Article

Digital Tools for the Promotion of Geological and Mining Heritage: Case Study from the Thames Goldfield, Aotearoa, New Zealand

by
Vanessa Cocal-Smith
*,
Graham Hinchliffe
and
Michael G. Petterson
School of Science, Faculty of Health and Environment, Auckland University of Technology, Auckland 1010, New Zealand
*
Author to whom correspondence should be addressed.
Geosciences 2023, 13(8), 253; https://doi.org/10.3390/geosciences13080253
Submission received: 26 June 2023 / Revised: 1 August 2023 / Accepted: 16 August 2023 / Published: 21 August 2023

Abstract

:
The geoheritage value in the Thames District, North Island, New Zealand, is notable for its over 50 epithermal gold deposits associated with the Coromandel Volcanic Zone, significant to the region’s geological, cultural, and mining heritage. This case study was conducted in collaboration with the Thames School of Mines and Mineralogical Museum to develop a series of web-based applications for public outreach and an accessible museum experience through the utilization of specimens from the mineralogical museum. This research applies a conceptual framework of ex situ geoheritage to explore links between local geology with cultural and mining heritage. Minerals and rock specimens collected for the Thames School of Mines Mineralogical Museum were used to create 3D virtual models demonstrating the epithermal mineralization in the Thames Goldfield. Outputs of this project consist of two digital products, including a digital mineral and rock repository and the dissemination of the geological collection through integrating the photogrammetric models into a user-friendly outreach, ArcGIS Storymaps, to depict the geoheritage relationship of the specimens to regional gold mining, and at the same time, to be developed to be implemented in geoscience education and communication. The results of this paper are intended to promote the use of digital tools for enhancing and raising awareness of the geoheritage values of the Thames Goldfield. This approach has relevance for Papua New Guinea and the Pacific Islands in raising awareness of geological, mineral, and mining heritage within widely distributed and often isolated communities across island archipelago nations.

1. Introduction

The geoheritage field has experienced a surge in interest over the last decade, with increased recognition as an essential part of Earth science education, fostering the connections between the Earth and people through scientific, educational, and cultural values [1]. Geoheritage contains an open-book memory of Earth’s past events, and is considered a link between natural phenomena and human understanding of how the Earth works [2,3,4].
Geoconservation is defined, for the purposes of this research, as the conservation of geoheritage, focused on the protection of significant and valuable elements. Numerous geological specimens, documents, maps, objects, and sites are at risk of degradation, e.g., from unsustainable specimen collection and storage, fragility, destructive testing, weathering and erosion, vegetation overgrowth, urban expansion, and other anthropogenic processes [5,6].
One of the key areas of research in this field is raising public awareness of geoheritage. The development of digital technologies has been influential to the approach of geoheritage and geoconservation outreach. Digital tools, such as 3D virtual modeling and web-based geographical information systems, provide innovative ways to visualize and disseminate knowledge to a non-specialist audience [7]. Digital technologies, such as geographical information systems (GIS) and digitalization, have played a role in developing geoheritage and geoconservation outreach, as seen in global research trends [8,9]. Over the last decade, the development of new digital technologies has allowed for new channels of communication, thus providing an accessible experience and visibility in geoheritage and geoconservation for both in situ and ex situ presentations [8]. The use of digital technologies in geoheritage and geoconservation enables engagement with the public through media, including web and mobile applications [8]. The internet has allowed information to become widely accessible in the digital age, thus reaching a wider audience, such as younger generations [9]. Cayla and Martin (2018) [3] discuss the applications of digital technologies in the field of geoheritage, highlighting how interactivity and multimedia can be used to bring awareness to the subject through engagement and improved visualization of geoheritage interpretations.
Previous studies on the promotion of geomining heritage have also utilized digital tools, such as the employment of web-gis as a tool to promote geotourism and sustainable geoheritage [8,9,10,11]. Studies such as that by Melelli et al. (2023) [11] demonstrate the interconnected values of geoheritage and cultural heritage in relation to mining activities, but also the potential for digital web tools to bring back to life mines that have no trace of existence.
In this study, we take a multidisciplinary approach to geoheritage interpretation by highlighting the connections between the underlying geology and gold mineralization to human history and mining heritage in the Thames-Coromandel and Hauraki Districts of northern North Island, New Zealand. This style of cultural heritage is relevant/important to historical, cultural, and social values [12].
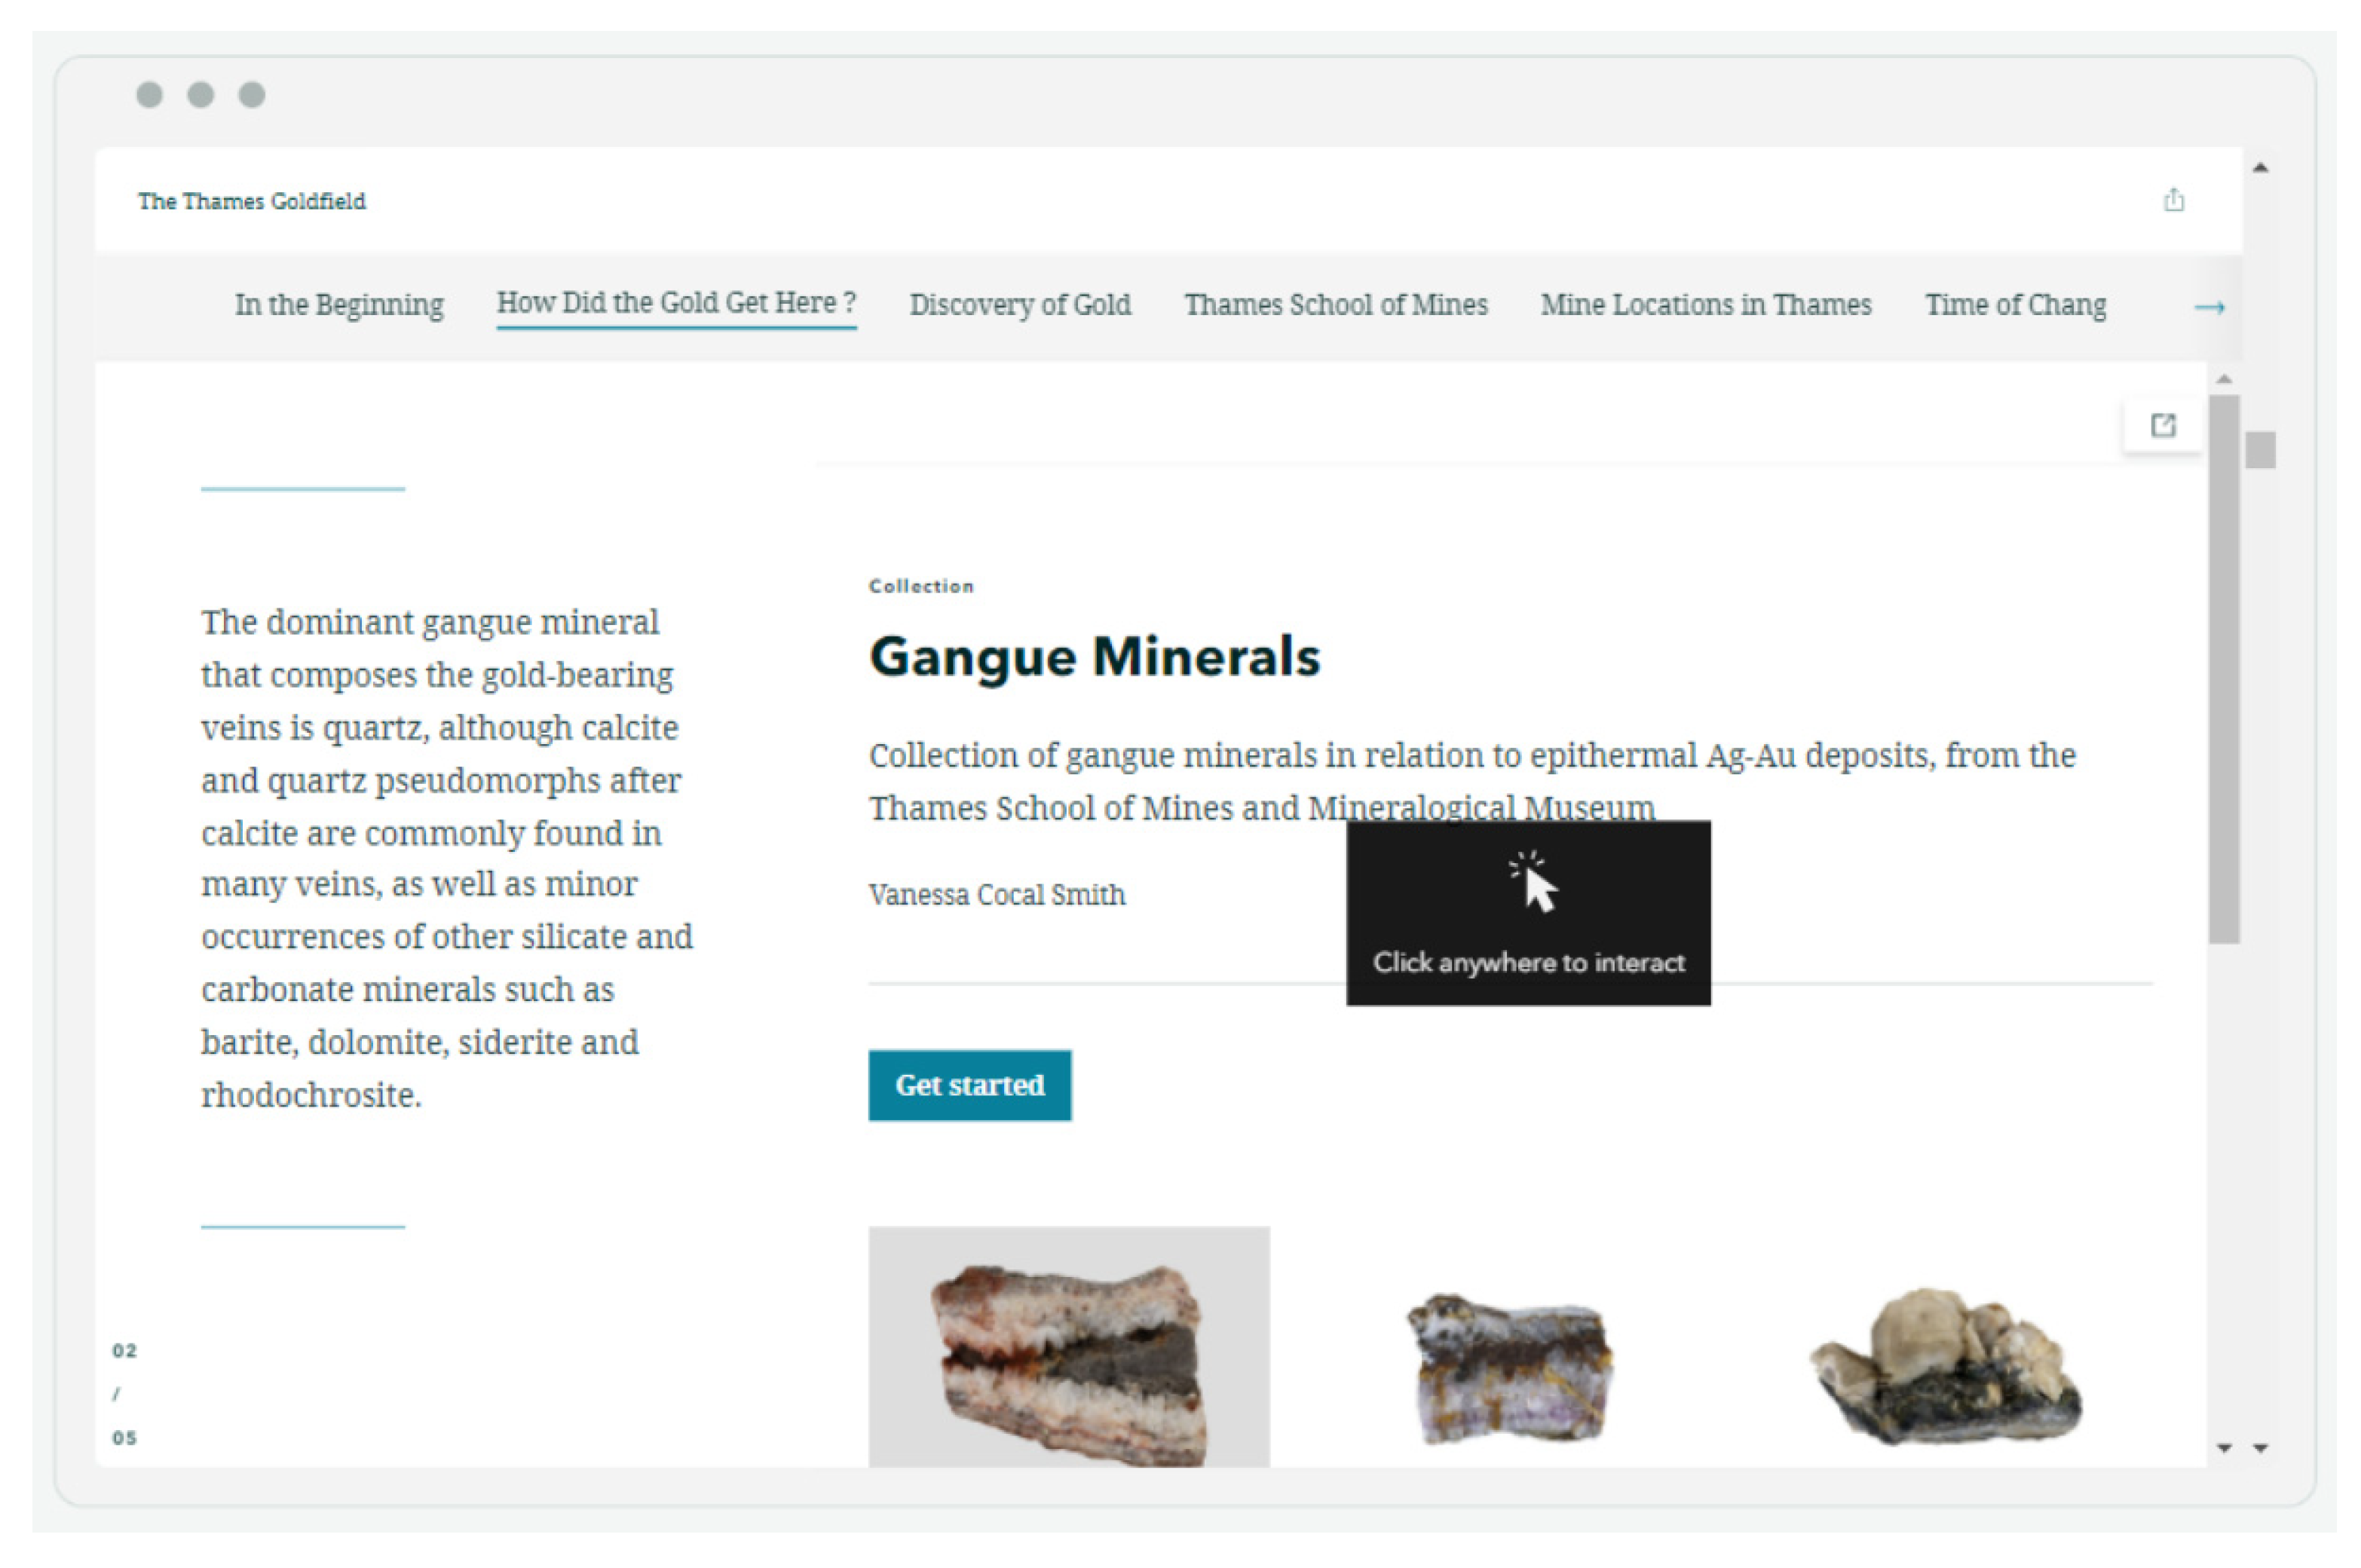
The outputs of our work include the development of two web-based applications, documenting and promoting aspects of geoconservation and geoheritage interpretations in relation to epithermal Ag–Au deposits in the Thames-Coromandel and Hauraki Districts. The first digital product created was the collection of 3D specimens from the Thames School of Mines and Mineralogical Museum, used to demonstrate how we can utilize ex situ geoheritage elements for in situ interpretations of the mineralization paragenesis of epithermal Ag–Au gold deposits in the Thames Goldfields. The geological collection at the Thames School of Mines host thousands of specimens that are locally sourced and established for the primary historical reason of educating and sharing experience with 19th and earlier 20th century gold miners. Photorealistic 3D geological specimen models were reconstructed by employing photogrammetric and structure from motion techniques to replicate the mineral in virtual space, and thus provide a virtual “surrogate” to physical specimens.
The second digital product comprises the development of an interactive web application. Storymaps by ESRI is a GIS-based storytelling platform that has gained popularity due to its ability to provide a more diversified and interactive presentation of information as opposed to general web pages that only contain text and pictures. The user-friendly design and interactive elements can add guidance and playfulness to non-specialist users’ experiences, encouraging the user to explore further and learn from the given information [3]. Storymaps is favored by many disciplines, such as archaeology, as well as many authors in the field, as the preferred form of virtual outreach (see Pasquaré Mariotto et al., 2020, Varvara et al., 2019; Antoniou et al., 2021 [10,13,14]). The benefits of using Storymaps is its compatibility with multimedia datasets and heterogeneous information [14]. Interactive platforms promoting geoheritage have been the focus for the progression of the field. These examples of digital tools illustrate how we can implement digital technologies to help promote geological knowledge in the context of geoheritage and geoconservation to the public.
ESRI’s Storymaps platform was used to disseminate geoheritage information in relation to the Thames-Coromandel and Hauraki Districts through the integration of photogrammetric models into a user-friendly outreach medium that can be utilized as an educational tool. The virtual outreach is complete with enriched material, such as 3D models, images, maps, multimedia, and cultural history, to form a holistic, interconnected, user-friendly resource available for all levels of expertise.
This work aims to demonstrate how we can popularize geoheritage for a wide audience, including geoscience professionals, educators, and amateur special interest groups, using existing and emerging technologies, incorporating industrial and cultural heritage by highlighting the geological processes that are responsible for the existence of goldfields in the Thames-Coromandel and Hauraki Districts. Through this study, we demonstrate the ability to combine geoheritage interpretations with digital technologies, using 3D photogrammetry and ESRI ArcGIS Storymaps, to create a comprehensive digital resource by incorporating geological, industrial, mining, and cultural heritage, for the digitized collection to be shared with the public and to generate awareness of the geoheritage significance of the Thames Goldfield.
The authors wish to publish this paper within the thematic Papua New Guinea and Pacific Islands Geosciences volume as we recognize that New Zealand/Aotearoa is a Pacific Island State with a strong Pacific Islander heritage, and that the concepts and methods here are appropriate for many Pacific Island nations, their museums, and curatorial facilities, and for documenting and raising awareness of their numerous mineral and mining districts.
This case study provides a promising approach to ex situ geoheritage through the utilization of museum collections and through the creation of virtualized samples. We aim to demonstrate how we can interpret geoheritage values through specimens and develop a narrative to represent the interconnectedness between geological and cultural heritage in historical mining centers. The methods used to produce the digital products highlight the effectiveness of low-cost photogrammetric techniques to produce high-quality outputs. The main goal of this case study is to show how we can popularize geomining heritage through a contemporary approach of storytelling with features appealing to a range of users, from geoscience enthusiasts to expert geoscientists.

2. Geological Setting and Gold Mining Heritage: Thames-Coromandel and Hauraki Goldfields

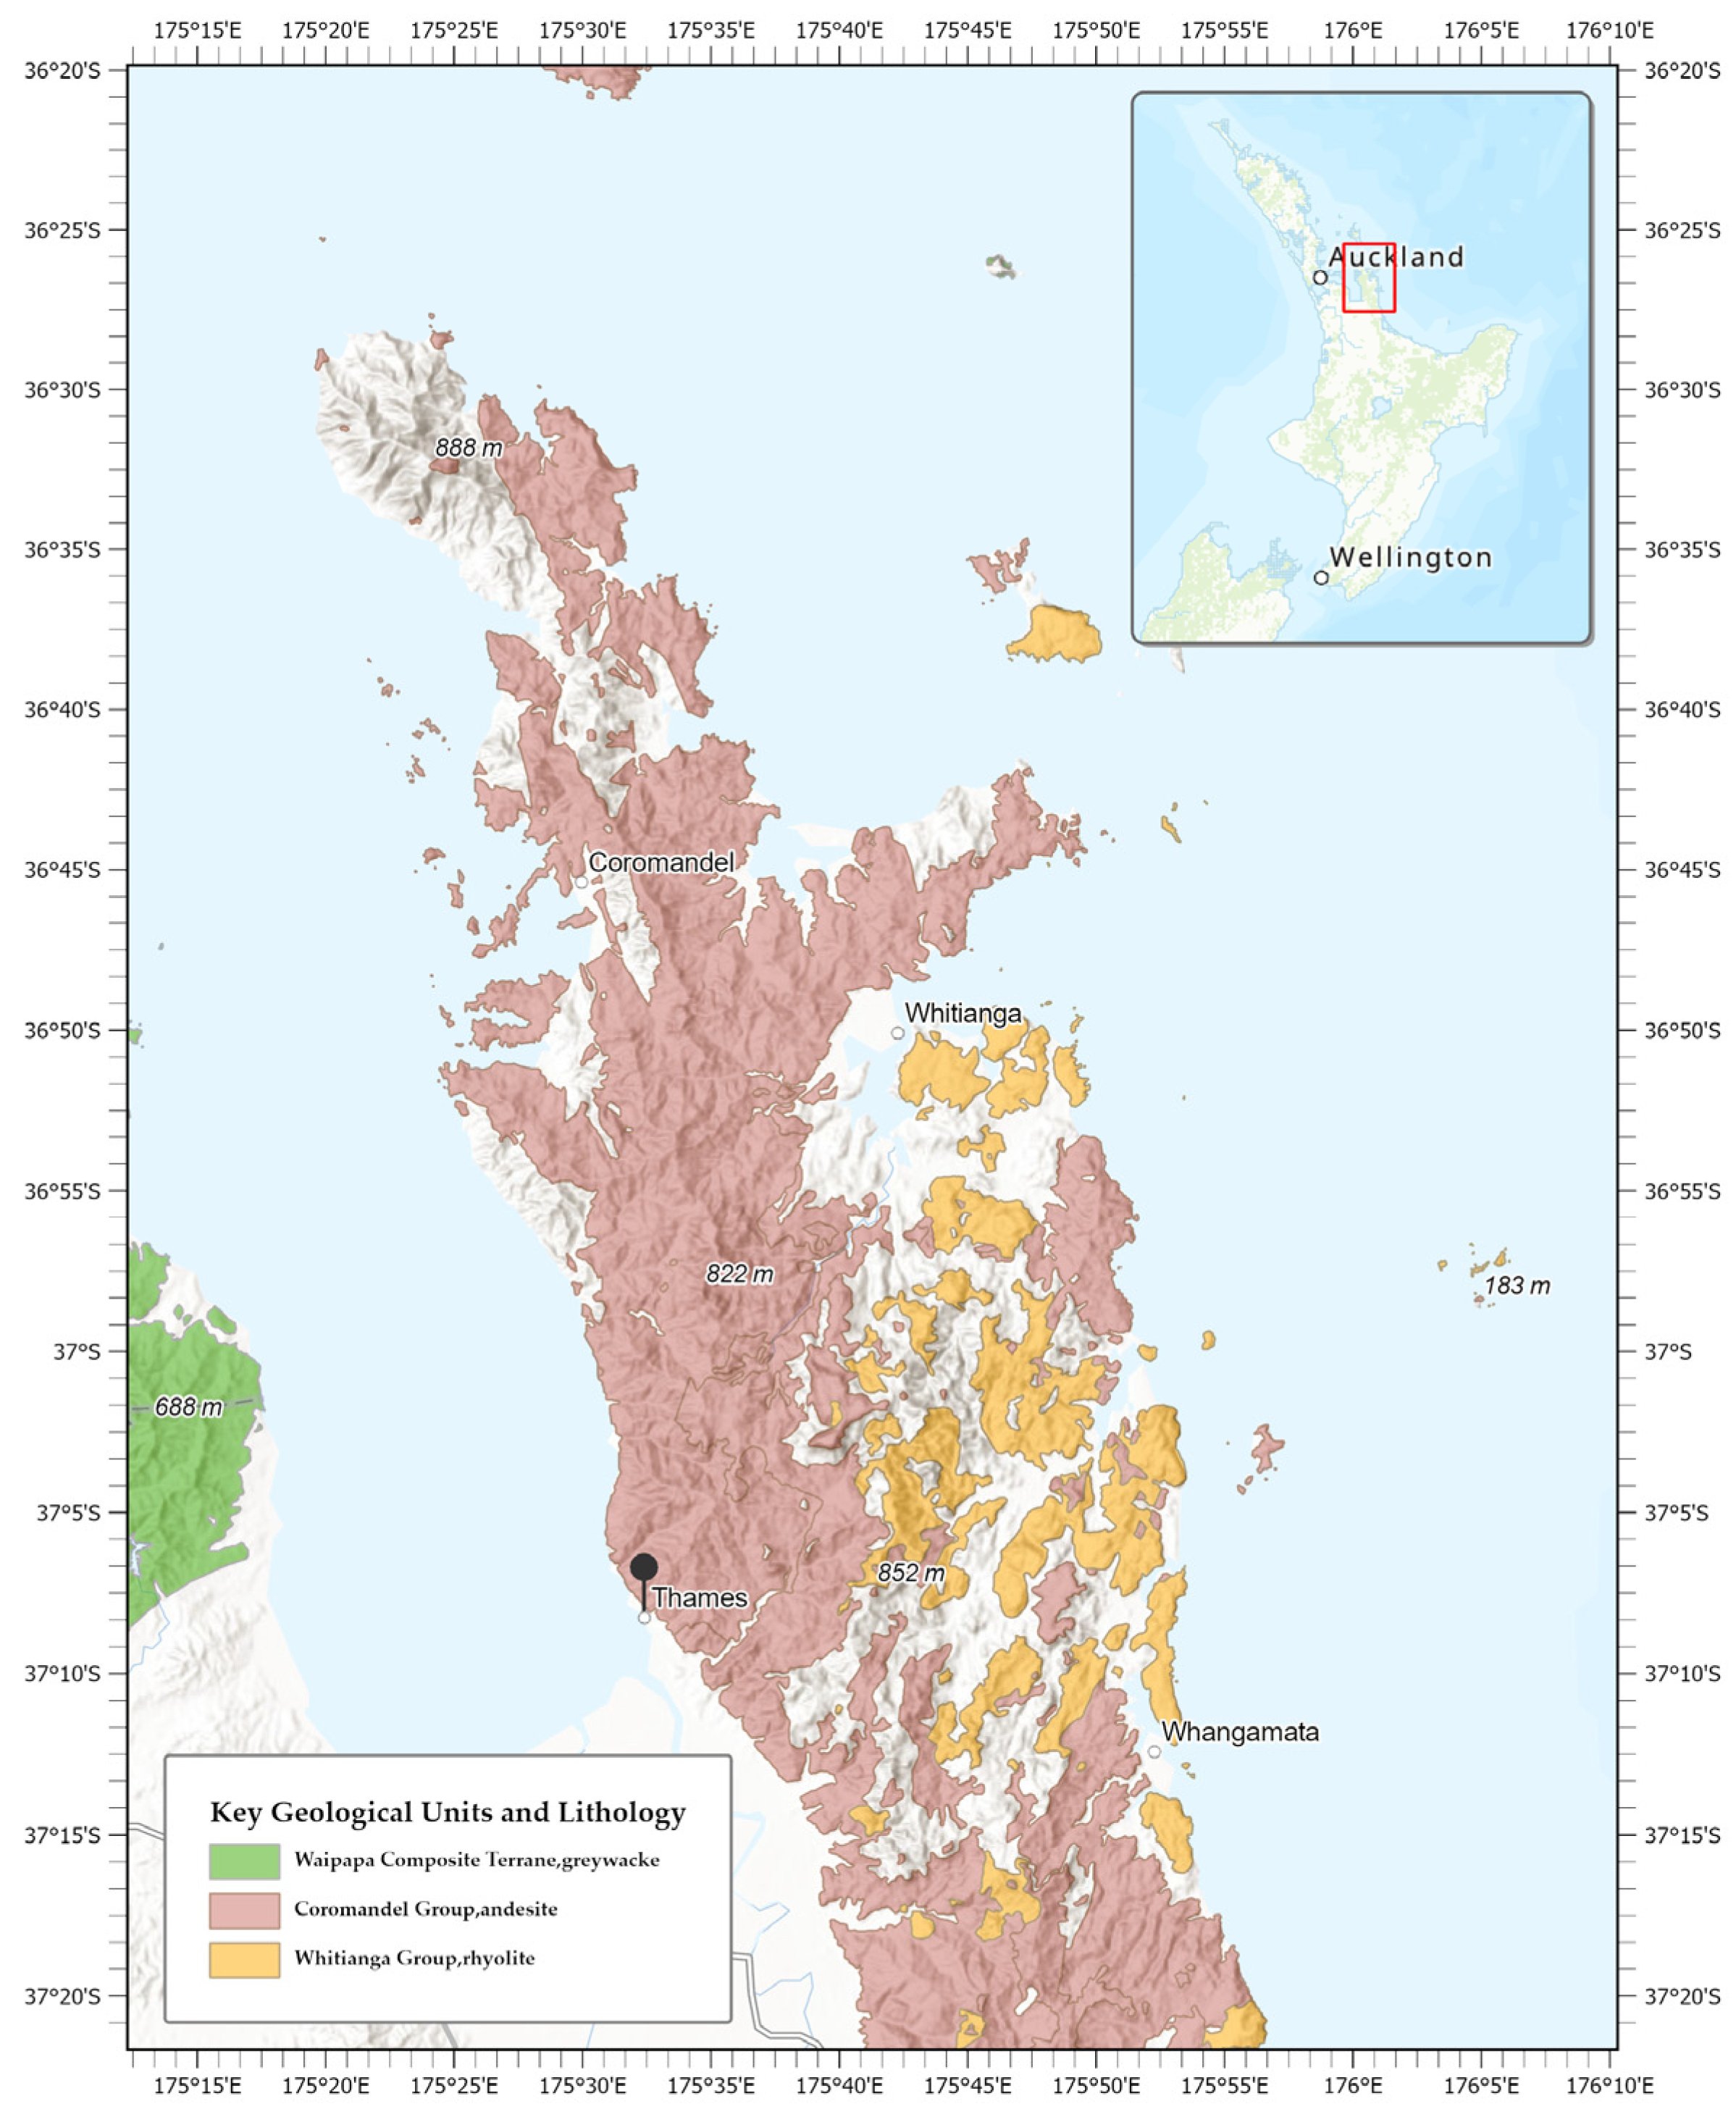
The Thames-Coromandel and Hauraki Goldfields (Figure 1) are situated in the extinct Coromandel Volcanic Zone (CVZ) [15]. Subduction-related volcanism began in the Miocene, as Cenozoic volcanism from Northland migrated southwest along the convergent Oceanic and Pacific Plate boundary [15].
Ag–Au mineralization in these districts is notably known for its over 50 Ag–Au epithermal deposits, as a direct result of Miocene–Pliocene volcanism, occurring within the north–south trending belt spanning over 200 km in length and at a width of 40 km from Great Barrier Island to the Southern Kaimai Ranges [16,17,18].
The basement sequence underlying the volcanism consists of Jurassic greywacke of the Waipapa terrane [19]. The volcanic rocks of the CVZ (
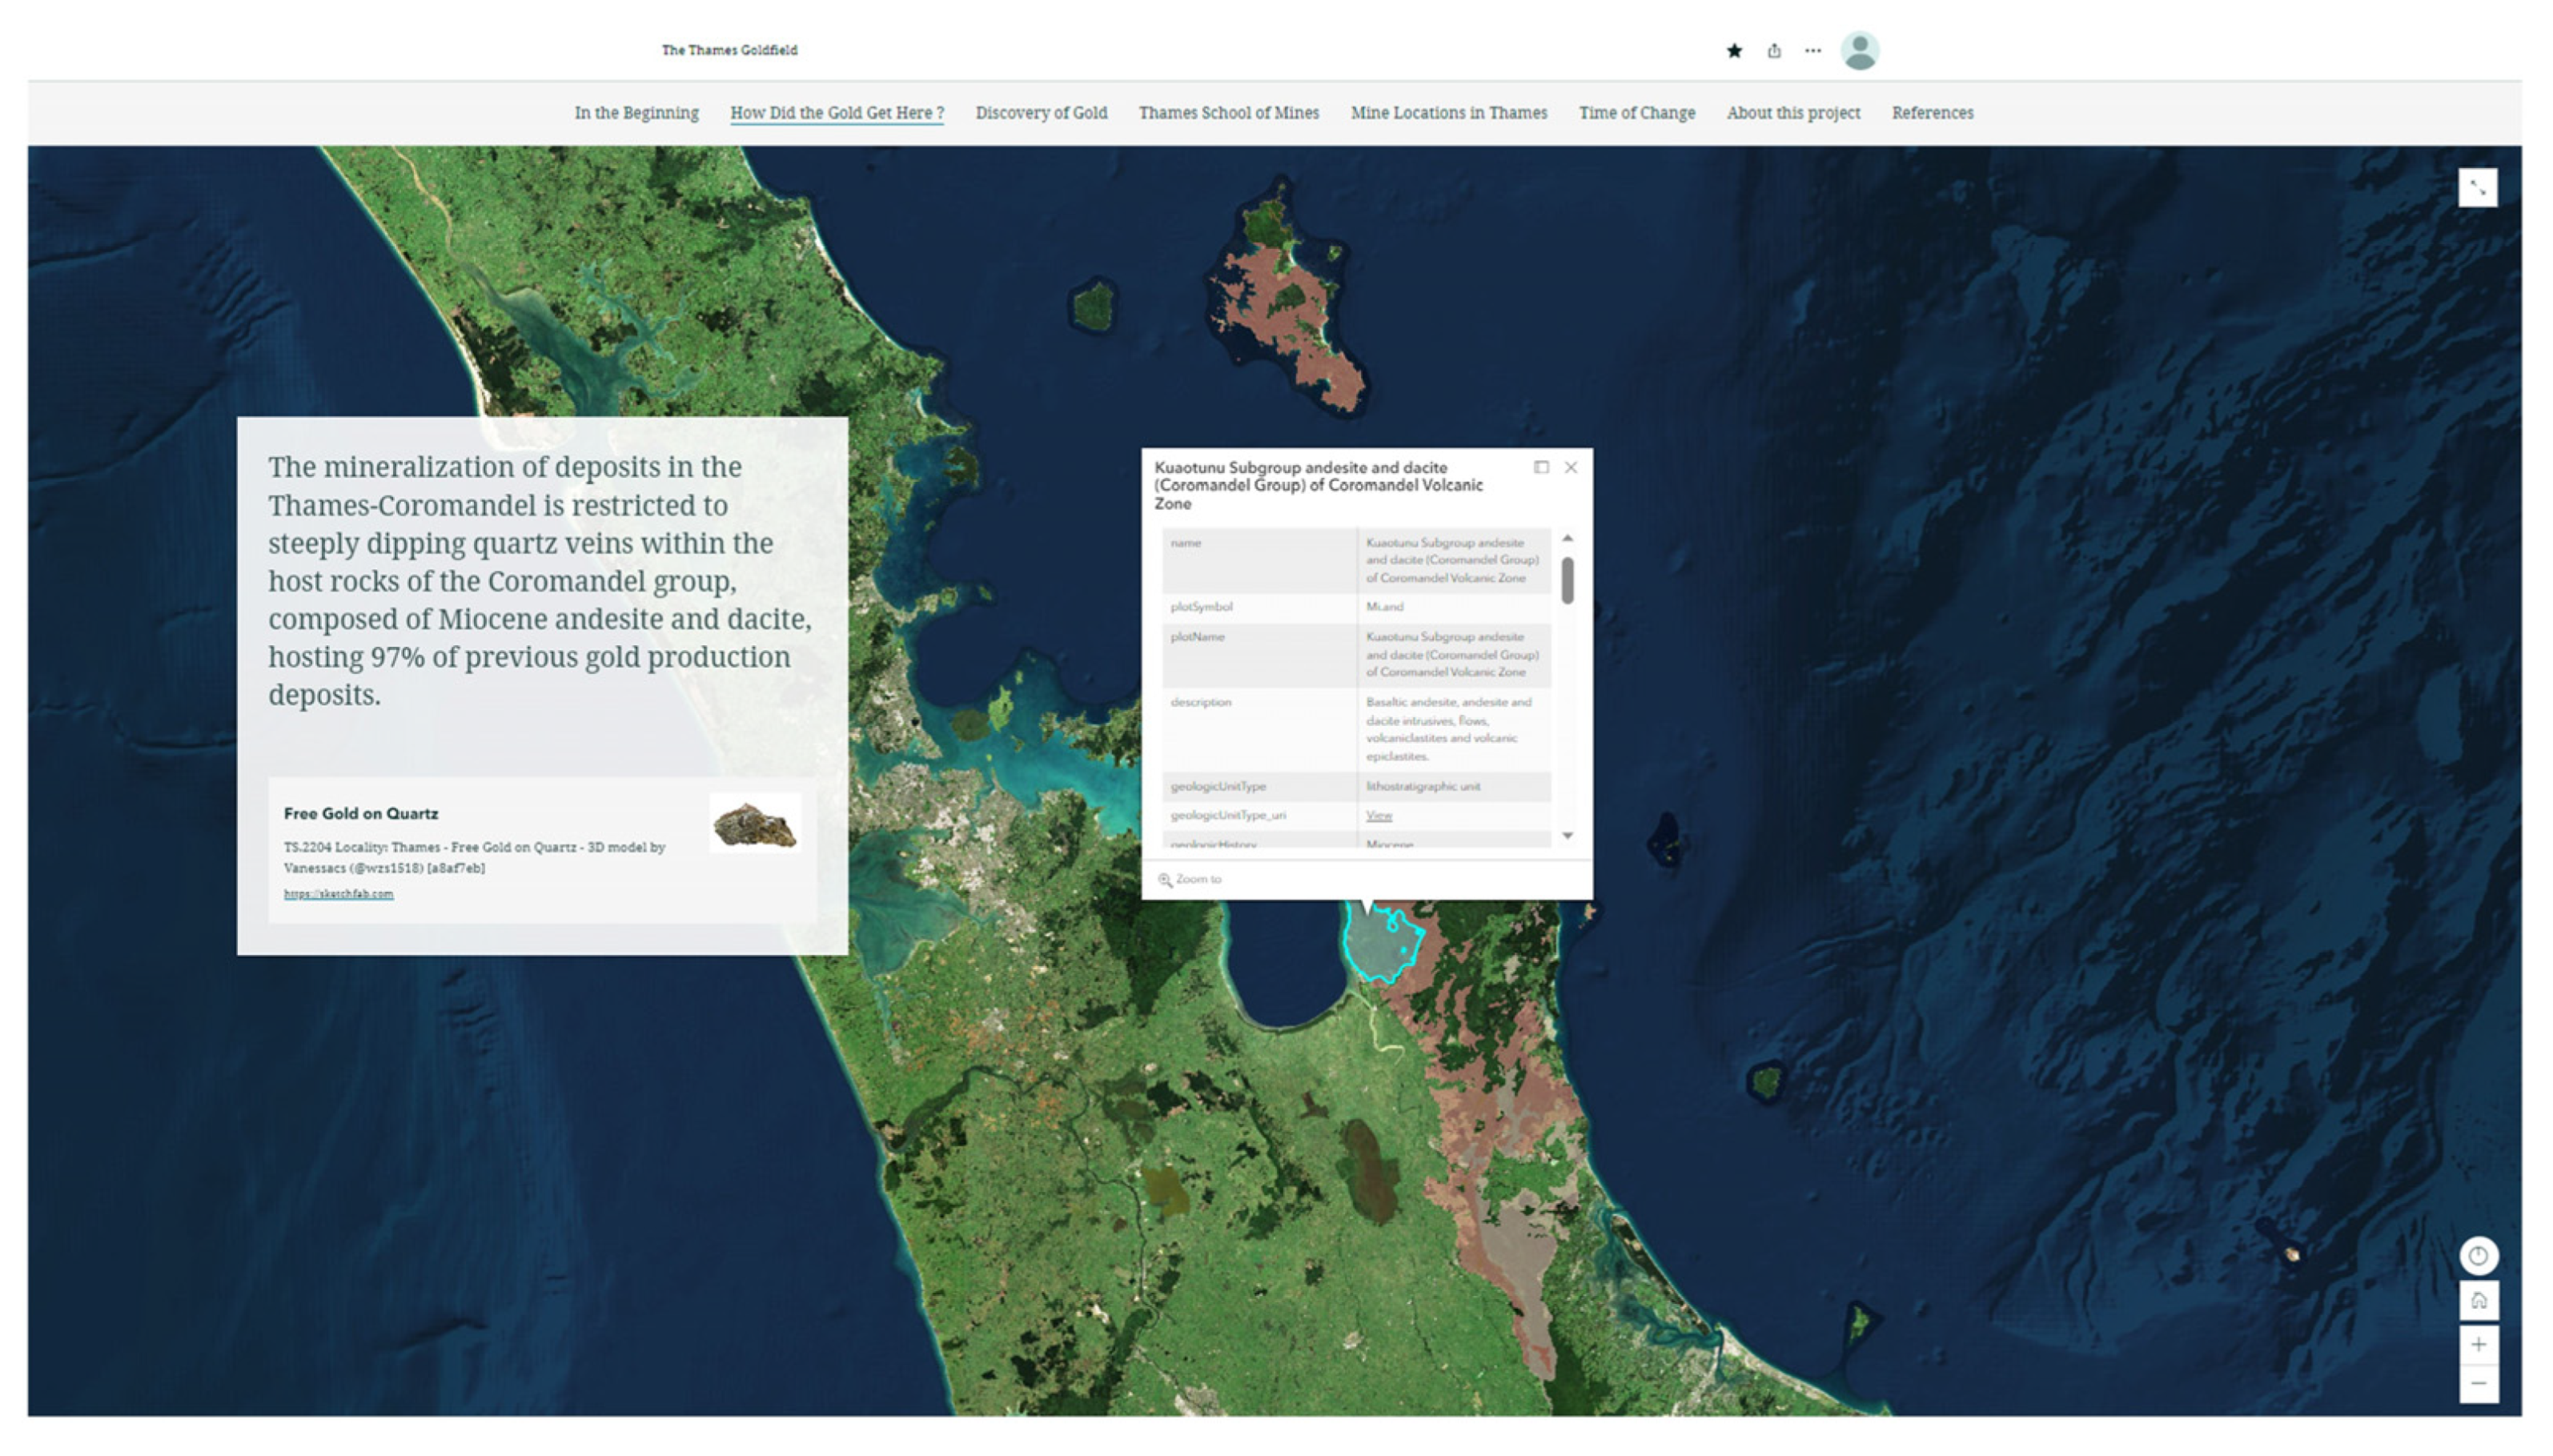
Figure 1) mainly consist of ca. 18 to 10 Ma andesite and dacite of the Coromandel group in the northern CVZ, and ca. 12 to 2 Ma Whitianga group rhyolite, andesite, dacite, and minor basalt deposits in the eastern and southern areas, as well as minor occurrences of Jurassic greywacke-hosted mineralization [15,19]. In the Hauraki District, epithermal gold deposits are primarily hosted in andesite, with minor production deposits occurring in rhyolite [18,19,20,21].
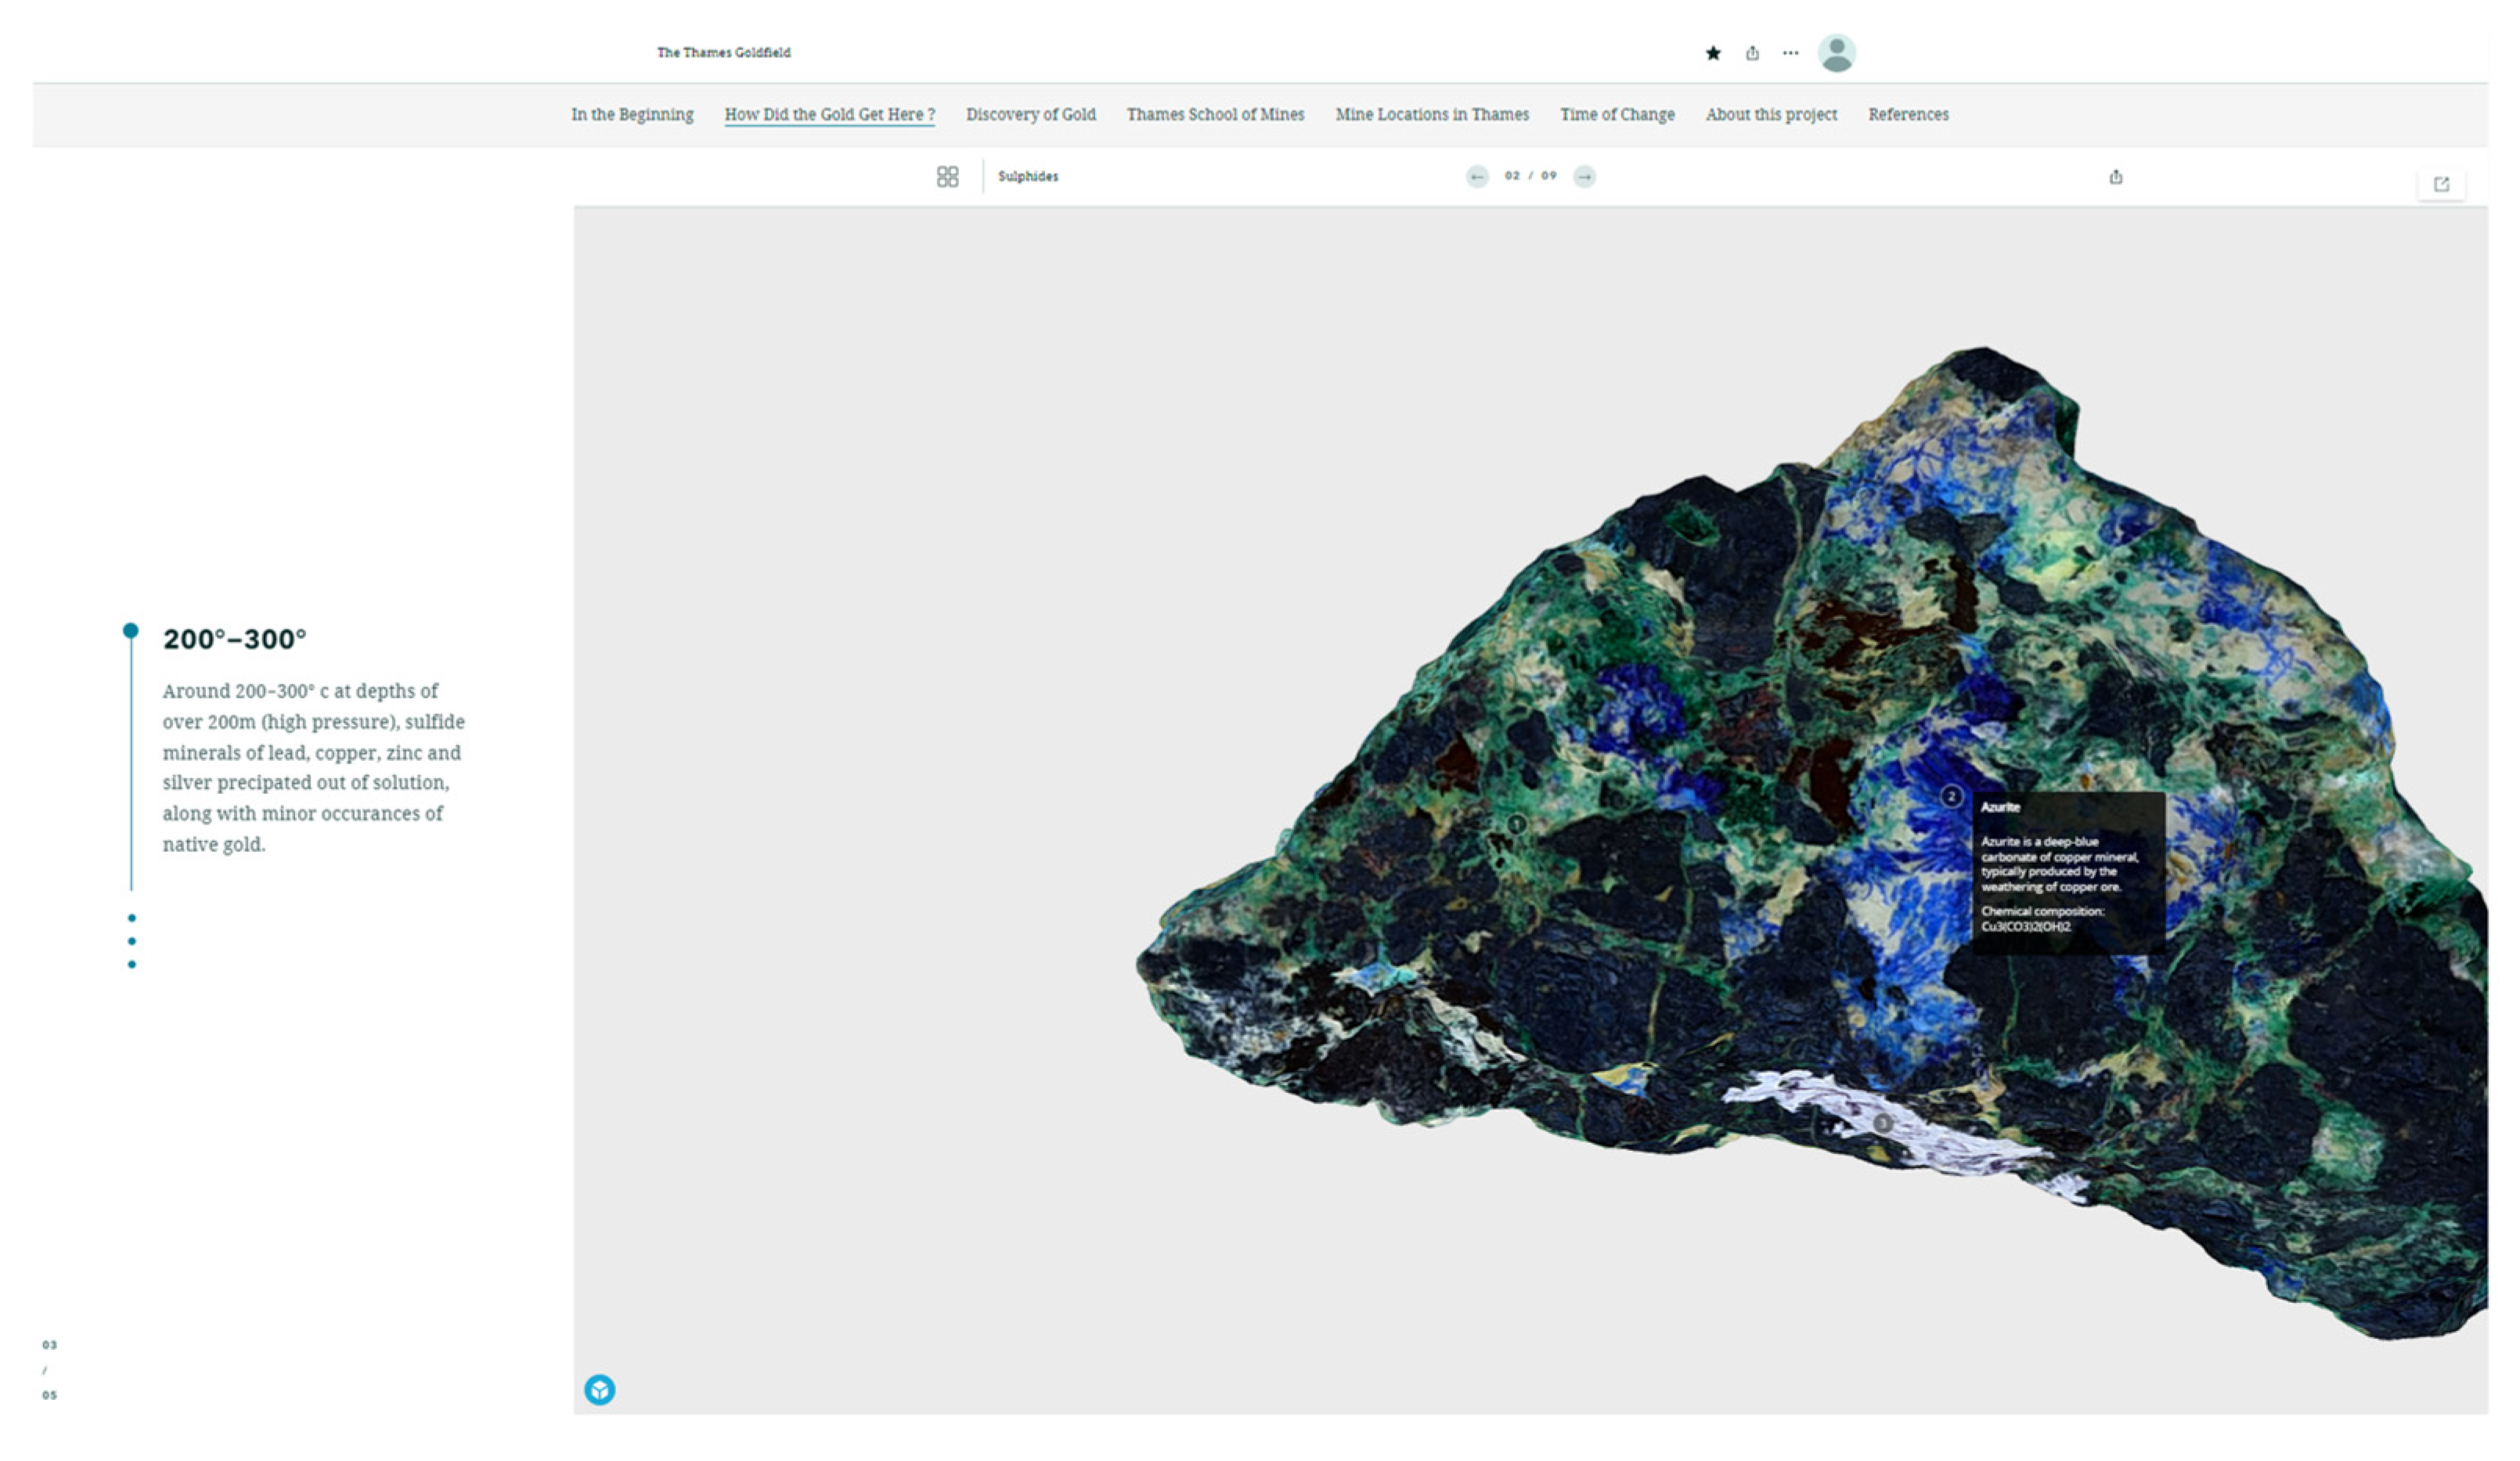
Deposits occur at depths typically less than 1.5 km below the water table, at temperatures below 300 °C (average around 160–270 °C) [21]. The main gangue minerals that occur in the Thames-Coromandel and Hauraki Districts consist of quartz, calcite, and adularia, with minor occurrences of carbonates and chlorite [18]. Mineral deposits comprise quartz veins, stockwork, and breccias [20,21].
The gold mineralization specimens used for this study area are part of low-to-intermediate sulfidation Au + Ag + Cu deposits. Deposits in the region are predominately found in quartz–sulfide veins, which are tectonically controlled by fault–fracture systems, comprised of colloform–crustiform vein textures and rhythmic banding of quartz and sulfide minerals [18,21].
The main metallic minerals are electrum (Ag–Au), acanthite (argentite), pyrite, sphalerite, galena, chalcopyrite, and marcasite, with minor occurrences of Cu, Sb, As, Ag sulfosalts, tellurides (Ag and Au), and cinnabar [18,19,20,21].
Sulfide and base-metal-rich deposits are characterized as low-sulfidation deposits due to the presence of sulfide minerals with low sulfur to metal ratios, typically associated with sub-alkalic rocks, and consist of minerals such as pyrite, sphalerite, galena, and chalcopyrite [18,20]. High sulfidation deposits are characterized by the presence of high sulfur to metal ratios and are commonly formed within or below stratovolcanoes and above Cu-porphyry systems [18].
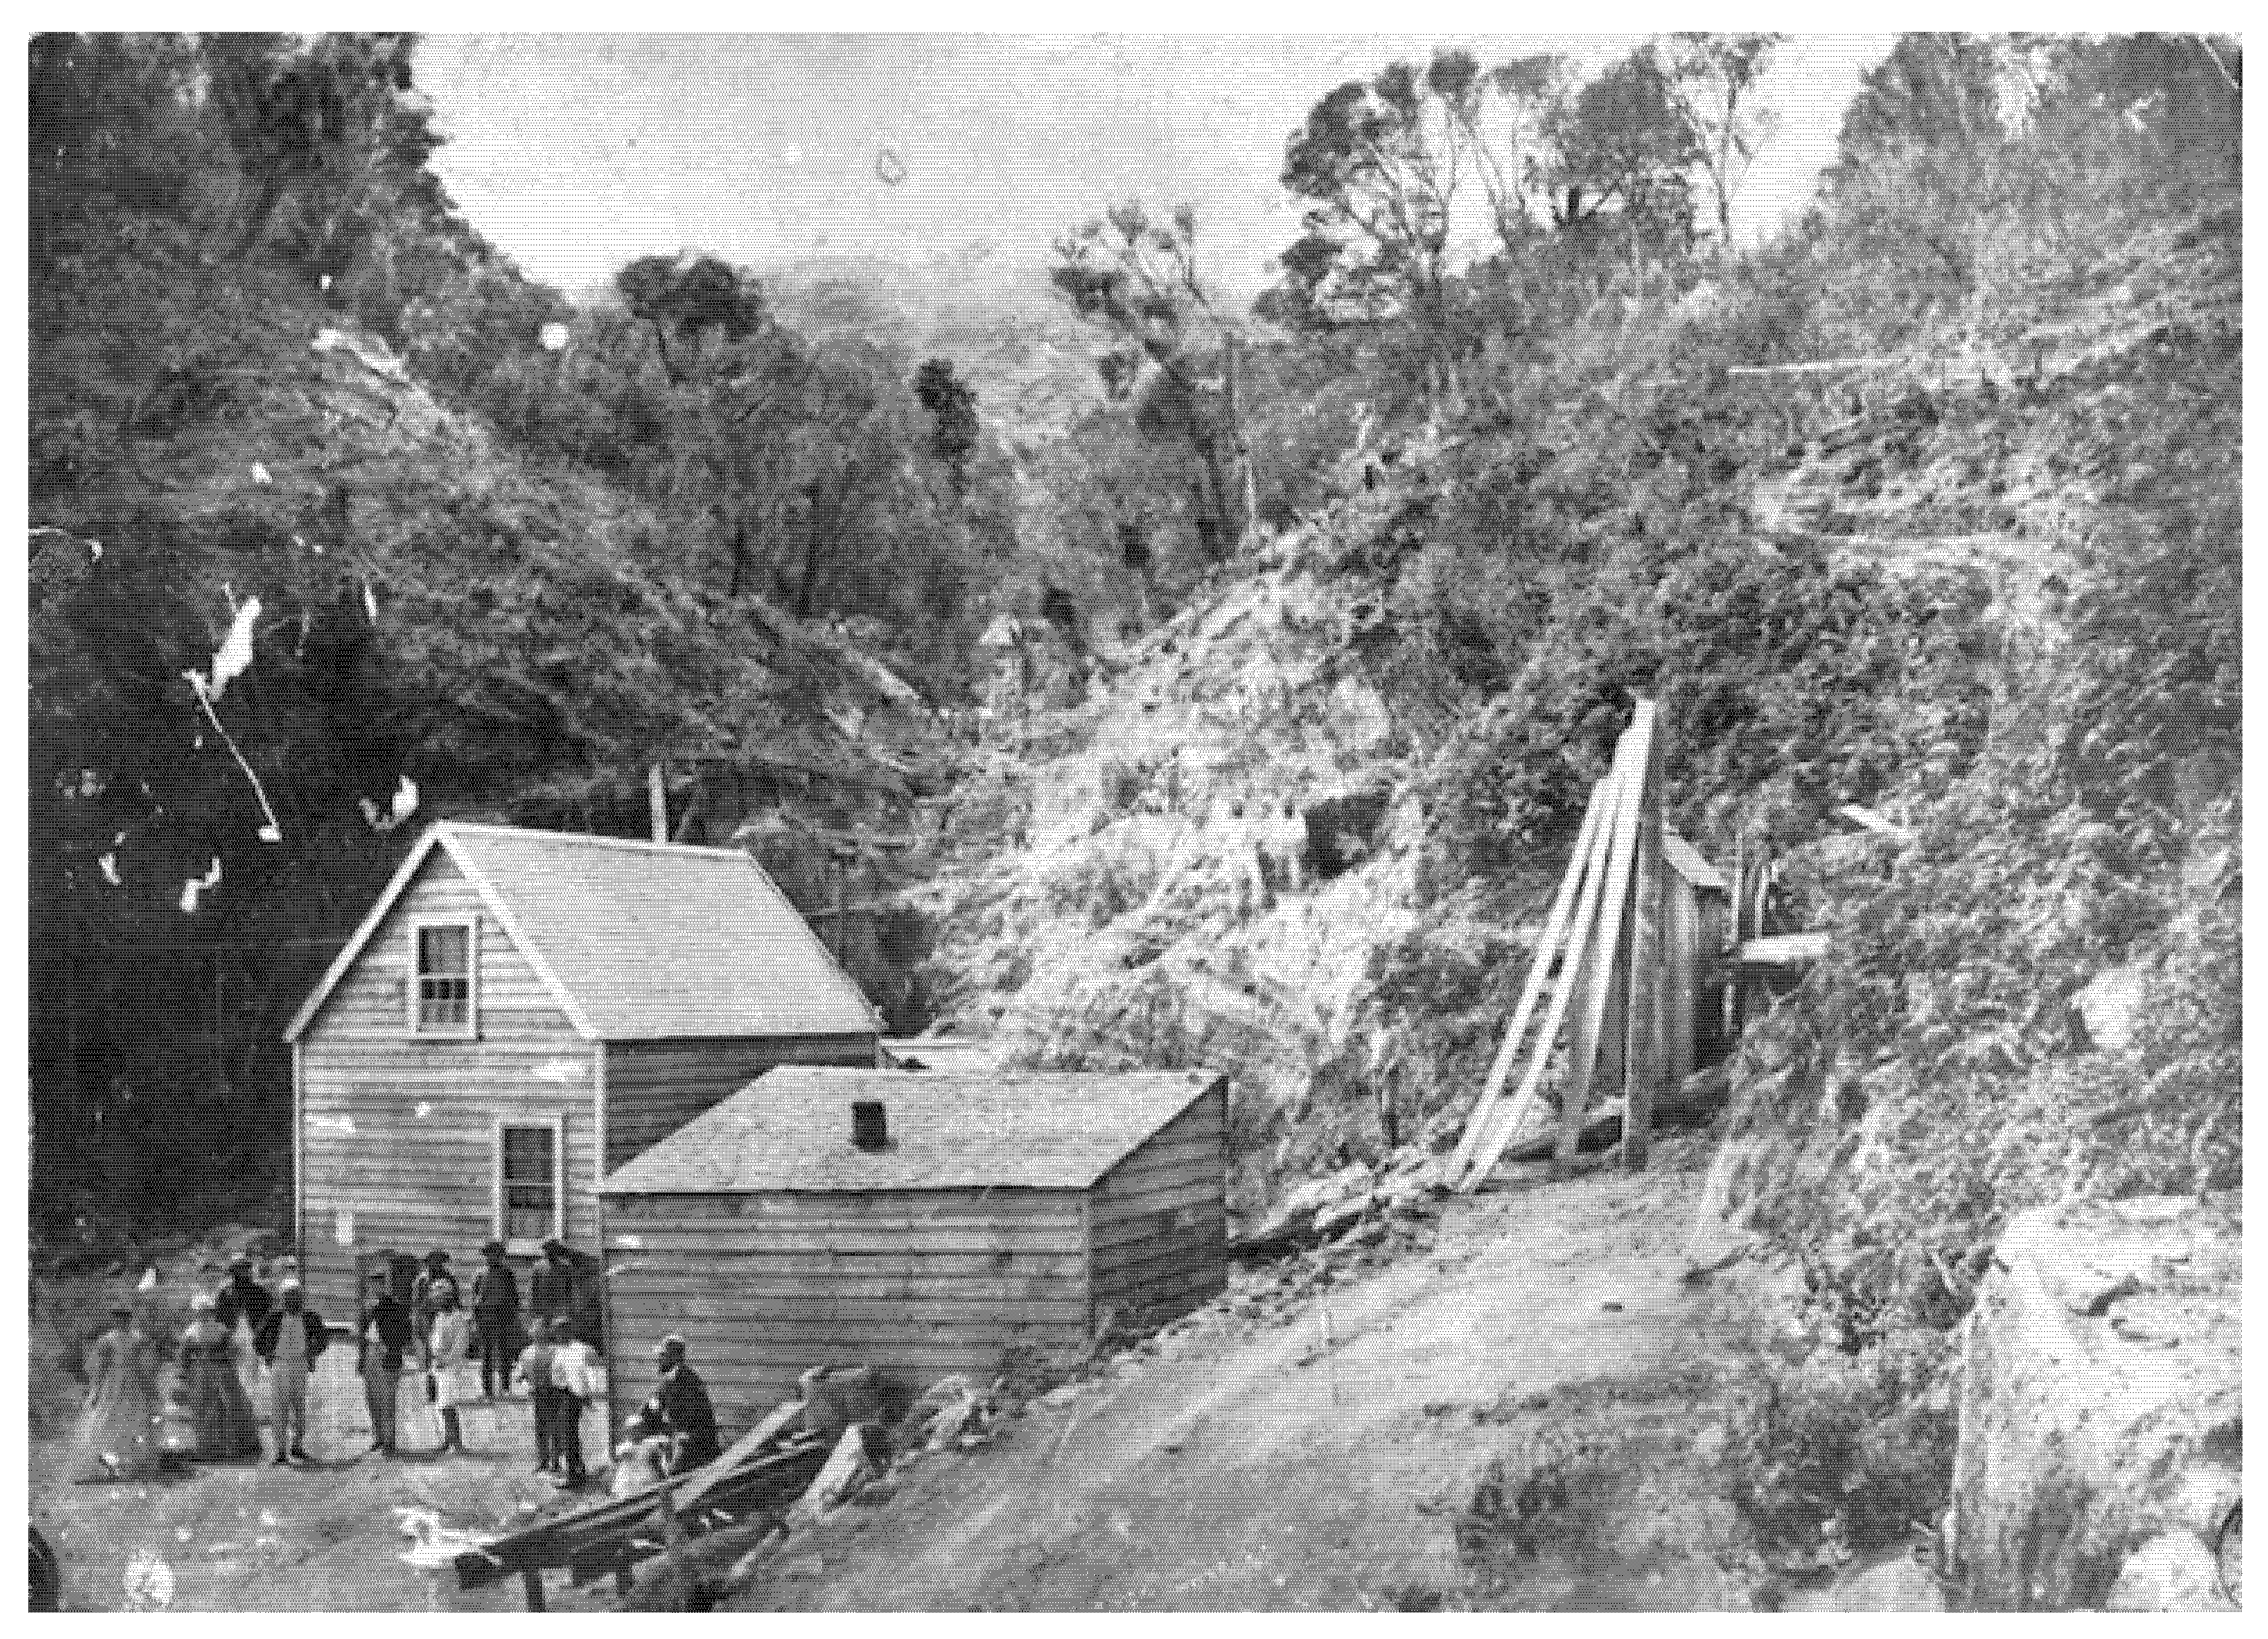
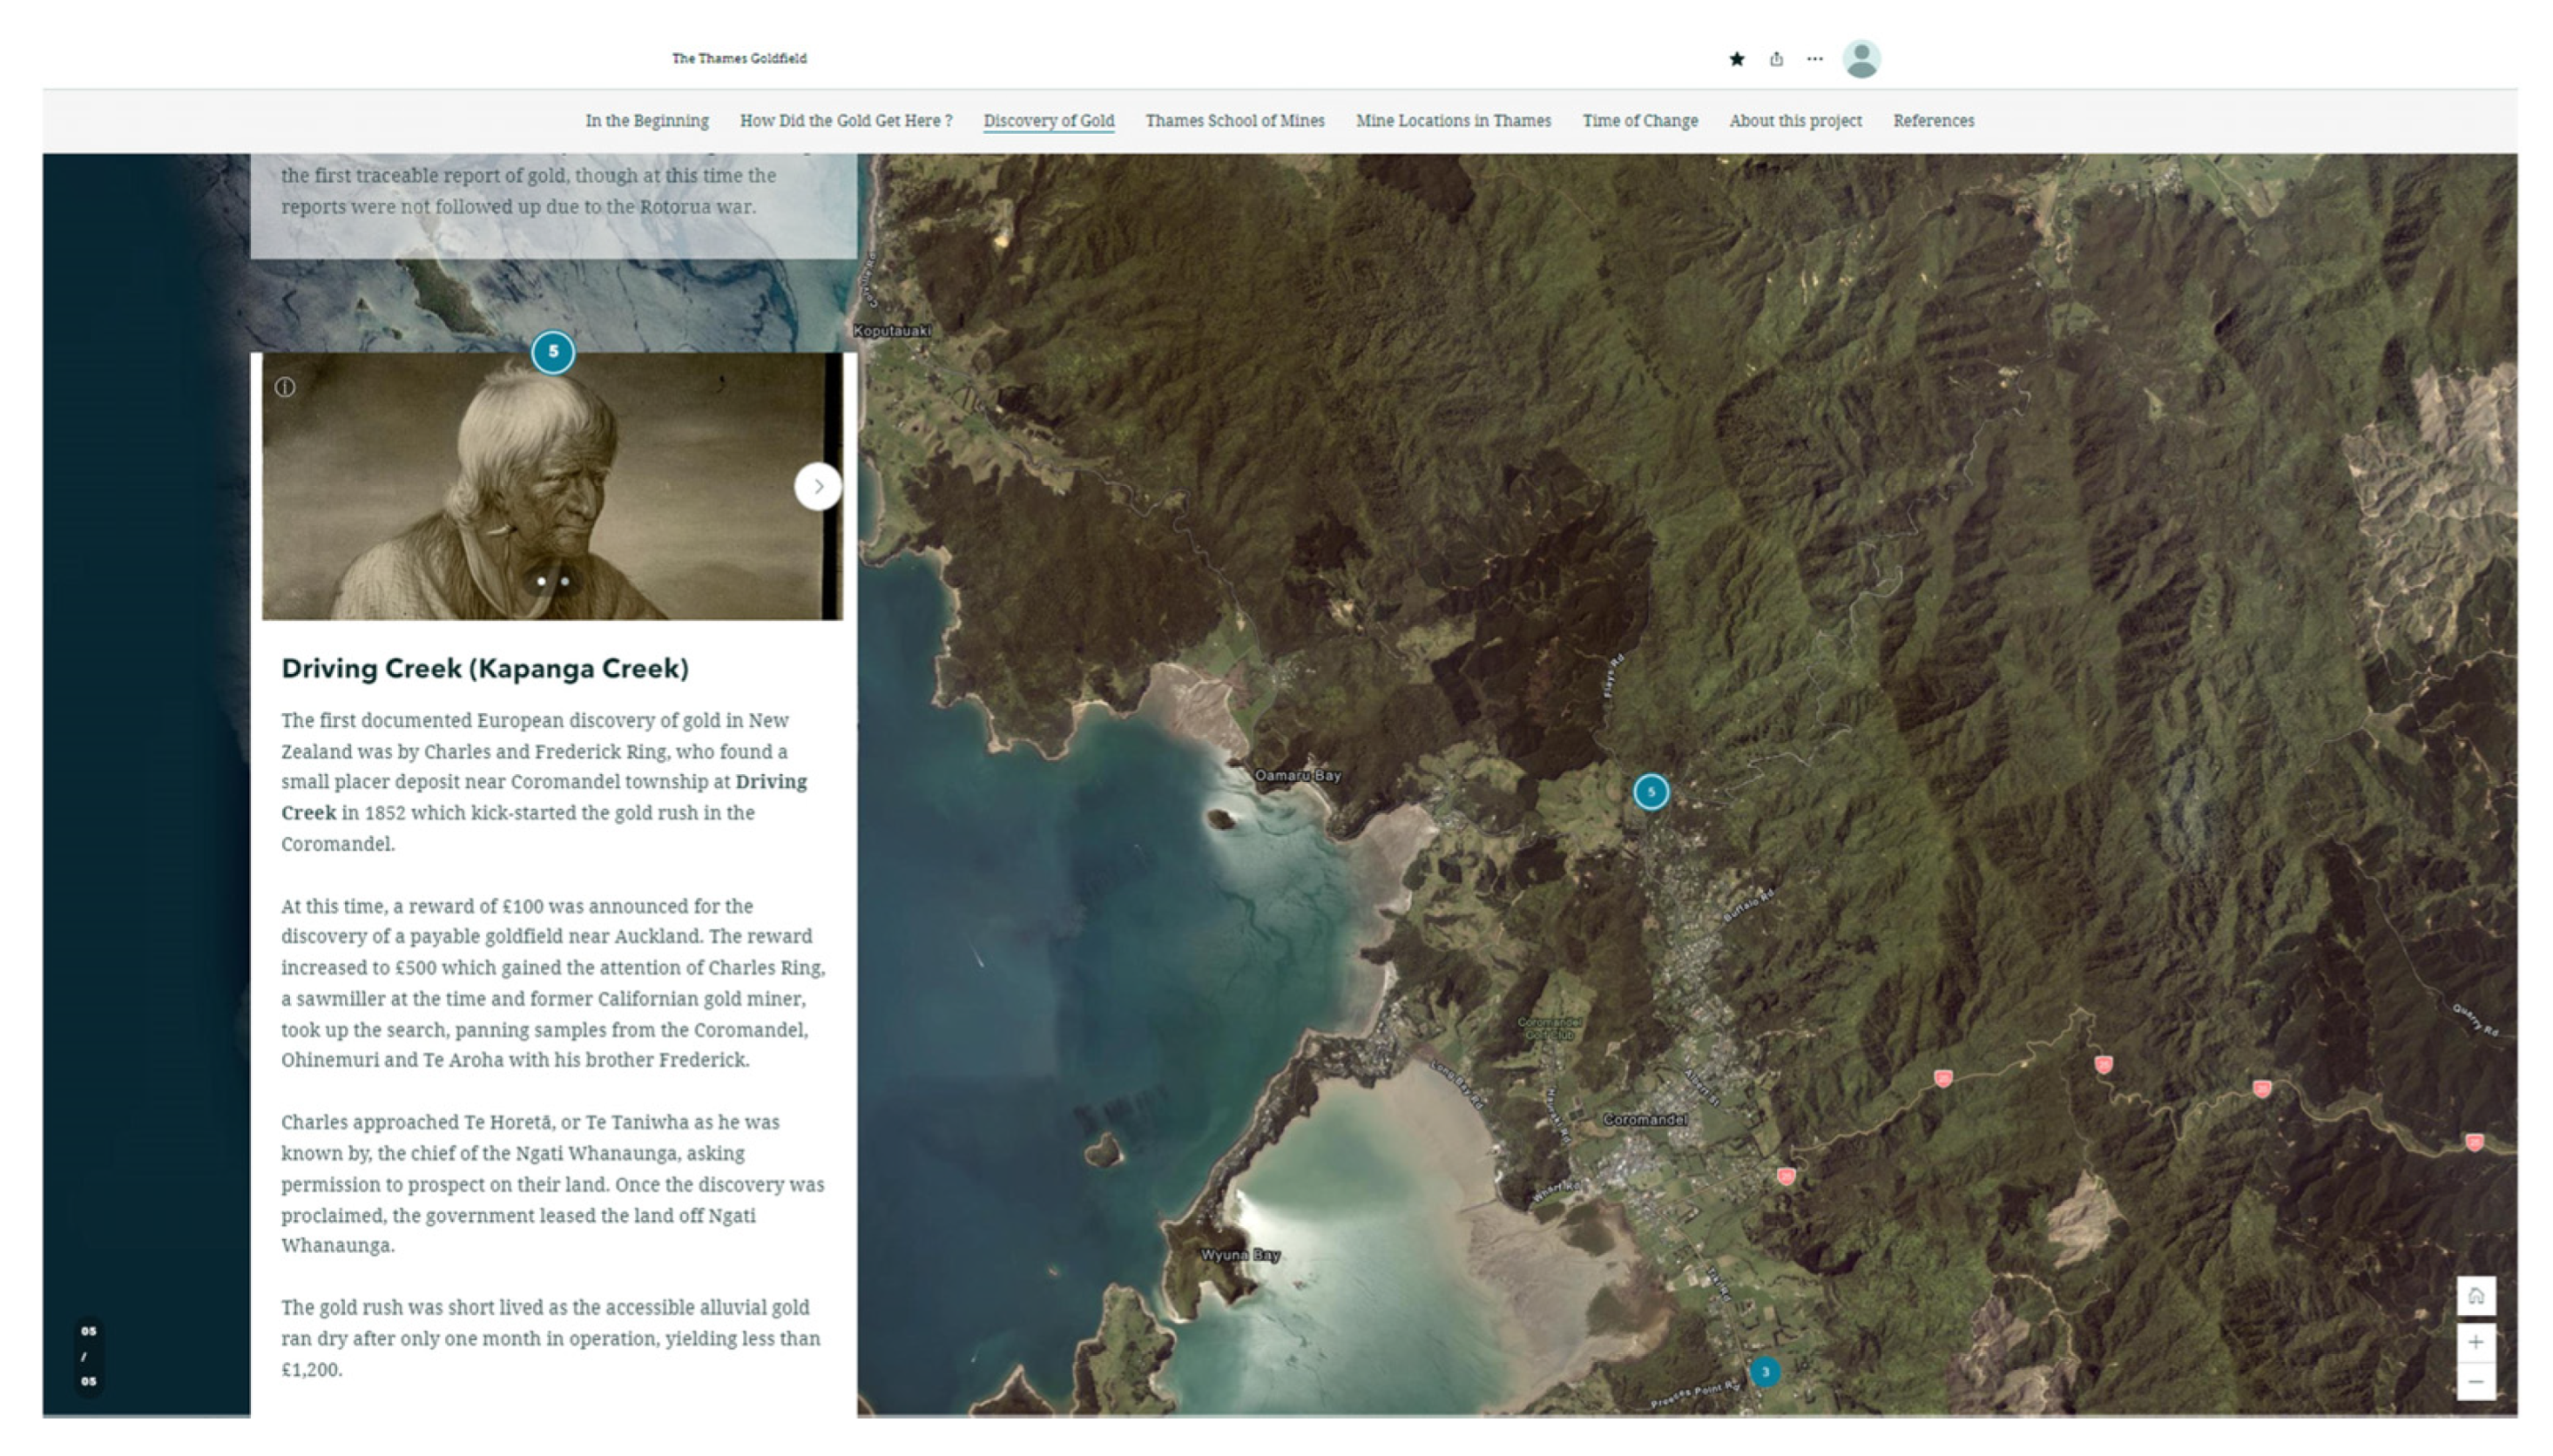
The search for gold started when Auckland announced a GBP 100 reward for the discovery of payable gold in 1851 [22]. Tasmanian brothers Charles and Fredrick Ring took up the search, with permission from Te Horeta to search his land, making the discovery in 1852 of a small placer deposit (Figure 2) at Driving Creek (Kapanga Creek) near to Coromandel town [17,23]. The gold rush in Coromandel was shortly lived as alluvial gold ran dry, yielding less than GBP 1200 [
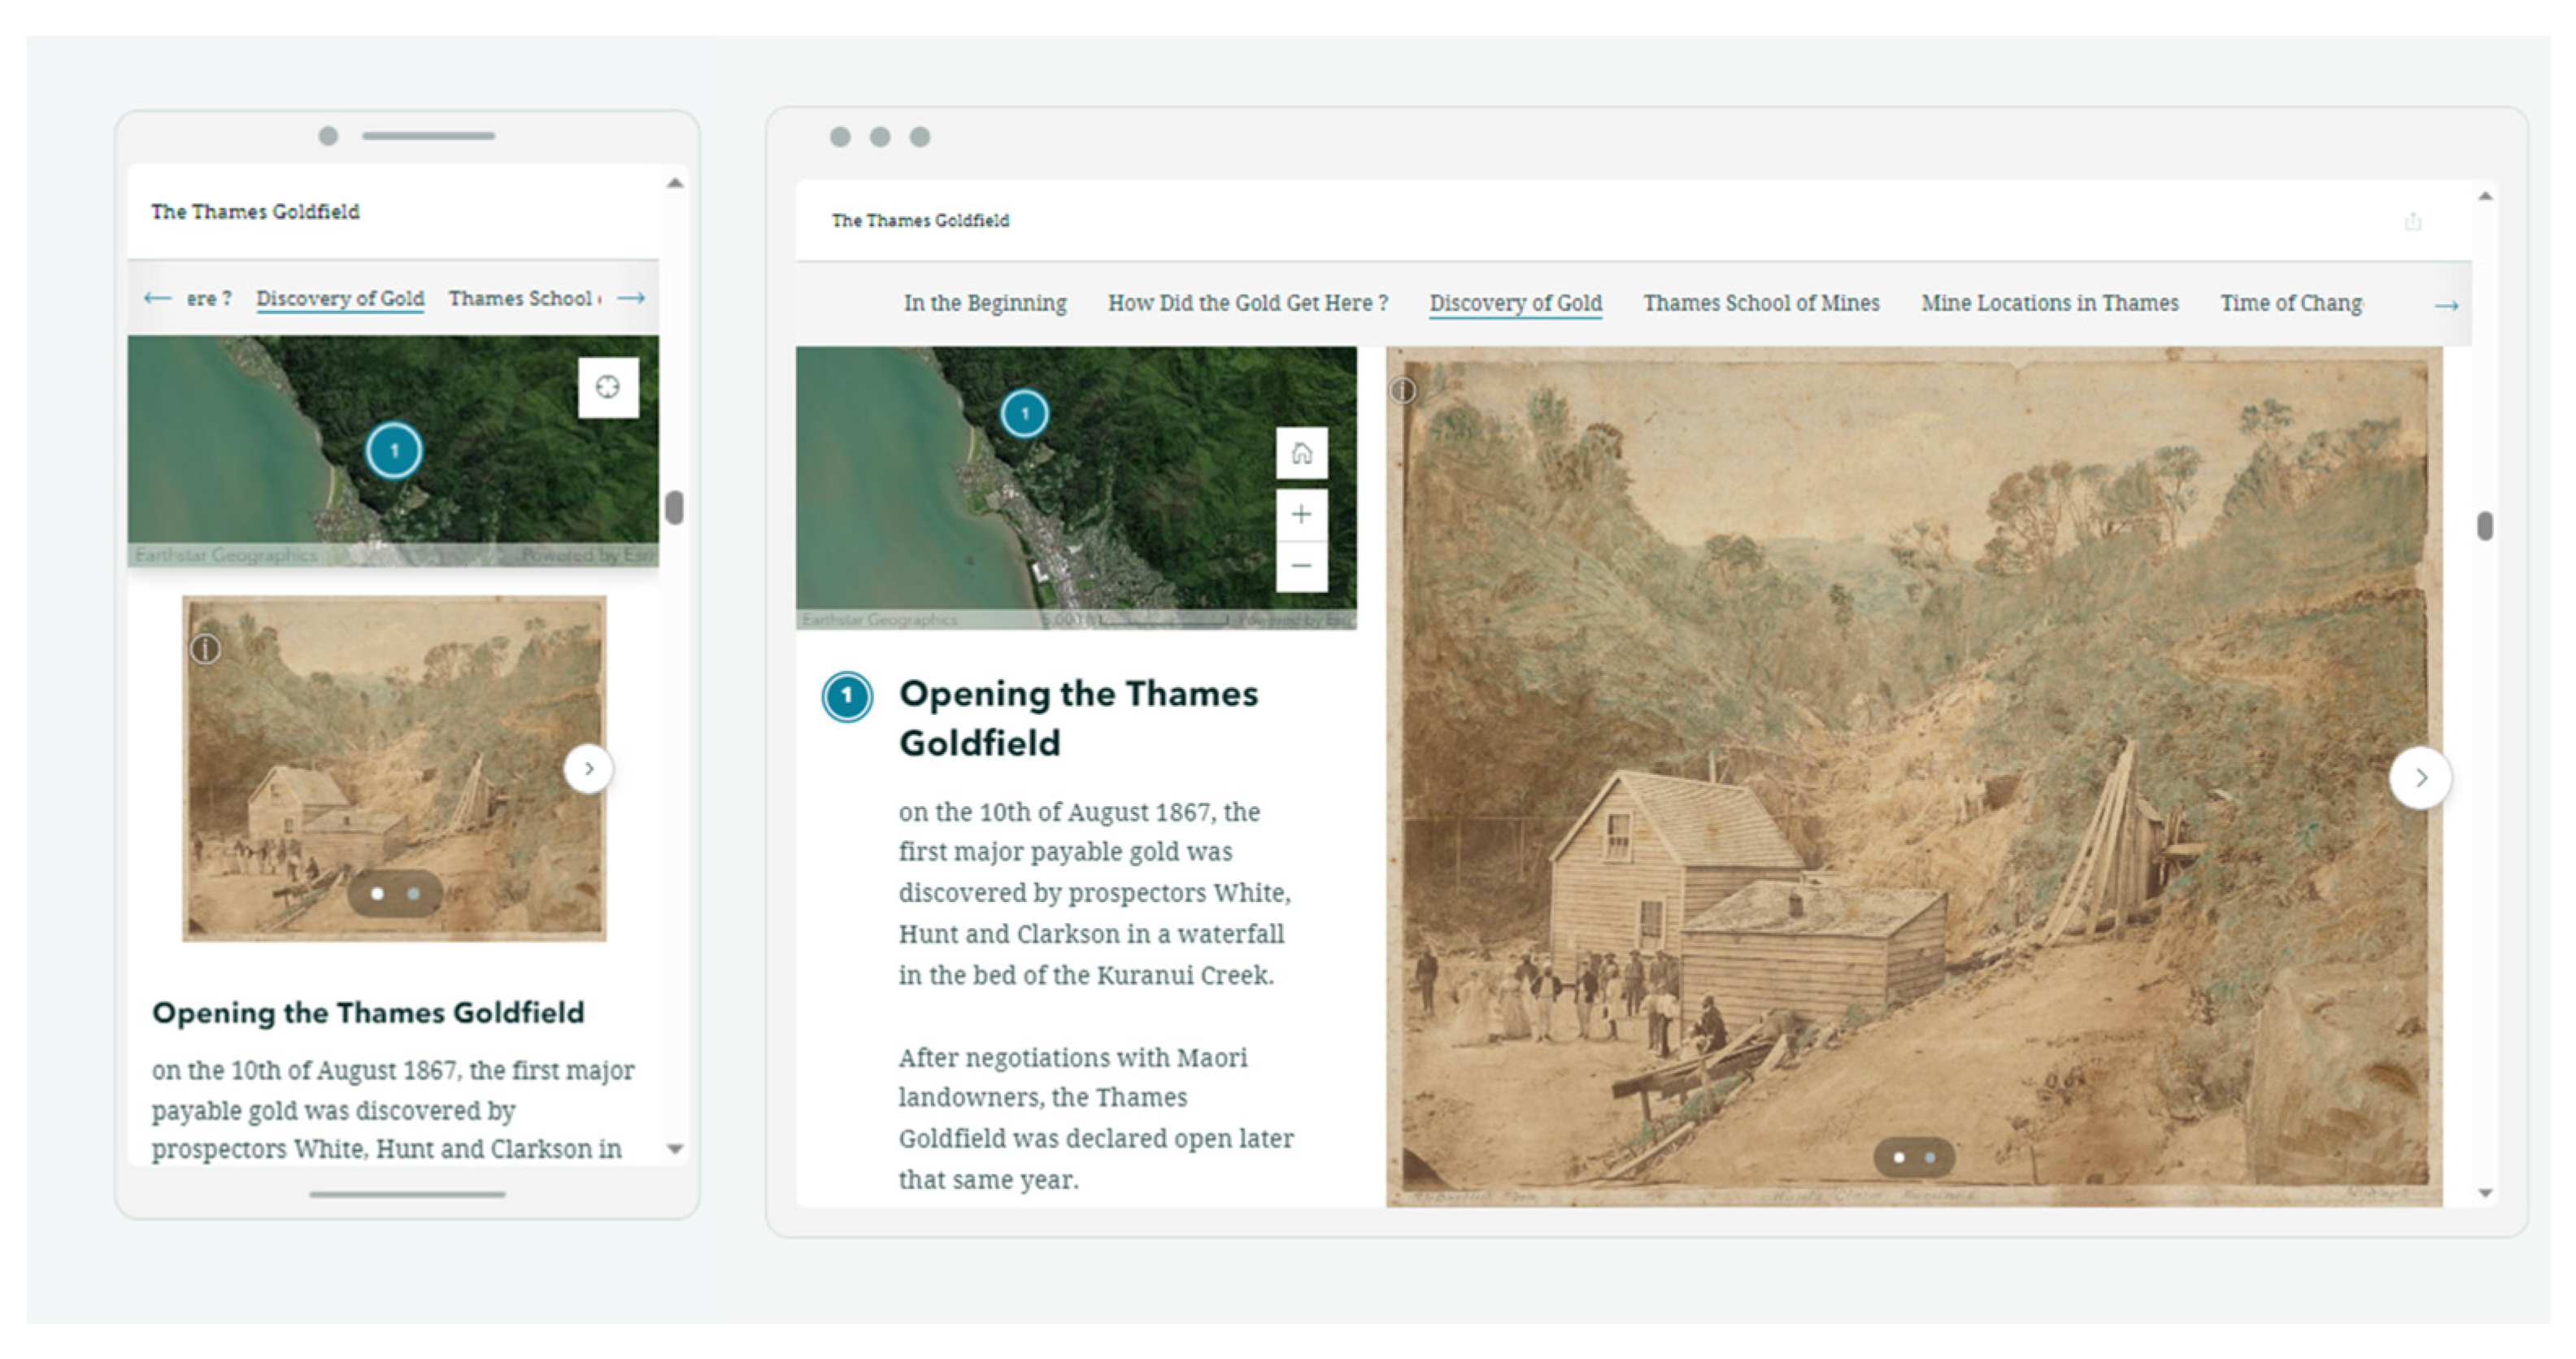
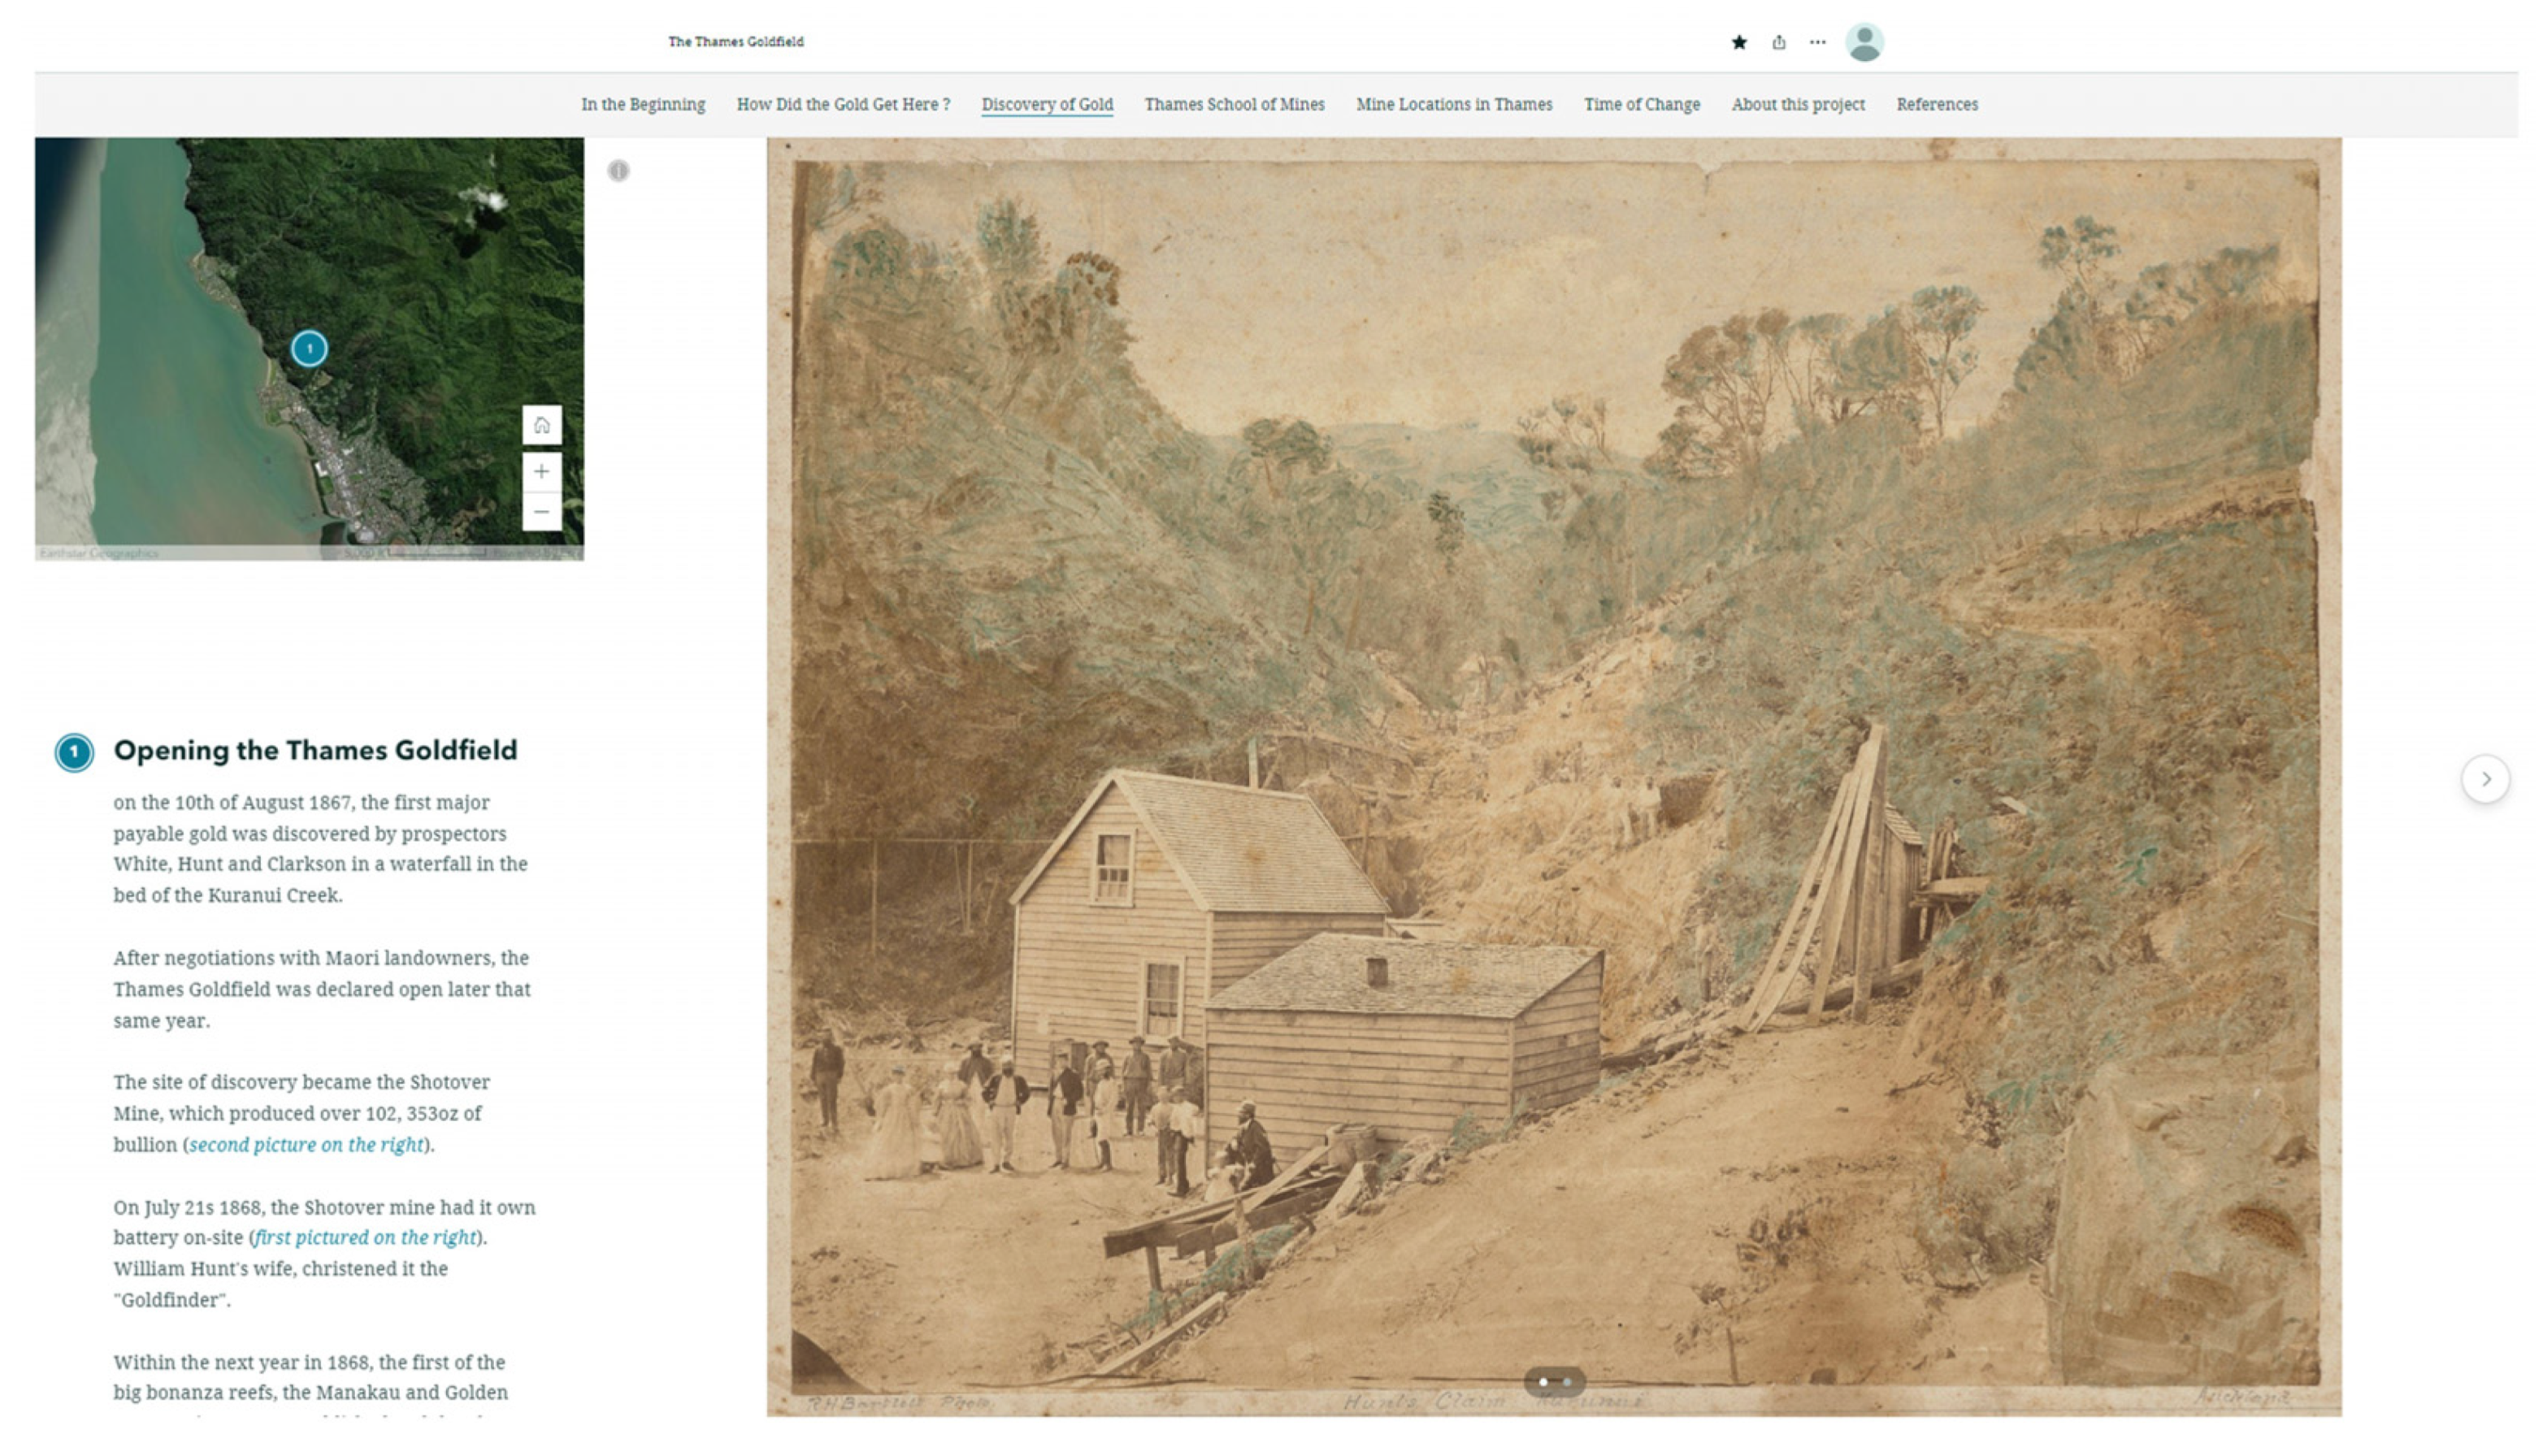
23]. It was not until 1867 in Thames when William Hunt, a prospector, identified gold flecks in the lower region of the Kauaeranga valley in a waterfall in the bed of the Kuranui stream that the next gold prospecting phase got underway [22]. Within the next year, in 1868, the first of the big bonanza reefs, the Manakau and Golden Crown mines were established as Thames peaked in population to 18,000 as more people arrived with the aim of becoming rich [22].
From the late 1860s, the gold mining industry in Thames was booming. It peaked in the 1870s, and brought Auckland out of economic depression, along with New Zealand’s first stock market boom [24,25]. From 1868 to 1871 were the town’s bonanza years, as gold production was at its peak, producing gold worth over GBP 1 million [22]. In total, 44% of the gold production in the Thames District came from six bonanza-grade deposits that covered an area of approximately 1.1 km2 [26]. The method of mining consisted primarily of underground mining, following quartz veins that contained the gold [23]. Hard rock mining took a while to take off as it required capital and expertise that was beyond the capabilities of alluvial miners, though with the prospect of gold, rock crushing batteries, pump stations, and transport systems for the ore were set up and commenced production in the mid-1860s, allowing more gold to be recovered [17,25]. Gold and silver production in the Thames District rapidly declined after 1900 as companies struggled to survive [25].

3. Thames School of Mines

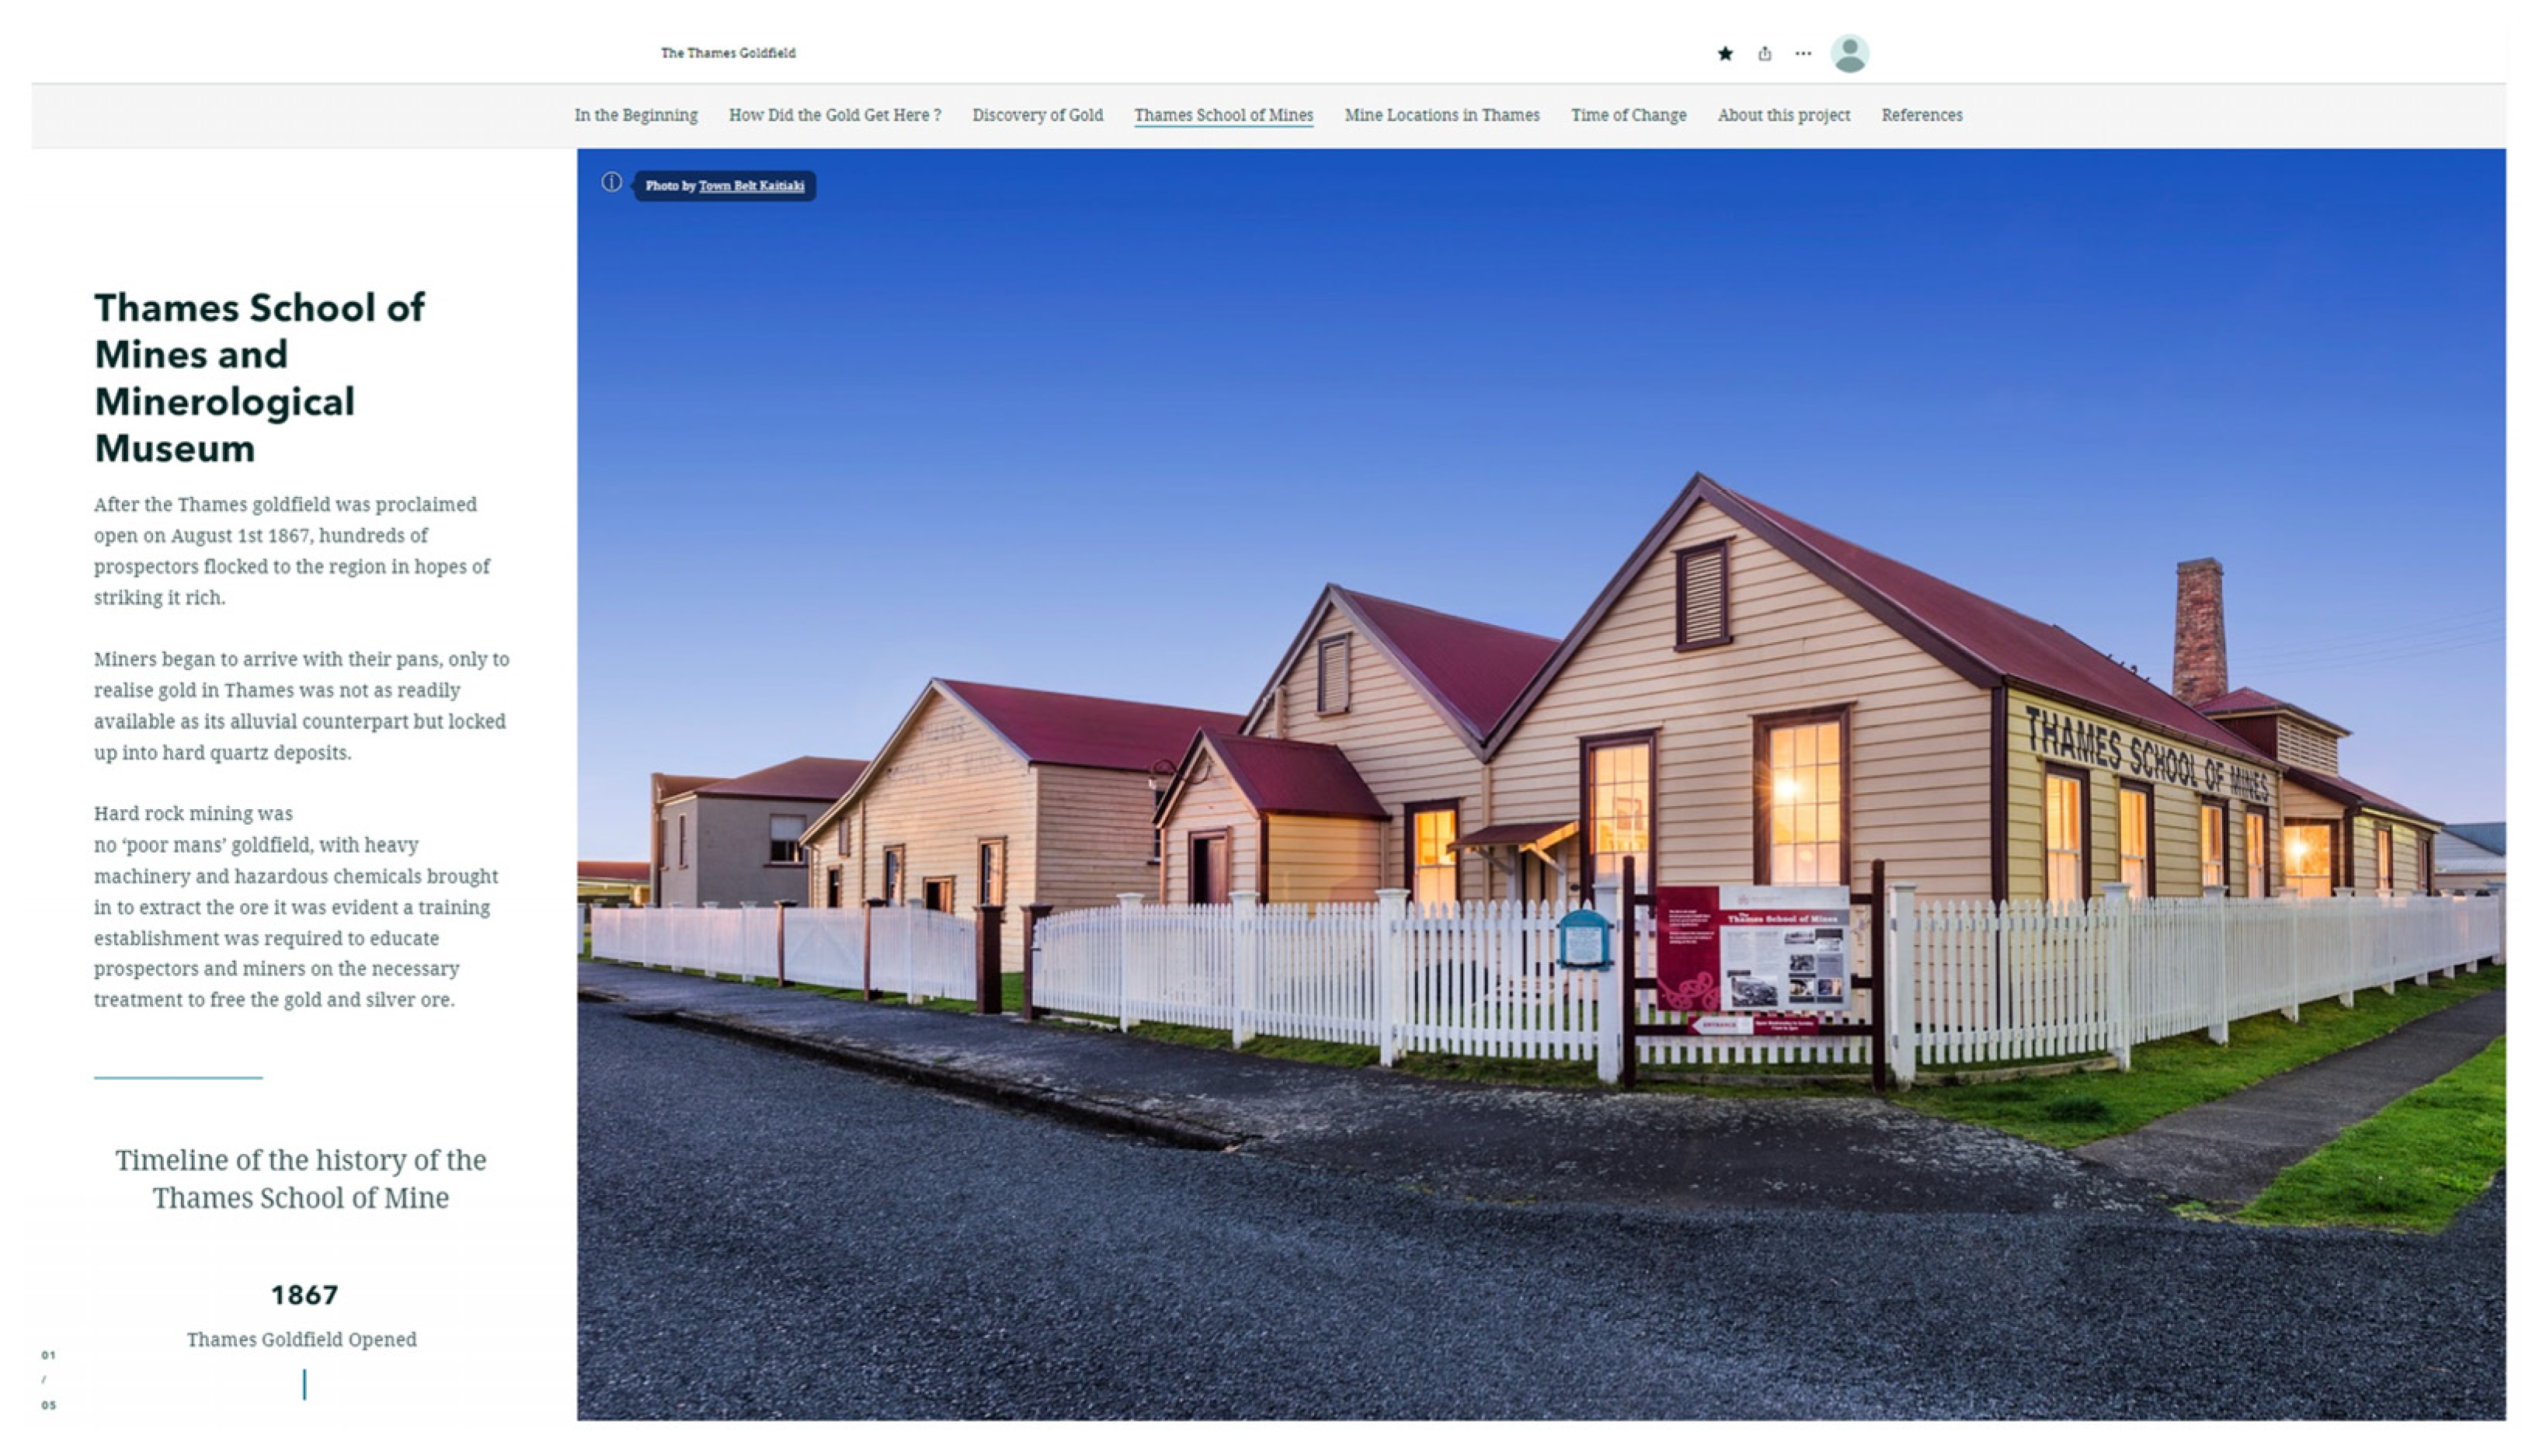
The Thames School of Mines was established in November 1885 after the discovery of payable gold, becoming the largest of 30 national school of mines within New Zealand [27]. Gold mining in the Hauraki District brought a new set of challenges for miners in New Zealand, as this was one of the first encounters with hard rock mining, utilizing heavy machinery specially imported to extract the ore. It quickly became evident that a training establishment was required to educate prospectors and miners on the necessary treatment to free the gold and silver ore from its host rock materials [28].
In 1886, the School of Mines was moved to what is now its permanent location, a former Wesleyan Sunday School, on the site of an urupa where the descendants of chief Te Apurangi rest [29]. The location of the school was centered in the middle of the Thames Mining District, giving students local access to vital facilities as well as holding classes in morning blocks or evening blocks to suit students actively engaging in mining [29]. The opening of the school had the primary objective of stimulating monetary investment from prospective miners. Additional buildings and facilities, such as the experimental metallurgical works (1888), library (1895), and Mineral Museum (1901), were added in subsequent years [30]. The school’s curriculum had an emphasis on mining practices, such as land and mining surveying, assaying, chemistry, geology and minerology, and ventilation and explosives, although it also taught subjects relating to agricultural sciences, pharmacology, and other engineering disciplines [29,30].
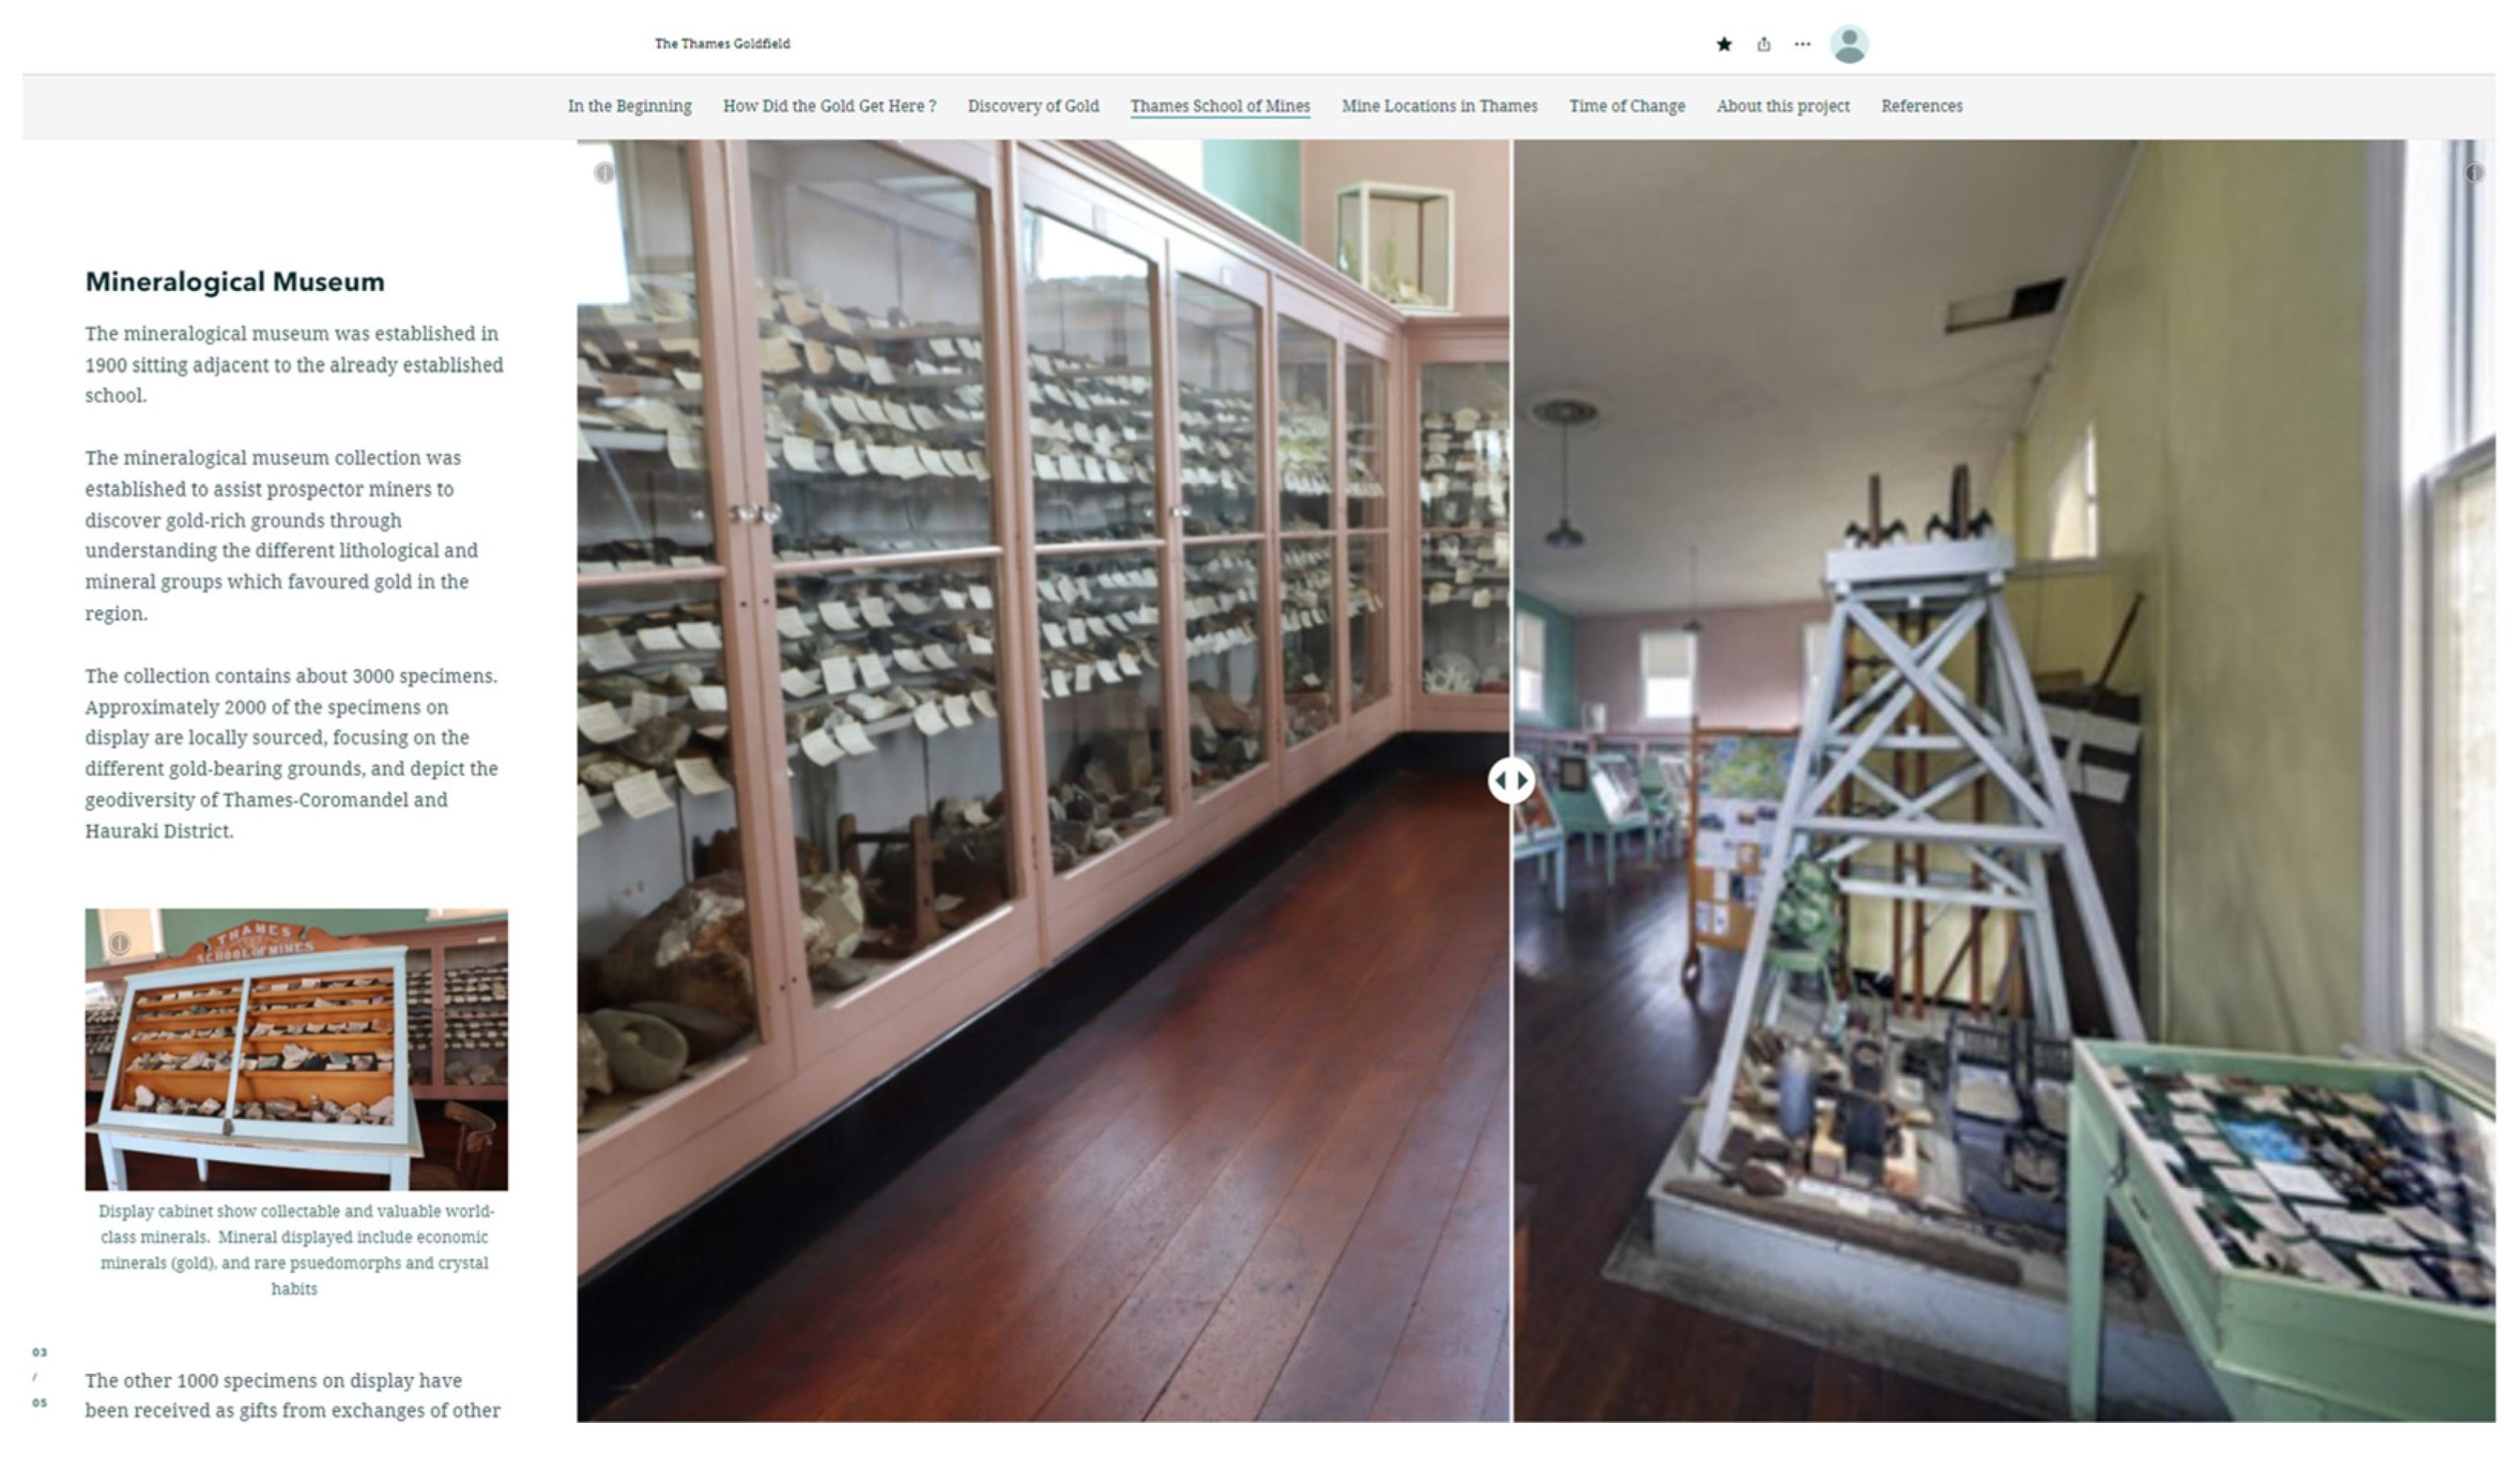
The Thames School of Mines’ Mineralogical Museum holds over 3000 rock and mineral specimens and is recognized as one of the best collections in the Southern Hemisphere [30]. The collection is predominantly focused on locally sourced specimens, though also displays specimens collected from further afield, both in New Zealand and internationally. The mineralogical museum collection was established to assist prospector miners discover gold-rich grounds through understanding the different lithological and mineral groups that favored gold in the region [30].
The display of specimens in the museum has retained the same layout as it did in the early 1900s, with local specimens arranged to display the variation of rocks and minerals found around the Thames and the wider Hauraki region [29,30]. Samples collected from the local goldfield fill the exhibition hall, arranged in displays to show series of unfavorable and favorable gold-bearing ground. These specimens on display also include a selection of quartz containing assay values for gold and silver, obtained from crushing a 1-ton parcel of similar quartz [30]. Over the years, donations of specimens from outside the Thames Goldfield were received, such as collections from Tasmania and New Caledonia for mineral comparisons, as well as from prominent figures such as the likes of Captain Manning, who made a donation of nickel and chrome iron ore [30].
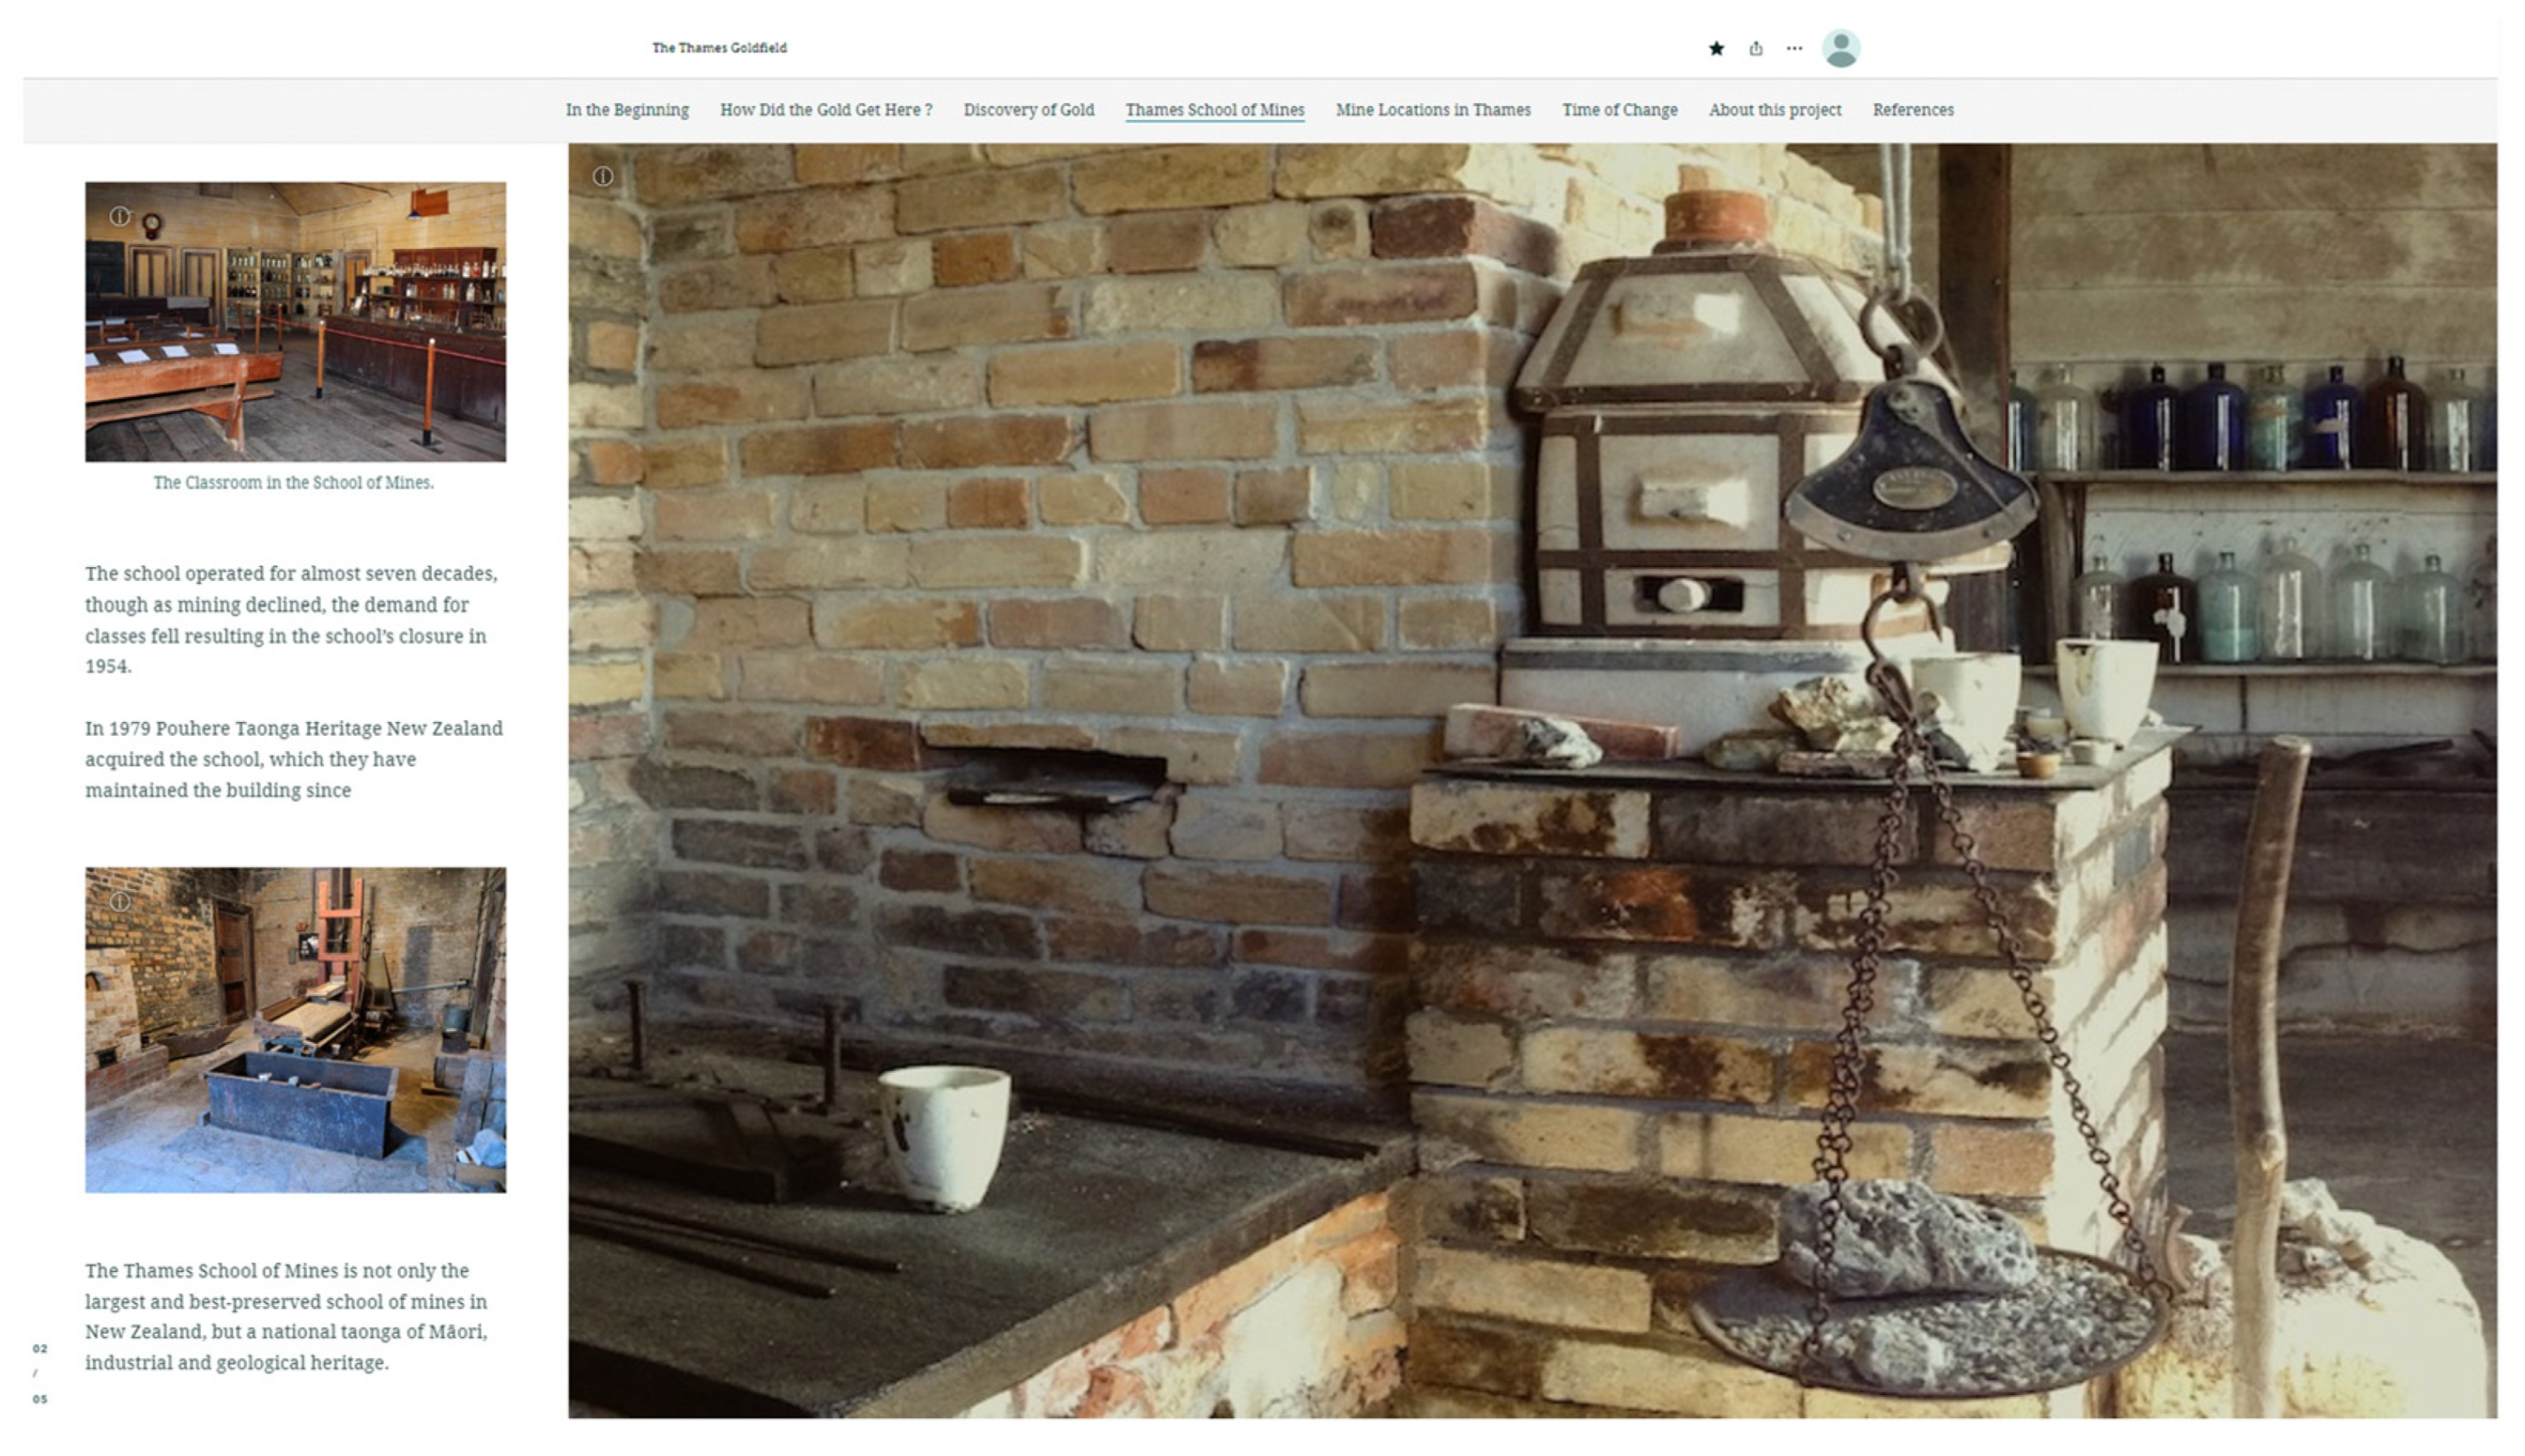
The school operated for almost seven decades, though as mining declined, the demand for classes fell, resulting in the school’s closure in 1954 [27]. In 1979, Pouhere Taonga Heritage New Zealand (former historical heritage trust) acquired the school, and have maintained the building ever since [27]. The Thames School of Mines is not only the largest and best-preserved school of mines in New Zealand, but a national taonga (a Māori word meaning “treasure of great cultural value”) demonstrating the convergence of Māori, industrial, and geological heritage [30].

4. Materials and Methods

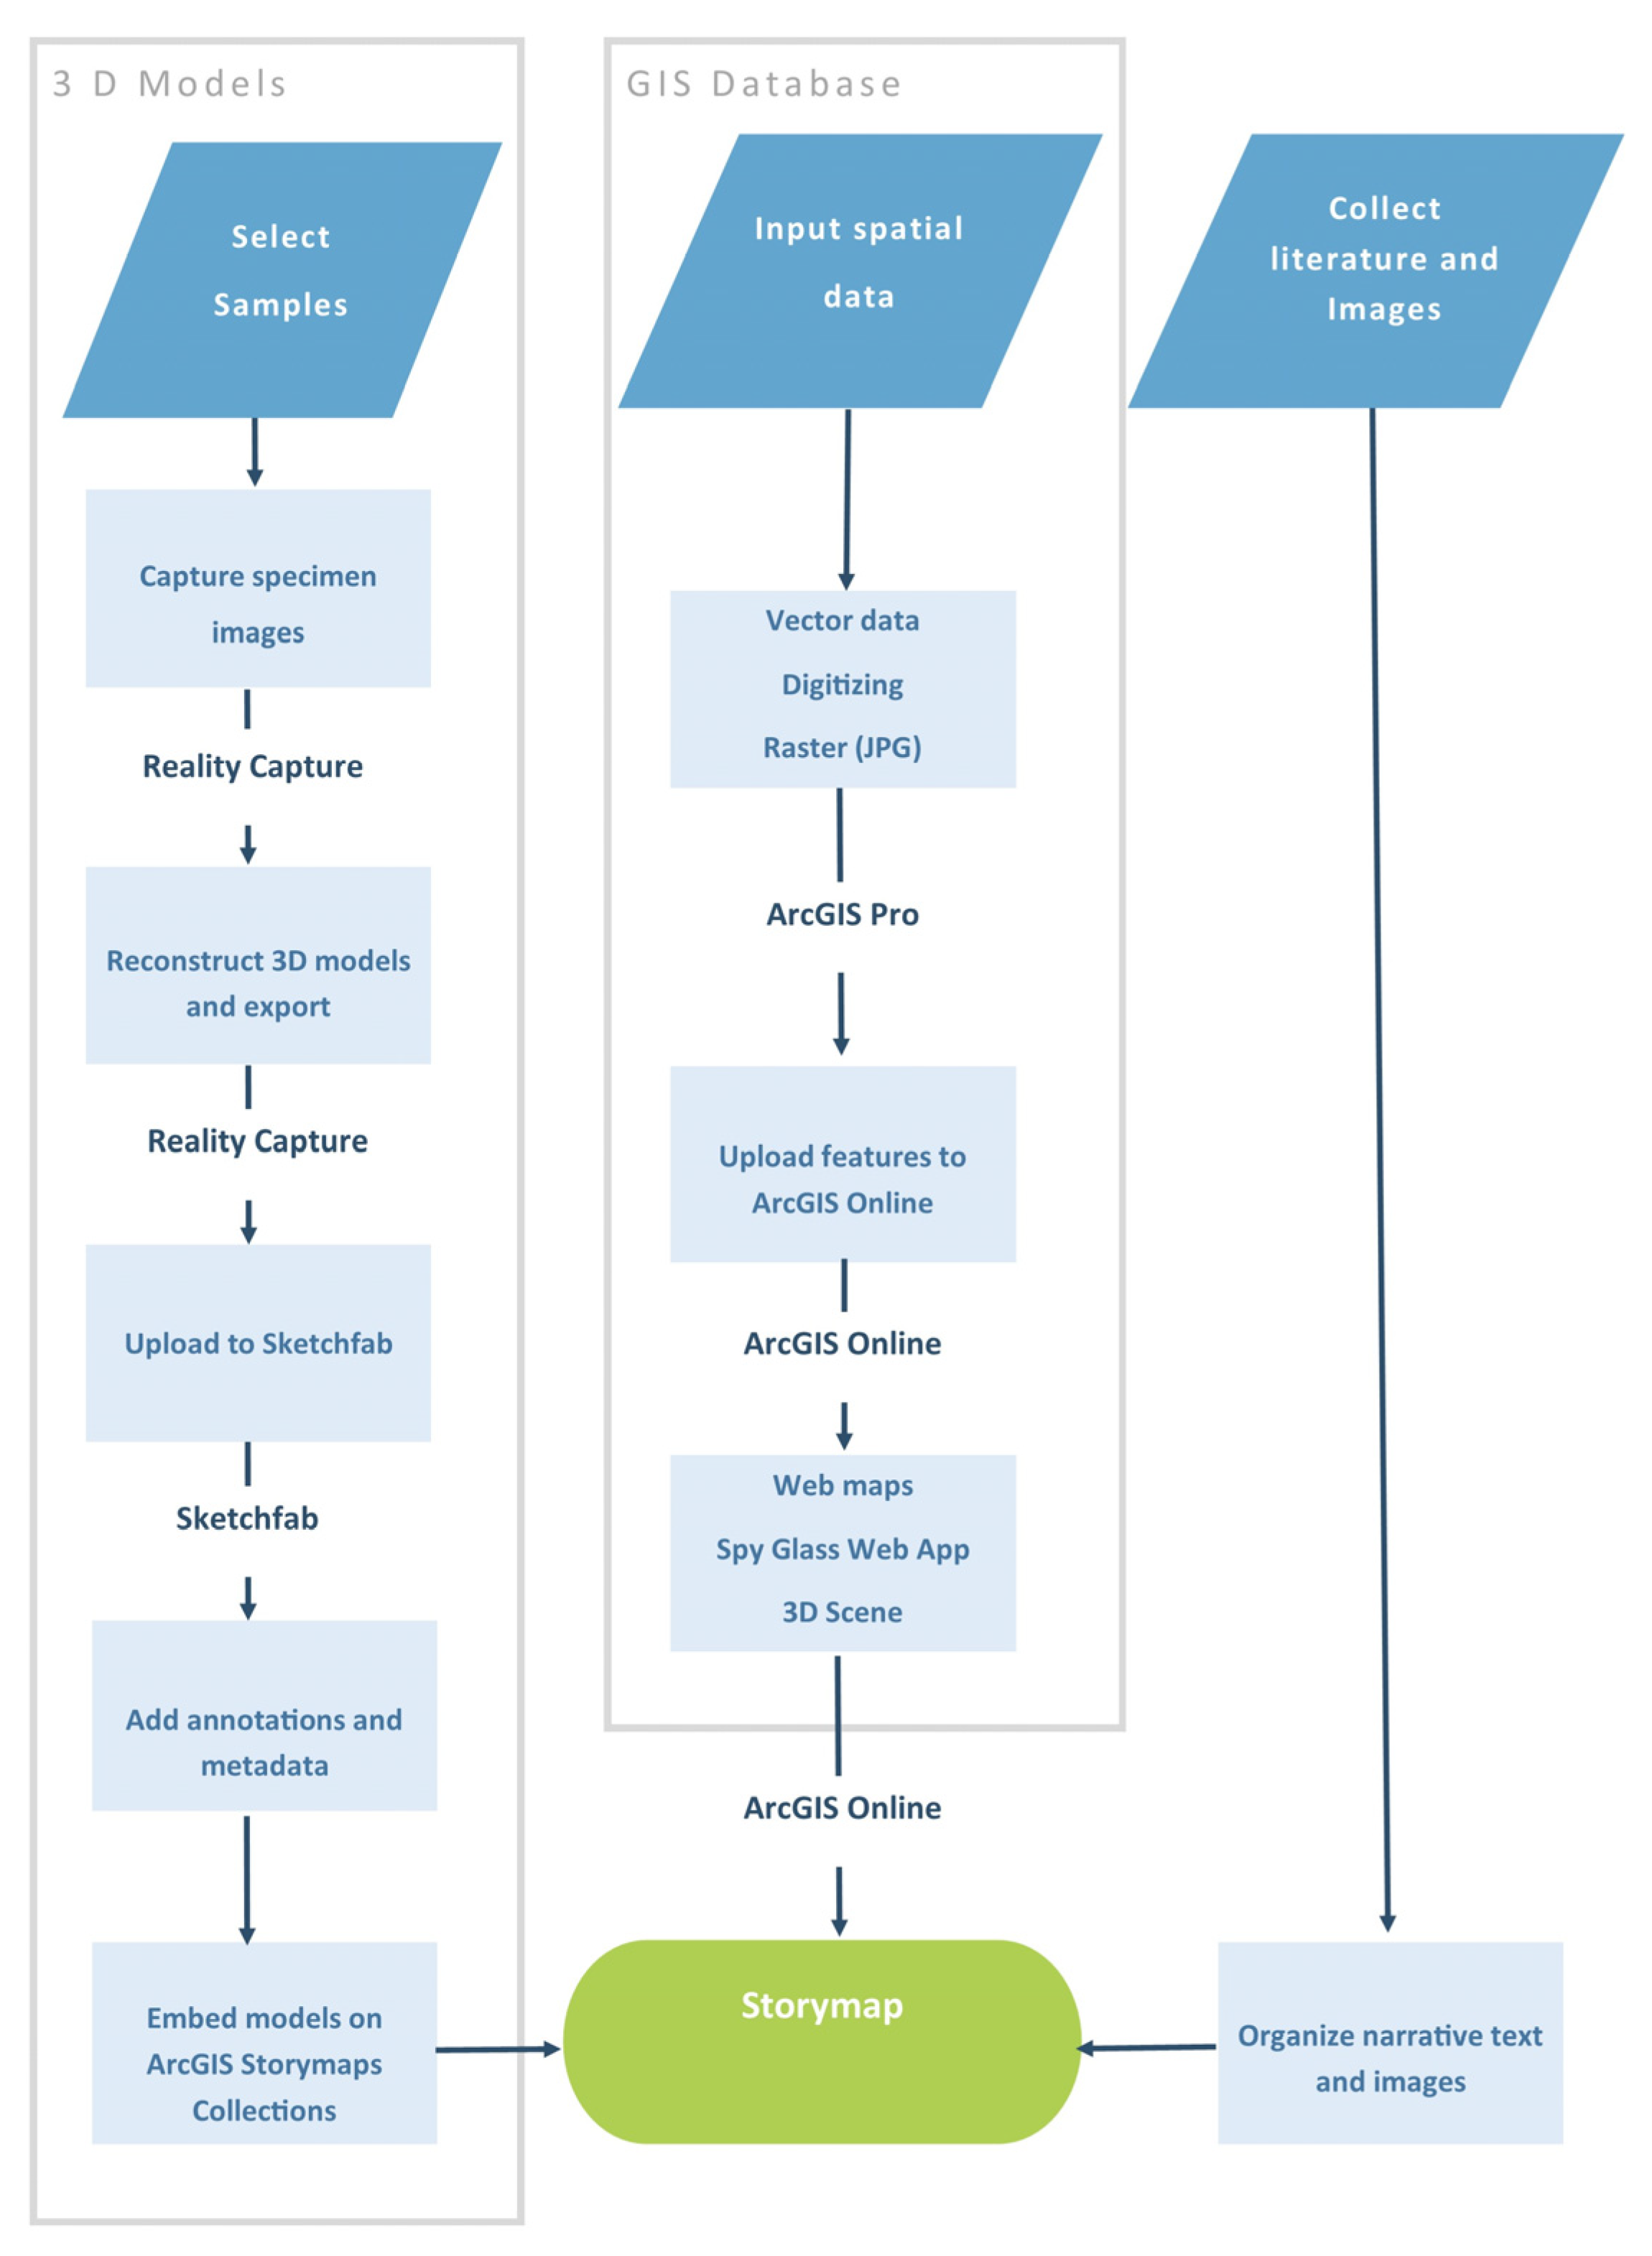
The methodology of constructing the web applications follows the workflow featured in Figure 3. The workflow features two major components, (1) the creation of the 3D model repository and (2) web maps, brought together to be integrated into the Storymaps. To create the storymap of the Thames Goldfield, different types of datasets have been compiled into the web application. Several sources were consulted to gain all the documentation needed. The gathered information was organized to provide a complete framework for the storymap of the gold mining districts in Thames and the surrounding vicinities (Appendix C).

4.1. Photogrammetry and 3D Rendering of Specimens

Photogrammetry and 3D scanning of rock and mineral specimens have been increasing in recent years, particularly in geo-education [31]. The use of 3D virtual models allows us to contextualize and gain a better understanding of geological materials that photos cannot provide on their own.
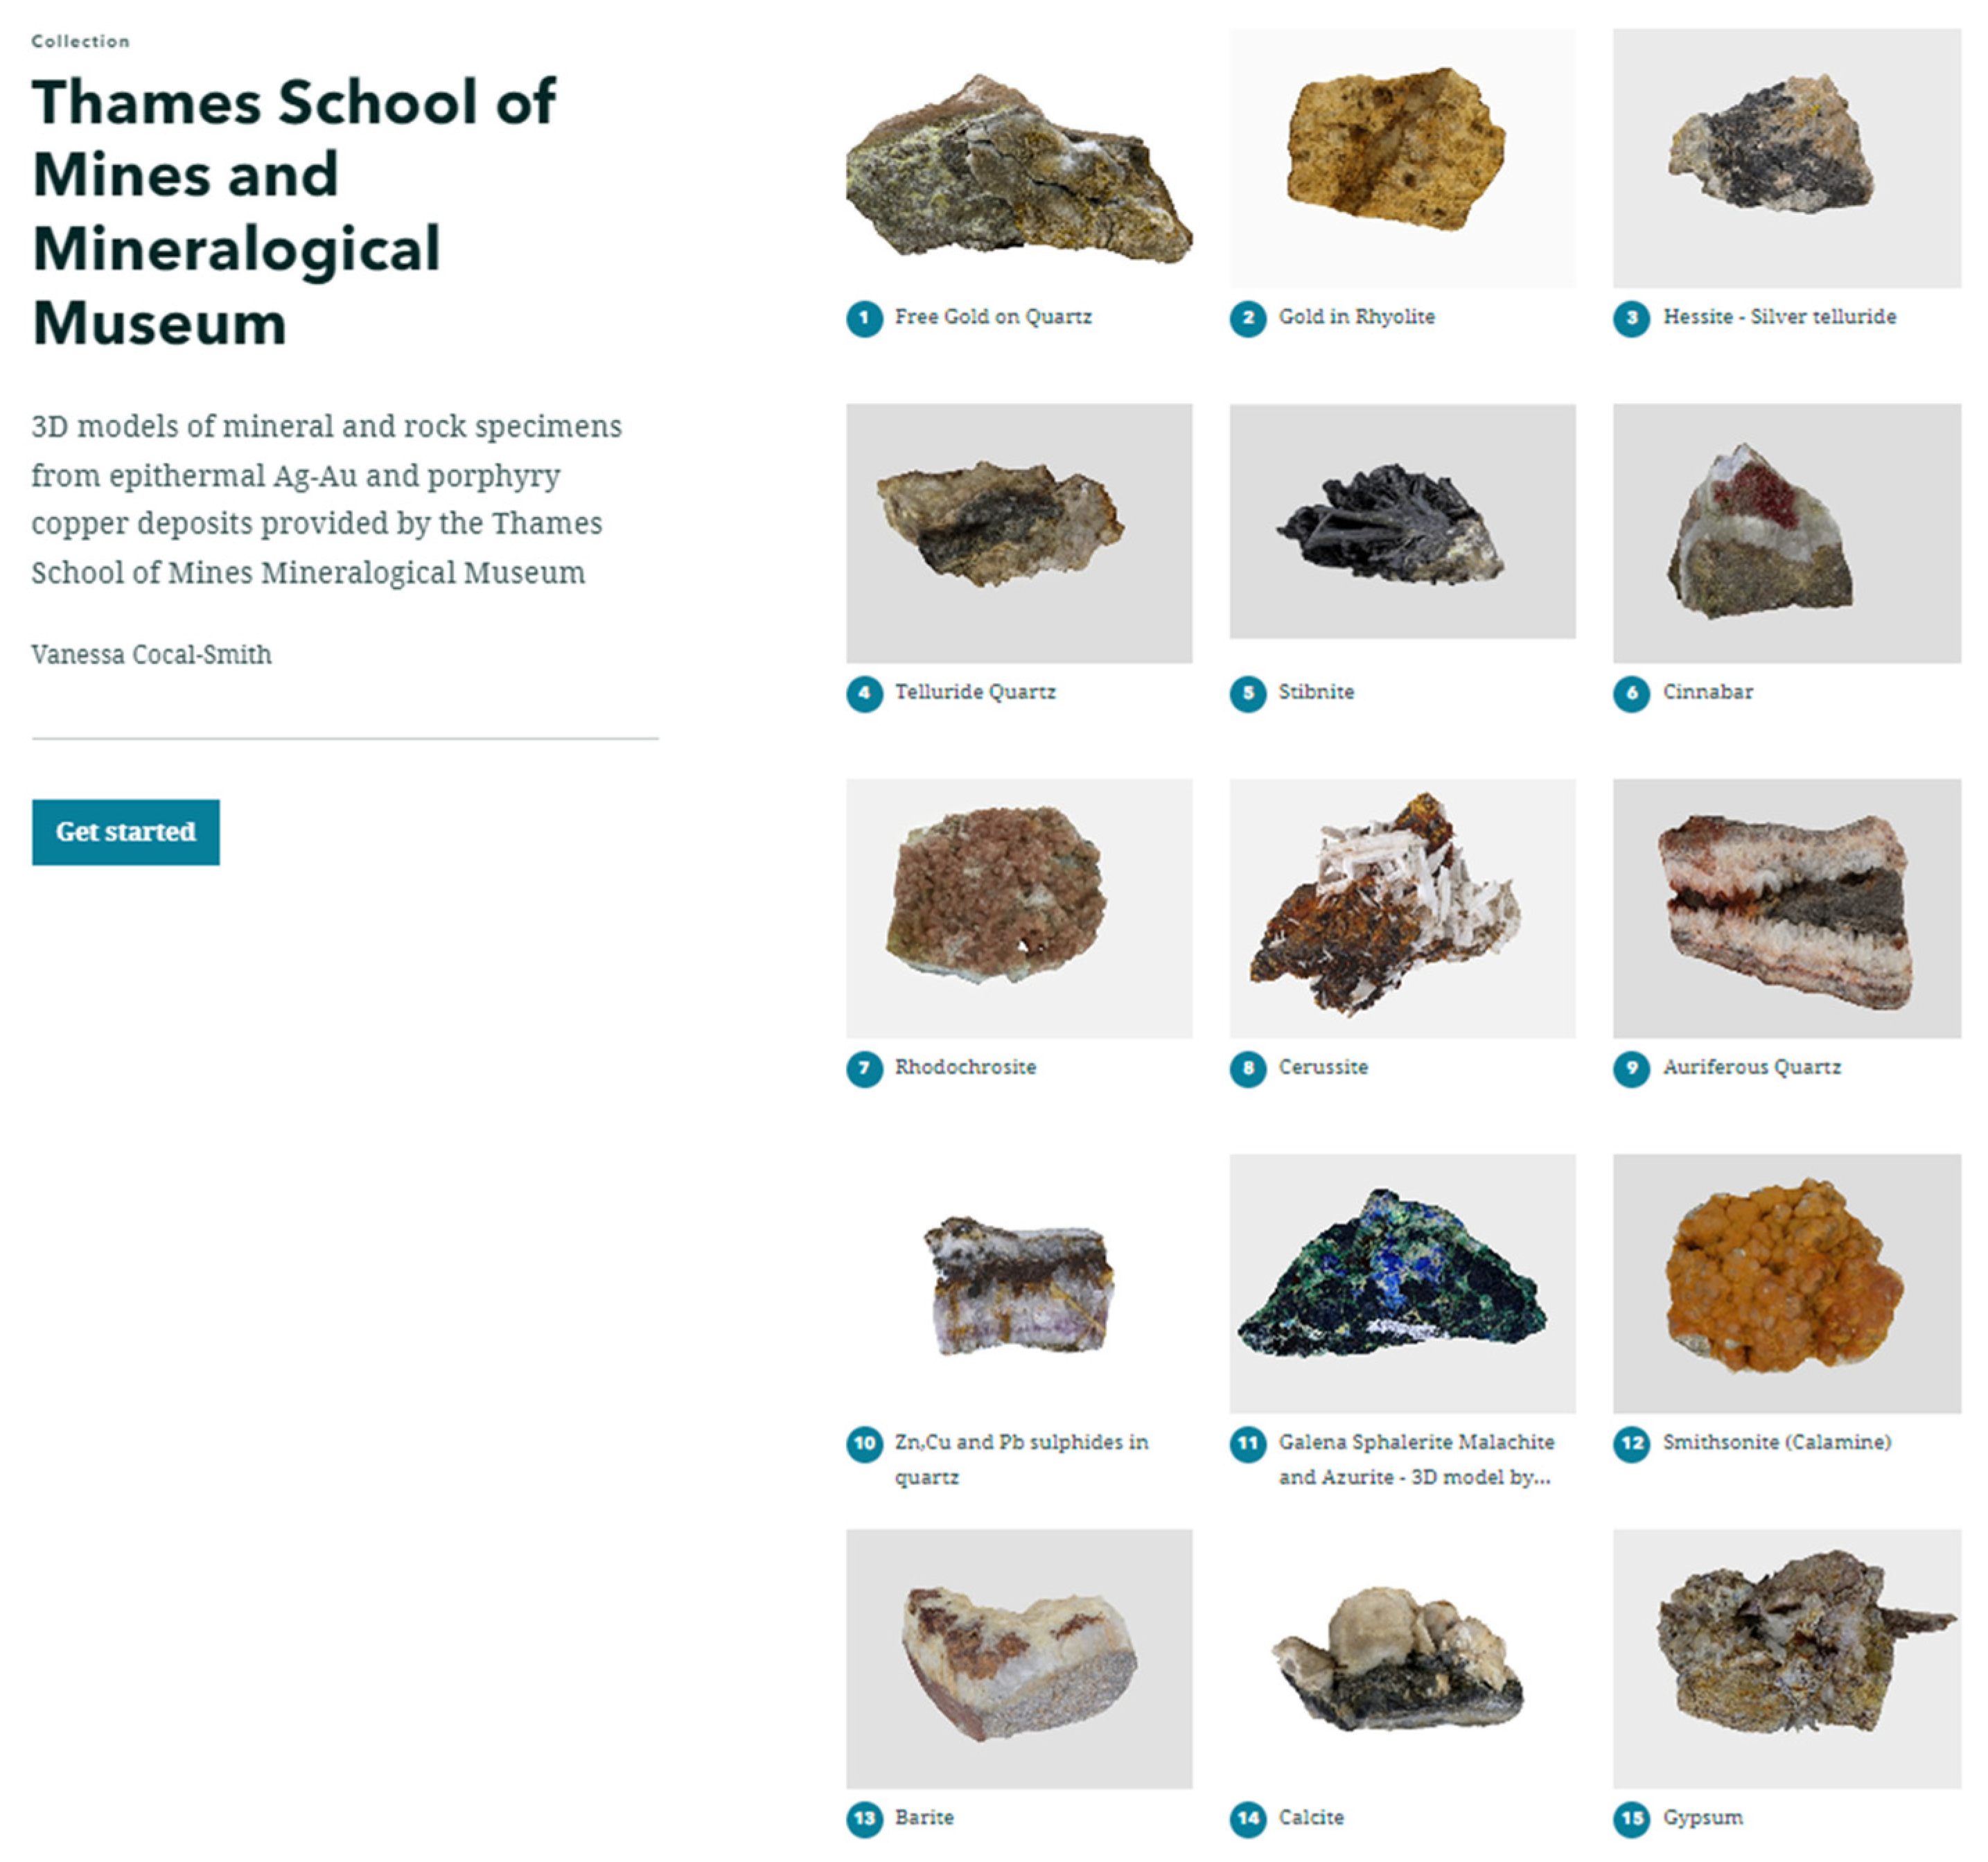
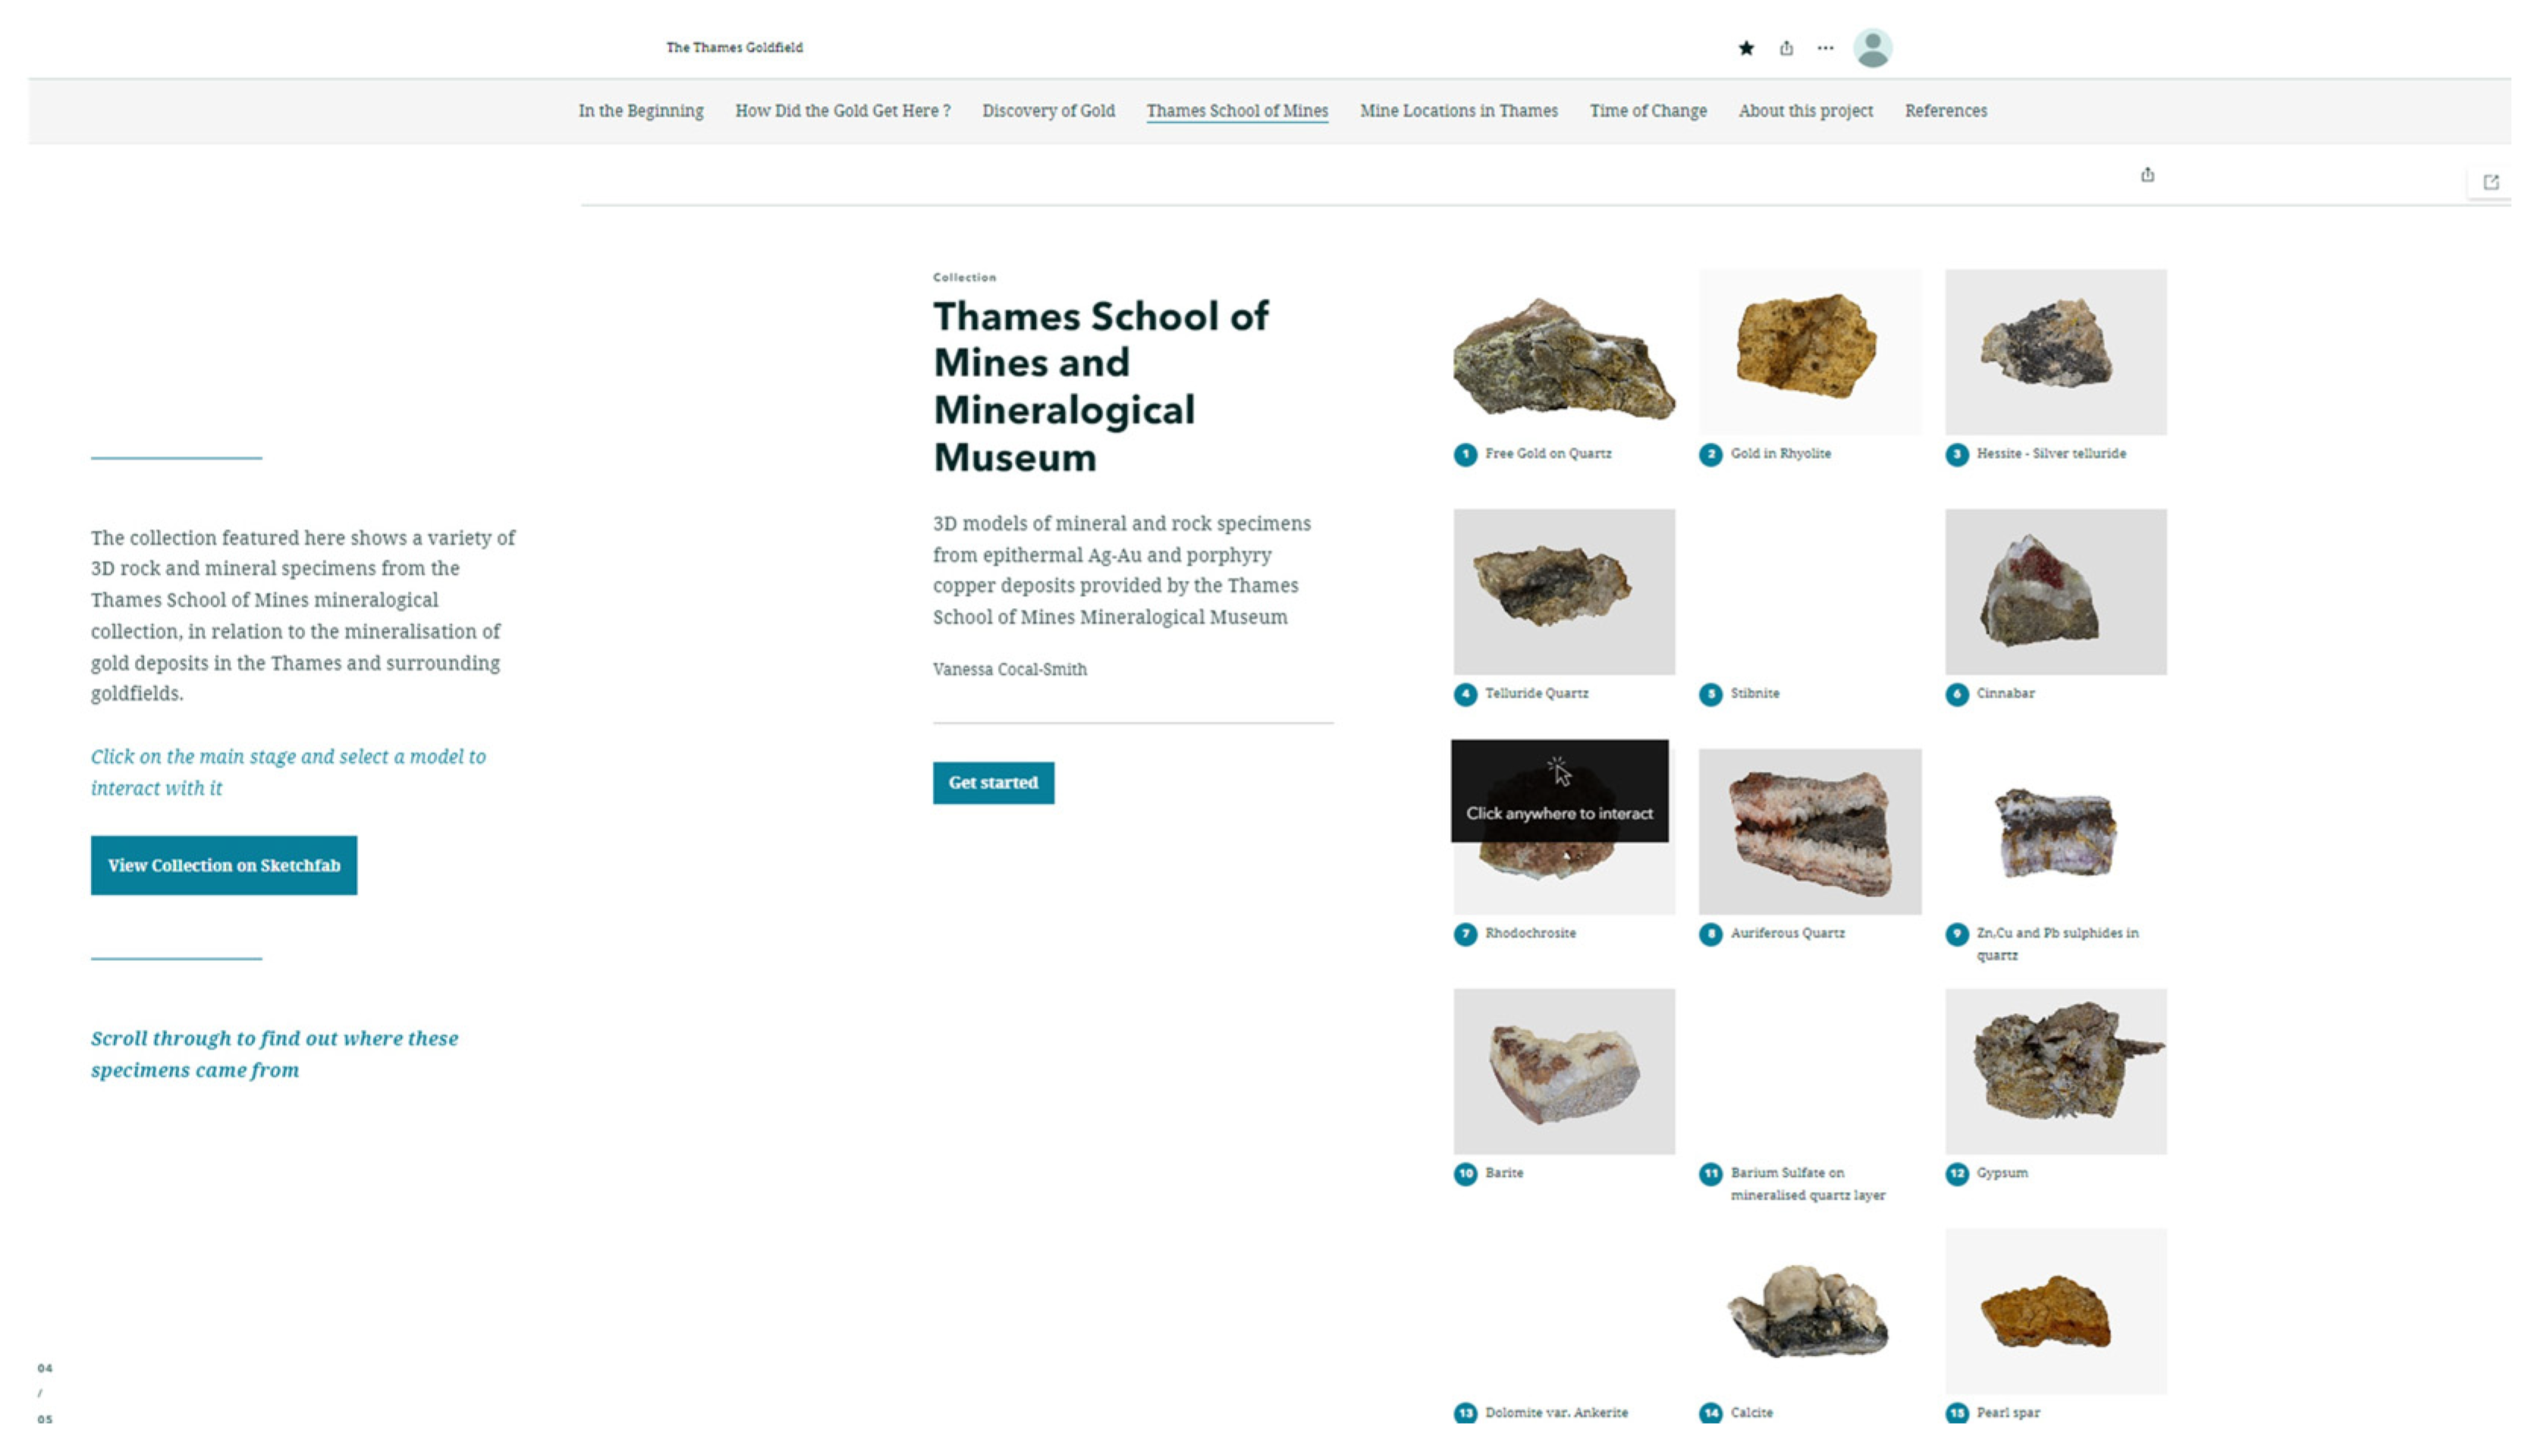
The Thames School of Mines mineralogical collection was made available to this project. Specimens selected from the collection were utilized to present a story of mineralization in the region in relation to the epithermal Ag–Au deposits. The selection criteria for the specimens were based on their relevance to epithermal mineralization at various stages, identified as having been found in Thames and the surrounding vicinity, as well as demonstrating geodiversity and aesthetic crystal habits.
To construct the models, the photogrammetric technique Structure-from-Motion (SfM) was employed. SfM photogrammetry is a technique that constructs a 3D projection from a series of 2D images by tie-point recognition from overlapping features present in the images [32]. SfM photogrammetry is a low-cost and efficient method for creating accurate and high-resolution 3D models [
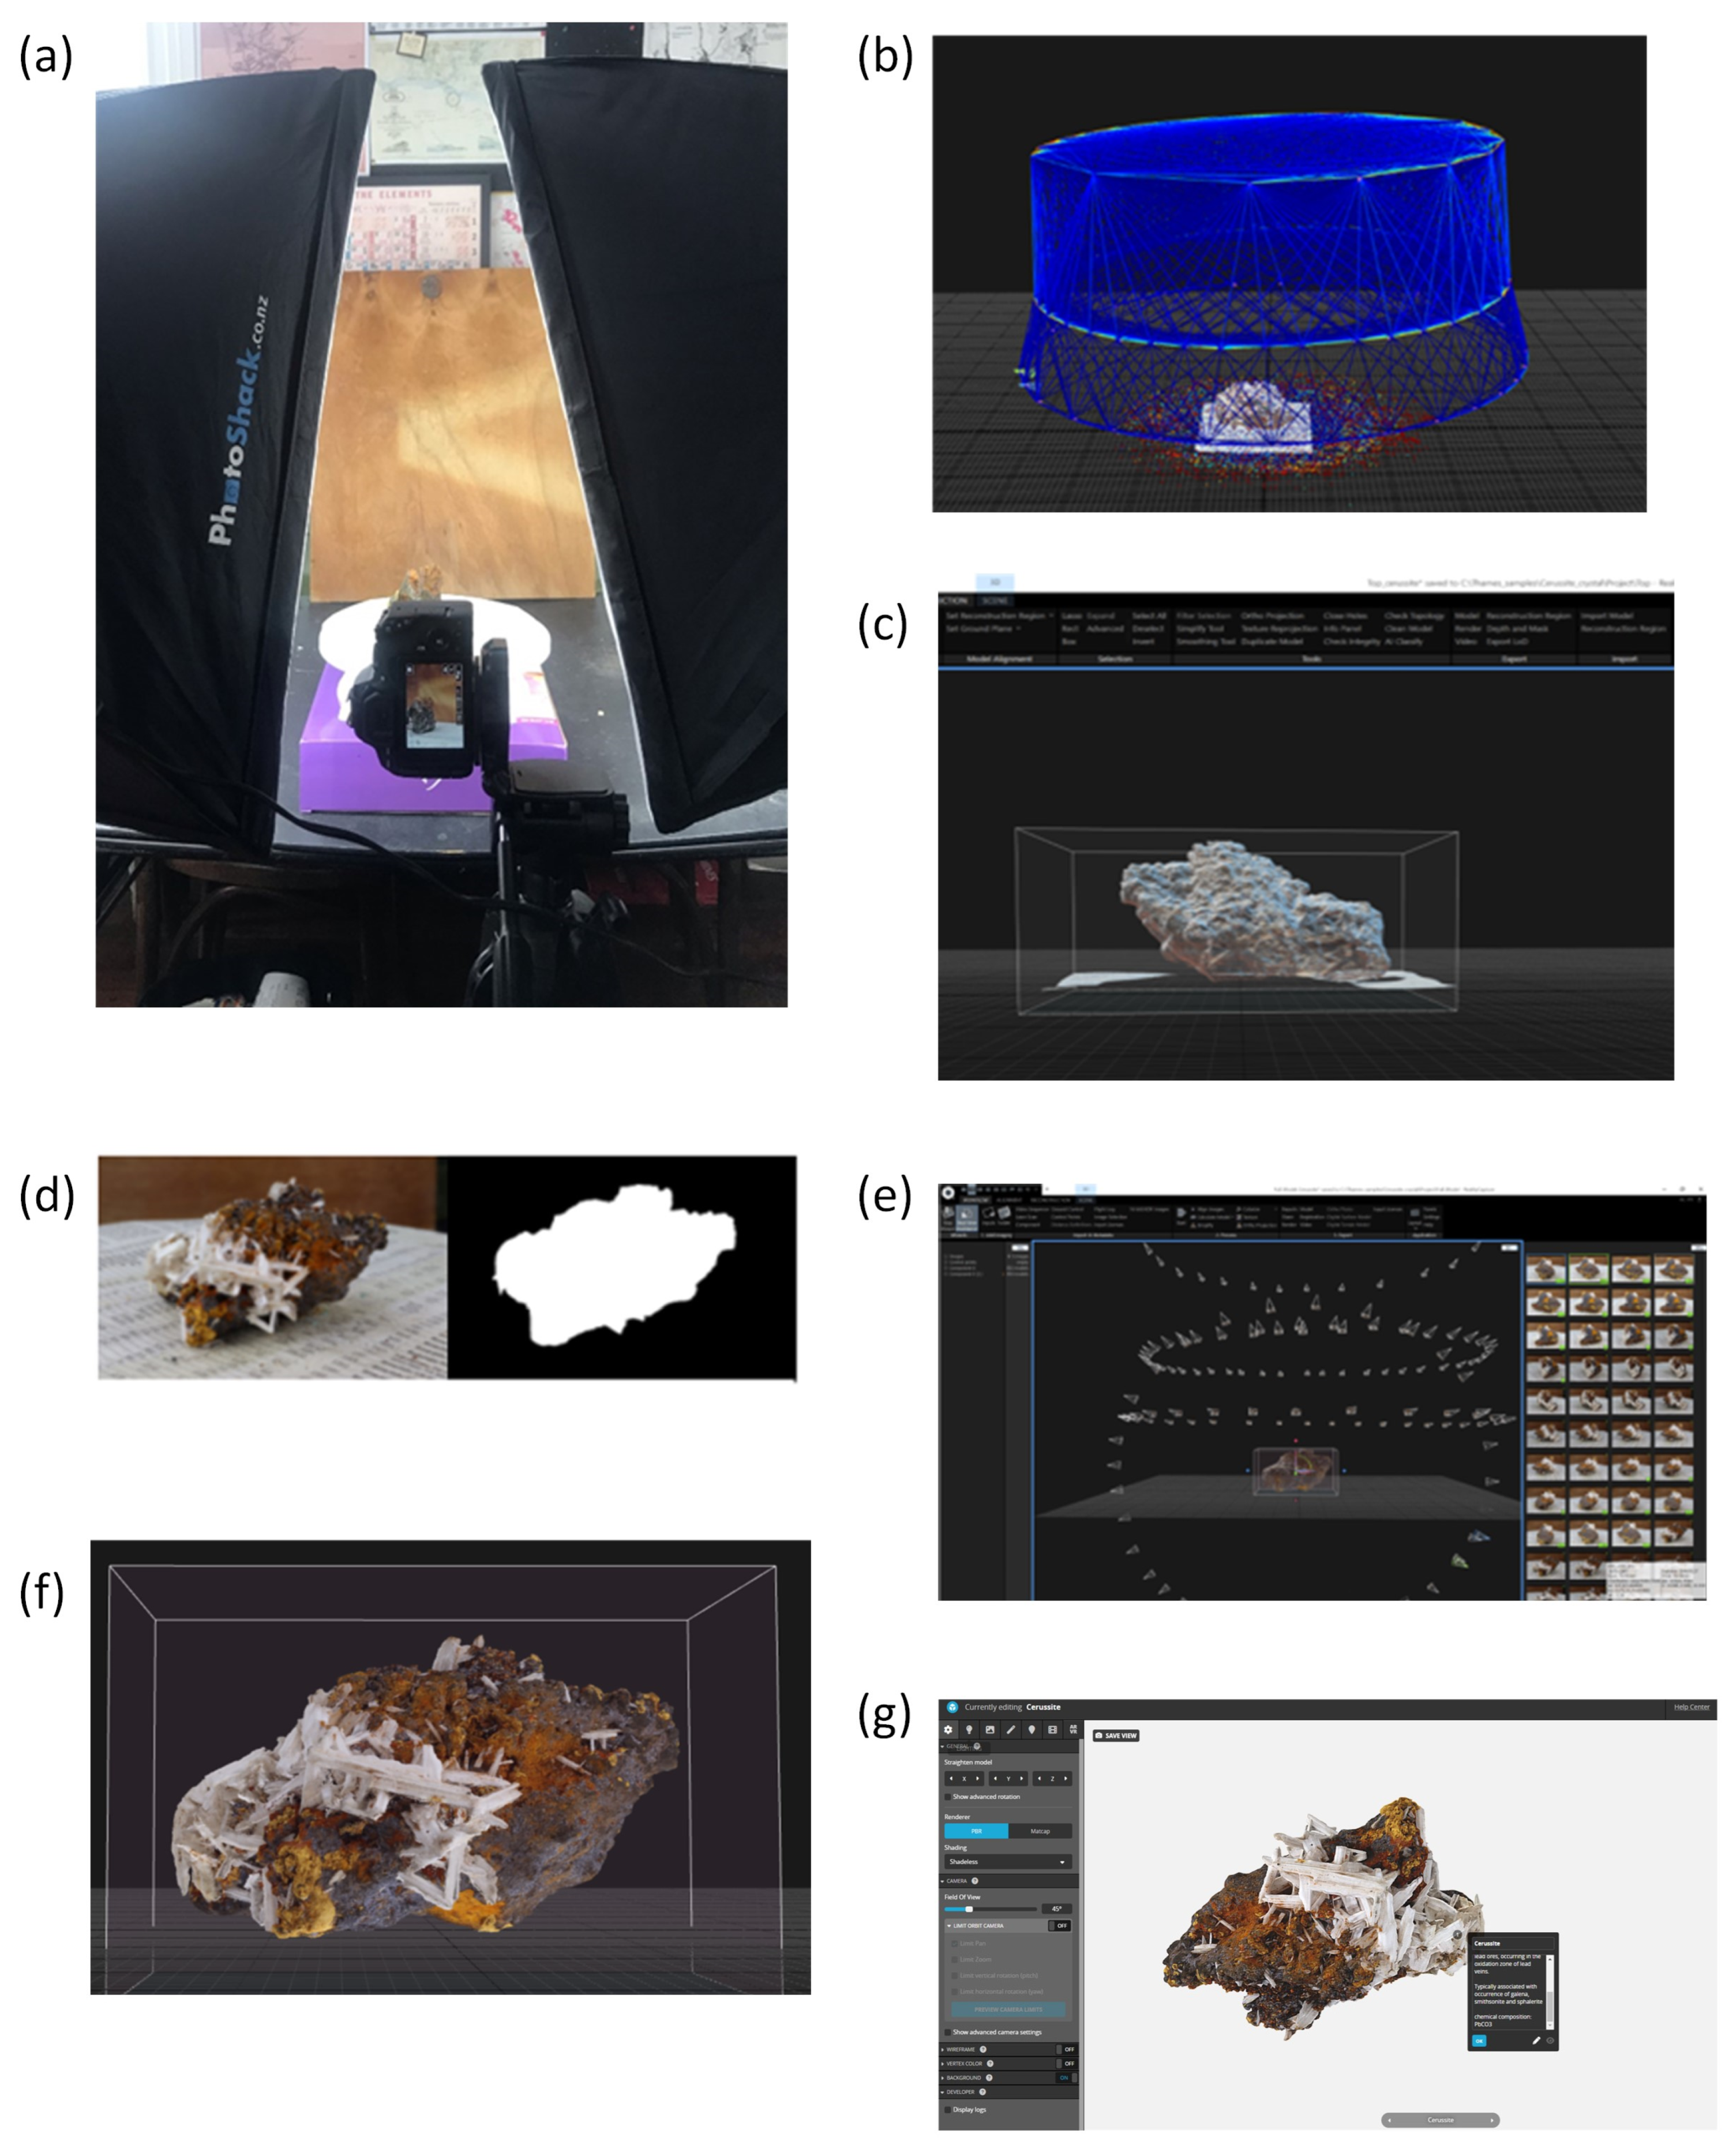
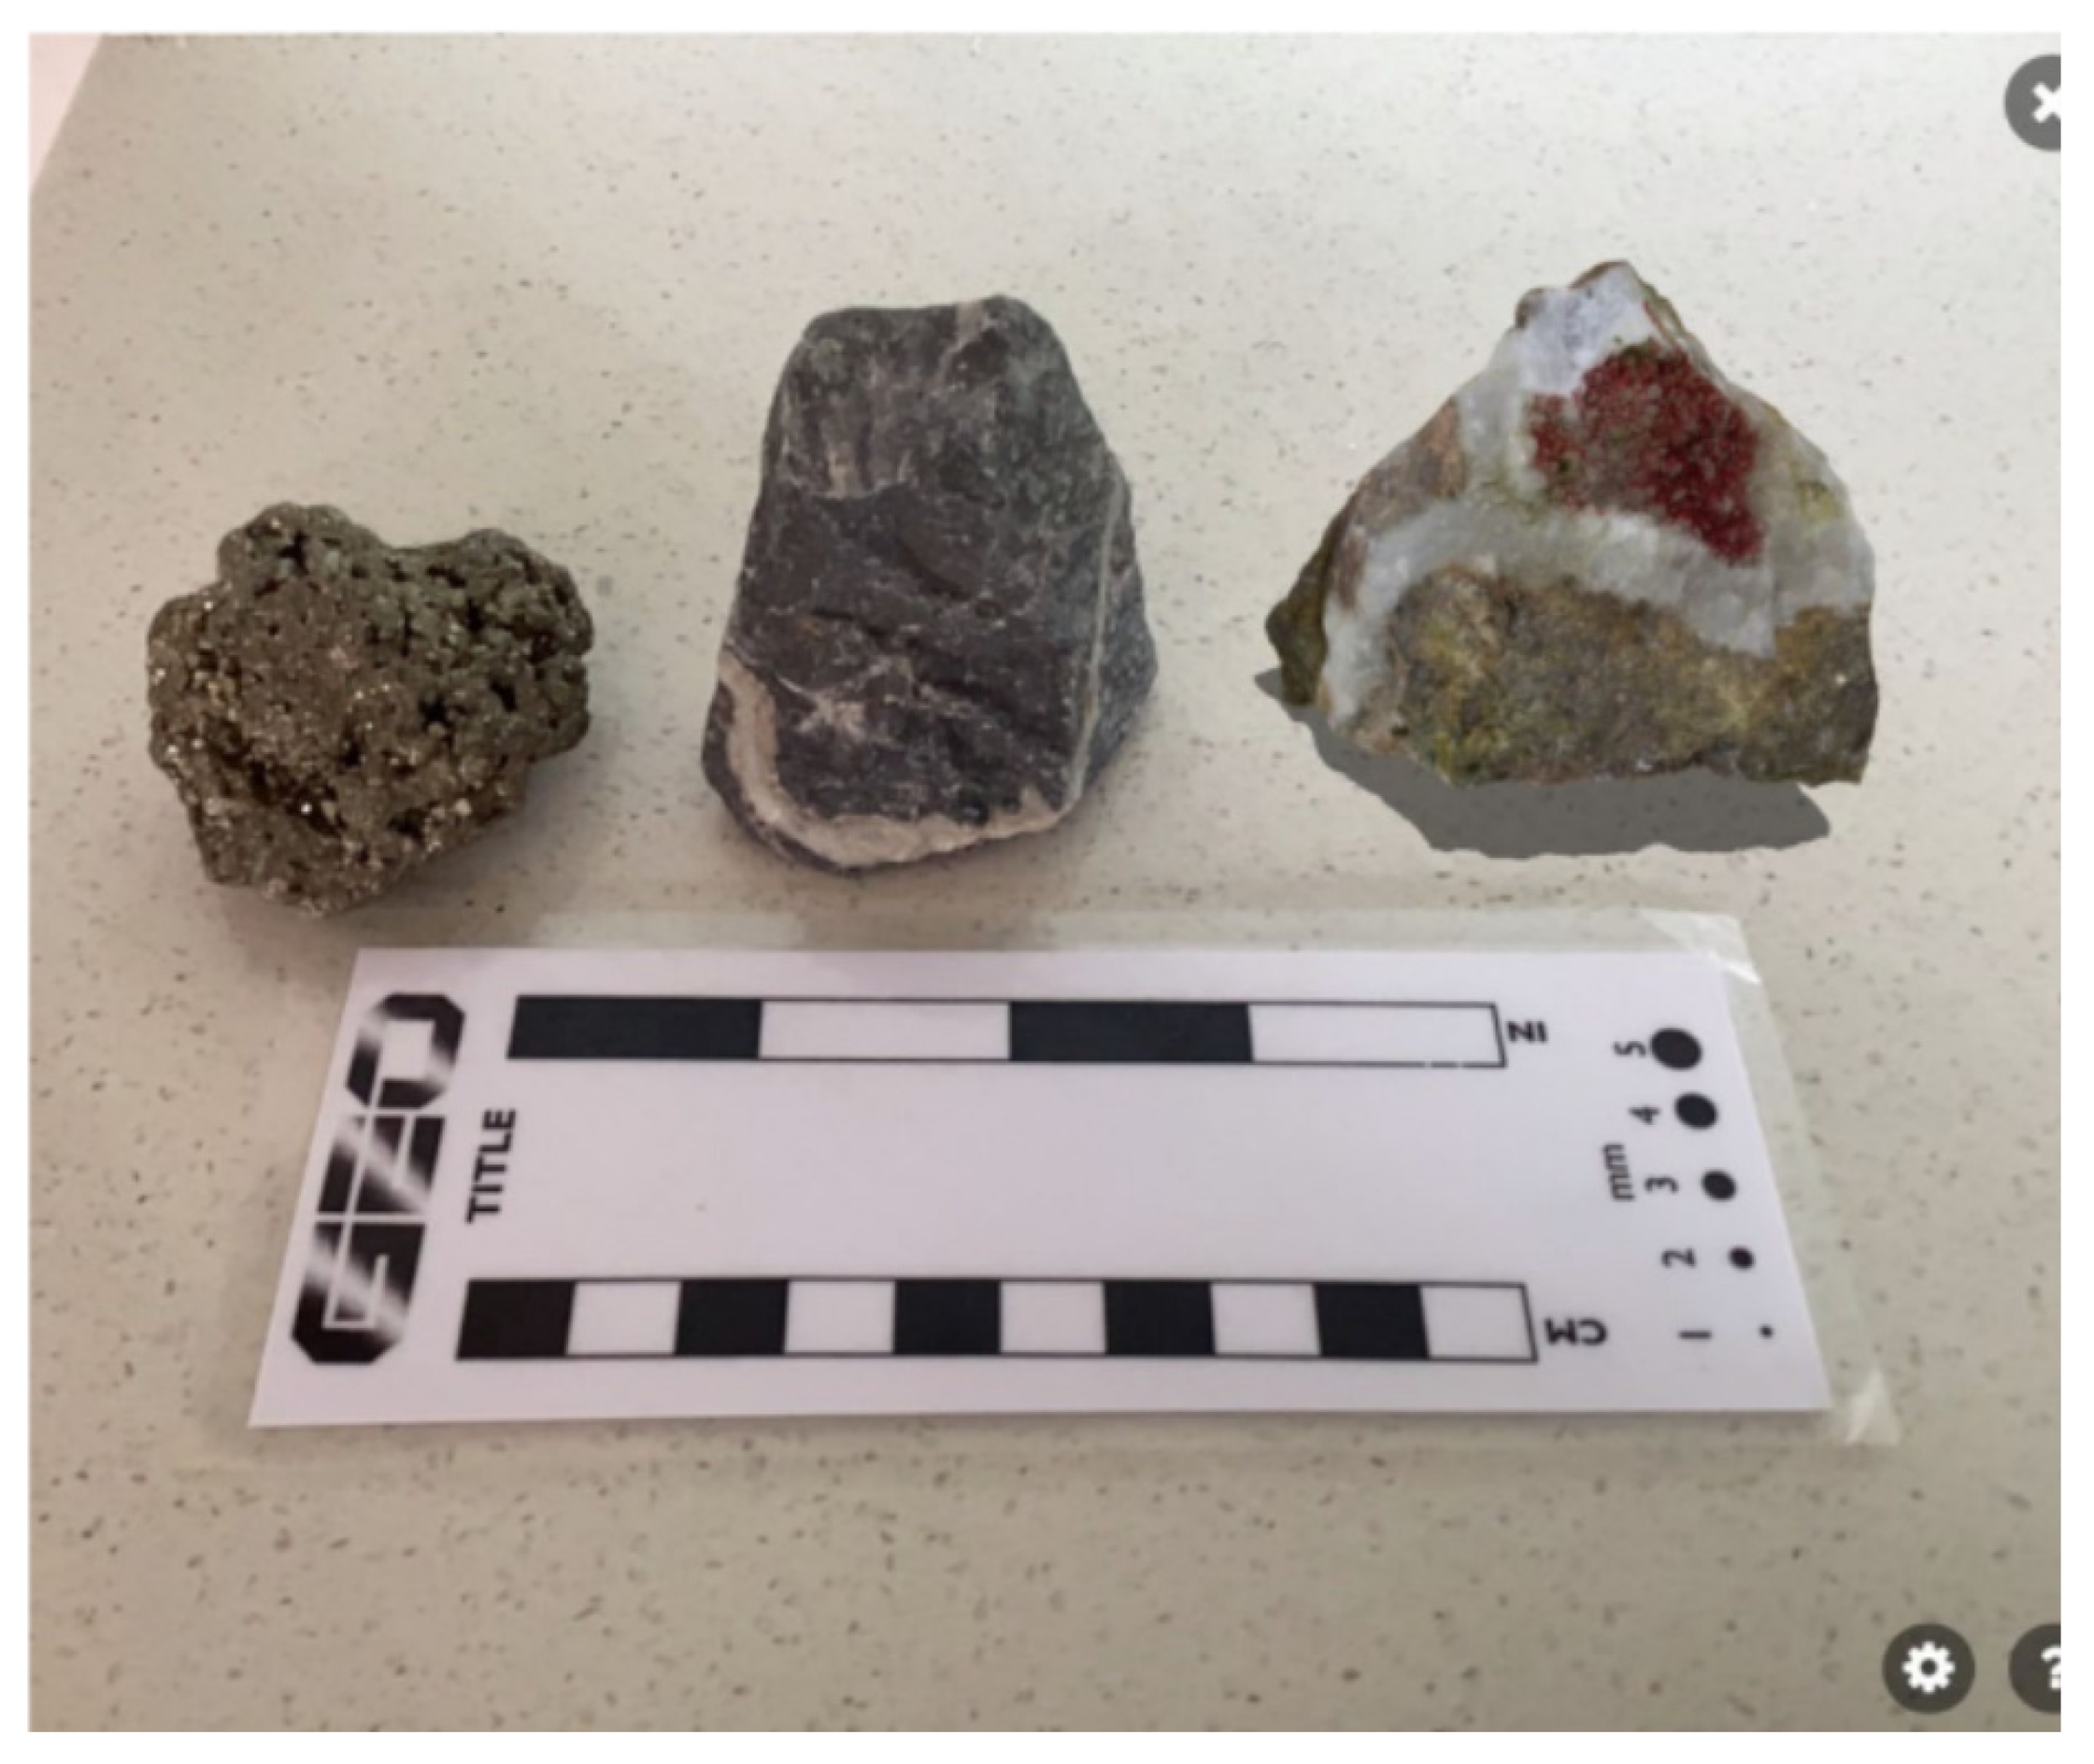
32]. Subsequently, 3D modeling was performed through the capturing reality software program Reality Capture version 1.0.3, using digital images of specimens obtained with a Canon EOS 200D fitted with an EF-S 18–55 mm lens (Figure 4a). The camera was fixed on a tripod and photographed on a 26 cm diameter turntable, with a plain background and printed base to assist with the 3D reconstruction (Figure 4a). Studio lighting was used to illuminate the specimen to keep the lighting consistent and eliminate shadows.
Specimens were photographed in two halves to capture the underside of the specimen placed on the turntable: later, the two halves were digitally stitched together for a full 360 reconstruction. The specimens were photographed at two levels per rotation: sub-horizontal to the base and a high-oblique view.
The number of photographs varied between the sizes of the minerals and details of each specimen; between 36 to 48 images per rotation were generated. Images were captured at 10° intervals to ensure sufficient overlap (over 60%) to allow the Reality Capture software to perform a seamless alignment (Figure 4b).
The images were captured as a JPEG file and transferred onto a PC to resize the images to a resolution of 1620 × 1080 pixels. Decreasing the image resolution was conducted as a pre-processing set, as the maximum upload file size on Sketchfab is 200 mb on a pro account. A preliminary check of the image quality was conducted before loading the images onto the software for alignment, where the software finds common points on the images, matches them together, and determines the camera position of each photograph. Each rotation was aligned separately to create a dense point cloud, which was then filtered to remove the base and exported as a depth and mask layer (Figure 4c,d). With the addition of the depth and mask, images from both rotations were reintroduced back into the software to be aligned and texturized into the 3D model (Figure 4e,f).
The models were exported in an Autodesk filmbox (fbx.) file format to be uploaded onto Sketchfab. Sketchfab was chosen as the 3D viewer platform as it is the largest 3D content sharing platform [
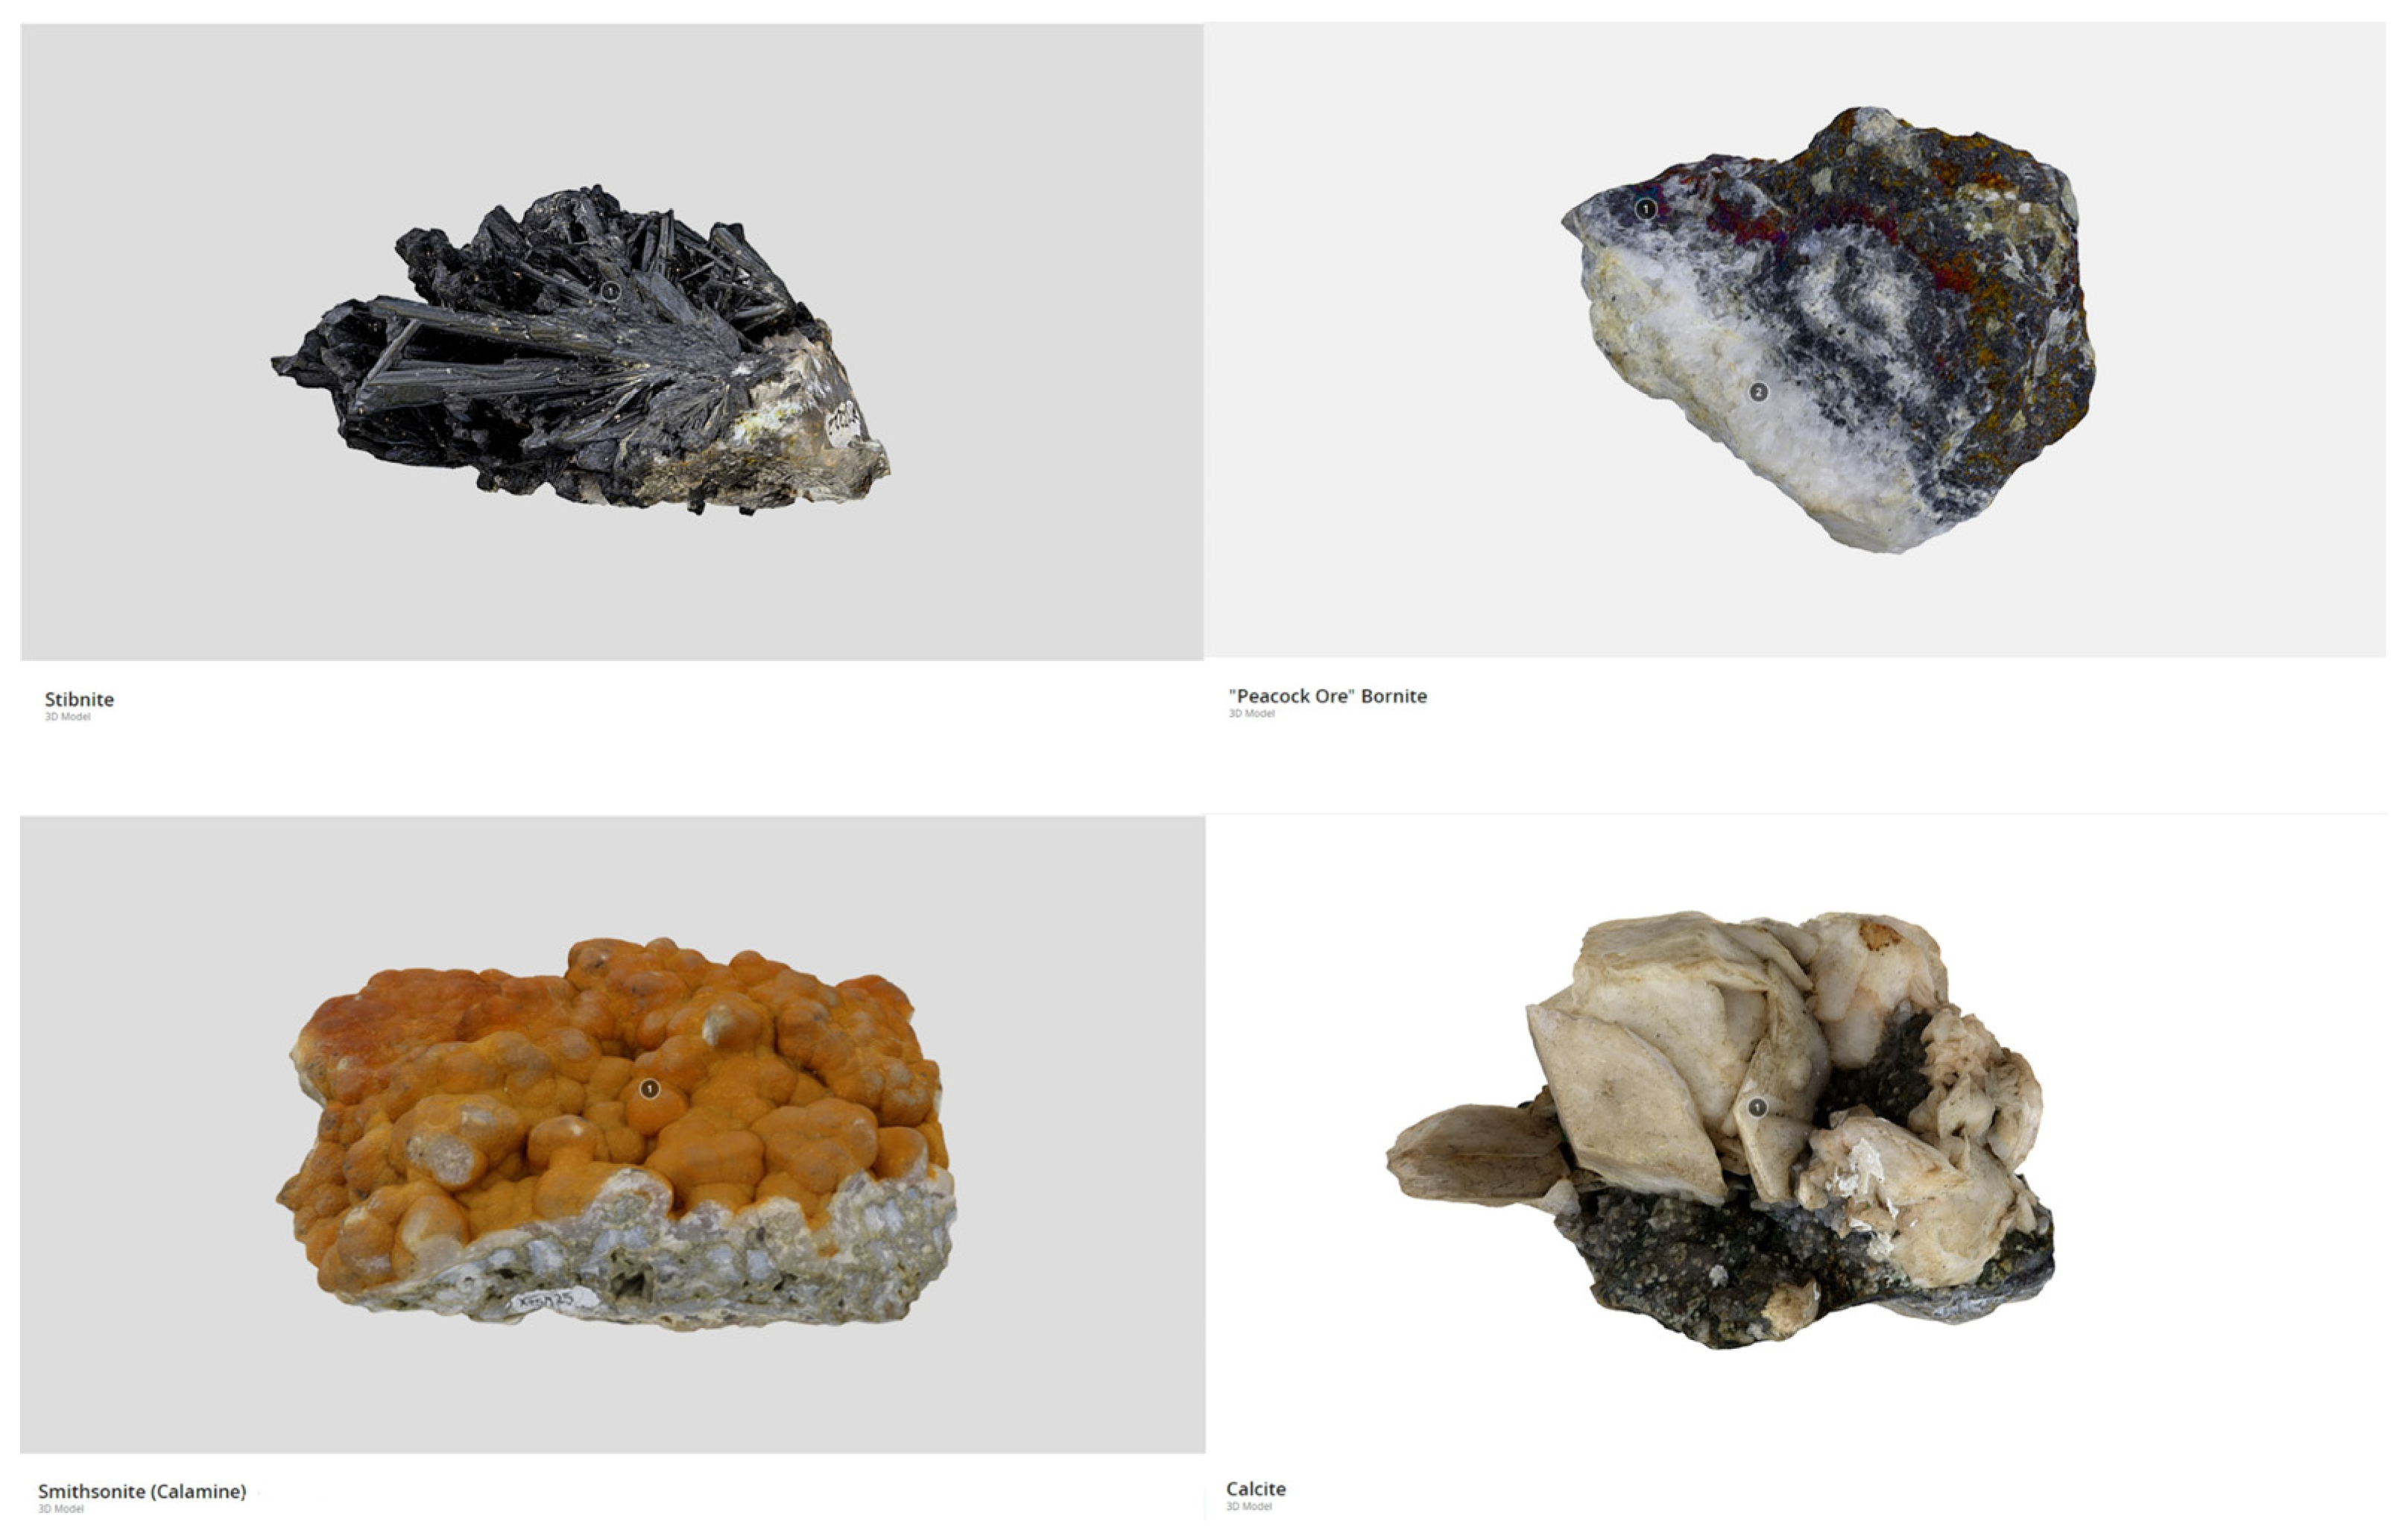
33]. Using the 3D editor in the Sketchfab platform, annotations were added to the models regarding the chemical composition, mode of occurrence, distinguishing features, and other relevant information pertaining to each specimen (Figure 4g). Minor enhancements were made to the visual appearance of the models in the 3D editor to enhance the color and increase metallic textures without compromising the integrity of the model. Furthermore, metadata on the sample’s locality and unique identifier (XTS/TS) were added to the description.
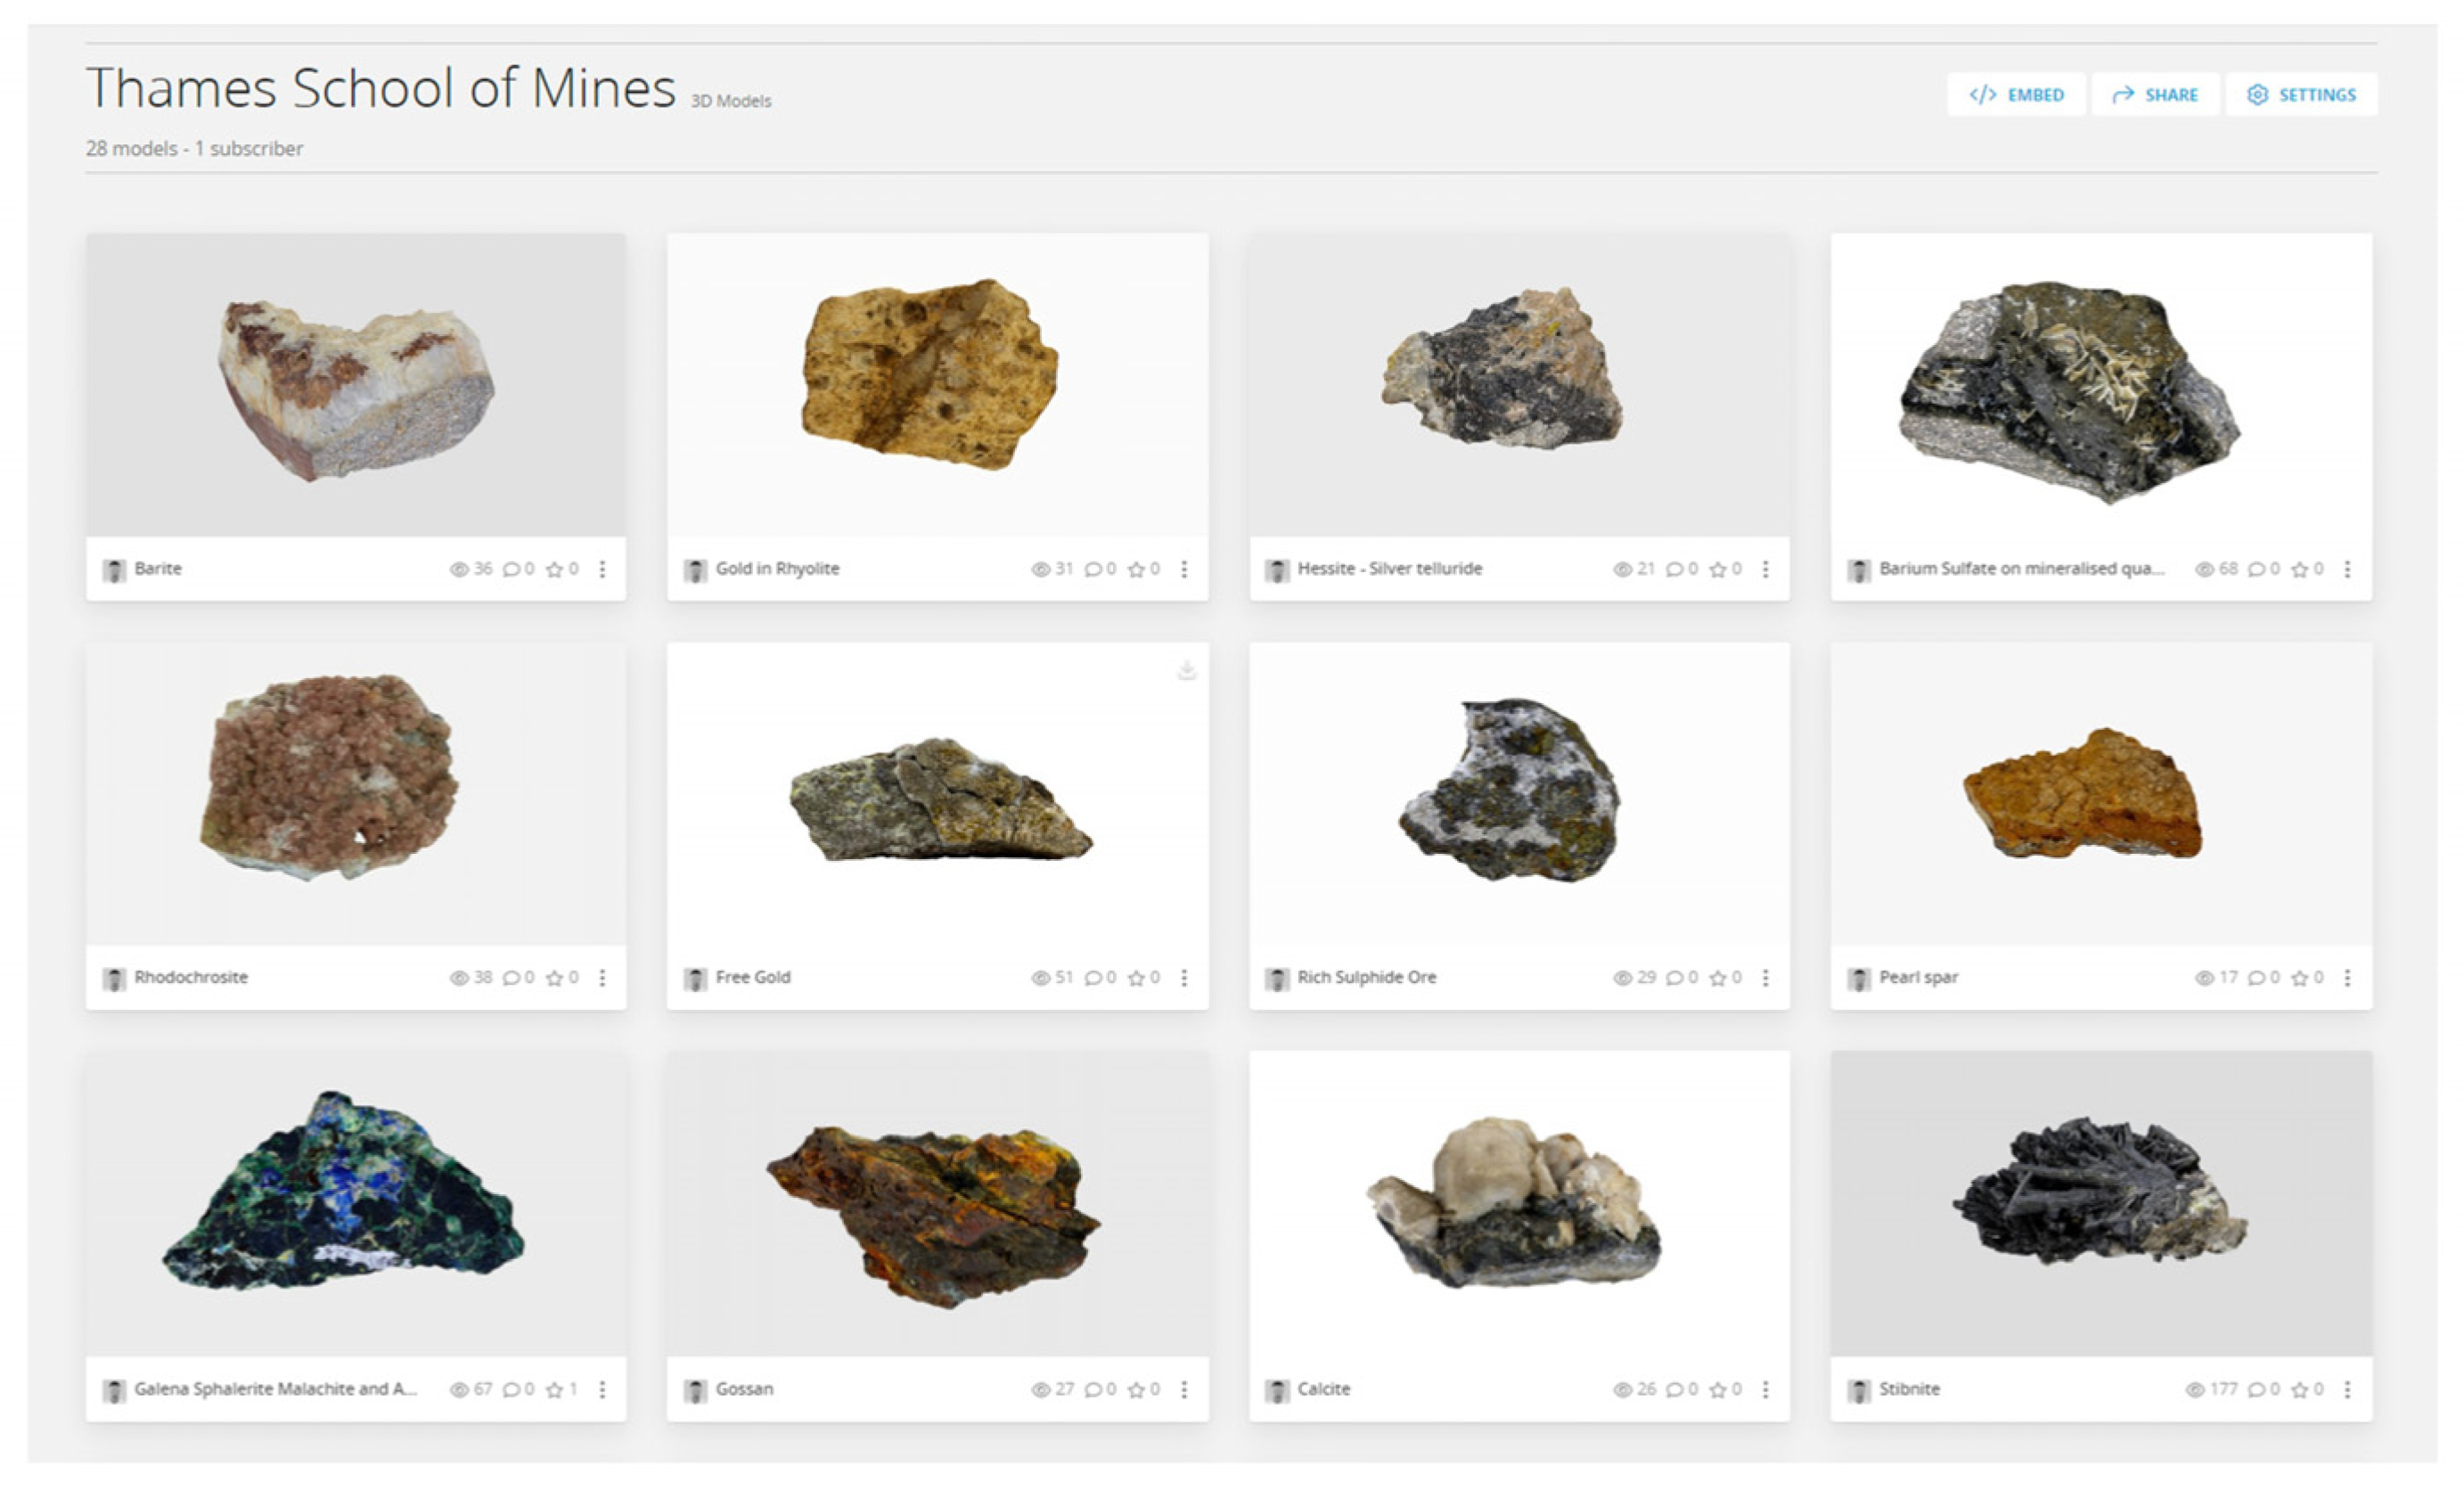
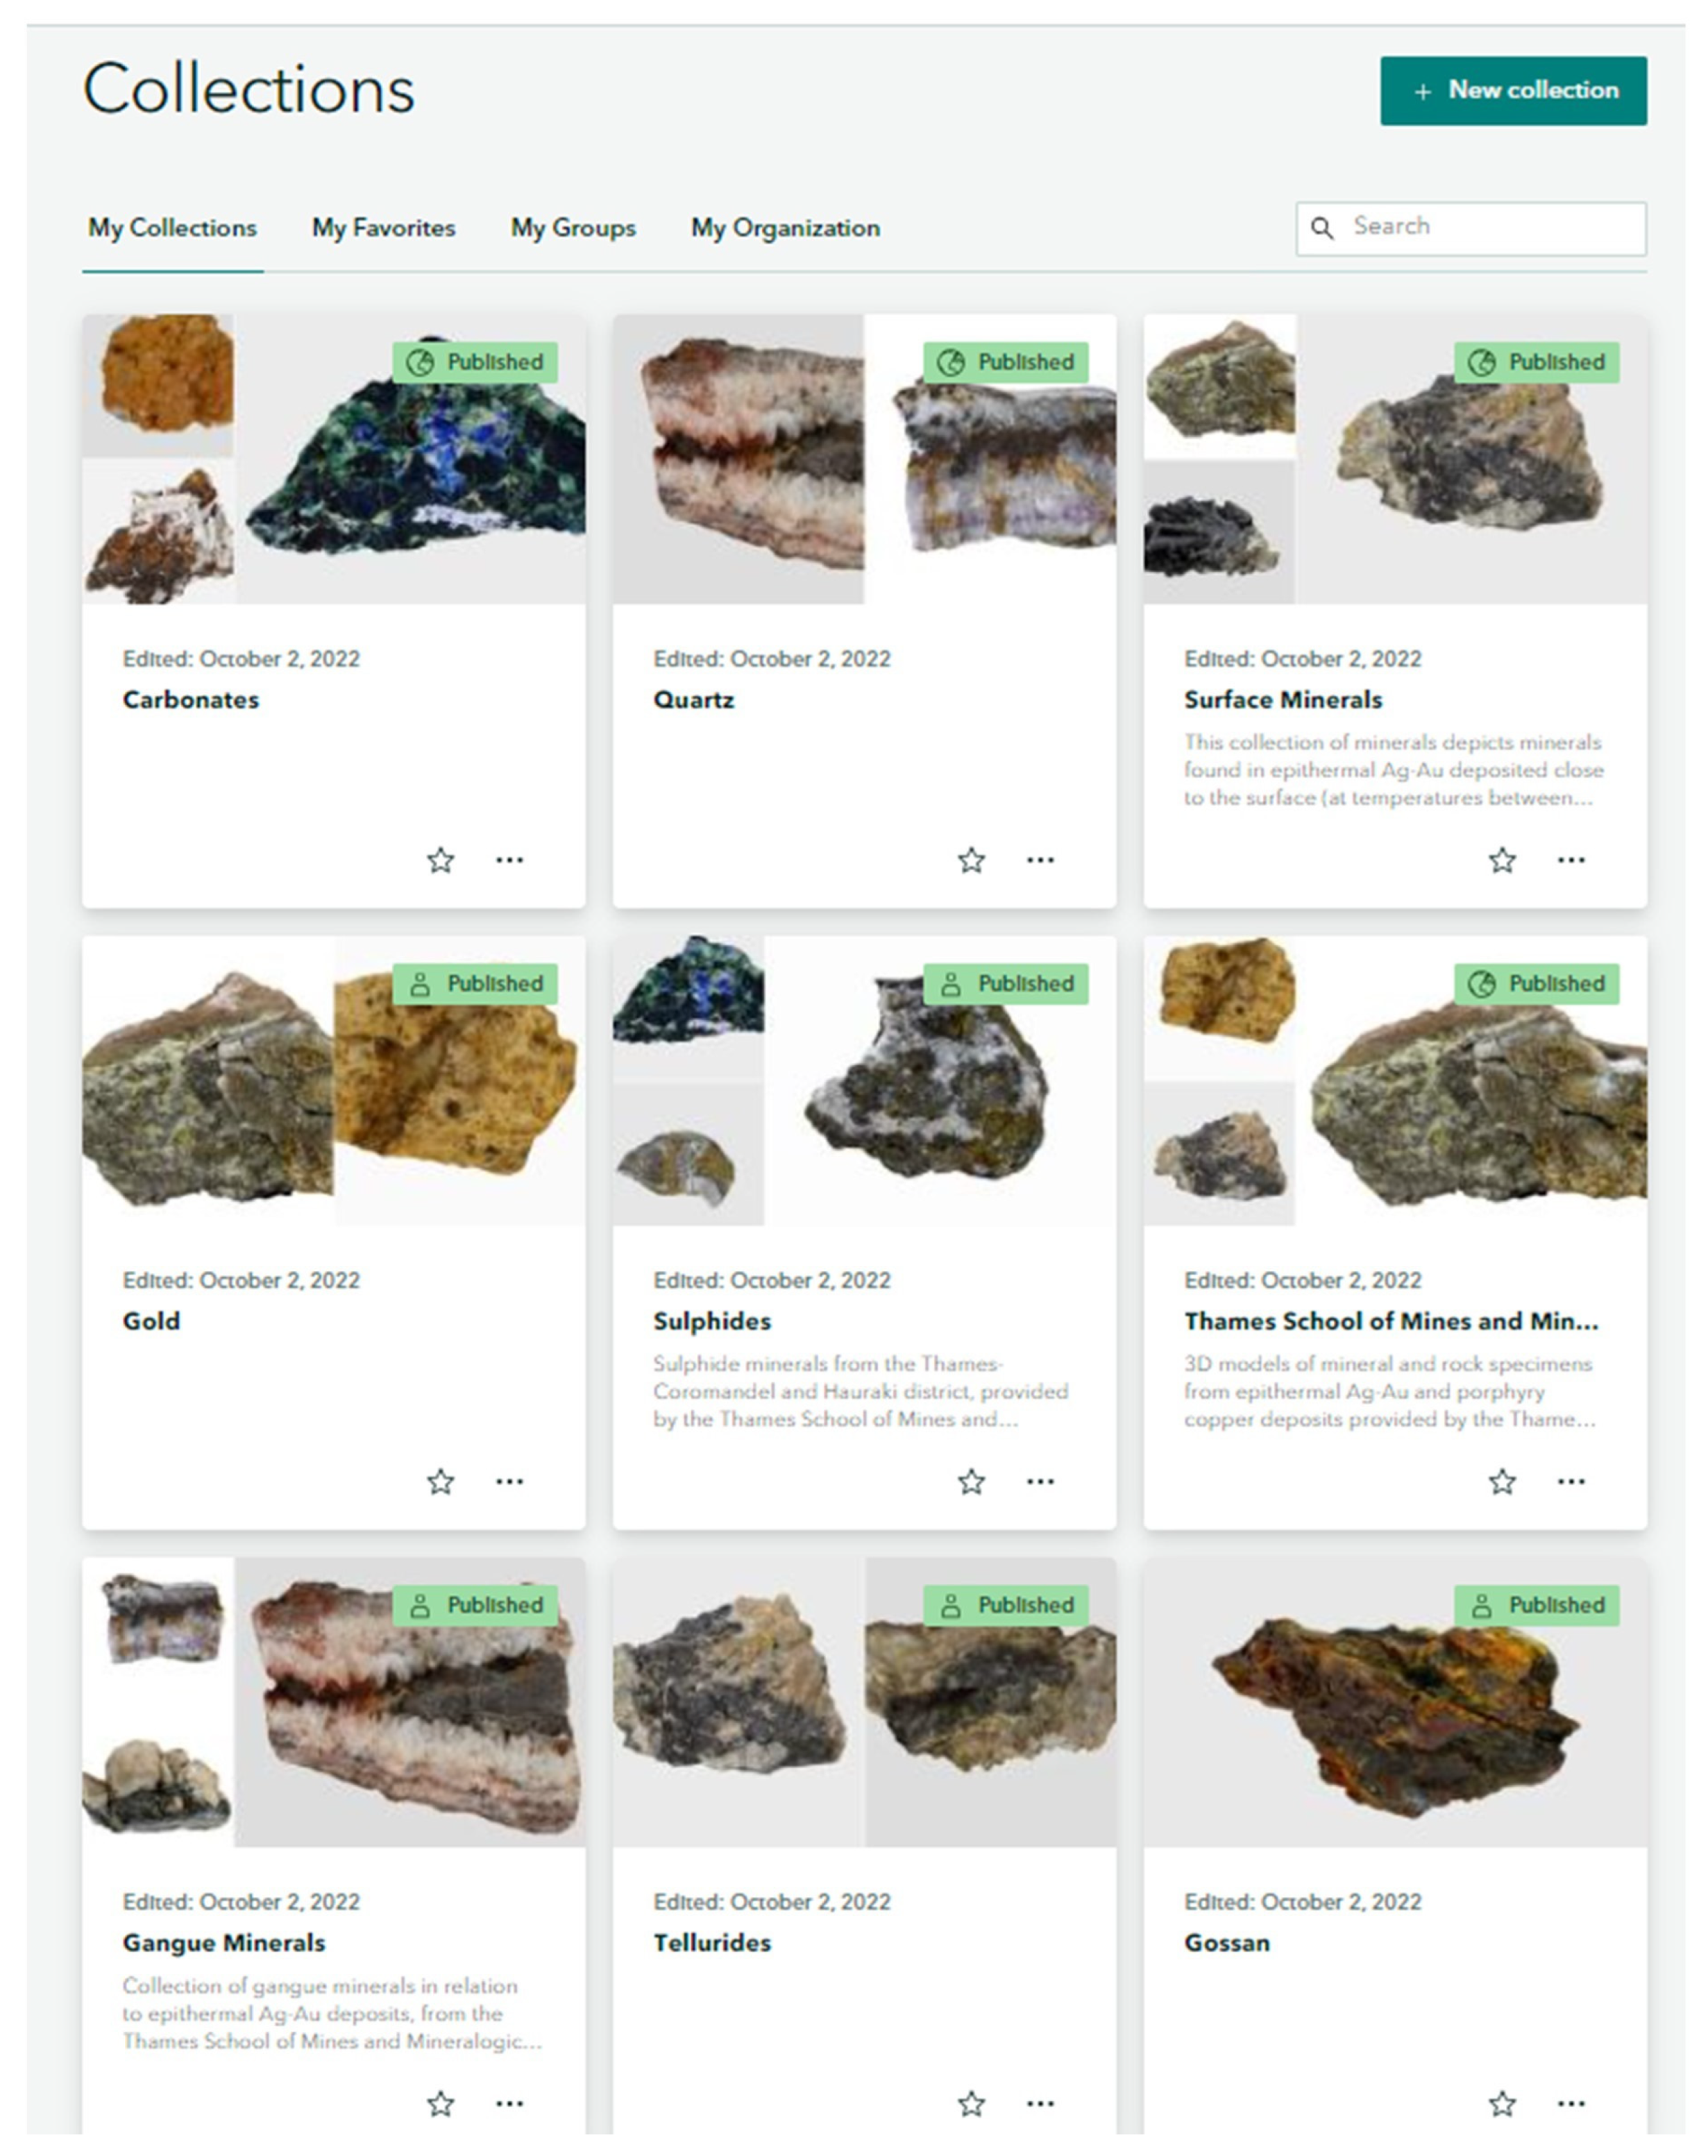
The models from the Sketchfab platform were embedded into another format of Storymap, collections (https://skfb.ly/oICPW, accessed on 19 January 2021), as this display provided a suitable repository for the TSM collection of rock and minerals.

4.2. Web Map Layers

Web map applications were used to enrich the story to give the users a sense of spatial distribution and place. The geovisualization and presentation of the data aimed to disseminate the relevant information in an engaging way, as well as the means to combine scientific information on the geological formation of the goldfields with existing mining and cultural heritage. The web maps were used to guide the narrative and connect the underlying geology to the gold history in the Thames Goldfield through geolocating places.
Table 1 features the data sources and the map service they provided. Geospatial data were collected from open-source domains that had been georeferenced and projected by the provided source (Table 1). All the layers used the projected coordinate system New Zealand Transverse Mercator (NZGD 2000) and clipped to the extent of the Thames-Coromandel and Hauraki Districts were derived from the territorial boundaries 2020 dataset from Stats NZ. Feature layers were created in ArcGIS Pro version 2.8.3, then shared to ArcGIS online (AGOL) to be introduced into the storymap application.
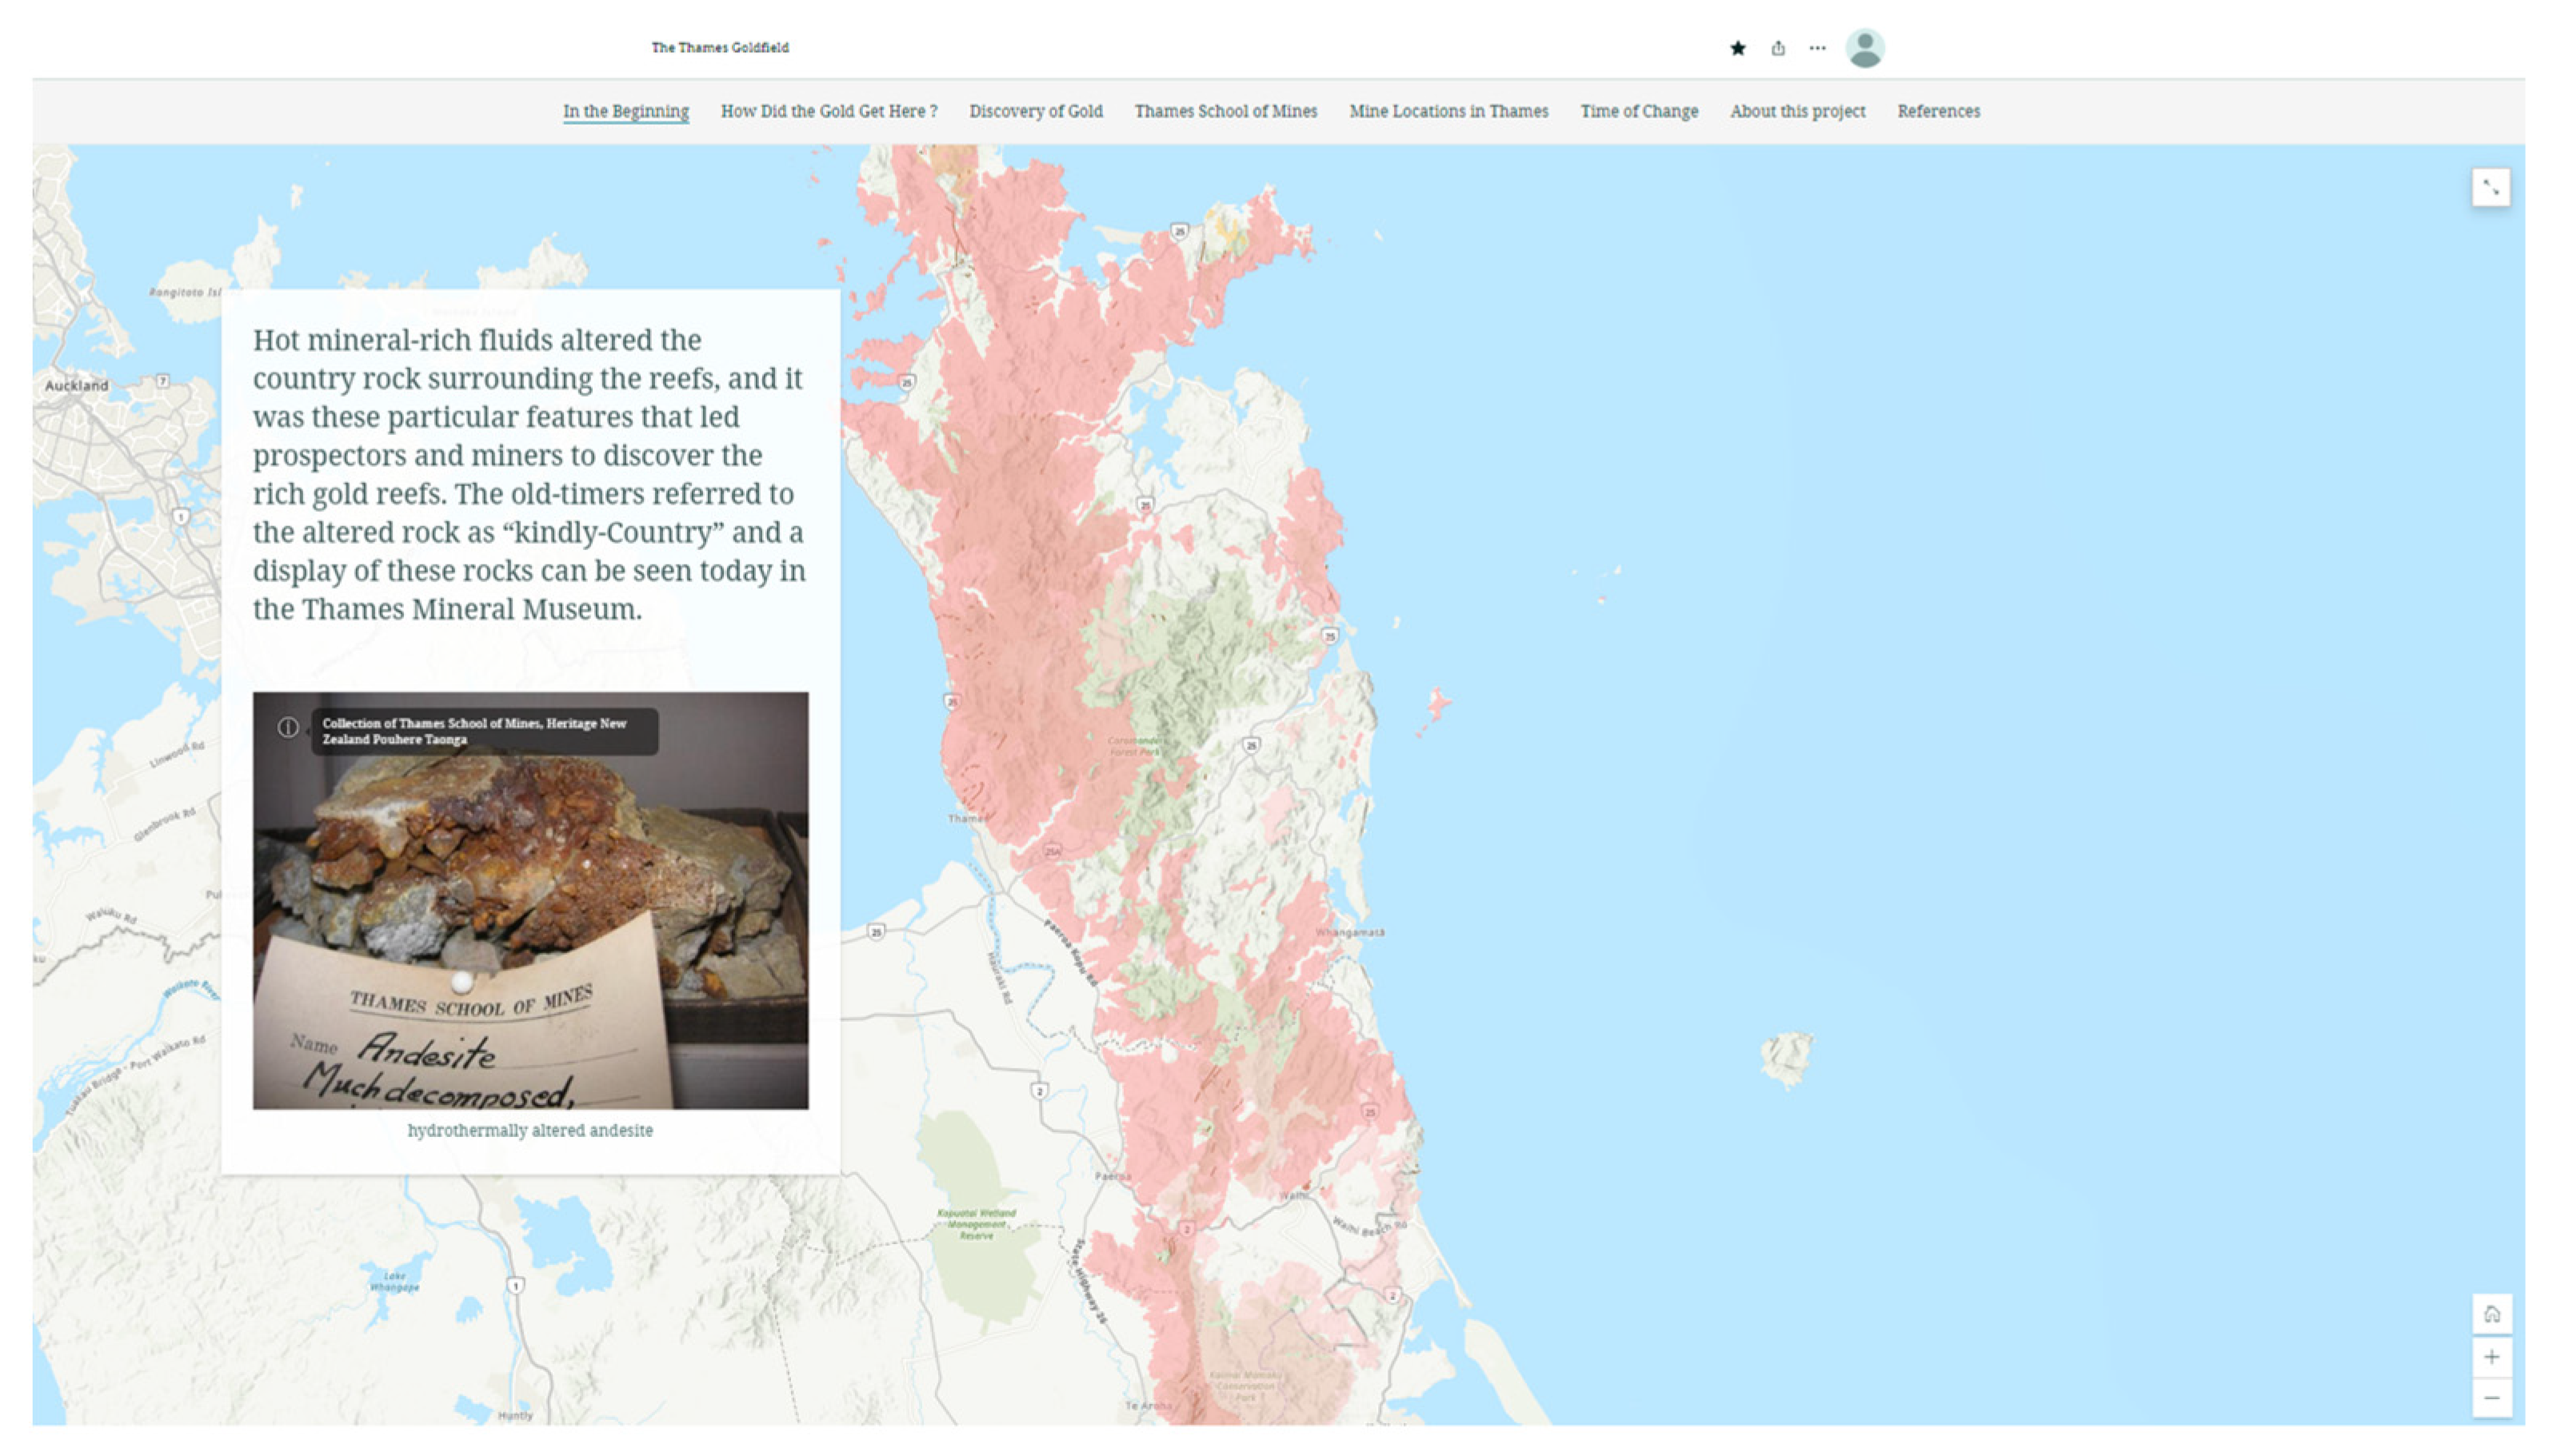
Geological web maps were used to show the users the different geological units in the Thames-Coromandel and Hauraki Districts. A geological map containing all the features (Table 1) was uploaded to AGOL, which was used as a master copy to create separate maps of the different geological and lithological groups for the storymap. The symbology of the geological map used the default provided by the Institute of Geological and Nuclear Sciences.
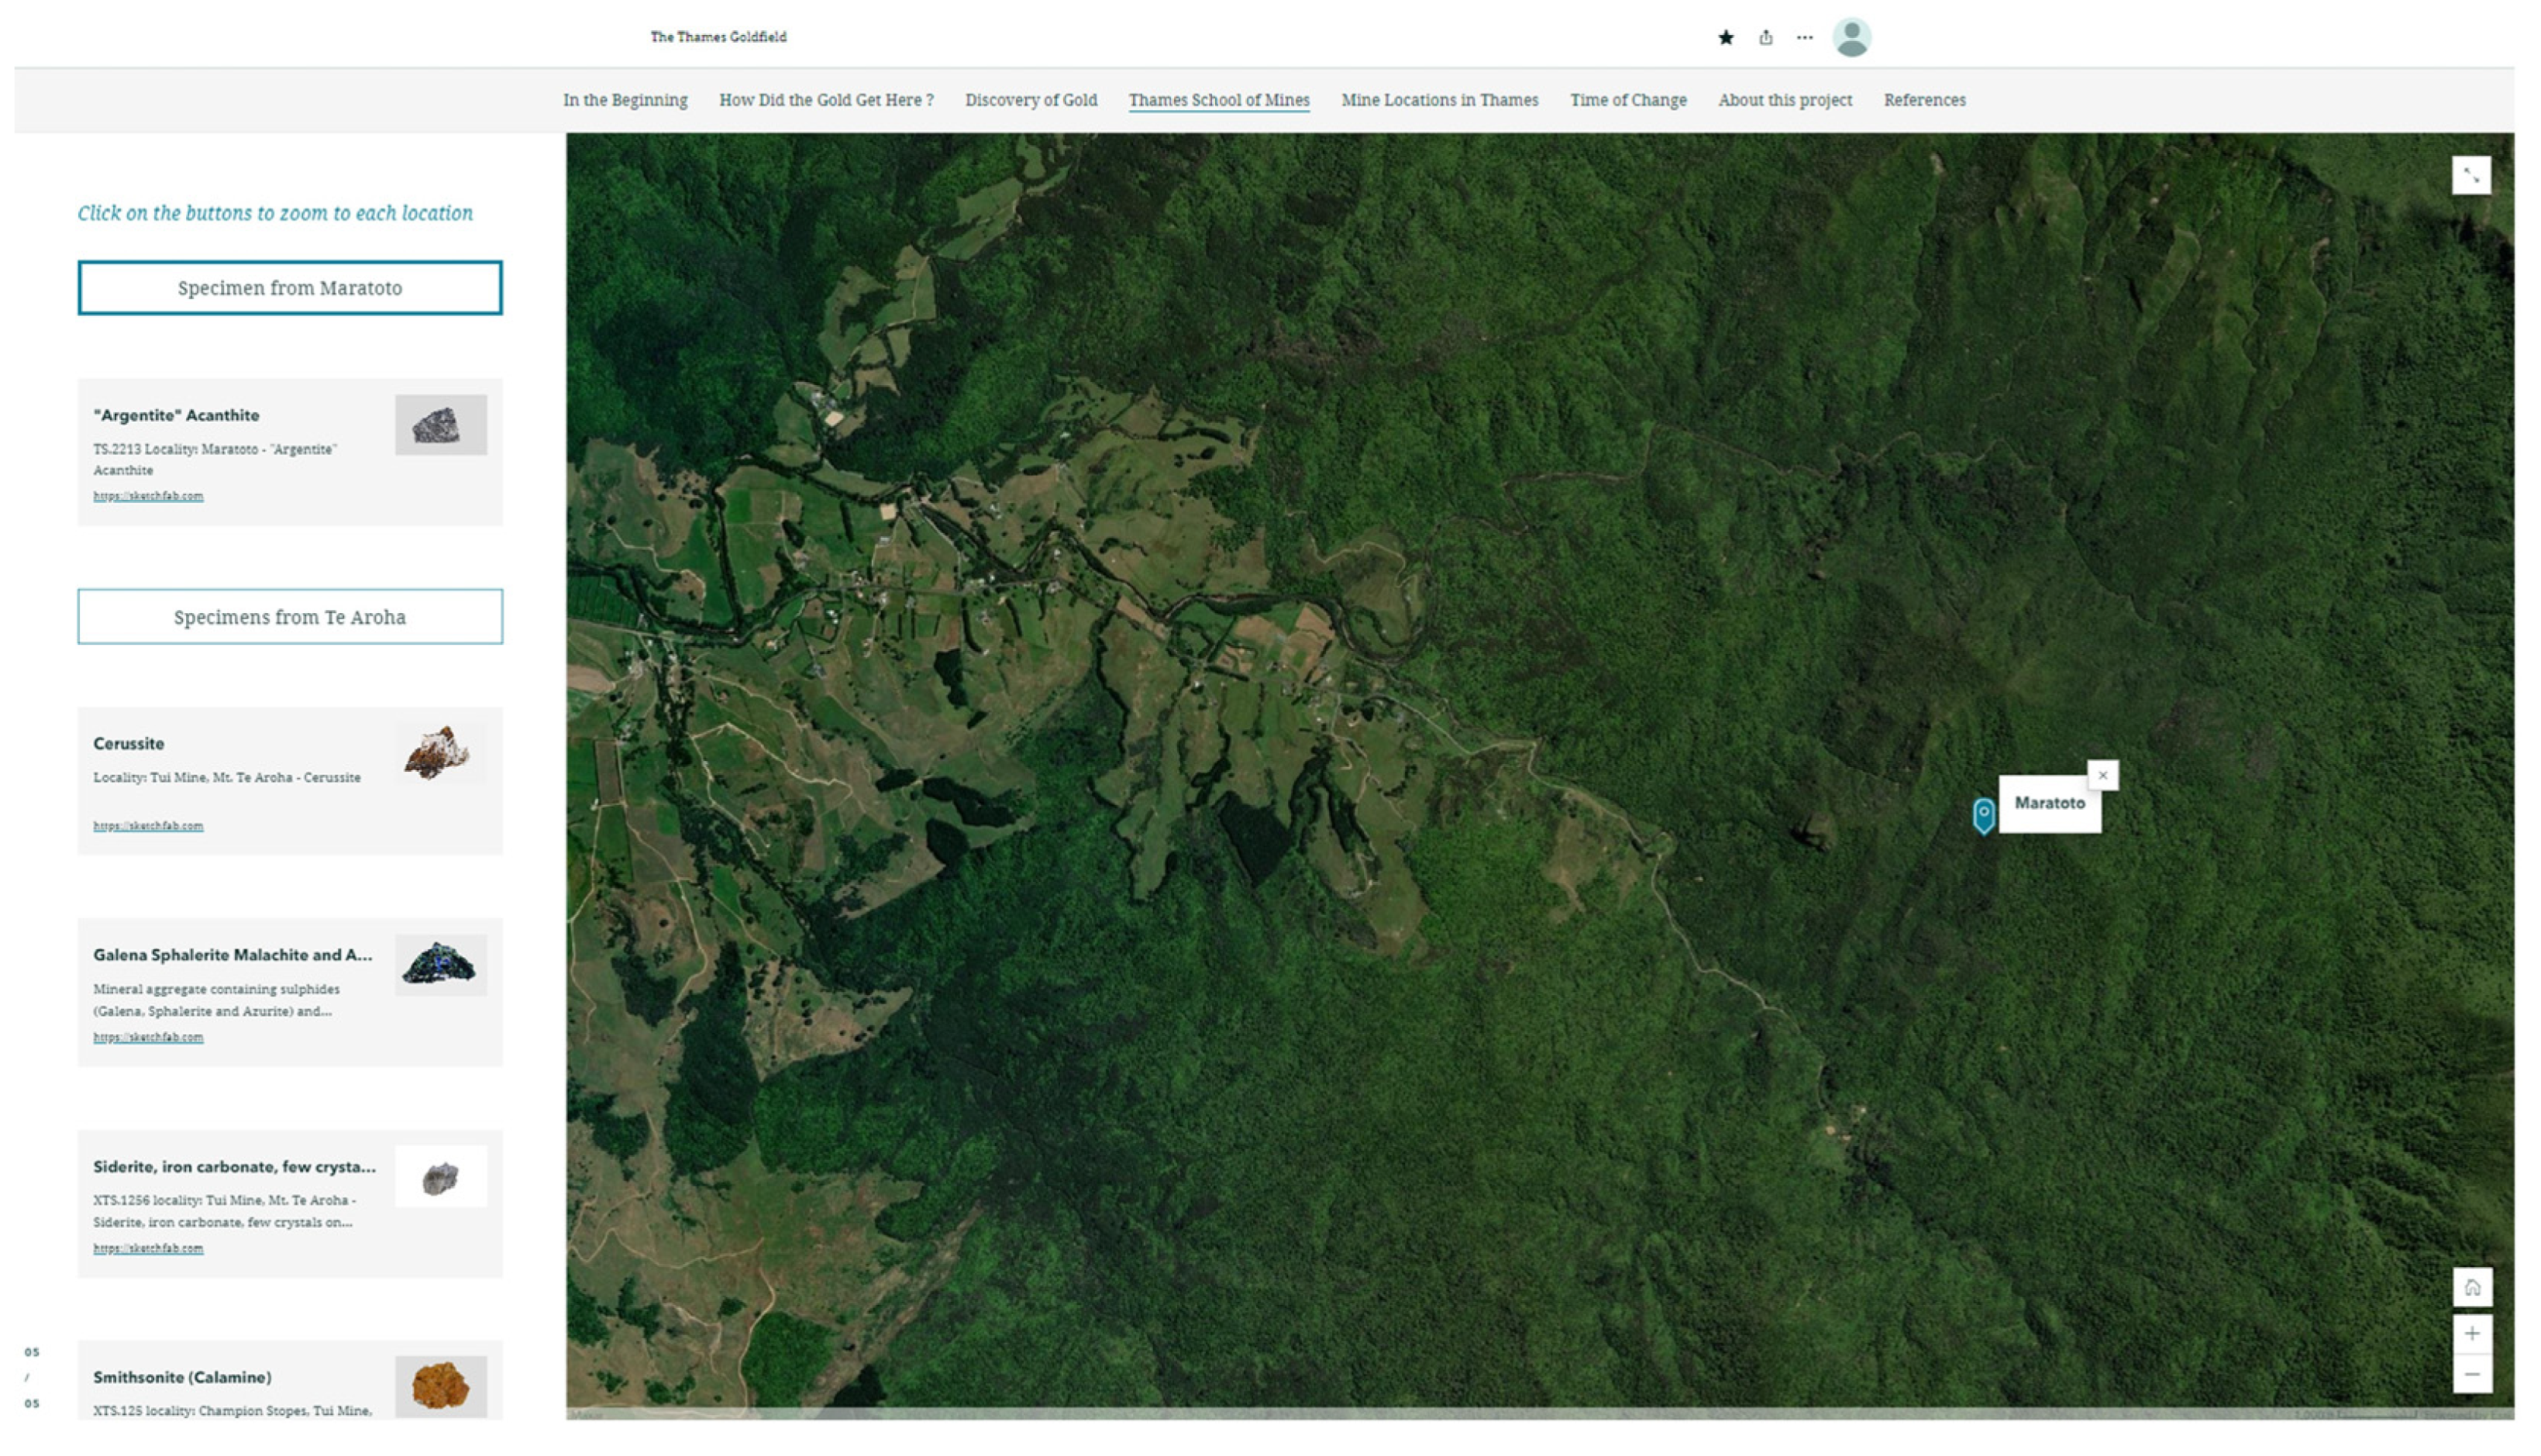
To gather the spatial locations for the first gold sightings and specimen localities, we used the Google web service, My Maps, to search the location and export as CSV file. Location points for the first gold sightings were derived from the literature and the specimen location from the display index card associated with the specimen. By using a CSV additional location could be added via GPS coordinates that were not able to be located using the geocoded place search. The CSV was imported into ArcGIS Pro to convert the coordinates into points by employing the geoprocessing tool XY Table to points.
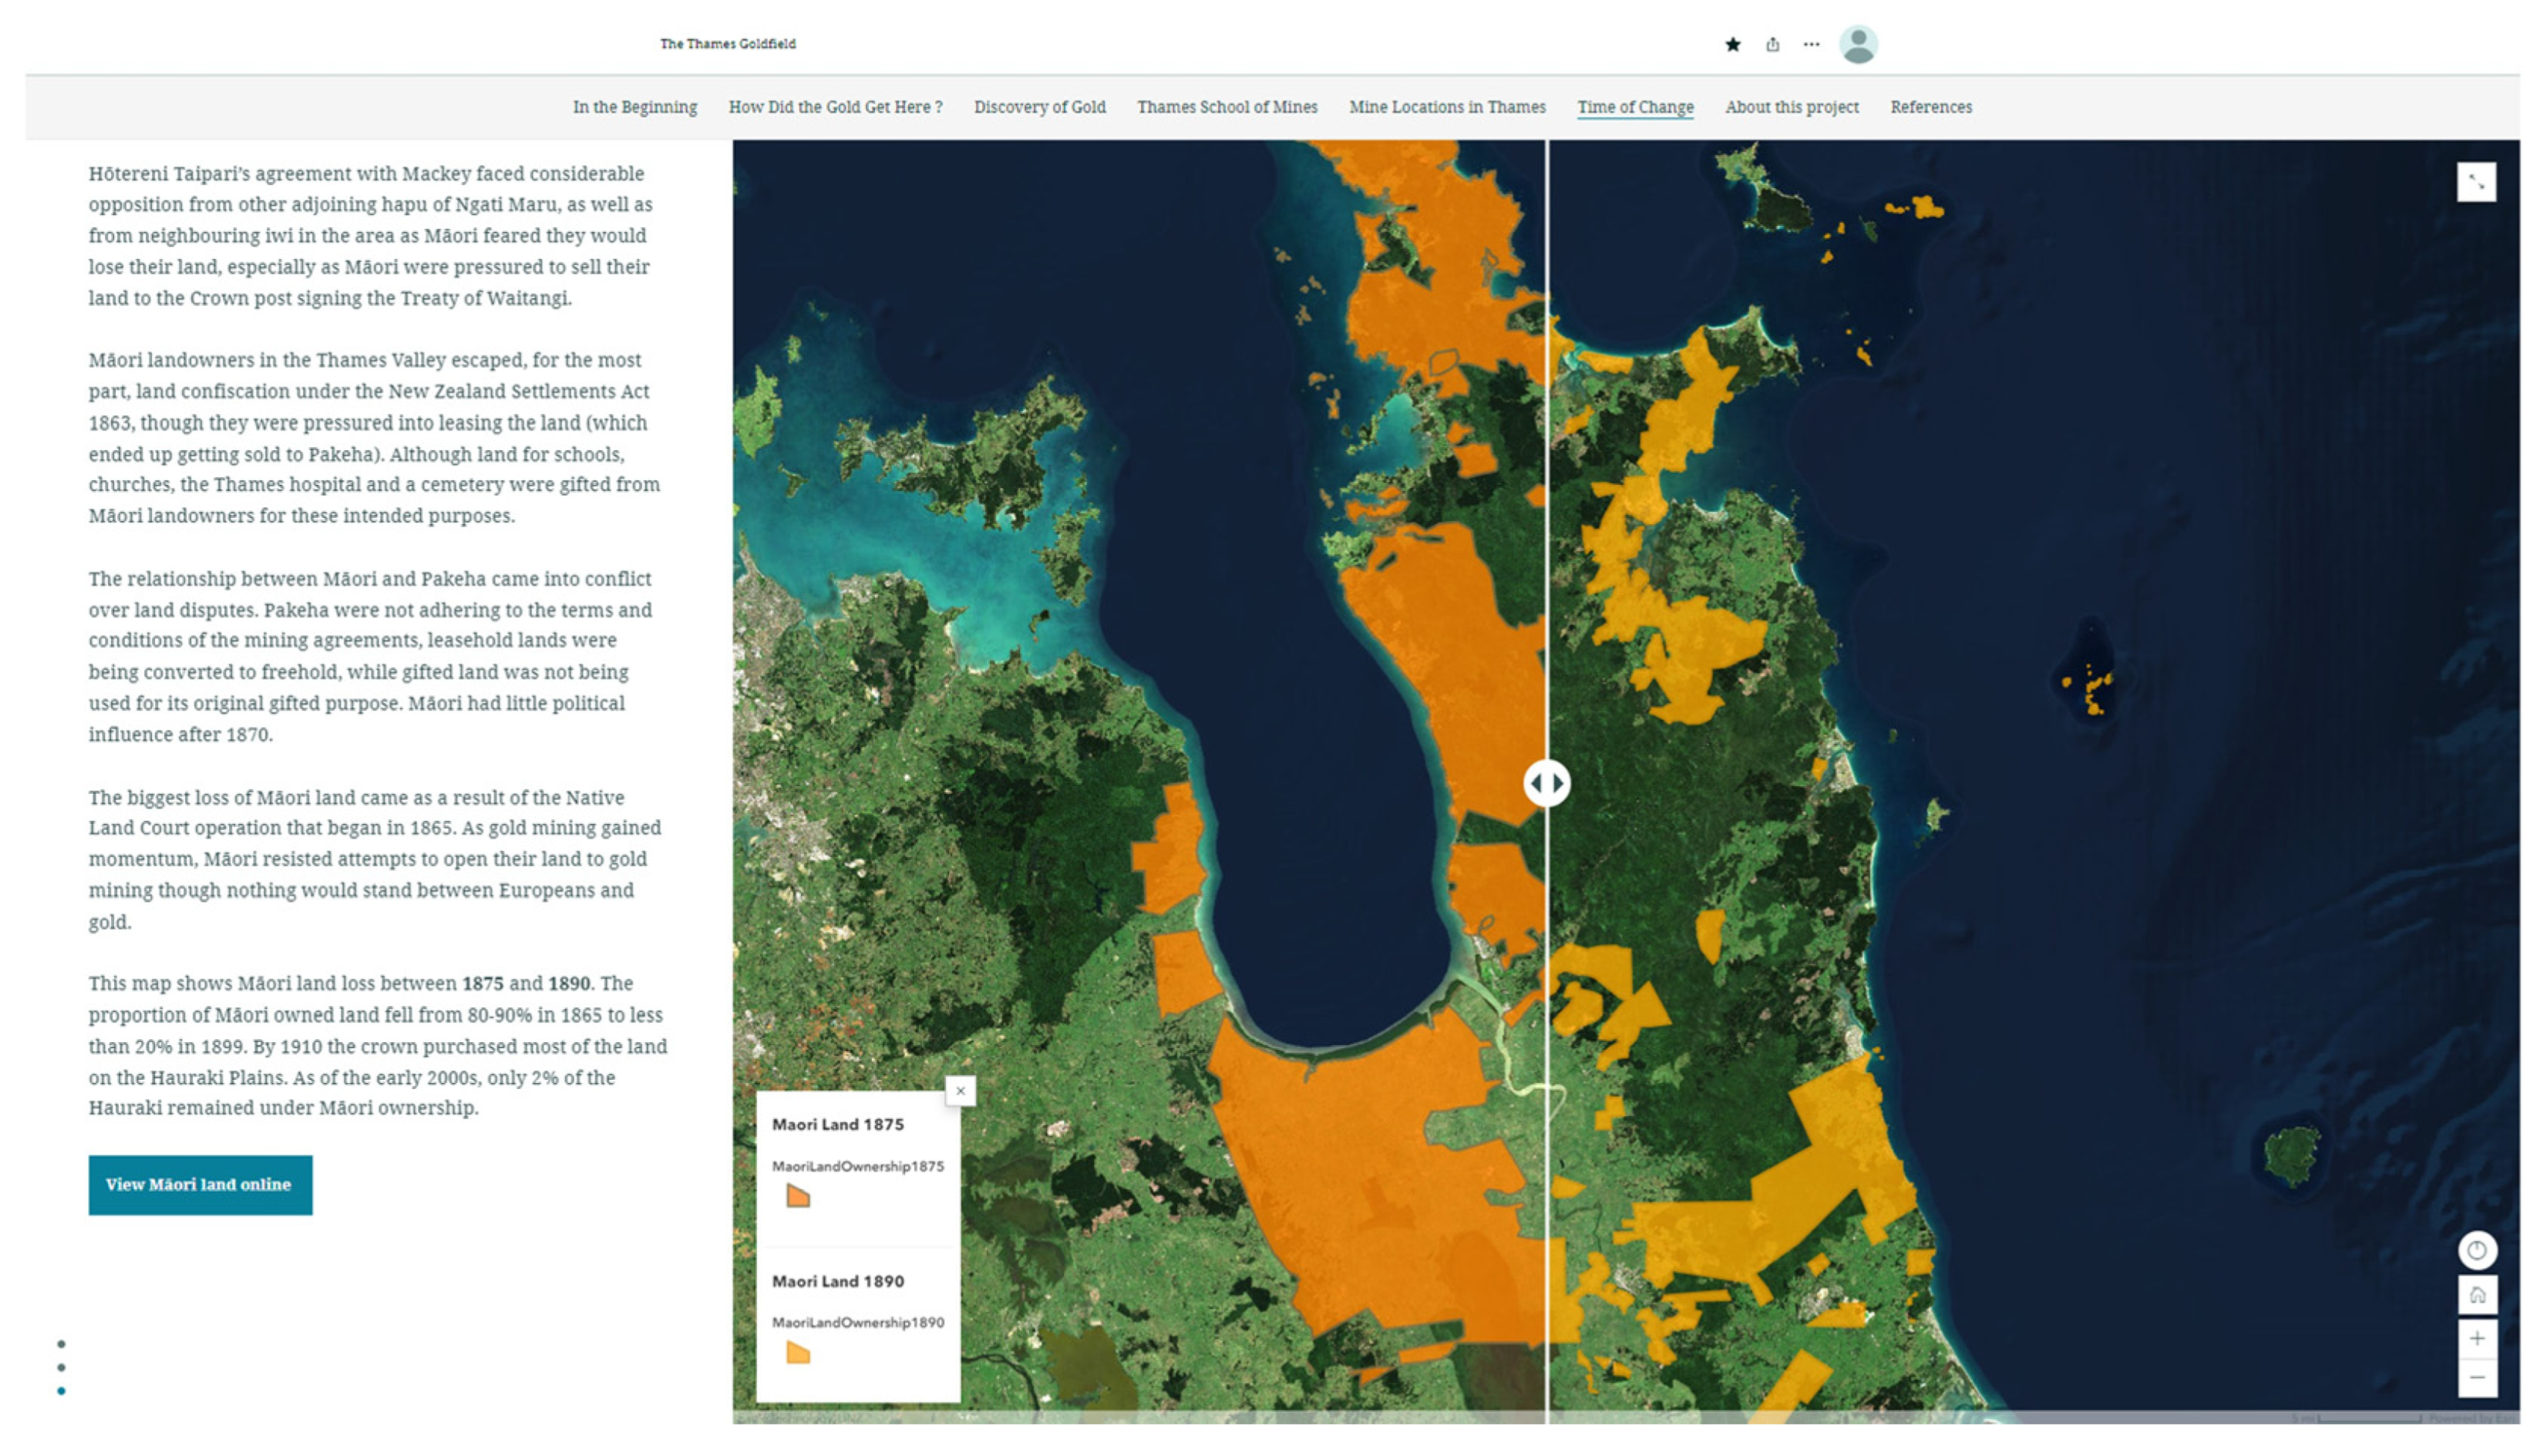
Analogue maps (.tiff, .jpeg) were required to be georeferenced through manual control points in ArcGIS Pro before uploading to AGOL as a tile web feature layer. Māori land ownership data for 1875 and 1890 were acquired from the Waitangi Tribunal Hauraki records (Table 1). The figures were exported as .png files and georeferenced to the map and digitized into a polygon shape format. Due to the limited data available the land cover is not entirely accurate but is used to emphasis the impacts of political and cultural changes in the district gold mining had attributed too.
Mining points were derived from the NZ Mine Points (Topo, 1; 50 k) dataset (Table 1) and filtered to select only the mine in the Thames vicinity that the minerals from the TSM came from (
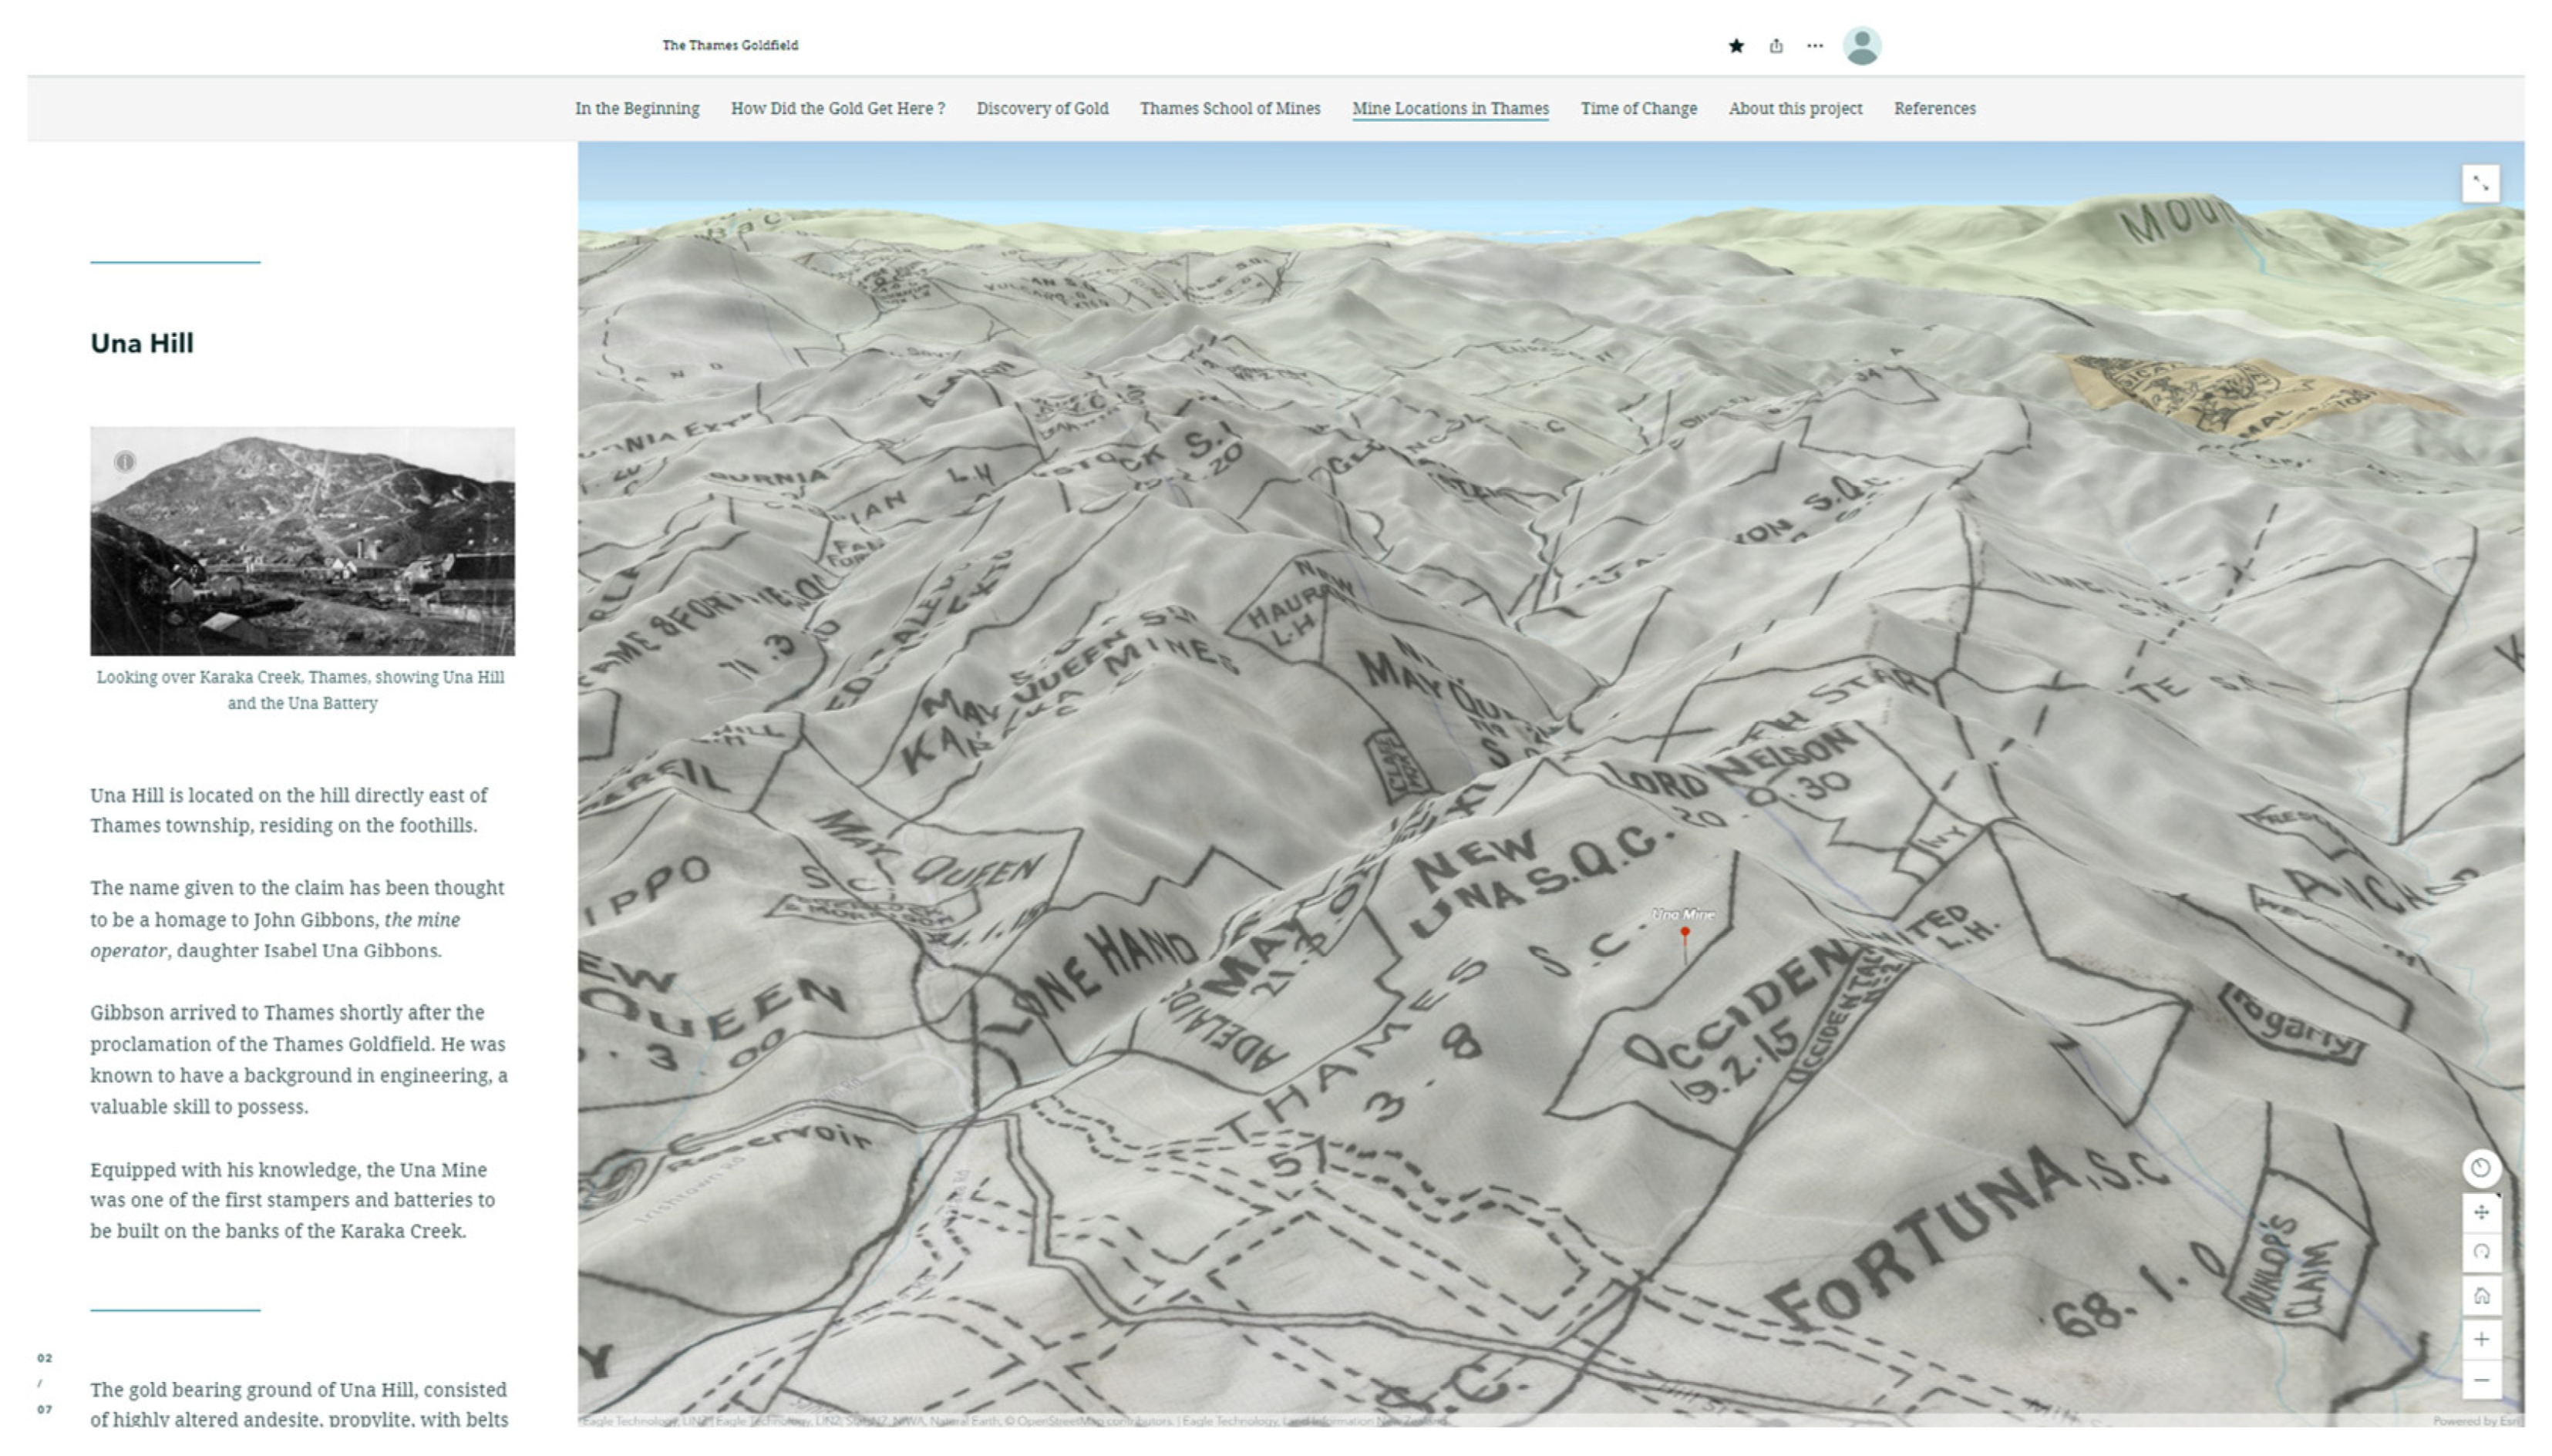
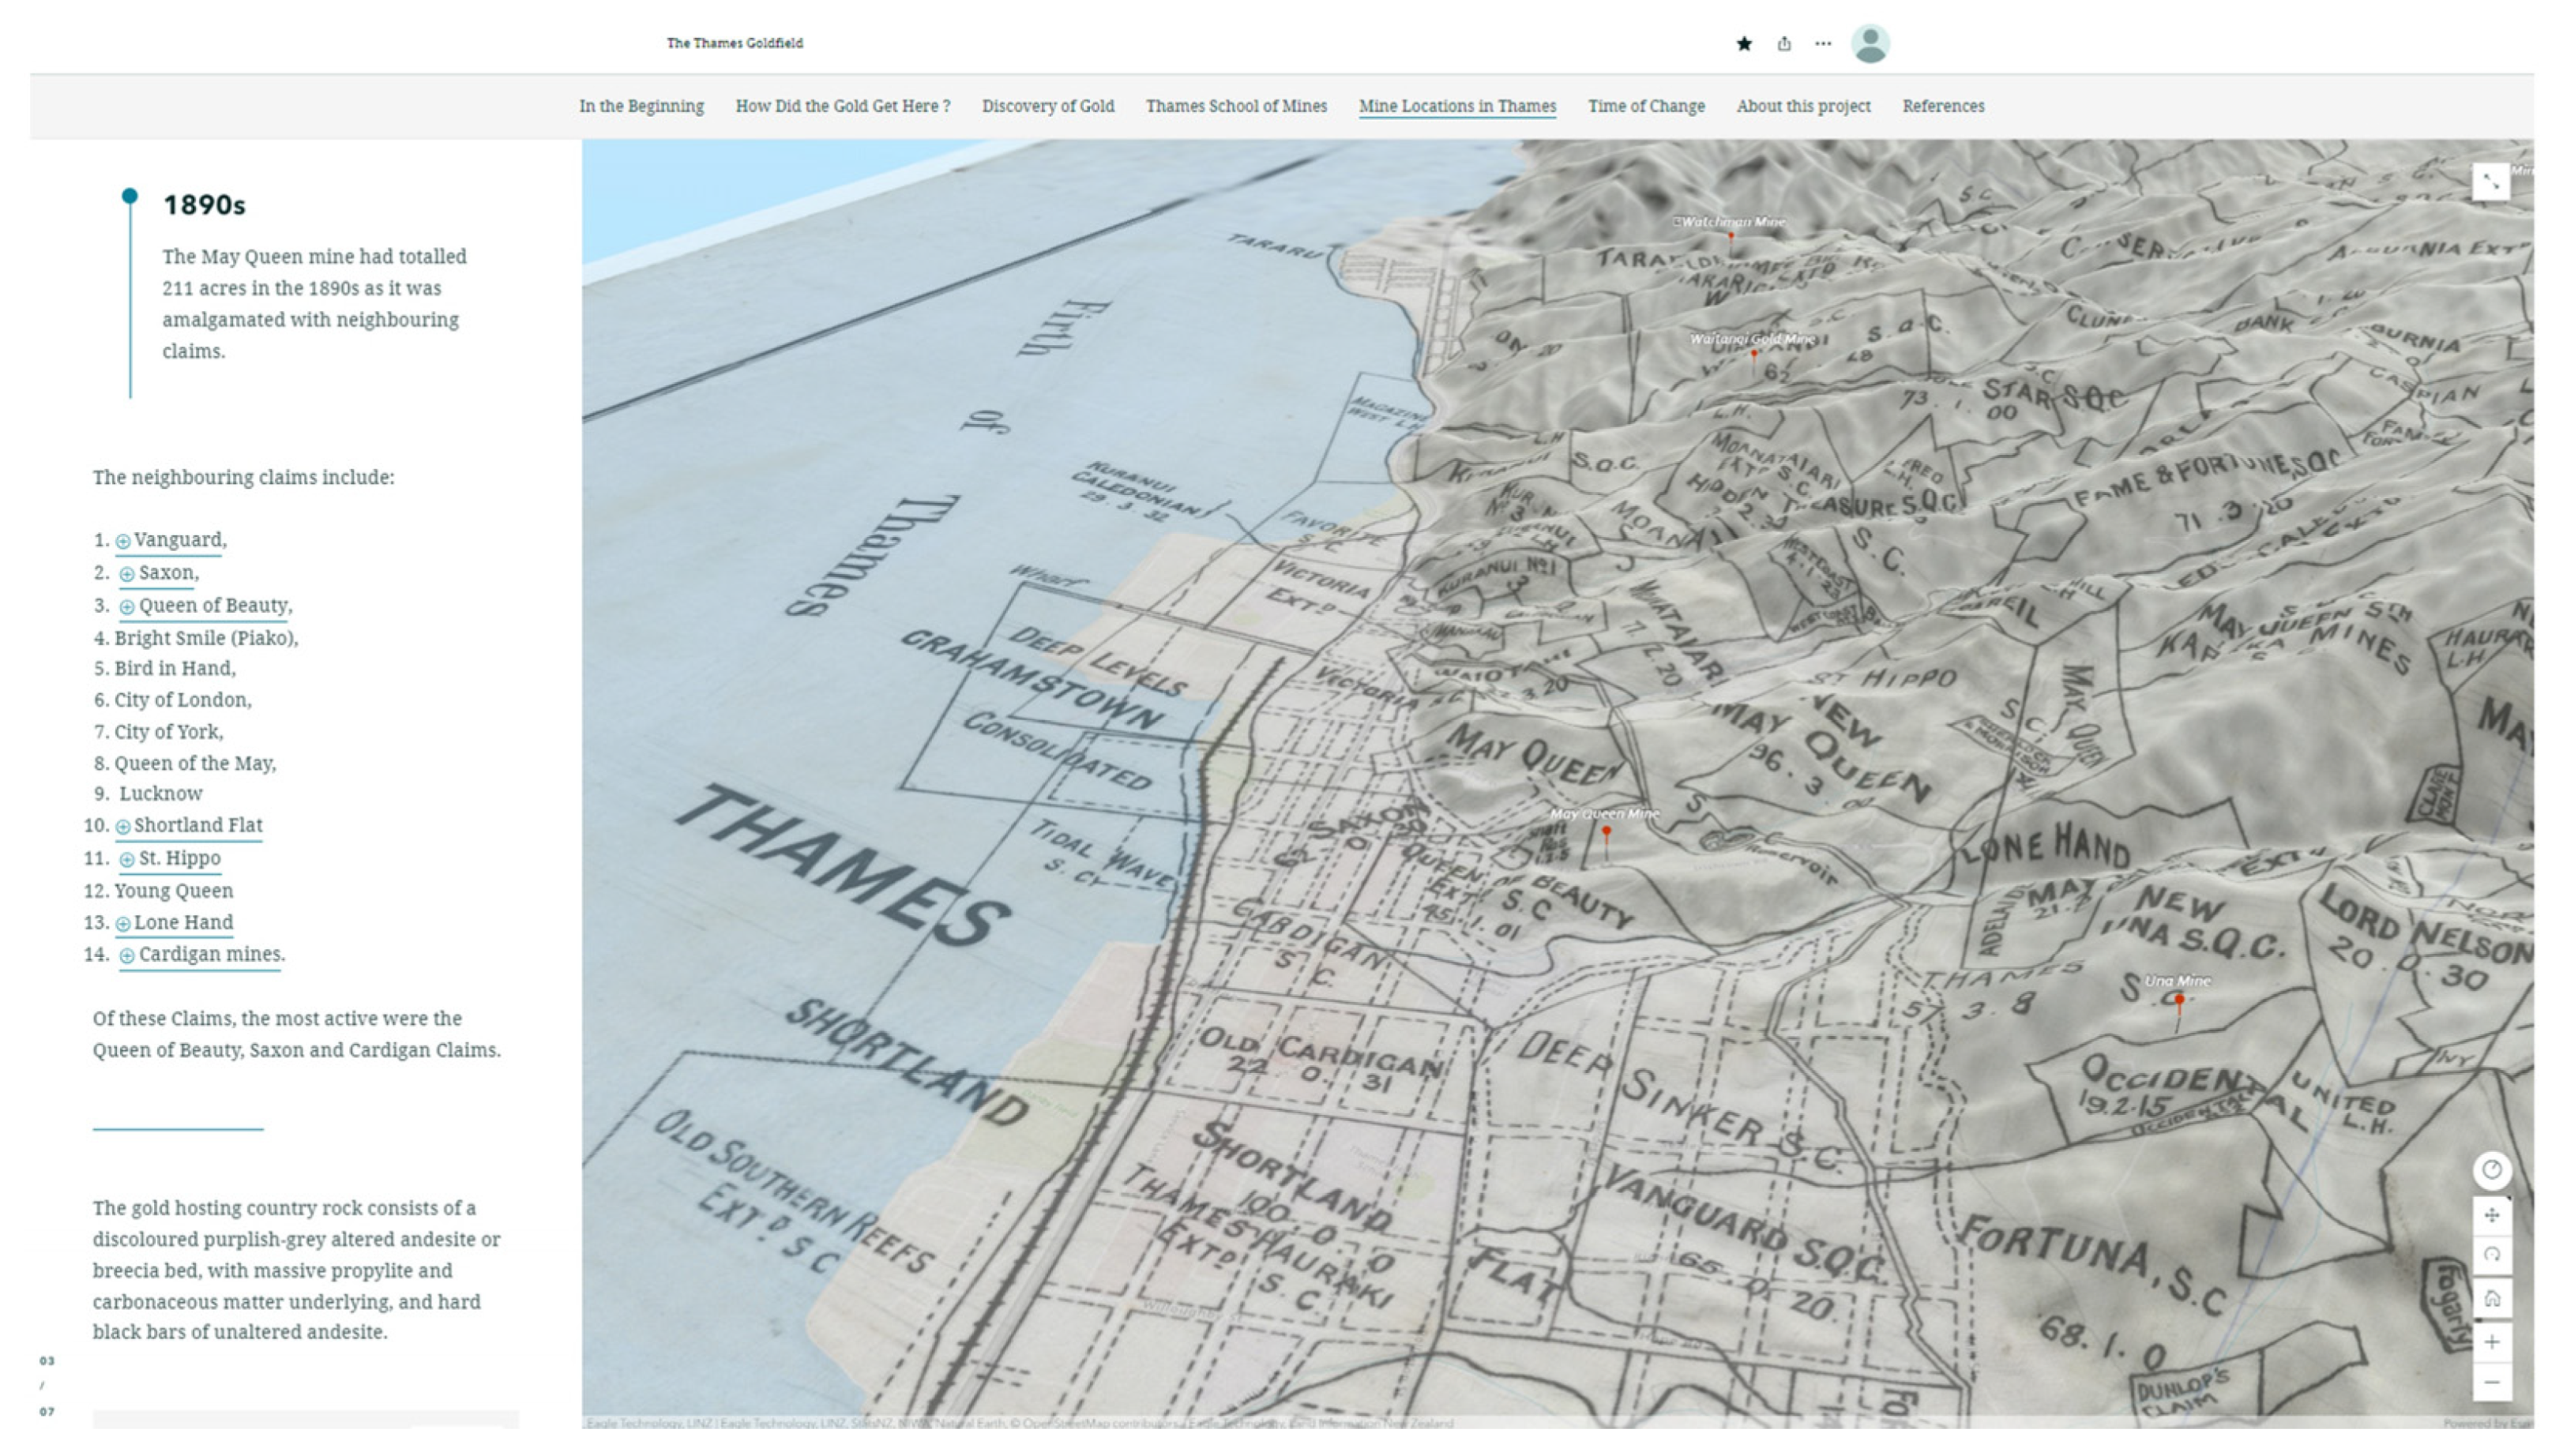
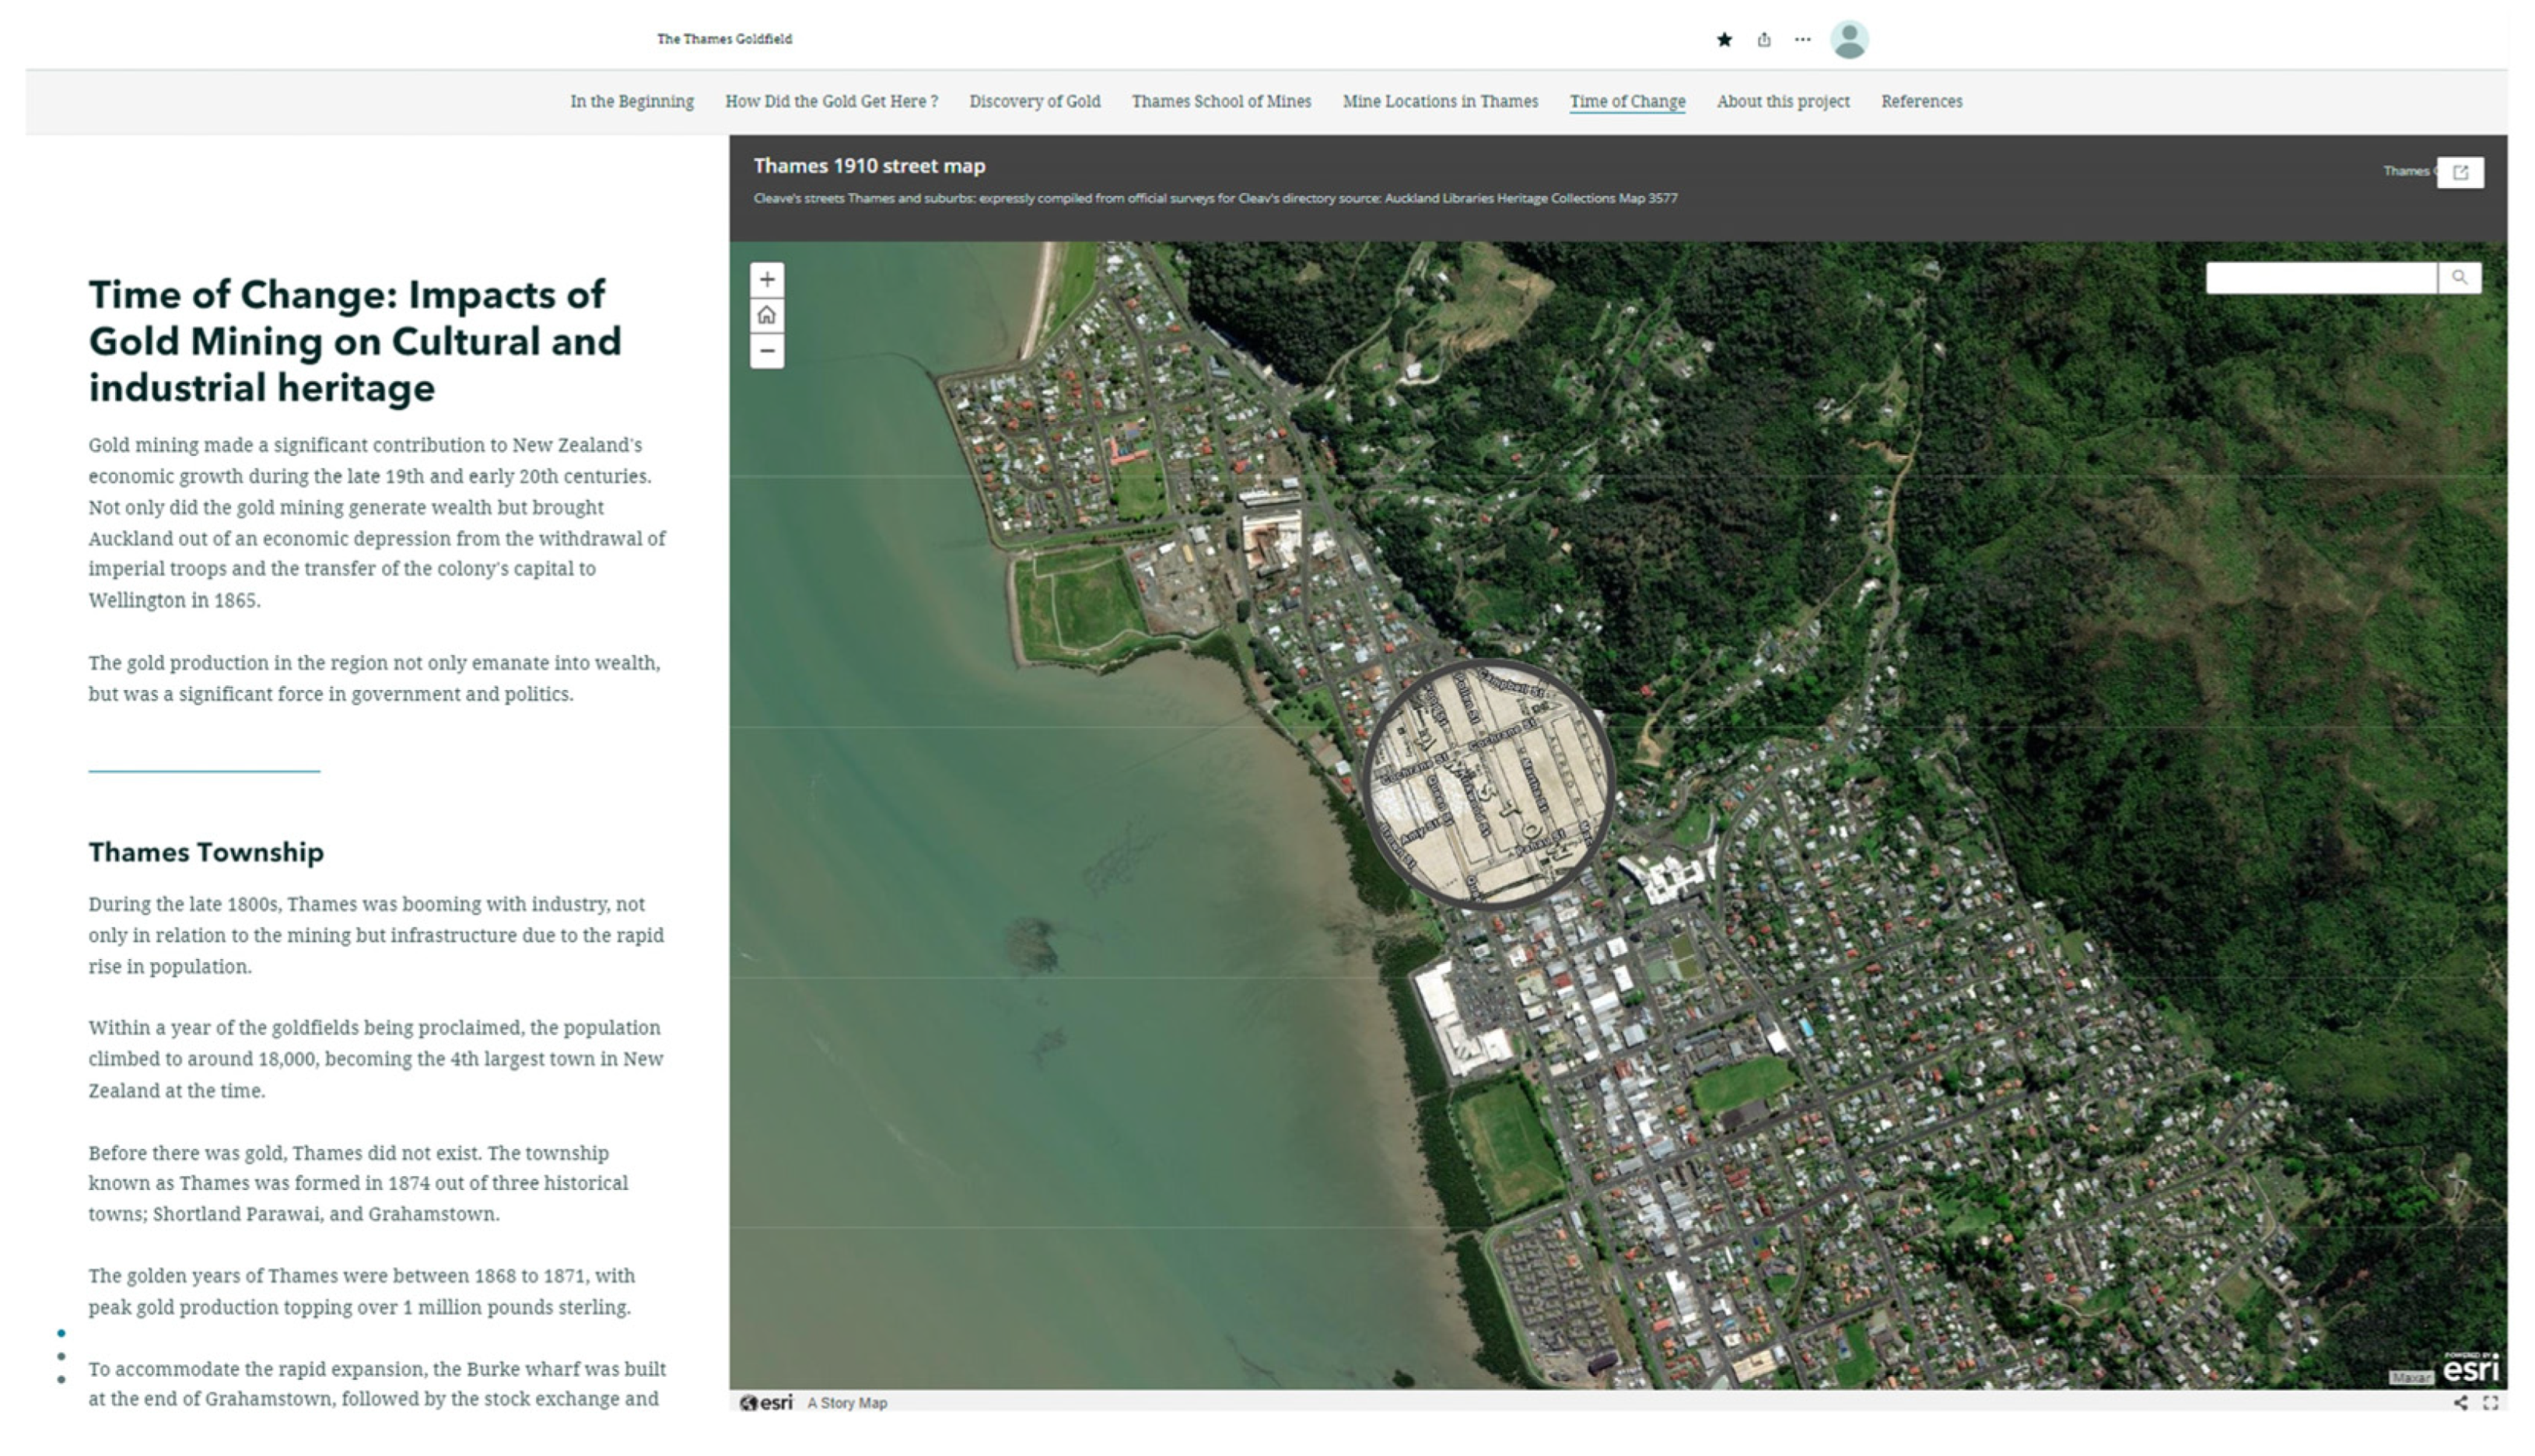
Table A1). The mining map was converted into a 3D scene, overlain with a superimposed map of the mining claims on the terrain with the mine points. The StoryMap Spyglass℠ app template was used to present the 1910 Thames Street map.

4.3. Developing the Storymap

The ESRI web application storymap was used to disseminate the information as the application supports multimedia and custom-made displays. Adopting Storymaps for this study offers several advantages compared to traditional methods of dissemination, such as interactive mapping to give spatial context, ease of use for both the developer and user, capability to understand provided information through interactivity compared to analogue methods, attractive customized displays based on the user’s needs, the ability to embed a range of different media (maps, images, text, and 3D models), and ultimately, the ability to cover a wide range of heterogenous information. The main advantage to the platform is its compatibility with different types of digital datasets.
The storymap was created using the Storymap Builder, allowing for full customization of the display. Designing a storymap requires no prior coding knowledge, as the program uses media blocks to develop the narrative. To build the story, the block palette menu is accessed by selecting “+”, this is where the function blocks can be accessed. There are three primary functions available, which include (1) basic features, (2) incorporating media, and (3) immersive blocks. For this project, we incorporated a variety of these different functions to keep the users engaged with the platform. The main storymap interface applies a scrolling format that allows the users to follow the story sequentially, as well as the choice to explore the different sections by selecting the topic in the content header. Story topics include the following: In the Beginning (geological setting to the Thames-Coromandel and Hauraki District), How Did the Gold Get Here? (Ag–Au epithermal mineralization), Discovery of Gold, Thames School of Mines, Mines in the Thames vicinity, and Times of Change (impacts of gold mining on cultural and industrial heritage).
Literature gathered for the storymap consist of peer-reviewed material to support the geological features, and grey literature (books, newspapers, and websites) to create the narrative around the mining, cultural, and industrial heritage, with all references cited in the credit section at the end of the storymap [18,19,20,22,23,24,25,26,27,28,29,30]. Images used in the storymap were gathered primarily from digital archives such as the national library, Auckland heritage collections, Kura, and Digital NZ. The image sources were added to the media settings, and can be found by hovering over the icon featured in the top left corner of the images.
A key element in the design of the storymap was to include as many interactive elements as possible to provide a hypermedia environment allowing for multiple levels of engagement. The presentation of the storymap emphasizes the use of visual and interactive displays, utilizing narrative text to enrich the storytelling and give context.

5. Outputs

5.1. Digital Mineral and Rock Repository

To date, the Sketchfab repository consist of thirty distinct models featured as a collection of “Thames School of Mines” and as thematic collections (Figure 5, Table A1). The geological collection features a diverse set of samples representing the Ag–Au epithermal mineralization paragenesis. The mineral assemblage displayed represent the various crystal habits, luster, and optical properties of the specimens, including rare and atypical formations (Figure 5).
In the Sketchfab 3D viewer, users can manipulate the models by zooming in, rotating the models, and reading the attached annotations and explanations that provide key information about the occurrence and properties of the mineral. Additional Sketchfab features also allow the models to be compatible with immersive virtual reality (Figure 6 and Figure 7).
The intended purpose of creating this secondary repository was to provide a suitable interface as a museum experience to be implemented into the final storymap output (Figure 8). The Sketchfab 3D models were embedded into the collections to display a total collection, as well as a thematic set that corresponds to the storymap (Figure A1).
The models can be viewed on any device with access to internet without the need to download additional software or browser plug-ins. All models are open access to viewing, although only downloadable upon request due to copyright. A benefit of having both repositories is increased exposure and visibility. The Sketchfab repository was also featured in an article by Heritage Quarterly, which has subsequently also increased its exposure to a wider audience (Figure A2).

5.2. Storymap

The created storymap (https://arcg.is/j5fiK, accessed on 19 January 2021) demonstrates an innovative approach to making geoheritage values of the Thames School of Mines and Mineralogical Museum specimens accessible in the context of the mining, cultural, and industrial heritage of the Thames Goldfields. The storymap is configured to be viewed on smart phones, tablets, and personal computers (Figure 9).
Each of the narrative text is accompanied by a visual medium that engages the user to explore. The target audience for the storymap was the public, reflected in the language used to narrate the story. The storymap has pre-processed filtered maps for the geological setting, allowing users who are not as confident in using GIS applications to visualize.
One key element of the storymap emphasized in the methodology was to generate as many interactive elements as possible to provide a true multimedia environment that allows for multiple levels of engagement. As a result, the story contains several variations of interactive web maps, a 3D scene, and over 30 3D interactive elements.

5.2.1. Geological Setting

The first part of the storymap, titled “in the beginning”, introduces the user to the geological setting of the Thames-Coromandel and Hauraki Districts (Figure 10). As the user scrolls through the section, the map display changes to the subject of the narrative text. This portion of the story sets the scene for gold mineralization, focusing on volcanism of the Coromandel Volcanic Zone and the underlying Jurassic basement sequence. The web maps presented in this section allow the user to explore the features by manipulating the maps to change the extent and select geological units that contain pop-up information about the geological unit (Figure 10). All web maps in this section used the same base map, vector terrain, as a means of seamless transition through the story and to give a sense of the terrain. Images in the text were also incorporated into the panel to further emphasize the spoken topic.

5.2.2. Gold Mineralization

Following the geological setting, the story moves to “how the gold got there”. This section of the story goes through the gold mineralization paragenesis. The story starts with tying the Ag–Au mineralization to the volcanism in the region, showing a map of the corresponding geological units (e.g., the Coromandel group, Whitianga group, and Waipapa basement group) associated with epithermal deposits, and a map featuring fault systems to demonstrate how the mineral-rich fluid traverses to the surface for deposition (Figure 11). The 3D models are embedded into the story through thematic collections depicting the geodiversity of minerals that occur in the different zones of mineralization, including minerals deposited over 400 °C, between 300–200 °C, closer to the surface (<200 °C), and gangue minerals (Figure 12 and Figure 13). The narrative text describes the occurrence of mineral groups in the docked panel, while they are able to interact with the models in the main stage.

5.2.3. Discovery of Gold

To explore the discovery of gold, a guided tour takes the user to locations of the first sightings. Rumors of mineral potential circulated as early as the arrival of Captain Cook in the 1700s. The guided tour goes through four stops, Mercury Bay, Beeson’s Island (Whanganui Island), Preeces Point, and Te Aroha, before ending at the official recorded discovery by Charles and Fredrich Ring in 1852 (Figure 14). The opening of the Thames Goldfield is its own segment, as it was a significant event that revolutionized the district. This section follows the story of the start of the Thames gold rush, following the discovery by William Hunt in 1867, with a tour with an approximated geolocated map of the discovery (Figure 15). The Thames Goldfield tells a story of hard rock mining, vastly different from the “poor man’s” alluvial goldfield. Images of prominent figures are added to the guided map tour to provide a face to the name (Figure 15).

5.2.4. Thames School of Mines and Mineralogical Museum

With the opening of the goldfields, the Thames School of Mines was established shortly after. The user is introduced to the Thames School of Mines and its history through a timeline (Figure 16). As the user scrolls through, they take a virtual tour of the School of Mines’ facilities through a series of images and narrative text (Figure 17). Additional interactive elements include a “swipe” display of the interior of the mineralogical museum (Figure 18). A curated display of all the 3D mineral and rock specimens is embedded at the end of the section to show all the samples collected from the Mineralogical Museum, topped off with a map of the general locations of the samples from around the Thames-Coromandel and Hauraki Districts (Figure 19 and Figure 20).

5.2.5. Mines

The mines section uses a 3D scene, with an old mining claims map superimposed onto the terrain (Figure 21). A selection of specific mines in Thames were selected based on where the specimens were collected from. The section starts with an overview of the claims in Thames and the surrounding vicinity. As the user scrolls through, the extent changes to focus on a particular mine. As Thames District has several claims, the locations chosen are focused on those mines that the specimens from the Thames School of Mines have a direct link to. The mines include Una Hill, May Queen, Waitangi, Watchman, and the Sylvia mine (Figure 22). Each mine is accompanied by a dock panel of text that gives the user background on the geological composition of the mines, companies involved in the mining operation, and additional information that informs the user on the history and significance of the mine. Due to literature concerning the mines being limited, the information for each mine varies. Map actions were added to the text of the May Queen, enabling the user to zoom to the surrounding claims, which were eventually amalgamated together to form the May Queen.

5.2.6. Time of Change: Cultural and Industrial Heritage in Relation to Gold Mining

This section explores outside the bounds of geology and reflects on the impact mining had on society. The section starts out with the formation of the Thames Township and the industrialization, describing how the town changed to accommodate the goldfields and those living in Thames over a short period (Figure 23 and Figure 24). Interactive maps are used to emphasize how gold mining revolutionized and industrialized Thames. A spyglass feature map encourages the user to inspect the 1910 Thames Street map in comparison to modern Thames (Figure 23). During this time, Māori and colonists began to have a volatile relationship. Māori land loss was a significant political issue, as at the time during Māori land alienation, gold mining accelerated the rate of land confiscation. A swipe map is embedded into the story for the users to compare land loss from 1875 to 1890 (Figure 25).

6. Discussion

In this study, we aim to bring attention to the digital applications utilizing ex situ geoheritage elements for in situ interpretation, developing links between geological and cultural heritage. Using the Thames School of Mines mineralogical collection, we have presented a contemporary form of interpretation and communication to bring awareness to the geoheritage values of the Thames Goldfields.
Digitization of geological collections has been a major facilitator for specimen-based geoconservation [34]. Musealization exists as one of the oldest forms of preservation, though traditional museum settings often lack adequate facilities to keep specimens on display, as well as the risk associated with mishandling collections; therefore, the sharing, preservation, and utilization of physical specimens is challenging [34]. The development of the digital geological collection constitutes a valuable approach with implications to geoconservation and geoheritage. Specimens from the Thames School of Mines Mineralogical Museum are highly vulnerable, as most of the collection was extracted over 125 years ago, containing minerals that are water-soluble and those that are naturally decaying, causing them to be fragile and friable; thus, it is practically impossible for visitors to interact with the physical specimens.
The digital inventory also provides a geoconservation measure that aims to preserve the specimens for future research and engagement. Popov et al. (2021) [35] describes the benefits of digitizing natural history collections from the London Natural History Museum as a means of collections becoming more accessible. Having a digital collection allows for accessibility to be globalized through the internet, enables unrestricted access to be viewed when specimens are not on physical display, as well as encourages collaboration and increases research efficiency [36,37].
Rock and mineral specimens from the Thames School of Mines mineralogical collection portray the region’s geological significance to Ag–Au epithermal deposits in relation to subduction-related volcanism. The virtual repository is a solution to making the collection more accessible, allowing the public to gauge an understanding of the significance the specimens have to the regional geology and geological history, aiding to illustrate the rich geological history of the Thames Goldfield, and how it revolutionized the region. These minerals are not only remnants of natural heritage, but an aggregation of heritage values relevant to mining, industrial, and cultural heritage. These additional values give more reason for preservation and protection.
Inventories, geoconservation, and public outreach are the main requirements for geoheritage management. In this work, we present an example of working with geoheritage elements ex situ. Much of the recent geoheritage research has been associated with in situ geoheritage, such as geological sites (geosites) and landscapes, as they are at a great risk of being lost due to environmental degradation and development [10,12]. Van Greet’s (2019) [37] publication on ex situ geoheritage found geological collections to be under-represented in the literature, and often dismissed as an opportunity to grow the field. Scientific collections, such as mineralogical collections, develop as a result of research, and form the basis of future studies, sharing support for the dissemination of knowledge for all levels of expertise [6,38]. Intensive mining during the gold rush has resulted in much of the natural landscape of the Thames-Coromandel District to become degraded. The mineral collection promotes the conservation of existing ex situ collections without further exploitation of the natural landscape.
Morita and Blimes, 2018 [39] discuss applications of low-cost 3D imagery for archaeological and cultural objects. Their analysis of the advantages of 3D imagery for delicate pottery or ancient jewelry items and similar objects underlines arguments used in this paper. Whether objects are for predominantly archaeological, paleontological, cultural, or geological use is in some ways accidental. The importance of new technologies [39] is the manner in which they virtually archive, preserve, and record data as images and models for a wide range of applications. Morita and Blimes, 2018 [39], for example, demonstrate how good-resolution imagery allows experts to magnify details on object images and undertake research using virtual collections. Global access to virtual object imagery through the internet [36,37] yields a wide range of advantages that were not possible when museums were originally developed and throughout the bulk of their history. Other advantages include increasing access for people with disabilities who cannot travel far; students of objects located far from their place of study; increasing options for space management within museums; providing materials for educators across the globe, perhaps of particular utilization in low-income or remote countries and regions where few educational resources are accessible; providing options for reducing the handling of delicate objects and specimens; and aiding publishable-level research [39].
Three-dimensional digitization is gaining traction in the field of geoheritage communication, enabling an audience of experts and non-experts to view the collections on their own devices anywhere in the world. Photogrammetric models essentially record a fragment of Earth’s history, though on its own does not necessarily effectively interpret its geoheritage significance as a standalone product. The application of these digital tools of communication and interpretation make this one of the more active areas of geoconservation and geoheritage work [7].
The storymap application shows an innovative way of communicating geoheritage interpretations through multidimensional and multidisciplinary knowledge pertaining to the geological, industrial, and cultural heritage of the Thames Goldfield. Dissemination of the storymap application illustrates how we can integrate interactive hypermedia datasets into a user-friendly outreach in the pursuit of virtual geoheritage communication. Interactive elements, such as the web maps and embedded models, form an immersive environment to engage users.
Being media-focused rather than text-focused encourages interactivity on multiple levels, and allows users to explore at their own discretion. Through the integration of the virtual products (web map applications and 3D models), it was possible to build a virtual geoheritage tour, providing additional value in the dissemination of knowledge in the geoheritage values of the Thames Goldfield. The storymap narrative guides the user through the geological history of Thames, connecting the underlying geology to mining heritage, and the influence mining in the Thames Goldfield has to cultural heritage.
All the digital content produced for this project is open-source, and can be accessed via any device with internet access. The availability of the digital products encapsulates a large audience, as essentially it can be viewed globally, as well as addresses the digital inclusion of those who cannot physically view the specimens at the Thames School of Mines due to mobility restrictions, spatial, or financial constraints.
The virtual repository and storymap web application provide an interactive vessel of communication to engage the public in geoheritage awareness. In the growth of geoheritage, mineralogical museums should be shown the same level of appreciation as geosites in terms of geoheritage values. The protection of geoheritage requires an interdisciplinary approach, crossing the knowledge of geological, industrial, and historical values. The geoheritage values of the mining minerals not only apply to the industrial activities, but its contribution to the cultural heritage of the region [40]. Viewing the rocks and minerals from a different perspective further enables the understanding of the geological resources as an integral part of cultural heritage, thus connecting the public to the importance of the Thames Goldfield by fostering a greater appreciation of the significance of geoheritage.

Recommendations for the Development of Geoheritage in Aotearoa, New Zealand

The field of geoheritage is still an emerging discipline, especially in New Zealand. Geoheritage in this research focused on the gold mining perspective dominated by colonial history, though future research could encourage investigating pre-colonial times. Although the storymap includes the impacts on Māori, the area of research pertaining to the involvement of Māori is extremely limited and underrepresented. Geoheritage values in future should extend outside of gold mining, looking into the use of the land and geological features, such as the use of shale for sharpening tools around Rocky Point [22], and intangible geoheritage, including Māori geomythology relating to the whenua (land) and its connection to tangata whenua (the people of the land). By incorporating these additional geoheritage values, we can contribute knowledge to the field as well as develop connections with iwi, enhancing geoconservation and geoheritage management.
Further connections to people can add value to the historical value we have given to the minerals of the Thames School of Mines mineralogical specimens by duly noting those who collected those specimens and their involvement with mining activities. Unfortunately, in this study, information pertaining to individuals was unable to be collected due to limitations accessing archival information. Geoheritage and mineral resources have many intersecting points.

7. Conclusions

The use of a web-based platform demonstrates how we can connect the geological significance of the Thames-Coromandel and Hauraki Districts to the region’s cultural and mining heritage. The storymap draws more public attention to not only the geological significance of the Thames-Coromandel and Hauraki Districts, but also their cultural and mining heritage significance, by forging connections between how gold mining in the region shaped the nation, demonstrating the impact it had on the New Zealand economy and shaping Thames cultural identity. The geological collection at the Thames School of Mines thus presents a narrative that explores geological heritage, mining heritage, industrial development, and the effects on social and political situations to the Thames-Coromandel and Hauraki Districts. Development of the curated 3D model collections formally shows the geoconservation efforts of preserving the specimens. Through the use of an interactive platform, we offer an outreach solution that not only demonstrates gold mineralization interpretation but promotes an interdisciplinary insight into cultural history and the consequences of mining. Integrating an interdisciplinary approach, we can develop a holistic interpretation of heritage in the context of geological, cultural, and industrial heritage to an audience including professional geoscientists, educators, and to those with a special interest in geoscience and New Zealand heritage. The digital content allows for future development in technology to give a new sense of preservation and dissemination of geoheritage in the 21st century.

Author Contributions

Conceptualization, V.C.-S., G.H. and M.G.P.; methodology, V.C.-S. and G.H.; software, V.C.-S.; formal analysis, V.C.-S.; investigation, V.C.-S.; data curation, V.C.-S.; writing—original draft preparation, V.C.-S. and M.G.P.; writing—review and editing, V.C.-S., M.G.P. and G.H.; visualization, V.C.-S.; supervision, M.G.P. and G.H. All authors have read and agreed to the published version of the manuscript.

Funding

This research received no external funding.

Data Availability Statement

No new data were created in this study. Data sharing is not applicable to this article.

Acknowledgments

The authors would like to thank the Thames School of Mines and Mineralogical Museum for supporting this project and making the geological collection available. This paper benefited from three anonymous reviews: all reviewers are deeply thanked for their time and expertise.

Conflicts of Interest

The authors declare no conflict of interest.

Appendix A

Table A1. Table of the mineral specimens utilized from the Thames School of Mines.
TS NumberSpecimen NameLocalityChemical FormulaMain Mineral GroupSecondary Group
TS.2298Calcite with sphalerite, galena, and copper pyritesMay Queen Extended, Karaka, ThamesCaCO3CarbonatesSulfides
TS.1219Dolomite var. ankeriteUna Hill, ThamesCaCO3 MgCO3Carbonates
TS.2121Pearl spar (indicates high gold values)Una Hill, ThamesCaMg (CO3)2Carbonates
TS.99Rhodochrosite on quartzZeehan mine, Thames CoastMnCO3CarbonatesSilicate
XTS.Cerussite crystalTui Mine, Mt. Te ArohaPbCO3Carbonates
TS.1404GypsumThamesCaSO4 H2OSulfateAltered host rock
TS.3856Galena lead sphalerite, and azurite and malachite oreNo. 2 Level Ruakaka Reef, Tui MineZn, Fe, SSulfide
TS.1256Siderite, iron carbonate, few crystals on quartzTui Mine, Mt. Te ArohaFeCO3CarbonatesSilicate
TS.2204GoldThamesAuNative metalQuartz and host rock
TS.2213ArgentiteMaratotoAg2SSulfide
TS.2223StibniteThamesSb2S3Sulfide
TS.2188“Fool’s gold” copper oreMonowai Mine, Thames CoastCuFeS2Sulfide
TS.1030Chalcopyrite (generally associated with gold in this district)Monowai Mine, Thames CoastCuFeS2SulfideQuartz
TS.2236Peacock copper oreMonowai Mine, Thames CoastCu5FeS4Sulfide
TS.1625Chalcopyrite in gossanTararu, ThamesCuFeS2SulfideSupergene
TS.98Crustified galena oreWatchman gold-mine, ThamesPbSSulfide
TS.77Cinnabar USD 62-0-0 per ton (old price)Maungakirikiri Tributary of Kauaeranga R. ThamesHgSSulfideSilicate and host rock
TS.125Smithsonite (ZnCO3) with iron oxide and lead carbonateChampion stopes, Tui Mine, Mt. Te ArohaZnCO3Carbonates
TS.2250Zinc, copper, and lead sulfides in quartz with amethystine bandsRuakaka Vein, No. 5 level, Tui Mine, Te ArohaSiO2 (Zn-Pb-Cu)SilicateOre forming
TS.2538Auriferous quartzTararu, ThamesAg–AuRockSilicate and host rock
TS.95Covellite on pyriteSylvia mine, ThamesCuSSulfide
TS.1988Rich sulfide ore, Waionmu sulfide corporationZeehan Mine, Waiomu(Cu + Fe) SSulfide
TS.1477BariteThamesBaSO4Sulfate
TS.118Barium sulfate on mineralized quartz layer onRuakaka Vein, No. 5 level, Tui MineBaSO4SulfateSilicate
TS.2767Pb, Zn, Cu ore partly oxidizedTop level Comstock working, Monowai reef systemZn-Pb-Cu SSulfide
TS.1182Quartz (containing tellurium)WaiomuSiO2, TeTellurideSilicate
TS.2280Silver tellurideWaitangi Mine, ThamesAgTeTelluride
TS.473Gold in rhyoliteTairuaAgNative metalRhyolite
TS.2910Chalcanthite hydrated CuSO4Monowai, Waiomu ValleyCuSO4Sulfate
TS.1412EpsomiteThamesMgSO4 H2OSulfateIgneous host rock

Appendix B

Figure A1. Curated collections created in ArcGIS Storymaps “Collections”. The collections presented are the embedded models used.
Geosciences 13 00253 g0a1

Appendix C

Figure A2. Quarterly Heritage New Zealand article about the 3D models from the Thames School of Mines. URL: https://issuu.com/heritagenz/docs/heritage_quarterly_autumn_2022/s/14973345 (accessed 3 March 2022).
Geosciences 13 00253 g0a2

References

  1. Crofts, R.; Tormey, D.; Gordon, J.E. Introducing new guidelines on geoheritage conservation in protected and conserved areas. Geoheritage 2021, 13, 33. [Google Scholar] [CrossRef]
  2. Cook, T.; Abbott, L. Geoheritage: Preserving Earth’s Legacy. Earth 2015, 60, 50–57. [Google Scholar]
  3. Cayla, N.; Martin, S. Digital geovisualisation technologies applied to geoheritage management. In Geoheritage, 1st ed.; Elsevier: Amsterdam, The Netherlands, 2018; pp. 289–303. [Google Scholar]
  4. Gioncada, A.; Pitzalis, E.; Cioni, R.; Fulignati, P.; Lezzerini, M.; Mundula, F.; Funedda, A. The volcanic and mining geoheritage of San Pietro Island (Sulcis, Sardinia, Italy): The potential for geosite valorization. Geoheritage 2019, 11, 1567–1581. [Google Scholar] [CrossRef]
  5. De Wever, P.; Alterio, I.; Egoroff, G.; Cornée, A.; Bobrowsky, P.; Collin, G.; Page, K. Geoheritage, a national inventory in France. Geoheritage 2015, 7, 205–247. [Google Scholar] [CrossRef]
  6. De Wever, P.; Guiraud, M. Geoheritage and museums. In Geoheritage, 1st ed.; Elsevier: Amsterdam, The Netherlands, 2018; pp. 129–145. [Google Scholar]
  7. Tormey, D. New approaches to communication and education through geoheritage. Int. J. Geoheritage Park. 2019, 7, 192–198. [Google Scholar] [CrossRef]
  8. Quesada-Valverde, M.E.; Quesada-Román, A. Worldwide trends in methods and resources promoting geoconservation, geotourism, and geoheritage. Geosciences 2023, 13, 39. [Google Scholar] [CrossRef]
  9. Pasquaré Mariotto, F.; Bonali, F.L. Virtual geosites as innovative tools for geoheritage popularization: A case study from Eastern Iceland. Geosciences 2021, 11, 149. [Google Scholar] [CrossRef]
  10. Pasquaré Mariotto, F.; Antoniou, V.; Drymoni, K.; Bonali, F.L.; Nomikou, P.; Fallati, L.; Karatzaferis, O.; Vlasopoulos, O. Virtual geosite communication through a webgis platform: A case study from Santorini island (Greece). Appl. Sci. 2021, 11, 5466. [Google Scholar] [CrossRef]
  11. Melelli, L.; Palombo, M.; Nazzareni, S. Ghost Mines for Geoheritage Enhancement in the Umbria Region (Central Italy). Geosciences 2023, 13, 208. [Google Scholar] [CrossRef]
  12. Carcavilla, L.; Díaz-Martínez, E.; García-Cortés, A.; Vegas, J. Geoheritage and Geodiversity; Instituto Geológico y Minero de España: Madrid, Spain, 2019; 24p, PanAfGeo Edition; NIPO: 697-19-003-2; Depósito Legal: M-12304-2019. [Google Scholar]
  13. Varvara, A.; Nomikou, P.; Pavlina, B.; Pantelia, S.; Bonali, F.L.; Lemonia, R.; Andreas, M. The story map for Metaxa mine (Santorini, Greece): A unique site where history and volcanology meet each other. In Proceedings of the 5th International Conference on Geographical Information Systems Theory, Applications and Management (GISTAM 2019), Heraklion, Greece, 3 May 2019; pp. 3–5. [Google Scholar]
  14. Antoniou, V.; Nomikou, P.; Panousis, D.; Zafeirakopoulou, E. Nisyros Volcanic Island: A geosite through a tailored GIS story. Geosciences 2021, 11, 132. [Google Scholar] [CrossRef]
  15. Christie, A.B.; Simpson, M.P.; Barker, R.G.; Brathwaite, R.L. Exploration for epithermal Au–Ag deposits in New Zealand: History and strategy. New Zealand J. Geol. Geophys. 2019, 62, 414–441. [Google Scholar] [CrossRef]
  16. Gadsby, M.R.; Spörli, K.B. Structural background to Hauraki goldfield mineralisation: A review. In Proceedings of the 11th New Zealand Geothermal Workshop, Auckland, New Zealand, 8 November 1989; pp. 149–154. [Google Scholar]
  17. John, D.A. Epithermal gold-silver deposits of the Hauraki Goldfield, New Zealand: An introduction. Econ. Geol. 2011, 106, 915–919. [Google Scholar] [CrossRef]
  18. Christie, A.B.; Brathwaite, R.L. Epithermal Gold in New Zealand: Mineral Deposits Models; Institute of Geological and Nuclear Sciences: Lower Hutt, New Zealand, 2003. [Google Scholar]
  19. Barker, R.; Christie, T. Exploration for epithermal gold-silver deposits in the Hauraki Goldfield, North Island, New Zealand. AusIMM Bull. 2014, 4, 38–42. [Google Scholar]
  20. Christie, A.B.; Simpson, M.P.; Brathwaite, R.L.; Mauk, J.L.; Simmons, S.F. Epithermal Au-Ag and related deposits of the Hauraki goldfield, Coromandel volcanic zone, New Zealand. Econ. Geol. 2007, 102, 785–816. [Google Scholar] [CrossRef]
  21. Christie, A.B. Introduction to New Zealand hard rock gold deposits and their exploration models. New Zealand J. Geol. Geophys. 2019, 62, 394–413. [Google Scholar] [CrossRef]
  22. Isdale, A.M. History of The River Thames N.Z.; County Chronicle Press Ltd.: Manurewa, New Zealand, 1967; pp. 28–36. [Google Scholar]
  23. Walrond, C. ‘Gold and gold mining’, Te Ara—The Encyclopedia of New Zealand. 2006. Available online: http://www.TeAra.govt.nz/en/gold-and-gold-mining (accessed on 16 February 2022).
  24. Hunt, G. ‘Business failures and corporate fraud—19th-century business failures’, Te Ara—The Encyclopedia of New Zealand. 2010. Available online: http://www.TeAra.govt.nz/en/photograph/22335/thames-in-the-goldmining-era (accessed on 16 February 2022).
  25. Hayward, B.W. Out of the Ocean into the Fire: History in the Rocks, Fossils and Landforms of Auckland, Northland and Coromandel; Geoscience Society of New Zealand: Aotearoa, New Zealand, 2017; pp. 134–159. [Google Scholar]
  26. Simpson, M.P.; Mauk, J.L.; Merchant, R.J. Bonanza-grade epithermal veins from the Coromandel and Thames districts, Hauraki Goldfield. In Proceedings of the Ausimm New Zealand Branch Conference, Queenstown, New Zealand, 27–30 August 2011; Volume 30, p. 27. [Google Scholar]
  27. La Roche, J. Thames School of Mines; Engineering Heritage New Zealand, IPENZ report, August 2012. Available online: https://www.engineeringnz.org/programmes/heritage/heritage-records/thames-school-mines/ (accessed on 28 January 2022).
  28. Young, A.; Coppard, E. The Story of the Thames School of Mines: The Early Years; Hauraki Regional Committee, New Zealand Historic Places Trust: Wellington, New Zealand, 1990. [Google Scholar]
  29. Mackay, J. Thames School of Mines under the Mines Department of New Zealand Syllabus of Lectures & Instruction; Government Printer: Wellington, New Zealand, 1901; pp. 2–18. [Google Scholar]
  30. Heritage New Zealand. The Thames School of Mines. Available online: https://www.heritage.org.nz/places/places-to-visit/coromandel/thames-school-of-mines (accessed on 28 January 2022).
  31. Andrews, G.; Labishak, G.; Brown, S.; Isom, S.; Pettus, H.; Byers, T. Teaching with digital 3D models of minerals and rocks. GSA Today 2020, 30, 46–47. [Google Scholar] [CrossRef]
  32. Caravaca, G.; Le Mouélic, S.; Mangold, N.; L’Haridon, J.; Le Deit, L.; Massé, M. 3D digital outcrop model reconstruction of the Kimberley outcrop (Gale crater, Mars) and its integration into Virtual Reality for simulated geological analysis. Planet. Space Sci. 2020, 182, 104808. [Google Scholar] [CrossRef]
  33. Sketchfab [Computer Software]. Available online: https://sketchfab.com/ (accessed on 15 January 2022).
  34. Sang, X.; Leng, X.; Ran, X.; Li, X.; Xue, L. A Virtual 3D Geological Library Based on UAV and SFM: Application for Promoting Teaching and Research on Geological Specimen and Heritage Online. Geoheritage 2022, 14, 43. [Google Scholar] [CrossRef]
  35. Popov, D.; Roychoudhury, P.; Hardy, H.; Livermore, L.; Norris, K. The value of digitising natural history collections. Res. Ideas Outcomes 2021, 7, e78844. [Google Scholar] [CrossRef]
  36. Apopei, A.I.; Buzgar, N.; Buzatu, A.; Maftei, A.E.; Apostoae, L. Digital 3D Models of Minerals and Rocks in a Nutshell: Enhancing Scientific, Learning, and Cultural Heritage Environments in Geosciences by Using Cross-polarized Light Photogrammetry. Carpathian J. Earth Environ. Sci. 2021, 16, 237–249. [Google Scholar] [CrossRef]
  37. Van Geert, F. In situ interpretation and ex situ museum display of geology. New opportunities for a geoheritage based dialogue? Int. J. Geoheritage Park. 2019, 7, 129–144. [Google Scholar] [CrossRef]
  38. Reis, J.; Póvoas, L.; Barriga, F.J.A.S.; Lopes, C.; Santos, V.F.; Ribeiro, B.; Pinto, A. Science education in a museum: Enhancing earth sciences literacy as a way to enhance public awareness of geological heritage. Geoheritage 2014, 6, 217–223. [Google Scholar] [CrossRef]
  39. Pijet-Migoń, E.; Migoń, P. Geoheritage and Cultural Heritage—A Review of Recurrent and Interlinked Themes. Geosciences 2022, 12, 98. [Google Scholar] [CrossRef]
  40. Morita, M.M.; Blimes, G.M. Applications of low-cost 3D imaging techniques for the documentation of heritage objects. Opt. Pura Y Apl. 2018, 51, 50026. [Google Scholar] [CrossRef]
Figure 1. Key volcanic and igneous geological units of the Coromandel District, North Island, New Zealand. Adapted from Christie et al., 2019 [16]. Acknowledgements: Geoscience Society of New Zealand.
Geosciences 13 00253 g001
Figure 2. Shotover Mine, Kuranui Creek, Thames. Auckland Star: Negatives. Ref: 1/1-003165-G. Alexander Turnbull Library, Wellington, New Zealand./records/23049364.
Geosciences 13 00253 g002
Figure 3. Workflow diagram of development stages to produce the 3D mineral repository and web maps to be implemented into the storymap.
Geosciences 13 00253 g003
Figure 4. (a) Portable image capturing set up. (b) First round of alignment showing the areas of overlap, as indicated by the network of line (c) Removing the base by manually filtering out sections. (d) Example of depth and mask layer. (e) The reintroduction of images accompanied with depth and mask in alignment. (f) Texturized 3D model in the Reality Capture (g) 3D model in Sketchfab 3D properties editor where annotations were added to enrich the specimen as well as minor enhancements to the display.
Geosciences 13 00253 g004
Figure 5. Screenshot taken of the Sketchfab “Thames School of Mines” collection. This collection features all the mineral specimens captured. Link to Sketchfab repository: https:/skfb.ly/oICPW (accessed on 19 January 2021).
Geosciences 13 00253 g005
Figure 6. A 3D model (far right, cinnabar) viewed alongside physical specimens (far left, pyrite, center, greywacke) using the Sketchfab augmented reality viewer. The viewer demonstrates how we can view the models in real space, as well as compare the models to the physical specimens.
Geosciences 13 00253 g006
Figure 7. Examples of the successful reconstruction of the specimens. Selection represents the photogrammetry technique’s ability to capture the luster and crystal habit. Top left: Stibnite (https://skfb.ly/6ZWD6, accessed on 19 January 2021), showing metallic luster and elongated crystal habit. Top right: Bornite (https://skfb.ly/o9G6Q, accessed on 19 January 2021), representing appearance of the metallic luster and vitreous luster of the quartz. Bottom left: Smithsonite (https://skfb.ly/o9G6R, accessed on 19 January 2021), showing rare coloration and botryoidal texture. Bottom right: calcite (https://skfb.ly/6ZWCY, accessed on 19 January 2021), with a bladed texture.
Geosciences 13 00253 g007
Figure 8. Storymap “collections” featuring the embedded Sketchfab models in a curated collection. The models featured in the collection have the same functionality as those hosted on the Sketchfab collection. Link to collection: https://arcg.is/1H0DC4 (accessed on 19 January 2021).
Geosciences 13 00253 g008
Figure 9. Example of how the Storymaps application is adapted to mobile (left) and tablet (right) devices.
Geosciences 13 00253 g009
Figure 10. Section introduced the user to the geological background of the Thames-Coromandel and Hauraki Districts. A floating side cart media display is used, focusing on the map media accompanied by narrative text that explains the different lithologies in relation to gold mineralization.
Geosciences 13 00253 g010
Figure 11. Screenshot of introduction to the mineralization of gold (how the gold got here). Web map used to reiterate the Coromandel group hosting almost all the gold-producing ground in the region. This initial story sequence uses a floating side cart, featuring a linked 3D model of gold found in Thames. The pop-up demonstrates how the user can select features on the web map.
Geosciences 13 00253 g011
Figure 12. Screenshot of “how the gold got here”. A docked side cart media display is used to show the mineralization sequence. The 3D models (right side) are displayed along the narrative text. Models are stored in a thematic set, based on their occurrence in relation to the mineralization paragenesis.
Geosciences 13 00253 g012
Figure 13. Screenshot show the thematic set of gangue minerals presented in the story section “how the gold got here”. The storymap prompts the user to interact with the embedded models.
Geosciences 13 00253 g013
Figure 14. Screenshot of the first sightings of gold in the region. A guided tour takes the user to different locations of rumored gold sightings. Each location is accompanied by a description of the reported gold finding. Some sites, such as the one featured, include images of prominent figures.
Geosciences 13 00253 g014
Figure 15. Screenshot of the Thames section of the ”discovery of gold”. A map tour was used to display the content. The main screen has two images, which can be viewed by selecting the arrow on the right.
Geosciences 13 00253 g015
Figure 16. Introducing the Thames School of Mines. A timeline is used to communicate to the user the main events in the school’s history before closure.
Geosciences 13 00253 g016
Figure 17. Virtual tour of the facilities through a series of images. The narrative text gives background information about the establishment of the school.
Geosciences 13 00253 g017
Figure 18. Virtual tour of the mineralogical museum facilities. The swipe feature is used to add an interactive element. Users can understand the lay out of the museum through the series of images.
Geosciences 13 00253 g018
Figure 19. A 3D curated rock and mineral display. The full set of specimens is featured in this collection. Users can view the models without leaving the storymap interface.
Geosciences 13 00253 g019
Figure 20. A map tour of the locations that the specimens came from. Locations are grouped by geographic area. Map action buttons are used to zoom to the locations.
Geosciences 13 00253 g020
Figure 21. Screenshot of one of the mine’s locations, Una Hill. Mining claims map is superimposed over the 3D terrain. Narrative text gives a description of the mines and is linked to a 3D specimen extracted from the mine. An image of Una Hill from the early 1900s is featured in the dock panel.
Geosciences 13 00253 g021
Figure 22. May Queen mine location, featuring the map actions. The words underlined in blue are selectable, zooming to the location of the named claim.
Geosciences 13 00253 g022
Figure 23. Screenshot of the last section covering the industrial and cultural impacts of gold mining. The information given describes the industrial growth of Thames at the time. The spyglass web map application reveals the 1910 street map by hovering over the modern landscape.
Geosciences 13 00253 g023
Figure 24. Screenshot of the section “times of change”. Images and narrative text describe the influence gold mining had on Thames cultural and industrial heritage. Colorized image is used to show what Thames looked like during the gold rush.
Geosciences 13 00253 g024
Figure 25. Screenshot of the last section, the impacts of gold mining on Māori society. A swipe map featured on the main stage shows land lost from 1875 (left) to 1890 (right).
Geosciences 13 00253 g025
Table 1. Input data for creating the web layers utilized in the storymap.
Web LayerData TypeUseSource
3D Mine Scene.tiffTo show mine locations (points and claims (.tiff)Fraser, C. 1910 The geology of the Thames subdivision, Hauraki, Auckland. Institute of Geological and Nuclear Sciences Limited
Mine X/Y Co-ordinate points NZ Mine Points (Topo, 1:50 k), Land Information New Zealand
Māori Land LossPolygon layers (1875 and 1890)Swipe map to compare land lossAdapted from Waitangi Tribunal, the Hauraki Report. Vol 2. Wellington: Legislation direct, 2006, Figure 70
Geological SettingLinesVeins, dykes, and faultsInstitute of Geological and Nuclear Sciences Limited
PolygonsGeological units, used to show different lithological groups hostingInstitute of Geological and Nuclear Sciences Limited
First Sighting’s X/Y Co-ordinates from CSVPoints used to geolocate gold sightings and specimen locationsLiterature (referenced in the storymap)
1910 Street Map of ThamesJPEGSpyglassCleave’s street Thames and suburbs: expressly complied from official surveys for Cleave’s director, Auckland Libraries Heritage Collection Map 3577
Disclaimer/Publisher’s Note: The statements, opinions and data contained in all publications are solely those of the individual author(s) and contributor(s) and not of MDPI and/or the editor(s). MDPI and/or the editor(s) disclaim responsibility for any injury to people or property resulting from any ideas, methods, instructions or products referred to in the content.

