

Does the Water Resource Tax Reform Bring Positive Effects to Green Innovation and Productivity in High Water-Consuming Enterprises?

1
School of Economics and Management, Hubei University of Science and Technology, Xianning 437100, China
2
Chinese Academy of Fiscal Sciences, Beijing 100142, China
*
Authors to whom correspondence should be addressed.
Water 2024, 16(5), 725; https://doi.org/10.3390/w16050725
Submission received: 11 November 2023
/
Revised: 16 January 2024
/
Accepted: 17 January 2024
/
Published: 28 February 2024
(This article belongs to the Special Issue Water Sustainability and High-Quality Economic Development)
Abstract
:Water resources are a fundamental natural and strategic economic resource and are closely related to high-quality economic and societal development. This paper uses the pilot implementation of the water resource tax reform to explore the impact of that reform on the green innovation and total factor productivity of enterprises. The study sample includes data for high water-consuming A-share listed enterprises in Shenzhen and Shanghai, China, from 2007 to 2021; the double-difference method was used for the analysis. Study findings indicate that replacing water resource fees with taxes significantly improves the green innovation level and total factor productivity of enterprises. Green innovation has a significant partial mediating effect between the water resource tax reform and total factor productivity. The water resource tax reform promotes green innovation in enterprises, enhancing total factor productivity. When considering different types of enterprise property rights, the economic effect of the water resource tax reform is more pronounced in non-state-owned enterprises, compared to state-owned enterprises. This paper provides empirical evidence for expanding the pilot scope of the water resource tax reform.
1. Introduction
Developing countries have long relied on large-scale and low-cost resource investments to gain product cost advantages, encouraging industrial competitiveness and rapid economic growth. However, the undervaluation of water resource factor prices and insufficient collection and management of water resources have led to extensive use of water resources by enterprises, leading to significant pressure on water resources and constraining industrial transformation and upgrades (Yao and Li, 2023) [1]. On 26 August 2021, the Food and Agriculture Organization of the United Nations released the Progress on Level of Water Stress report, stating that about one-third of the world’s population (2.3 billion people) live in countries experiencing water scarcity. One-tenth of the population (733 million people) live in countries facing high or severe water shortages. By 2050, major cities are likely to face water crises, including Beijing, London, Mumbai, and Tokyo. The high interdependence among urban, agricultural, and industrial water use highlights the need to promote sustainable, inclusive, and comprehensive governance approaches.
There are many disadvantages in the design and implementation of a water resource fee system, including low collection standards, the arbitrary selection of collection subjects, a low actual collection rate, and ineffective income use. This results in water prices not effectively reflecting the scarcity of water resources, decreasing the potentially protective role of a fee system. This makes it difficult for governments and enterprises to adapt to the needs of green development in the new era. This has led to calls to implement rigid constraints on water resources, promote the water resource tax reform, improve the water resource tax system, comprehensively improve water resource utilization efficiency, and expand development space by saving water (Lv et al., 2022) [2].
The theory of resource depletion posits that, as human society continuously develops, resources are continuously developed and consumed, decreasing reserves. This increases resource prices and decreases resource demands (Huang, 2018) [3]. The theory of resource depletion highlights that resource exhaustibility can affect demand and prices. This highlights the need for the government to regulate resource prices to protect resources, reduce resource usage, and improve resource utilization efficiency. Ing (2020) proposed that the government should design relevant tax policies to generate resource rents and alleviate resource depletion problems [4]. Welsch (2008) studied mineral resource externalities, positing that the presence of negative externalities indicates that the government should impose corresponding taxes and fees on miners to effectively address the associated problems [5]. Doing so should promote the rational development of mineral resources and alleviate excessive mining. Liu and Ruebeck (2020) noted that the negative externality problem associated with water bodies should be addressed in accordance with local conditions, and an effective charging mechanism should be developed based on the actual local environmental situation [6].
Many developed countries have used taxation to regulate water resources (Thomas and Zaporozhets, 2017) [7]. For example, Sweden’s introduction of a water resource tax has achieved results with respect to residential water use. The approach has increased government tax revenue, driving other government activities, such as water resource protection, and has improved the efficiency of residential water resource utilization (Höglund, 1999) [8]. The practice of levying a water resource tax in the Netherlands has shown that, in the short term, a water resource tax increases water-use costs for enterprises. The tax encourages enterprises to actively change their water-use methods, enhance their technological competitiveness, and improve their water resource utilization efficiency (Clinch et al., 2001) [9]. Berbel et al. (2019) studied the water resource tax systems of some European Union countries; the study found that introducing water resource taxes in these countries achieved significant water-saving effects and internalized the environmental and resource costs of agricultural irrigation water [10].
In contrast, while the introduction of a water resource tax in South Africa increased tax revenue and saved water consumption in the short term, the tax also reduced agricultural household income and lowered national consumption levels in the long run (van Heerden et al., 2008) [11]. Porcher (2017) studied the relationship between a French water tax and consumer behavior. The study found that the water consumption saved by levying a water tax was essentially the same as the reduction in water consumption achieved by directly increasing water prices [12]. There remains controversy about the economic consequences of introducing a water resource tax.
Porter’s hypothesis states that the design and effective operation of environmental controls can force enterprises to actively engage in green innovation activities (Porter and Linde, 1995) [13]. Fan (2021) analyzed the functional position of taxation and the specific purpose of individual resource taxes to determine the functional position of China’s taxes [14]. That paper argues that the resource tax, as a specific-purpose tax, plays a unique role in saving resources and protecting the environment. Jia and Lin (2022) simulated that analysis by constructing a general equilibrium model; the study found that the resource tax supports the protection of economic aggregates [15]. Legitimacy is an important prerequisite for enterprise survival; paying taxes in accordance with the law is a basic obligation. Given the cost of tax violations, enterprises will choose to reduce water resource consumption and waste. Enterprises cultivate a green competitive advantage and receive the benefits of innovation by reforming traditional production methods, improving existing processes and technologies, strengthening wastewater recycling through innovative governance at the end of production, and developing a circular economy (Chen et al., 2018) [16]. Porter and Linde (1995) [13] and Ambec et al. (2013) [17] also argued that environmental regulations may promote enterprise R&D investment and technological innovation and realize joint improvements in environmental performance and productivity through the innovation compensation effect. However, research is still needed to determine if a water tax reform also promotes the green innovation of enterprises and enhances their total factor productivity.
This paper provides the following innovations to this research field: First, some scholars have posited that a water resource tax improves water resource utilization efficiency and enhances the technological competitiveness of enterprises (Clinch et al., 2001; Berbel et al., 2019) [9,10]. In contrast, other scholars have posited that a water resource tax reduces the level of national consumption (van Heerden et al., 2008) [11]. Further, other scholars have posited that water resource tax reforms produce insignificant water savings (Porcher, 2017) [12]. Therefore, this study explores the economic consequences of a water tax reform from a micro-firm innovation and productivity perspective, providing empirical evidence to inform the water tax reform debate.
Second, the study considers the intrinsic mechanism of a water resource tax reform and its effect on enterprise total factor productivity. By applying an enterprise perspective, the research reveals the innovation incentive effect of a water resource tax reform. This helps to deepen the understanding of how a water resource tax reform affects enterprise behavior and provides an empirical reference to promote efficiency improvements and green innovation development among high water-consuming enterprises.
2. Literature Review
2.1. Water Resource Tax
In contrast to a traditional business model, green economic development requires that enterprises both pursue profits and reduce negative externalities. Levying a resource tax plays an important role in promoting green economic development (Mikhno et al., 2021) [18]. Illustrating this, Ing (2020) called for government policies to regulate the extraction of non-renewable water resources by imposing resource taxes and limiting the time frame for companies to extract those resources [4].
Most studies have found that implementing a water resource tax policy produces positive economic effects. Munguía-López et al. (2019) used a theoretical analysis to conclude that water taxes and tax credits contribute to higher profits and environmental benefits, such as reduced water extraction and increases in aquifer recharge [19]. Berbel et al. (2019) studied the water tax system in selected countries of the European Union, finding that implementing a water tax is effective in saving water, which optimizes environmental quality and internalizes the cost of resources for irrigated agriculture [10]. Thomas and Zaporozhets (2017) [7] examined the economic effects of water taxes in the United States, the Netherlands, and several other European countries. The study found a “win-win” situation, with increased water-use efficiency and reduced total water use. Ouyang (2022) also found that a water resource taxation policy improved water-use efficiency and optimized water-use structures [20]. Biancardi et al. (2021) used a differential game approach to analyze user and public authority behavior. They found that, in a non-cooperative case, imposing a water tax has a significant positive effect on protecting public groundwater resources [21]. Guo et al. (2022) examined the relationship between a water resource tax, sewage tax, and corporate green innovation decision making [22]. The study found that a water resource tax is significantly better than a sewage tax in terms of economic effects on water saving and emission reduction; this approach supports external ecological compensation. A few scholars have also explored water resource tax implementation. For example, Chen et al. (2020) argued that implementing a water resource tax motivates residents and businesses to look for lower cost alternatives [23].
2.2. Corporate Green Innovation
Green innovation refers to the development and design of new technologies and products that support energy savings, pollution prevention, and recycling to achieve ecological sustainability (Oltra and Saint, 2009) [24]. The goal of green innovation is to reduce ecological risks and enhance environmental governance effects (Vasileiou et al., 2022) [25]. Previous papers have explored the factors that influence green innovation with respect to the external system and environment, as well as at the corporate and managerial levels.
Applying an external regime and environment perspective, Frondel et al. (2008) noted that environmental regulations are an instrument of government environmental policy and are an important driver of green innovation [26]. Horbach (2008) also argued that government regulations are a major determinant of a firm’s green innovation [27]. Borsatto and Bazani (2021) found that environmental regulatory pressure from the government has a positive impact on green innovation [28]. This is because enterprises avoid penalties for violating environmental laws by actively investing resources in green technological innovations that lower the cost of violating the law. However, coercive pressure that pushes enterprises to follow environmental policies and regulations also dampens green innovation practices (Stucki, 2019) [29]. Other scholars have found that consumer preferences and demands (Fernando et al., 2021) [30] and institutional investors (Zhang et al., 2021) [31] significantly impact on enterprise green innovation.
Some researchers have applied an enterprise perspective, arguing that basic enterprise characteristics and the resources and capabilities an enterprise holds have a greater impact on the enterprise’s green innovation in each context. Segarra-Ona et al. (2012) argued that enterprise size generally indicates if an enterprise has the many resources needed for innovation [32]. As such, size is often considered important for enterprises to engage in green innovation. In contrast, Sáez-Martínez et al. (2016) argued that enterprise size does not impact an enterprise’s implementation of environmentally friendly products or process innovations [33]. Keskin et al. (2013) argued that newly established enterprises and those established for a relatively shorter time have an advantage in green innovation [34]. Other important success factors encouraging green innovation include qualified human resources (Ogbeibu et al., 2020) [35], adequate cash flow (Scarpellini et al., 2018) [36], and abundant and high-quality administrative resources (Bezerra et al., 2020) [37]. An enterprise’s absorptive (Shahzad et al., 2020) [38], technological (Triguero et al., 2013) [39], dynamic (Wang and Ahmed, 2007) [40], and organizational (Lončar et al., 2019) [41] capabilities are also important factors affecting the ability to undertake green innovation.
From a managerial perspective, managers’ environmental awareness and personal characteristics significantly impact their decisions to implement green innovation. Environmentally cost-effective managers focus more on improving existing product lines and producing green products with shorter payback cycles and greater visibility (Sumrin et al., 2021) [42]. Arena et al. (2018) found that chief executive officers (CEOs) with arrogant personalities are more likely to invest in projects with uncertain outcomes, given their high self-concept and tendency to like challenges [43]. This allows them to take high risks with respect to green innovation, and they may earn high returns from them. Zhang et al. (2023) used data from Chinese listed enterprises to demonstrate that CEOs’ overseas experience improves the green innovation level in corporate firms [44]. In addition to this, manager attention is also an important influence on green innovation in enterprises (Papagiannakis et al., 2019) [45].
2.3. Total Factor Productivity of Enterprises
Total factor productivity (TFP) covers many factors, such as technological progress, management efficiency, and scale effect, and comprehensively reflects resource allocation efficiency and the market competitiveness of enterprises. Overall, the key factors affecting enterprise TFP include government behavior, market behavior, and enterprise behavior.
Applying a government behavior perspective, Bernard et al. (2019) found that improving transportation infrastructure construction can optimize enterprise production chains, creating economies of scale, and ultimately promote enterprise TFP [46]. Aghion et al. (2015) found that government resource allocations to competitive enterprises increases enterprise TFP—total factor productivity [47]. This countered Kiyota and Okazaki (2010) [48], who argued that government subsidies allow a large number of enterprises without economies of scale to consume significant resources, preventing the transfer of government resources to enterprises with economies of scale and thus preventing an overall increase in TFP.
Applying a market behavior perspective, financial market development can provide financial support for enterprise technological upgrades, promote continuous upgrading, and ultimately promote enterprise TFP (Arizala et al., 2013) [49]. Research has also found that financial development has a non-linear effect on TFP (Méon and Weill, 2010) [50]. Financing constraints in an enterprise’s broader industry may also inhibit the enterprise’s TFP (Caggese, 2019) [51]. Human capital, intellectual property rights, and research and development (R&D) expenditures appear to be statistically significant and are strong factors in determining changes in TFP (Habib et al., 2019) [52]. An increase in information regarding share prices in the capital market can improve corporate governance and reduce factor costs, this improves enterprise performance and contributes to the enterprise TFP (Bennett et al., 2020) [53].
Applying a behavioral perspective, Hsieh and Klenow (2009) argued that talent acquisition and rising labor costs can increase enterprise TFP [54]. Tian and Twite (2011) noted that measures to improve corporate governance, such as improving the efficiency of the board of directors and executive compensation, exerts an effect similar to competition in the product market and effectively raises the TFP level [55]. Import-intensive firms are less productive; however, the productivity of firms with greater board connectivity generates a positive industry-level spillover effect (Ahamed et al., 2023) [56].
This literature review indicates there have been extensive studies on water resource tax reform, green innovation, and TFP, and that research has yielded valuable research results. However, research gaps and opportunities remain. First, the economic effects of a water resource tax reform have been mainly analyzed from the perspective of water-saving effects and ecological protection. Few studies have focused on green innovation and productivity. Further, many studies have considered the factors that influence enterprise green innovation from the perspectives of external institutions and environments, basic enterprise characteristics, resource capabilities, and manager characteristics. However, researchers have not yet fully explored the relationship between a water resource tax reform and enterprise green innovation. In particular, the economic effects of a water resource tax reform on enterprise green innovation deserve further study.
3. Theoretical Analysis and Research Hypothesis
No consensus has been reached on whether and how environmental regulations affects enterprise TFP. The various arguments can be broadly categorized into the following three views: The first is the “Porter’s hypothesis”, which states that environmental regulations promote firm TFP. Based on Porter’s hypothesis, reasonable and moderate environmental regulations will not only reduce the net cost of meeting regulatory requirements but will also fully stimulate enterprise innovation vitality, resulting in an “innovation compensation effect” that can promote the technological progress of enterprises and the efficiency of resource allocation (Porter and Linde, 1995) [13]. The second view is the “disincentive hypothesis” of neoclassical economics, which suggests that environmental regulations inhibit firm TFP. The “compliance cost effect” of environmental taxes increases the burden on enterprises and has a crowding-out effect on R&D investment and technological innovation, and, thus, enterprise TFP declines (Wang et al., 2023) [57]. Hancevic (2016) also argued that, under strict environmental regulations, enterprises tend to spend more money on unproductive activities, such as the purchase of environmental protection equipment [58]. In addition, their additional wastage, combined with the decline in the matching of the means of production with the original production equipment, ultimately results in productivity losses. The third view is the “uncertainty theory”, which states that a non-linear relationship exists between the impact of environmental regulations on enterprise TFP. Gray et al. (1995) argued that environmental regulations do not have a significant uplifting effect on either technological progress or efficiency improvement in enterprise TFP [59]. Medeiros et al. (2018) argued that a non-linear relationship exists between environmental regulations and enterprise productivity [60].
At the beginning of the implementation of water resource fees and taxes, there was the “disincentive hypothesis” of neoclassical economics. However, there is seldom an abrupt end to the phenomenon of changing water resource fees and taxes, but rather a tendency to implement them over the long term. In addition, the lure of compensatory returns from innovation will help entrepreneurs see the potential profitability of green production methods, products, and services. Water consumption by enterprises is inextricably linked to their production and business activities, and the water resource tax levied by China’s government is directly linked to the amount of water consumed by enterprises. The policy design of “more consumption, more tax” will greatly increase the cost to enterprises for environmental violations. Enterprise behavioral decisions are mainly oriented toward economic interests. In order to reduce the cost of environmental violations and production costs, high water-consuming enterprises have an incentive to eliminate outdated production capacity, to purchase environmentally friendly and energy-saving special equipment, and to improve production technology. They also have an incentive to engage in the research and development of green products and to optimize the allocation of resources, so as to better cope with the impact of the water resource tax reform on their own enterprise. Water resource fees or taxes can force enterprises to carry out green technological innovation and engage in the research and development of environmentally clean production technology and products. These fees will also make enterprises more inclined to purchase energy-saving and environmentally friendly equipment, thus eliminating a backward production capacity. This in turn promotes the technological optimization and upgrading of enterprises and improves their TFP. Based on the above, the following hypothesis is proposed:
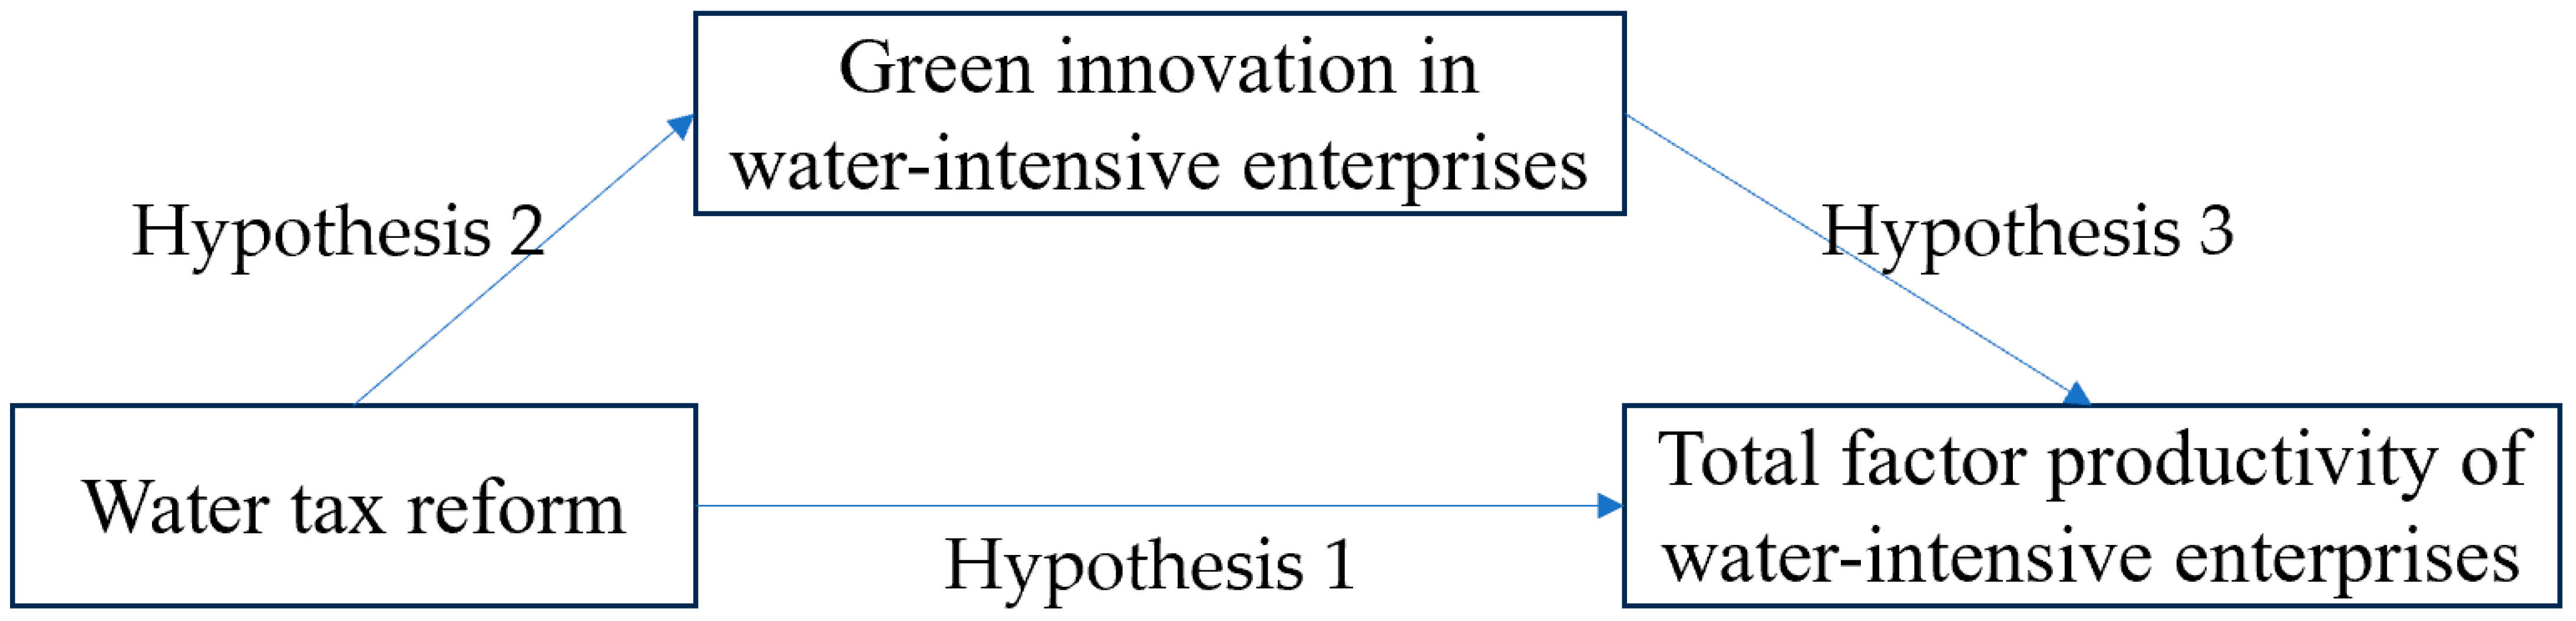
Hypothesis 1:
Water tax reform increases the total factor productivity (TFP) of high water-consuming firms.
Environmental taxes are levied to achieve environmental improvements. This is ultimately realized by driving enterprises toward green technological innovation. As such, promoting green technological innovation has become an important objective in environmental tax implementation (Magat, 1979) [61]. Porter’s hypothesis posits that appropriate environmental regulations incentivize technological innovation, offsetting the increased costs of environmental protection and improving firm productivity and profitability (Porter and Linde, 1995) [13]. Earlier still, Weitzman (1978) theorized that using tax instruments more effectively encourages technological innovation more than command-and-control instruments alone [62]. The “double dividend” theory states that environmental taxes force enterprises to save energy and reduce emissions; this also improves production technology, increases production, and increases revenue. Montero (2002) found that taxes provide the best positive incentives for green technology innovation under perfectly competitive markets [63]. By purchasing special water-saving equipment, improving production technology, and optimizing resource allocations, high water-consuming enterprises can flexibly choose countermeasures that improve production efficiency. This may reduce the cost of production water and ultimately slow or offset the pressure on operating costs created by the shift in water resource policy from a fee to a tax (Wang et al., 2023) [57].
Water taxes are an important component of water-use constraints, and they internalize enterprise external costs through price transmission (Larson et al., 1996) [64]. In the new era of water resource fees, high water-consuming enterprises will no longer be able to form a low-cost competitive advantage by seizing water resources at low prices. In addition, the newly designed water resource tax system will form a forcing mechanism by restraining the behavior of economic participants. The steep increase in the cost of water use by high water-consuming enterprises has forced them to change their rough water use and restrain their improper water-use behavior (Marriott et al., 2021) [65]. At the same time, these enterprises have had to increase their investment in green innovation and enhance their green technological innovation level. Ambec and Barla (2002) found that the implementation of a sewage charge policy, although it will increase enterprise costs, will lead enterprises to actively reflect on their own problems in green development [66]; they will also have to formulate corresponding green development strategies and promote the innovation of governance mechanisms (Wang and Wu, 2023) [67]. In addition, the water tax reform makes enterprise costs stickier and gives those enterprises the ability to allocate more idle resources on their own, especially when business volumes are declining (Cannon, 2014) [68]. This forces enterprises to allocate idle resources to green transformation activities. For this reason, China’s water resource tax reform will motivate enterprises to engage in green innovation and also bring the pressure of green innovation to enterprises. On this basis, this paper puts forward the following hypothesis:
Hypothesis 2:
Water tax reform increases green innovation in high water-consuming enterprises.
Green technology innovation is the recombination of green production factors and production and manufacturing conditions, mainly including the innovation and application of energy savings and emission reduction, pollution control and management, recycling, and timely utilization in the field of manufacturing (Cai and Li, 2018) [69]. If an enterprise engages in technological innovation with an environmental bias, this not only can stimulate the enterprise to improve environmental quality but also can promote healthy and sustainable economic development (Song et al., 2020) [70]. Compared to traditional technological innovation, the manifestation of green technological innovation is more intense (Gilli et al., 2014) [71]. Replacing high-polluting production technologies with green production technologies reduces raw material inputs, energy consumption, and pollution emissions; lowers pollution control costs; and improves business performance (Porter and Linde, 1995) [13]. According to the theory of endogenous economic growth, an increase in the level of technological innovation can improve the relevant enterprise production process and methods; optimize the combination of labor, capital, and other production factors; and increase the levels of input and output, thus enhancing enterprise TFP (Klette and Griliches, 2000) [72].
Enterprise green technology innovation is conducive to reducing the consumption of raw materials, improving the efficiency of natural resource utilization, reducing enterprise production costs, and improving the input–output ratio (Carrión-Flores and Innes, 2010) [73]. High water-consuming enterprises that want to maximize profits can reduce water costs by actively developing or adopting new water-saving technologies, accelerating the elimination of outdated water-using processes, equipment, and appliances; increasing the sustainability of water resource use; and improving the reuse rate of water resources. All of these steps will help the enterprise to obtain additional revenues. At the same time, high water-consuming enterprises improve their production efficiency by improving production processes and methods and by optimizing the way they combine production factors. This in turn improves the TFP of high water-consuming enterprises. On this basis, the following hypothesis is proposed:
Hypothesis 3:
Green innovation in high water-consuming enterprises is positively correlated with TFP. That is, green innovation in high water-consuming enterprises helps to improve TFP.
Based on the above theoretical analysis, the theoretical framework of this article is constructed, as shown in Figure 1.
4. Research Design
4.1. Sample Selection
To accurately identify the impact of a water resource tax reform on the green innovation of high water-consuming enterprises, the study sample includes all high water-consuming enterprises in Chinese A-share listed enterprises, from 2007 to 2021. Excluded enterprises include ST and *ST enterprises, as well as enterprises that had unsound financial data and extreme values during the observation period. Finally, financial enterprises and enterprises with gearing ratios greater than 1 were also excluded. Sample data are from the China Stock Market and Accounting Research (CSMAR) database and include a total of 8949 sample observations from 1081 listed enterprises.
According to the Guidelines for the Industry Classification of Listed Companies (revised in 2012), this study selected 21 industries as high water-consuming industries and used industry codes to screen high water-consuming enterprises. These 21 industries include coal mining and washing; oil and gas mining; ferrous metal mining; non-ferrous metal mining; mining auxiliary activities; agro-food processing; food manufacturing; wine, beverage and refined tea manufacturing; textile, textile garments and apparel; leather, fur, feathers, and their products and footwear; paper and paper products; printing and recording media reproduction; petroleum processing; coking and nuclear fuel processing; chemical raw material and chemical products manufacturing; ferrous metal smelting and rolling; non-ferrous metal smelting; rolling and processing; metal products; power and heat production and supply; and gas production and supply. The statistical software used in this article is Stata16.0.
4.2. Variable Measurement
The water tax reform is a dummy variable (denoted by TT), where TTit = Treatedi × Timet. The term Treatedi is a policy group dummy variable and has a value of 1 if the province where the firm is located has implemented the water tax reform, and 0 if it has not. The term Timet is a time dummy variable. Based on timing and sequential differences in the water resource tax reform, this variable has a value of 1 in the year of the reform pilot and later; otherwise, it is 0. Hebei Province was the first to start the water resource tax reform pilot on 1 July 2016. In 2017, the pilot scope of the reform was expanded to nine provinces: Beijing, Tianjin, Shanxi, Inner Mongolia, Shandong, Henan, Sichuan, Shaanxi, and Ningxia.
An enterprise’s green innovation level (denoted by GI) is represented by the number of its patent applications. Patents, as a standard for measuring a company’s technological innovation capability, have been widely recognized by the academic community. They reflect an enterprise’s innovation capability in terms of new materials, processes, and technologies (Fleming and Sorenson, 2004) [74]. Green patents can intuitively reflect the output capacity of green innovation, and patent authorization is related to various factors, such as approval time. This makes measuring the impact of institutional shocks on corporate green innovation behavior quite difficult. Patent applications are more stable, reliable, and timely than patent authorizations (Wurlod and Noailly, 2018) [75]. The data on green invention patents come from the CNRDS (Chinese National Research Data Services) platform database. The data calculation steps are as follows: Firstly, this study downloaded and organized the list of listed enterprises and their subsidiaries through the annual reports of the Shenzhen and Shanghai Stock Exchanges in China, and data were collected based on the summary list. Secondly, enterprise patent information was obtained through the official website of the China National Intellectual Property Administration, mainly involving patent applicants, application time, and IPC classification number. Finally, based on the IPC codes listed in the International Patent Classification green list, the number of green invention patent applications of the sample companies were manually identified. Based on Wurlod and Noailly (2018) [75] and Liu et al. (2023) [76], this study used the natural logarithm of the number of green invention patents filed by enterprises plus 1 to measure the green innovation level of enterprises.
The TFP of enterprises (denoted by TFP_LP) was determined using the LP method (Levinsohn and Petrin, 2003) [77]. The specific processing was as follows: Based on the Cobb–Douglas production function, the intermediate input variables were added to estimate TFP. The specific Model (1-1) was as follows: . In this expression, is the total output, with the operating income of the sample firms used as the proxy variable; denotes capital inputs, with the net fixed assets serving as the proxy variable; denotes labor inputs, with the number of firm employees used as the proxy variable; denotes intermediate inputs, with the sum of operating costs, selling expenses, administrative expenses, and financial expenses, minus the balance of depreciation and amortization versus cash payments made to and for employees as the proxy variable, and denotes the TFP (TFP_LP). The LP method makes three basic assumptions. Firstly, assuming that the TFP of an enterprise follows an exogenous first-order Markov process, Model (1-2) can be obtained: (1-2). Secondly, the influencing factors of intermediate input variables are limited to capital and technology, i.e., (1-3). Thirdly, the assumption was made that, when capital investment remains constant, the intermediate input variable increases in line with the increase in TFP, and the two are monotonically increasing functions, i.e., (1-4). Substituting Models (1-2), (1-3), and (1-4) into Model (1-1) yields Model (1-5), which is (1-5). Once Model (1-5) is estimated, all coefficients in the production function will be successfully estimated. Using this result, one can fit Equation (1-5) to obtain the logarithmic value of the residuals, which is also the logarithmic value of TFP.
Green innovation requires a large amount of capital investment (Gramkow and Anger-Kraavi, 2018) [78], and enterprises with strong profitability can provide sufficient financial flow for green innovation. The higher the growth potential of an enterprise is, the more funds and resources that enterprise will allocate to expanding production scale and marketing, which squeezes out investment in innovation (Filson and Lewis, 2000) [79]. The higher the financial leverage of an enterprise is, the more that enterprise will increase the availability of funds and have a positive impact on technological innovation (Amore et al., 2013) [80]. Independent directors can better fulfill their regulatory functions through their professional competence and have an impact on the innovation output of the enterprise (Francis and Smith, 1995) [81]. Expanding the size of the board of directors can promote corporate innovation, as increasing the number of directors can enrich the decision-making level of the enterprise. This enables the enterprise to make more comprehensive and thoughtful innovation decisions, thereby improving the innovation performance of the enterprise (Cleyn and Braet, 2012) [82]. Unlike the free-riding behavior of small and medium-sized shareholders, major shareholders often actively participate in corporate governance, due to their high shareholding ratio and large market value. Belloc (2013) confirmed that major shareholders can influence corporate innovation through “hand voting” and “foot voting” [83]. A general manager concurrently serving as the chairman will expand the power of the management, which will lead to the weakening of the supervisory function of the board of directors. Zahra et al. (2000) argued that job separation contributes to rational decision making in enterprises and is significantly positively correlated with research and development expenditures [84]. Raising the annual salary of executives can enhance their risk-taking ability and further stimulate their willingness to innovate (Coles et al., 2006) [85]. Implementing equity and salary incentives for executives can encourage them to view business development from a long-term perspective, thereby further enhancing their willingness to innovate (Miller et al., 2007) [86]. The deep evolution of digital technology has had a great impact on the productivity growth of enterprises (Yoo et al., 2010) [87]. Driven by digital transformation, enterprises have achieved “cost reduction” and “strong innovation” by constructing different data management systems, improving production efficiency (Mikalef and Pateli, 2017) [88]. Financial subsidies and tax incentives have a positive impact on corporate innovation, a finding which has been extensively validated (Bronzini et al., 2016; Lokshin and Mohnen, 2012) [89,90].
Based on the above considerations, green innovation in enterprises is not only influenced by the water resource tax reform but also by profitability, growth, financial leverage, board governance, major shareholder governance, manager incentives, market competition, technology spillover, and fiscal policies. Therefore, these variables were used as control variables.
See Table 1 for specific variable definitions and descriptions.
4.3. Model Setup
Model (1) was constructed to test Hypothesis 1. The explained variable is enterprise TFP, and the explanatory variable is the water resource tax reform. Based on Hypothesis 1, it is expected that the regression coefficient of the water resource tax reform is significantly positive; such a result indicates that the water resource tax reform effectively enhances enterprise TFP.
Model (2) was constructed to test Hypothesis 2. The explanatory variable is corporate green innovation, and the explained variable is the water tax reform. According to Hypothesis 2, the regression coefficient of β1 in Equation (2) is expected to be significantly positive, which indicates that the water tax reform will significantly promote corporate green innovation.
Model (3) was constructed to test Hypothesis 3. The explanatory variable is enterprise TFP, and the explained variable is enterprise green innovation. According to Hypothesis 3, it is expected that the regression coefficient of γ1 in Equation (3) is significantly positive, which indicates that enterprise green innovation will significantly enhance total factor productivity.
5. Empirical Results and Analysis
5.1. Descriptive Statistics and Pearson Correlation Analysis
Table 2 shows the descriptive statistics of the main variables. In Table 2, the mean of TFP_LP is 10.9894; the median is 10.8418, and the standard deviation is 1.2855. This indicates that there are relatively small individual differences in the TFP of high water-consuming enterprises. The mean of GI is 0.2082; the median is 0, and the standard deviation is 0.5843. This indicates that there are large individual differences in the green innovation of high water-consuming enterprises, and most sampled enterprises do not have patents for green inventions. The mean value of TT is 0.1406, indicating that about 14.06% of the sample data were from the year of the water resource tax implementation and the year after.
Table 3 shows the Pearson correlation analysis. In Table 3, the correlation coefficient between GI and TFP_LP is 0.3779, which is significant at a 1% level. This indicates that green innovation significantly improves enterprise TFP. The correlation coefficient between TT and TFP_LP is 0.1292, which is significant at a 1% level. This indicates that the water resource tax reform improves enterprise TFP. The correlation coefficient between TT and GI is 0.1051, which is significant at a 1% level. This indicates that the water resource tax reform increases the relevant enterprise green innovation level. The Pearson correlation coefficients of all variables are less than 0.8, indicating that the possibility of covariance is small when later analyzing linear regression.
5.2. Benchmark Regression Analysis
Table 4 shows the baseline regression analysis. First, Model (1) was used to assess the impact of the water resource tax reform on enterprise TFP. The regression coefficient of the water resource tax reform is 0.1147, with a t-value of 4.49, which is significant at a 1% level. This indicates that the water resource tax reform significantly increases enterprise TFP. That is, Hypothesis 1 was tested.
Second, Model (2) was used to assess the impact of the water resource tax reform on enterprise green innovation. The regression coefficient of the water resource tax reform is 0.1029, with a t-value of 5.73, which is significant at a 1% level. This indicates that China’s water resource tax reform significantly improves the level of enterprise green innovation. That is, Hypothesis 2 was tested.
Finally, Model (3) was used to assess the impact of green innovation on enterprise TFP. The results show that the regression coefficient of enterprise green innovation is 0.3547, with a t-value of 24.29. That is, Hypothesis 3 was tested.
5.3. Robustness Tests
Robustness tests were performed to assess the robustness of the study results.
5.3.1. Fixed Effects Model
Given possible endogeneity problems, this paper applied a panel fixed effects model to empirically test the relationship among the water resource tax reform, green innovation, and enterprise TFP. Table 5 shows the results of the test using the fixed effects model. This is consistent with the results of the benchmark regression.
5.3.2. Substitution of Key Variables
Table 6 shows the test results when replacing the key variables. Based on Liu et al. (2023) [76], the natural logarithm of the total number of an enterprise’s green patent applications plus 1 was used to measure the enterprise’s green innovation level, denoted by GI′. Green patents include green utility model patents and green invention patents. When using the LP method (Levinsohn and Petrin, 2003) [77], the GMM model was used to calculate the enterprise’s TFP during the linearization of the Cobb–Douglas production function. The regression results in Table 6, including the tests replacing the explained variables or the explanatory variables, and re-testing Models (1), (2), and (3), indicate that the water tax reform has a positive contribution to green innovation and the enterprise’s TFP, while green innovation of enterprises has a positive contribution to the enterprise’s TFP.
5.3.3. PSM-DID Model
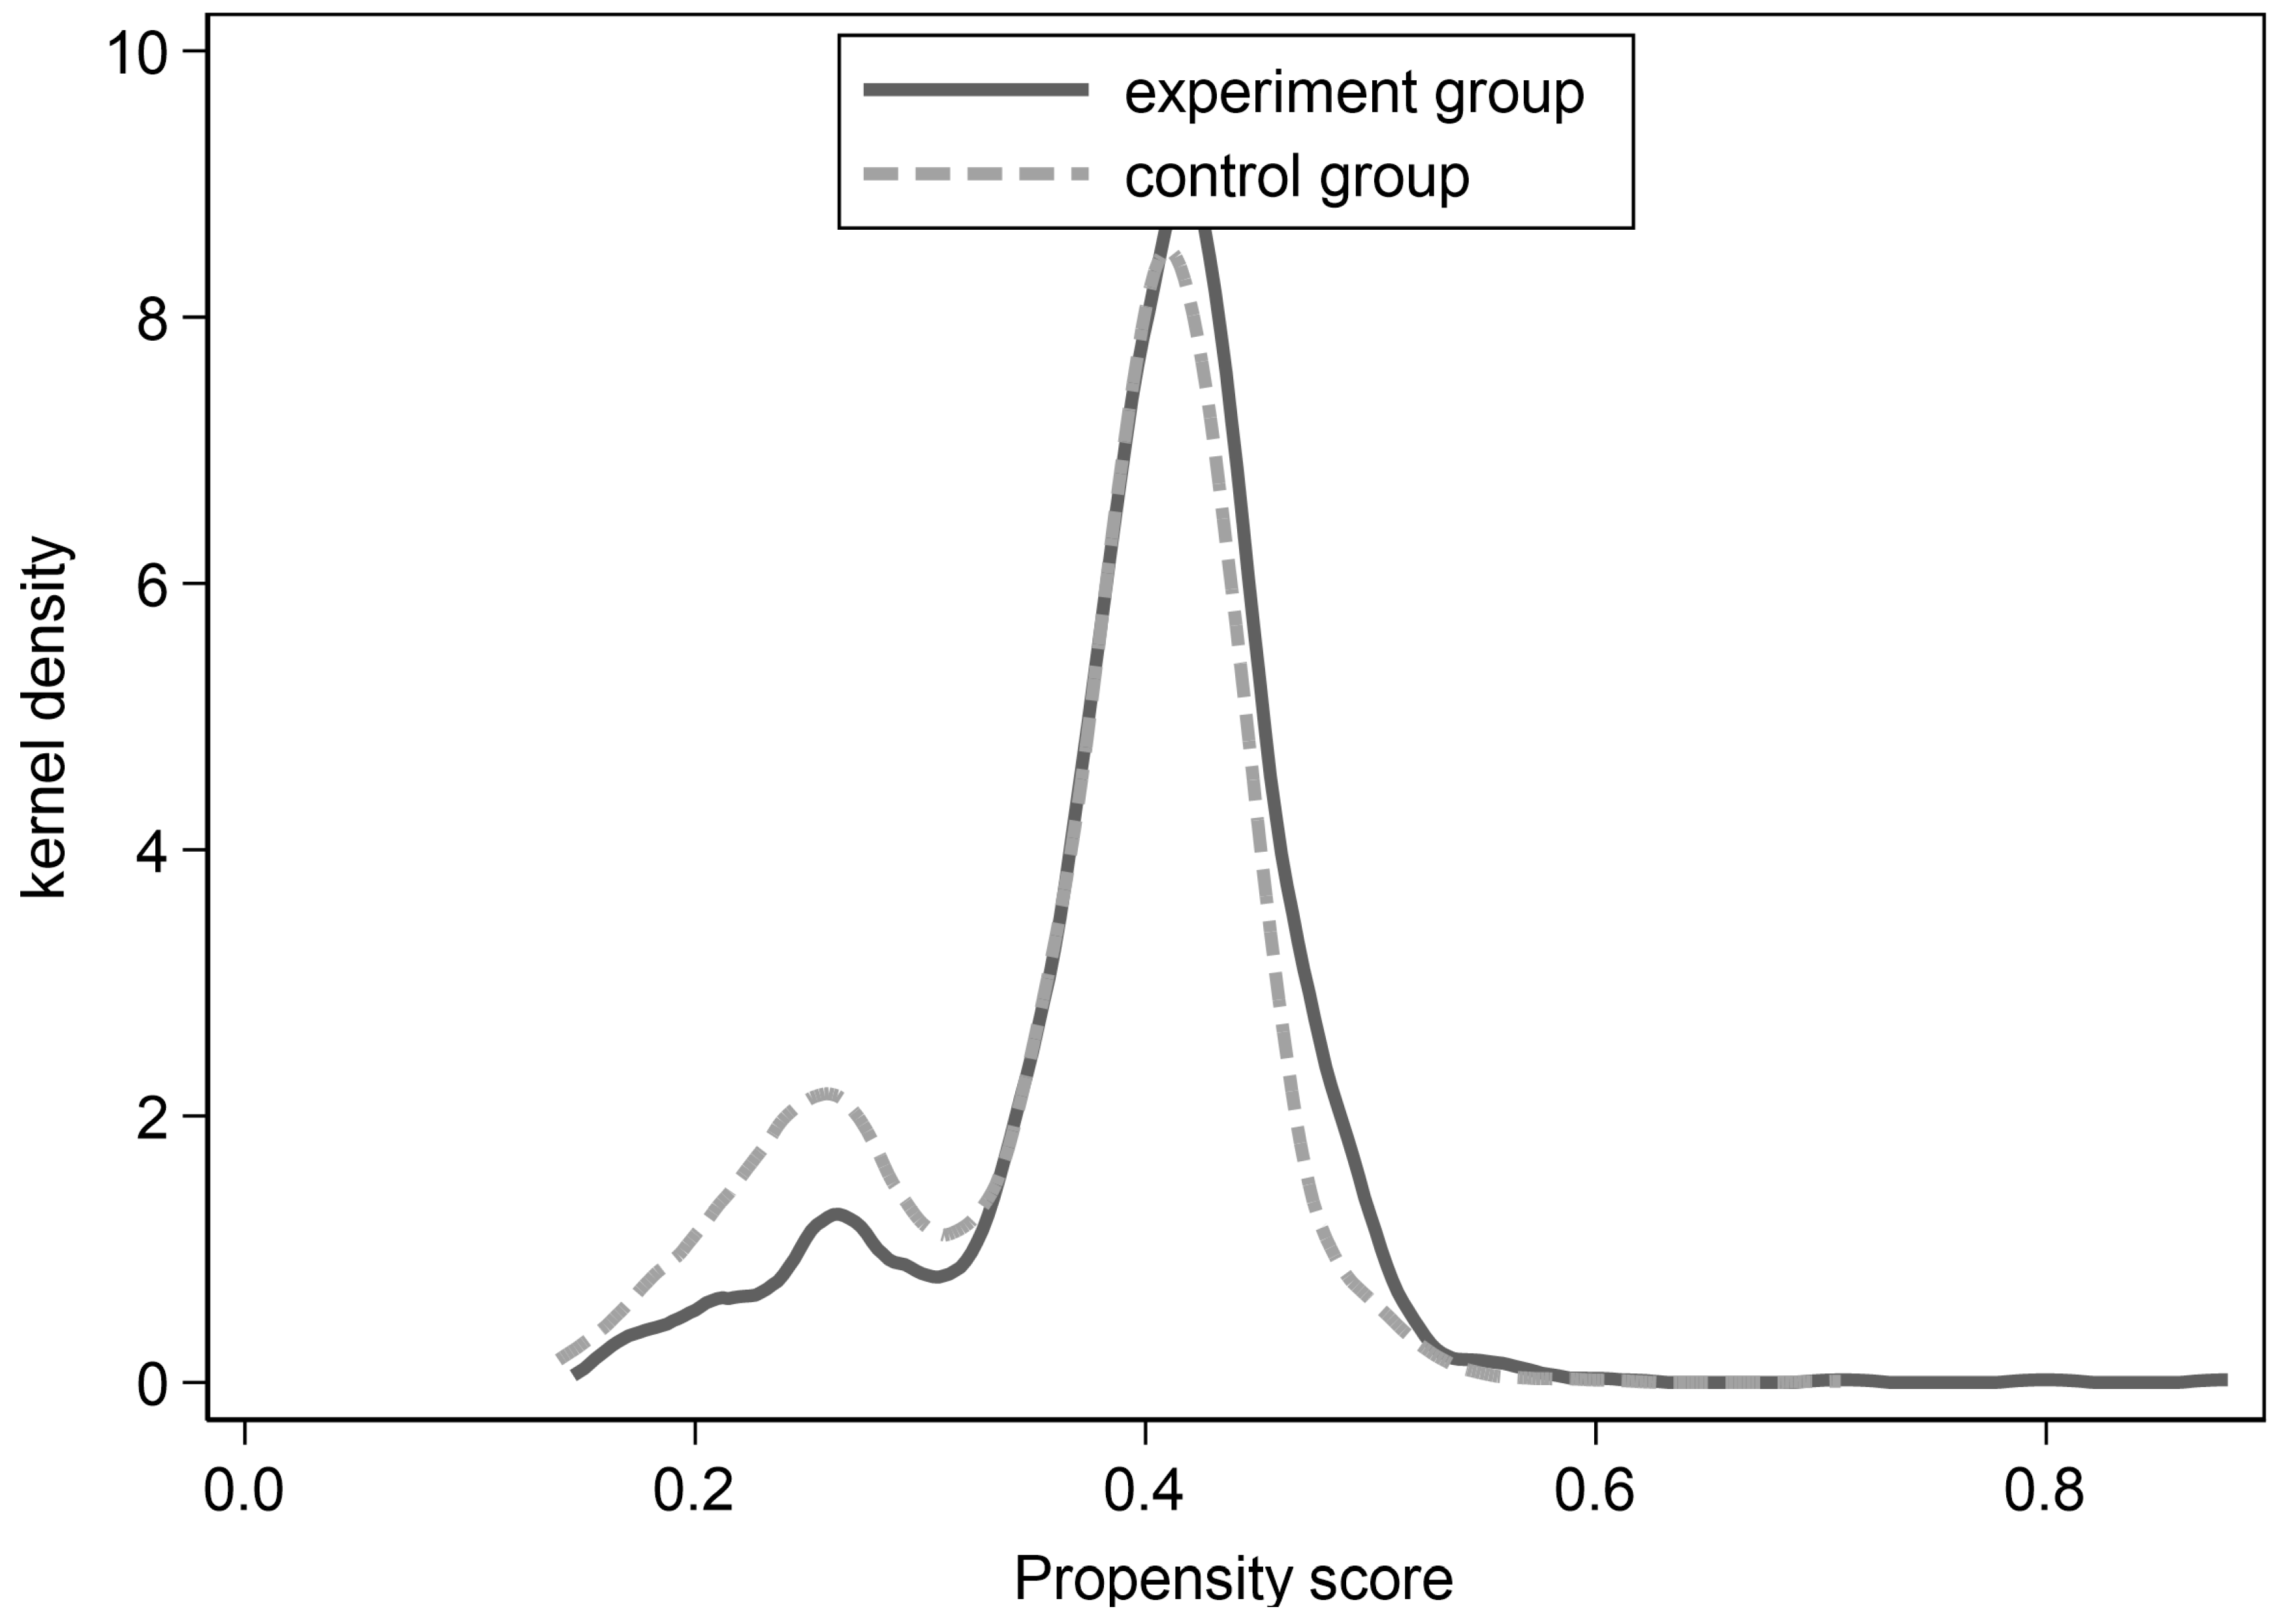
To mitigate the systematic differences in the trend of changes in the water resource tax reform and other tax reforms and to reduce the estimation bias of the double-difference method, this study further applied the PSM-DID method to conduct a robustness test. In the specific estimation, this study used the kernel matching method for estimation to test the robustness of the role of the water tax reform in promoting green innovation and enhancing enterprise-level TFP. Figure 2 shows the density function plot of the propensity score value. Before estimation, the study also assessed the match between the experimental group and the control group. This was performed by drawing the density function plot of the propensity score value. The resulting matching is relatively close, indicating that the matching effect of this paper is very good. Thus, the feasibility and rationalization of the PSM-DID approach is further demonstrated, based on the common support assumptions.
Table 7 shows the PSM-DID model test results and indicates that, after applying the PSM-DID method, China’s water tax reform still significantly increased the number of green invention patents of enterprises (by 9.1%) and improved enterprise TFP (by 18.2%). The results of the PSM-DID estimation do not significantly differ from the double-difference results in the previous section.
5.4. Intrinsic Mechanism of Action Test
According to the above theoretical analysis and empirical test, the water resource tax reform significantly promotes enterprise green innovation and enhances TFP, while enterprise green innovation significantly enhances TFP. Based on the principle underlying the mediation effect test (Baron and Kenny, 1986) [91], the relationship between the water tax reform, corporate green innovation, and TFP was tested using the Sobel method. Table 8 shows the results of the Sobel test. Among them, Path c is the regression result of China’s water resource tax reform on enterprise TFP; Path a is the regression result of the water resource tax reform on enterprise green innovation, and paths b and c’ are the regression results of the water resource tax reform and enterprise green innovation, respectively, on enterprise TFP. In Table 8, the path test value shows that enterprise green innovation has a significant partial mediating effect between the water resource tax reform and enterprise TFP.
5.5. Heterogeneity Analysis
Considering the special nature of enterprise property rights in China, enterprises are divided into two groups: state-owned enterprises (SOEs) and non-state-owned enterprises (non-SOEs), based on the ultimate economic controller of the enterprise. Table 9 shows the regression results when comparing the two sets of enterprises. For the SOE sample, the Model (1) test results indicate that the regression coefficient of TT is not significantly positive. The Model (2) test results also show the regression coefficient of TT is significantly positive. The test results for Model (3) indicate that the regression coefficient of GI is significantly positive. In the non-SOE sample, the test results of Models (1) and (2) indicate that the regression coefficients of TT are significantly positive. The test results of Model (3) indicate that the regression coefficients of GI are significantly positive. Whether in SOEs or non-SOEs, the water tax reform plays a significant role in promoting green innovation in enterprises, and green innovation in enterprises also plays a significant role in promoting TFP. However, the contribution of the water tax reform to TFP is significant only in non-SOEs, compared to SOEs.
The contribution of the water tax reform to enterprise TFP is not significant in SOEs, probably because SOEs are less sensitive to the water tax. SOEs naturally have good government-enterprise relations, have easier access to policy information, and are able to withstand a higher water tax levy.
6. Conclusions
Strengthening the constraints on water resources is important for modernizing a harmonious coexistence between human beings and nature. This paper analyzes the opportunities offered by the pilot implementation of a policy shift from a water resource fee to a tax. This study focuses on the role of the water resource tax reform in strengthening the constraints of a water resource tax, forcing enterprises to move toward green innovation and enhancing the intrinsic mechanisms involved in productivity. The double-difference method was used to explore the relationship among the water resource tax reform, enterprise green innovation, and total factor productivity (TFP). The study finds that shifting water resource reforms from a fee to a tax significantly increases the green innovation level and TFP of enterprises. Green innovation has a significant partial mediating role between the water tax reform and TFP. Green innovation also enhances enterprise TFP. Further differentiating the sample with respect to firm property rights shows that the economic effects of the water tax reform are larger for non-state-owned firms than state-owned firms. This study provides empirical evidence for expanding the scope of the pilot water resource tax reform.
This study’s findings lead to the following recommendations. On the one hand, it is important to accelerate the reform of the water resource tax and optimize the system of paid water resource use. There is currently a significant contradiction between the supply and demand of water resources, highlighting the need for an intervention strategy that is market-oriented and government-supplemented. It is also important to maximize the decisive role of the market price mechanism and to rely on the water resource tax reform to promote water resource intensification and water resource conservation. It is also vitally important to maximize the information advantage of local governments and to rationalize the formulation of the water resource tax rate. The goal should be to effectively constrain enterprise water-use behavior, while avoiding an excessive crowding effect on the focal production and business activities of the enterprise. These actions should promote industrial transformation and upgrading.
On the other hand, enterprises are encouraged to engage in green technological innovation and to continuously improve their green innovation level. Green transformation and development have become consensus approaches in the international community. This represents a shared global response to the climate change crisis, environmental pollution, and ecological damage and creates major opportunities for future economic and societal development. The key to enterprise green transformation is to rely on technological innovation to improve efficiency. Enterprises can use technological innovation to improve resource utilization rates, drive development toward the two ends of the “smile curve”, and transform technology-intensive and high-value-added industries. These actions promote green enterprise development and optimize industrial structures.
Author Contributions
Conceptualization and writing—original draft preparation, C.X.; data curation and analysis, Y.G.; writing—reviewing, W.H.; editing, B.F. All authors have read and agreed to the published version of the manuscript.
Funding
This work was supported by the research and innovation team project of Hubei University of Science and Technology (2023T12).
Data Availability Statement
Data are contained within the article.
Conflicts of Interest
The authors declare that the research was conducted in the absence of any commercial or financial relationships that could be construed as a potential conflict of interest.
References
- Yao, P.; Li, J. Determining industry by water: Fee to tax of water resources and industrial transformation and upgrading. Stat. Res. 2023, 40, 135–148. [Google Scholar]
- Lv, Y.; Ge, Y.; Geng, Y. Has the water resource tax reform improved the green efficiency of water resource? J. Arid Land Resour. Environ. 2022, 36, 77–83. [Google Scholar]
- Huang, B. An exhaustible resources model in a dynamic input–output framework: A possible reconciliation between Ricardo and Hotelling. J. Econ. Struct. 2018, 7, 8. [Google Scholar]
- Ing, J. Adverse selection, commitment and exhaustible resource taxation. Resour. Energy Econ. 2020, 61, 101161. [Google Scholar]
- Welsch, H. Resource dependence, knowledge creation, and growth: Revisiting the natural resource curse. J. Econ. Dev. 2008, 33, 45–70. [Google Scholar] [CrossRef]
- Liu, H.; Ruebeck, C.S. Knowledge spillover and positive environmental externality in agricultural decision making under performance-based payment programs. Agric. Resour. Econ. Rev. 2020, 49, 270–290. [Google Scholar] [CrossRef]
- Thomas, A.; Zaporozhets, V. Bargaining over environmental budgets: A political economy model with application to French water policy. Environ. Resour. Econ. 2017, 68, 227–248. [Google Scholar]
- Höglund, L. Household demand for water in Sweden with implications of a potential tax on water use. Water Resour. Res. 1999, 35, 3853–3863. [Google Scholar] [CrossRef]
- Clinch, J.P.; Dunne, L.; Dresner, S. Environmental and wider implications of political impediments to environmental tax reform. Energy Policy 2006, 34, 960–970. [Google Scholar]
- Berbel, J.; Borrego-Marin, M.M.; Exposito, A.; Giannoccaro, G.; Montilla-Lopez, N.M.; Roseta-Palma, C. Analysis of irrigation water tariffs and taxes in Europe. Water Policy 2019, 21, 806–825. [Google Scholar] [CrossRef]
- van Heerden, J.H.; Blignaut, J.; Horridge, M. Integrated water and economic modelling of the impacts of water market instruments on the South African economy. Ecol. Econ. 2008, 66, 105–116. [Google Scholar] [CrossRef]
- Porcher, S. The ‘hidden costs’ of water provision: New evidence from the relationship between contracting-out and price in French water public services. Util. Policy 2017, 48, 166–175. [Google Scholar]
- Porter, M.E.; Linde, C. Toward a new conception of the environment-competitiveness relationship. J. Econ. Perspect. 1995, 9, 97–118. [Google Scholar] [CrossRef]
- Fan, T. Research on the reform and perfection of resource Tax system. Open J. Soc. Sci. 2021, 9, 107943. [Google Scholar] [CrossRef]
- Jia, Z.; Lin, B. CEEEA2. 0 model: A dynamic CGE model for energy-environment-economy analysis with available data and code. Energy Econ. 2022, 112, 106117. [Google Scholar] [CrossRef]
- Chen, X.; Yi, N.; Zhang, L.; Li, D. Does institutional pressure foster corporate green innovation? Evidence from China’s top 100 companies. J. Clean. Prod. 2018, 188, 304–311. [Google Scholar] [CrossRef]
- Ambec, S.; Cohen, M.A.; Elgie, S.; Lanoie, P. The Porter hypothesis at 20: Can environmental regulation enhance innovation and competitiveness? Rev. Environ. Econ. Policy 2013, 7, 2–22. [Google Scholar] [CrossRef]
- Mikhno, I.; Koval, V.; Shvets, G.; Garmatiuk, O.; Tamošiūnienė, R. Green economy in sustainable development and improvement of resource efficiency. Cent. Eur. Bus. Rev. 2021, 10, 99–113. [Google Scholar] [CrossRef]
- Munguía-López, A.C.; González-Bravo, R.; Ponce-Ortega, J.M. Evaluation of carbon and water policies in the optimization of water distribution networks involving power-desalination plants. Appl. Energy 2019, 236, 927–936. [Google Scholar]
- Ouyang, R.; Mu, E.; Yu, Y.; Chen, Y.; Hu, J.; Tong, H.; Cheng, Z. Assessing the effectiveness and function of the water resources tax policy pilot in China. Environ. Dev. Sustain. 2022, 9, 1–17. [Google Scholar] [CrossRef]
- Biancardi, M.; Maddalena, L.; Villani, G. Water taxes and fines imposed on legal and illegal firms exploiting groundwater. Discret. Contin. Dyn. Syst.-Ser. B 2021, 26, 5787–5806. [Google Scholar]
- Guo, J.; Chen, Z.; Nie, P. Discussion of the tax scheme for cleaner water use. Water Conserv. Sci. Eng. 2022, 7, 475–490. [Google Scholar] [CrossRef]
- Chen, Y.; Li, J.; Lu, H.; Yang, Y. Impact of unconventional natural gas development on regional water resources and market supply in China from the perspective of game analysis. Energy Policy 2020, 145, 111750. [Google Scholar] [CrossRef]
- Oltra, V.; Saint Jean, M. Sectoral systems of environmental innovation: An application to the French automotive industry. Technol. Forecast. Soc. Chang. 2009, 76, 567–583. [Google Scholar] [CrossRef]
- Vasileiou, E.; Georgantzis, N.; Attanasi, G.; Llerena, P. Green innovation and financial performance: A study on Italian firms. Res. Policy 2022, 51, 104530. [Google Scholar]
- Frondel, M.; Horbach, J.; Rennings, K. What triggers environmental management and innovation? Empirical evidence for Germany. Ecol. Econ. 2008, 66, 153–160. [Google Scholar] [CrossRef]
- Horbach, J. Determinants of environmental innovation—New evidence from German panel data sources. Res. Policy 2008, 37, 163–173. [Google Scholar] [CrossRef]
- Borsatto, J.M.L.S.; Bazani, C.L. Green innovation and environmental regulations: A systematic review of international academic works. Environ. Sci. Pollut. Res. 2021, 28, 63751–63768. [Google Scholar] [CrossRef]
- Stucki, T. Which firms benefit from investments in green energy technologies?–The effect of energy costs. Res. Policy 2019, 48, 546–555. [Google Scholar] [CrossRef]
- Fernando, Y.; Tseng, M.-L.; Sroufe, R.; Abideen, A.Z.; Shaharudin, M.S.; Jose, R. Eco-innovation impacts on recycled product performance and competitiveness: Malaysian automotive industry. Sustain. Prod. Consum. 2021, 28, 1677–1686. [Google Scholar]
- Zhang, Y.; Zhang, J.; Cheng, Z. Stock market liberalization and corporate green innovation: Evidence from China. Int. J. Environ. Res. Public Health 2021, 18, 3412. [Google Scholar] [PubMed]
- Segarra-Ona MD, V.; Peiró-Signes, A.; Verma, R.; Miret-Pastor, L. Does environmental certification help the economic performance of hotels? Evidence from the Spanish hotel industry. Cornell Hosp. Q. 2012, 53, 242–256. [Google Scholar] [CrossRef]
- Sáez-Martínez, F.J.; Díaz-García, C.; Gonzalez-Moreno, A. Firm technological trajectory as a driver of eco-innovation in young small and medium-sized enterprises. J. Clean. Prod. 2016, 138, 28–37. [Google Scholar] [CrossRef]
- Keskin, D.; Diehl, J.C.; Molenaar, N. Innovation process of new ventures driven by sustainability. J. Clean. Prod. 2013, 45, 50–60. [Google Scholar] [CrossRef]
- Ogbeibu, S.; Emelifeonwu, J.; Senadjki, A.; Gaskin, J.; Kaivo-Oja, J. Technological turbulence and greening of team creativity, product innovation, and human resource management: Implications for sustainability. J. Clean. Prod. 2020, 244, 118703. [Google Scholar]
- Scarpellini, S.; Marín-Vinuesa, L.M.; Portillo-Tarragona, P.; Moneva, J.M. Defining and measuring different dimensions of financial resources for business eco-innovation and the influence of the firms’ capabilities. J. Clean. Prod. 2018, 204, 258–269. [Google Scholar] [CrossRef]
- da Cunha Bezerra, M.C.; Gohr, C.F.; Morioka, S.N. Organizational capabilities towards corporate sustainability benefits: A systematic literature review and an integrative framework proposal. J. Clean. Prod. 2020, 247, 119114. [Google Scholar] [CrossRef]
- Shahzad, M.; Qu, Y.; Zafar, A.U.; Rehman, S.U.; Islam, T. Exploring the influence of knowledge management process on corporate sustainable performance through green innovation. J. Knowl. Manag. 2020, 24, 2079–2106. [Google Scholar] [CrossRef]
- Triguero, A.; Moreno-Mondéjar, L.; Davia, M.A. Drivers of different types of eco-innovation in European SMEs. Ecol. Econ. 2013, 92, 25–33. [Google Scholar] [CrossRef]
- Wang, C.L.; Ahmed, P.K. Dynamic capabilities: A review and research agenda. Int. J. Manag. Rev. 2007, 9, 31–51. [Google Scholar] [CrossRef]
- Lončar, D.; Paunković, J.; Jovanović, V.; Krstić, V. Environmental and social responsibility of companies cross EU countries–Panel data analysis. Sci. Total Environ. 2019, 657, 287–296. [Google Scholar] [CrossRef] [PubMed]
- Sumrin, S.; Gupta, S.; Asaad, Y.; Wang, Y.; Bhattacharya, S.; Foroudi, P. Eco-innovation for environment and waste prevention. J. Bus. Res. 2021, 122, 627–639. [Google Scholar] [CrossRef]
- Arena, C.; Michelon, G.; Trojanowski, G. Big egos can be green: A study of CEO hubris and environmental innovation. Br. J. Manag. 2018, 29, 316–336. [Google Scholar]
- Zhang, Z.; Yang, L.; Peng, X.; Liao, Z. Overseas imprints reflected at home: Returnee CEOs and corporate green innovation. Asian Bus. Manag. 2023, 22, 1328–1368. [Google Scholar]
- Papagiannakis, G.; Voudouris, I.; Lioukas, S.; Kassinis, G. Environmental management systems and environmental product innovation: The role of stakeholder engagement. Bus. Strategy Environ. 2019, 28, 939–950. [Google Scholar] [CrossRef]
- Bernard, A.B.; Moxnes, A.; Saito, Y.U. Production networks, geography, and firm performance. J. Political Econ. 2019, 127, 639–688. [Google Scholar]
- Aghion, P.; Cai, J.; Dewatripont, M.; Du, L.; Harrison, A.; Legros, P. Industrial policy and competition. Am. Econ. J. Macroecon. 2015, 7, 1–32. [Google Scholar]
- Kiyota, K.; Okazaki, T. Industrial policy cuts two ways: Evidence from cotton-spinning firms in Japan, 1956–1964. J. Law Econ. 2010, 53, 587–609. [Google Scholar] [CrossRef]
- Arizala, F.; Cavallo, E.; Galindo, A. Financial development and TFP growth: Cross-country and industry-level evidence. Appl. Financ. Econ. 2013, 23, 433–448. [Google Scholar] [CrossRef]
- Méon, P.G.; Weill, L. Does financial intermediation matter for macroeconomic performance? Econ. Model. 2010, 27, 296–303. [Google Scholar] [CrossRef]
- Caggese, A. Financing constraints, radical versus incremental innovation, and aggregate productivity. Am. Econ. J. Macroecon. 2019, 11, 275–309. [Google Scholar] [CrossRef]
- Habib, M.; Abbas, J.; Noman, R. Are human capital, intellectual property rights, and research and development expenditures really important for total factor productivity? An empirical analysis. Int. J. Soc. Econ. 2019, 46, 756–774. [Google Scholar] [CrossRef]
- Bennett, B.; Stulz, R.; Wang, Z. Does the stock market make firms more productive? J. Financ. Econ. 2020, 136, 281–306. [Google Scholar] [CrossRef]
- Hsieh, C.T.; Klenow, P.J. Misallocation and manufacturing TFP in China and India. Q. J. Econ. 2009, 124, 1403–1448. [Google Scholar] [CrossRef]
- Tian, G.Y.; Twite, G. Corporate governance, external market discipline and firm productivity. J. Corp. Financ. 2011, 17, 403–417. [Google Scholar] [CrossRef]
- Ahamed, M.M.; Luintel, K.B.; Mallick, S.K. Does local knowledge spillover matter for firm productivity? The role of financial access and corporate governance. Res. Policy 2023, 52, 104837. [Google Scholar] [CrossRef]
- Wang, H.; Yang, G.; Ouyang, X.; Tand, Z.; Long, X.; Yue, Z. Horizontal ecological compensation mechanism and technological progress: Theory and empirical study of Xin’an River Ecological Compensation Gambling Agreement. J. Environ. Plan. Manag. 2023, 66, 501–523. [Google Scholar]
- Hancevic, P.I. Environmental regulation and productivity: The case of electricity generation under the CAAA-1990. Energy Econ. 2016, 60, 131–143. [Google Scholar]
- Gray, W.B.; Shadbegian, R.; Wolverton, A. Environmental regulation and labor demand: What does the evidence tell us? Annu. Rev. Resour. Econ. 2023, 15, 177–197. [Google Scholar] [CrossRef]
- de Medeiros, J.F.; Vidor, G.; Ribeiro, J.L.D. Driving factors for the success of the green innovation market: A relationship system proposal. J. Bus. Ethics 2018, 147, 327–341. [Google Scholar]
- Magat, W.A. The effects of environmental regulation on innovation. Law Contemp. Probl. 1979, 43, 4–25. [Google Scholar]
- Weitzman, M.L. Optimal rewards for economic regulation. Am. Econ. Rev. 1978, 68, 683–691. [Google Scholar]
- Montero, J.P. Market structure and environmental innovation. J. Appl. Econ. 2002, 5, 293–325. [Google Scholar]
- Larson, D.M.; Helfand, G.E.; and House, B.W. Second-best tax policies to reduce nonpoint source pollution. Am. J. Agric. Econ. 1996, 78, 1108–1117. [Google Scholar] [CrossRef]
- Marriott, L.; Kraal, D.; and Singh-Ladhar, J. Tax as a solution for irrigation water scarcity, quality and sustainability: Case studies in Australia and New Zealand. Aust. Tax Forum 2021, 36, 369–402. [Google Scholar]
- Ambec, S.; Barla, P. A Theoretical foundation of the Porter hypothesis. Econ. Lett. 2002, 75, 355–360. [Google Scholar]
- Wang, K.; Wu, Y. Research on the promoting effect of green tax system on total factor productivity of rare earth enterprises—Empirical analysis based on resource tax reform. Price Theory Pract. 2023, 3, 116–119. [Google Scholar]
- Cannon, J.N. Determinants of ‘sticky costs’: An analysis of cost behavior using United States air transportation industry data. Account. Rev. 2014, 89, 1645–1672. [Google Scholar] [CrossRef]
- Cai, W.; Li, G. The drivers of eco-innovation and its impact on performance: Evidence from China. J. Clean. Prod. 2018, 176, 110–118. [Google Scholar] [CrossRef]
- Song, M.; Wang, S.; Zhang, H. Could environmental regulation and R&D tax incentives affect green product innovation? J. Clean. Prod. 2020, 258, 120849. [Google Scholar]
- Gilli, M.; Mancinelli, S.; Mazzanti, M. Innovation complementarity and environ-mental productivity effects: Reality or delusion? Evidence from the EU. Ecol. Econ. 2014, 103, 56–67. [Google Scholar] [CrossRef]
- Klette, T.J.; Griliches, Z. Empirical patterns of firm growth and R&D investment: A quality ladder model interpretation. Econ. J. 2000, 110, 363–387. [Google Scholar]
- Carrión-Flores, C.E.; Innes, R. Environmental innovation and environmental performance. J. Environ. Econ. Manag. 2010, 59, 27–42. [Google Scholar] [CrossRef]
- Fleming, L.; Sorenson, O. Science as a map in technological search. Strateg. Manag. J. 2004, 25, 909–928. [Google Scholar] [CrossRef]
- Wurlod, J.D.; Noailly, J. The impact of green innovation on energy intensity: An empirical analysis for 14 industrial sectors in OECD countries. Energy Econ. 2018, 71, 47–61. [Google Scholar] [CrossRef]
- Liu, B.; Cifuentes-Faura, J.; Ding, C.J.; Liu, X. Toward carbon neutrality: How will environmental regulatory policies affect corporate green innovation? Econ. Anal. Policy 2023, 80, 1006–1020. [Google Scholar] [CrossRef]
- Levinsohn, J.; Petrin, A. Estimating production functions using inputs to control for unobservables. Rev. Econ. Stud. 2003, 70, 317–341. [Google Scholar]
- Gramkow, C.; Anger-Kraavi, A. Could fiscal policies induce green innovation in developing countries? The case of Brazilian manufacturing sectors. Clim. Policy 2018, 18, 246–257. [Google Scholar] [CrossRef]
- Filson, A.; Lewis, A. Innovation from a small company perspective-an empirical investigation of new product development strategies in SMEs. In Proceedings of the 2000 IEEE Engineering Management Society, EMS-2000 (Cat. No. 00CH37139), Albuquerque, NM, USA, 15 August 2000; IEEE: Piscataway, NJ, USA, 2000; pp. 141–146. [Google Scholar]
- Amore, M.D.; Schneider, C.; Žaldokas, A. Credit supply and corporate innovation. J. Financ. Econ. 2013, 109, 835–855. [Google Scholar]
- Francis, J.; Smith, A. Agency costs and innovation some empirical evidence. J. Account. Econ. 1995, 19, 383–409. [Google Scholar] [CrossRef]
- De Cleyn, S.H.; Braet, J. Do board composition and investor type influence innovativeness in SMEs? Int. Entrep. Manag. J. 2012, 8, 285–308. [Google Scholar] [CrossRef]
- Belloc, F. Law, finance and innovation: The dark side of shareholder protection. Camb. J. Econ. 2013, 37, 863–888. [Google Scholar] [CrossRef]
- Zahra, S.A.; Ireland, R.D.; Hitt, M.A. International expansion by new venture firms: International diversity, mode of market entry, technological learning, and performance. Acad. Manag. J. 2000, 43, 925–950. [Google Scholar]
- Coles, J.L.; Daniel, N.D.; Naveen, L. Managerial incentives and risk-taking. J. Financ. Econ. 2006, 79, 431–468. [Google Scholar] [CrossRef]
- Miller, D.J.; Fern, M.J.; Cardinal, L.B. The use of knowledge for technological in-novation within diversified firms. Acad. Manag. J. 2007, 50, 307–325. [Google Scholar] [CrossRef]
- Yoo, Y.; Henfridsson, O.; Lyytinen, K. Research commentary—The new organizing logic of digital innovation: An agenda for information systems research. Inf. Syst. Res. 2010, 21, 724–735. [Google Scholar] [CrossRef]
- Mikalef, P.; Pateli, A. Information technology-enabled dynamic capabilities and their indirect effect on competitive performance: Findings from PLS-SEM and fsQCA. J. Bus. Res. 2017, 70, 1–16. [Google Scholar]
- Bronzini, R.; Piselli, P. The impact of R&D subsidies on firm innovation. Res. Policy 2016, 45, 442–457. [Google Scholar]
- Lokshin, B.; Mohnen, P. How effective are level-based R&D tax credits? Evidence from the Netherlands. Appl. Econ. 2012, 44, 1527–1538. [Google Scholar]
- Baron, R.M.; Kenny, D.A. The moderator–mediator variable distinction in social psychological research: Conceptual, strategic, and statistical considerations. J. Personal. Soc. Psychol. 1986, 51, 1173–1182. [Google Scholar] [CrossRef] [PubMed]
Figure 1.
Theoretical framework diagram.

Figure 2.
Density function plot of the propensity score value.


Table 1.
Specific variable definitions and descriptions.
| Variable Type | Variable Name | Variable Symbol | Definition |
|---|---|---|---|
| Explained variable | Total factor productivity | TFP_LP | Total factor productivity calculated using the LP method |
| Mediator variable | Enterprise green innovation | GI | Add 1 to the number of invention patents applied for by the enterprise in the current year, taking the natural logarithm. |
| Explanatory variable | Water resource tax reform | TT | Whether to carry out pilot water resource tax reform, represented by the dummy variable TT, TTit = Treatedi × Timet |
| Control variable | Company profitability | ROA | Net profit margin on total assets |
| Company growth | Growth | Total assets growth rate | |
| Financial leverage | Lev | Asset–liability ratio | |
| Independent director governance | Id | The proportion of independent directors to the size of the board of directors | |
| Director board size | Bs | Total number of directors in the board of directors | |
| Governance of major shareholders | Msg | Shareholding ratio of the largest shareholder | |
| CEO duality | Pt | The value of the general manager concurrently serving as the chairman is 1; otherwise, the value is 0. | |
| Managerial ownership | MS | Proportion of shares held by company executives | |
| Executive compensation | MC | The total monetary compensation of company executives is calculated as the natural logarithm. | |
| Product market competition | HHI | HHI = represents the size of the i-th enterprise, and represents the total market size. | |
| Digital transformation | DT | Data calculation of text mining based on digital lexicon | |
| Financial subsidy | FS | (Government subsidies—returns of various taxes and fees received)/total assets | |
| Tax incentives | TI | Returns of various taxes and fees received/total assets | |
| Industry | Industry | Industry dummy variable | |
| Year | Year | Year dummy variable |
Table 2.
Descriptive statistics of the main variables.
| Variable | Mean | Median | Max | Min | SD | Obs |
|---|---|---|---|---|---|---|
| TFP_LP | 10.9894 | 10.8418 | 14.7543 | 4.4336 | 1.2855 | 8949 |
| GI | 0.2082 | 0 | 6.6983 | 0 | 0.5843 | 8949 |
| TT | 0.1406 | 0 | 1 | 0 | 0.3476 | 8949 |
| ROA | 0.0410 | 0.0363 | 0.6271 | -0.6449 | 0.0709 | 8949 |
| Growth | 0.1326 | 0.0780 | 19.0954 | -0.8490 | 0.4286 | 8949 |
| Lev | 0.4453 | 0.4448 | 0.9970 | 0.0080 | 0.2014 | 8949 |
| Id | 0.3724 | 0.3333 | 0.8 | 0.1429 | 0.0555 | 8949 |
| Msg | 0.3661 | 0.3468 | 0.8999 | 0.0029 | 0.1559 | 8949 |
| Pt | 0.2206 | 0 | 1 | 0 | 0.4146 | 8949 |
| Bs | 8.9136 | 9 | 18 | 0 | 1.9163 | 8949 |
| MS | 0.0507 | 0.0001 | 0.7259 | 0 | 0.1216 | 8949 |
| MC | 14.7365 | 14.7958 | 18.5844 | 0 | 1.1287 | 8949 |
| HHI | 0.1248 | 0.1049 | 1 | 0.0144 | 0.1138 | 8949 |
| DT | 0.7037 | 0 | 5.0689 | 0 | 0.9758 | 8949 |
| FS | 0.0048 | 0.0023 | 0.4212 | 0 | 0.0166 | 8949 |
| TI | 0.0006 | 0 | 0.1132 | 0 | 0.0029 | 8949 |
Table 3.
Pearson correlation analysis.
| Variable | TFP_LP | GI | TT | ROA | Growth | Lev | Id |
|---|---|---|---|---|---|---|---|
| TFP_LP | 1 | ||||||
| GI | 0.3779 *** | 1 | |||||
| TT | 0.1292 *** | 0.1051 *** | 1 | ||||
| ROA | 0.1375 *** | −0.0017 | 0.0267 ** | 1 | |||
| Growth | −0.0140 | −0.0230 ** | −0.0273 *** | 0.1735 *** | 1 | ||
| Lev | 0.3670 *** | 0.1195 *** | −0.0223 ** | −0.3497 *** | −0.0057 | 1 | |
| Id | 0.0271 ** | 0.0287 *** | 0.0157 | 0.0080 | 0.0020 | −0.0521 *** | 1 |
| Msg | 0.3281 *** | 0.1503 *** | −0.0397 *** | 0.1236 *** | −0.0196 * | 0.0588 *** | 0.0551 *** |
| Pt | −0.1547 *** | -0.0693 *** | −0.0547 *** | 0.0394 *** | 0.0297 *** | −0.1432 *** | 0.1180 *** |
| Bs | 0.2549 *** | 0.1430 *** | −0.0026 | 0.0115 | −0.0265 ** | 0.2334 *** | −0.6101 *** |
| MS | −0.1822 *** | −0.0633 *** | −0.0630 *** | 0.1026 *** | 0.0461 *** | −0.2433 *** | 0.1246 *** |
| MC | 0.3162 *** | 0.1719 *** | 0.1081 *** | 0.1823 *** | 0.0099 | −0.0474 *** | −0.0033 |
| HHI | −0.0911 *** | −0.0116 | −0.0868 *** | −0.0891 *** | −0.0326 ** | 0.0177 | 0.0093 |
| DT | 0.0149 | −0.0194 | −0.0187 | 0.0144 | −0.0061 | 0.0153 | 0.0114 |
| FS | −0.0365 ** | −0.0599 *** | 0.0175 | 0.0504 *** | −0.0037 | −0.0074 | 0.0189 |
| TI | 0.1645 *** | 0.0590 *** | 0.0335 ** | −0.0261 * | 0.0237 | −0.0068 | 0.0956 *** |
| Variable | Msg | Pt | Bs | MS | MC | HHI | DT |
| Msg | 1 | ||||||
| Pt | 0.0518 *** | 1 | |||||
| Bs | 0.0806 *** | −0.0755 *** | 1 | ||||
| MS | −0.3995 *** | 0.0803 *** | −0.1653 *** | 1 | |||
| MC | 0.1003 *** | −0.0647 *** | 0.4409 *** | −0.1910 *** | 1 | ||
| HHI | 0.0408 *** | −0.0296 *** | 0.0534 *** | 0.0688 *** | 0.0514 *** | 1 | |
| DT | −0.0002 | −0.0015 | −0.0218 | 0.0446 *** | −0.0390 *** | 0.0148 | 1 |
| FS | 0.0458 *** | 0.0380 *** | −0.0441 *** | 0.0432 *** | 0.0369 ** | −0.0513 *** | −0.0015 |
| TI | 0.0331 ** | 0.0629 *** | −0.0717 *** | 0.0654 *** | 0.2166 *** | 0.0732 *** | −0.0077 |
| Variable | FS | TI | |||||
| FS | 1 | ||||||
| TI | 0.0358 ** | 1 |
Note: *, **, and *** denote the significance levels at 10%, 5%, and 1%, respectively.
Table 4.
Benchmark regression analysis.
| Variable | Model (1) | Model (2) | Model (3) |
|---|---|---|---|
| TT | 0.1147 *** (4.49) | 0.1029 *** (5.73) | |
| GI | 0.3547 *** (24.29) | ||
| ROA | 3.4274 *** (27.16) | −0.0214 (−0.24) | 3.4413 *** (28.14) |
| Growth | −0.0775 *** (−4.15) | −0.0189 (−1.44) | −0.0716 *** (−3.96) |
| Lev | 1.6378 *** (35.40) | 0.1726 *** (5.31) | 1.5783 *** (35.14) |
| Id | 0.9539 *** (6.07) | 0.6019 *** (5.45) | 0.7413 *** (4.85) |
| Msg | 1.3241 *** (24.11) | 0.4250 *** (11.02) | 1.1692 *** (21.83) |
| Pt | −0.1292 *** (−6.06) | −0.0361 ** (−2.41) | −0.1197 *** (−5.80) |
| Bs | 0.0644 *** (12.99) | 0.0365 *** (10.47) | 0.0522 *** (10.80) |
| MS | −0.3707 *** (−4.95) | −0.0710(−1.35) | −0.3620 *** (−5.00) |
| MC | 0.2051 *** (26.57) | 0.0594 *** (10.95) | 0.1834 *** (24.36) |
| HHI | 0.1317 (0.83) | 0.1510 (1.36) | 0.0730 (0.48) |
| DT | 3.7172 (1.36) | 2.1639 (1.13) | 2.9031 (1.09) |
| FS | −3.6460 *** (−7.71) | −0.4637 (−1.40) | −3.4948 *** (−7.62) |
| TI | 0.1054 *** (11.16) | 0.0069 (1.04) | 0.1019 *** (11.14) |
| Constant | 2.8642 *** (19.23) | −1.7303 *** (−16.54) | 3.4882 *** (23.80) |
| Year/industry | Yes | Yes | Yes |
| Adjust_R2 | 0.4800 | 0.2191 | 0.5113 |
| Obs | 8949 | 8949 | 8949 |
Note: *, **, and *** denote the significance levels at 10%, 5%, and 1%, respectively.
Table 5.
Results of the test using the fixed effects model.
| Variable | Model (1) | Model (2) | Model (3) |
|---|---|---|---|
| TT | 0.1147 *** (4.49) | 0.1029 *** (5.73) | |
| GI | 0.3547 *** (24.29) | ||
| Controli,t | Yes | Yes | Yes |
| Constant | 3.1830 *** (21.53) | −1.6088 *** (−15.49) | 3.7774 *** (26.05) |
| Year/industry | Yes | Yes | Yes |
| Adjust_R2 | 0.4639 | 0.2048 | 0.4966 |
| Obs | 8949 | 8949 | 8949 |
Note: *, **, and *** denote the significance levels at 10%, 5%, and 1%, respectively.
Table 6.
Test results when replacing the key variables.
| Variable | Replacing the Explanatory Variables | Replacing the Explained Variables | ||
|---|---|---|---|---|
| Model (2) | Model (3) | Model (1) | Model (3) | |
| TT | 0.3387 *** (13.49) | 0.0732 *** (3.83) | ||
| GI′ | 0.3135 *** (34.20) | |||
| GI | 0.1303 *** (10.57) | |||
| Controli,t | Yes | Yes | Yes | Yes |
| Constant | −2.7356 *** (−17.19) | 3.7379 *** (26.46) | 0.9412 *** (7.77) | 1.1697 *** (9.56) |
| Year/industry | Yes | Yes | Yes | Yes |
| Adjust_R2 | 0.2442 | 0.5264 | 0.2499 | 0.2580 |
| Obs | 8949 | 8949 | 8949 | 8949 |
Note: *, **, and *** denote the significance levels at 10%, 5%, and 1%, respectively.
Table 7.
PSM-DID model.
| Column 1: TT → TFP_LP | |||||
| Weighted variable(s) | Mean control | Mean treated | Diff. | |t| | Pr (|T| > |t|) |
| TFP_OLS | 8.275 | 8.458 | 0.182 | 5.63 | 0.0000 *** |
| ROA | 0.037 | 0.039 | 0.002 | 0.88 | 0.3773 |
| Growth | 0.145 | 0.150 | 0.005 | 0.32 | 0.7504 |
| Lev | 0.493 | 0.491 | −0.002 | 0.33 | 0.7419 |
| Id | 0.364 | 0.364 | 0.000 | 0.13 | 0.8999 |
| Msg | 0.384 | 0.390 | 0.006 | 1.12 | 0.2642 |
| Pt | 0.117 | 0.112 | −0.004 | 0.45 | 0.6532 |
| Bs | 9.415 | 9.429 | 0.013 | 0.20 | 0.8416 |
| MS | 0.023 | 0.024 | 0.001 | 0.38 | 0.7046 |
| MC | 14.402 | 14.427 | 0.025 | 0.56 | 0.5783 |
| HHI | 0.134 | 0.139 | 0.005 | 1.02 | 0.3087 |
| TI | 0.001 | 0.001 | 0.000 | 0.18 | 0.8593 |
| FS | 0.004 | 0.004 | 0.000 | 0.35 | 0.7250 |
| DT | 0.311 | 0.310 | -0.001 | 0.06 | 0.9529 |
| Column 2: TT → GI | |||||
| Weighted variable(s) | Mean control | Mean treated | Diff. | |t| | Pr (|T| > |t|) |
| GI | 0.128 | 0.219 | 0.091 | 5.18 | 0.0000 *** |
| ROA | 0.037 | 0.039 | 0.002 | 0.88 | 0.3773 |
| Growth | 0.145 | 0.150 | 0.005 | 0.32 | 0.7504 |
| Lev | 0.493 | 0.491 | −0.002 | 0.33 | 0.7419 |
| Id | 0.364 | 0.364 | 0.000 | 0.13 | 0.8999 |
| Msg | 0.384 | 0.390 | 0.006 | 1.12 | 0.2642 |
| Pt | 0.117 | 0.112 | −0.004 | 0.45 | 0.6532 |
| Bs | 9.415 | 9.429 | 0.013 | 0.20 | 0.8416 |
| MS | 0.023 | 0.024 | 0.001 | 0.38 | 0.7046 |
| MC | 14.402 | 14.427 | 0.025 | 0.56 | 0.5783 |
| HHI | 0.134 | 0.139 | 0.005 | 1.02 | 0.3087 |
| TI | 0.001 | 0.001 | 0.000 | 0.18 | 0.8593 |
| FS | 0.004 | 0.004 | 0.000 | 0.35 | 0.7250 |
| DT | 0.311 | 0.310 | −0.001 | 0.06 | 0.9529 |
Note: *, **, and *** denote the significance levels at 10%, 5%, and 1%, respectively.
Table 8.
Results of the Sobel test.
| Variable | Path c (Model with dv Regressed on iv) | Path a (Model with Mediator Regressed on iv) | Paths b and c’ (Model with dv Regressed on Mediator and iv) | |||
|---|---|---|---|---|---|---|
| TT | 0.2412 *** (9.64) | 0.1550 *** (9.02) | 0.1847 *** (7.59) | |||
| GI | 0.3646 *** (24.44) | |||||
| Controli,t | Yes | Yes | Yes | |||
| Constant | 2.4059 *** (17.11) | −1.9716 *** (-20.42) | 3.1247 *** (22.43) | |||
| Year/industry | Yes | Yes | Yes | |||
| Adjust_R2 | 0.3682 | 0.0903 | 0.4077 | |||
| Obs | 8949 | 8949 | 8949 | |||
| Column 1: Sobel–Goodman Mediation Tests | ||||||
| Est | Std_err | z | P > |z| | |||
| Sobel | 0.057 | 0.007 | 8.463 | 0.000 | ||
| Aroian | 0.057 | 0.007 | 8.457 | 0.000 | ||
| Goodman | 0.057 | 0.007 | 8.469 | 0.000 | ||
| Column 2: Indirect, Direct, and Total Effects | ||||||
| Est | Std_err | z | P > |z| | |||
| a_coefficient | 0.155 | 0.017 | 9.021 | 0.000 | ||
| b_coefficient | 0.365 | 0.015 | 24.441 | 0.000 | ||
| Indirect_effect_aXb | 0.057 | 0.007 | 8.463 | 0.000 | ||
| Direct_effect_c’ | 0.185 | 0.024 | 7.586 | 0.000 | ||
| Total_effect_c | 0.241 | 0.025 | 9.637 | 0.000 | ||
| Proportion of total effect that is mediated: 0.234 | ||||||
| Ratio of indirect to direct effect: 0.306 | ||||||
| Ratio of total to direct effect: 1.306 | ||||||
Note: *, **, and *** denote the significance levels at 10%, 5%, and 1%, respectively.
Table 9.
Distinguishing the property nature of enterprises.
| Variable | SOEs | Non-SOEs | ||||
|---|---|---|---|---|---|---|
| Model (1) | Model (2) | Model (3) | Model (1) | Model (2) | Model (3) | |
| TT | 0.0484(1.17) | 0.0615 * (1.88) | 0.1149 *** (3.79) | 0.0640 *** (3.73) | ||
| GI | 0.3704 *** (19.84) | 0.1708 *** (6.63) | ||||
| Controli,t | Yes | Yes | Yes | Yes | Yes | Yes |
| Constant | 3.0283 *** (15.46) | −2.0909 *** (−13.49) | 3.8029 *** (19.88) | 3.4272 *** (13.03) | −0.6637 *** (−4.46) | 3.5634 *** (13.57) |
| Year/industry | Yes | Yes | Yes | Yes | Yes | Yes |
| Adjust_R2 | 0.5202 | 0.3210 | 0.5613 | 0.4537 | 0.0834 | 0.4571 |
| Obs | 4237 | 4237 | 4237 | 4712 | 4712 | 4712 |
Note: *, **, and *** denote the significance levels at 10%, 5%, and 1%, respectively.
Disclaimer/Publisher’s Note: The statements, opinions and data contained in all publications are solely those of the individual author(s) and contributor(s) and not of MDPI and/or the editor(s). MDPI and/or the editor(s) disclaim responsibility for any injury to people or property resulting from any ideas, methods, instructions or products referred to in the content. |
© 2024 by the authors. Licensee MDPI, Basel, Switzerland. This article is an open access article distributed under the terms and conditions of the Creative Commons Attribution (CC BY) license (https://creativecommons.org/licenses/by/4.0/).
Share and Cite
MDPI and ACS Style
Xu, C.; Gao, Y.; Hua, W.; Feng, B. Does the Water Resource Tax Reform Bring Positive Effects to Green Innovation and Productivity in High Water-Consuming Enterprises? Water 2024, 16, 725. https://doi.org/10.3390/w16050725
AMA Style
Xu C, Gao Y, Hua W, Feng B. Does the Water Resource Tax Reform Bring Positive Effects to Green Innovation and Productivity in High Water-Consuming Enterprises? Water. 2024; 16(5):725. https://doi.org/10.3390/w16050725
Chicago/Turabian StyleXu, Chaohui, Yingchao Gao, Wenwen Hua, and Bei Feng. 2024. "Does the Water Resource Tax Reform Bring Positive Effects to Green Innovation and Productivity in High Water-Consuming Enterprises?" Water 16, no. 5: 725. https://doi.org/10.3390/w16050725
Note that from the first issue of 2016, this journal uses article numbers instead of page numbers. See further details here.