Article

Identifying the Driving Forces of Alpine Wetland Dynamic Changes in the Yellow River Source National Park from 2000 to 2020

1
College of Agriculture and Animal Husbandry, Qinghai University, Xining 810016, China
2
China Water Resources Pearl River Planning Surveying & Designing Co., Ltd., Guangzhou 510630, China
3
Xining University, Xining 810016, China
4
Qinghai Youyuan Space Information Technology Co., Ltd., Xining 810016, China
*
Author to whom correspondence should be addressed.
Water 2023, 15(14), 2557; https://doi.org/10.3390/w15142557
Submission received: 4 May 2023 / Revised: 7 July 2023 / Accepted: 10 July 2023 / Published: 12 July 2023
(This article belongs to the Section Hydrology)

Abstract

:
The Yellow River Source National Park (YRSNP), one of largest alpine wetlands in China which serves as the origin of the Yellow River, is situated in the heart of the Qinghai–Tibetan Plateau. The alpine wetland ecosystem, which is its primary ecological system, is crucial for maintaining ecological balance, preserving biodiversity, and facilitating the sustainable development of the Yellow River Basin. In this study, based on the Google Earth Engine (GEE) platform combined with Landsat 5 7 8 remote sensing images, we used a random forest classification model to identify and classify the alpine wetland from 2000 to 2020 and analyze its pattern of dynamic changes. The main driving forces that drive the change of the alpine wetland area in the YRSNP from 2000 to 2020 are identified using a random forest regression analysis in combination with data on precipitation, temperature, potential evapotranspiration, soil moisture, and population density. The results show that: (1) From 2000 to 2020, the average overall accuracy of remote sensing classification and extraction of the YRSNP alpine wetlands is 0.8492 and the Kappa coefficient is 0.8051. (2) From 2000 to 2020, the shrinking trend of the YRSNP alpine wetland area is restrained. However, the lake wetland, marsh wetland, and marsh meadow all increase by 0.58%, 0.06%, and 3.34%, respectively, whereas the river wetland shows a declining trend. (3) The results of the identification of driving forces indicate that soil moisture is the main factor influencing the dynamic changes of the alpine wetland, although the decline in population density has a favorable impact on the alpine wetland. The results can provide scientific basis for maintaining the stability, diversity, and sustainability of the alpine wetland ecosystem in the Yellow River Source National Park.

1. Introduction

The Yellow River Source National Park (YRSNP) is established at the territory of the Yellow River source. The YRSNP serves an extremely important ecosystem service function of water conservation and runoff catchment. As a significant component of the YRSNP ecosystem, the alpine wetland ecosystem is the most significant water conservation and recharge area for the source of the Yellow River [1,2]. However, influenced by climate warming and human activities in recent years, the imbalance of the Asian water tower has increased, and the surface runoff has decreased, resulting in a decrease in the Yellow River flow [3,4]. Additionally, due to overgrazing, the biodiversity of the alpine wetland has been lost, and stability has decreased, which has a significant impact on local production and livelihoods. This has increased the risk of carbon stock releases as well as water security in the middle and lower reaches [5]. Therefore, research on the pattern of the dynamic changes and driving forces of the YRSNP alpine wetland is urgently needed to protect the stability and integrity of the alpine wetland ecosystems. This research can serve as a scientific foundation for the protection and management of alpine wetlands as well as a guide for the sustainable development of alpine wetlands.
Currently, field surveys and remote sensing monitoring are the two main methods for studying the dynamic changes of alpine wetland ecosystems. By establishing sample plots, field surveys based on wetland categories can look at various biological, hydrological, and soil indicators [6]. This process requires a significant amount of time, the wetland information obtained is only representative of a single period, and it does not adequately capture its evolutionary process. Research into the pattern of dynamic changes of wetlands has consistently used remote sensing monitoring due to its timeliness, accuracy, and ease of acquisition. Convolutional neural networks [7,8], random forests [9,10], support vector machines [11,12], classification and regression trees [13], decision trees [14], maximum likelihood classification [15], K-nearest neighbors classification [16], and object-based models make up most of the current remote sensing monitoring of wetlands [17,18]. Compared with other classification models, the random forest model is considered the best suited for wetland remote sensing classification research because of its ability to fuse multi-source data and avoid overfitting of training samples [19].
Temperature and precipitation are the dominant driving factors influencing the dynamic changes of alpine wetlands in the research of alpine wetland drivers. Zhou et al. found that the majority of Qinghai lake wetland areas showed a continuous upward trend, while river wetland and marsh wetland areas decreased and then increased. The main driver for wetland area change was precipitation in the Yellow River source area under dry conditions, while temperature had a negative impact on the area of marsh wetland. This is because of the influence of hydrological recharge brought by precipitation and the melting glaciers in the upper reaches due to the increase in temperature during the warm season [20]. Ma et al. discovered that the warm season mean temperature and mean annual temperature had the greatest influence on the changes of the YRSNP wetland [21]. However, some research has indicated that the impacts of natural factors such as climate change on alpine wetlands can be amplified by human activities. By proposing the human impact index, Lu et al. analyzed the temporal and spatial relationship between wetland area change and the human impact index. The results showed that the main factor causing wetland destruction in China in the past 40 years had been human interference [22]. Lu et al. found that excessive grazing and irrigation were the dominant factors of the altered inundation status of the Tibetan Plateau’s marsh wetland [23]. Temperature change was the dominant factor leading to the dynamic changes of the YRSNP alpine wetlands. However, this finding mostly applies to the period prior to 2010 [24], and it is unclear what factors influenced the dynamic changes of the YRSNP alpine wetlands from 2000 to 2020.
The current driving forces in studies into the patterns of wetland dynamic changes are mainly based on meteorological factors (temperature and precipitation) and socio-economic indicators (population and GDP), and a driving force analysis is performed using traditional mathematical and statistical analysis. Yan et al. used a multiple linear regression to analyze the correlations between 24 indicators, including demographic factors, economic factors, city construction factors, water pollution factors, tourism development factors, tourism development factors, and wetland areas. They also used redundancy analysis to rank the importance of the variables [25]. For each province in China, Bian et al. used simultaneous frequency and linear regression analysis to analyze the relationship between the amount of water required by people, the amount of wastewater discharge, the area of city construction, the area of forest, the area of agricultural crops, the length of highways, and meteorological data (precipitation and temperature) with the amount of change in the area between the first and second wetland resources [26]. Zhang et al. used principal component analysis to examine the effects of meteorological (precipitation, temperature, and evapotranspiration), geographic (elevation, slope, distance, and built-up land), and socioeconomic (population and GDP) factors on wetland changes in the Yellow River Delta. The results indicated that whereas meteorological factors only accounted for 16.77% of the variance, economic factors were responsible for 65.07% of it [27]. As an important part of wetland water, soil moisture is an indispensable feature evaluation factor in wetland research [28,29]. It is the basic condition for the survival and normal growth of wetland plants, but the research mentioned above does not use it as a driving factor for driving force analysis.
To sum up, the dominant driving factors of the dynamic changes of the YRSNP alpine wetland from 2000 to 2020 are not clear in the existing research. Moreover, there are few studies that analyze the driving forces of alpine wetland dynamic changes combined with soil moisture. Therefore, in this study we used Landsat satellite images with the GEE platform to reveal the pattern of dynamic changes and the dominant drivers of the YRSNP alpine wetlands, including the identification and classification of the YRSNP alpine wetlands from 2000 to 2020. On this basis, combined with temperature, precipitation, potential evapotranspiration, soil moisture, and population density, the dominant driving factors were analyzed based on a random forest model. The results could point to direction for the protection and restoration of the YRSNP alpine wetland ecosystem.

2. Materials and Methods
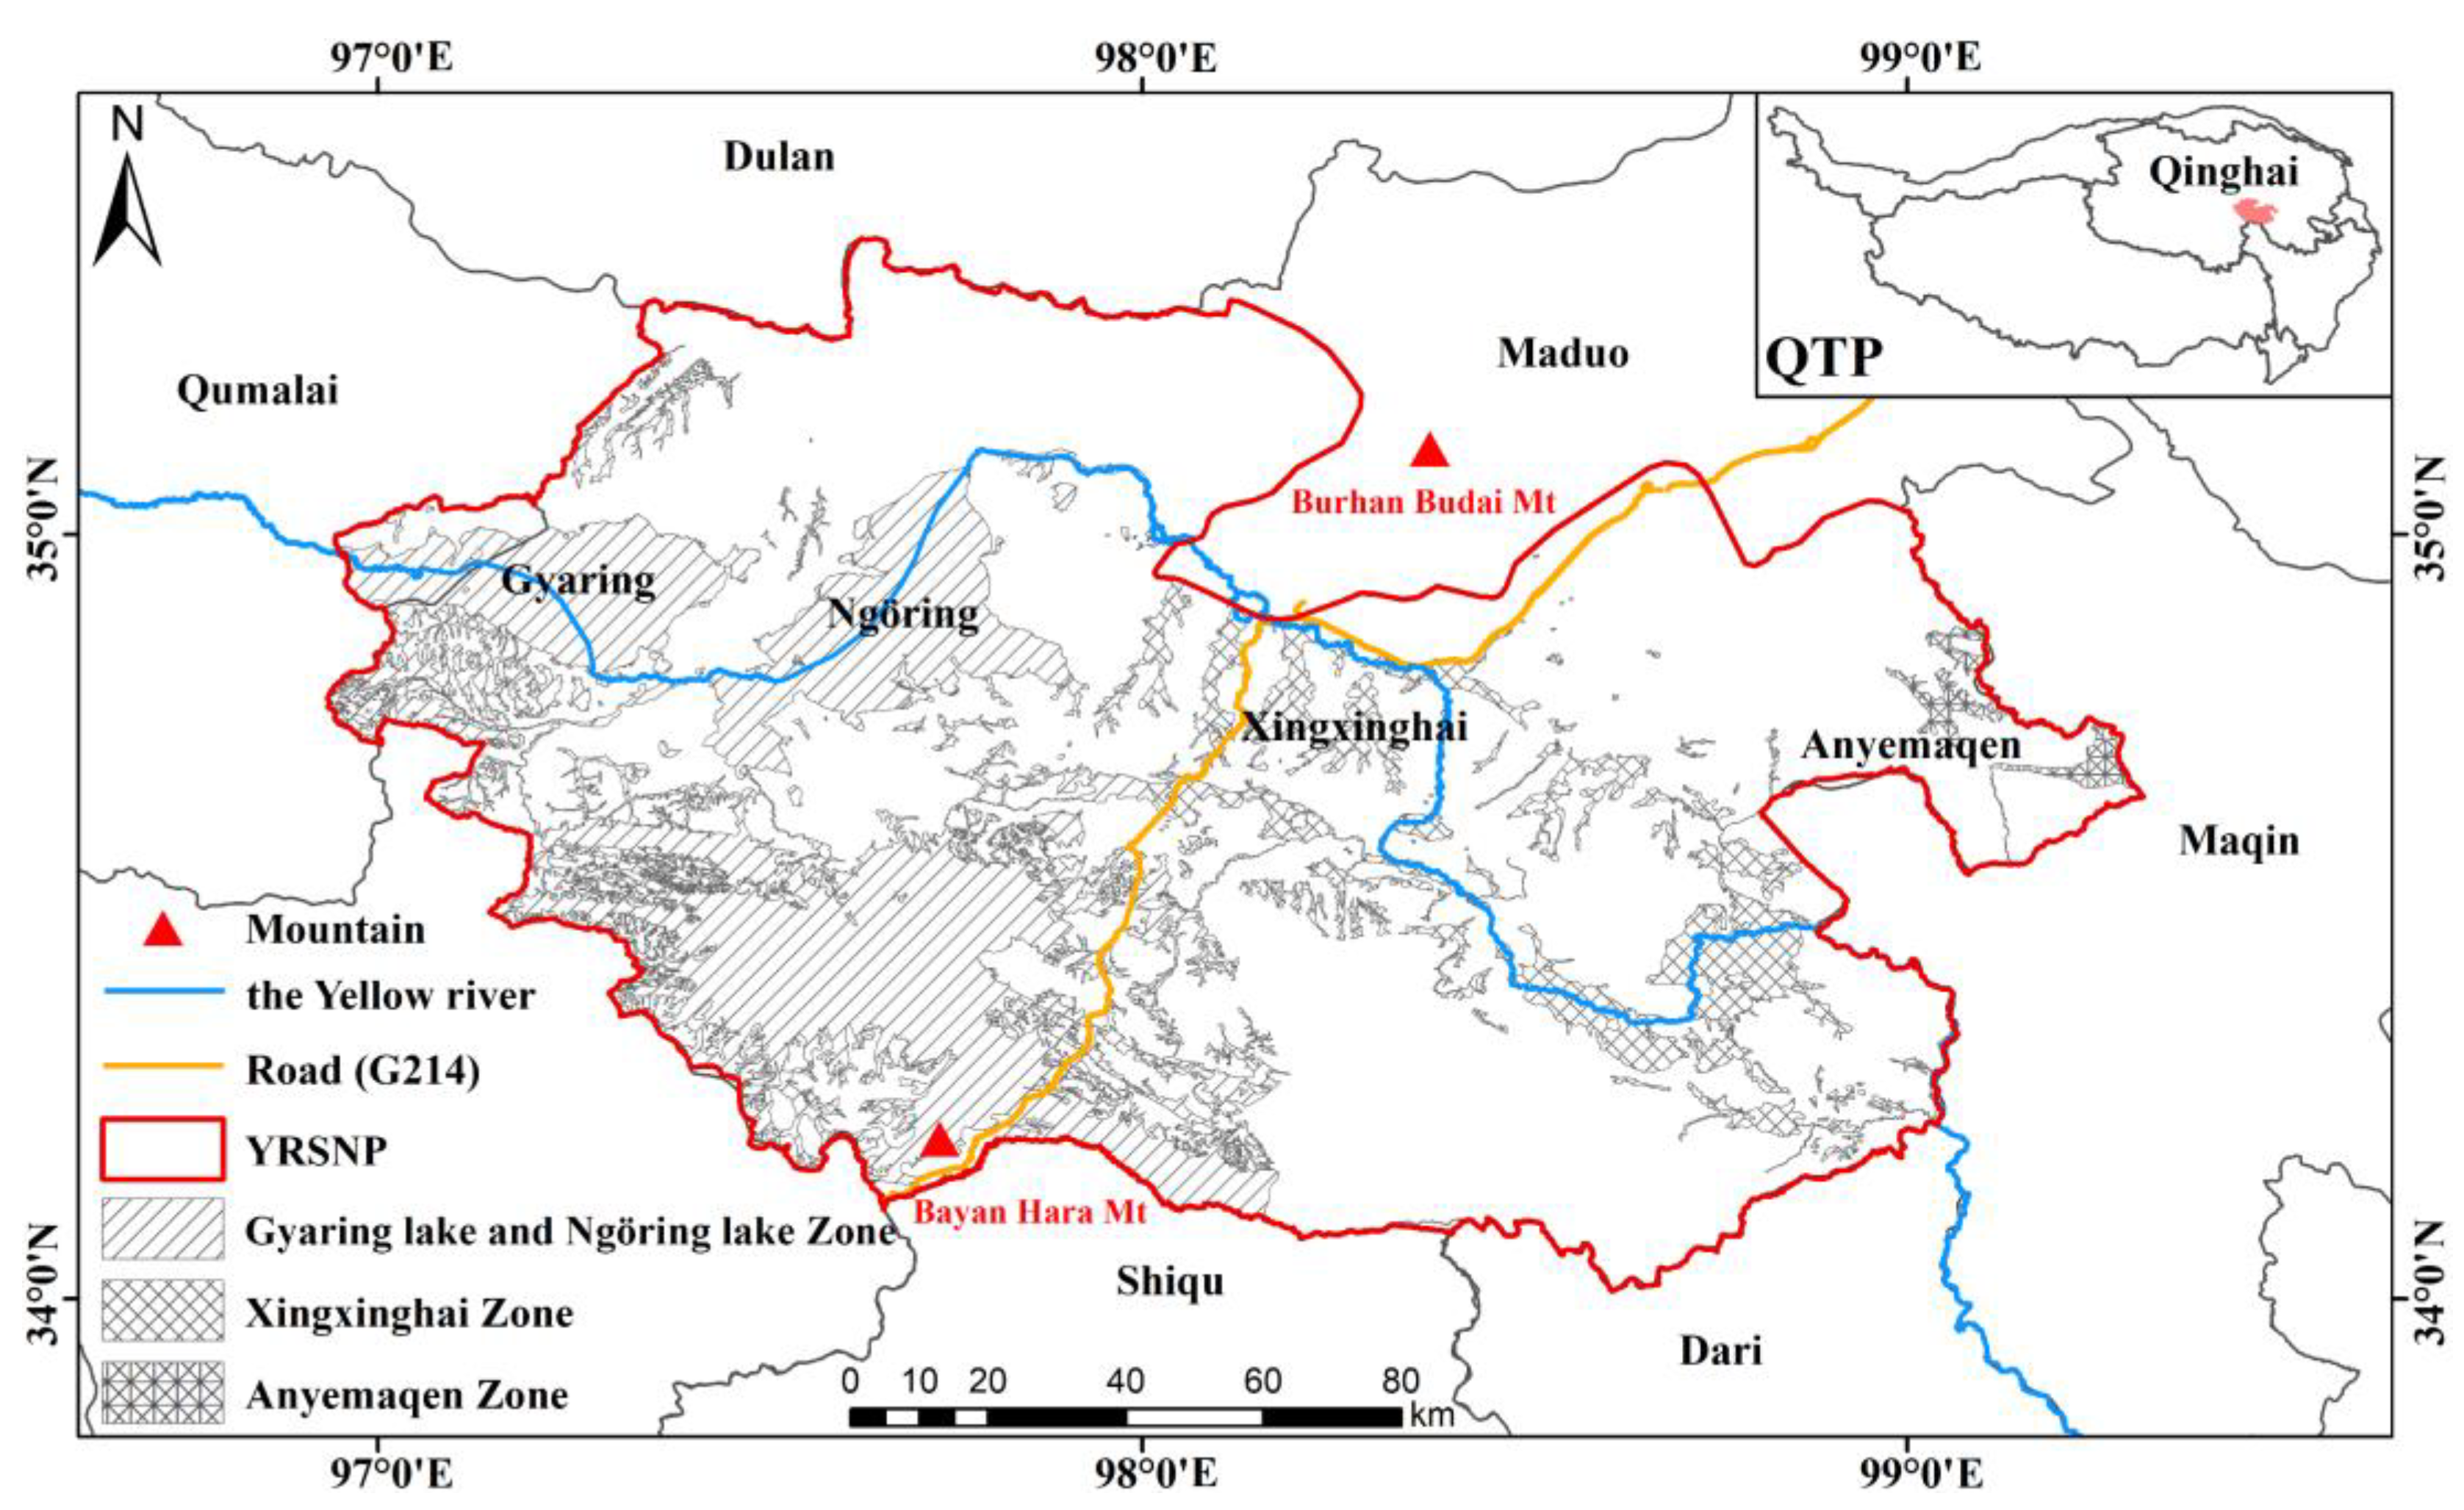
2.1. Study Area

The YRSNP is situated in the eastern part of the Qinghai–Tibet Plateau, the core area of the Three-River-Source National Park. Its geographic range is between 34°0′–35°23′ N and 96°56′–99°18′ E, primarily encompassing Maduo and Qumalai. The YRSNP, which is comprised of the Gyaring Lake and Ngöring Lake Protection Zone, the Xingxinghai Protection Zone, and the Anyemaqen Protection Zone, is situated between the Bayan Hara Mountains and Burhan Budai Mountains (Figure 1). It has a total area of 19,023 km2, accounting for approximately 6.29% of the total area of the Three-River-Source region. The YRSNP belongs to tundra climate in the Köppen climate classification, which has the characteristics of low temperature, low precipitation, high evaporation, and strong solar radiation [21]. Alpine wetlands were extremely scattered across the YRSNP, making up at least 30% of the total area. These wetlands included the internationally significant Gyaring Lake Wetland and Ngöring Lake Wetland, as well as the nationally significant Gonagma Wetland and Maduo Lake Wetland [30]. According to the second wetland resource survey data, YRSNP wetland types in the YRSNP include river wetland, lake wetland, and marsh wetland, while human activities are dominated by grazing.

2.2. Data and Preprocessing

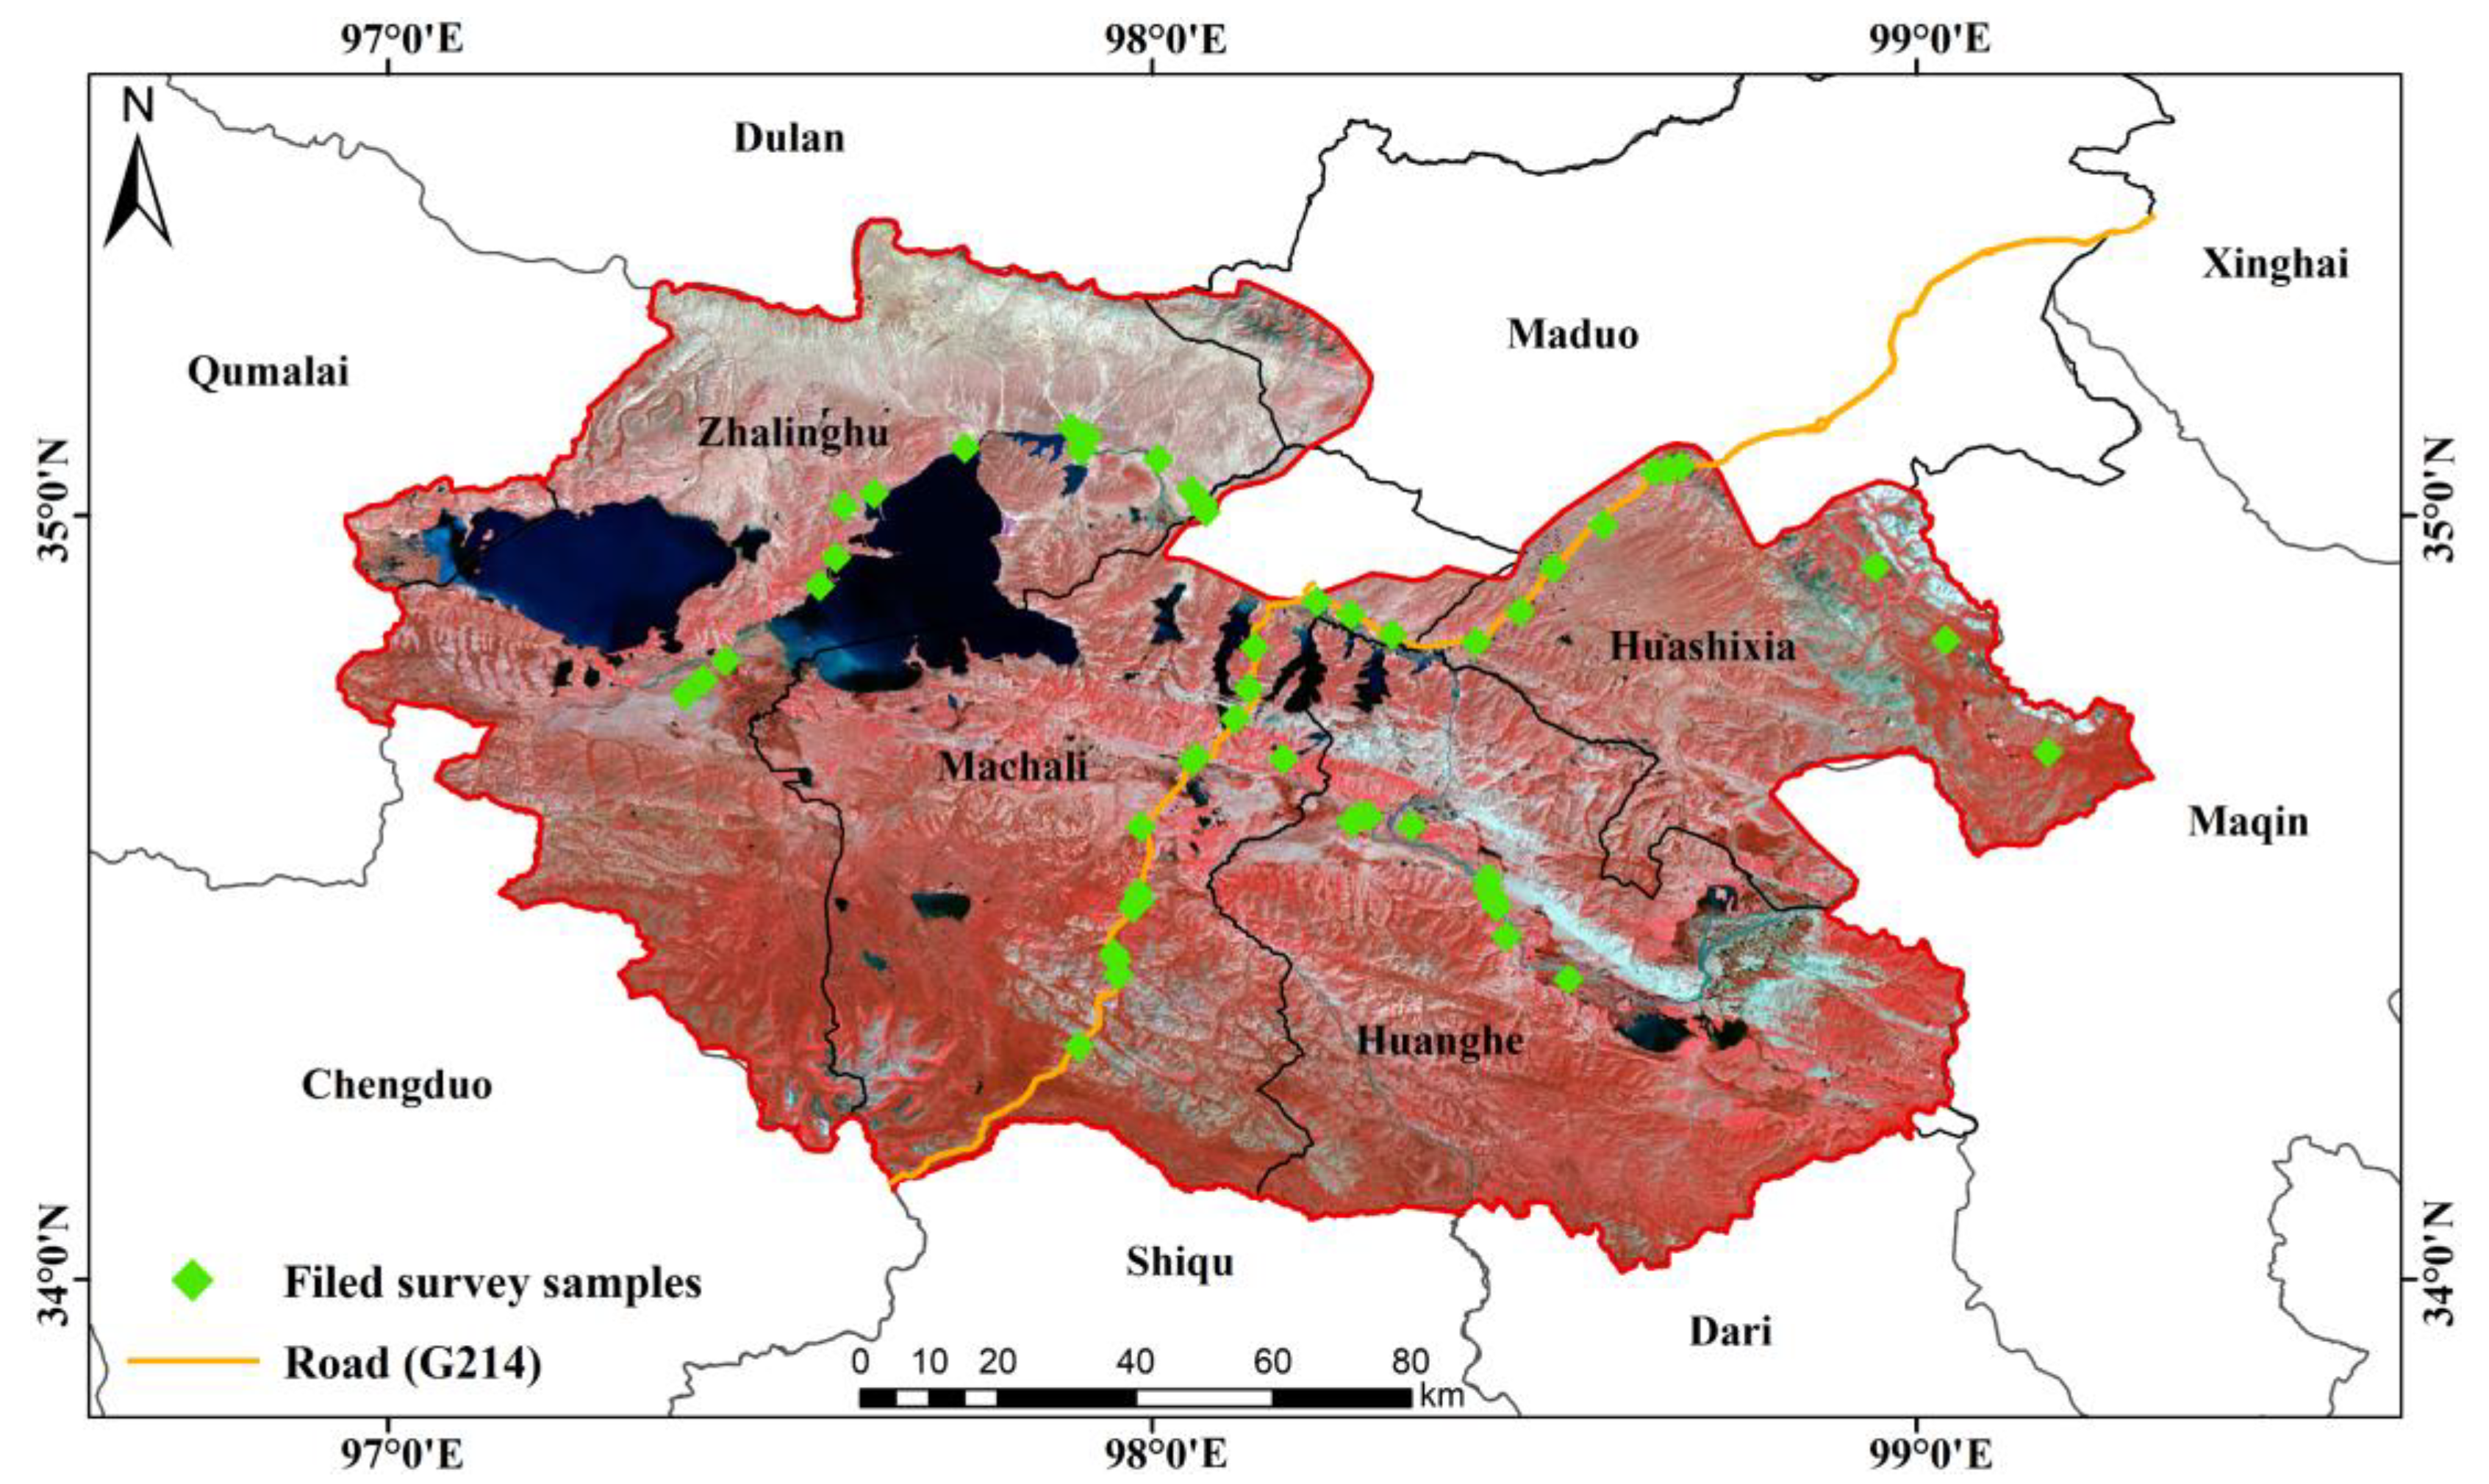
2.2.1. Field Survey Data

From April to July 2019 and 2020, field surveys were conducted in the YRSNP to verify the sample dataset selected based on Google Earth, the second wetland resources survey of Qinghai Province, and land use data. The field survey samples were mainly used to verify the classification accuracy in 2019 and 2020. The main objective of the field surveys was the positioning and recording of samples using unmanned aerial vehicles (UAV) and handheld GPS devices, including longitude, latitude, and wetland types. A total of 59 sample points were collected, with a distribution mainly found in Huashixia, Machali, Huanghe, Zhalinghu, and along the G214 road. The distribution of the field survey samples is shown in Figure 2.

2.2.2. Remote Sensing Data

The GEE platform was used in this study to access the Landsat series remote sensing image. The parameters of each remote sensing image are detailed in Table 1. In addition, the GEE platform was used to carry out the preprocessing, as follows: Firstly, all YRSNP images in the abundant water season (July–September) from 2000 to 2020 were screened out [31]. Then, the remote sensing image was masked by adjusting the range of pixel_qa value and cloud removal function; Finally, the cloud-removed images were synthesized and spliced according to the median value, and the annual YRSNP abundant water season images from 2000 to 2020 were obtained by clipping the YRSNP boundary.

2.2.3. Meteorological Data

The National Earth System Science Data Center (http://www.geodata.cn/, accessed on 4 March 2022) provided the meteorological data used in this study, including the monthly average temperature, precipitation, and potential evapotranspiration from 2000 to 2020 [32]. Then, the annual warm season meteorological data were calculated by the annual meteorological data from June to August. The potential evapotranspiration was then calculated according to the Hargreaves formula. The calculation formula was as follows [33]:
PET = 0.0023 × S0 × (MaxT − MinT)0.5 × (MeanT + 17.8),
where PET was the monthly potential evapotranspiration, S0 was the theoretical solar radiation reaching the top of the earth’s atmosphere, MaxT was the monthly maximum temperature, MinT stood for the monthly minimum temperature, and MeanT for the monthly average temperature.
In this study, the monthly meteorological data were calculated and clipped using the ArcMap 10.8 software (developed by Environmental Systems Research Institute, Inc., Redlands, CA, USA) to obtain the annual meteorological data of the YRSNP from 2000 to 2020. The mean annual temperature is the mean temperature of 12 months, and the annual precipitation and potential evapotranspiration are the sum of 12 months’ precipitation and potential evapotranspiration, respectively.

2.2.4. Other Data

In this study, other data included the soil moisture data, the topographic data, the population density data, the second wetland resource survey data, and land use data.
The National Tibetan Plateau Science Data Center (https://data.tpdc.ac.cn/, accessed on 25 February 2023) provided the soil moisture data. The dataset was named the global daily surface soil moisture dataset at 1 km resolution (2000–2020), had a temporal resolution of months, and a spatial resolution of 1 km [34].
The topographic and geomorphological data were obtained from SRTMGL1_003 with a spatial resolution of 30 m (https://developers.google.com/earth-engine/datasets/catalog/USGS_SRTMGL1_003, accessed on 15 December 2022) on the GEE platform. We used the ee.Image and ee.Algorithms. Terrain functions of the GEE platform were used to realize the call of SRTMGL1_003, and then the select function was used to realize the calculation of elevation, slope, and aspect.
The data on population density were obtained from Landscan global population distribution data (https://landscan.ornl.gov/, accessed on 25 February 2023) with a spatial resolution of 1 km.
The Department of Natural Resources of Qinghai Province (https://zrzyt.qinghai.gov.cn/, accessed on 16 July 2021) provided the second wetland resource survey data and land use data. The second wetland resource survey was completed in 2012, including information on wetland types, map spot latitude and longitude, and vegetation types. The land use data in the research area include information from the third national land survey, the 2012 land use status, and the 2020 land change survey.
For the subsequent unified calculation, the image coordinate system was unified to the WGS-84 coordinate system and resampled to a spatial resolution of 1 km.

2.3. Methods

2.3.1. Wetland Classification System

Wetland areas were defined by the Ramsar Convention on Wetlands as “areas of marsh, fen, peatland, or water, whether natural or artificial, permanent or temporary, with water that is static or flowing, fresh, brackish or salt, including areas of marine water the depth of which at low tide does not exceed 6 m”. In this study, the existing wetland classification system studies on the Tibetan Plateau and the results of the Second National Wetland Resources Survey were combined to determine the YRSNP wetland classification system (shown in Table 2), which includes river wetland, lake wetland, marsh wetland, and marsh meadow.

2.3.2. Sample Transfer Method

Using a sample transfer method based on reclassification, the training samples from historical years were obtained for this study [35]. By eliminating the samples that differed from the initial classification result due to the little change in sample types in the two adjacent years, the sample transfer technique of reclassification allowed samples with the same sample type and classification result to be reclassified [36]. Taking the 2020 and 2019 YRSNP remote sensing images as an example, the 2020 sample set was obtained by field surveys, Google Earth, and the 2020 land use change database. First, the 2020 sample set was used as the training sample set for the 2019 YRSNP land uses remote sensing classification. Next, the trained YRSNP land use remote sensing classification data was exported, and the ArcMap 10.8 software was used to extract the classification results of the 2020 sample set on the 2019 YRSNP land use remote sensing classification data. Finally, the sample points whose classification results did not match the 2020 sample set were removed, and then the 2019 YRSNP land use remote sensing classification was repeated.

2.3.3. Importance of Features

To rank the importance of the classification features and identify the leading driving factors, a random forest model was used. Breiman first introduced the random forest model in 2001 [37]. The Gini was an index to measure the purity of the random forest classification model and the value was between 0 and 1. The larger the value, the higher the purity of the model. The formula for calculating the Gini index was as follows [38]:
V I M j G i n i = 1 n i = 1 n V I M i j G i n i ,
V I M i j G i n i = i = 1 M V I M j m G i n i ,
V I M j m G i n i = G I m G I l G I r ,
where V I M j G i n i was the Gini importance in the random forest model. V I M i j G i n i was the importance of the i-th tree of the variable. V I M j m G i n i was the importance of the variable at node M. G I m was the Gini index of node m. G I l and G I r represented the Gini indices of two new nodes split by node M, respectively. n was the number of classification trees, and M was the number of times the classification feature appears in the i-th tree.
In this study, the classification feature importance ranking and dominant driver identification were carried out based on the GEE platform and Rstudio (developed by Posit and PBC), respectively.

2.3.4. Random Forest Classification and Accuracy Assessment

Based on the results of sample migration, in this study, 70% of the samples were set as the training set, and 30% of the samples were set as the verification set. An ee. classifier is a random forest model based on the GEE platform. The functions of Smilerandomforest enable the identification and classification of the YRSNP alpine wetland through remote sensing. Additionally, the explain and ee.List.sequence functions, respectively, were used to determine the significance of the classification features and the number of decision trees. The confusion matrix of the YRSNP remote sensing classification results was obtained by invoking the errorMatrix function. The user accuracy, overall accuracy, and Kappa coefficient were then calculated, respectively, to verify the classification accuracy. The rate at which the verification points are correctly classified is measured by user accuracy [39]. The ratio of the number of correctly classified wetland pixels to the total number of pixels in the wetland classification results is known as overall accuracy, and its calculation formula is was follows [40]:
O A = T P + T N T P + F P + T N + F N ,
where OA was the overall accuracy of wetland classification, TP (True Positive) indicated the number of positive samples with correct wetland classification, TN (True Negative) represented the number of negative samples with correct wetland classification, FP (False Positive) indicated the number of positive samples with incorrect wetland classification, and FN (False Negative) represented the number of negative samples with incorrect wetland classification. Based on the confusion matrix, the Kappa coefficient was an index used to measure classification accuracy, and its calculation formula was as follows [41]:
K a p p a = P o P e 1 P e ,
where Kappa was the Kappa coefficient of the wetland classification, Po represented the ratio of correctly classified wetland pixels to total pixels in the wetland classification result, and Pe represented the ratio of correctly classified wetland pixels to total pixels in the case of random classification.

2.3.5. Classification Features

The classification features used in this study included spectral features, spectral indexes, and topographic features. Considering that Landsat images from different periods were used in this study, in order to ensure the consistency of the spectral band information, in combination with previous studies, the spectral bands that were all present in Landsat images from different periods were used, including red band (red), green band (green), blue band (blue), near-infrared band (NIR), and short-wave infrared band (SWIR) [42,43]. Existing studies have shown that water body index, vegetation index, red edge index, building index, and bare ground index were the key band combinations that the spectral index used to reflect the characteristics of ground objects, so they were also included in the classification feature system. The altitude, slope, and aspect were represented in the terrain features. In this study, the classification features used in the remote sensing identification and classification of the YRSNP alpine wetland, based on Landsat 5 7 8 images, are provided in Table 3.

2.3.6. Mann–Kendall Analysis

Mann–Kendall is a nonparametric statistical test originally proposed by Mann in 1945 and further refined by Kendall and Sneyers [44]. Its advantages are that it does not require the measured values to follow a normal distribution, nor does it require the trend to be linear, and it is not affected by missing values and outliers. The result is dimensionless. The statistical test is as follows [45]:
Z = S V a r S S > 0 0 S = 0 S + 1 V a r S S < 0
S = i = 1 n 1 j = i + 1 n s i g n x j x i
s i g n θ = 1 θ > 0 0 θ = 0 1 θ < 0
V a r S = n n 1 2 n + 5 18
where n is the time series from 2000 to 2020, i = 2000, 2001, …, 2020. When |Zs| > u1−α/2, the driving factors data of the study are at the α level. Significant changes are generally taken as α = 0.05. When |Zs| > 1.96, the time series has a significance α < 0.05, and |Zs| < 1.96 means significance α > 0.05.

2.3.7. Trend Analysis

Trend analysis was applied to the change trend of the driving factors in the study area from 2000 to 2020. Trend analysis was performed together with slope analysis, which is as follows [46,47]:
S l o p e = n × i = 1 n X × i i = 1 n X i = 1 n i n × i = 1 n i 2 i = 1 n i 2
where Slope indicates the change trend from 2000 to 2020, x is driving factors in year i, i = 2000, 2001, …, 2020, n is the time series from 2000 to 2020, Slope > 0 suggests an elevating trend, and Slope < 0 denotes a reducing trend. Slope analysis was carried out with the use of MATLAB R2016b (The MathWorks, Inc., Natick, MA, USA).

3. Results

3.1. Accuracy Evaluation

The random forest model and Landsat 5 7 8 were used to identify and classify the YRSNP alpine wetland from 2000 to 2020 (Figure 3). The Yellow River flowed toward the central area of Xingxinghai through the western Gyaring Lake and Ngöring Lake before flowing eastward and was impacted by the topographical features. This was where the river wetland was mainly distributed. Lake wetlands were mainly distributed in the Gyaring, Ngöring, and Xingxinghai lakes, while marsh wetland was concentrated in the southwest of Ngöring Lake, and marsh meadow was concentrated in the southern and eastern areas of the YRSNP. Land use/cover types other than wetlands and grasslands were classified as others.
The accuracy of the YRSNP alpine wetland remote sensing classification results from 2000 to 2020 was evaluated by combining the field survey and sample transfer to a complete sample set, and using an accuracy assessment to complete a classification accuracy evaluation. The results are shown in Table 4. The results were combined with user accuracy, overall accuracy, and the Kappa coefficient. Between 2000 and 2020, the overall accuracy range of the YRSNP was 0.8295 to 0.8878, with 0.8492 serving as the average accuracy. The range of the Kappa coefficient from 0.7777 to 0.8538 and its average value of 0.8051 showed that the remote sensing classification accuracy of the YRSNP from 2000 to 2020 was reliable. User accuracy for river wetlands in terms of wetland categories ranged from 0.7938 to 0.9090, with an average user accuracy of 0.8636. Lake wetlands had a user accuracy that ranged from 0.8936 to 0.9999, with an average of 0.9700. With an average user accuracy of 0.7496, the user accuracy for marsh wetlands varied from 0.5714 to 0.9166. The user accuracy of marsh meadows ranges from 0.6086 to 0.8717, with an average of 0.7379. The user accuracy of grassland ranges from 0.7160 to 0.8553, with an average of 0.7842. The user accuracy of others ranges from 0.8965 to 0.9999, with an average of 0.9454. The most accurate type of wetland was a lake, while marsh wetland, marsh meadow, and grassland had the lowest accuracy and were not easy to distinguish.

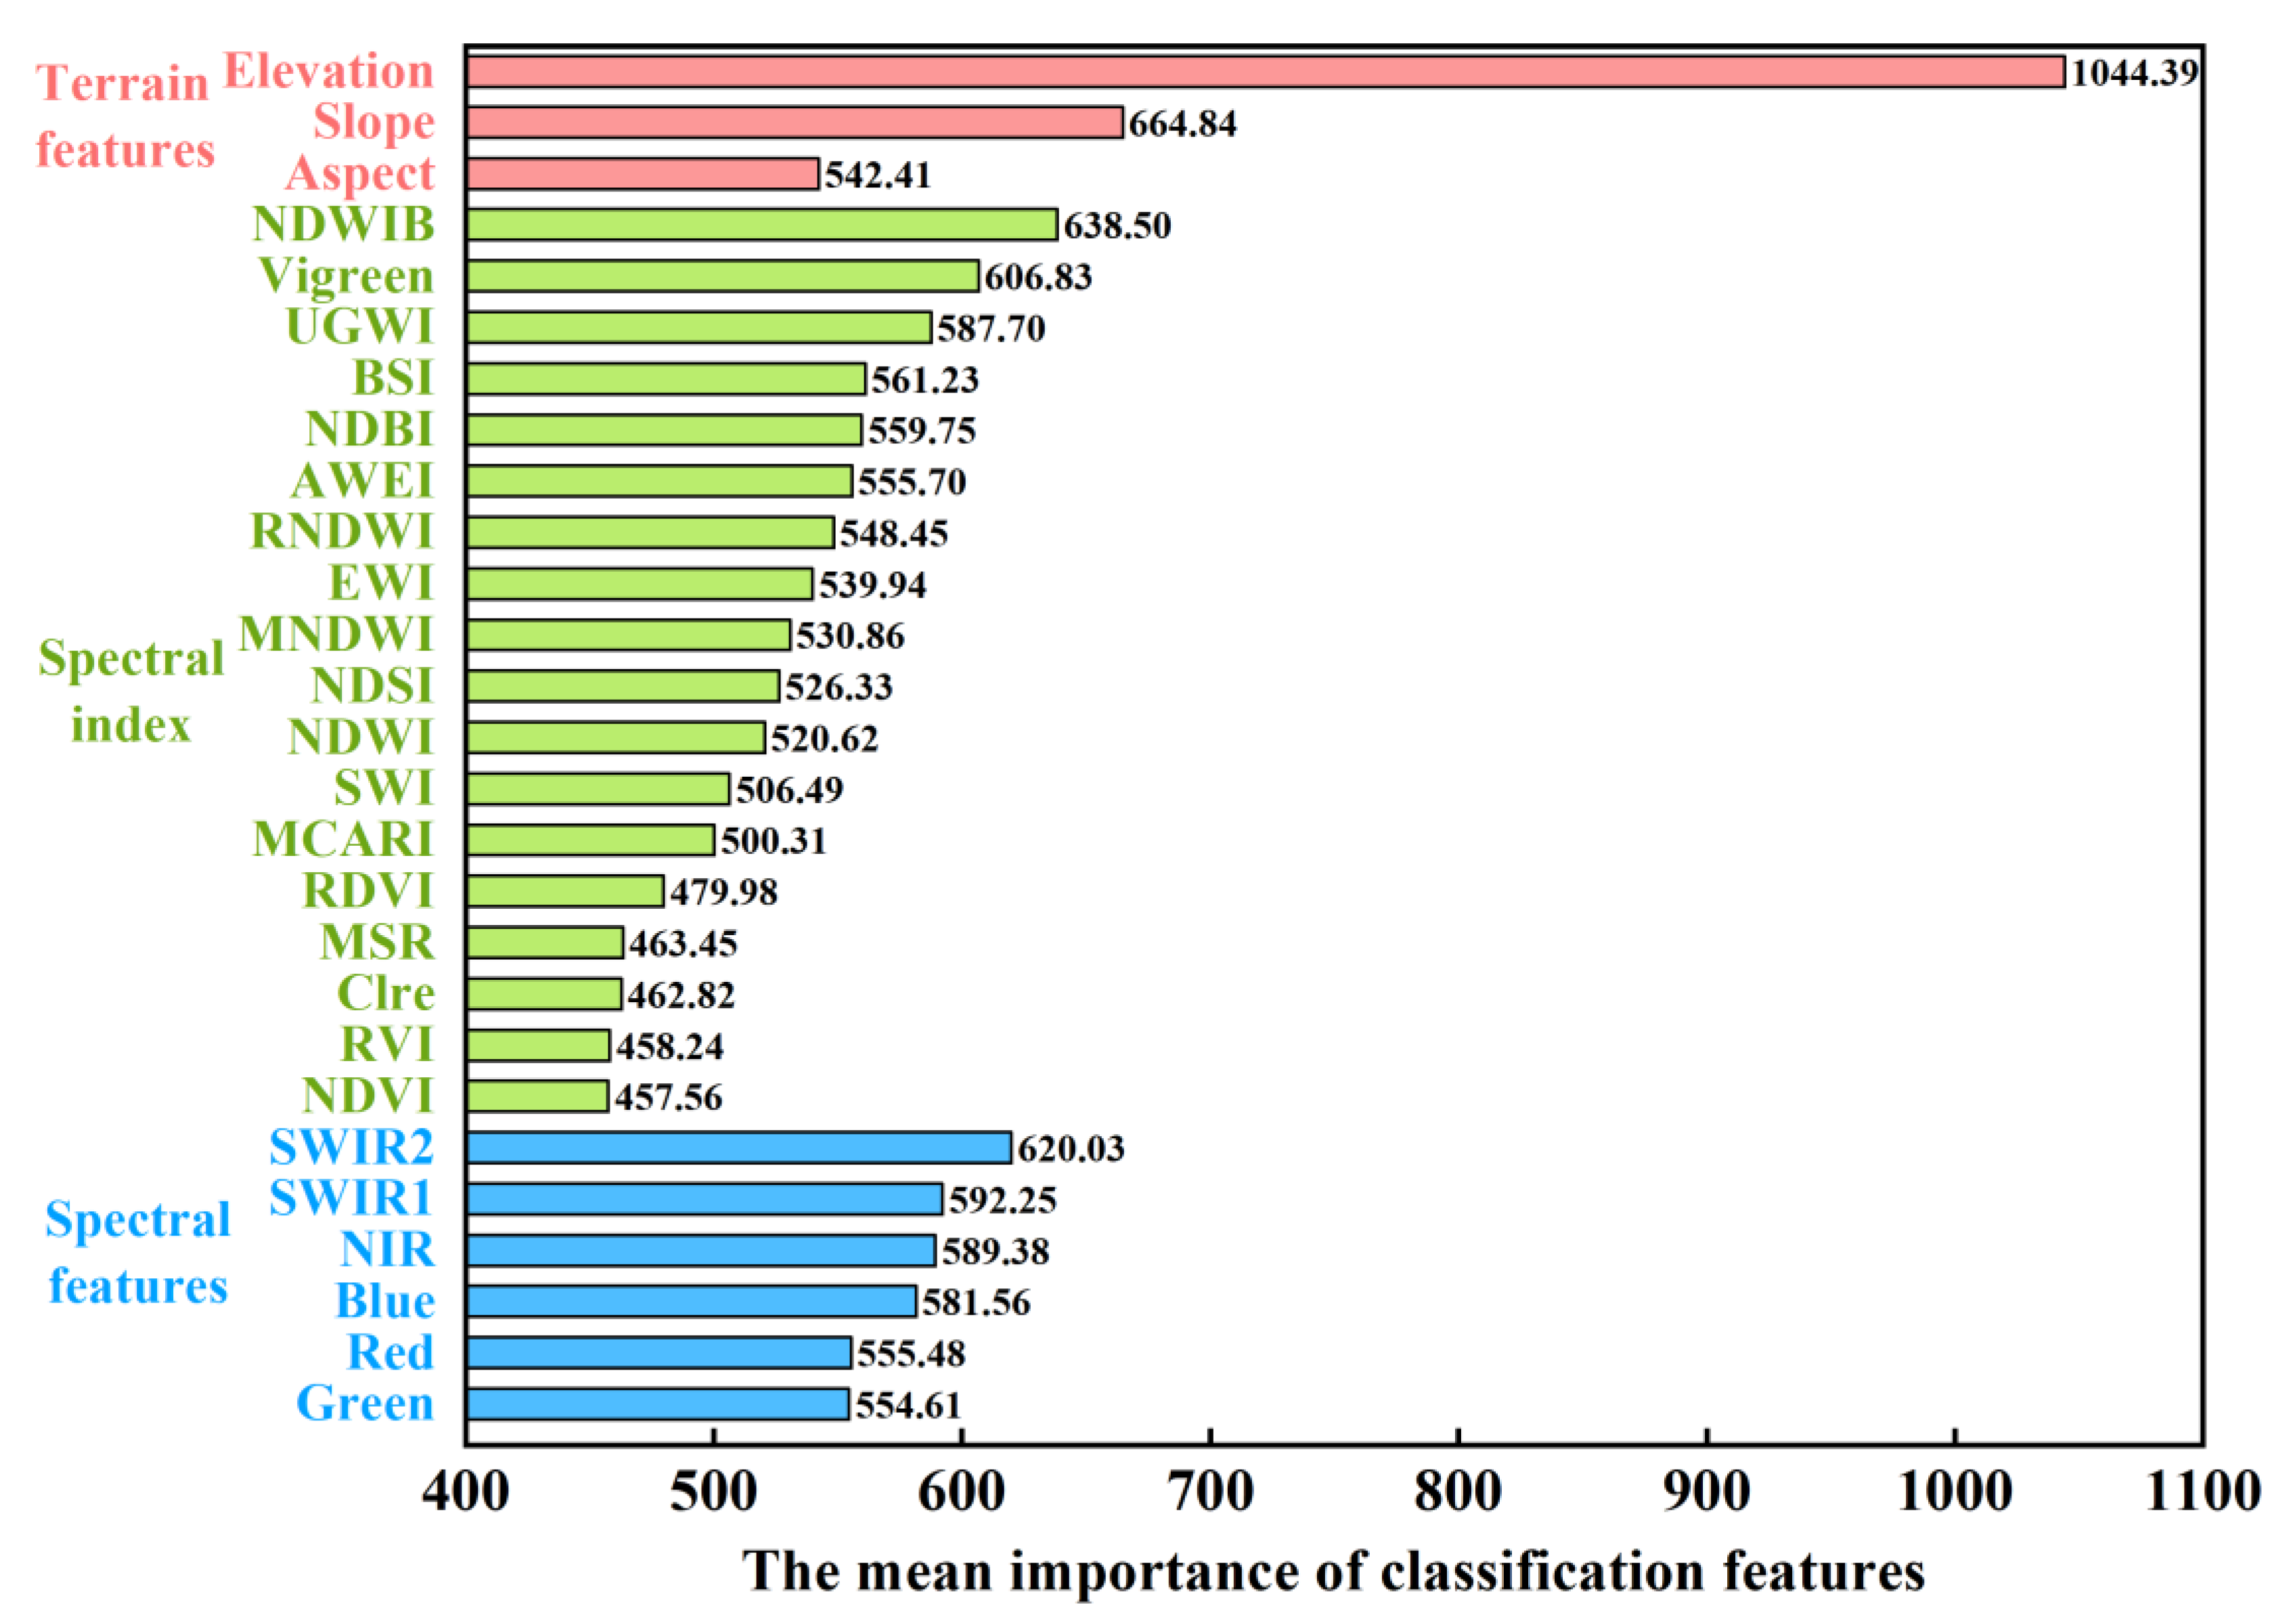
3.2. Importance of Classification Features

Figure 4 displayed the rankings for the average importance classification features. The findings demonstrated that topographic features were substantially more relevant than spectral features and spectral indexes. Elevation (1044.39) was the most significant classification feature in the topographic feature, NDWI_B (638.50) was the most significant classification feature in a spectral index, and SWIR2 (620.03) was the most significant classification feature in a spectral feature. Elevation, slope, UGWI, Vigreen, NDWI_B, Blue, NIR, SWIR1, and SWIR2 are all classification features that are above the importance mean.

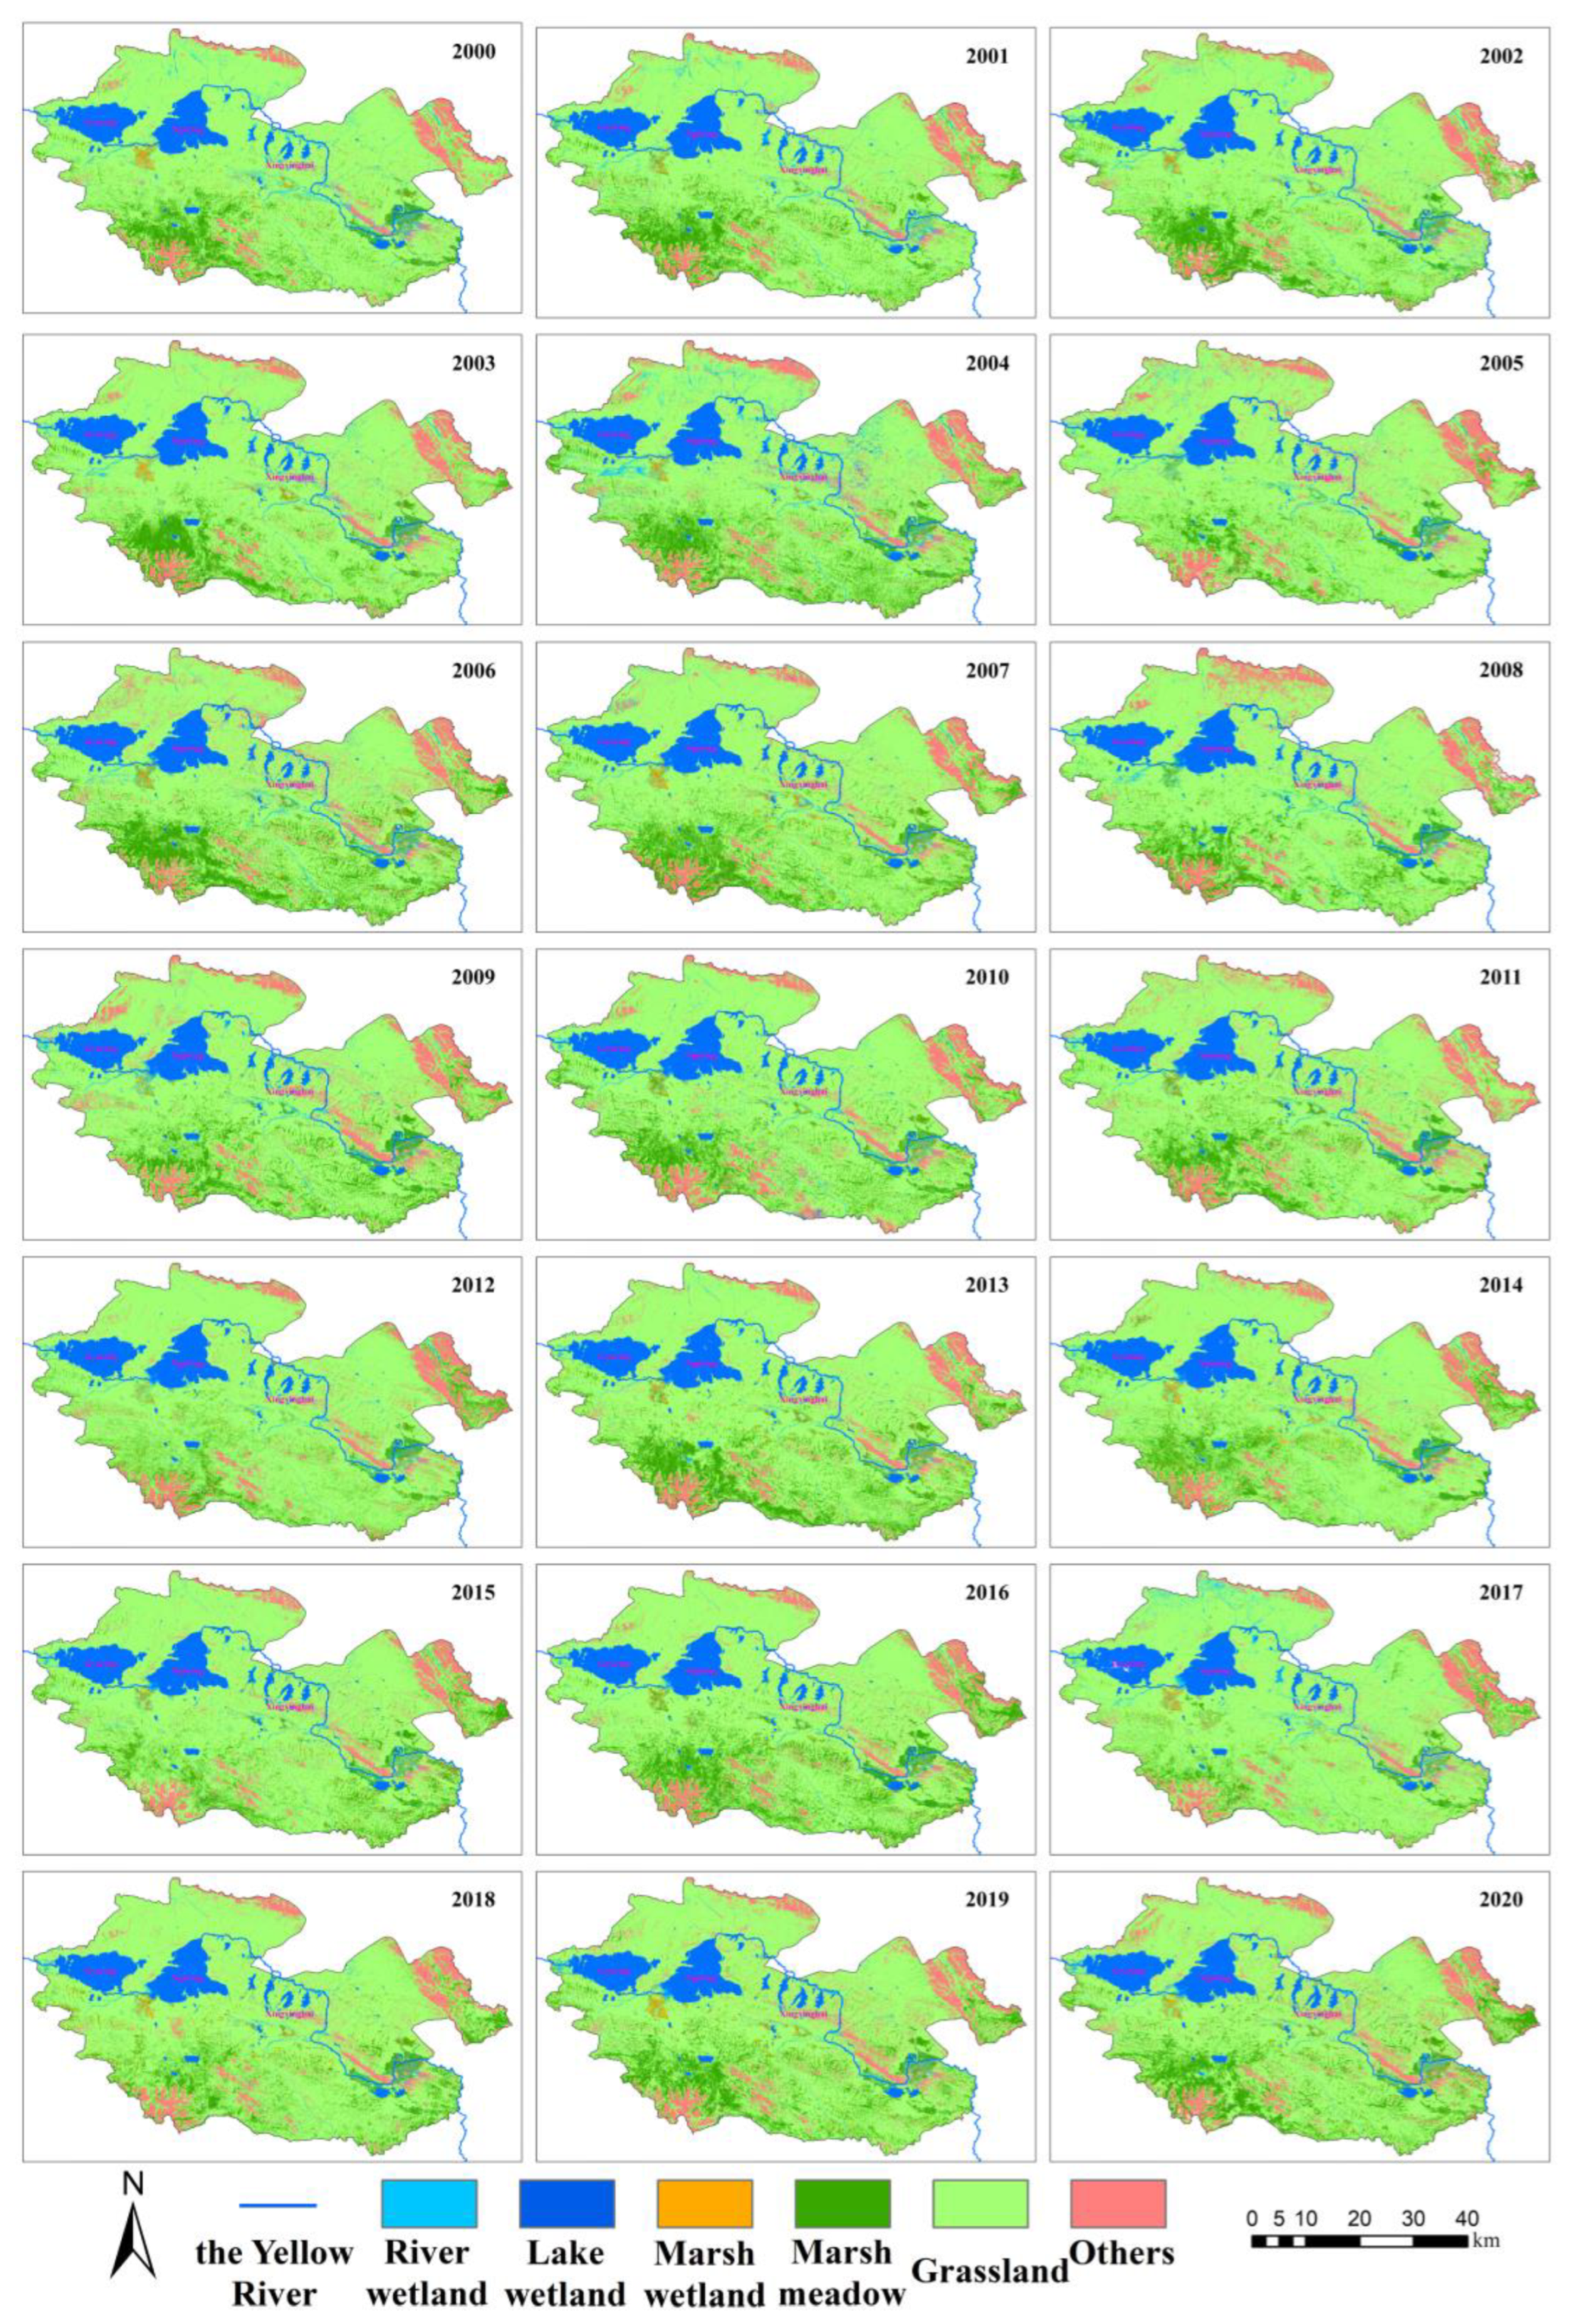
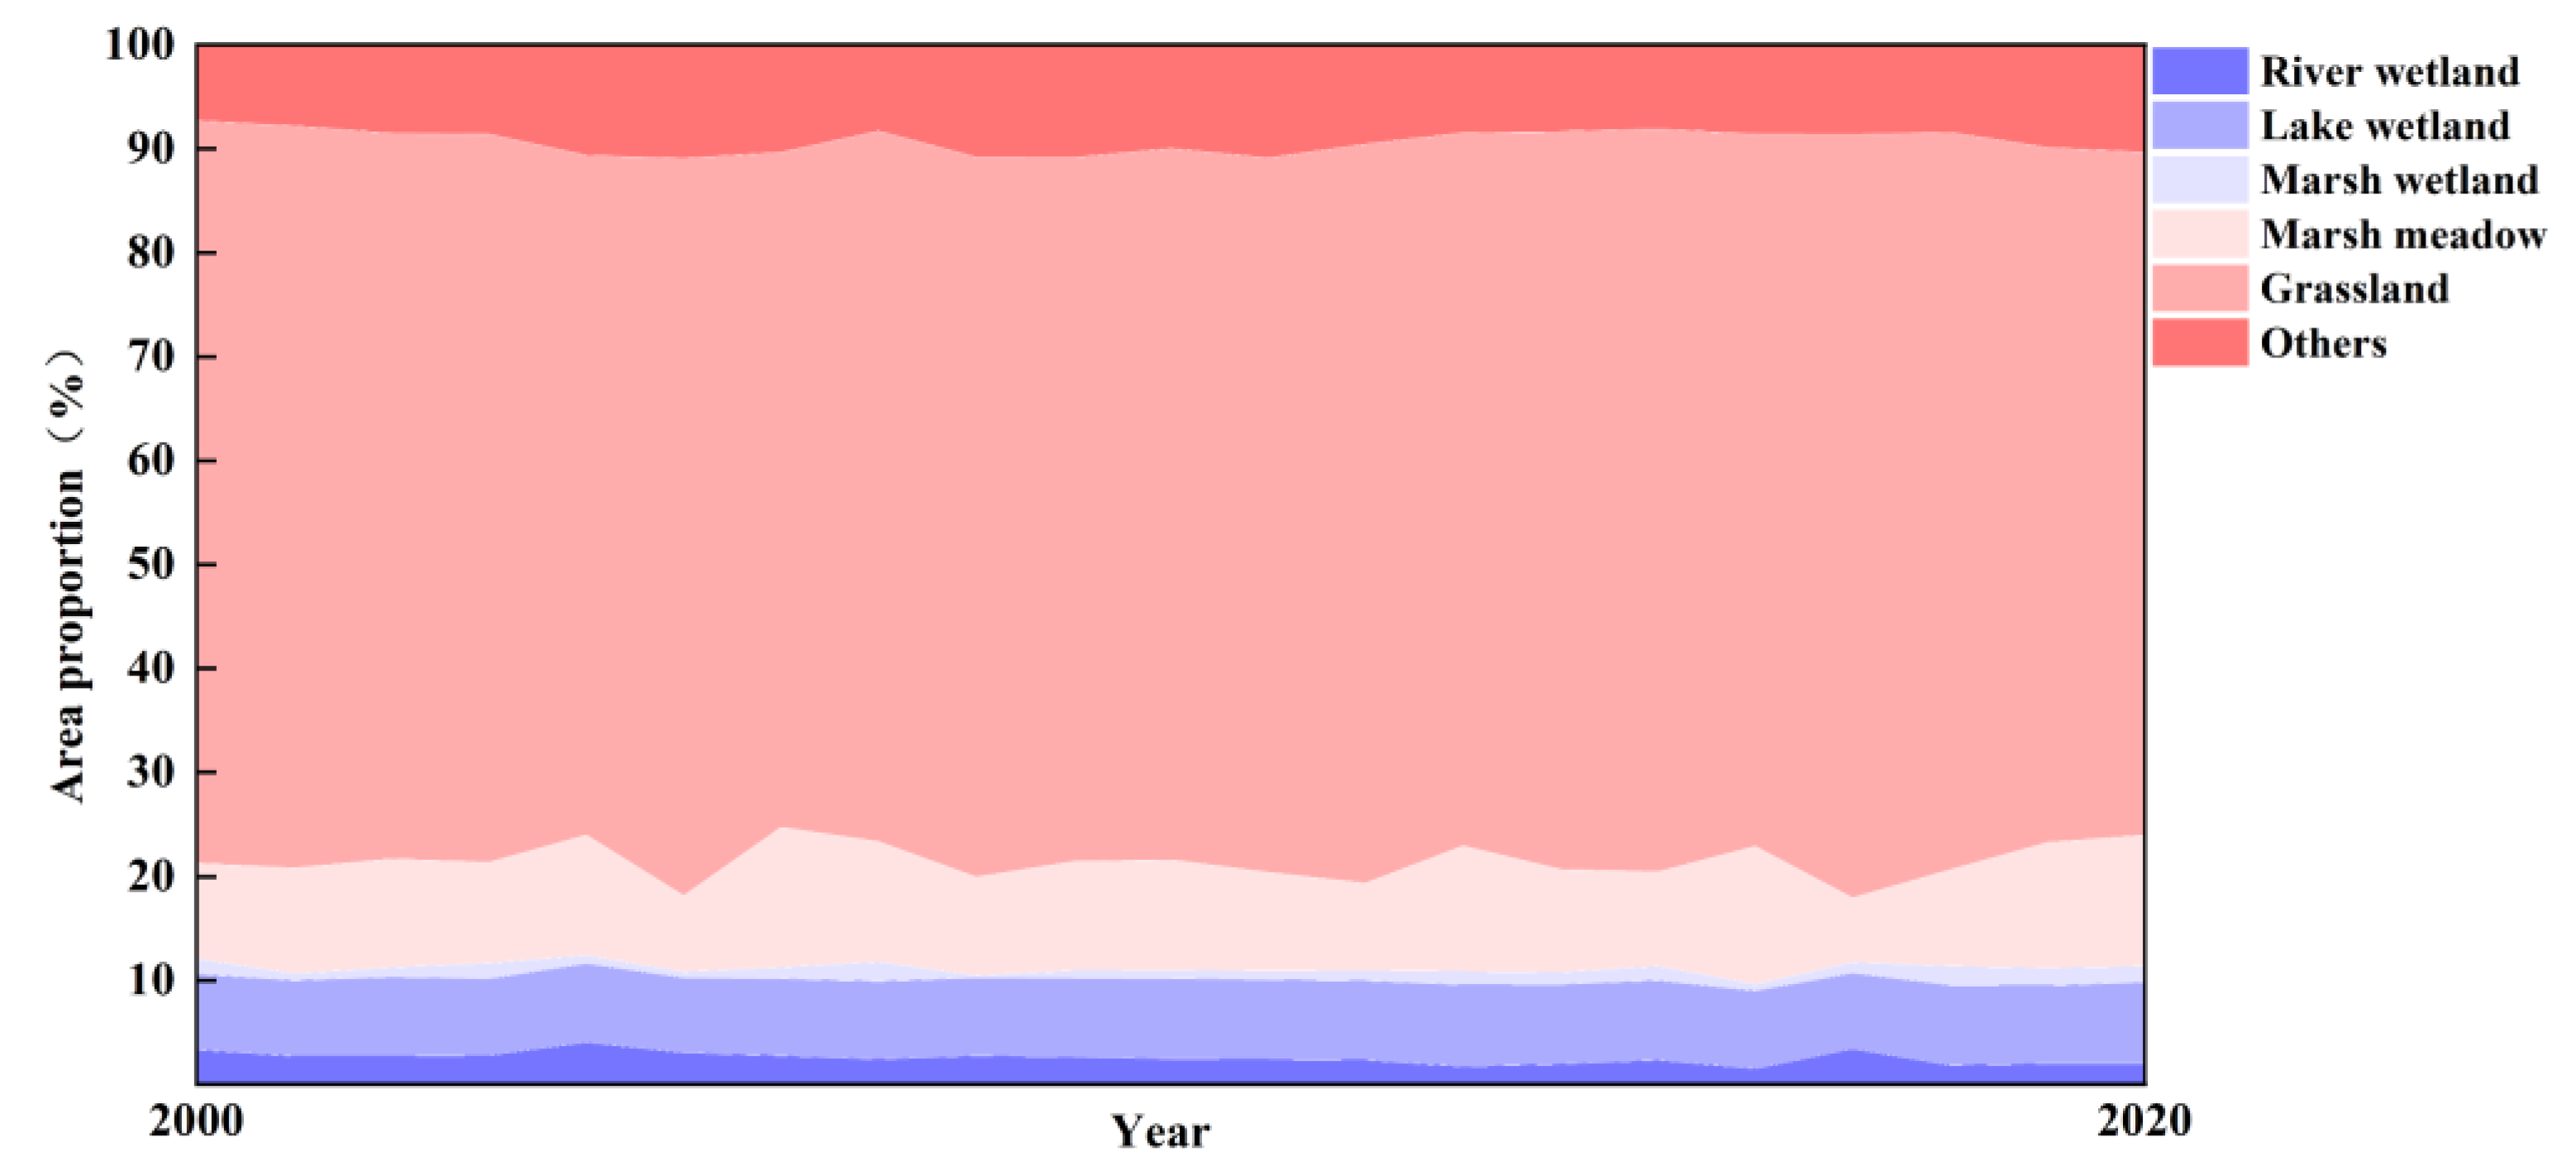
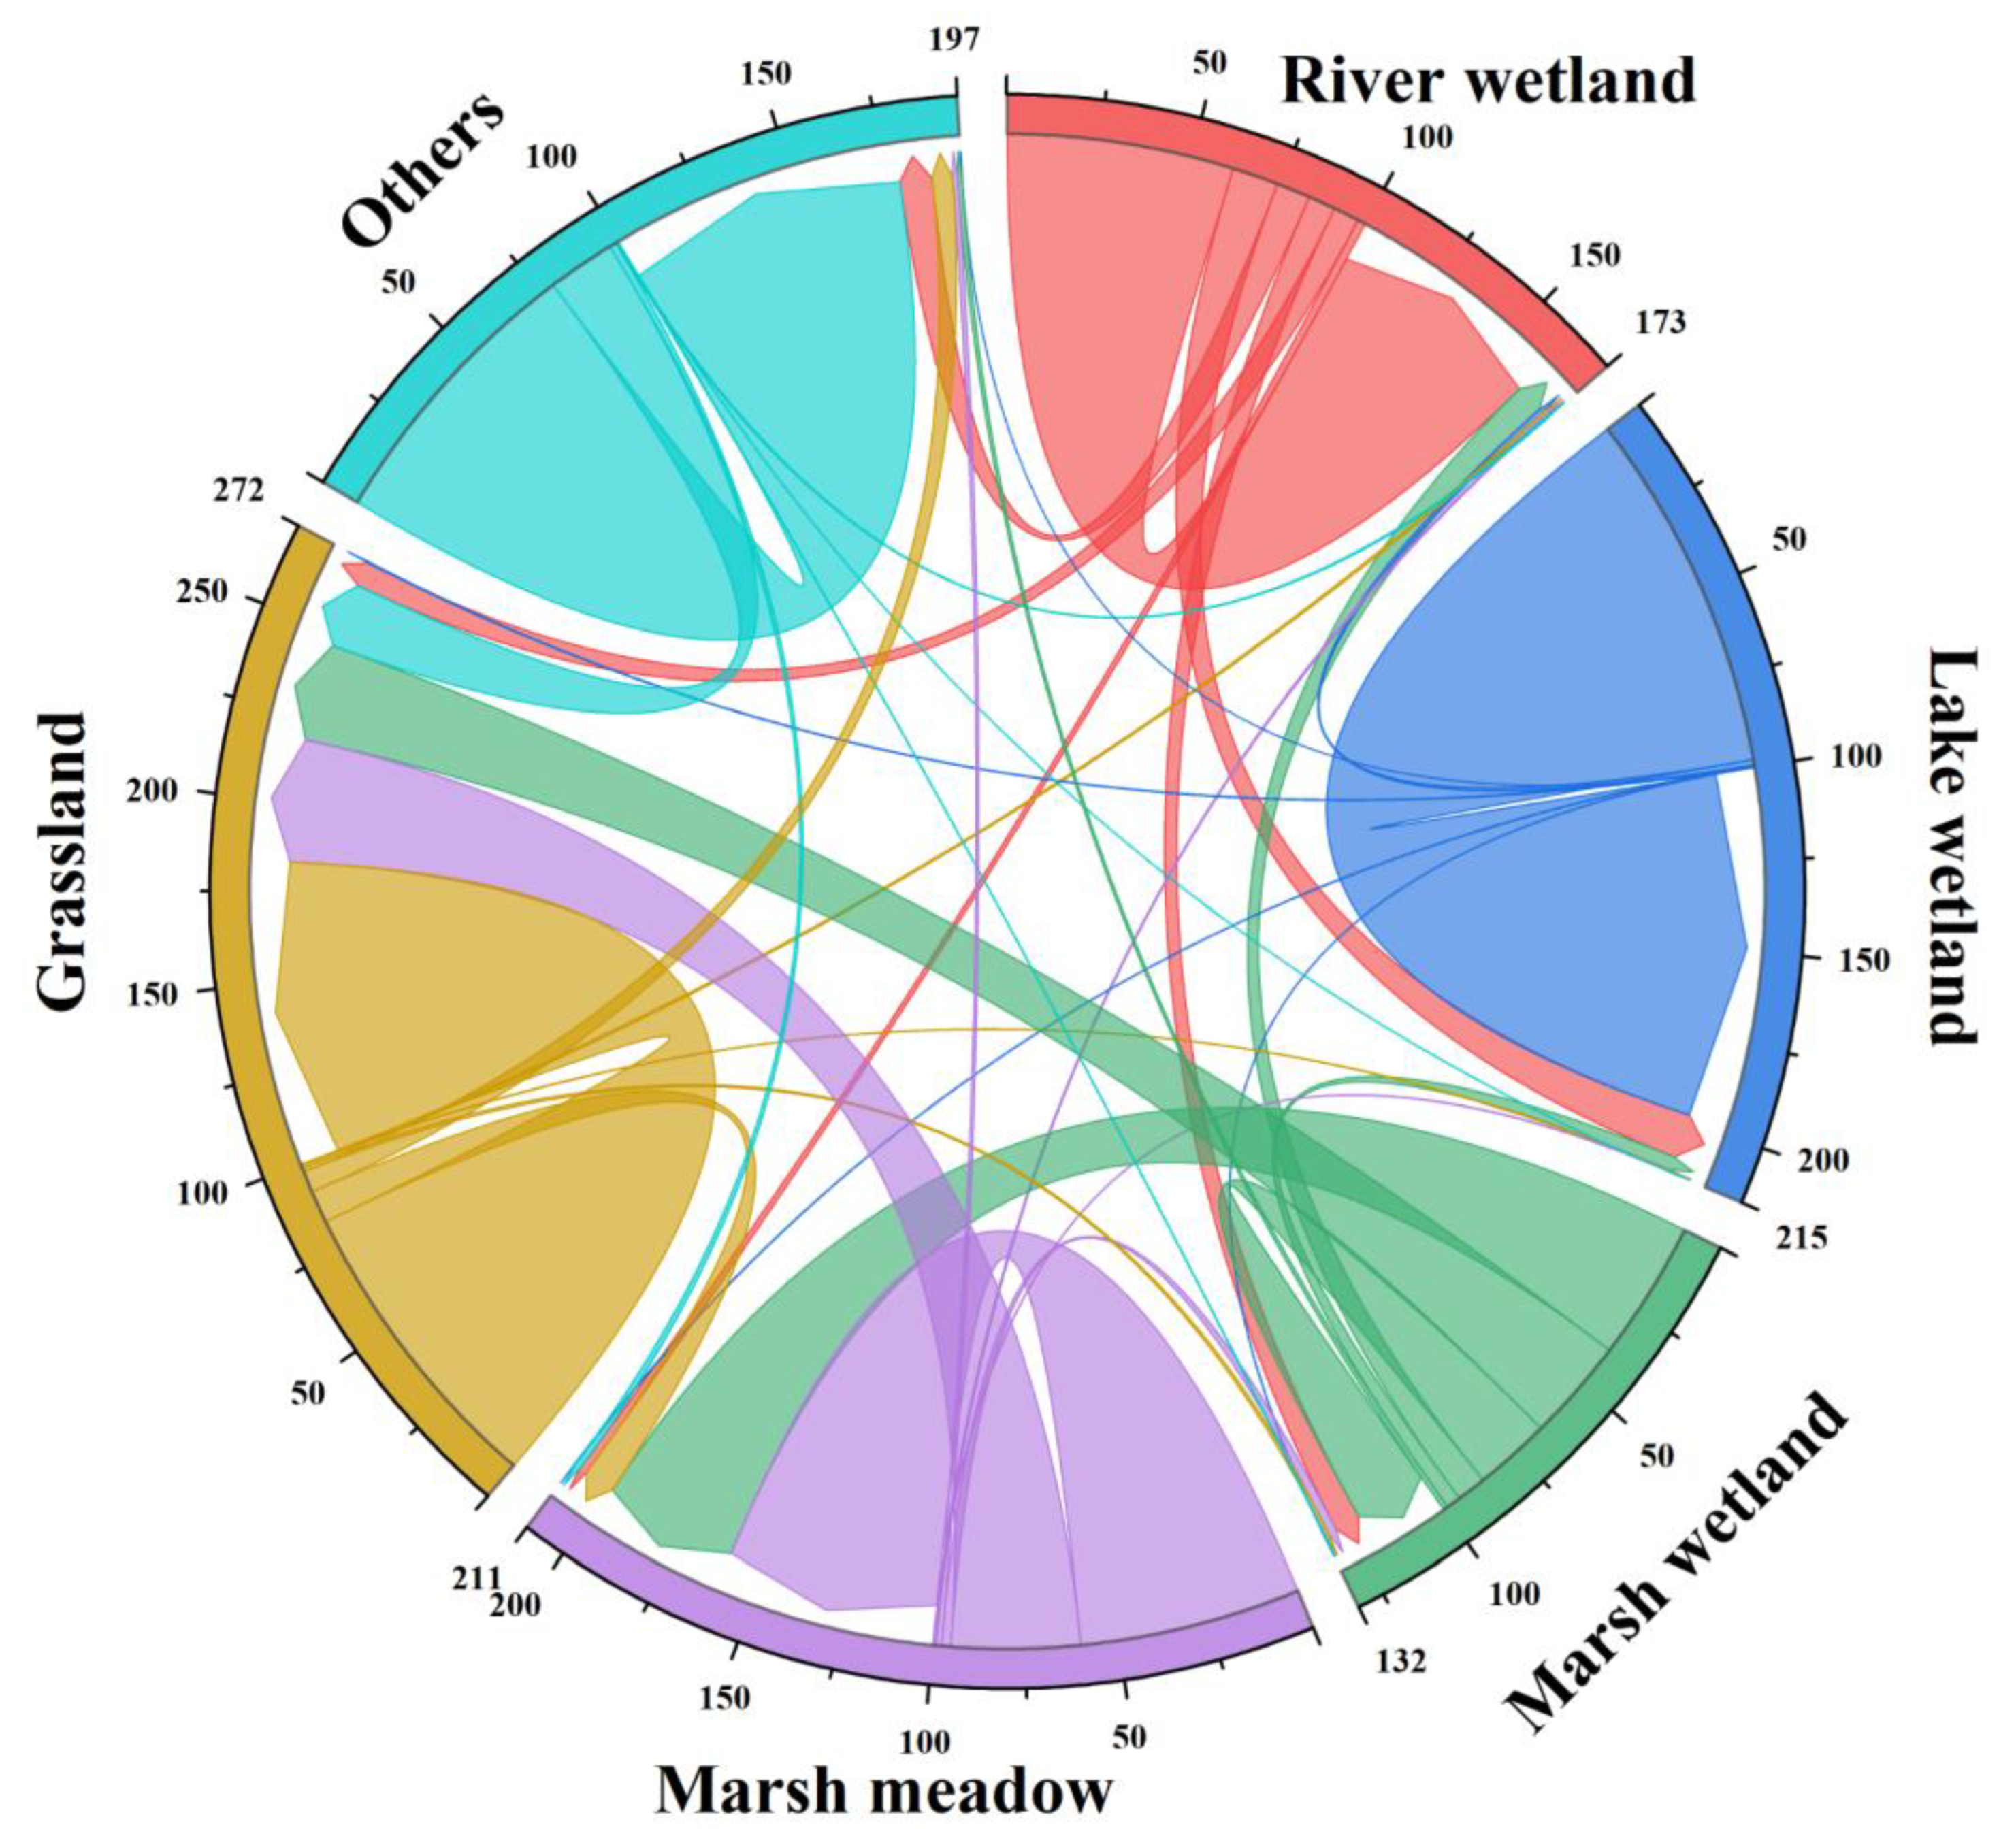
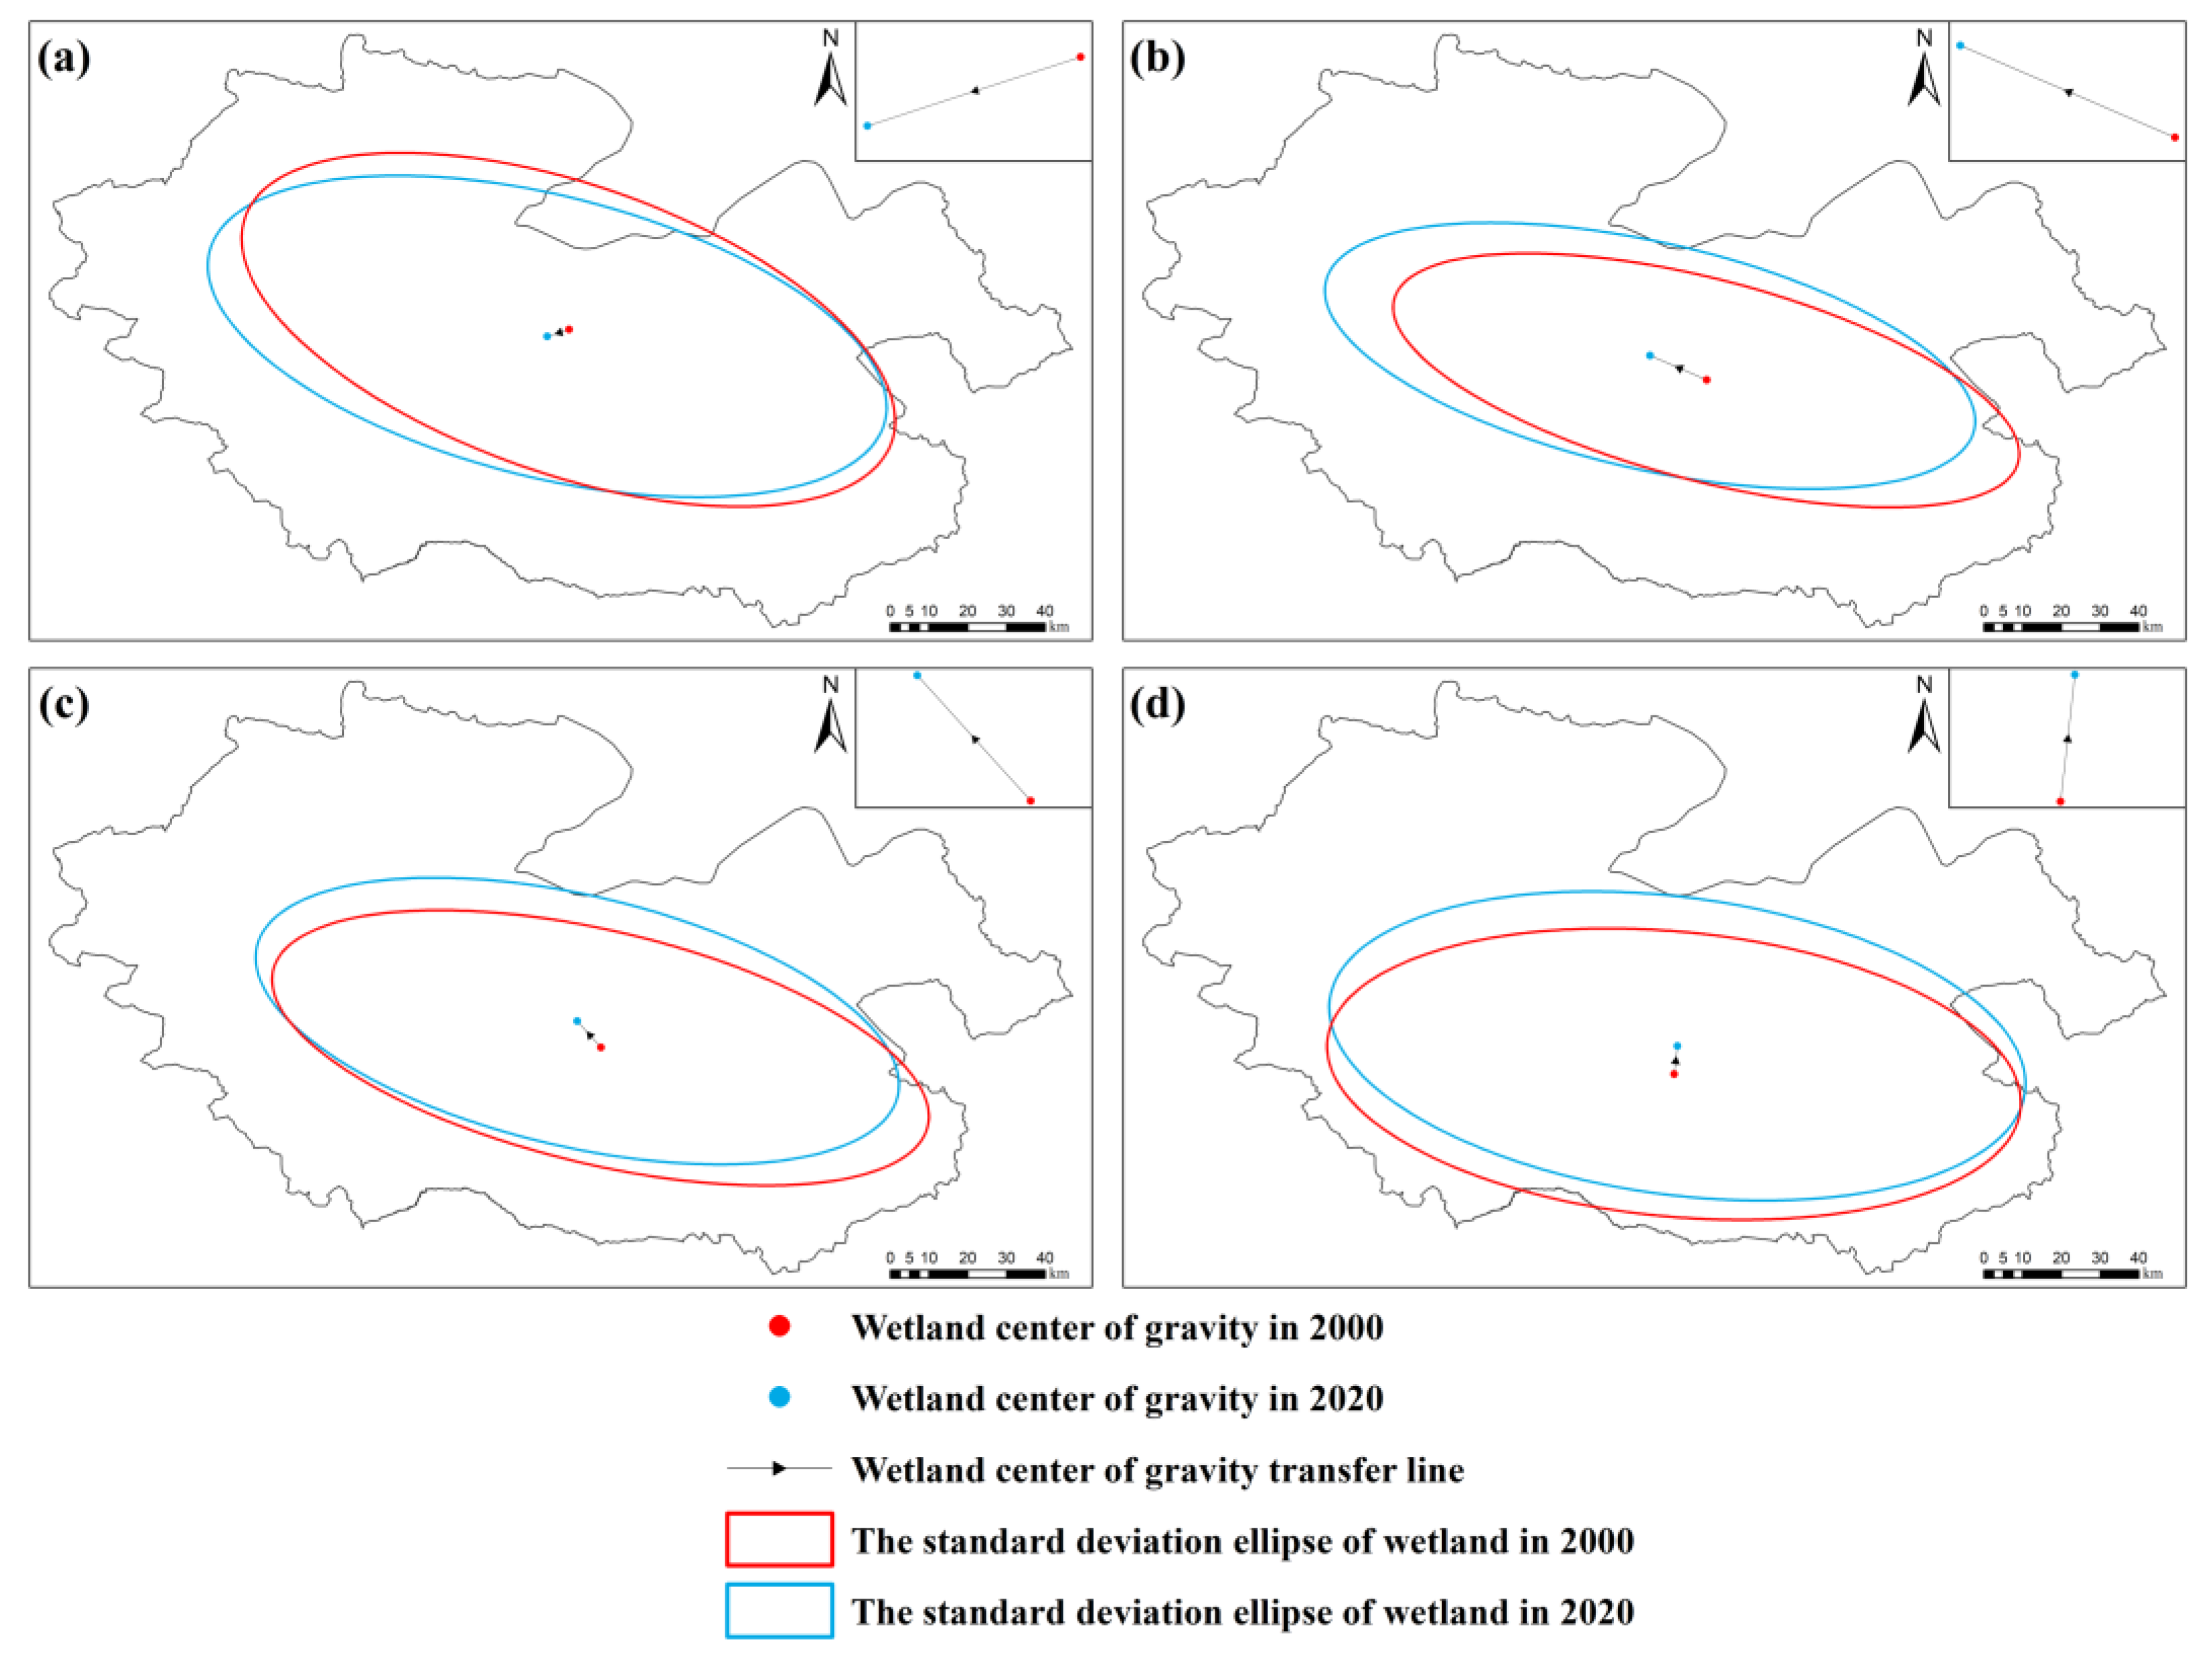
3.3. Dynamic Changes Pattern

Figure 5 depicts the changes in the proportion of various land use types in the study area from 2000 to 2020. The results indicated that from 4044 km2 in 2000 to 4561 km2 in 2020, the wetland area had grown. Between 2000 and 2020, the proportion of river wetlands in the study area decreased from 3.32% to 2.00%, whereas the proportion of lake wetlands increased from 7.23% to 7.81%. While the proportion of marsh wetlands increased from 1.47% to 1.53%, the proportion of marsh meadows increased from 9.19% to 12.62%. While the proportion of grassland decreased from 71.42% to 65.66%, the proportion of others increased from 7.31% to 10.35%. Only river wetlands had drastically decreased, with marsh meadows increasing by 3.43% being the most significant change in the wetland category.
The transfer of land use between different categories can be better understood using the land use transfer matrix. The land use transfer matrix for the study area from 2000 to 2020 is shown in Figure 6. According to the results, between 2000 and 2020, 70.10% of river wetland areas remained unchanged, 10.83% of river wetland was converted to grassland, 7.28% was converted to lake wetland, 4.40% was converted to marsh wetland, 4.26% was converted to others, and 3.13% was converted to marsh meadow. Marsh wetlands were the type that transferred most steadily into river wetlands. In total, 92.57% of the areas of lake wetland remained the same; 4.52% were converted into river wetlands; 1.92% into grassland; 0.46% into marsh wetlands; 0.38% into marsh meadow; and 0.15% into others. River wetland was the one that transferred the most into lake wetland. In total, 22.77% of the area of the marsh wetlands was left unaltered, 44.46% was converted to grassland, and 22.87% was converted to marsh meadow. A total of 52.07% of the area of marsh meadow remained unchanged, while 43.04% was converted to grassland. A total of 87.57% of the grassland areas remained unchanged, and 6.07% was converted to marsh meadows. Others had 59.45% of their areas unchanged, and 35.57% was converted to grassland.
We can further analyze the spatial changes of wetlands in the study area from 2000 to 2020 by merging the wetland gravity center and standard deviation ellipses of the study area in 2000 and 2020. Figure 7 displays the results. The gravity center of the river wetland in the study area moved to the southwest by 5007.04 m from 2000 to 2020, and the standard deviation ellipse area decreased by 95.49 km2. The spatial transfer of river wetland was significantly influenced by the change in the X-axis direction. The center of gravity of the lake wetland in the study area moved to the northwest by 13,615.22 m from 2000 to 2020, and the standard deviation ellipse area increased by 905.81 km2. The spatial transfer of the lake wetland was influenced by changes in the X-axis and Y-axis directions. The center of gravity of the marsh wetland in the study area moved to the northwest by 8486.27 m between 2000 and 2020, and the standard deviation ellipse area increased by 352.64 km2. The spatial transfer of marsh wetland was significantly influenced by the change in the X-axis direction. The center of gravity of marsh meadow in the study area moved to the northeast by 7246.17 m between 2000 and 2020, and the standard deviation ellipse area increased by 426.87 km2. The spatial transfer of marsh meadows was significantly influenced by the change in the X-axis direction. The results show that except for river wetlands, other wetland types moved toward the concentrated distribution area of lakes in the northeast of the YRSNP.

3.4. Dynamic Changes Characteristics of Driving Factors

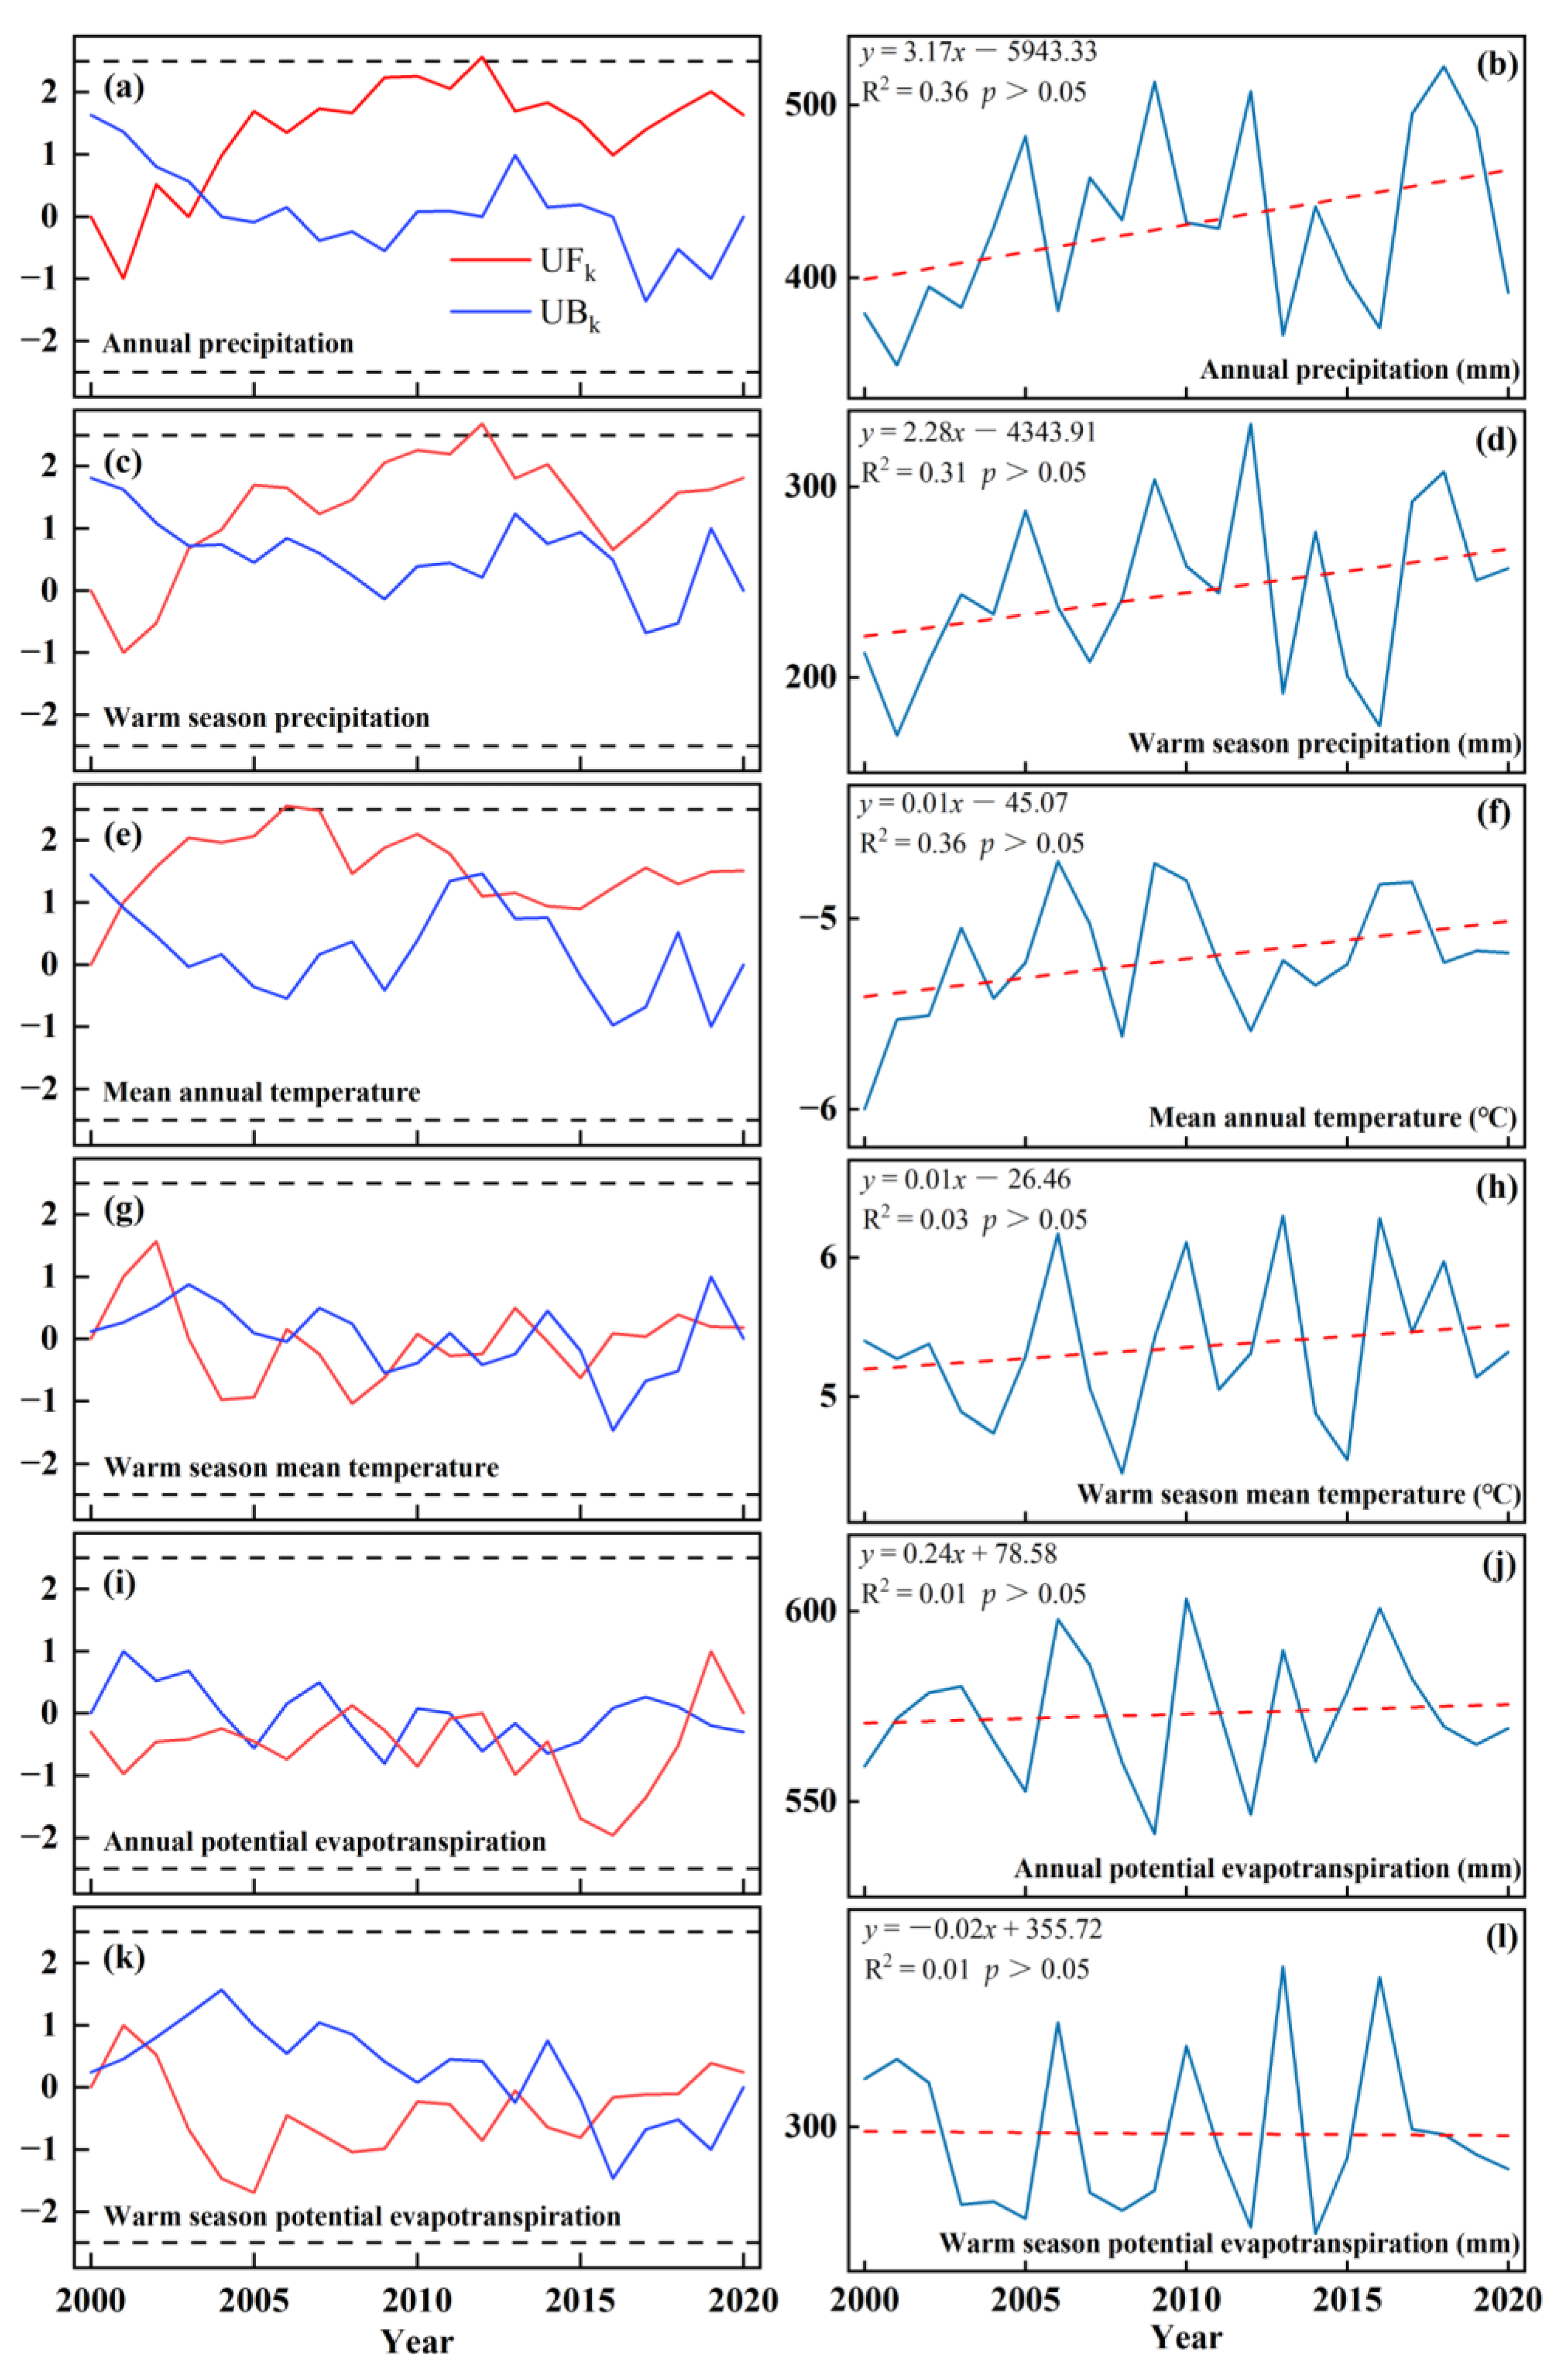
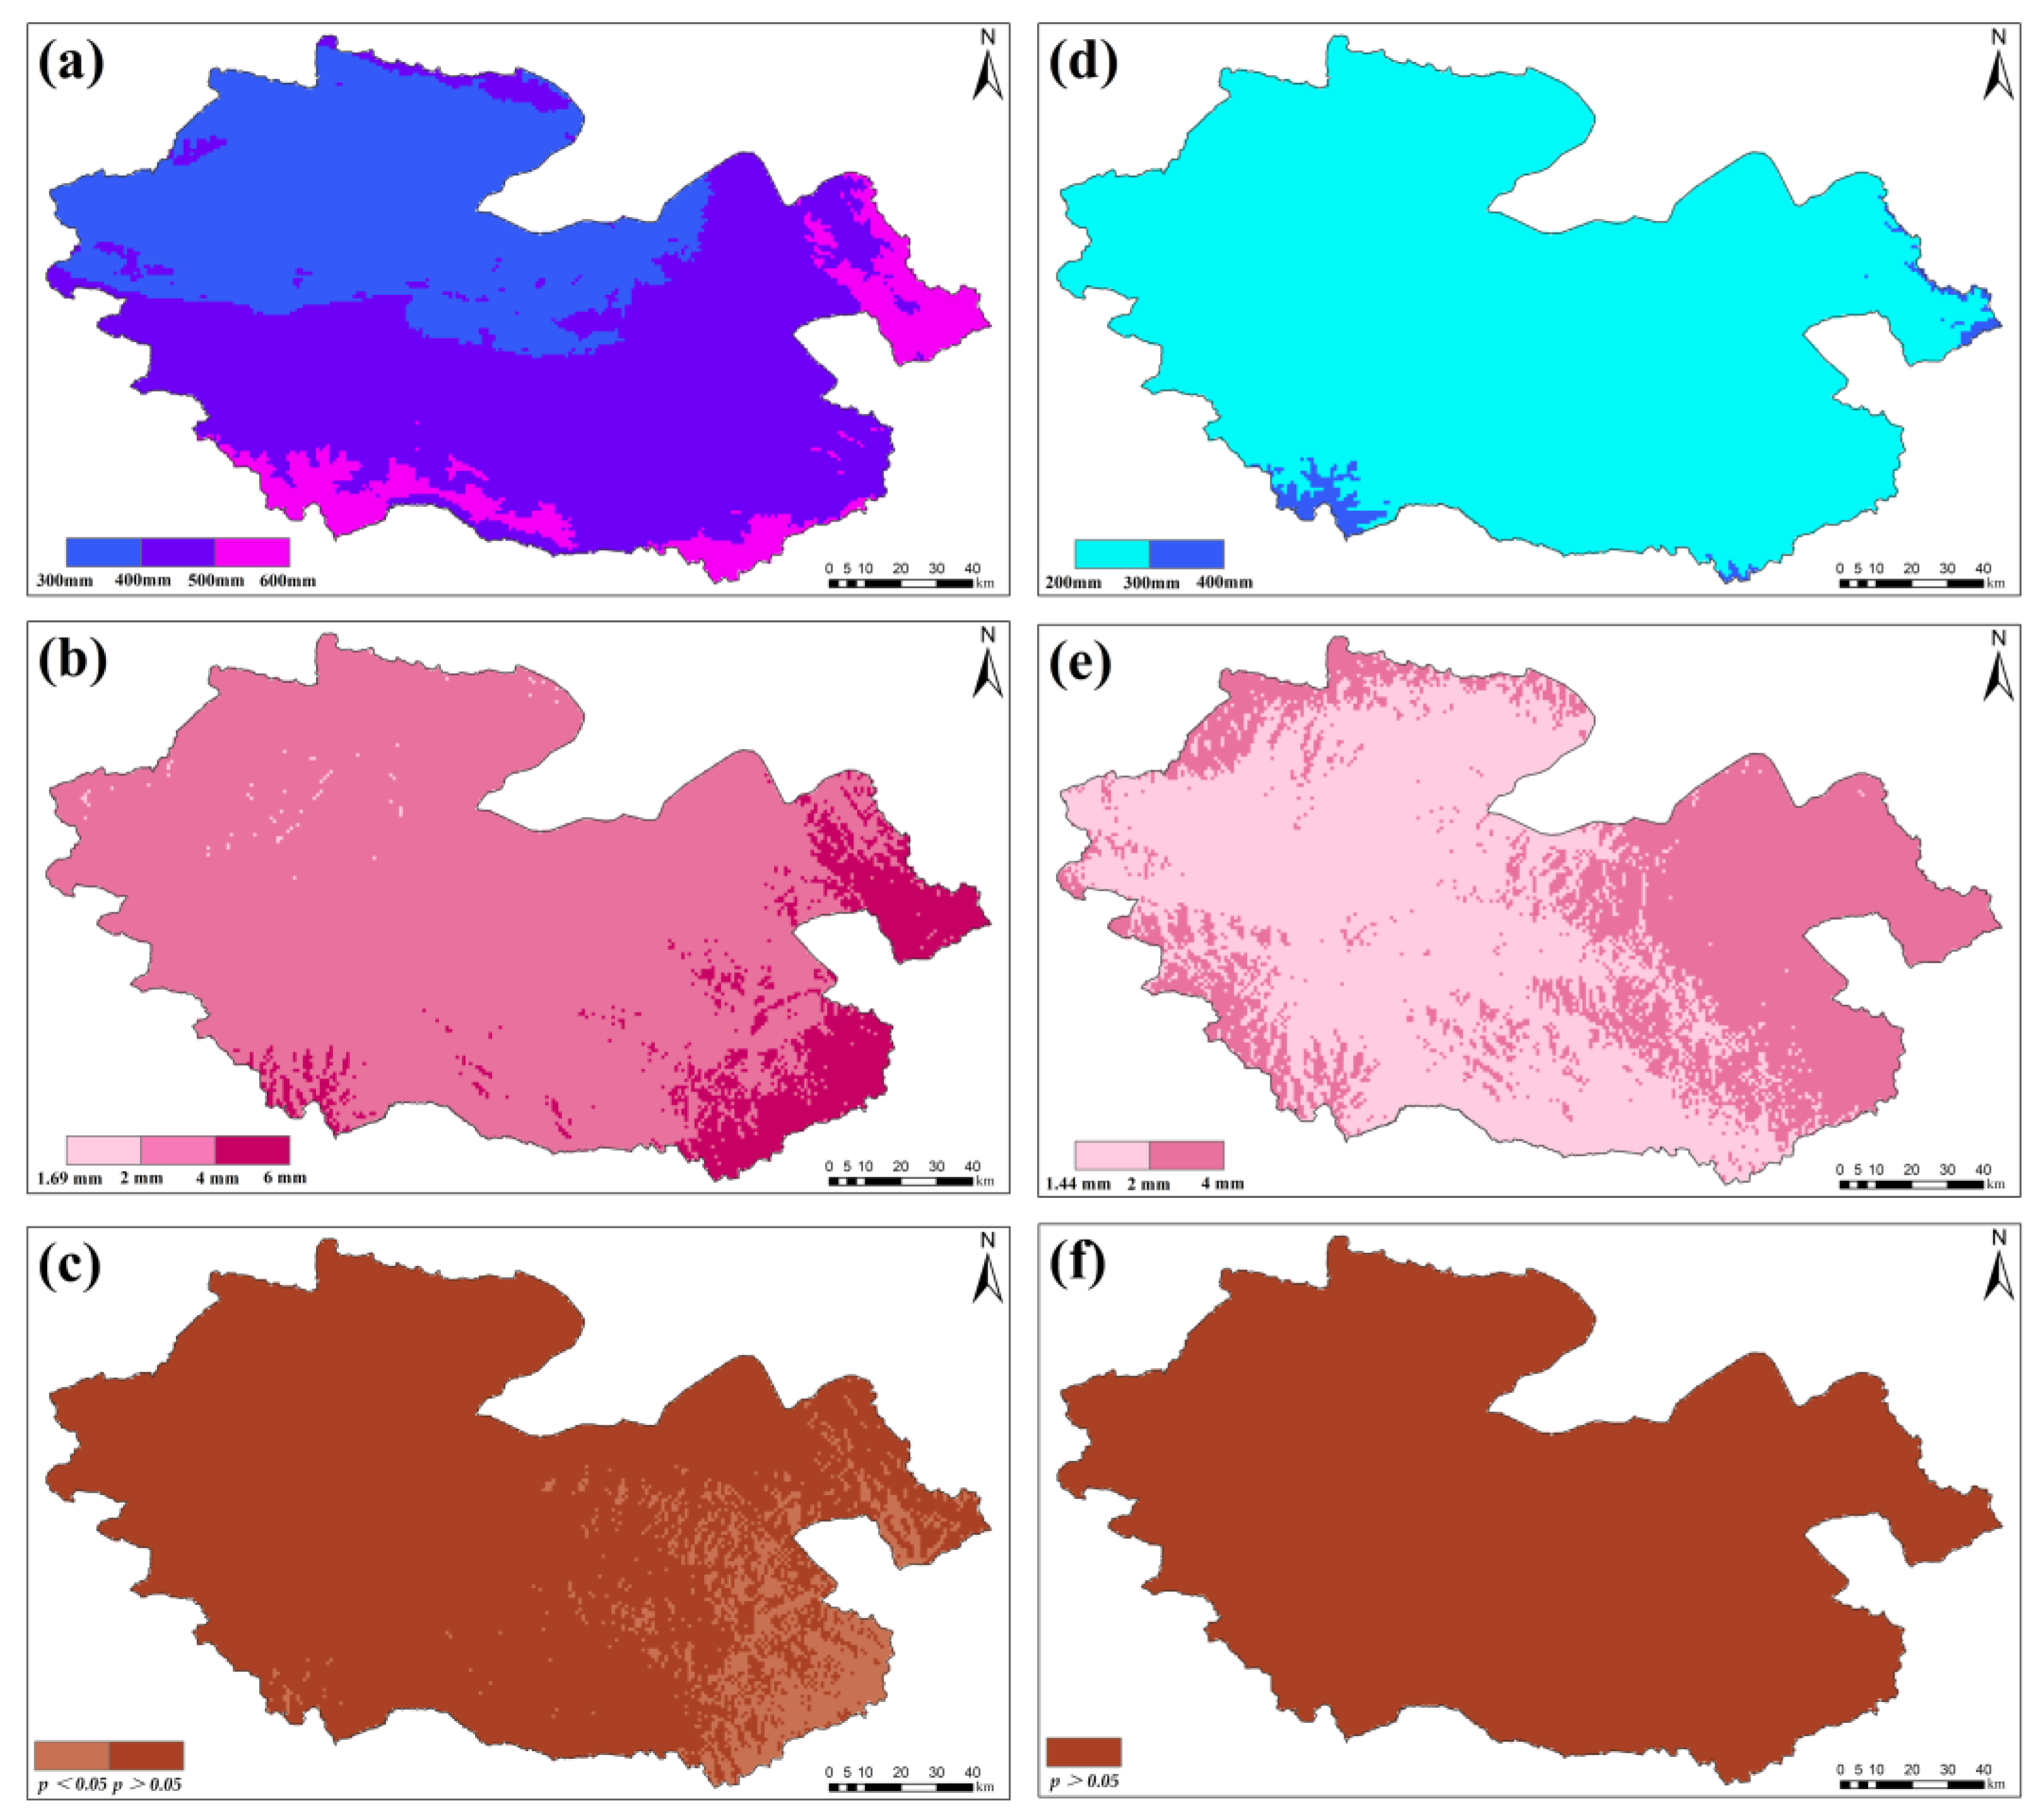
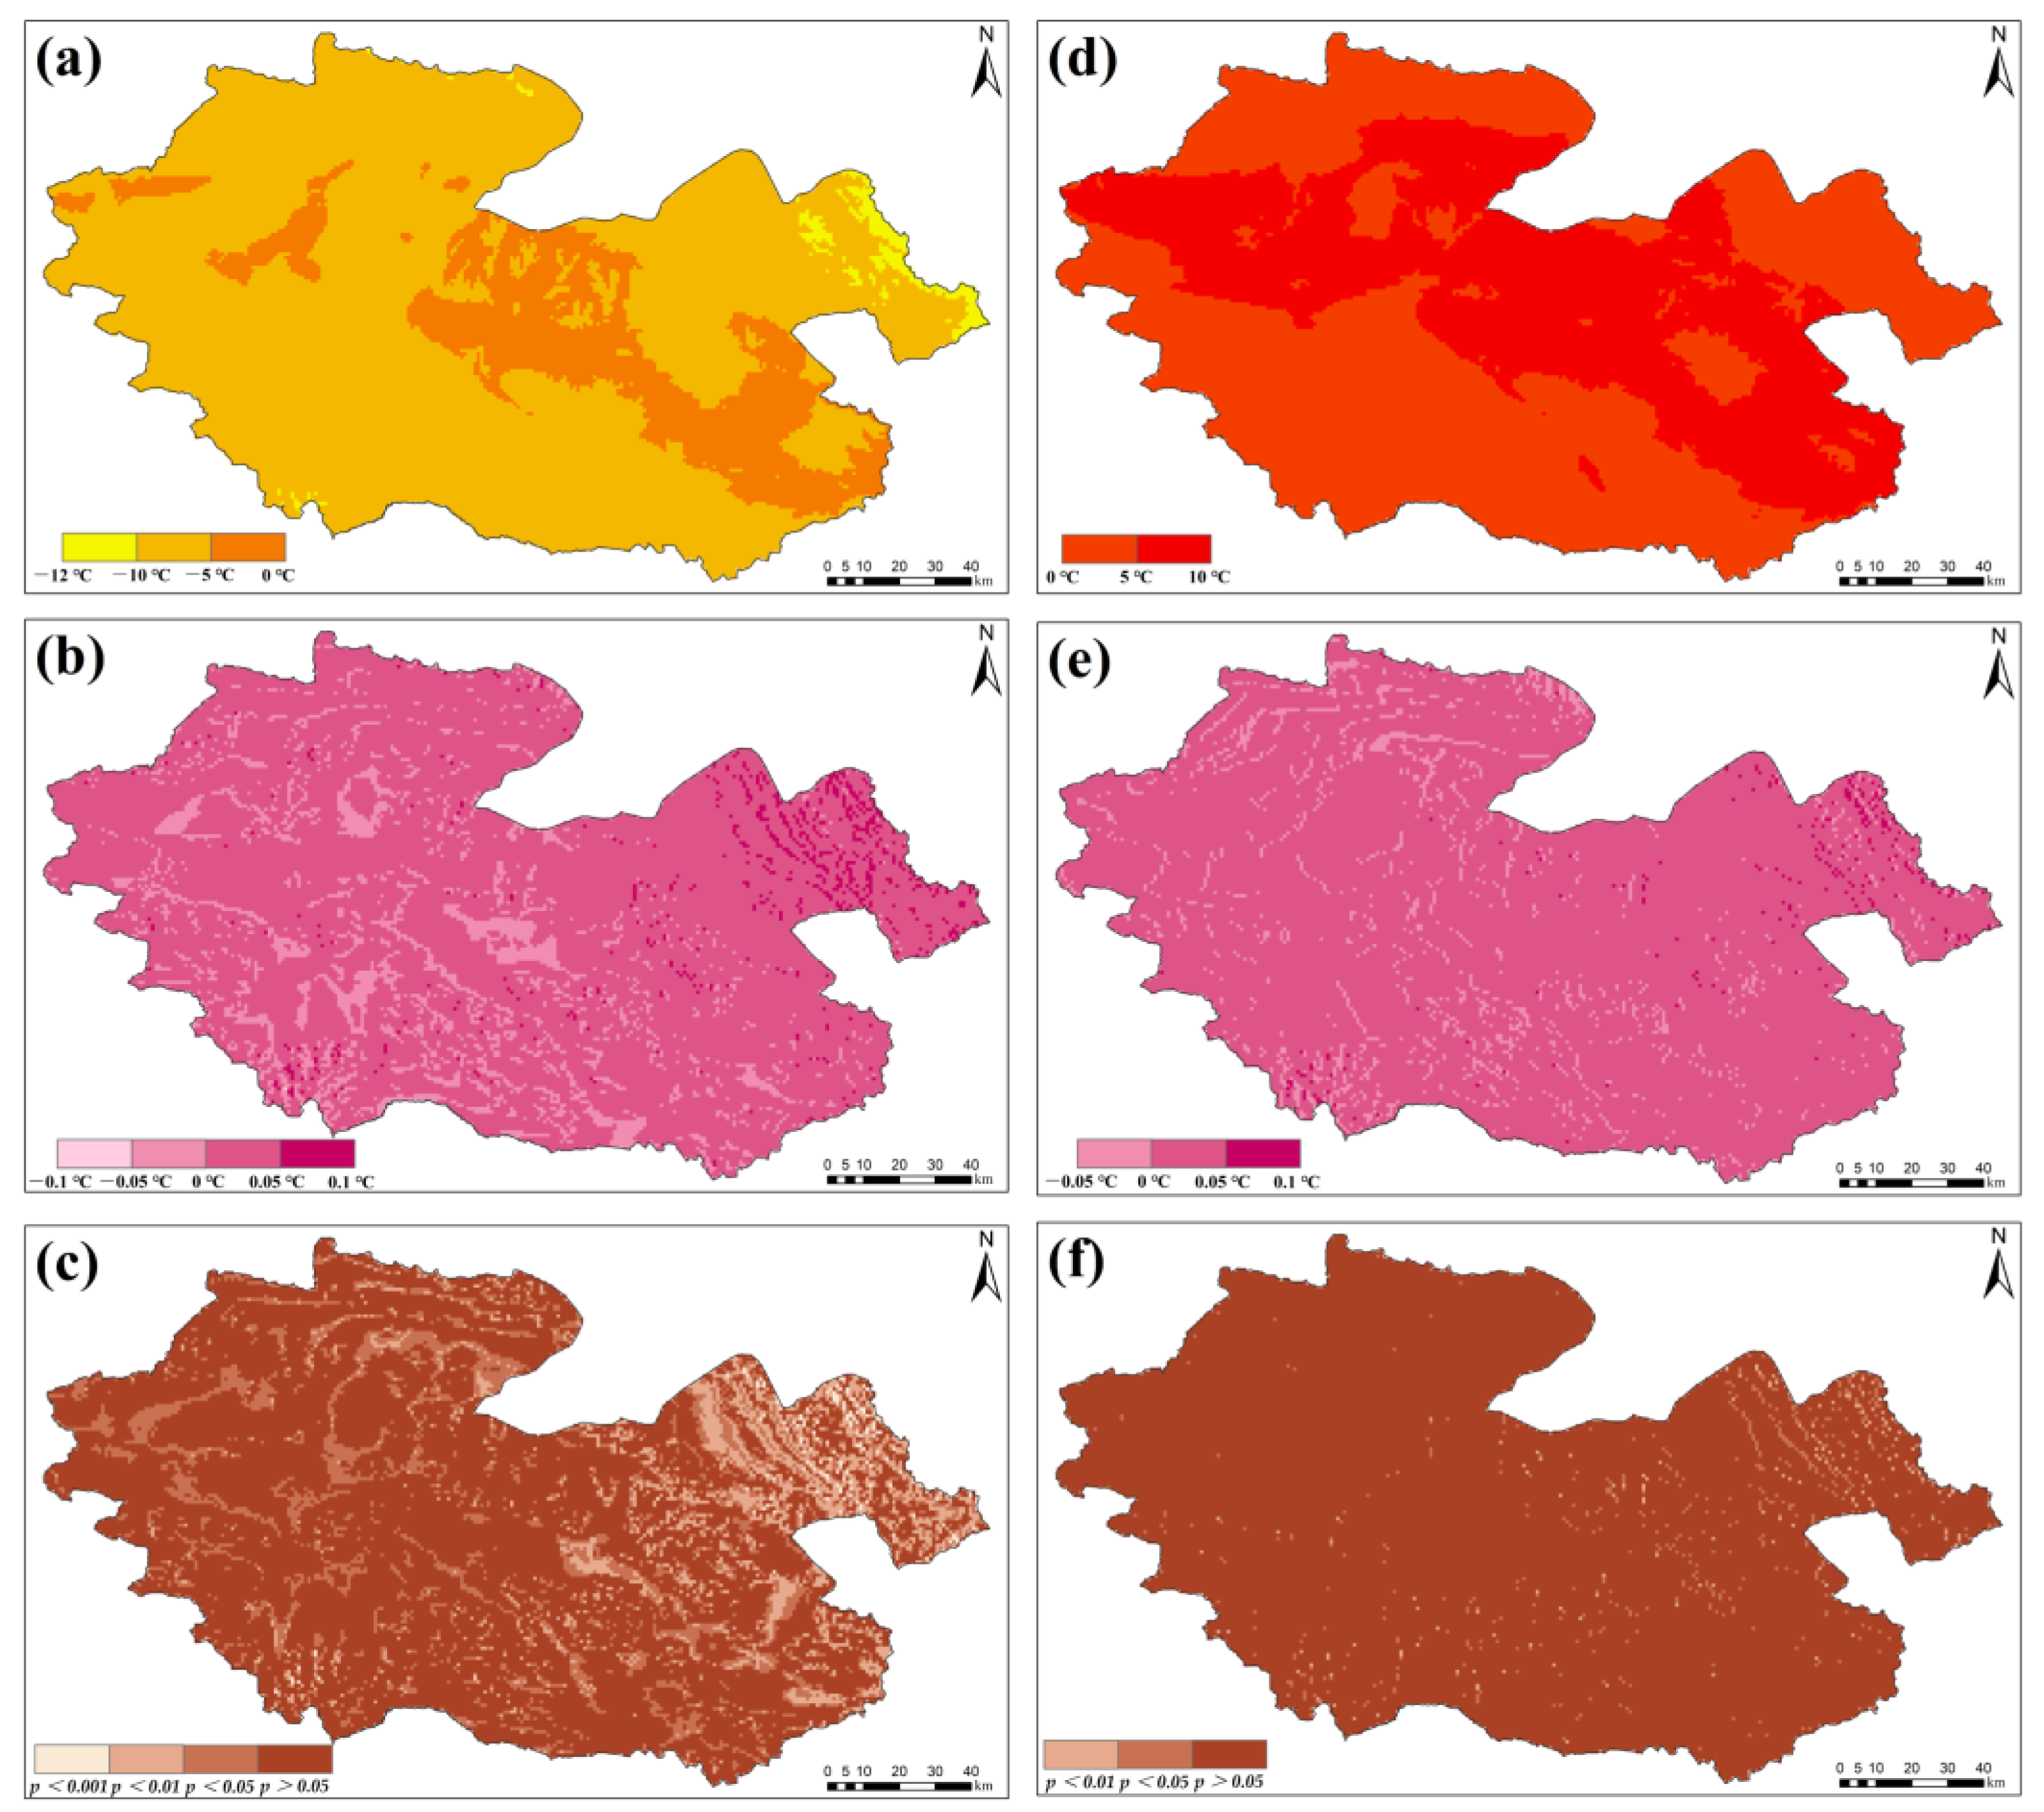
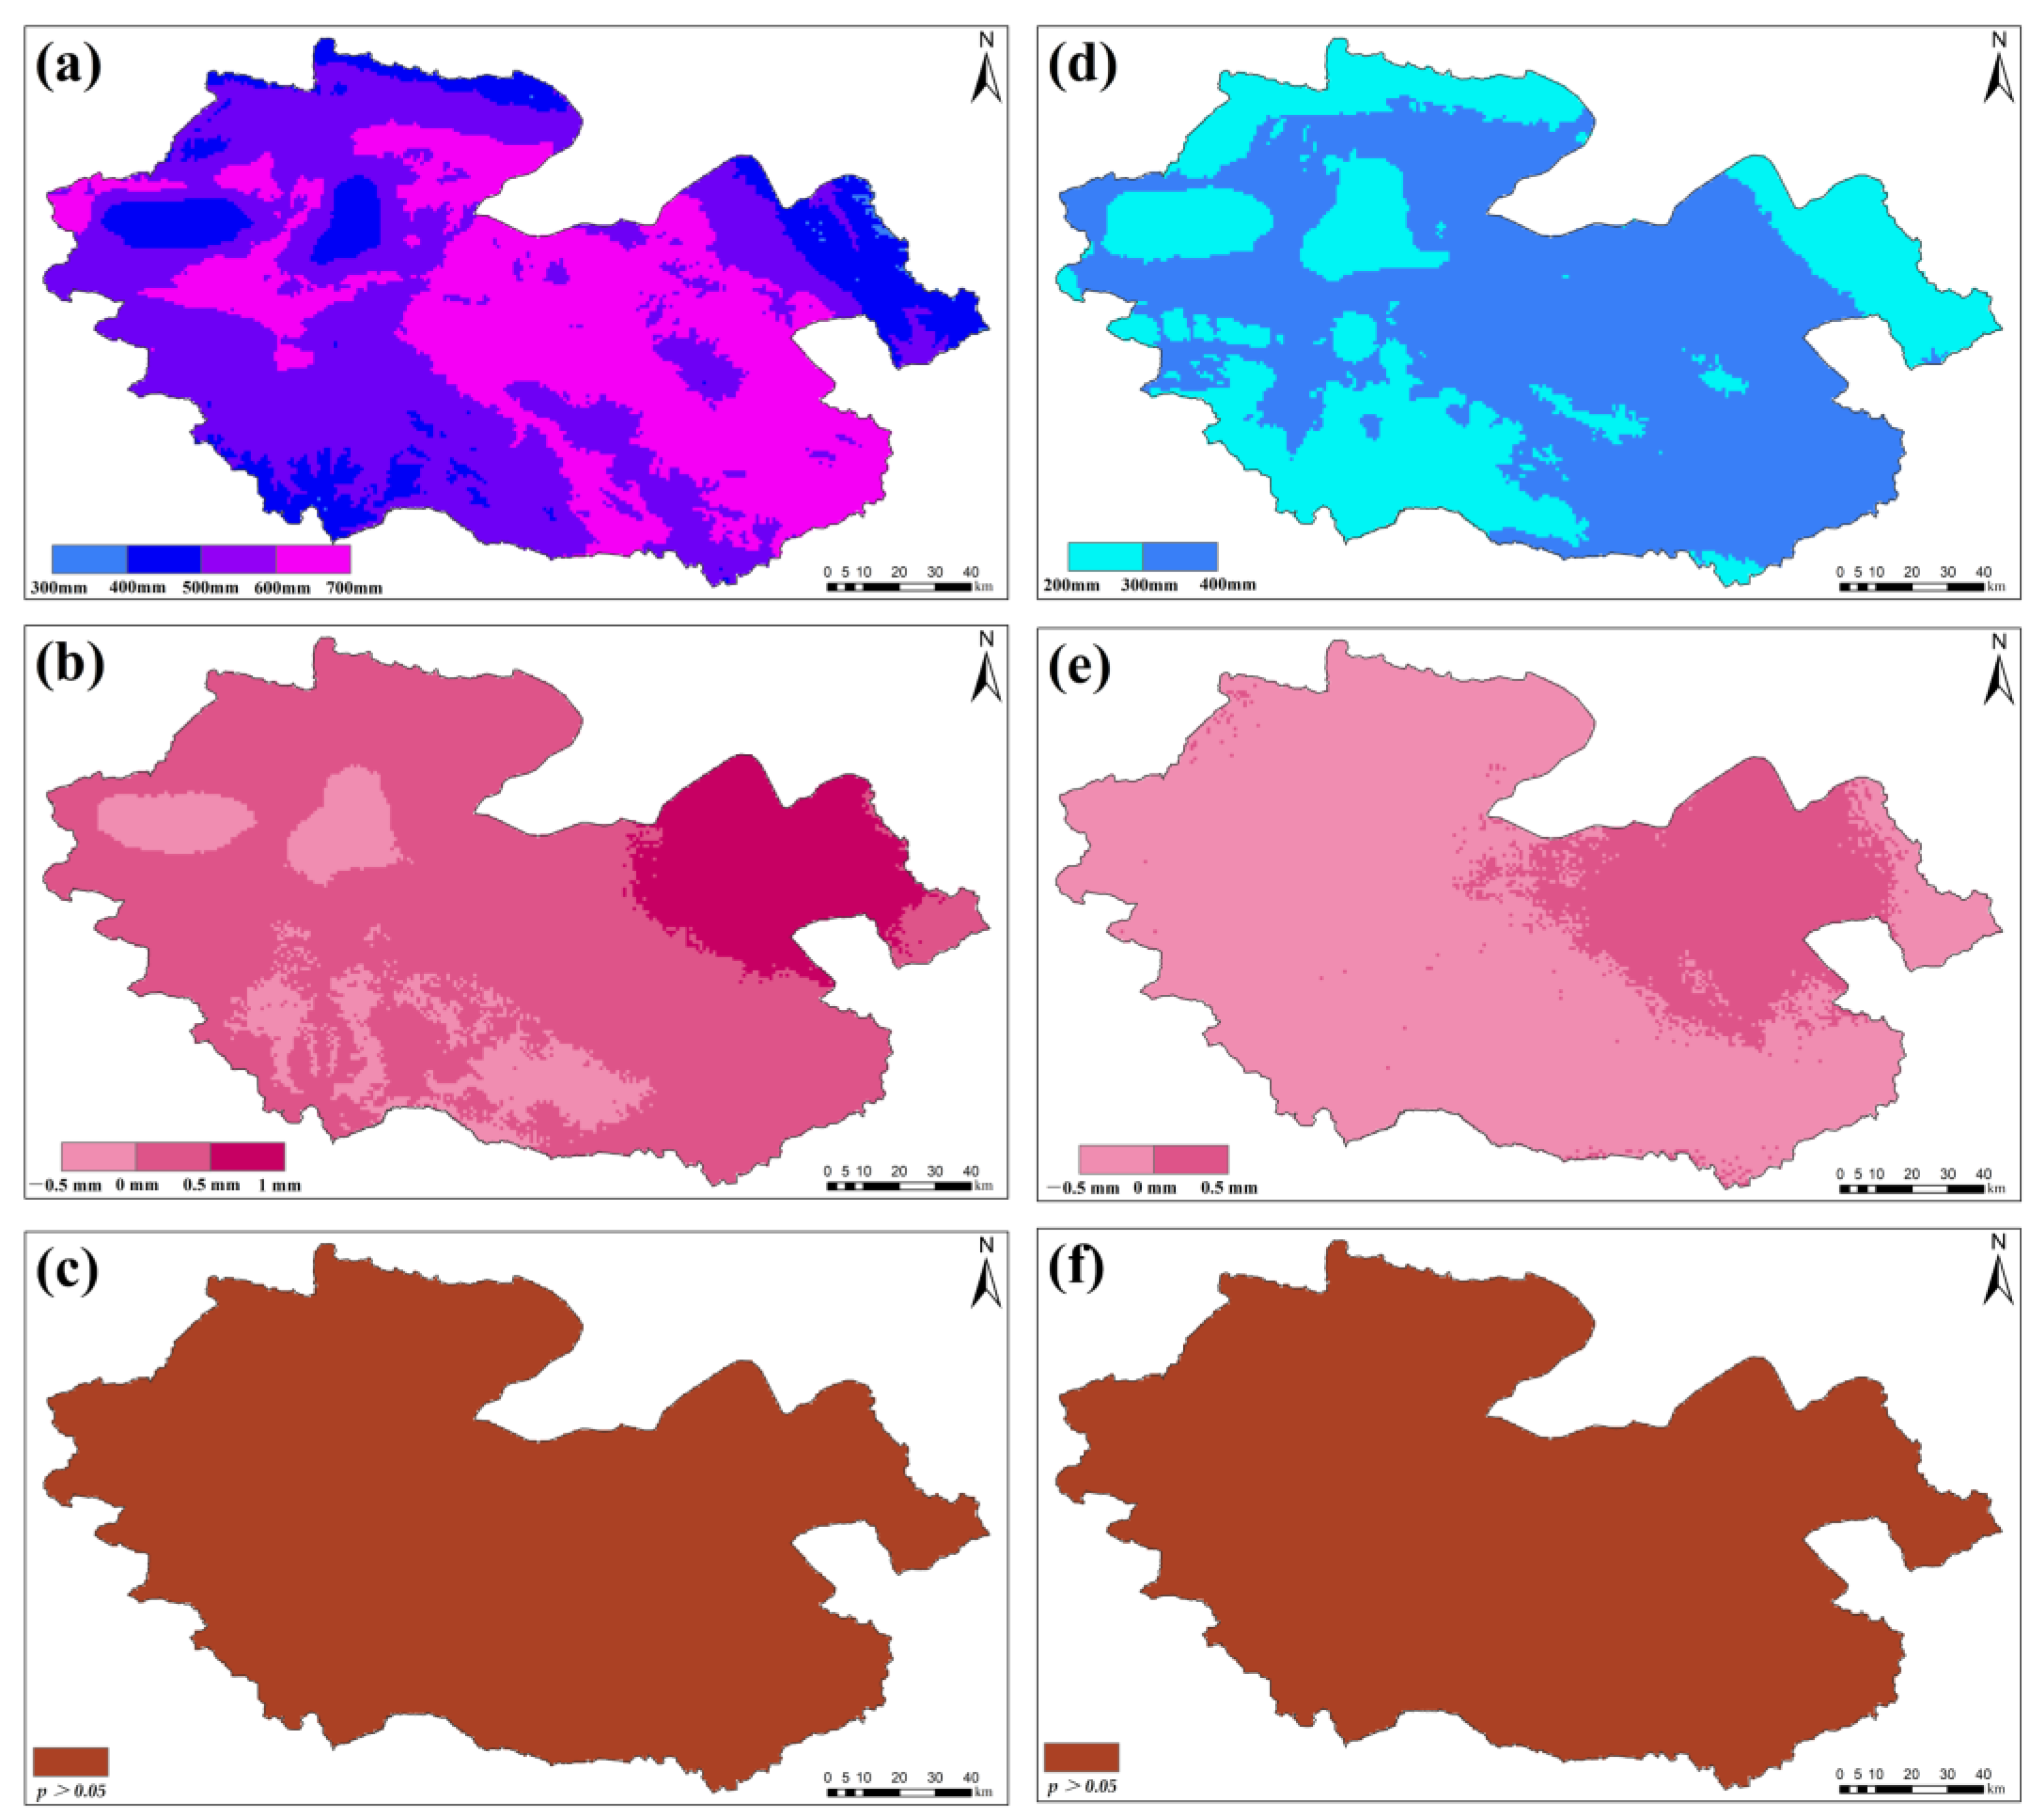
3.4.1. Dynamic Changes of Meteorological Factors

Figure 8 displays the results of the MK test and trend analysis of meteorological factors in the YRSNP from 2000 to 2020. Between 2000 and 2020, the mean annual precipitation was 460.61 mm, and the warm season mean precipitation was 244.39 mm, which accounts for 53.05% of the annual precipitation, indicating that warm season precipitation is the main precipitation period in the YRSNP. In addition, the mean annual potential evapotranspiration for the period 2000–2020 and the mean potential evapotranspiration during the warm season are 573.04 mm and 299.02 mm, respectively. These values are 1.24 and 1.22 times the total precipitation for the same period, indicating that precipitation may be evaporated even during the warm season. The warm season mean temperature was 5.35 °C, while the mean annual temperature between 2000 and 2020 was −5.21 °C, showing a significant temperature differential in the YRSNP season. Further trend analysis shows that there is no significant increasing trend from 2000 to 2020 (p > 0.05) for all meteorological factors except for warm season potential evapotranspiration. Most of the YRSNP precipitation may still evaporate in the future even though the trend value of precipitation is much larger than the potential evapotranspiration because of the significant difference between precipitation and potential evapotranspiration. A clear warm-humid climate trend is not present in the YRSNP due to the small temperature trend value.
Trend analyses were used to characterize the spatial variation trend of meteorological factors. The annual precipitation in the study area shows obvious spatial heterogeneity, showing a gradient decrease from southeast to northwest (Figure 9). The annual precipitation in the study area increased by 3.16 mm on average between 2000 and 2020, as shown by a further trend analysis and significant analysis, and the annual precipitation in the eastern region experienced the greatest increases. All the regions of the study area displayed an increasing trend, with the region experiencing the largest increases also exhibiting a significant increasing trend (p < 0.05), as did the other regions. Warm season precipitation has a relatively simple spatial distribution, with most areas experiencing 200–300 mm of precipitation. From 2000 to 2020, the warm season precipitation in the study area increased by 1.13 mm, which indicated no significant increase. In the study area, this showed there was obvious spatial heterogeneity in the mean annual temperature during mild and warm seasons, and all these temperatures displayed a spatial pattern of decreasing from the central horizontal axis area to the surrounding areas (Figure 10). An additional trend analysis showed that between 2000 and 2020, the mean annual temperature in the study area increased by 0.02 °C during the mild and warm seasons, while 6.87% of the regional warm season mean temperature decreased, and about 12.71% of the regional mean annual temperature increased. According to the significant analysis, 26.53% of the regional warm season mean temperature shows a significant upward trend, and the mean annual temperature in 2.65% of places, mostly in the surrounding areas of rivers and lakes, exhibit a significant upward trend. While the lake area shows small potential evapotranspiration, the annual potential evapotranspiration and warm season potential evapotranspiration in the study area are similar to the warm season mean temperature (Figure 11). Further trend analyses show that, from 2000 to 2020, the annual potential evapotranspiration in the study area will increase by 0.11 mm on average, while Gyaring Lake, Ngöring Lake, and the southern marsh meadow area will show a downward trend. Potential evapotranspiration decreased by −0.03 mm on average throughout the warm season, but only in some parts of northeast China. The significant analysis shows that the annual potential evapotranspiration and warm season potential evapotranspiration in the study area have no significant changes. Overall, the climate in the study area follows the warm-humid climate trend.

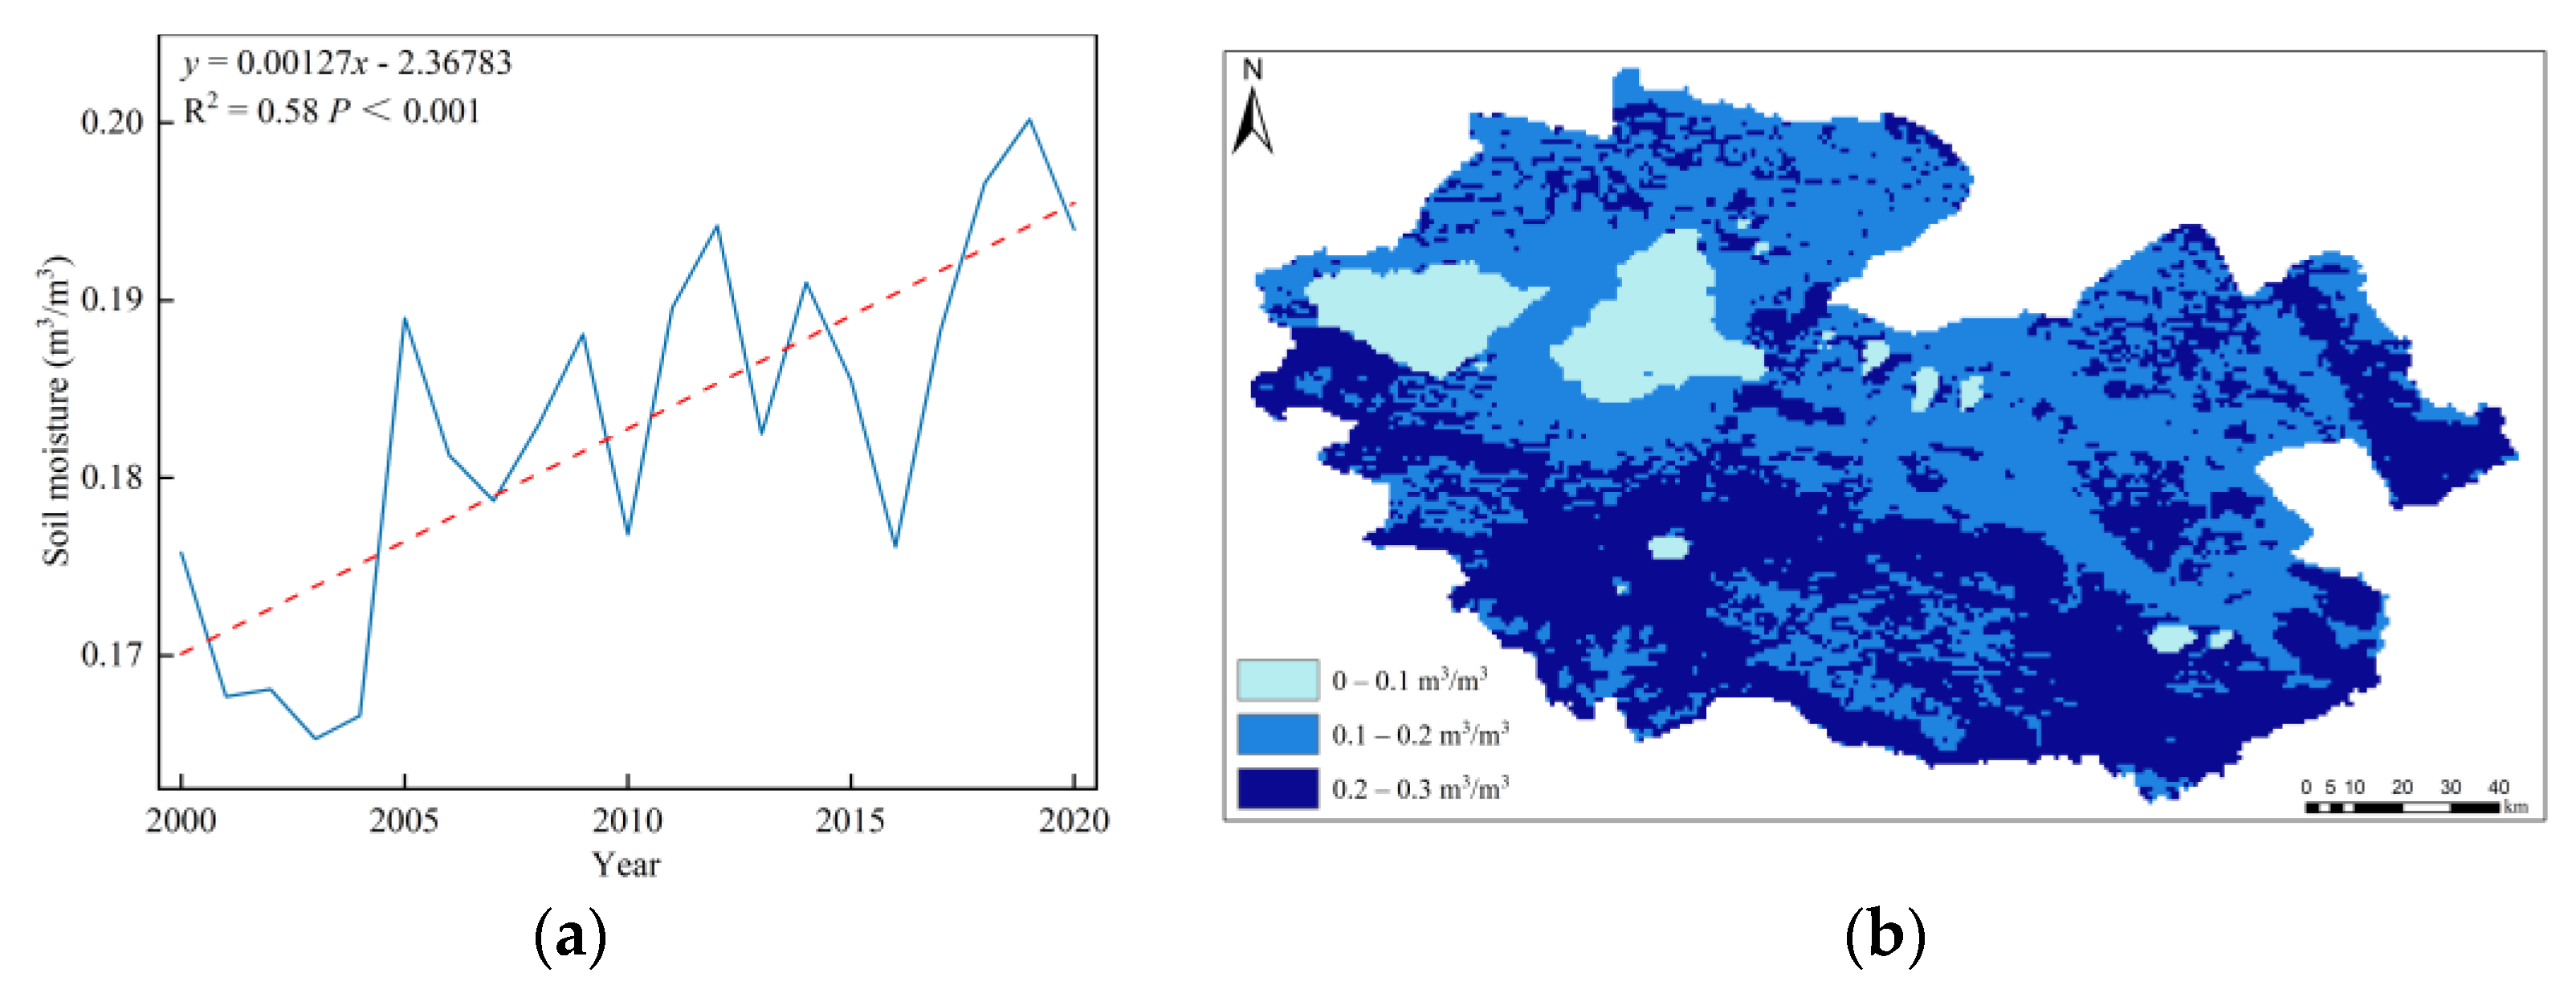
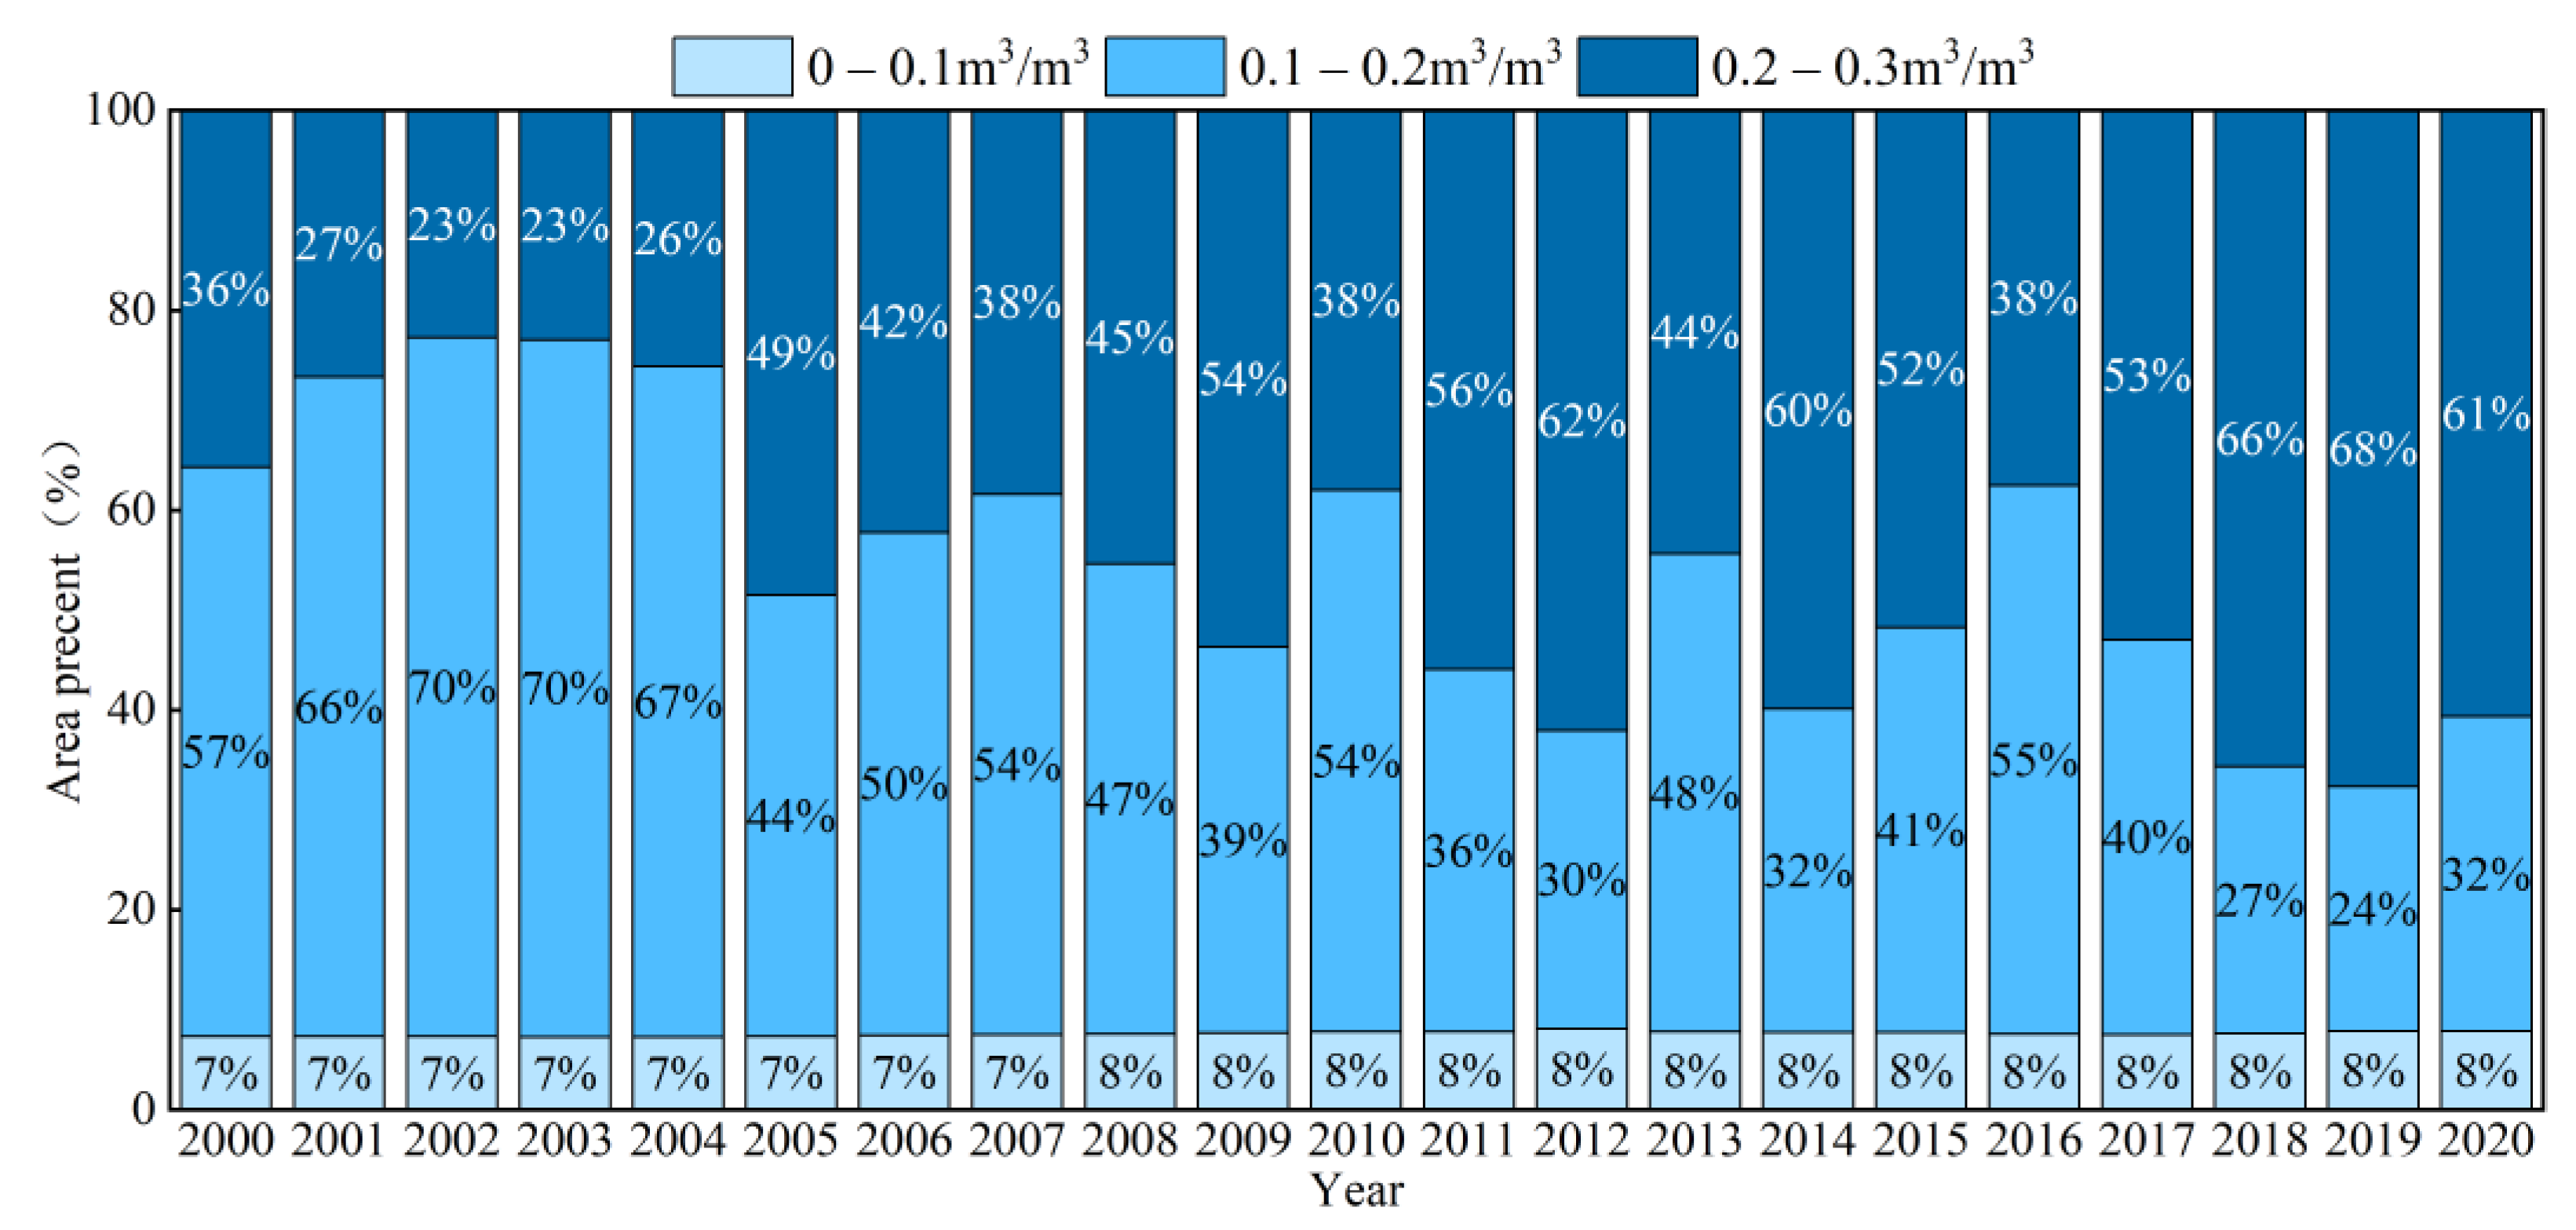
3.4.2. Dynamic Changes Characteristics of Soil Moisture

Figure 12 and Figure 13 display the trend analysis and spatial-temporal change of soil moisture in YRSNP from 2000 to 2020. The results show that from 2000 to 2020, the soil moisture in the YRSNP increased at an annual rate of 0.00127 m3/m3 (p < 0.001) and that the average soil moisture in the YRSNP was 0.1828 m3/m3 in 21 years, indicating a low spatial trend in the north.
The area ratio of soil moisture at all levels from 2000 to 2020 is calculated using the equal spacing method to further analyze the change of soil moisture in YRSNP from 2000 to 2020 (Figure 13). The results show that the area of soil moisture at 0–0.1 m3/m3 level does not vary considerably and remains constant at about 8% throughout the year. In certain ways, the YRSNP soil is developing toward humidification since the area of 0.1–0.2 m3/m3 grade soil wetland is decreasing at a rate of 1.82% per year, and correspondingly, the area of 0.2–0.3 m3/m3 grade soil humidity is increasing at a rate of 1.80% per year.

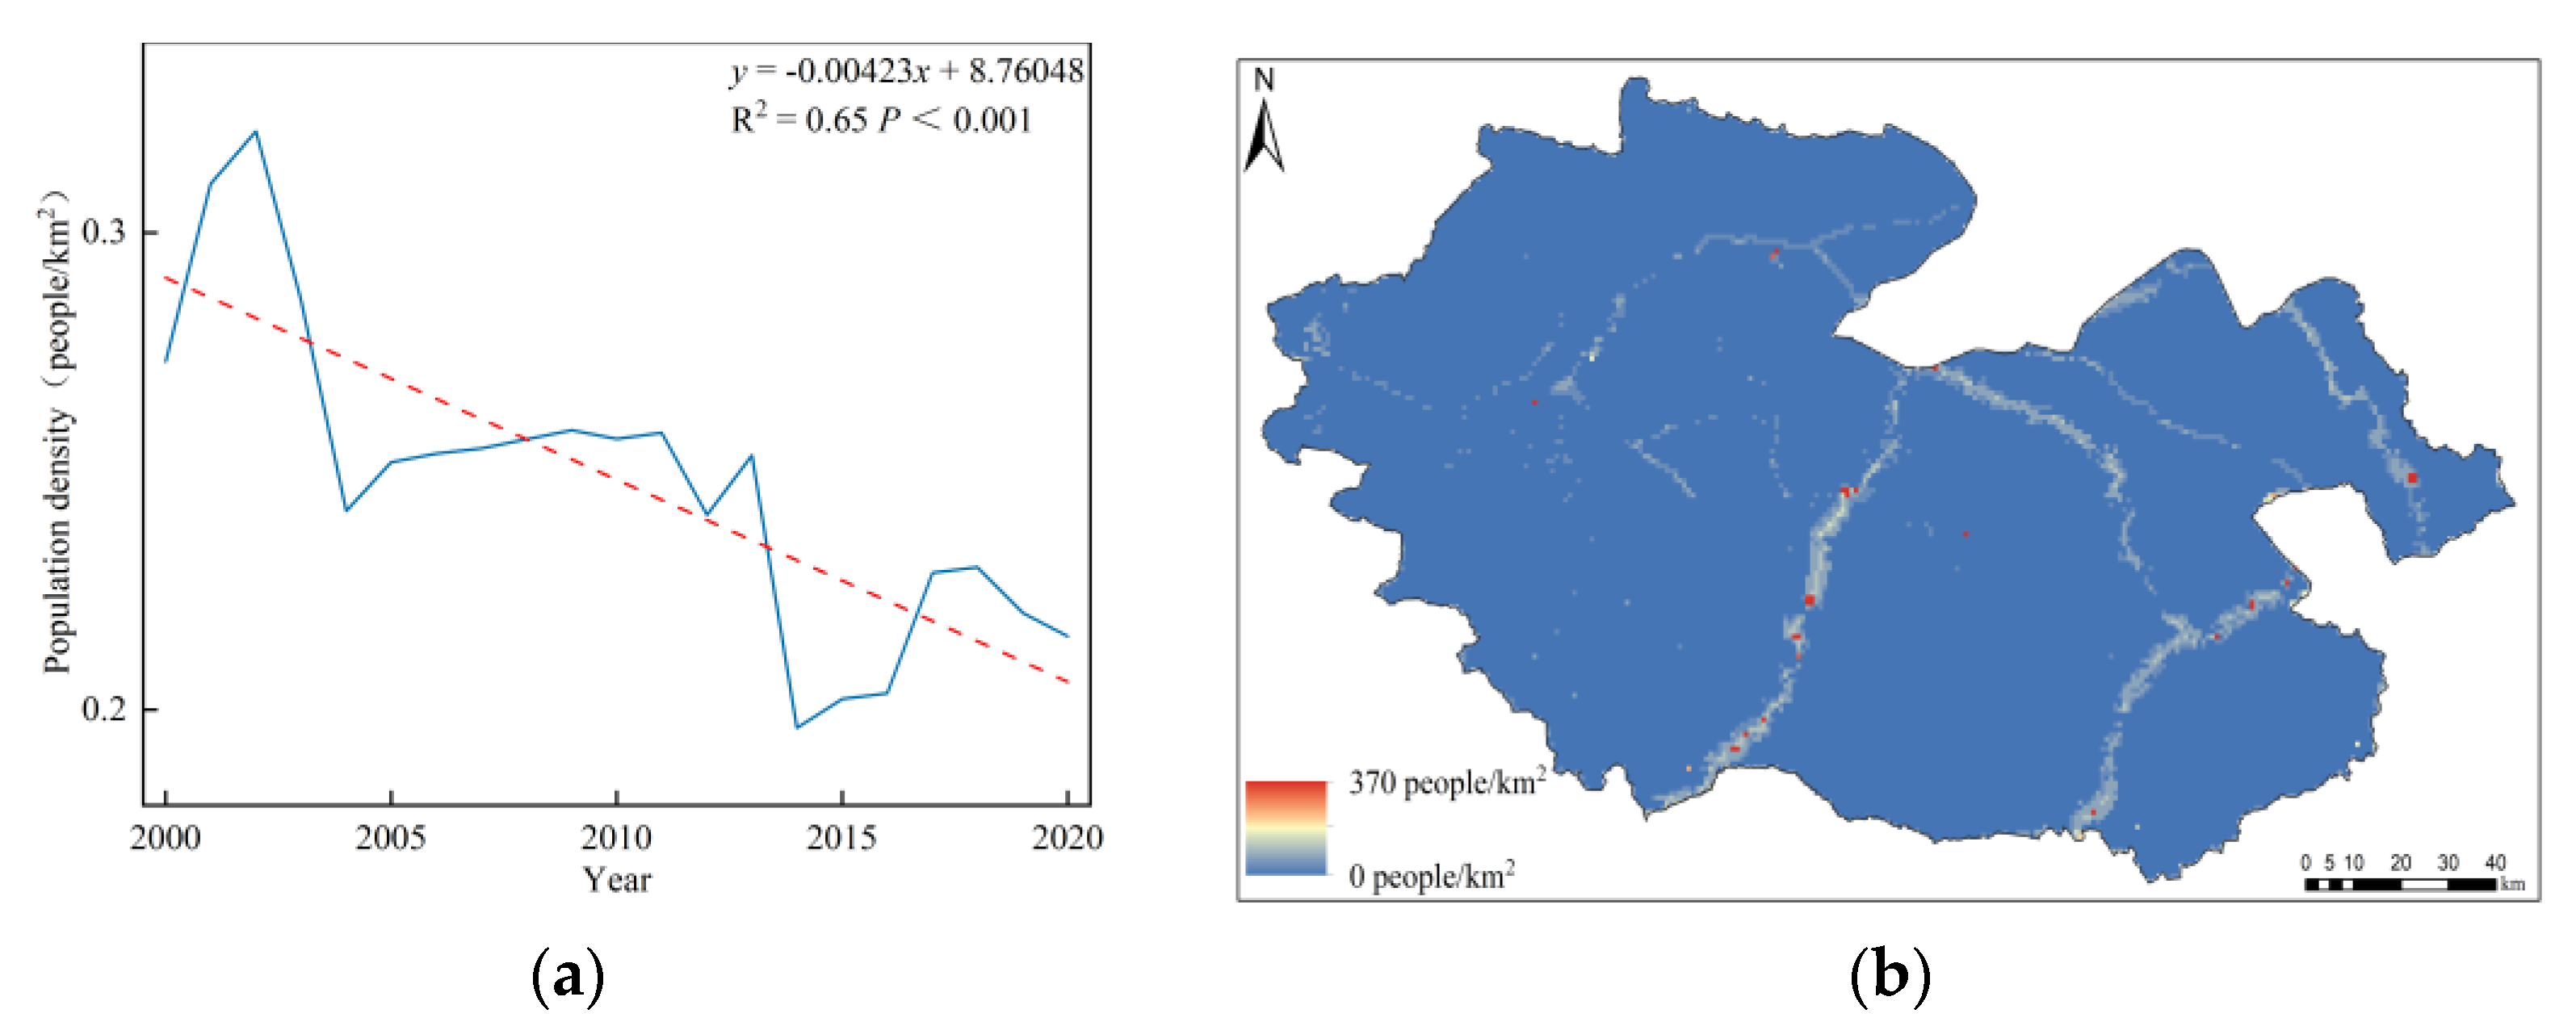
3.4.3. Dynamic Changes Characteristics of Population Density

The population density of YRSNP decreased significantly from 2000 to 2020 with a trend of 0.00423 people/km2 per year (p < 0.001), but the population density base of YRSNP was small, so the change was not significant. This is shown by the changing trend of population density of YRSNP from 2000 to 2020 shows (Figure 14a). The policy of ex-situ poverty alleviation and relocation that has been in place for many years may have something to do with the change in population density. Most of the farmers and herdsmen in villages and towns have relocated to Maduo County City or other counties because of ex-situ poverty alleviation and relocation (http://tjj.qinghai.gov.cn/tjData/qhtjnj/, accessed on 7 April 2023), so the population distribution will be more dispersed. Further analysis combined with Figure 14b reveals that the average YRSNP population density from 2000–2020 was 0.18 people/km2, and the population of YRSNP is concentrated along G214 road in the middle.

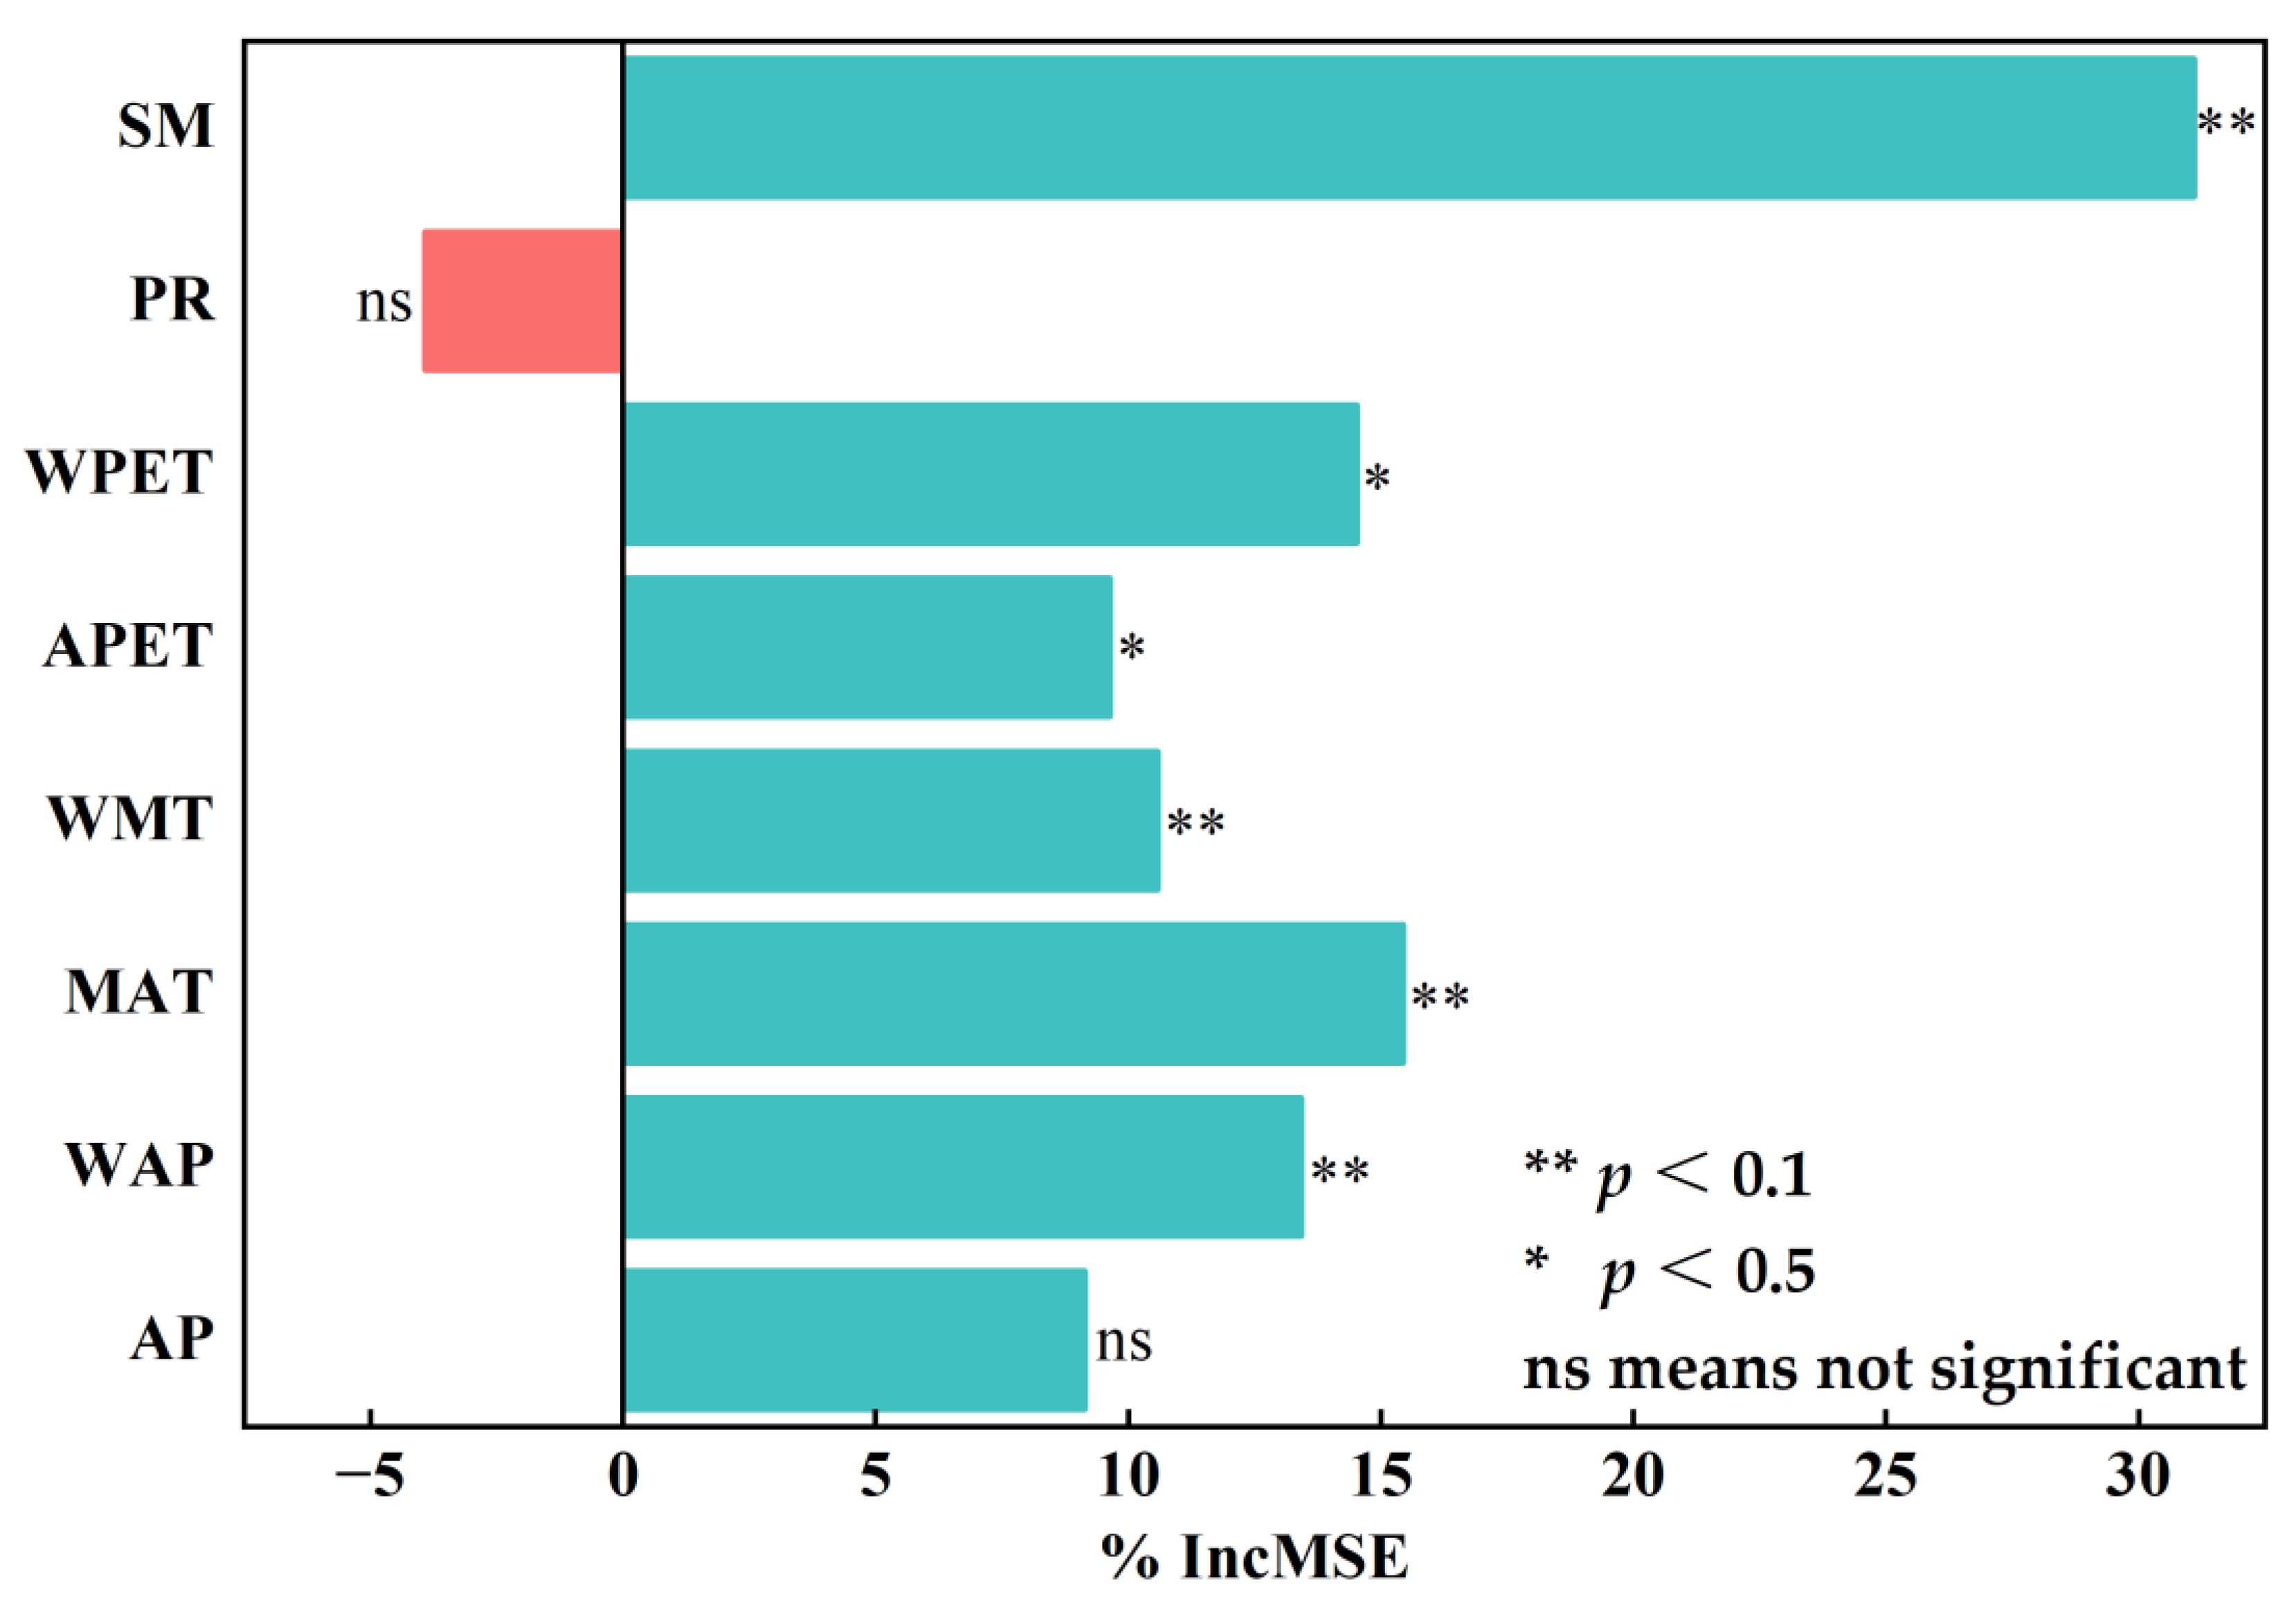
3.4.4. Dominant Factor Identification

The grid data in fishing nets are extracted and exported to RStudio for random forest regression analysis by setting fishing nets to extract the area, annual precipitation, warm season precipitation, mean annual temperature, warm season mean temperature, annual potential evapotranspiration, warm season mean potential evapotranspiration, mean population density, and mean soil moisture of the YRSNP alpine wetland from 2000 to 2020 within a grid range of 1 km × 1 km. The decision tree in the random forest regression model is set to 500 in combination with previous studies and many experiments, as illustrated in Figure 15. According to the findings, the 80% variance in the dependent variable (wetland area) can be accounted for by the independent variables annual precipitation, warm season precipitation, annual mean temperature, warm season mean temperature, annual potential evapotranspiration, warm season potential evapotranspiration, population density, and soil moisture. The order of importance of each variable is soil moisture (p < 0.1) > mean annual temperature (p < 0.1) > warm season potential evapotranspiration (p < 0.5) > warm season precipitation (p < 0.1) > warm season mean temperature (p < 0.1). Soil moisture will therefore be the main factor influencing the YRSNP wetland area change between 2000 and 2020, followed by mean annual temperature, warm season potential evapotranspiration, warm season precipitation, warm season mean temperature, and annual potential evapotranspiration. Population density will also have an impact on wetland areas.

4. Discussion

4.1. Identification and Classification of the YRSNP Alpine Wetland from 2000 to 2020 Using Remote Sensing

This study used the random forest model to identify and classify YRSNP alpine wetlands from 2000 to 2020 based on the classification characteristics, including spectral characteristics, spectral index, and topographic features. The mean Kappa coefficient was 0.8051, while the mean overall accuracy was 0.8492. The results demonstrated that the classification accuracy was high and that the random forest model was suitable for identifying and classifying alpine wetlands, which were consistent with the previous research results [48]. In terms of classification features, spectral features (red, green, blue, NIR, SWIR1, and SWIR2) are commonly used in the remote sensing classification of alpine wetlands [42,43]. The research shows that these spectral features are sensitive to changes in vegetation and soil moisture. Even though NDWI and MNDWI were the main remote sensing indexes that could effectively distinguish water bodies from non-water bodies, NDWI_B can provide more assistance for classification accuracy than MNDWI in this study. The water body index has evolved into NDWI_B, a more advanced version that can suppress irrelevant background data and enhance water body data, while NDWI and MNDWI will be impacted by shadows [43,49]. VI_green is a prime vegetation index in this study. Gitelson et al. proposed VI_green in 2002. The distribution of vegetation under different vegetation fractions can be reflected by VI_green, which is more sensitive to different vegetation fractions than NDVI [50]. Elevation, which is the most important classification feature and has a definite relationship with the climate characteristics of different altitude intervals, is one of the three primary types of topographic features, along with slope and aspect. Alpine wetlands are mostly distributed in low-altitude areas since snow-covered areas are primarily generated due to the influence of temperature in high-altitude regions [51,52]. In addition, recent studies showed that phenological characteristics have an influence on the landscape evolution of alpine wetlands. SOS (SOS: start of growing season) and EOS (EOS: end of growing season) change dramatically when the wetland water volume decreases. SOS and EOS change slowly when the wetland water volume increases. An earlier SOS and delayed EOS can be used as indicators of alpine wetland degradation [53].

4.2. Spatial-Temporal Change of Alpine Wetland and Meteorological Factors in the YRSNP from 2000 to 2020

Based on the Landsat 5 7 8 time series remote sensing images, the YRSNP alpine wetland’s pattern of dynamic changes from 2000 to 2020 showed that its area increased from 4044 km2 in 2000 to 4561 km2 in 2020, while the proportion of river wetland decreased from 3.32% to 2.00%. The proportion of lake wetland areas increased from 7.23% to 7.81%, marsh wetland increased from 1.47% to 1.53%, and marsh meadow areas increased from 9.19% to 12.62%, which is consistent with the related research results [54]. As shown in Figure 5, there is an apparent change in the area of marsh grassland between 2005 and 2016, which may be due to the low classification accuracy. In addition, the results of the transfer of land use showed that the wetland types were transformed into each other, with some river wetland transformed into lake wetland due to the construction of the Yellow River source hydropower plant and river oscillation, while the increase in precipitation was the main reason for the transformation of marsh wetland into river wetland, and the increase in temperature leads to the decrease of marsh wetland and marsh meadow [21,55,56,57]. The warm season in June, July, and August is the predominant time for precipitation in the YRSNP, according to the mean annual precipitation of 460.61 mm for the region from 2000 to 2020 and the warm season mean precipitation of 244.39 mm. The trend analysis shows that while warm season precipitation does not increase significantly at a rate of 2.28 mm from 2000 to 2020, the annual precipitation of the YRSNP does increase significantly at a rate of 3.17 mm [58,59]. Compared with the Qinghai–Tibet Plateau and the Sanjiangyuan region, it is wetter, and its trend is consistent with the previous research results. The temperature difference between the YRSNP seasons is significant, as seen by the –5.21 °C mean annual temperature of the YRSNP from 2000 to 2020 and the 5.35 °C mean temperature of the warm season. Additionally, the mean annual temperature and warm season mean temperature has increased at a rate of about 0.01 °C, which is consistent with the related research results [60]. The mean annual potential evapotranspiration of the YRSNP from 2000 to 2020 is 573.04 mm, and the mean evapotranspiration during the warm season is 299.02 mm, which is consistent with the findings of the related studies [61]. It is clear that the YRSNP has an obvious deficit effect on precipitation evaporation. However, the specific deficit needs to be calculated in conjunction with the actual evapotranspiration. From 2000 to 2020, the YRSNP will generally be warm and humid, which is consistent with the global and Qinghai–Tibet Plateau trends of climate change. It should be noted that global climate change, which intensifies ocean evaporation and land evapotranspiration and leads to a strong regional hydrological cycle, is the cause of the increase in YRSNP precipitation. However, there is a high probability of extreme precipitation due to the influence of the El Niño Southern Oscillation and North Atlantic Oscillation, which will affect the stability of alpine wetland ecosystems [62,63,64].

4.3. Analysis of Driving Factors of the YRSNP Alpine Wetland Dynamic Changes from 2000 to 2020

The annual precipitation, warm season precipitation, mean annual temperature, warm season mean temperature, annual potential evapotranspiration, warm season potential evapotranspiration, population density, and soil moisture were all ranked in this study using random forest regression. The results showed that the area change of the YRSNP alpine wetland from 2000 to 2020 was significantly influenced by soil moisture, with soil moisture having the biggest influence. Soil moisture is primarily used to reflect the surface dry and wet changes, whereas precipitation and potential evapotranspiration are used to characterize climate drought changes, compared with climatic factors. The dry and wet characteristics of the surface environment are more directly related to ecosystems, land use, and management because they are influenced by both atmospheric and land surface processes, soil, and topography [28]. A study on soil moisture in the Tibetan Plateau found that land use/cover is an important factor affecting soil water content, and different land use types tend to reflect changes in vegetation cover, which affects the soil water content. In addition, surface temperature plays a crucial role in soil water content variation [65,66]. Additionally, soil moisture has the power to change the water use pattern and physiological characteristics of alpine plants as well as to mediate the positive effect of ecosystem carbon sink capacity on global warming [67]. In the micro-environment of soil, with the increase of soil moisture, microbial activity may be restricted by an anaerobic environment, thus enhancing the carbon retention capacity of wetlands [29,68,69]. The most significant carbon pool in terrestrial ecosystems is wetlands. This study found a significant positive correlation between soil moisture and the alpine wetland area, indicating that there is a certain relationship between its area and carbon fixation capacity. In terms of climatic change, the YRSNP has an obvious deficit of precipitation–evaporation, meaning that evaporation exceeds precipitation, and soil humidity, as an important feature of the surface environment, is more like the basic guarantee of a wetland area. It can only be restored to a wetland after the soil humidity reaches a certain threshold. Therefore, the influence of soil moisture on alpine wetlands is the greatest in the YRSNP. Due to the long-standing phenomenon of overgrazing in the YRSNP, population density has the lowest importance than other driving forces and has a negative impact on the pattern of dynamic changes of the YRSNP alpine wetlands. The YRSNP alpine wetland ecosystem has been restored to some extent as a result of the population moving from dispersed pastoral areas to the central area of the county because of the ex situ poverty alleviation and relocation policy.

4.4. Limitations and Uncertainties

The YRSNP alpine wetland data from 2000 to 2020 were obtained using a random forest classification model, even though this study is based on the GEE platform and uses Landsat 5 7 8 remote sensing images. The driving factors affecting the area change of the YRSNP alpine wetland from 2000 to 2020 were determined using a random forest regression analysis, along with the annual data of temperature, precipitation, potential evapotranspiration, soil moisture, and population density. However, due to the spatial resolution of the image, the availability of data, and the generalization performance of the classification model, the results are still uncertain. Deep learning models should be utilized in conjunction with higher resolution remote sensing images such as SPOT, Worldview, and Quick Bird to conduct in-depth studies in the future. And in future work, we will consider and add the innovative trend analysis methodology without any assumption to understand the change trend.

5. Conclusions

The random forest model was employed in this study to reveal the pattern of dynamic changes and the leading driving factors of the YRSNP alpine wetland. The results showed that, except for river wetlands (the area decreased by 1.32%), the varieties of the YRSNP alpine wetlands were rising from 2000 to 2020, among which marsh meadow showed the largest increase (the area increased by 3.34%), and that the entire wetland was relatively close to the concentrated distribution area of lake wetlands. According to the land use transfer matrix, grassland provided the primary supplement for the alpine wetland in the YRSNP; the area accounted for 20%. While population density has a negative influence on the YRSNP alpine wetland area, soil moisture is the driving force that has the biggest impact on change in that area. Annual precipitation is the positive driving force that has the least impact. The research results can provide a scientific basis for the restoration and protection of the YRSNP alpine wetland ecosystem.

Author Contributions

Conceptualization, T.M. and Z.Z.; methodology, T.M. and L.Z.; software, T.M.; validation, Y.S., B.H. and X.F.; investigation, Y.S.; resources, X.F.; data curation, J.G. and W.Z.; writing—original draft preparation, T.M.; writing—review and editing, T.M.; funding acquisition, Z.Z. All authors have read and agreed to the published version of the manuscript.

Funding

This research was funded by the Key Research and Development and Translational Program of Qinghai Province (No. 2022-QY-225) and the National Key Research and Development Program of China (No. 2016YFC0501903).

Institutional Review Board Statement

Not applicable.

Informed Consent Statement

Not applicable.

Data Availability Statement

Not applicable.

Conflicts of Interest

The authors declare no conflict of interest.

References

  1. Yu, H.; Liu, B.; Wang, G.; Zhang, T.; Yang, Y.; Lu, Y.; Xu, Y.; Huang, M.; Yang, Y.; Zhang, L. Grass-livestock balance based grassland ecological carrying capability and sustainable strategy in the Yellow River Source National Park, Tibet Plateau, China. J. Mt. Sci. 2021, 18, 2201–2211. [Google Scholar] [CrossRef]
  2. Li, W.; Xue, P.; Liu, C.; Yan, H.; Zhu, G.; Cao, Y. Monitoring and Landscape Dynamic Analysis of Alpine Wetland Area Based on Multiple Algorithms: A Case Study of Zoige Plateau. Sensors 2020, 20, 7315. [Google Scholar] [CrossRef]
  3. Yao, T.; Bolch, T.; Chen, D.; Gao, J.; Immerzeel, W.; Piao, S.; Su, F.; Thompson, L.; Wada, Y.; Wang, L.; et al. The imbalance of the Asian water tower. Nat. Rev. Earth Environ. 2022, 3, 618–632. [Google Scholar] [CrossRef]
  4. Zhang, Q.; Shen, Z.; Pokhrel, Y.; Farinotti, D.; Singh, V.P.; Xu, C.; Wu, W.; Wang, G. Oceanic climate changes threaten the sustainability of Asia’s water tower. Nature 2023, 615, 87–93. [Google Scholar] [CrossRef] [PubMed]
  5. Wang, Y.; Lv, W.; Xue, K.; Wang, S.; Zhang, L.; Hu, R.; Zeng, H.; Xu, X.; Li, Y.; Jiang, L.; et al. Grassland changes and adaptive management on the Qinghai–Tibetan Plateau. Nat. Rev. Earth Environ. 2022, 3, 668–683. [Google Scholar] [CrossRef]
  6. HJ 1169-2021; Technical Specification for Investigation and Assessment of National Ecological Status—Field Observation of Wetland Ecosystem. Ministry of Ecology and Environment of the People’s Republic of China: Beijing, China, 2021.
  7. DeLancey, E.R.; Simms, J.F.; Mahdianpari, M.; Brisco, B.; Mahoney, C.; Kariyeva, J. Comparing Deep Learning and Shallow Learning for Large-Scale Wetland Classification in Alberta, Canada. Remote Sens. 2020, 12, 2. [Google Scholar] [CrossRef] [Green Version]
  8. Liu, T.; Abd-Elrahman, A.; Jon, M.; Wilhelm, V.L. Comparing Fully Convolutional Networks, Random Forest, Support Vector Machine, and Patch-based Deep Convolutional Neural Networks for Objectbased Wetland Mapping using Images from small Unmanned Aircraft System. GISci. Remote Sens. 2018, 55, 243–264. [Google Scholar] [CrossRef]
  9. Judah, A.; Hu, B. The Integration of Multi-source Remotely-Sensed Data in Support of the Classification of Wetlands. Remote Sens. 2019, 11, 1537. [Google Scholar] [CrossRef] [Green Version]
  10. Banks, S.; White, L.; Behnamian, A.; Chen, Z.; Montpetit, B.; Brisco, B.; Pasher, J.; Duffe, J. Wetland Classification with Multi-Angle/Temporal SAR Using Random Forests. Remote Sens. 2019, 11, 670. [Google Scholar] [CrossRef] [Green Version]
  11. Simioni, J.P.D.; Guasselli, L.A.; de Oliveira, G.G.; Ruiz, L.F.C.; de Oliveira, G. A comparison of data mining techniques and multi-sensor analysis for inland marshes delineation. Wetl. Ecol. Manag. 2020, 28, 577–594. [Google Scholar] [CrossRef]
  12. Meng, X.; Zhang, S.; Zang, S. Lake Wetland Classification Based on an SVM-CNN Composite Classifier and High-resolution Images Using Wudalianchi as an Example. J. Coast. Res. 2019, 93(sp1), 153. [Google Scholar] [CrossRef]
  13. Corcoran, J.; Knight, J.; Gallant, A. Influence of Multi-Source and Multi-Temporal Remotely Sensed and Ancillary Data on the Accuracy of Random Forest Classification of Wetlands in Northern Minnesota. Remote Sens. 2013, 5, 3212–3238. [Google Scholar] [CrossRef] [Green Version]
  14. Baker, C.; Lawrence, R.; Montagne, C.; Patten, D. Mapping Wetlands and Riparian Areas Using Landsat ETM+ Imagery and Decision-Tree-Based Models. Wetlands 2006, 26, 465–474. [Google Scholar] [CrossRef]
  15. Gosselin, G.; Touzi, R.; Cavayas, F. Polarimetric Radarsat-2 wetland classification using the Touzi decomposition: Case of the Lac Saint-Pierre Ramsar wetland. Can. J. Remote Sens. 2014, 39, 491–506. [Google Scholar] [CrossRef]
  16. Soltani, K.; Amiri, A.; Zeynoddin, M.; Ebtehaj, I.; Gharabaghi, B.; Bonakdari, H. Forecasting monthly fluctuations of lake surface areas using remote sensing techniques and novel machine learning methods. Theor. Appl. Climatol. 2021, 143, 713–735. [Google Scholar] [CrossRef]
  17. Cai, Y.; Li, X.; Zhang, M.; Lin, H. Mapping wetland using the object-based stacked generalization method based on multi-temporal optical and SAR data. Int. J. Appl. Earth Obs. 2020, 92, 102164. [Google Scholar] [CrossRef]
  18. Fu, B.; Zuo, P.; Liu, M.; Lan, G.; He, H.; Lao, Z.; Zhang, Y.; Fan, D.; Gao, E. Classifying vegetation communities karst wetland synergistic use of image fusion and object-based machine learning algorithm with Jilin-1 and UAV multispectral images. Ecol. Indic. 2022, 140, 108989. [Google Scholar] [CrossRef]
  19. Mahdavi, S.; Salehi, B.; Granger, J.; Amani, M.; Brisco, B.; Huang, W. Remote sensing for wetland classification: A comprehensive review. GISci. Remote Sens. 2018, 55, 623–658. [Google Scholar] [CrossRef]
  20. Zhou, H.; Xiao, F.; Zhou, B.; Mao, X.; Ji, H.; Ma, J.; Wang, W.; Song, W.; Ma, C.; Yandi, S.; et al. Present situation, problems and protection strategies of wetland resources in Qinghai Province. Qinghai Sci. Technol. 2021, 28, 21–26. [Google Scholar]
  21. Ma, T.; She, Y.; Zhao, L.; Hu, B.; Feng, X.; Zhao, J.; Zhao, Z. Alpine Wetland Evolution and Their Response to Climate Change in the Yellow-River-Source National Park from 2000 to 2020. Water 2022, 14, 2351. [Google Scholar] [CrossRef]
  22. Lu, M.; Zou, Y.; Xun, Q.; Yu, Z.; Jiang, M.; Sheng, L.; Lu, X.; Wang, D. Anthropogenic disturbances caused declines in the wetland area and carbon pool in China during the last four decades. Glob. Chang. Biol. 2021, 27, 3837–3845. [Google Scholar] [CrossRef] [PubMed]
  23. Lu, D.; Chang, J. Examining human disturbances and inundation dynamics in China’s marsh wetlands by using time series remote sensing data. Sci. Total Environ. 2023, 863, 160961. [Google Scholar] [CrossRef] [PubMed]
  24. Yang, J. Studies on eco-environmental change in source regions of the Yangtze and Yellow Rivers of China: Present and future. Sci. Cold Arid. Reg. 2019, 11, 173–183. [Google Scholar]
  25. Yan, W.; Wang, Y.; Chaudhary, P.; Ju, P.; Zhu, Q.; Kang, X.; Chen, H.; He, Y. Effects of climate change and human activities on net primary production of wetlands on the Zoige Plateau from 1990 to 2015. Glob. Ecol. Conserv. 2022, 35, e2052. [Google Scholar] [CrossRef]
  26. Bian, H.L.; Li, W.; Li, Y.Z.; Ren, B.; Niu, Y.D.; Zeng, Z.Q. Driving forces of changes in China’s wetland area from the first (1999–2001) to second (2009–2011) National Inventory of Wetland Resources. Glob. Ecol. Conserv. 2020, 21, e00867. [Google Scholar] [CrossRef]
  27. Zhang, X.; Wang, G.; Xue, B.; Zhang, M.; Tan, Z. Dynamic landscapes and the driving forces in the Yellow River Delta wetland region in the past four decades. Sci. Total Environ. 2021, 787, 147644. [Google Scholar] [CrossRef]
  28. Li, M.; Ma, Z. Sensible and Latent Heat Flux Variability and Response to Dry–Wet Soil Moisture Zones Across China. Bound.-Layer Meteorol. 2015, 154, 157–170. [Google Scholar] [CrossRef]
  29. Fan, S.; Qin, J.; Sun, H.; Jia, Z.; Chen, Y. Alpine soil microbial community structure and diversity are largely influenced by moisture content in the Zoige wetland. Int. J. Environ. Sci. 2022, 19, 4369–4378. [Google Scholar] [CrossRef]
  30. Zheng, J.; Dong, D.; Dong, X.; Liu, J. China Wetland Resources Qinghai Volume; China Forestry Publishing House: Beijing, China, 2015. [Google Scholar]
  31. Lang, Q.; Niu, Z.; Hong, X.; Yang, X. Remote Sensing Monitoring and Change Analysis of Wetlands in the Tibetan Plateau. Geomat. Inf. Sci. Wuhan Univ. 2021, 46, 230–237. [Google Scholar]
  32. Peng, S.; Ding, Y.; Liu, W.; Li, Z. 1 km monthly temperature and precipitation dataset for China from 1901 to 2017. Earth Syst. Sci. Data 2019, 11, 1931–1946. [Google Scholar] [CrossRef] [Green Version]
  33. Peng, S.; Ding, Y.; Wen, Z.; Chen, Y.; Cao, Y.; Ren, J. Spatiotemporal change and trend analysis of potential evapotranspiration over the Loess Plateau of China during 2011–2100. Agric. For. Meteorol. 2017, 233, 183–194. [Google Scholar] [CrossRef] [Green Version]
  34. Zheng, C.; Jia, L.; Zhao, T. A 21-year dataset (2000–2020) of gap-free global daily surface soil moisture at 1-km grid resolution. Sci. Data 2023, 10, 139. [Google Scholar] [CrossRef]
  35. Huang, H.; Wang, J.; Liu, C.; Liang, L.; Li, C.; Gong, P. The migration of training samples towards dynamic global land cover mapping. ISPRS J. Photogramm. 2020, 161, 27–36. [Google Scholar] [CrossRef]
  36. Yan, X.; Niu, Z. Reliability Evaluation and Migration of Wetland Samples. IEEE J. Sel. Top. Appl. Earth Obs. Remote Sens. 2021, 14, 8089–8099. [Google Scholar] [CrossRef]
  37. Breiman, L. Random Forests. Mach. Learn. 2001, 45, 5–32. [Google Scholar] [CrossRef] [Green Version]
  38. Sheykhmousa, M.; Mahdianpari, M.; Ghanbari, H.; Mohammadimanesh, F.; Ghamisi, P.; Homayouni, S. Support Vector Machine Versus Random Forest for Remote Sensing Image Classification: A Meta-Analysis and Systematic Review. IEEE J. Sel. Top. Appl. Earth Obs. Remote Sens. 2020, 13, 6308–6325. [Google Scholar] [CrossRef]
  39. Kotaridis, I.; Lazaridou, M. Remote sensing image segmentation advances: A meta-analysis. ISPRS J. Photogramm. 2021, 173, 309–322. [Google Scholar] [CrossRef]
  40. Olofsson, P.; Foody, G.M.; Herold, M.; Stehman, S.V.; Woodcock, C.E.; Wulder, M.A. Good practices for estimating area and assessing accuracy of land change. Remote Sens. Environ. 2014, 148, 42–57. [Google Scholar] [CrossRef]
  41. Foody, G.M. Explaining the unsuitability of the kappa coefficient in the assessment and comparison of the accuracy of thematic maps obtained by image classification. Remote Sens. Environ. 2020, 239, 111630. [Google Scholar] [CrossRef]
  42. Kaplan, G.; Avdan, U. Monthly Analysis of Wetlands Dynamics Using Remote Sensing Data. ISPRS Int. J. Geo-Inf. 2018, 7, 411. [Google Scholar] [CrossRef] [Green Version]
  43. Huo, X.; Niu, Z.; Zhang, B.; Liu, L.; Li, X. Research on Remote Sensing Feature Selection for Alpine Wetland Classification. Natl. Remote Sens. Bull. 2022, 27, 1045–1060. [Google Scholar] [CrossRef]
  44. Chen, T.; Bao, A.; Jiapaer, G.; Guo, H.; Zheng, G.; Jiang, L.; Chang, C.; Tuerhanjiang, L. Disentangling the relative impacts of climate change and human activities on arid and semiarid grasslands in Central Asia during 1982–2015. Sci. Total Environ. 2019, 653, 1311–1325. [Google Scholar] [CrossRef] [PubMed]
  45. Liu, Y.; Wang, Q.; Zhang, Z.; Tong, L.; Wang, Z.; Li, J. Grassland dynamics in responses to climate variation and human activities in China from 2000 to 2013. Sci. Total Environ. 2019, 690, 27–39. [Google Scholar] [CrossRef] [PubMed]
  46. Yu, H.L.; Ding, Q.N.; Meng, B.P.; Lv, Y.Y.; Liu, C.; Zhang, X.Y.; Sun, Y.; Li, M.; Yi, S.H. The Relative Contributions of Climate and Grazing on the Dynamics of Grassland NPP and PUE on the Qinghai-Tibet Plateau. Remote Sens. 2021, 13, 3424. [Google Scholar] [CrossRef]
  47. Sen, P.K. Estimates of the Regression Coefficient Based on Kendall’s Tau. J. Am. Stat. Assoc. 1968, 324, 1379–1389. [Google Scholar] [CrossRef]
  48. Zhang, B.; Niu, Z.; Zhang, D.; Huo, X. Dynamic Changes and Driving Forces of Alpine Wetlands on the Qinghai–Tibetan Plateau Based on Long-Term Time Series Satellite Data: A Case Study in the Gansu Maqu Wetlands. Remote Sens. 2022, 14, 4147. [Google Scholar] [CrossRef]
  49. Zhang, S.; Zhou, B.; Shi, F.; Chen, Q.; Su, S. Study on Information Extraction Method of Alpine Wetland in Qinghai-Xizang Plateau based on Remote Sensing Data of GF-1 Satellite——Taking Maduo County for Example. Plateau Meteorol. 2020, 39, 1309–1317. [Google Scholar]
  50. Gitelson, A.A.; Kaufman, Y.J.; Stark, R.; Rundquist, D. Novel algorithms for remote estimation of vegetation fraction. Remote Sens. Environ. 2002, 80, 76–87. [Google Scholar] [CrossRef] [Green Version]
  51. Feher, L.C.; Osland, M.J.; McKee, K.L.; Whelan, K.R.T.; Coronado-Molina, C.; Sklar, F.H.; Krauss, K.W.; Howard, R.J.; Cahoon, D.R.; Lynch, J.C.; et al. Soil Elevation Change in Mangrove Forests and Marshes of the Greater Everglades: A Regional Synthesis of Surface Elevation Table-Marker Horizon (SET-MH) Data. Estuaries Coasts 2022. [Google Scholar] [CrossRef]
  52. Gao, W.; Shen, F.; Tan, K.; Zhang, W.; Liu, Q.; Lam, N.S.N.; Ge, J. Monitoring terrain elevation of intertidal wetlands by utilising the spatial-temporal fusion of multi-source satellite data: A case study in the Yangtze (Changjiang) Estuary. Geomorphology 2021, 383, 107683. [Google Scholar] [CrossRef]
  53. Hu, Z.; Zhang, X.; Zhang, X.; Wang, J.; Wang, X. Response of spatio-temporal variation of land surface phenology to alpine wetland landscape evolution from 1990 to 2020. Acta Ecol. Sin. 2023, 21. [Google Scholar]
  54. Li, X.L.; Gao, J.; Brierley, G.; Qiao, Y.M.; Zhang, J.; Yang, Y.W. Rangeland Degradation on the Qinghai-Tibet Plateau: Implications for Rehabilitation. Land Degrad. Dev. 2013, 24, 72–80. [Google Scholar] [CrossRef]
  55. Zhang, Y.; Yan, J.; Cheng, X. Advances in impact of climate change and human activities on wetlands on the Tibetan Plateau. Acta Ecol. Sin. 2023, 43, 2180–2193. [Google Scholar]
  56. Shen, X.; Zhang, J.; Lu, X. Spatio-temporal change of marshes NDVI and its response to climate change in the Qinghai-Tibet Plateau. Acta Ecol. Sin. 2020, 40, 6259–6268. [Google Scholar]
  57. Li, Y.; Hou, Z.; Zhang, L.; Song, C.; Piao, S.; Lin, J.; Peng, S.; Fang, K.; Yang, J.; Qu, Y.; et al. Rapid expansion of wetlands on the Central Tibetan Plateau by global warming and El Nino. Sci. Bull. 2023, 5, 485–488. [Google Scholar] [CrossRef] [PubMed]
  58. Chen, J.; Yan, F.; Lu, Q. Spatiotemporal Variation of Vegetation on the Qinghai–Tibet Plateau and the Influence of Climatic Factors and Human Activities on Vegetation Trend (2000–2019). Remote Sens. 2020, 12, 3150. [Google Scholar] [CrossRef]
  59. Jin, Z.; You, Q.; Wu, F.; Sun, B.; Cai, Z. Changes of climate and climate extremes in the Three-Rivers Headwaters’ Region over the Tibetan Plateau during the past 60 years. Trans. Atmos. Sci. 2020, 43, 1042–1055. [Google Scholar]
  60. Sun, Q.; Liu, W.; Gao, Y.; Li, J.; Yang, C. Spatiotemporal Variation and Climate Influence Factors of Vegetation Ecological Quality in the Sanjiangyuan National Park. Sustainability 2020, 12, 6634. [Google Scholar] [CrossRef]
  61. Xu, S.; Yu, Z.; Yang, C.; Ji, X.; Zhang, K. Trends in evapotranspiration and their responses to climate change and vegetation greening over the upper reaches of the Yellow River Basin. Agric. For. Meteorol. 2018, 263, 118–129. [Google Scholar] [CrossRef]
  62. Wei, J.; Wang, W.; Shao, Q.; Rong, Y.; Xing, W.; Liu, C. Influence of mature El Niño-Southern Oscillation phase on seasonal precipitation and streamflow in the Yangtze River Basin, China. Int. J. Climatol. 2020, 40, 3885–3905. [Google Scholar] [CrossRef]
  63. Dong, Y.; Zhai, J.; Zhao, Y.; Li, H.; Qingming, W.; Shan, J.; Huanyu, C.; Ding, Z. Teleconnection patterns of precipitation in the Three-River Headwaters region, China. Environ. Res. Lett. 2020, 15, 104050. [Google Scholar] [CrossRef]
  64. Xi, Y.; Miao, C.; Wu, J.; Duan, Q.; Lei, X.; Li, H. Spatiotemporal Changes in Extreme Temperature and Precipitation Events in the Three-Rivers Headwater Region, China. J. Geophys. Res. Atmos. 2018, 123, 5827–5844. [Google Scholar] [CrossRef]
  65. Qu, Y.; Zhu, Z.; Montzka, C.; Chai, L.; Liu, S.; Ge, Y.; Liu, J.; Lu, Z.; He, X.; Zheng, J. Inter-comparison of several soil moisture downscaling methods over the Qinghai-Tibet Plateau, China. J. Hydrol. 2021, 592, 125616. [Google Scholar] [CrossRef]
  66. Wang, J.; Xu, D. Artificial Neural Network-Based Microwave Satellite Soil Moisture Reconstruction over the Qinghai-Tibet Plateau, China. Remote Sens. 2022, 13, 5156. [Google Scholar] [CrossRef]
  67. Ganjurjav, H.; Gao, Q.; Gornish, E.S.; Schwartz, M.W.; Liang, Y.; Cao, X.; Zhang, W.; Zhang, Y.; Li, W.; Wan, Y.; et al. Differential response of alpine steppe and alpine meadow to climate warming in the central Qinghai–Tibetan Plateau. Agric. For. Meteorol. 2016, 223, 233–240. [Google Scholar] [CrossRef] [Green Version]
  68. Peng, F.; You, Q.; Xu, M.; Guo, J.; Wang, Y.; Xue, X. Effects of Warming and Clipping on Ecosystem Carbon Fluxes across Two Hydrologically Contrasting Years in an Alpine Meadow of the Qinghai-Tibet Plateau. PLoS ONE 2014, 9, e109319. [Google Scholar] [CrossRef] [PubMed] [Green Version]
  69. Wei, J.; Li, X.; Liu, L.; Christensen, T.R.; Jiang, Z.; Ma, Y.; Wu, X.; Yao, H.; López-Blanco, E. Radiation, soil water content, and temperature effects on carbon cycling in an alpine swamp meadow of the northeastern Qinghai–Tibetan Plateau. Biogeosciences 2022, 19, 861–875. [Google Scholar] [CrossRef]
Figure 1. Geographical location of the YRSNP.
Water 15 02557 g001
Figure 2. The distribution of the field survey samples in the YRSNP from 2019 to 2020 (the background is the Landsat 8 image of the study area in 2020).
Water 15 02557 g002
Figure 3. Land use classification of the YRSNP from 2000 to 2020.
Water 15 02557 g003
Figure 4. Sorting diagram of classification features importance based on a random forest model.
Water 15 02557 g004
Figure 5. Variation of area proportion of various land use types in the YRSNP from 2000 to 2020.
Water 15 02557 g005
Figure 6. Land use transfer in the YRSNP from 2000 to 2020.
Water 15 02557 g006
Figure 7. The wetland center of gravity transfer and standard deviation ellipse in the YRSNP from 2000 to 2020. (a) River wetland center of gravity transfer and standard deviation ellipse, (b) lake wetland center of gravity transfer and standard deviation ellipse, (c) marsh wetland center of gravity transfer and standard deviation ellipse, (d) marsh meadow center of gravity transfer and standard deviation ellipse.
Water 15 02557 g007
Figure 8. The Mann–Kendall analysis and change trend of meteorological factors in the YRSNP from 2000 to 2020. (a) The Mann–Kendall analysis of annual precipitation; (b) the change trend of annual precipitation; (c) the Mann–Kendall analysis of warm season precipitation; (d) the change trend of warm season precipitation; (e) the Mann–Kendall analysis of mean annual temperature; (f) the change trend of mean annual temperature; (g) the Mann–Kendall analysis of warm season mean temperature; (h) the change trend of warm season mean temperature; (i) the Mann–Kendall analysis of annual potential evapotranspiration; (j) the change trend of annual potential evapotranspiration; (k) the Mann–Kendall analysis of warm season potential evapotranspiration; (l) the change trend of warm season potential evapotranspiration.
Water 15 02557 g008
Figure 9. The change trend of annual precipitation and warm season precipitation in the YRSNP from 2000 to 2020. (a) The mean annual precipitation; (b) the trend of annual precipitation; (c) the significance of annual precipitation change trend; (d) the mean warm season precipitation; (e) the trend of warm season precipitation; (f) the significance of warm season precipitation change trend.
Water 15 02557 g009
Figure 10. The change trend of mean annual temperature and warm season mean temperature in the YRSNP from 2000 to 2020. (a) The mean annual temperature; (b) the change trend of mean annual temperature; (c) the significance of mean annual temperature change trend; (d) the warm season mean temperature; (e) the trend of warm season mean temperature; (f) the significance of warm season mean temperature change trend.
Water 15 02557 g010
Figure 11. The change trend of annual potential evapotranspiration and warm season potential evapotranspiration in the YRSNP from 2000 to 2020. (a) The mean annual potential evapotranspiration; (b) the trend of annual potential evapotranspiration; (c) the significance of annual potential evapotranspiration change trend; (d) the mean warm season potential evapotranspiration; (e) the trend of warm season potential evapotranspiration; (f) the significance of warm season potential evapotranspiration change trend.
Water 15 02557 g011
Figure 12. Spatial distribution and change trends of soil moisture in the YRSNP from 2000 to 2020. (a) Change trends; (b) spatial distribution using equal interval.
Water 15 02557 g012
Figure 13. Area proportion of different soil moisture grades in the YRSNP from 2000 to 2020.
Water 15 02557 g013
Figure 14. Spatial distribution and change trends of population density in the YRSNP from 2000–2020. (a) Change trends; (b) spatial distribution.
Water 15 02557 g014
Figure 15. Random forest regression analysis results graph (SM: soil moisture; PR: population density; WPET: warm season potential evapotranspiration; APET: annual potential evapotranspiration; WMT: warm season mean temperature; MAT: mean annual temperature; WAP: warm season precipitation; AP: annual precipitation).
Water 15 02557 g015
Table 1. Information of various remote sensing image parameters used in the YRSNP from 2000 to 2020.
Remote Sensing ImageDatasetMain Band Information
Landsat 5 TMUSGS Landsat 5 Level 2, Collection 2, Tier 1B1 Blue 0.45–0.52 μm 30 m
B2 Green 0.52–0.60 μm 30 m
B3 Red 0.63–0.69 μm 30 m
B4 NIR 0.76–0.90 μm 30 m
B5 SWIR1 1.55–1.75 μm 30 m
B6 LWIR 10.40–12.50 μm 120 m/60 m
B7 SWIR2 2.08–2.35 μm 30 m
Landsat 7 ETM+USGS Landsat 7 Level 2, Collection 2, Tier 1
Landsat 8 OLIUSGS Landsat 8 Level 2, Collection 2, Tier 1B2 Blue 0.45–0.52 μm 30 m
B3 Green 0.53–0.60 μm 30 m
B4 Red 0.63–0.68 μm 30 m
B5 NIR 0.85–0.89 μm 30 m
B6 SWIR1 1.56–1.67 μm 30 m
B7 SWIR2 2.10–2.30 μm 30 m
Table 2. Wetland classification system for remote sensing in the YRSNP.
Wetland CategoryLandsat Remote Sensing ImageDescription
River wetlandWater 15 02557 i001Natural linear waterbody with flowing water in the wetland area
Lake wetlandWater 15 02557 i002Natural polygon waterbody with standing water in the wetland area
Marsh wetlandWater 15 02557 i003Naturally formed, the center is mostly patchy, and low vegetation covers the surrounding area
Marsh meadowWater 15 02557 i004Natural wetland and surrounded by large areas of tall grass
Table 3. Table of classification feature parameters used based on Landsat 5 7 8 images.
Primary Classification FeatureSecondary Classification FeatureTertiary Classification FeatureFormula
Landsat 5 7Landsat 8
Spectral featureBandBlue, Green, Red, NIR, SWIR1, SWIR2Blue (B1), Green (B2), Red (B3), NIR (B4), SWIR1 (B5), SWIR2 (B7)Blue (B2), Green (B3), Red (B4), NIR (B5), SWIR1 (B6), SWIR2 (B7)
Spectral indexWater indexMNDWI B 2 B 5 B 2 + B 5 B 3 B 6 B 3 + B 6
NDWI B 2 B 4 B 2 + B 4 B 3 B 5 B 3 + B 5
NDWI_B B 1 B 3 B 1 + B 3 B 2 B 4 B 2 + B 4
RNDWI B 5 B 3 B 5 + B 3 B 6 B 4 B 6 + B 4
EWI ( B 2 B 4 B 7 ) ( B 2 + B 4 + B 7 ) ( B 3 B 5 B 7 ) ( B 3 + B 5 + B 7 )
SWI B 1 + B 3 B 4 B 2 + B 4 B 5
AWEI 4 × ( B 2 B 5 ) ( 0.25 × B 4 + 2.75 × B 7 ) 4 × ( B 3 B 6 ) ( 0.25 × B 5 + 2.75 × B 7 )
UGWI B 2 3 ( B 1 + B 3 + B 4 ) B 2 3 + ( B 1 + B 3 + B 4 ) B 3 3 ( B 2 + B 4 + B 5 ) B 3 3 + ( B 2 + B 4 + B 5 )
Vegetation indexNDVI B 4 B 3 B 4 + B 3 B 5 B 4 B 5 + B 4
VIgreen B 2 B 3 B 2 + B 3 B 3 B 4 B 3 + B 4
RVI B 4 B 3 B 5 B 4
RDVI B 4 B 3 B 4 + B 3 B 5 B 4 B 5 + B 4
MSR ( B 4 B 3 ) 1 B 4 + B 3 + 1 ( B 5 B 4 ) 1 B 5 + B 4 + 1
MCARI [ B 4 B 3 0.2 × ( B 4 B 2 ) ] × B 4 B 3 [ B 5 B 4 0.2 × ( B 5 B 3 ) ] × B 5 B 4
Red edge indexCIre ( B 4   /   B 3 ) 1 ( B 5   /   B 4 ) 1
Build-up indexNDBI B 5 B 4 B 5 + B 4 B 6 B 5 B 6 + B 5
Bare land indexBSI ( B 3 + B 5 ) ( B 4 + B 8 ) ( B 3 + B 5 ) + ( B 4 + B 8 ) ( B 4 + B 6 ) ( B 5 + B 2 ) ( B 4 + B 6 ) + ( B 5 + B 2 )
Snow indexNDSI B 2 B 11 B 2 + B 11 B 3 B 6 B 3 + B 6
Topographic
feature
Elevation
Slope
Aspect
Table 4. Evaluation table of wetland remote sensing classification accuracy in study area based on a random forest model.
YearUser AccuracyOverall
Accuracy
Kappa
River
Wetland
Lake
Wetland
Marsh
Wetland
Marsh
Meadow
GrasslandOthers
20000.80240.96870.69230.75670.81320.92300.84270.7951
20010.85130.98210.57140.80550.73980.94590.83090.7799
20020.79380.89360.76470.70000.80000.96730.83110.7818
20030.83140.97910.65000.87170.75720.95400.83770.7915
20040.86660.98140.72720.78780.77770.89650.84090.7907
20050.86740.93750.90000.74280.80000.95000.85940.8192
20060.88050.90760.83330.75600.79240.94620.85350.8110
20070.84610.98000.63060.75600.77320.95660.84260.7954
20080.85360.99990.83330.78780.85530.95650.88780.8538
20090.84090.99990.81810.74070.77930.92770.85230.8106
20100.87640.99990.75000.72720.80790.91010.86590.8279
20110.90660.99990.76920.64100.83440.93400.86890.8311
20120.90620.96550.66660.60860.71600.97500.82950.7777
20130.90120.96490.73330.84610.79730.96350.87380.8393
20140.88750.98300.75000.79310.75830.95180.85780.8175
20150.85930.99990.64280.84000.74170.94890.84120.7926
20160.85360.98000.85710.63040.77580.99990.83790.7882
20170.83330.96420.85710.74070.79390.96150.85430.8082
20180.90900.93650.91660.64100.74350.93820.83410.7881
20190.90470.97910.64000.68080.80400.90210.84000.7964
20200.86450.96820.73910.72090.80740.94590.85210.8118
Note: Others included barren, built-up land, and other land use/cover types.
Disclaimer/Publisher’s Note: The statements, opinions and data contained in all publications are solely those of the individual author(s) and contributor(s) and not of MDPI and/or the editor(s). MDPI and/or the editor(s) disclaim responsibility for any injury to people or property resulting from any ideas, methods, instructions or products referred to in the content.

