Article

Dynamic Changes and Driving Forces of Alpine Wetlands on the Qinghai–Tibetan Plateau Based on Long-Term Time Series Satellite Data: A Case Study in the Gansu Maqu Wetlands

1
State Key Laboratory of Remote Sensing Science, Aerospace Information Research Institute, Chinese Academy of Sciences, Beijing 100094, China
2
University of Chinese Academy of Sciences, Beijing 100049, China
3
Technology Innovation Center for Land Engineering, Ministry of Natural Resources, Beijing 100035, China
4
Chinese Academy of Meteorological Sciences, Beijing 100081, China
5
School of Earth Science and Resources, Chang’an University, Xi’an 710054, China
*
Author to whom correspondence should be addressed.
Remote Sens. 2022, 14(17), 4147; https://doi.org/10.3390/rs14174147
Submission received: 28 July 2022 / Revised: 17 August 2022 / Accepted: 19 August 2022 / Published: 24 August 2022
(This article belongs to the Special Issue Remote Sensing of Wetlands and Biodiversity)

Abstract

:
The Qinghai–Tibet Plateau (QTP), also known as the Third Pole of the Earth, is sensitive to climate change, and it has become a hotspot area for research. As a typical natural ecosystem on the QTP, alpine wetlands are particularly sensitive to climate change. The identification of different types of alpine wetland and analysis of changes in their distributions and areas are the most direct indicators for characterizing the impact of climate change on wetlands. To understand the dynamic change process of the alpine wetlands in the QTP and their responses to climate change, the Maqu wetlands, located at the source of the Three Rivers in the eastern part of the QTP, was taken as an example; the Google Earth Engine (GEE) remote sensing cloud platform and long-term dense Landsat time series data from 1990 to 2020 were used to map the annual wetland classification and to analyze the evolution characteristics of the wetlands and their driving forces. The results revealed that (1) based on dense Landsat time series data, different alpine wetland types can be effectively distinguished, including swamp, swamp meadow, and wet meadow. (2) From 1990 to 2020, the area of the Maqu wetlands exhibited an overall fluctuating decrease, with the total area decreasing by about 23.35%, among which the swamp area decreased the most (by 27.15%). The overall type of change was from wet to dry. All of the types of wetlands were concentrated between 3400 and 3600 m above sea level, and the reduction in the wetland area was concentrated on slopes < 3°, with the greatest loss of wetland area occurring on shady slopes. (3) The driving forces of the changes in the wetlands were predominantly temperature and precipitation, and the greatest correlation was between the total wetland area and the growing season temperature. The results of this study provide valuable information for the conservation of alpine wetlands.

Graphical Abstract

1. Introduction

Wetlands are one of the most biodiverse landscapes in nature, and as transitional ecosystems between land and water, they are more sensitive to climate change [1,2]. Climate change, such as temperature increases, precipitation changes, and sea level rise, affects wetland hydrological processes and plant communities and leads to changes in wetland ecosystems [3]. Alpine wetlands are situated at high latitudes and high altitudes, where vegetation growth is slow and the growing season is short, and they are also more sensitive to climate change than other regions [4,5]. The Qinghai–Tibet Plateau (QTP), also known as the Third Pole of the Earth, is one of the hotspots for climate change research and one of the main distribution areas of alpine wetlands in China, accounting for about 20% of the country’s wetlands [6]. The alpine wetlands on the QTP are vulnerable to low temperature environments, strong evapotranspiration, direct radiation, and special ecological conditions, and their response to climate change mainly depends on water recharge and discharge patterns [7]. Thus far, research on the response of alpine wetlands to climate change has mainly focused on topics, such as the spatial and temporal changes in the vegetation distribution, carbon cycling, monitoring the dynamics of grassland phenology, and wetland type transformation [8,9,10,11,12]. The information gained by studying the changes in the alpine wetlands and their responses to climate change can help us understand the specific internal causes of wetland degradation to effectively monitor ecological security and to formulate reasonable protection policies.
The Maqu wetlands are a typical area of alpine wetlands on the QTP. They are an important water source conservation pond and supply area in the upper reaches of the Yellow River. Due to the impacts of climate change and human activities, the wetland area has been shrinking and the ecological function has been gradually degrading [13]. The high spatial heterogeneity of the highlands creates complex and diverse vegetation communities that may respond differently to climate change [14]. The main types of wetlands in Maqu include water, swamp, swamp meadow, and wet meadow. Regarding wetland changes due to climate change and human activities, most studies have focused on wetland loss and gain and on the conversions between wetland and non-wetland types [15]. However, changes in wetland area also include conversion between wetland types, i.e., the conversion of one wetland type to another wetland type, and the transition between wetland types may be more sensitive to climate change; so, it is necessary to strengthen the monitoring and analysis of changes between wetland types.
Currently, there is great uncertainty in the analysis of changes in alpine wetlands, which is mainly due to the lack of long-term datasets on alpine wetlands in existing studies. To obtain information about the long-term dynamic changes in alpine wetlands, it is crucial to explore rapid and accurate methods for wetland change detection [16]. The identification of wetland types and their changes is a challenge due to their complex surface cover, seasonal dynamics, and limited field investigations [17]. Change detection methods can be divided into two basic types: dual time phase change detection and time series change detection [18]. The main idea of the dual-phase change detection method is to detect changes by comparing the differences between two images in different time periods. The time interval of the selected images is usually many years; it does not consider the continuity of the time dimension and lacks investigation of the change process; thus, it is likely to miss the critical and rapidly changing dynamic information [19]. However, to obtain high-frequency continuous change information, the time series change detection method can be used. Among them, the time series change detection method based on post-classification data, that is, post-classification comparison (PCC), has been widely used for various types of land use and land cover change and wetland change detection due to its simplicity and directness [20,21,22]. A unique advantage of using time series PCC is to use continuous information to improve the ability to describe changes in wetlands over time [23,24]. Through dense long-term time series analysis, we can determine the time point when the real changes occurred, avoiding the fixed time interval and the chance of missing the year when the real changes occurred.
Research on wetland evolution relies on long-term data accumulation, and multi-source remote sensing historical archived data are the basis for wetland change detection. Landsat thematic mapper/enhanced thematic mapper plus (TM/ETM+) images have been widely used for wetland mapping and monitoring due to their high spatial resolution (30 m), their ability to provide continuous long time series image data (since the 1970s), and their free access and availability [25]. Google Earth Engine (GEE), a cloud-based platform for geospatial data analysis, provides an efficient solution for analyzing long-term and large-area land use change [26]. The GEE is an integrated cloud computing platform for remote sensing and earth science data processing, and it provides rich data resources and various integrated algorithm tools [27,28].
To explore the long-term change characteristics of alpine wetlands and their response to climate change, we took the Maqu alpine wetlands on the eastern part of the QTP as an example. The specific objectives were as follows: (1) classification and mapping of the Maqu wetlands from 1990 to 2020 using the GEE platform and dense long-term Landsat time series data; (2) analysis of the dynamic processes of wetland change, including area change, type conversion, and spatial pattern changes; and (3) analysis of the driving forces of wetland change, especially the response relationship between climate change and the changes in the areas of swamp, swamp meadow, and wet meadow, to provide a basis for the maintenance of wetland ecosystems in Maqu and the environmental protection of fragile ecological zones on the QTP.

2. Materials and Methods
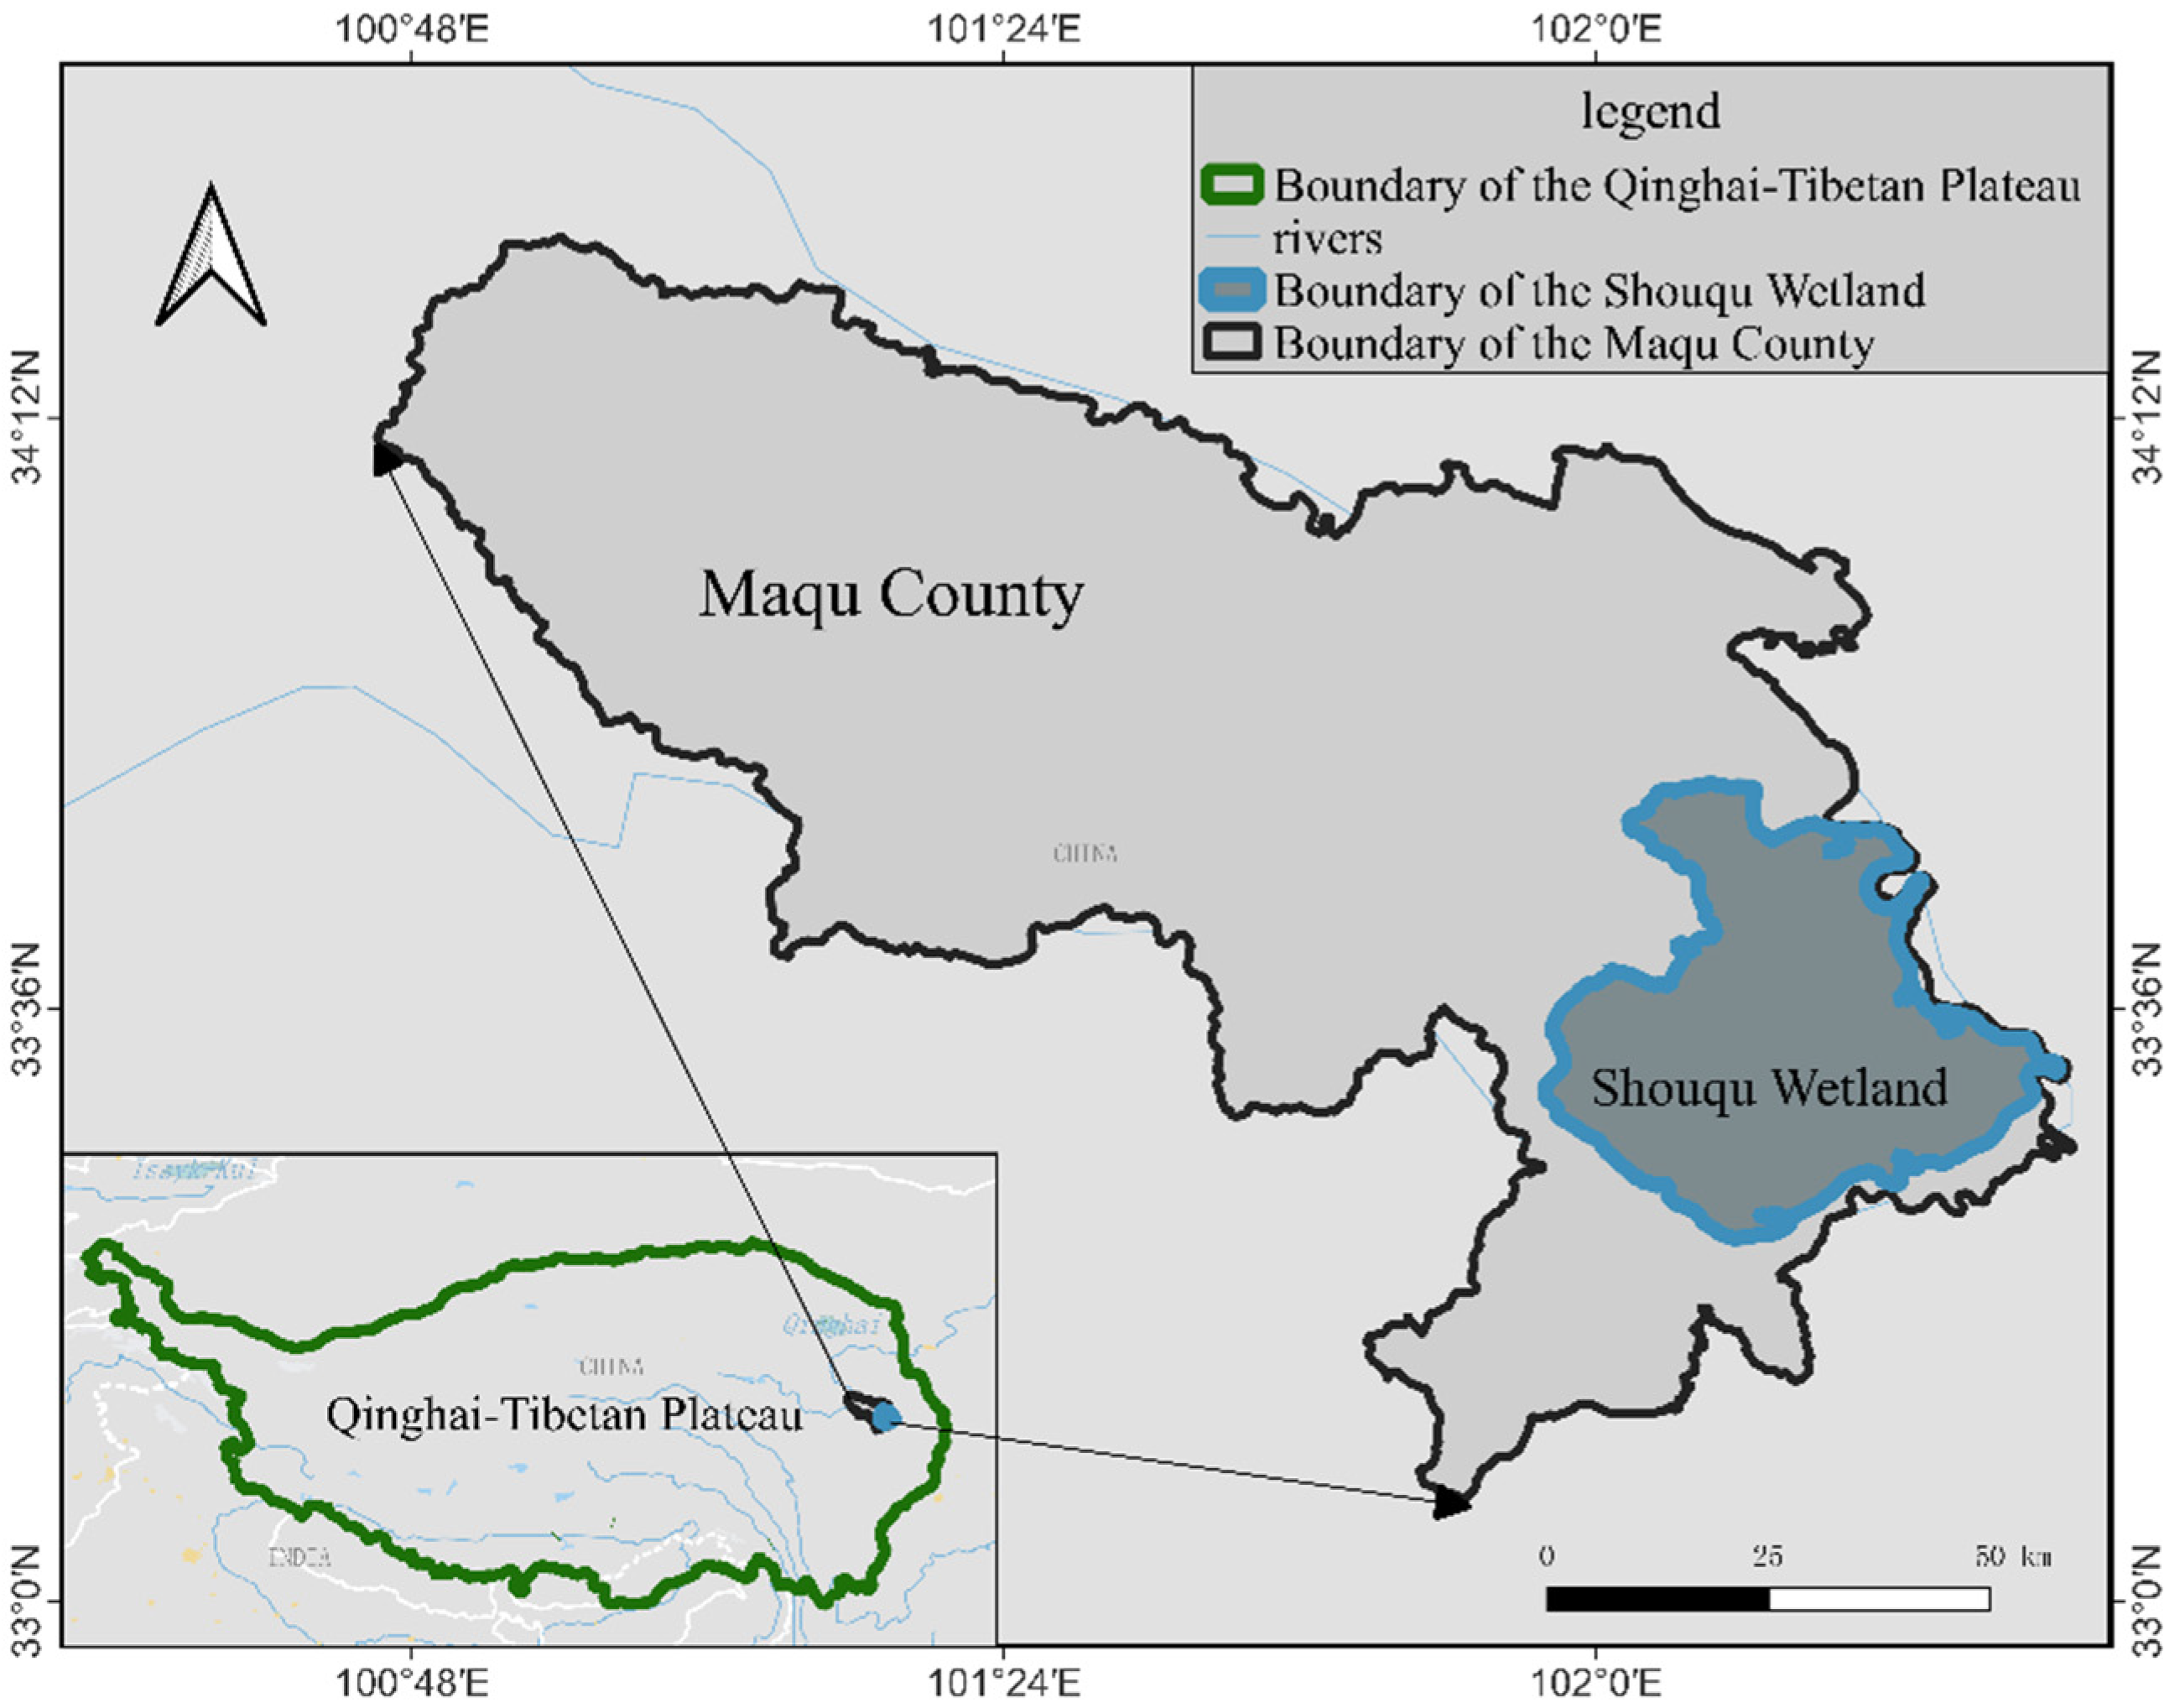
2.1. Study Area

Located on the eastern part of the QTP, southern part of Gansu Province, at the junction of Gansu, Qinghai, and Sichuan provinces (33.03–34.23°N, 100.46–102.29°E), Maqu County is an important national ecological function reserve in China (Figure 1). The Maqu wetlands are an important water-conserving area in the upper reaches of the Yellow River. This area contains a large number of swampy wetlands and alpine meadows, is rich in surface water, and is the largest wetland in the source area of the Yellow River.
The elevation of the region ranges from 3300 to 4806 m, and the terrain is high in the west and low in the east. The study area has a dry and cold plateau continental alpine humid climate, with long winters, extremely short summers [29], a mean annual temperature of 1.2 °C, concentrated rainfall, and annual precipitation of 615.5 mm. Due to its typical wetland types, geographic conditions, and ecological environment, this area is a typical representative of the alpine wetland ecosystem on the QTP.

2.2. Data

To compile a complete time series, we collected available Landsat image data from 1990 to 2020 for the study area (Table 1). Because of the special geographical location of Magu County (high altitudes, cloudy conditions, and lack of high-quality winter images), satellite image data acquired during the growing season (April–September) were selected for synthesis. Finally, 570 Landsat TM images, 21 ETM+ images, and 285 Operational Land Imager (OLI) images were selected for use in this study.
Digital elevation data were also obtained, and the topographic data were derived from the Shuttle Radar Topography Mission (SRTM) digital elevation data. This SRTM V3 product (SRTM Plus) was provided by the National Aeronautics and Space Administration (NASA, Washington, DC, USA) Jet Propulsion Laboratory, with a spatial resolution of 1 arc second (~30 m). The data were downloads from the SRTM data distribution website (http://srtm.csi.cgiar.org (accessed on 1 October 2021)). These data were mainly used to calculate the terrain moisture index, slope, aspect, and terrain undulation.
Both the temperature and precipitation data were from the ERA5, i.e., the fifth generation of the atmospheric reanalysis of global climate information, and the ERA5 DAILY provides hourly estimates of atmospheric, terrestrial, and oceanic climate variables, which are available at https://cds.climate.copernicus.eu/cdsapp#!/home (accessed on 12 November 2021). The temperature data used were the 2 m mean air temperature, the precipitation data used were the daily total precipitation, and the daily data were combined to obtain the annual data.
The evapotranspiration data and the Palmer index (drought index) were derived from the TerraClimate global land surface monthly climate and climate water balance dataset [30]. The Palmer index was calculated by determining the amount of precipitation needed in an area and comparing it with the actual amount of precipitation in order to analyze and calculate the severity of drought in that area [31]. Both were gridded datasets with a spatial resolution of approximately 4 km, and the data were obtained from the website of the Climatology Lab (https://www.climatologylab.org/terraclimate.html (accessed on 27 November 2020)).

2.3. Methods

The workflow of this study can be divided into three main parts (Figure 2). First, the long-term Landsat time series image data for 1990–2020 were reconstructed and composited by year. Second, based on the alpine wetland classification system, we used the random forest algorithm to classify the long-term time series image data and to obtain classification maps of the Maqu wetlands from 1990 to 2020. Then, we analyzed the changes in the wetland area, type, and spatial distribution. Finally, we explored the relationship between climate change and the changes in the area of the alpine wetlands.

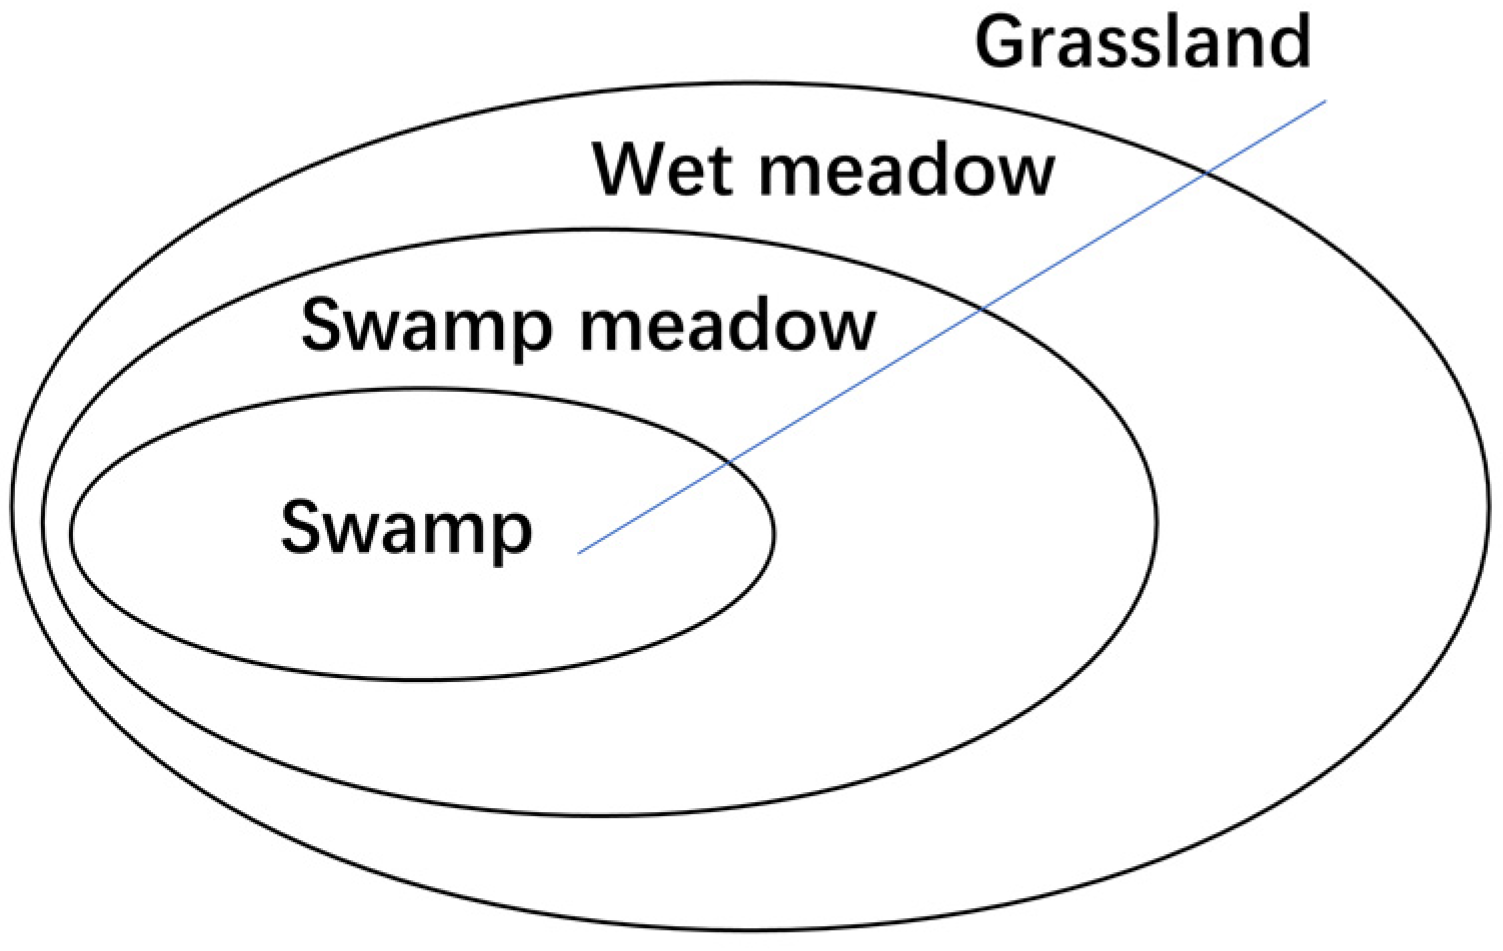
2.3.1. Classification System and Training Samples

Based on the widely used wetland classification system and combined with the unique characteristics of alpine wetlands [32,33], the Maqu wetland classification system was constructed. The wetland types include water body (river and lake), swamp wetland, swamp meadow, and wet meadow, and the non-wetland types include grassland, shrubland, bare land, and snow. The specific feature types and their interpreted characteristics are presented in Table 2.
Due to the complexity of the composition and actual distribution of the different types of wetlands, it is difficult to reach a consensus on the definition and boundaries of wetlands [34]. In terms of the spatial distribution pattern, the geographic features exhibit a succession from swamp to swamp meadows to wet meadows [35]. Ideally, as shown in Figure 3, the swamp is the center from which the wetlands spread outward. However, the actual distribution does not have such a clear boundary. The main differences between these three types of wetlands are in their water contents and vegetation type [36]. From the perspective of the water content, the swamp is characterized by saturated soil conditions and soil moisture contents of 92–112%. The soil moisture content of the swamp meadow is 89–97%, which is drier than the swamp, but there are still some places where water accumulates throughout the year. Only a small part of the wet meadow is inundated during the rainy season, with soil moisture contents of 34–43%.
Based on the GEE platform and Google Earth high-resolution satellite images, the visual interpretation method was adopted, and a total of 2580 sample points were selected with a Landsat image acquired in 2020 as the baseline image. To obtain sample points for the last 30 years of historical years, we adopted a sample migration method based on reclassification [37]. First, use the samples of the reference year (2020) to directly classify the image data of the target year (1990–2019), compare the classification results with the sample point types, remove the sample points whose initial classification results were inconsistent with the sample types, and the remaining samples were used for reclassification to obtain higher accuracy classification results. Since most of the land cover types do not change greatly, the reclassification sample migration method is simple and straightforward, and this selection strategy ensures the overall accuracy and stability of the sample set.

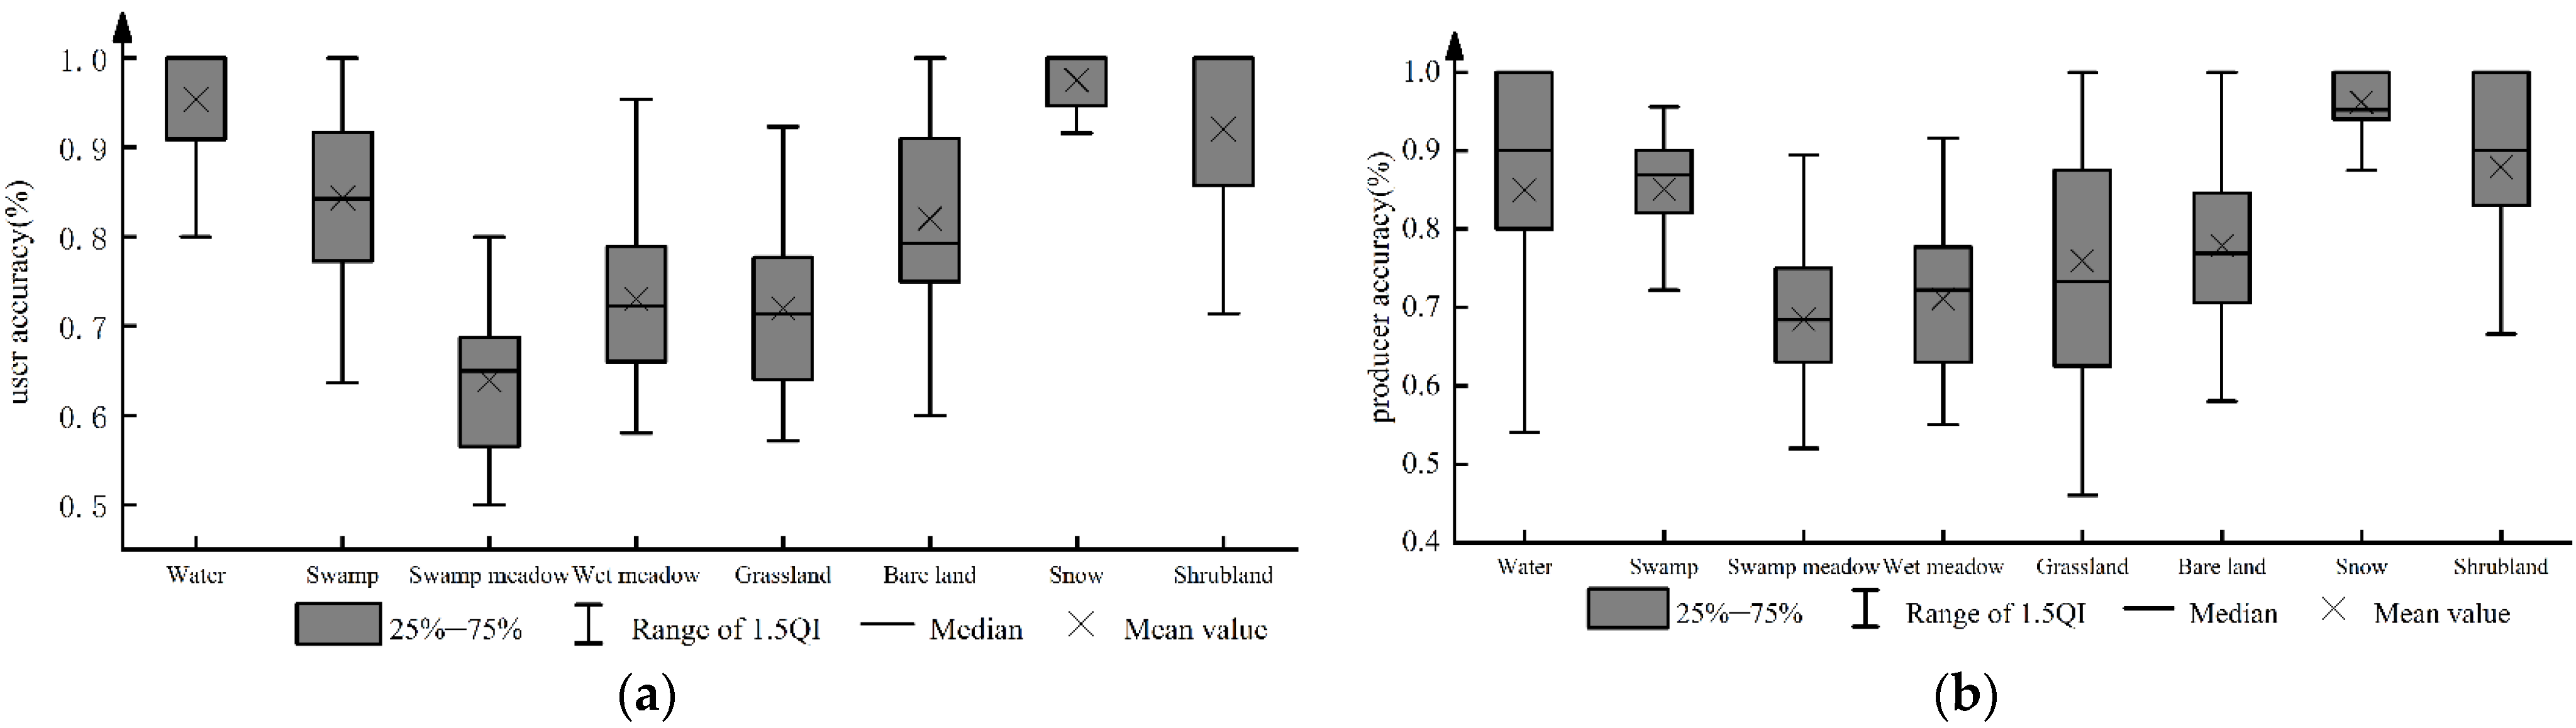
2.3.2. Classification Based on Random Forest and Accuracy Assessment

Firstly, all available Landsat image data from 1990 to 2020 were acquired on GEE, and the annual data set was formed by using the data after cloud masking from April to September each year. Then, the median function was used to calculate the median of the image dataset year-by-year and finally to form a median image per year.
To classify the Maqu wetland year-by-year, this paper establishes a random forest (RF) classifier based on the alpine wetland classification system and the features set. RF is an integrated learning method with decision trees as the basic classifier [38]. Multiple sub-sample sets are built by iteratively extracting samples from the original samples, decision trees are built based on the sub-sample sets, respectively, and the generated decision trees are formed into a classifier to classify the input data using voting. Two parameters need to be set in the RF building step: the number of decision trees (N) and the number of features per node of each tree (m) [39]. In this paper, the number of decision trees is set to 45, and the number of features selected for each node is 5.
In addition to the spectral features of the image band, the classification features also include the vegetation index, water index, and topographic features. All of the feature variables are described in Table 3.
The topographic wetness index (TWI) is a physical indicator of the influence of the topography on the runoff flow and accumulation in the modeled runoff area. The TWI is a function of the slope and upstream contributing area, and it quantifies the control of the topography on the underlying hydrological processes [40]. It is calculated as follows:
T W I = l n ( α tan β )
where α is the sink area over the contour length, and β is the steepest outward slope of each grid cell, which is measured as the drop/distance, i.e., the tangent value of the slope angle. Larger TWI values indicate that the soil water content in the area is more likely to reach saturation.
Table 3. Formulates and sources of feature variables.
FeaturesAbbrev.FormulaReference
Water Body IndexNDWI ρ G r e e n ρ N I R ρ G r e e n + ρ N I R [41]
MNDWI ρ G r e e n ρ S W I R ρ G r e e n + ρ S W I R [42]
LSWI ρ N I R ρ S W I R ρ N I R + ρ S W I R [43]
EWI ρ G r e e n ρ N I R ρ S W I R ρ G r e e n + ρ N I R + ρ S W I R [44]
AWEI 4   ×   ( ρ G r e e n - ρ S W I R 1 )     ( 0.25 × ρ N I R + 2.75 × ρ S W I R 2 )[45]
Vegetation IndexNDVI ρ N I R ρ R e d ρ N I R + ρ R e d [46]
RVI ρ N I R ρ R e d
RDVI ρ N I R ρ R e d ρ N I R + ρ R e d [47]
CIre ρ N I R ρ R e d 1 [48]
Terrain
Features
TWI T W I = l n ( α tan β ) [40]
Slope
Aspect
Relief
To evaluate the accuracy of the classification maps from 1990–2020, a stratified random sampling design was used to assess the classification accuracy, and 20% of the screened sample data of each year were used as the validation data of that year. Confusion matrix was used to evaluate the image classification results, and it was measured according to the overall accuracy, kappa coefficient, producer accuracy, and user accuracy.

2.3.3. Post Classification Change Detection Analysis

The change detection method used in this study was PCC, which uses a direct comparison of the classification results to analyze the changes. Long-term time series analysis of the wetland classification maps from 1990 to 2020 was conducted to analyze the changes in the wetland area, types, and spatial distribution. The PCC method has the following advantages. By classifying the images in each phase, it can avoid the radiation normalization problem caused by multi-source sensors. It can provide information about the time period before and after the change, and this method has no limit regarding the length of the time series.

3. Results

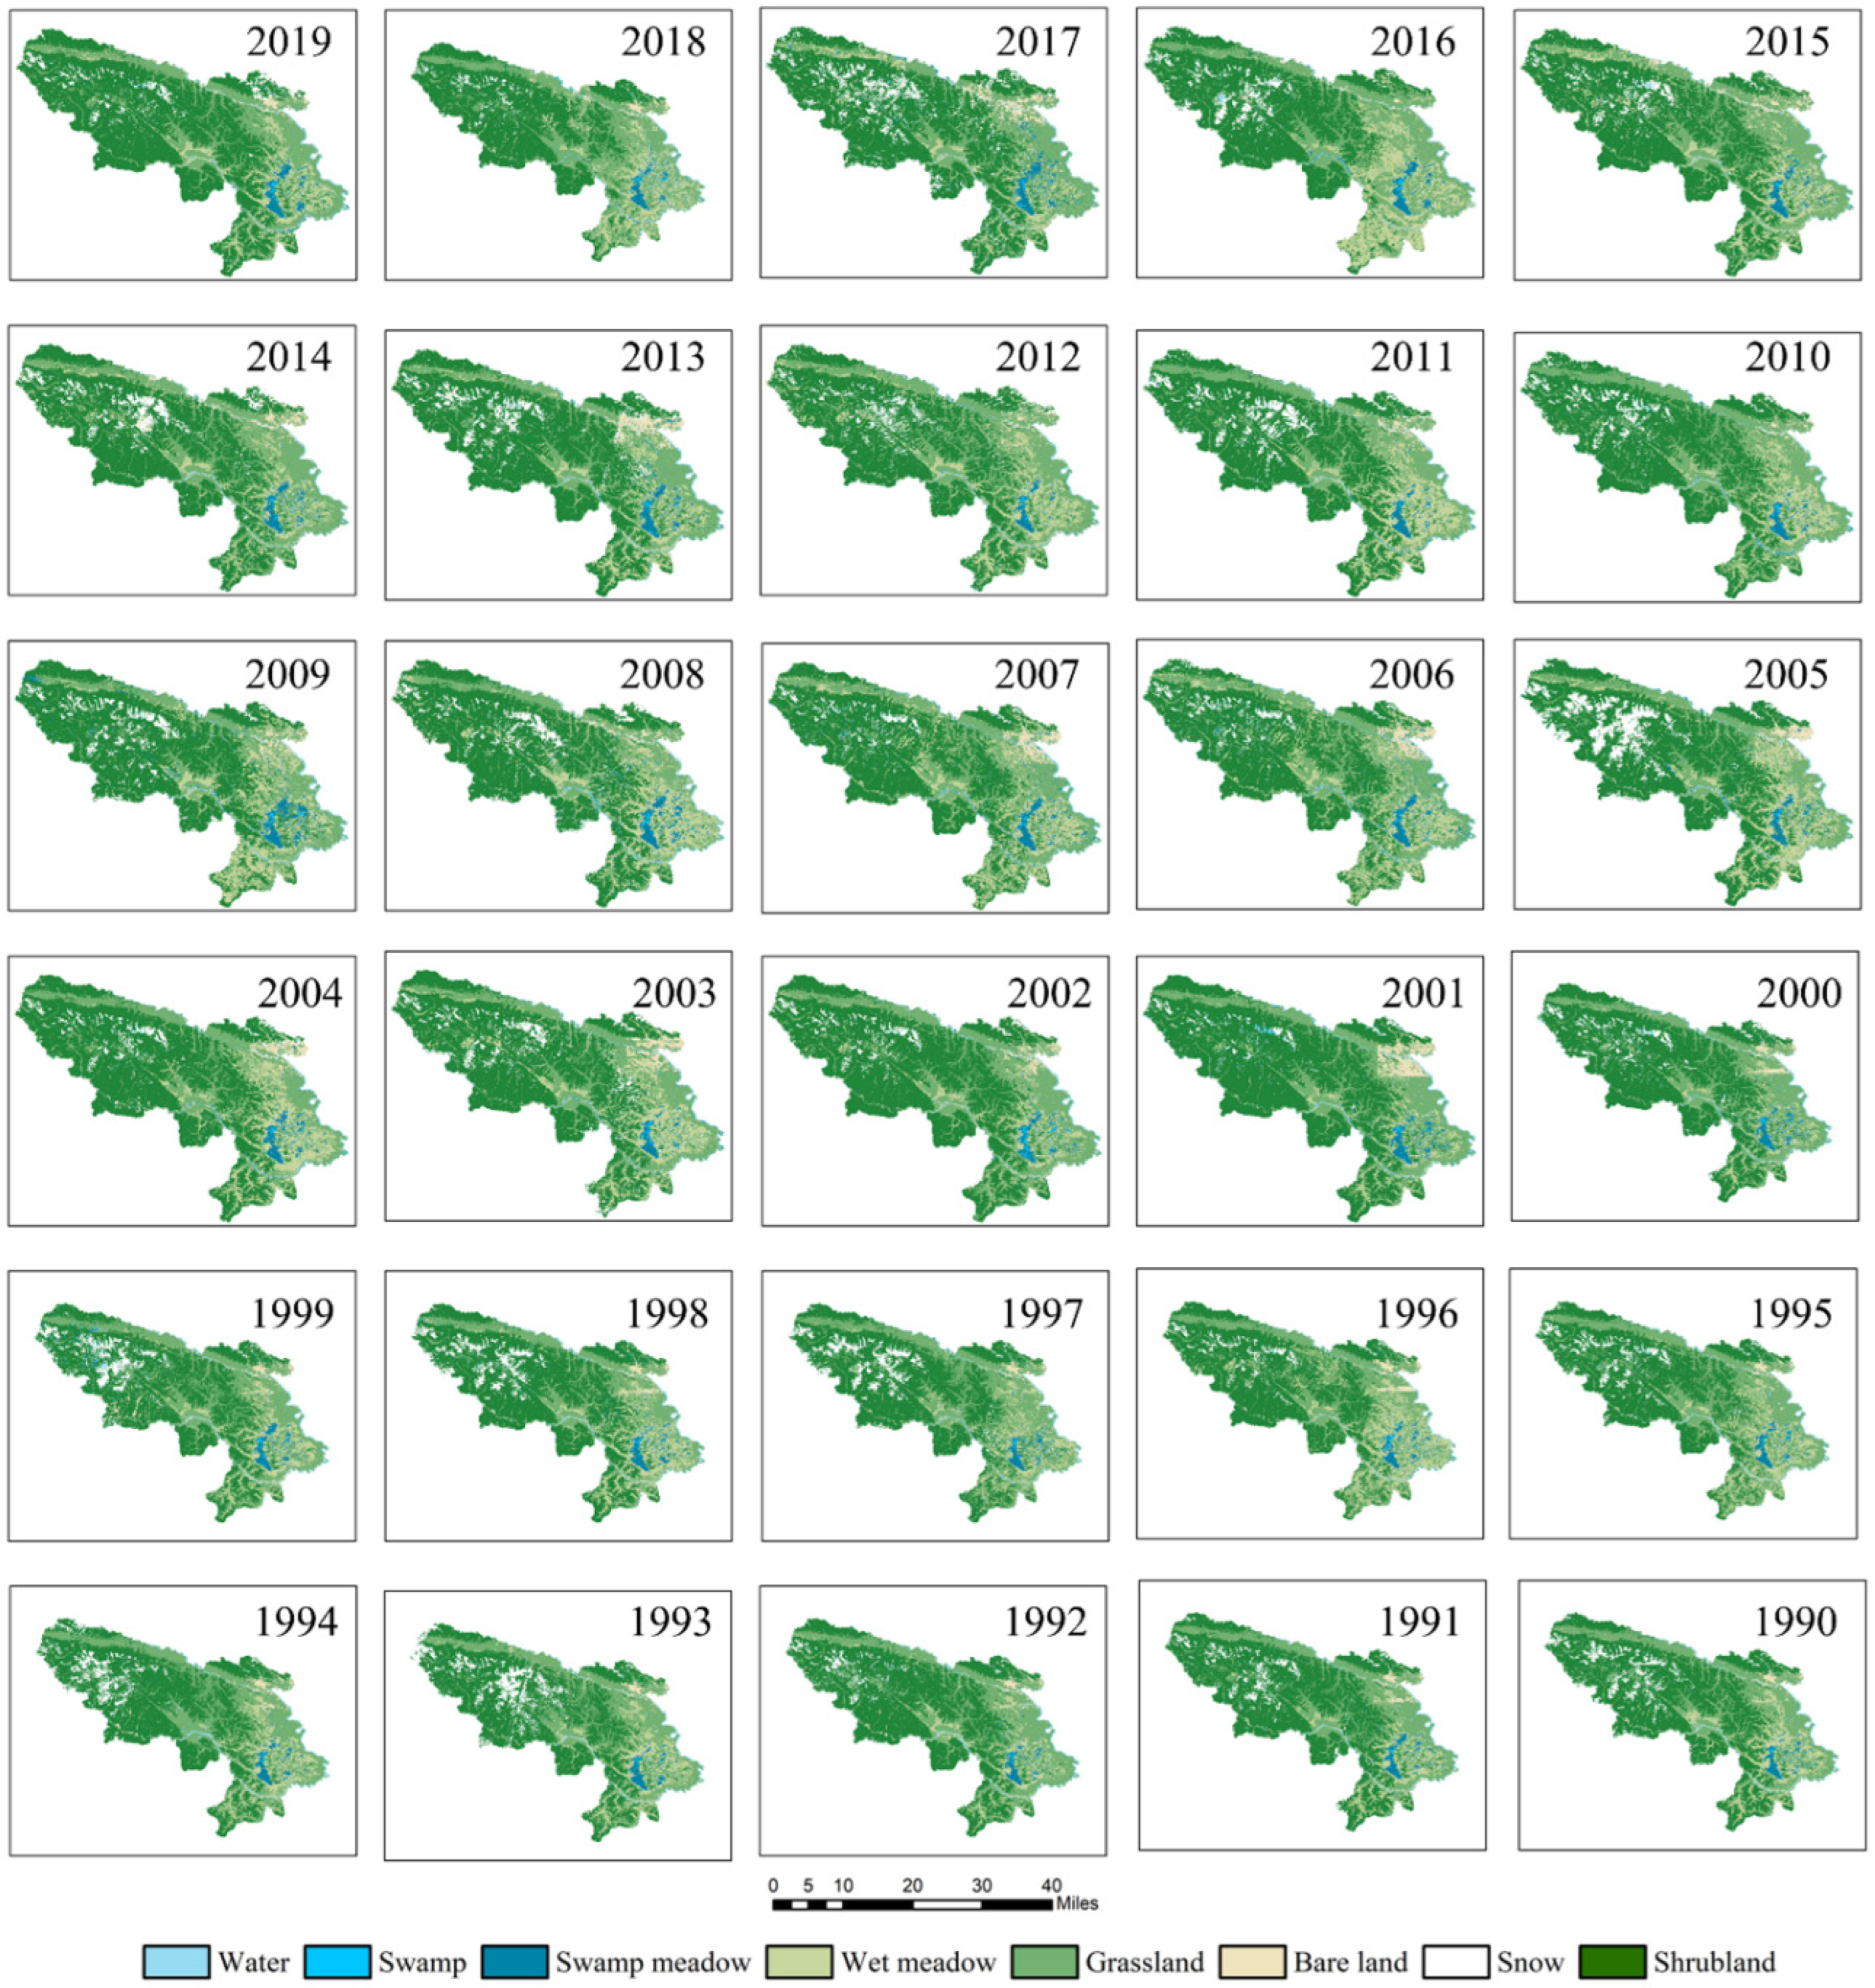
3.1. Annual Classification Results and Accuracy

Using long-term Landsat time series image data and the RF classification method, we obtained annual classification maps of the Maqu wetlands from 1990 to 2020. The accuracy indicators of the classification results include the overall accuracy (OA), kappa coefficient, producer accuracy (PA), and user accuracy (UA). The statistical results are shown in Figure 4. The average OA of the annual classification map from 1990 to 2020 is 84.63% (80.41–91.62%), the kappa coefficient is 0.81 (0.77–0.89), the average PA is 81.43%, and the average UA is 84.72%. The classification accuracies of the grassland and shrubland are relatively stable, with average classification accuracies of 86.62% and 83.73%, respectively. Among the four wetland types, the highest average classification accuracy is 93.15% for water bodies; the accuracies of the swamp, swamp meadow, and wet meadow are 74.26%, 81.42%, and 76.35%, respectively. These results show that the remote sensing classification results have a high accuracy, meet the accuracy target, and satisfy our needs.
The annual wetland classification maps for Maqu wetland from 1990 to 2020 based on the RF method are shown in Figure 5 and Figure 6. Figure 5 shows the classification map of the Maqu wetlands for 2020. The enlarged map on the right shows the details of the wetland classification in the Yellow River Shouqu wetland. Figure 6 shows the classification maps of the Maqu wetlands from 1990 to 2019, which exhibit spatial consistency. These maps illustrate the dynamic changes during the past 31 years.
In terms of the spatial distribution, the largest wetland area was located in the eastern-central part of Maqu County, concentrated in the Yellow River Shouqu wetlands. The distribution of the Maqu wetlands was controlled by the surface relief and shape, and most of the rivers were distributed along the boundaries of Maqu County. The distribution of the swamp was relatively concentrated, mainly in the southeastern part of Maqu County. The swamp, swamp meadow, and wet meadow were distributed in close proximity to each other, and their boundary lines are difficult to delineate, exhibiting a progressive distribution in position. The grasslands were scattered, and the shrub land was mainly located in the northwestern part of Maqu County.
In terms of the wetland types, according to the interpretation of the remote sensing images, the statistics (Figure 7) show that the total area of the Maqu wetlands in 2020 was 1021.48 km2. The wet meadow accounted for nearly one half of the wetlands (about 579.04 km2) and was the main component of the Maqu wetlands. Melting snow and glaciers at high altitudes have refilled the downslope areas, creating vast areas of wet meadows. The swamp meadow accounted for the second largest proportion of the total wetland area (257.69 km2, and 25.23%). The swamp meadow was distributed at the periphery of the swamp and was often recharged by downslope water flow, snowmelt, and rainfall. The water bodies in the Maqu wetlands were mainly related to the Yellow River and its many tributaries, covering an area of 143.94 km2. The distribution of the swamp was relatively small, about 40.81 km2, accounting for 4% of the total wetland area.

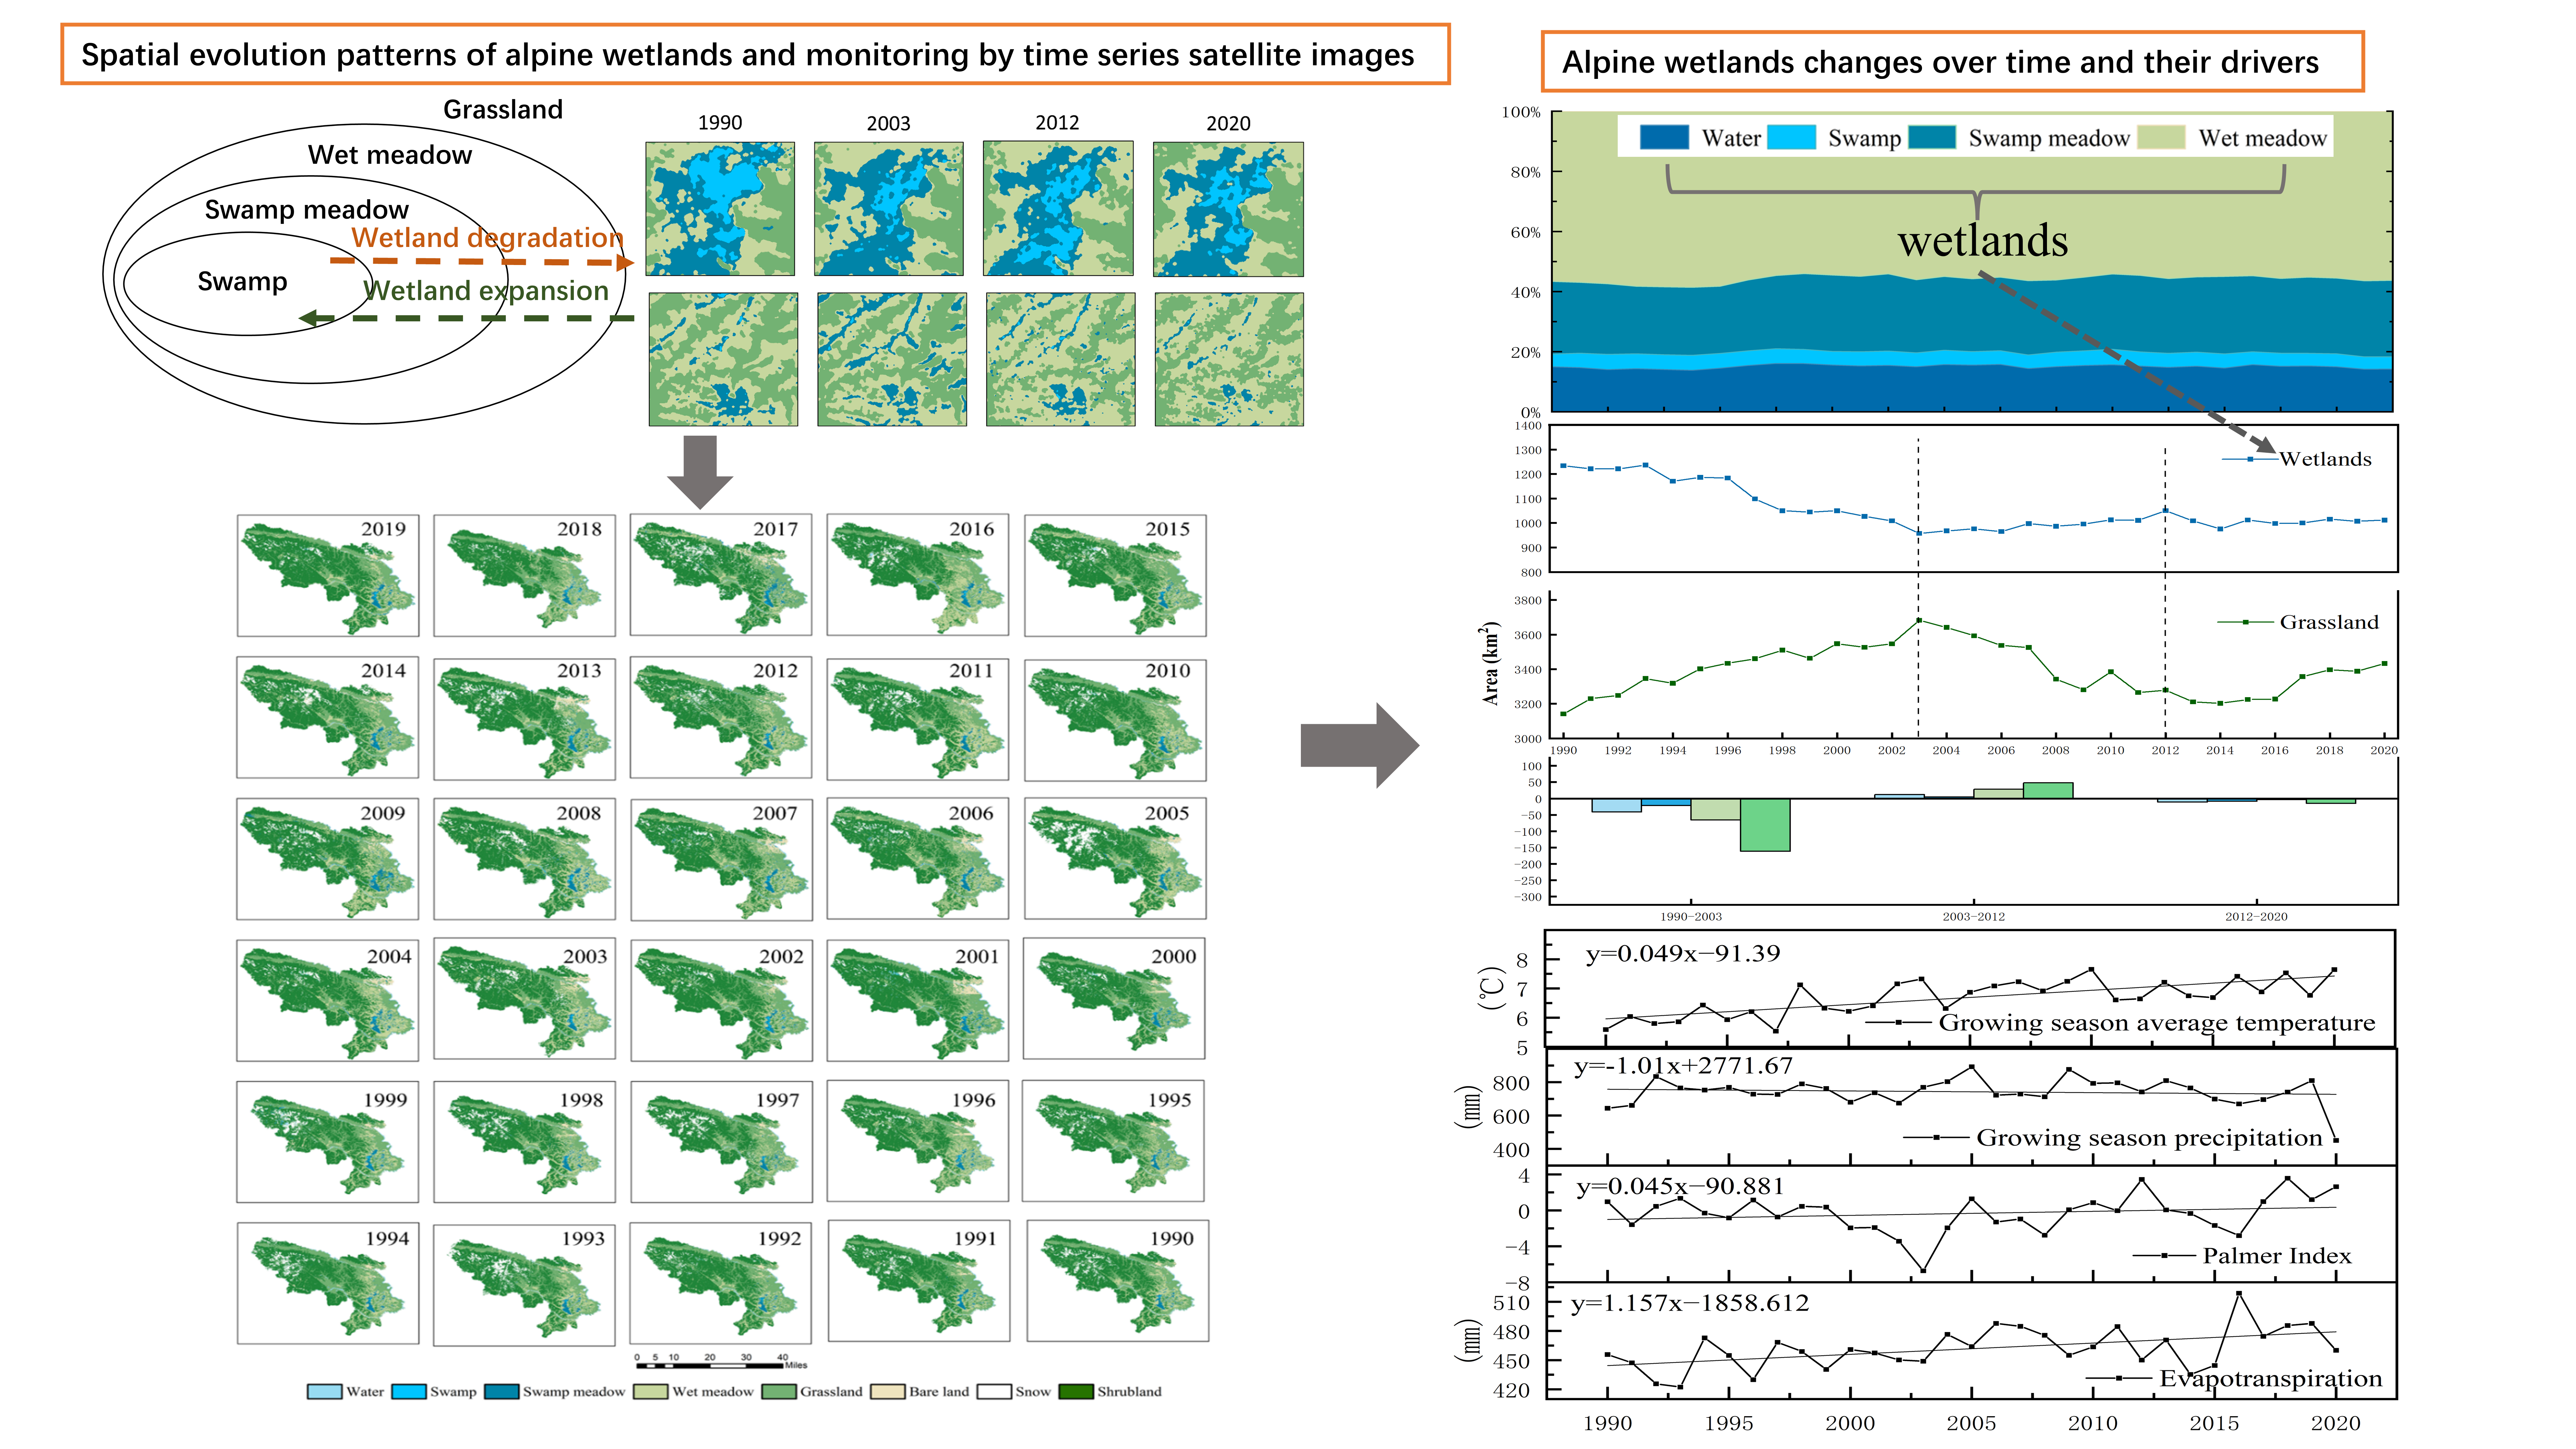
3.2. Wetland Change Characteristics

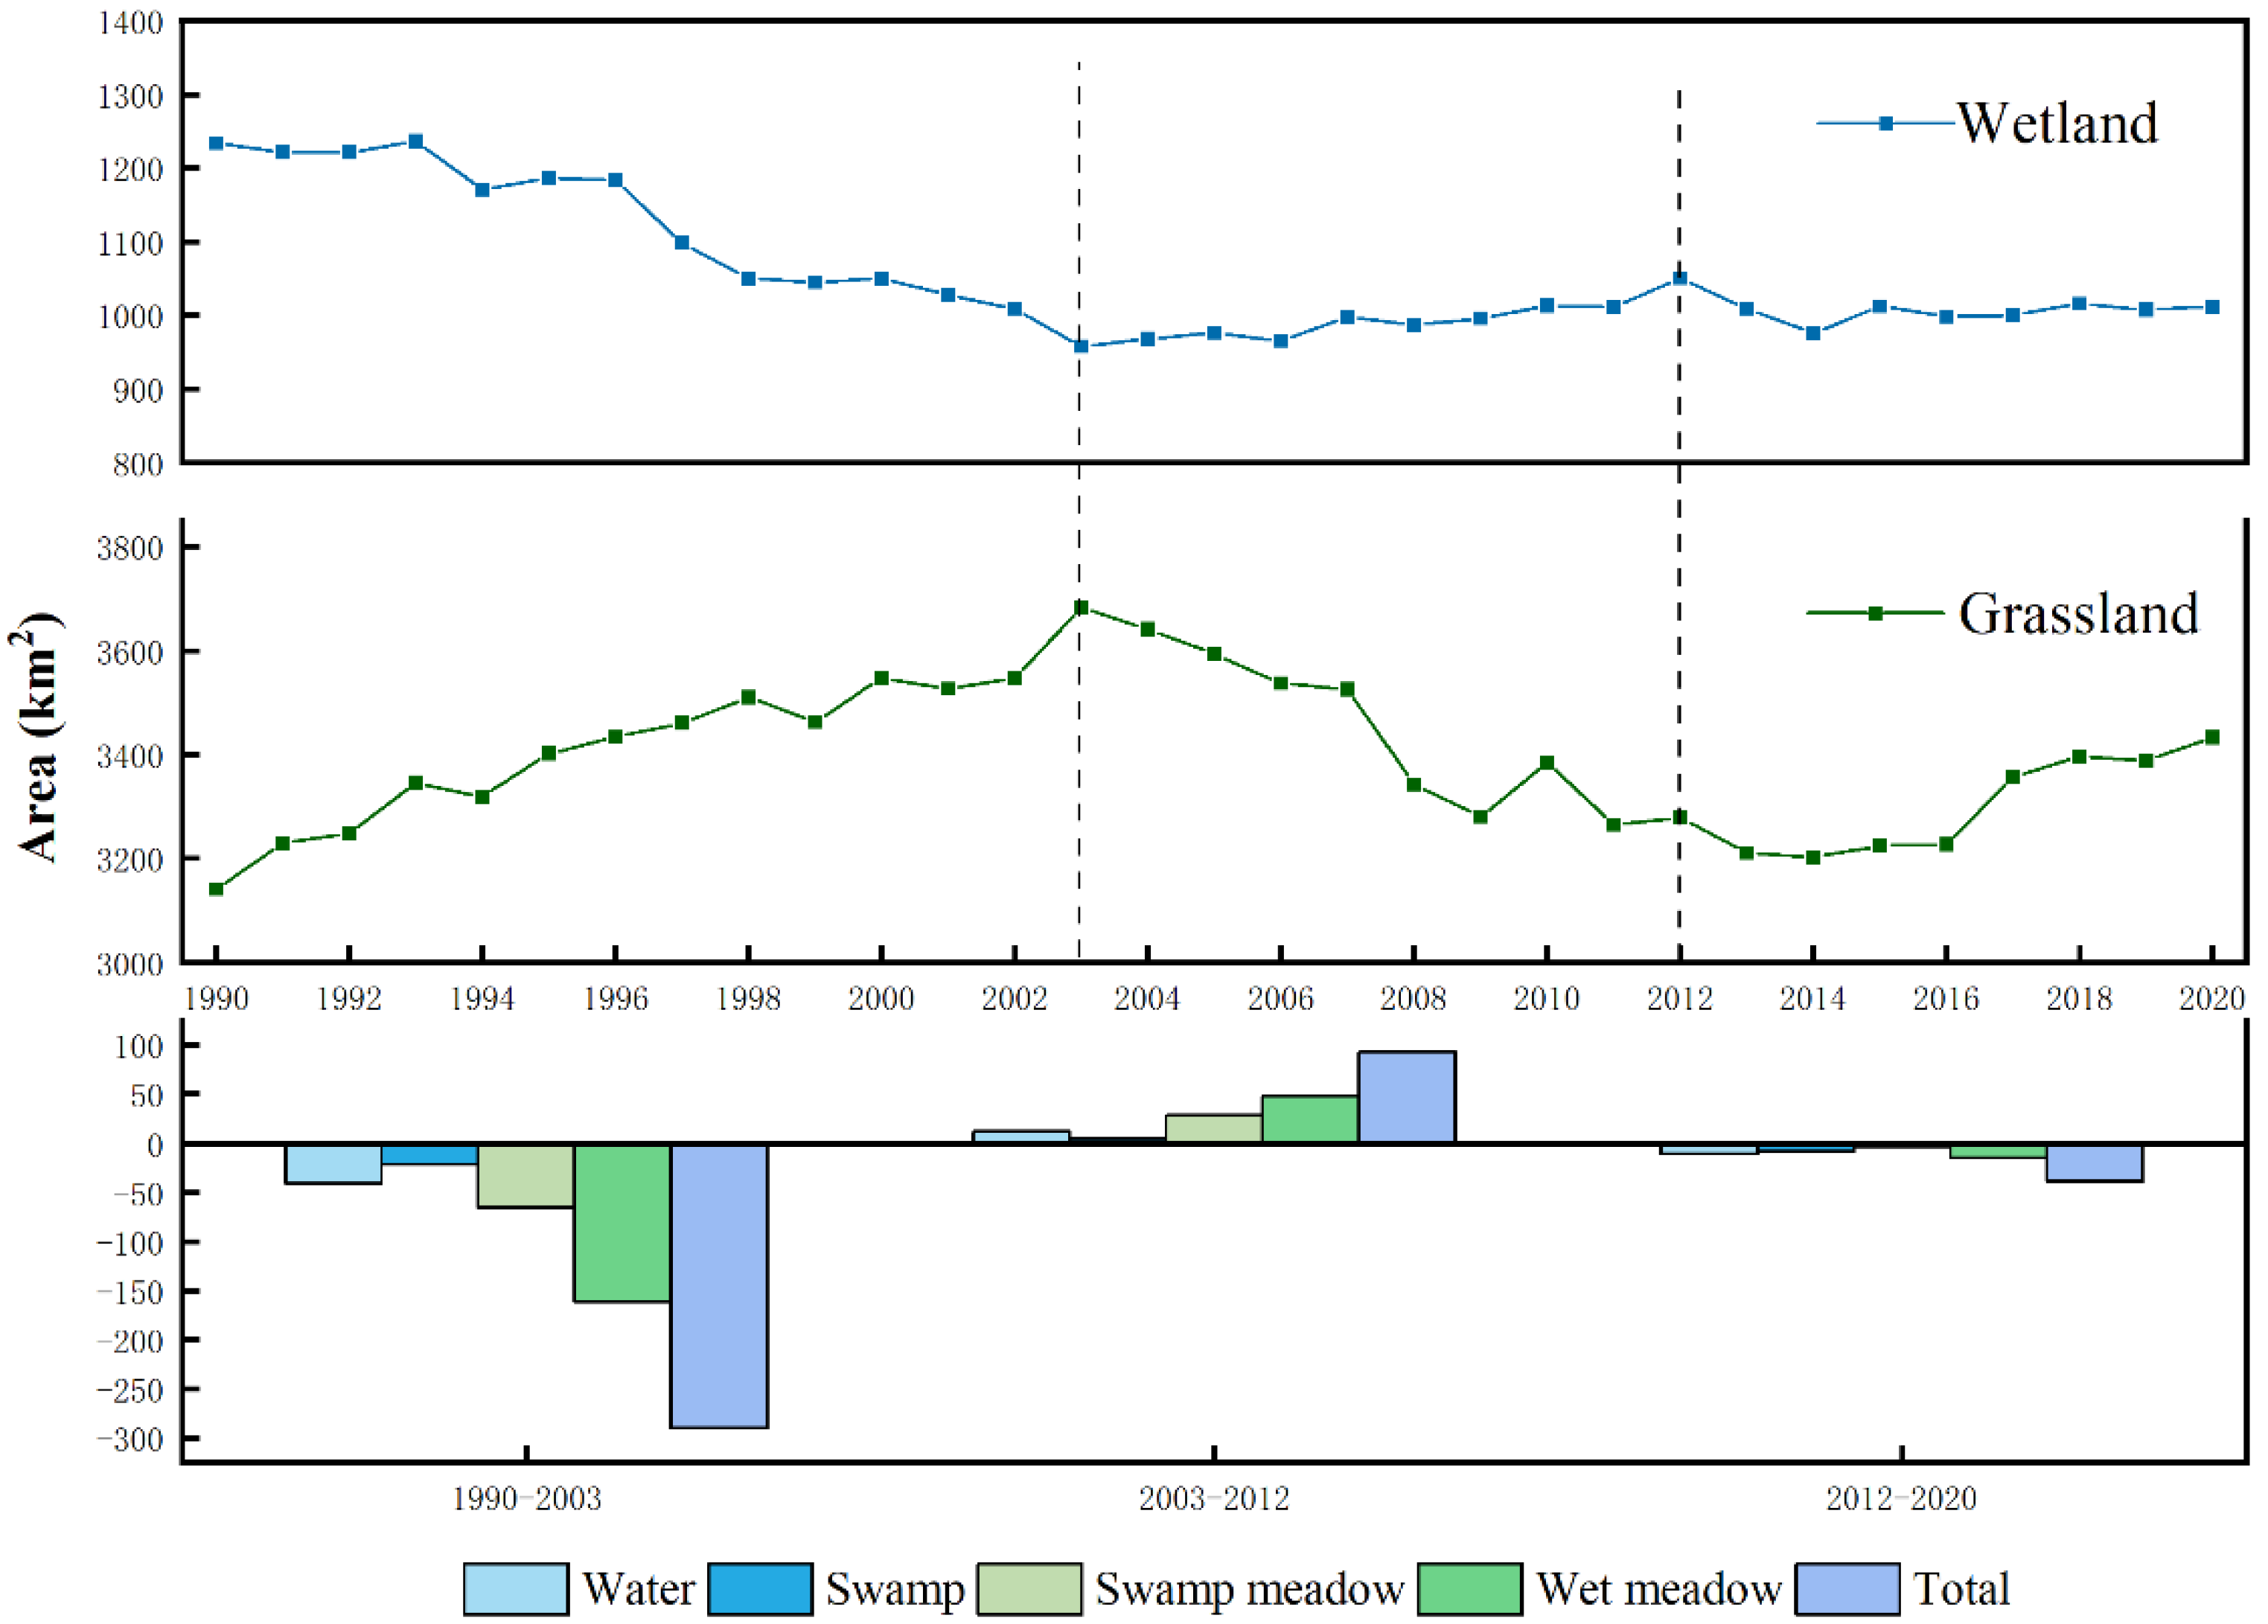
3.2.1. Changes in Wetland Area

The statistical analysis of the overall change in the area of the Maqu wetlands was conducted based on the remote sensing mapping results (Figure 8). From 1990 to 2020, the overall changes in the areas of the various types of wetlands in Maqu exhibited decreasing trends. The total wetland area decreased by about 261.19 km2, with an overall change of 23.35%. Among them, the area of the water bodies decreased by about 31.92 km2, accounting for 12.22% of the total reduction in the wetland area. The swamp area decreased by 7.31%, i.e., by about 19.08 km2. The area of the swamp meadow decreased by about 41.12 km2, accounting for 15.74% of the total reduction. The change in the area of the wet meadow was relatively large, with a decrease of 169 km2, accounting for 64.73% of the total reduction in the wetland area. Regarding the overall rate of reduction over the past 31 years, the swamp had the highest reduction rate, and the areas of the swamp meadow and wet meadow varied less (15.95% and 22.68%, respectively).
The four types of wetlands were combined into one category, and the changes in the areas of the wetlands and grasslands were determined, and the detailed changes in their areas were analyzed. The change process can be divided into three stages based on the overall change curve (Figure 9): 1990–2003, 2003–2012, and 2012–2020. The specific changes in wetland area are shown in Table 4. In the first stage, the wetland area fluctuated, decreasing from 1247.67 km2 to 957.56 km2. During this period, the area of the wetland decreased at the fastest rate, with an average reduction of 96.71 km2 per year. The wet meadow area decreased the most, accounting for 55.64% of the total decrease in the wetland area. The area of the grassland exhibited a fluctuating increasing trend, from 3141.05 km2 to 3682.57 km2. In the second stage, the area of the wetlands increased by 92.8 km2. All of the types of wetlands increased slightly. The area of the swamp increased the least, with an increase of 4.64 km2. The grassland area increased by 12.31%. The implementation of the Three-River Source Ecological Protection Project was the main reason for the restoration of the wetland area and the ecological functions in Maqu between 2000 and 2010. In the third stage, the fluctuations in the wetland area decreased by 16.46%, among which the area of the swamp meadow decreased by 3.83 km2; the grassland area increased from 3279.06 km2 to 3432.41 km2.
Overall, the wetland area fluctuated and eventually decreased, while the grassland area fluctuated and increased, which is consistent with the law of land class succession. Among them, the area of the wet meadow changed the most. As the transition zone between wetland and grassland, the area of the wet meadow will change more under climate change.

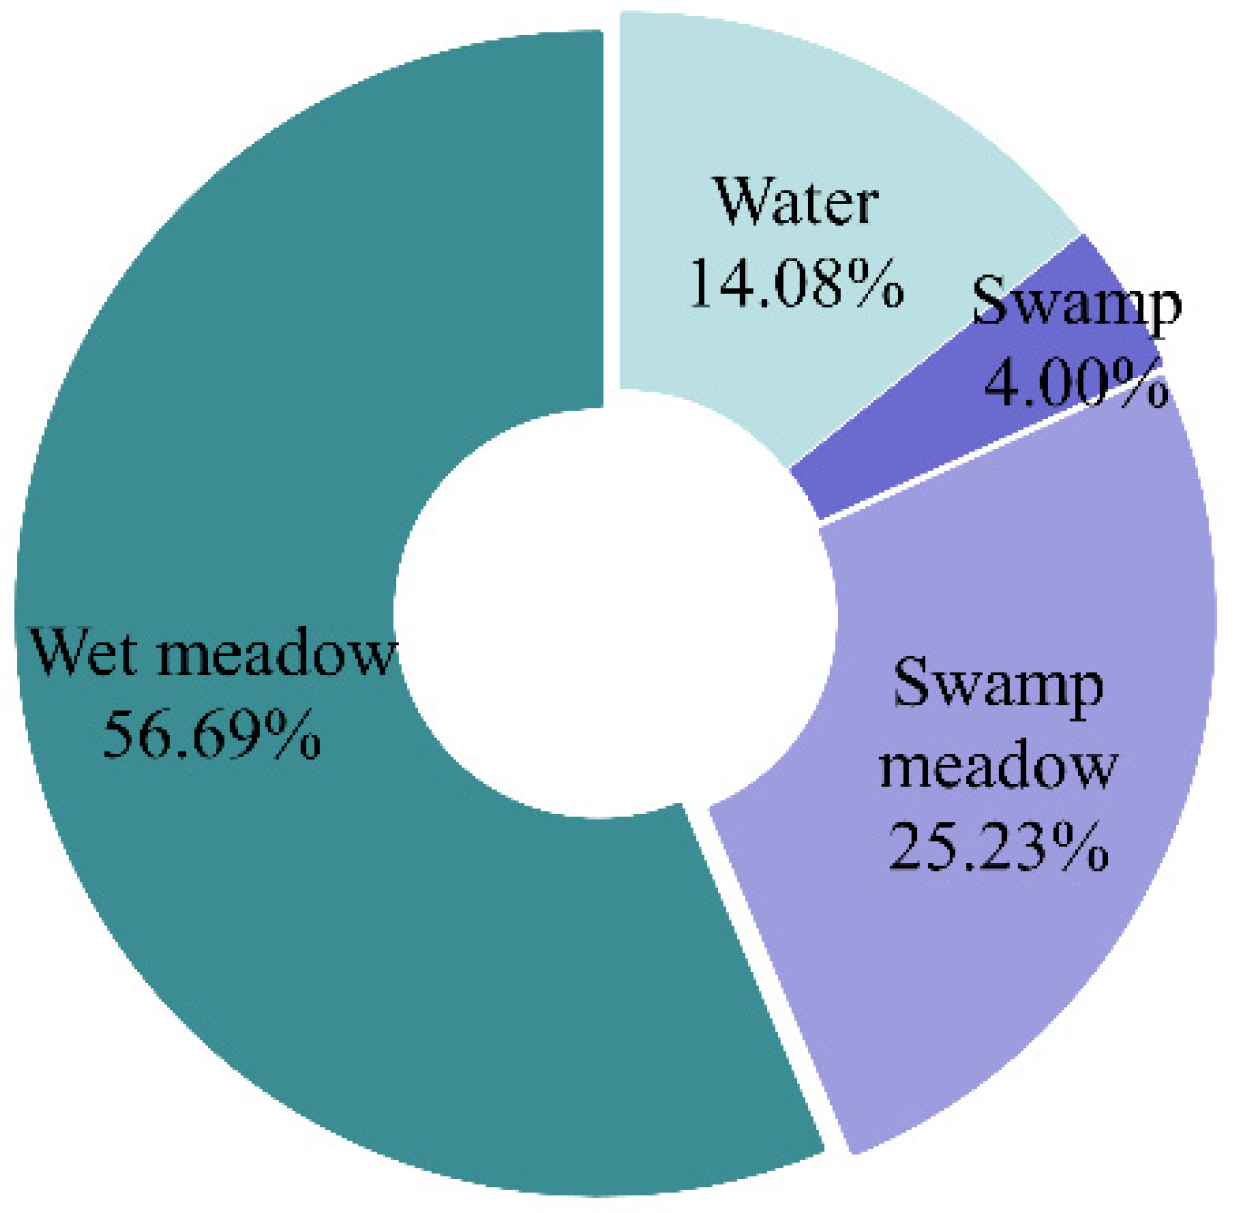
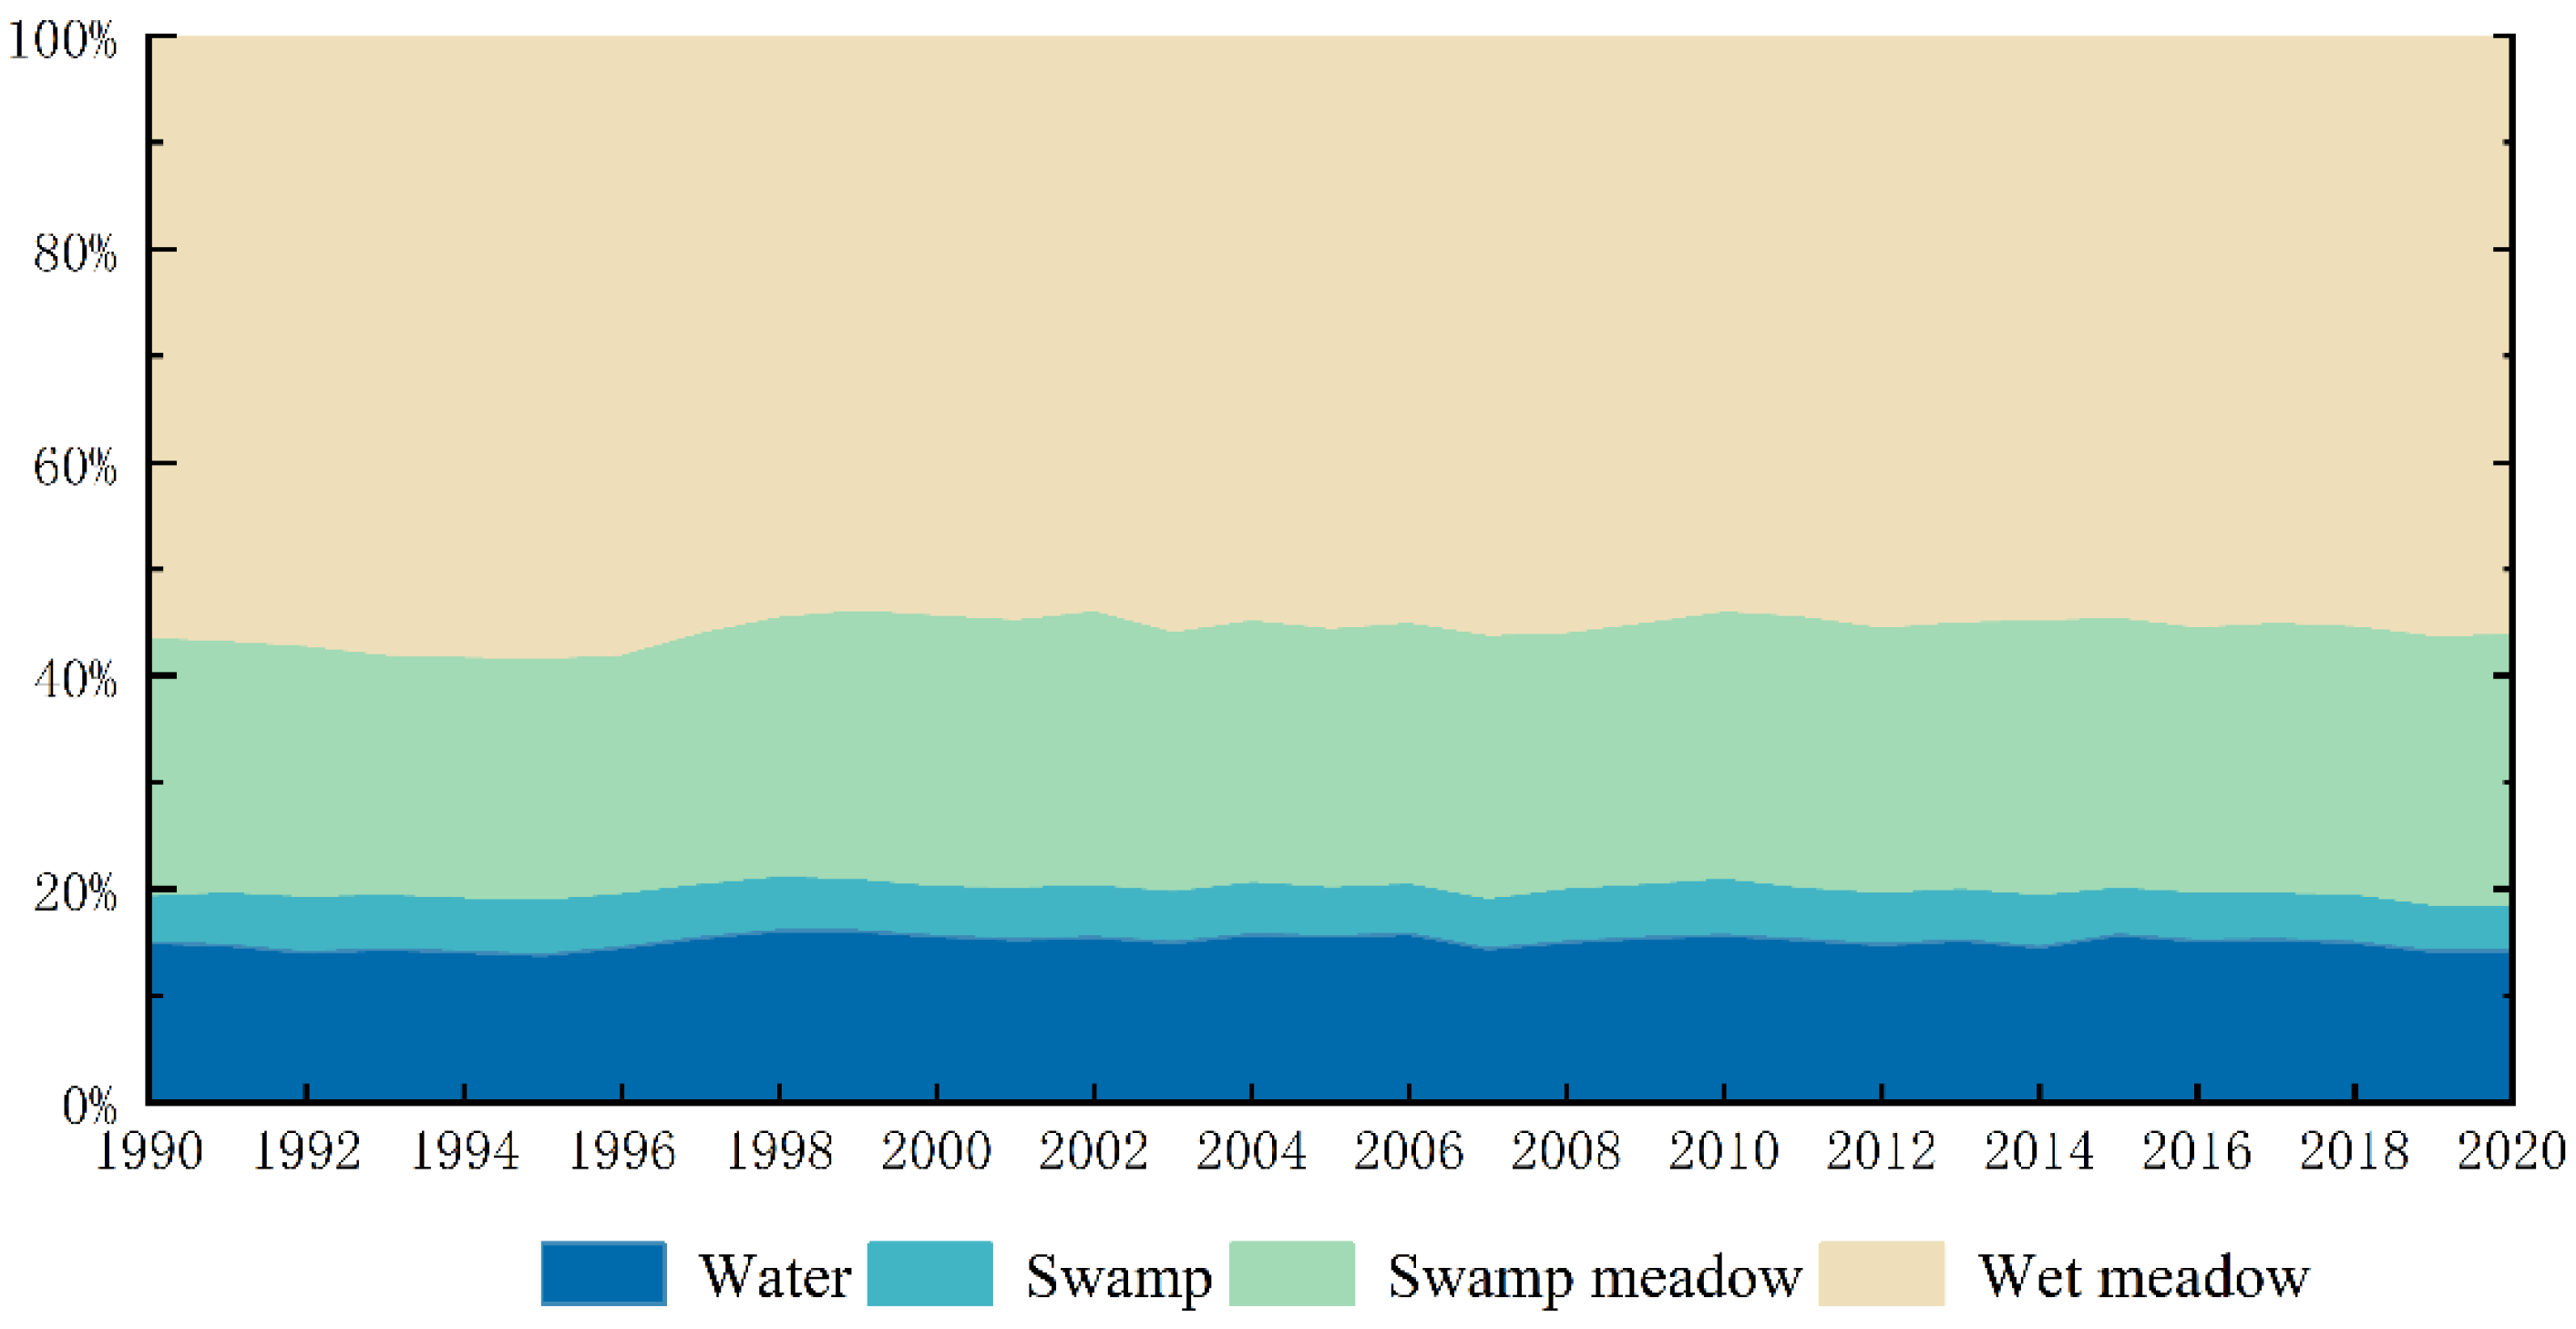
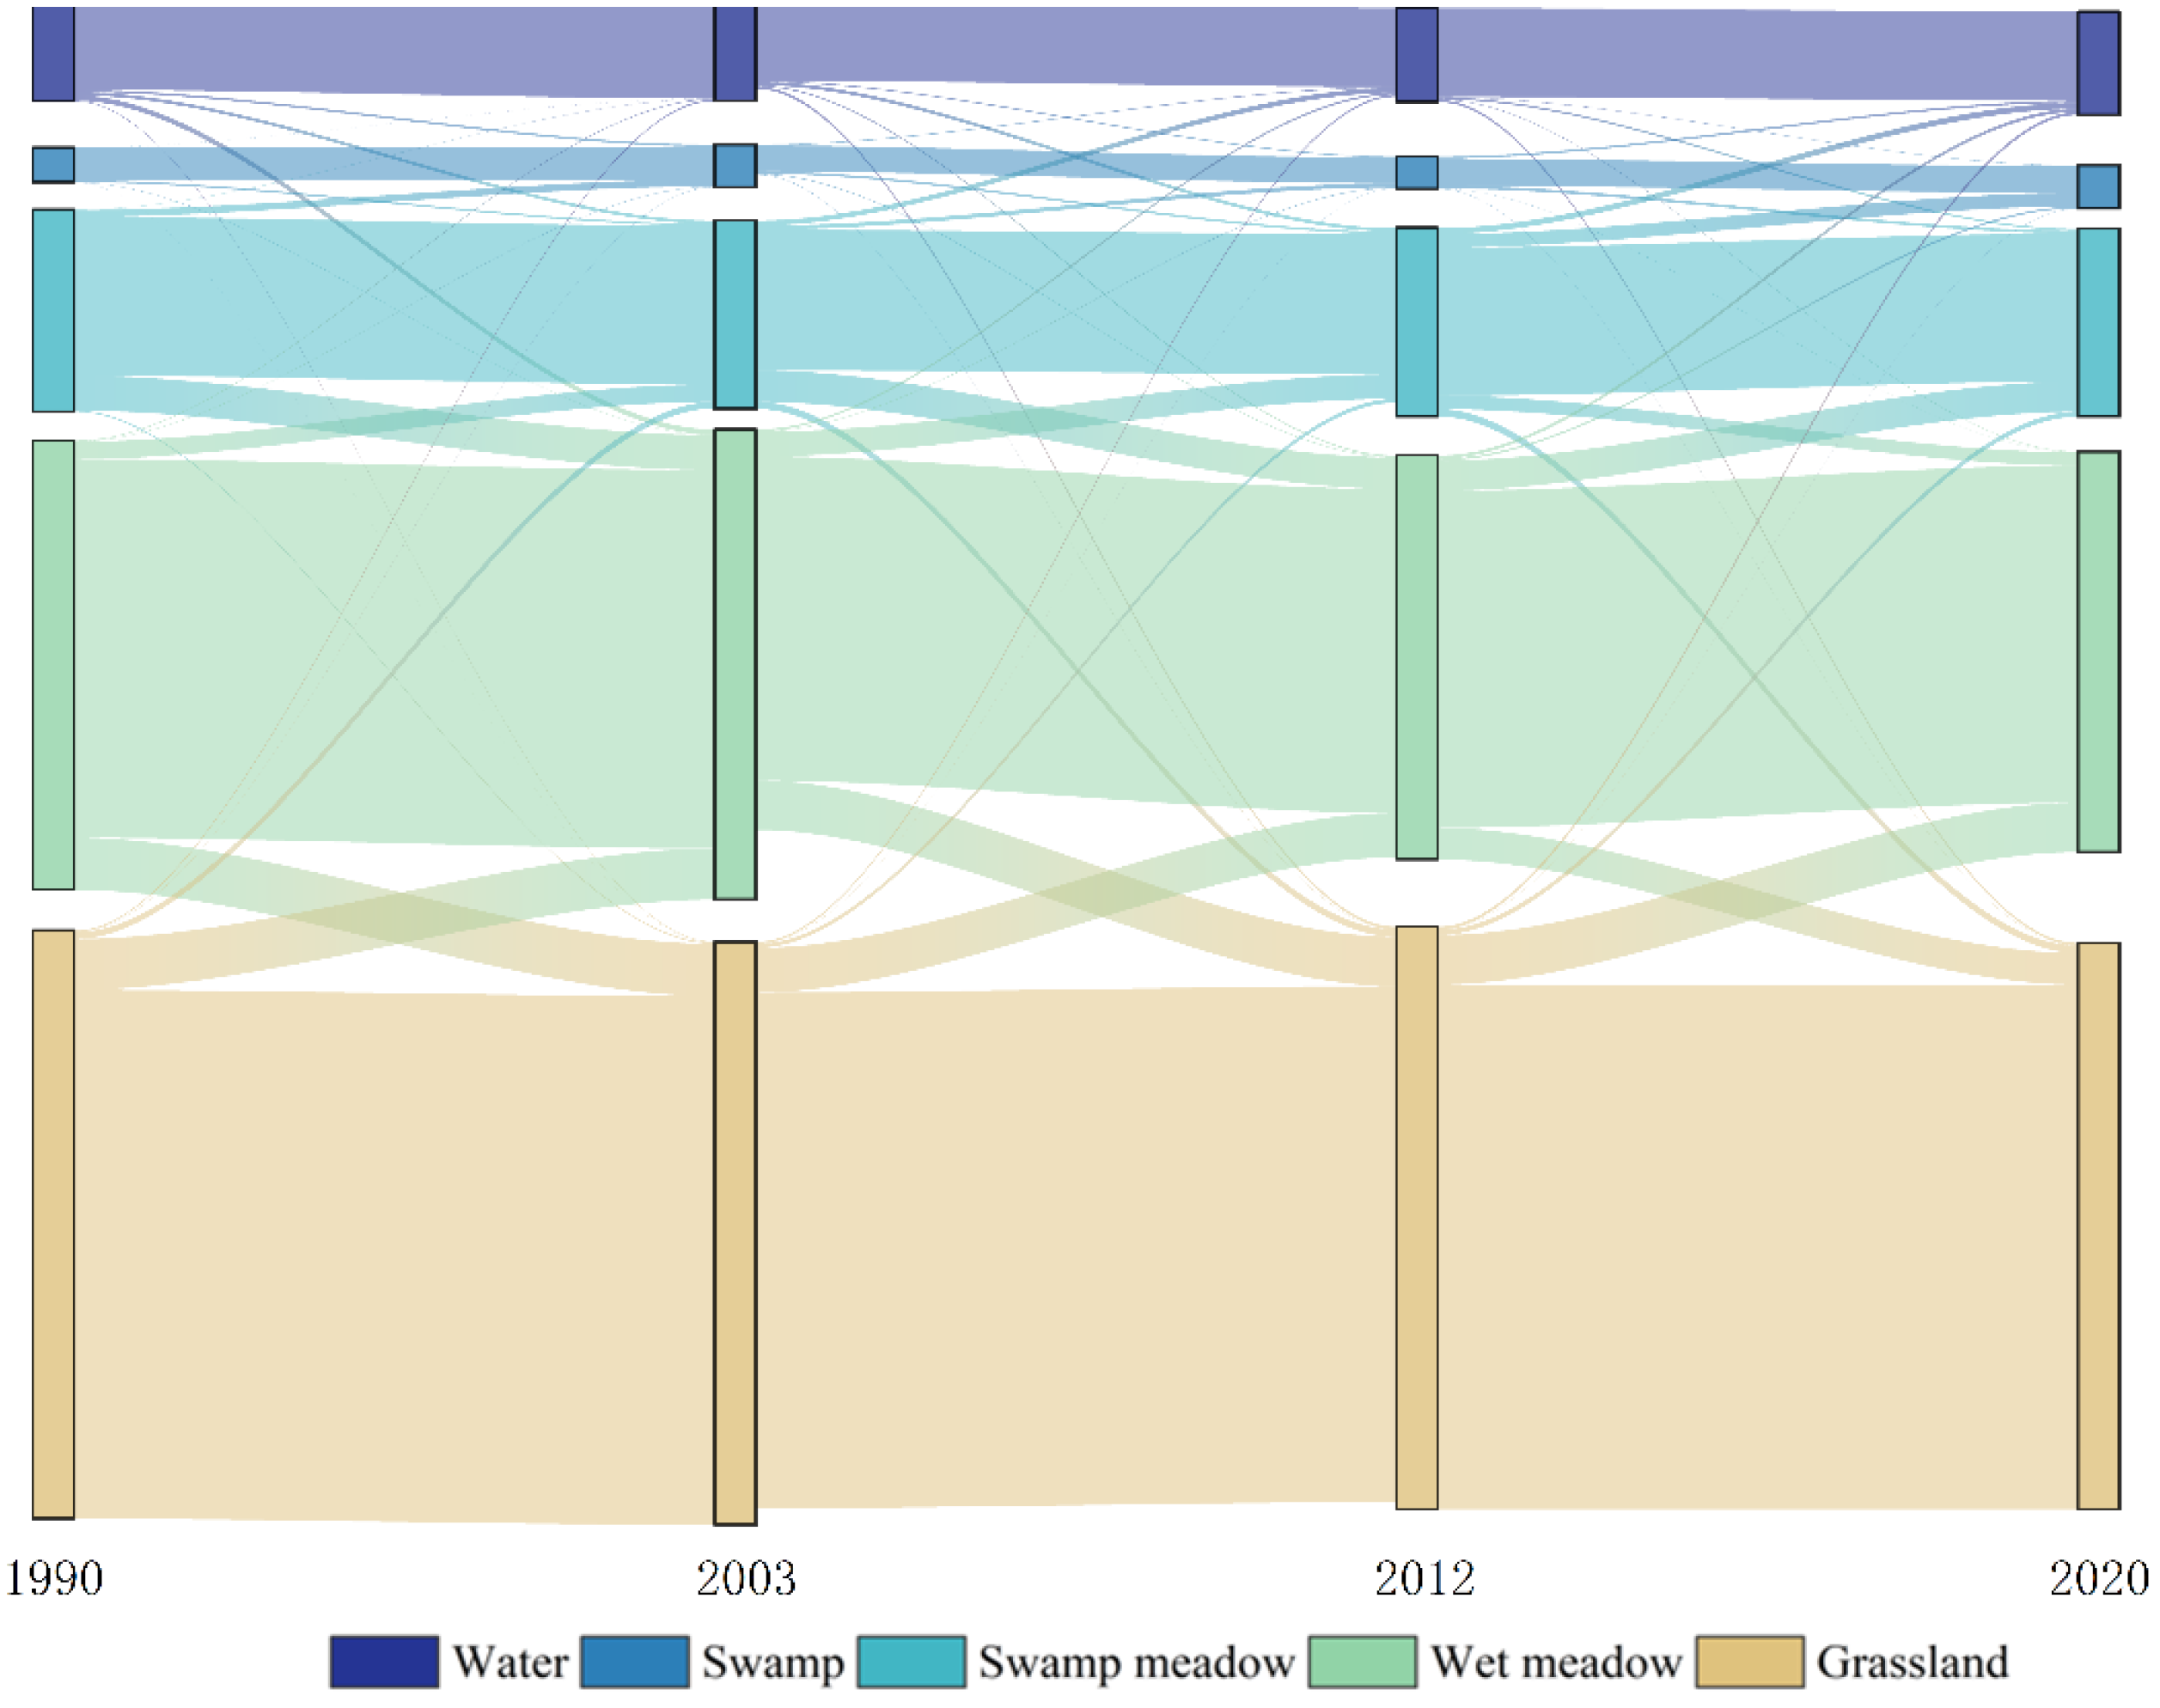
3.2.2. Changes in Wetland Type

Due to the unique hydrological and morphological characteristics of wetlands, it is not common for one type of wetland to be converted to another land type on a large scale. During a sustained drought, it is possible for one type of wetland to convert to another. In addition, some types of wetlands at the same or similar elevations can be interchanged due to changes in water levels.
To more visually represent the direction and proportional area of wetland changes during the past 31 years in Maqu, the Sankey diagram was used to quantify the changes in the wetland types during the different periods (Figure 10). In the first stage, from 1990 to 2003, the swamp was in a state of net loss and was mainly transformed into swamp meadow. The wetland area fluctuated widely, the wet meadow was converted to grasslands, and under natural conditions, many alpine meadows were severely degraded when the depth of the water table exceeded the root depth. In the second stage, from 2003 to 2012, the marsh area in the study area increased slightly, the transfer-in area was larger than the transfer-out area, and part of it was transformed through conversion of swampy meadows. In the third stage, from 2012 to 2020, the swamp meadow was mainly transformed into wet meadow, and the total wetland area fluctuated less. The area of wet meadow transferred out was larger than the area transferred in, which eventually caused a decrease in the area of wet meadow, which was mainly transformed into grassland.
In terms of the type of wetland, the overall performance exhibited a change from wet to dry. The decreasing trends of the areas of the swamp and swamp meadow were serious, and among all of the reduced types of wetlands, the change in the type of wetlands exhibited a gradual decrease in the proportion of conversion from wetland to non-wetland, and when the area of the wetlands decreased, the area of the grasslands increased.

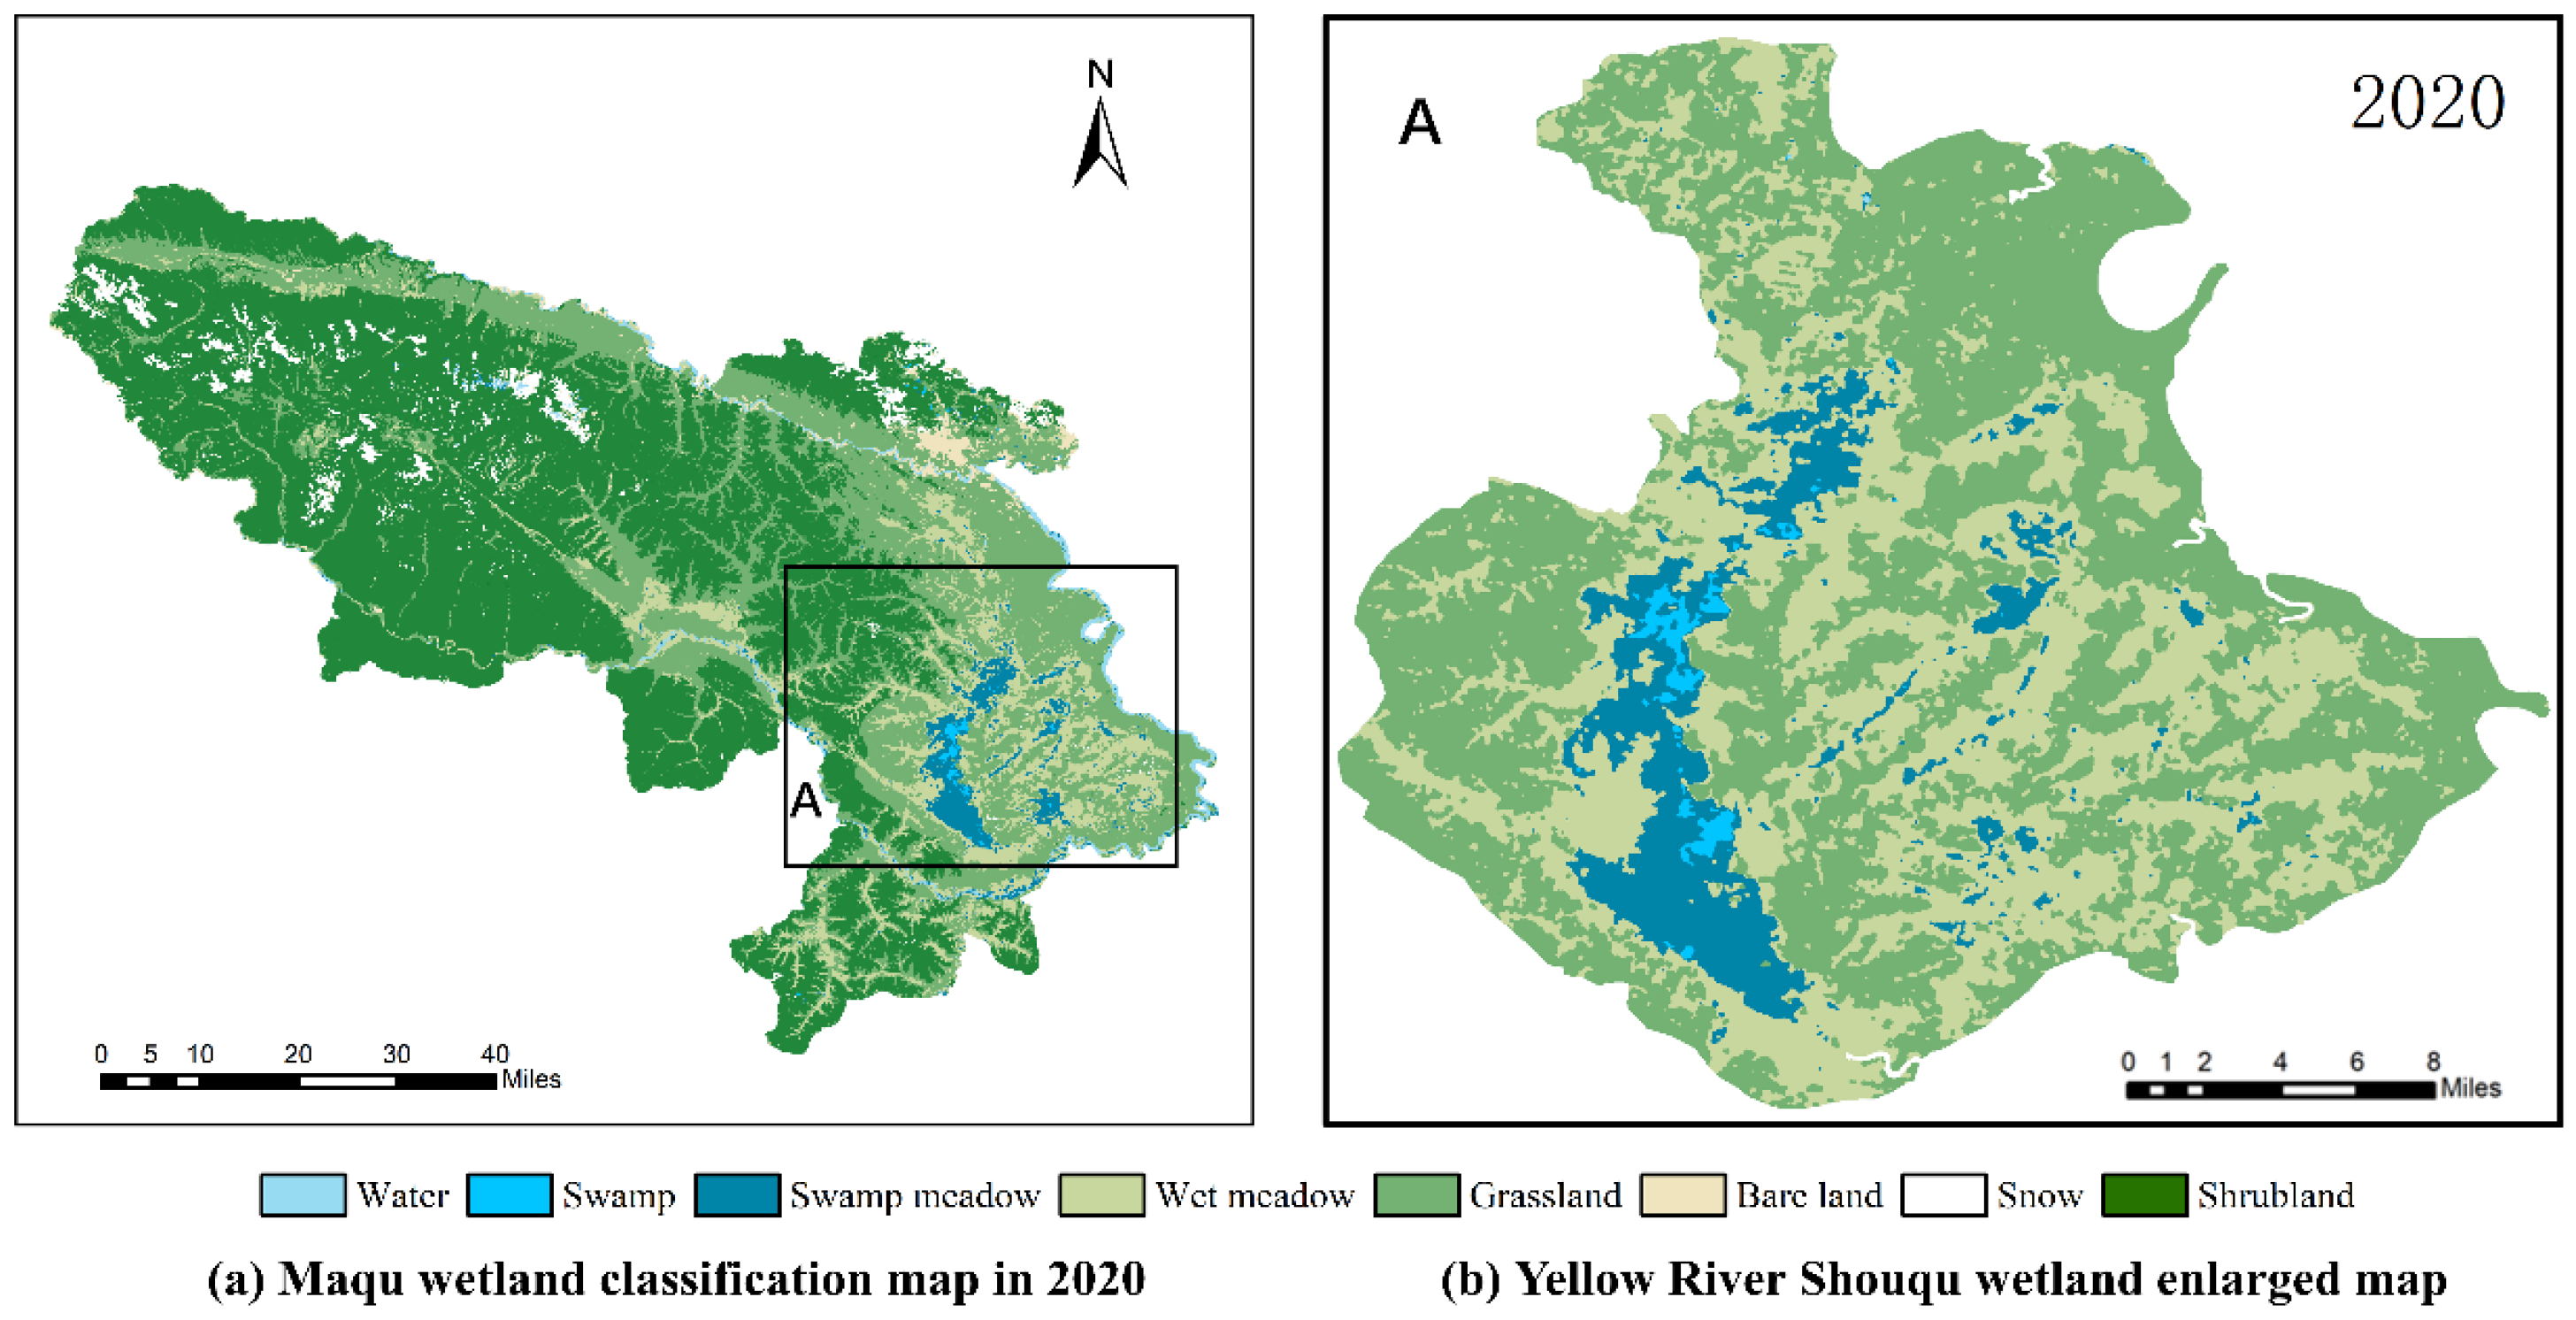
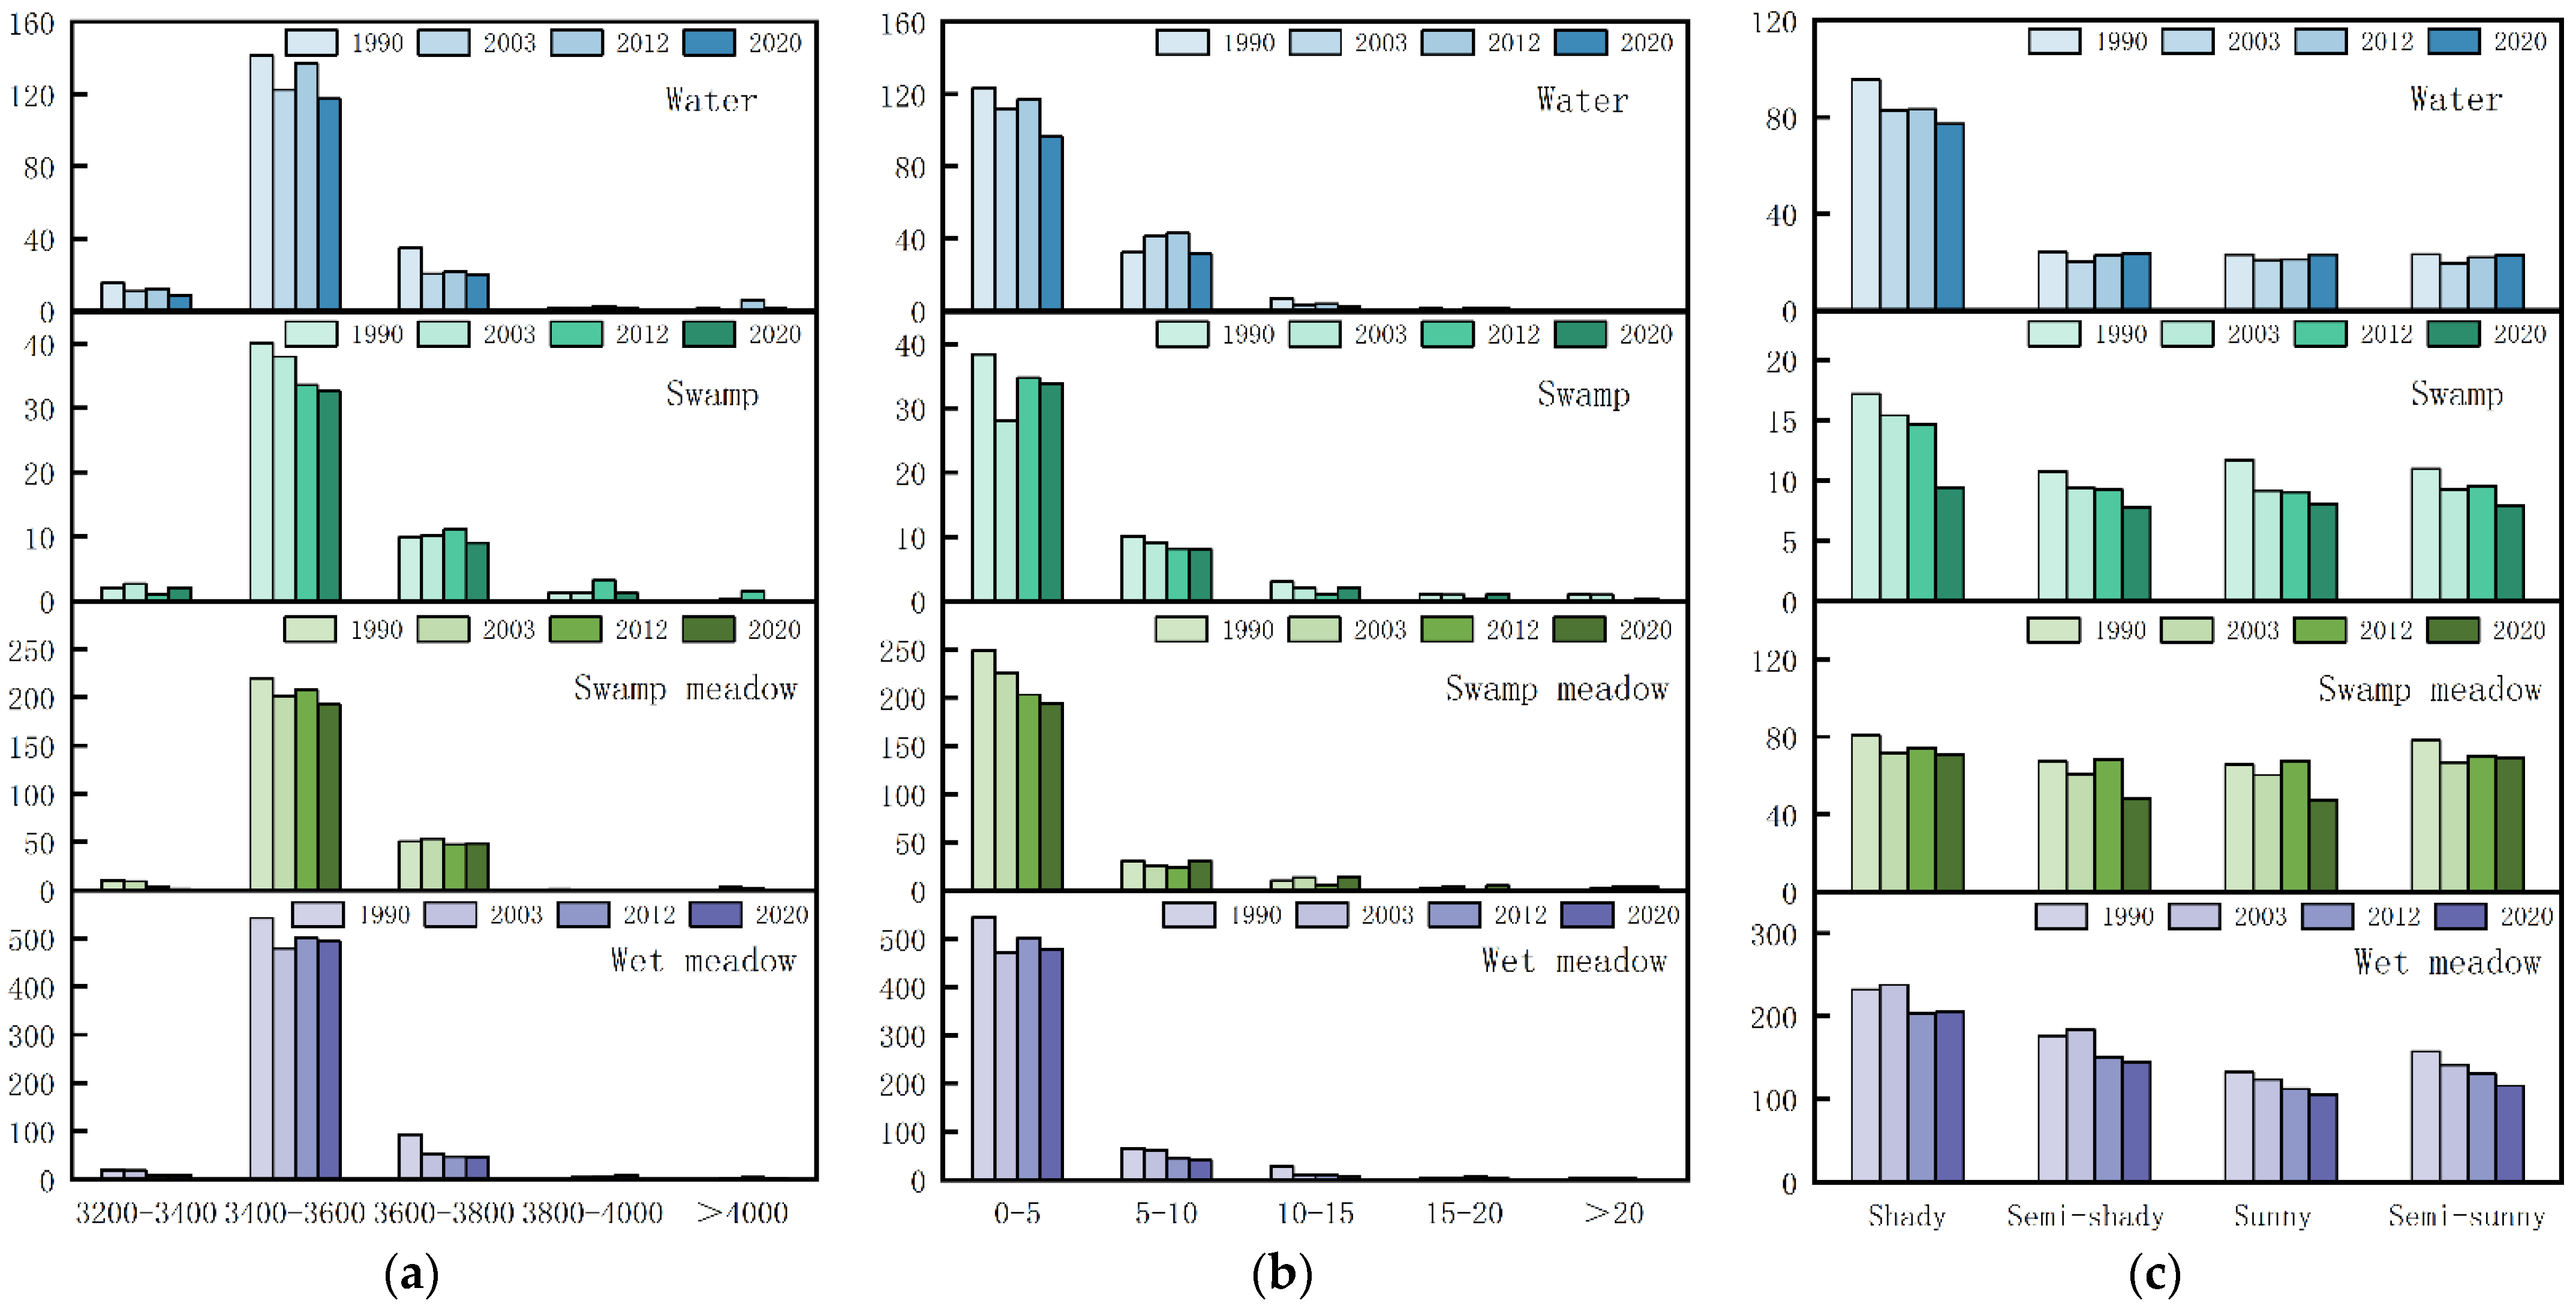
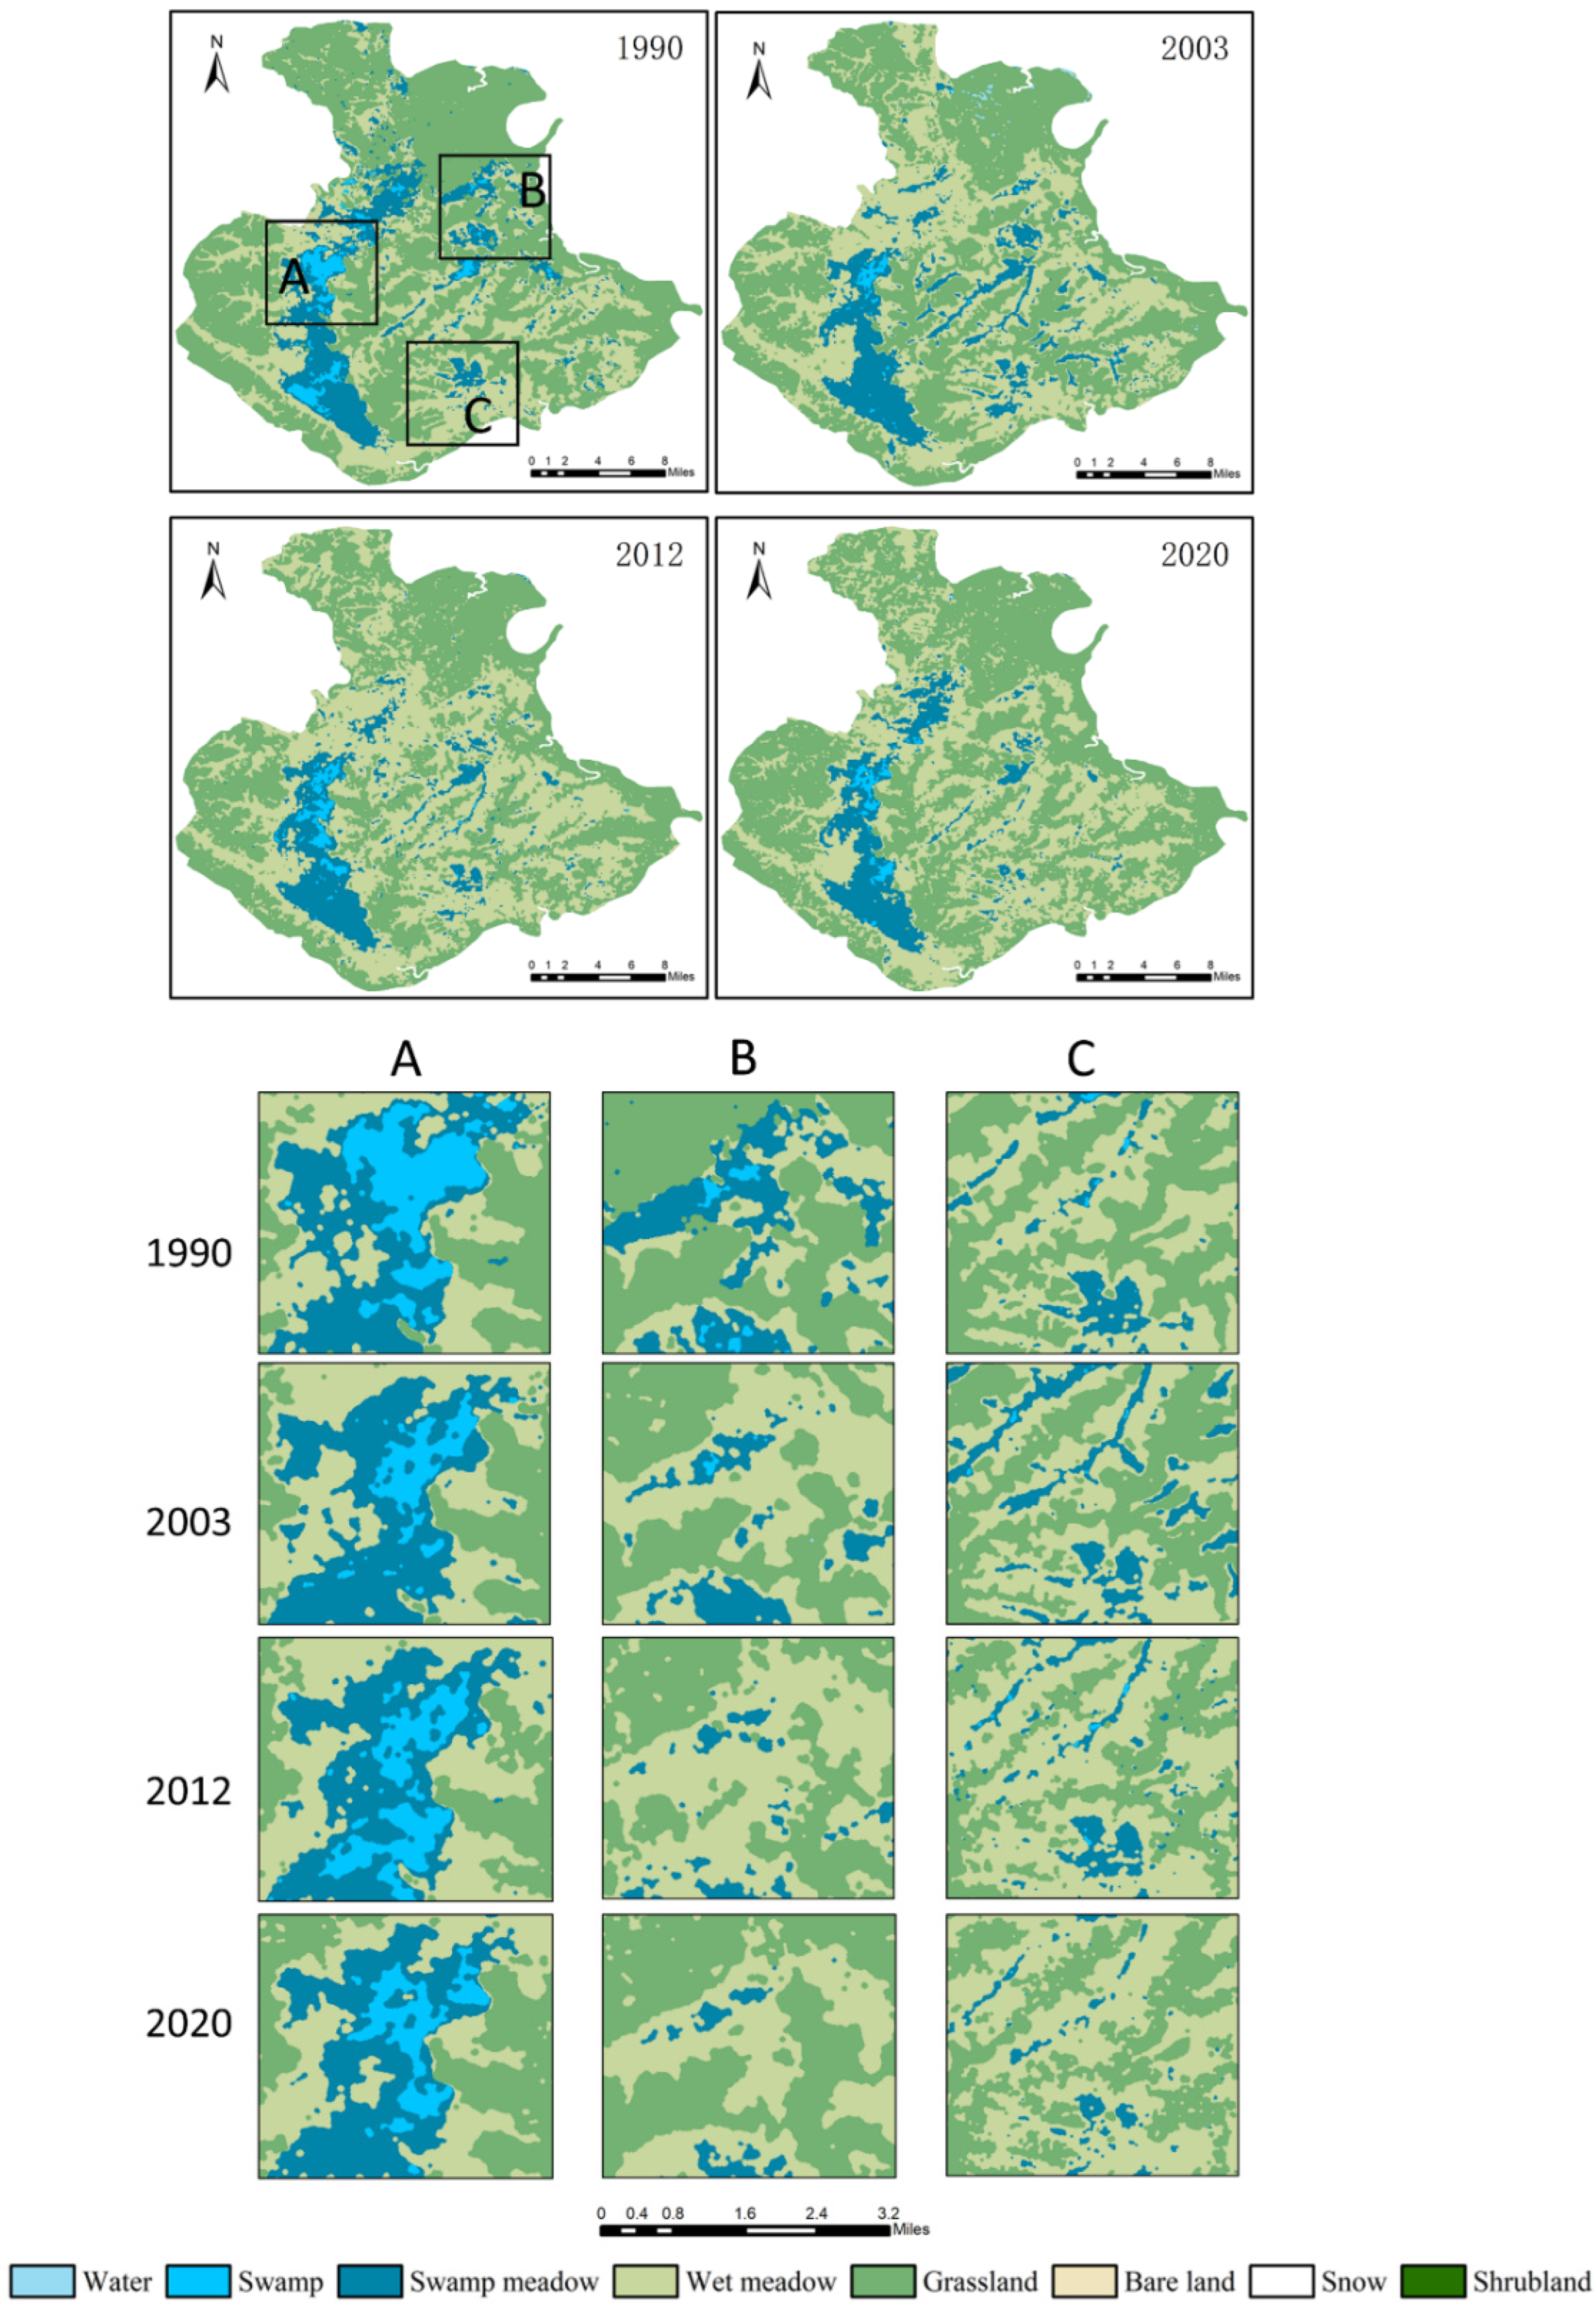
3.2.3. Changes in Wetland Spatial Distribution

To understand the distribution and topographic characteristics of the Maqu wetlands, the commonly used topographic factors (elevation, slope, and aspect) were used to analyze the distributions and change characteristics of the various types of wetlands (Figure 11). Topographic features are closely related to wetland distribution [49]. From a hydrological point of view, topography is an important factor affecting the spatial variations in wetlands. It affects the distribution of the wetlands by affecting the spatial distribution of the soil moisture and groundwater flow [50].
The SRTM digital elevation model data were divided into five categories at equal intervals of 200 m, and then they were spatially overlain with the 1990, 2003, 2012, and 2020 wetland map data. The analysis results show that the wetlands were concentrated between 3400 and 3600 m above sea level, and there were almost no wetlands above 4000 m above sea level. Most of the reduced wetlands were also concentrated between 3400 and 3800 m, probably because the outflow from the wetlands was high, while the inflow was low at these elevations.
The same elevation data were used for the slope analysis, and the data were divided at equal intervals at 5°. About 83% of the wetlands were distributed on slopes < 3°, and the various types of wetlands were mainly distributed on slopes of 0–5°. Regarding slopes greater than 15°, a few wet meadows still existed on these unstable slopes. In general, gentler slopes are more likely to lead to wetland loss, with wetland loss mainly occurring at around 3° and little change in the wetland area on slopes steeper than 20°.
Wetlands exist on slopes with all aspects but were more prominent on slopes with certain aspects. The same elevation data were used for the aspect analysis; the aspects were divided into shady slopes (315–45°), semi-shady slopes (45–135°), sunny slopes (135–225°), and semi-sunny slopes (225–315°); and the wetland mapping results were overlain on the slope aspect data to analyze the distribution of the wetland area on slopes with different aspects during the different periods. In general, the distribution of the wetlands with different aspects was more uniform than the distributions of the altitude and slope. The water bodies were more concentrated on the shady slopes, and the areas of the water bodies distributed on the semi-shady and semi-sunny slopes were nearly equal. The distribution of the swamp was similar to that of the water bodies. The area of the wet meadows distributed on the shady, semi-shady, semi-sunny, and sunny slopes decreased sequentially. The distribution of the swamp meadow was almost equal for all four aspects. The relationship between the wetland loss and the slope aspect can be explained by the differences in solar radiation due to the topography, with a greater reduction in wetland area on shady slopes than on sunny slopes.
The aspect controls the energy balance and affects water evapotranspiration, which in turn affects the variability of the different types of wetlands. The wet meadow was affected by the increasing temperature, and the decreasing moisture represented a continuous decrease in area. The wetland with water surfaces easily received melt water input, and the area increased. This indicates that the slope aspect affected the distribution of the wetlands by controlling the input and expenditure of radiation, which in turn affected the input and output of the wetland water.

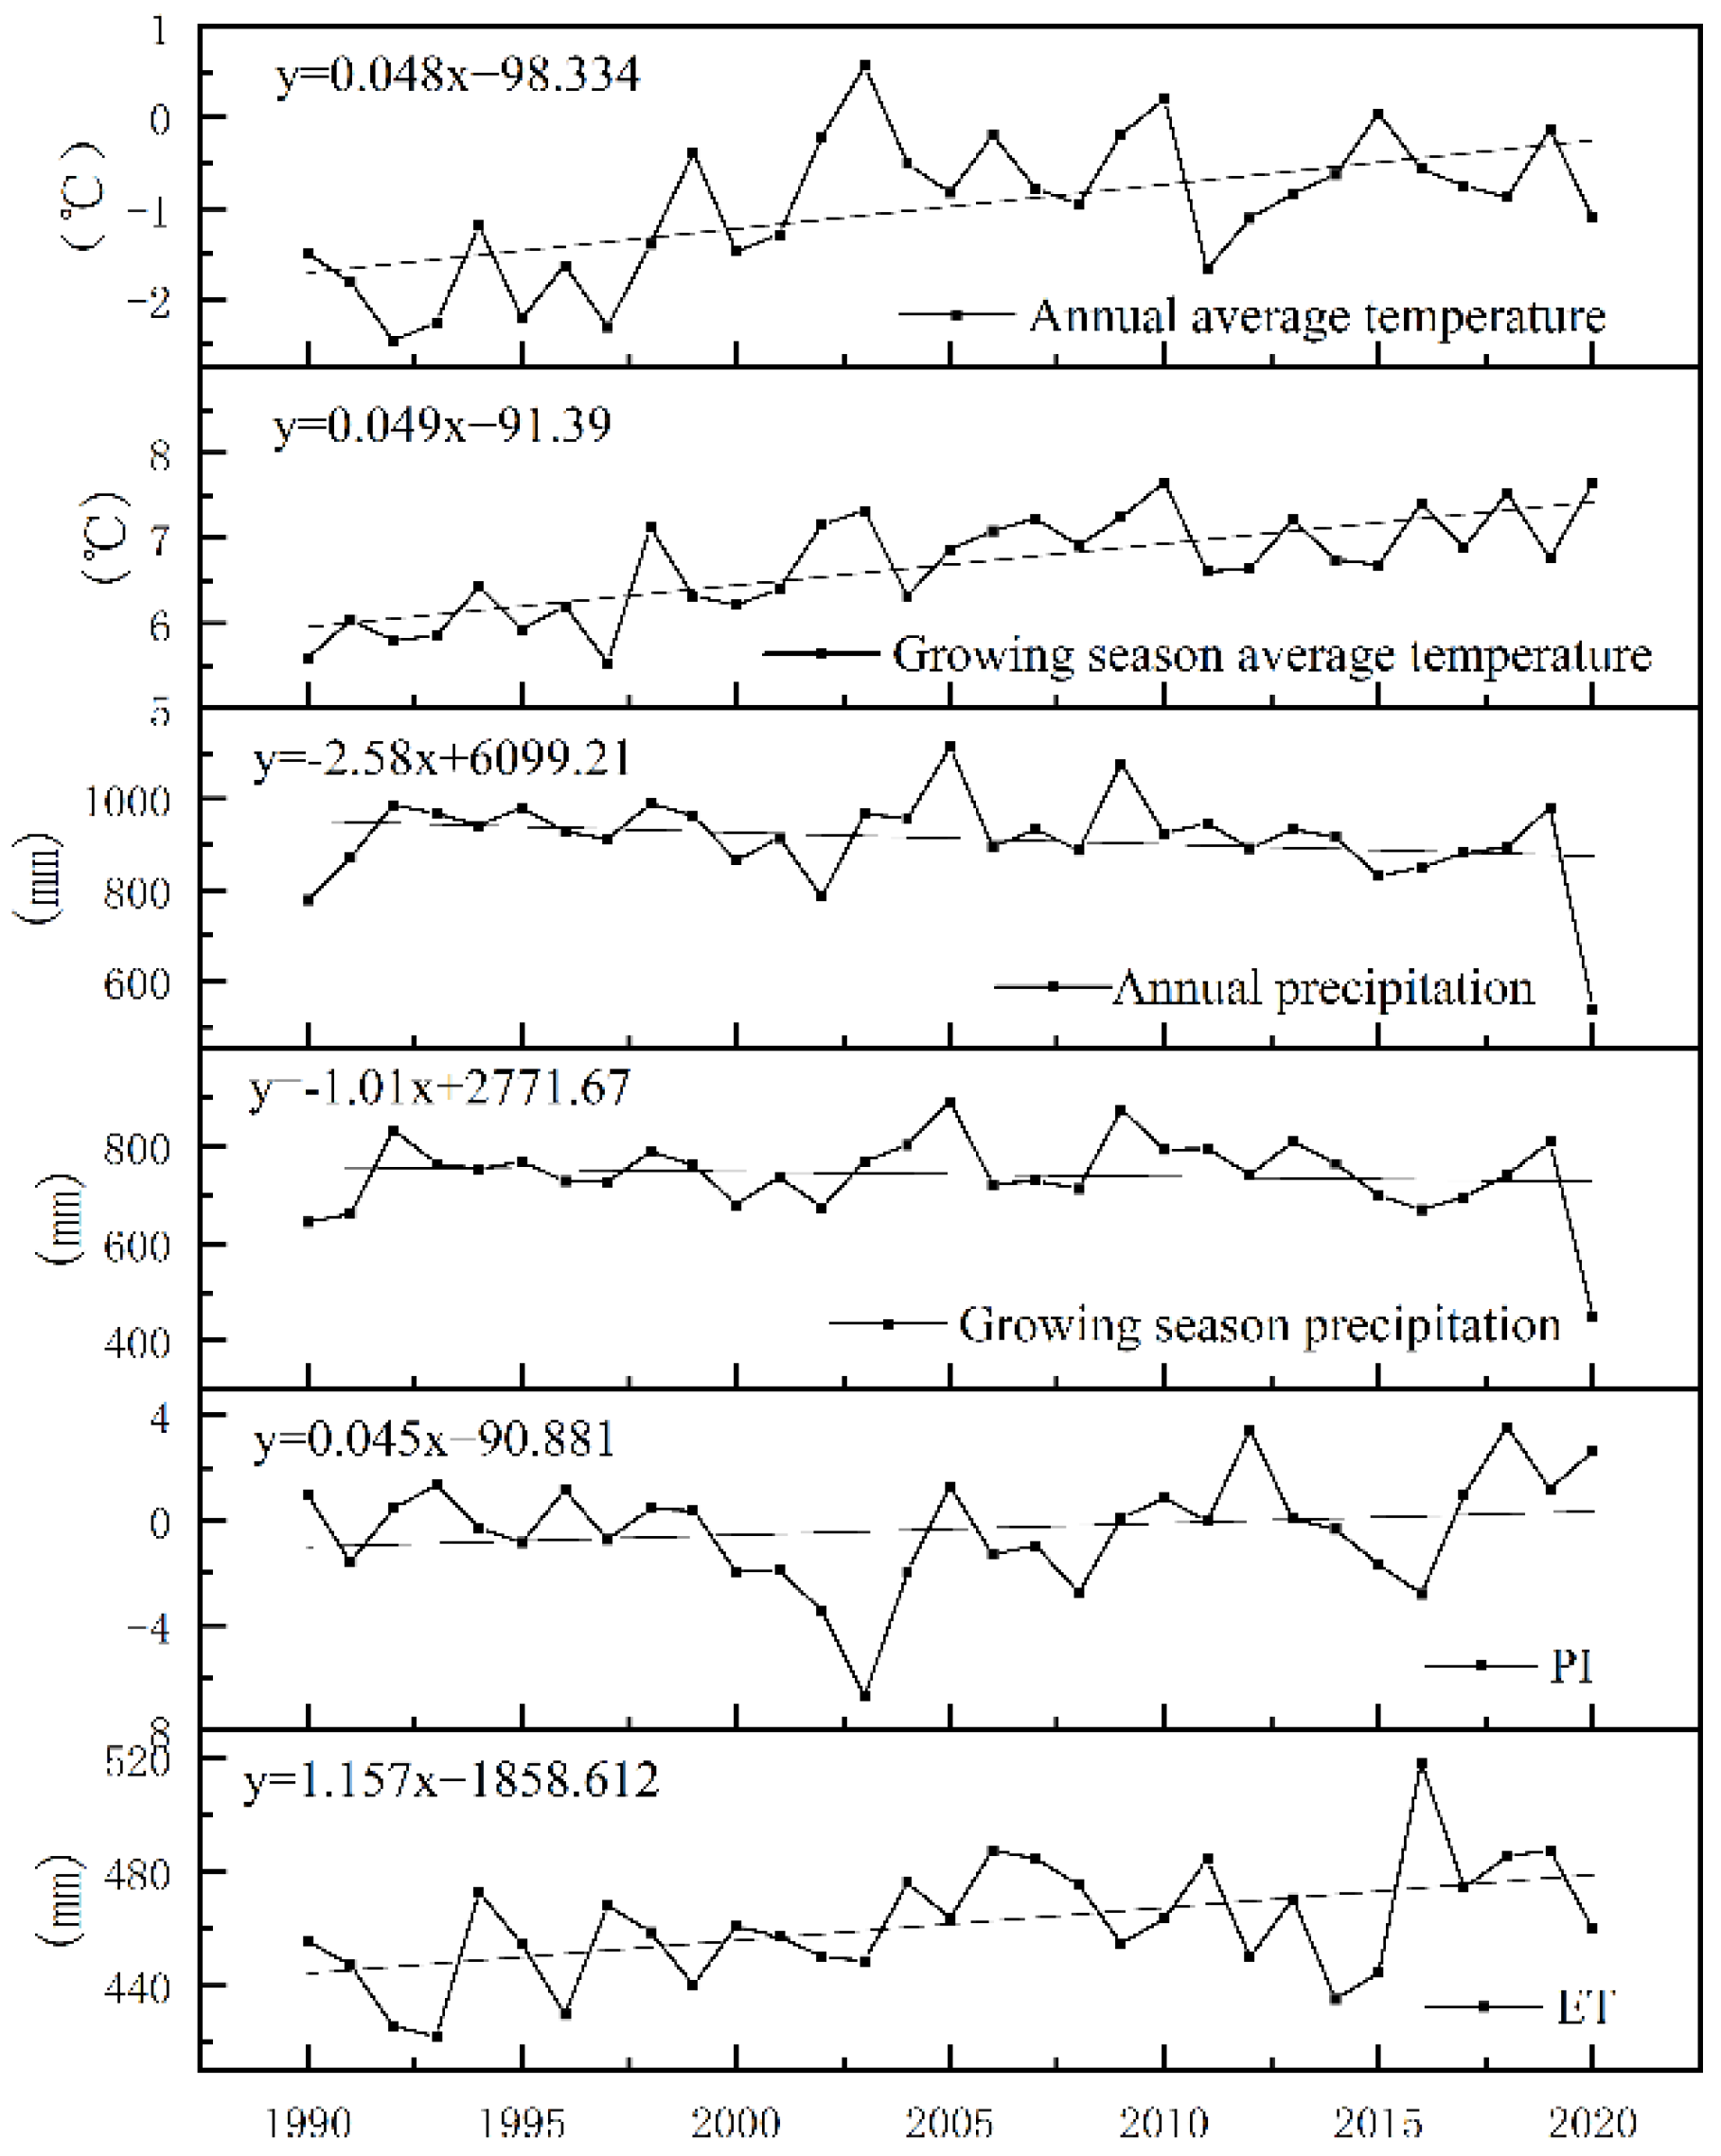
3.3. Driving Forces of Wetland Change

The driving factors of the wetland changes included climatic factors and anthropogenic factors. Since the intensity of human activities in Maqu County is relatively low, the impact of human activities was very limited. Therefore, in this study, we mainly investigated the impacts of climatic factors on the wetland changes. Six climatic variables were analyzed: the annual precipitation, growing season precipitation (from April to September), annual average temperature, average growing season temperature (from April to September), Palmer Index (PI), and evapotranspiration (ET). To explore the impact of climate fluctuations on wetland changes, we analyzed the changes in the various climatic factors and their correlations with the wetland changes.
The climate change characteristics in Maqu County over the past 31 years are shown in Figure 12, and the continuous data are linearly fitted. Based on the fitted trend line, the annual precipitation and growing season precipitation exhibited weak decreasing trends, with rates of change of −2.58 mm/10 a and −1.01 mm/10 a, respectively. The annual average temperature and the average growing season temperature exhibited overall increasing trends, with rates of change of 0.48 °C/10 a and 0.49 °C/10 a, respectively. The PI exhibited a relatively stable trend, and the ET exhibited a weakly decreasing trend.
To quantify the correlations between the different climatic factors and the changes in the areas of the various types of wetland, six climatic factors were used to conduct correlation analysis with each wetland type. Pearson correlation analysis was conducted, with a statistical significance level of 0.05.
As can be seen from Table 5, the degrees of correlation between the different types of wetlands and the different climatic factors were different. Among them, the total area of the wetland exhibited the greatest correlation with the annual average temperature, that is, its impact on the wetland was the most obvious, with a correlation coefficient of −0.754; whereas the correlation coefficient with the average growing season temperature was −0.744. During the past 31 years, the average growing season temperature fluctuated between 5.53 °C and 7.65 °C, and the correlations between the types of wetland and the temperature had correlation coefficients greater than 0.6. The wet meadow exhibited the most obvious response to temperature among the four types of wetlands, with a correlation coefficient > 0.7. Temperature was the most important factor limiting the growth of vegetation in the alpine wetlands. The temperature changes were negatively correlated with the areas of the various types of wetlands. It can be seen that the temperature increased and the evaporation from the wetlands increased sharply, which aggravated the degradation of the wetlands to a certain extent. Contrary to the trend of the temperature change, the precipitation exhibited a slightly decreasing trend, and the precipitation during the growing season fluctuated between 450.895 mm and 892.769 mm. The wetland area was positively correlated with the precipitation. The greater the amount of precipitation, the more hydrological recharge the wetland can directly obtain, which can directly promote the expansion of the wetland area. The correlations between the various types of wetlands and the precipitation were low. The correlation coefficient between the water bodies and annual precipitation was the highest (0.471), the correlation coefficient between the total wetland area and annual precipitation was 0.357, and the correlation coefficient with the growing season precipitation was 0.342, indicating that the precipitation accumulation effect had little effect on the wetland area. Both the PI and ET were negatively correlated with the wetland area. The drier the climate and the greater the ET, the more easily the wetland area decreased. The PI and ET had a relatively small impact on the change in the wetland area.
Based on the above analysis, the main characteristics of the climate changes in the Maqu wetlands during the past 31 years were that the annual average temperature increased significantly and the precipitation decreased slightly. The influence of temperature on the wetland changes was the largest. The increase in temperature led to increased evaporation, which accelerated the loss of wetland moisture and shrank the wetland area. However, in basins with glaciers and years of snow, warmer temperatures can lead to increased meltwater. Therefore, changes in temperature have different effects on wetlands in different regions. The impact of the precipitation on the wetlands was slow and cumulative over the years. Temperature was the decisive factor in the expansion and shrinkage of the wetlands in this region.

4. Discussion

4.1. Long-Term Annual Wetland Mapping and Change Detection

Obtaining a long-term continuous annual dataset for wetlands and their changes is a huge challenge. Wetland information is usually given in statistical yearbooks for many years, and land surveys are not very detailed in terms of wetland classification. Analysis based on satellite remote sensing images provides a cost-effective and convenient method for continuous monitoring of wetland changes. In this study, a unified classification system was applied to classify the Maqu wetlands from 1990 to 2020. The accuracy of the annual classification results largely depends on the number and quality of the sample points used to train the classification model [51]. In time series wetland classification, how to apply samples to images from different historical periods is a very important problem [37]. Obtaining samples through visual interpretation year-by-year is a time-consuming and labor-intensive process. Making full use of existing sample sets can effectively save time and reduce the workload. Therefore, in this study, a set of samples for 2020 was used as the benchmark, and the sample migration method based on reclassification was used to update and check the sample data of the first 30 years. The overall classification accuracy of all of the classification maps was greater than 84%.
In this study, a long-term time series of Maqu classification maps was generated to analyze the changes during the past 31 years, including changes in wetland area, wetland type transformation, and wetland spatial distribution changes. According to the statistics of the area changes year-by-year, it was found that the main area change points occurred in 2003 and 2012. The area decreased greatly from 1990 to 2003, and it changed steadily after 2003 with a slight increase. After 2012, the area exhibited a fluctuating decreasing trend. A dense time series can help to identify the year when the transition actually occurred, and studies have generally used integer intervals or only two images to analyze changes over several years, times, or turning points, which can lead to some of the real changes being obscured. Change detection using a dense time series can meet the requirements of monitoring the dynamic changes in the entire wetland [52]. For example, Zhang et al. (2011) used aerial photos acquired in 1967 and satellite images acquired in 1986, 2000, and 2004 to study the spatiotemporal changes in the extent and distribution of the alpine wetland ecosystem on the QTP from 1967 to 2004. Studies have shown that more than 10% of alpine wetlands on the QTP have disappeared, with nearly 96% of the loss occurring between 1986 and 2000. The time interval of the images of the study area was selected in advance, but the actual year of transition could be any year from 1967 to 2004, and the time range of the change may be selected with deviation.

4.2. Analysis of within Wetland Changes

The QTP is one of the areas that are most sensitive to climate change. At present, most studies conducted on the alpine wetlands on the QTP have focused on the transformation between wetland and non-wetland, and there is a lack of research on the transformation between wetland types. In this study, the Maqu wetlands were divided into four types: water bodies, swamp, swamp meadow, and wet meadow, among which the swamp meadow and wet meadow are unique wetland types on the QTP. The classification accuracy of the swamp, swamp meadow, and wet meadow was lower than the general level. This confusion may be caused by the unclear boundary between adjacent types of wetland and the fact that the spectral information for these three types is relatively similar, leading to significant difficulty in classification.
Three representative regions were selected to illustrate the changes in the distribution of the local wetlands in four periods (Figure 13). From the perspective of the entire space, the swamp, swamp meadow, and wet meadow were distributed according to a continuous gradient pattern, which conforms to the distribution law. The area variations in the succession direction of water body–swamp–swamp meadow–wet meadow–grassland were calculated by integrating the transfers between the different types of wetlands (Table 6). From 1990 to 2003, the area of all of the types of wetlands changed the most, among which 5.63 km2 of marsh was converted to swamp meadow. The Maqu wetlands are characterized by high vegetation coverage, moist air, and a high soil organic matter content, which requires surface water and underground water to fill the soil pores for a long time [53]. Local changes in the water table due to the silting of abandoned drainage channels can result in meadow swamping [54]. From 2003 to 2012, 18.40 km2 of swamp meadow was converted to wet meadow; the increases in temperature and evaporation were the main reasons for the transition from swamp meadow to wet meadow. Conversely, when the precipitation increased, excess water flooded the wet landscape, encouraging the growth of peat plants. The dead plant residues could not be decomposed completely under anaerobic conditions and gradually formed peat, transforming the meadow into a swamp [55]. Therefore, studying the transitions between wetland types is more conducive to exploring the succession process of wetlands.

4.3. Limitations of the Current Study and Future Improvements

In our research, the Landsat imagery with long-term time coverage was employed to detect wetland changes. However, their medium spatial resolution (30 m) could lead to relatively low precisions of those wetland subtypes, such as swamp (74.26%), swamp meadow (81.42%), and wet meadow (76.35%). The high-resolution satellite images, such as sentinel images and GF satellite images, could have good performances in the identification of those above alpine wetland subtypes, which are potential agents for alpine wetland mapping but need to be explored in a future study.
For the long-term climate analysis in the QTP, the solely available dataset for evapotranspiration and Palmer index (drought index) has 4 km spatial resolution. Compared with the rapid elevation change in the study area and the finer resolution of wetland mapping, the coarse resolution of climate data products would inevitably introduce some uncertainties into the results, which could be improved when the high-resolution climate data product in those areas was available in the future.
The imbalance in the Asian water tower caused by the accelerated transformation of ice and snow into liquid water [6] was one of the focuses of global changes in the QTP. The response of glaciers, frozen soil, lakes, and rivers to climate change was considered, yet the alpine wetlands, which have important functions in water storage, were not taken into account. The future of the Asian water tower remains highly uncertain. Understanding and accurate predictions of future water supply require consideration of the role of alpine wetlands in water management on the QTP. The research method used in this paper can be extended to the entire QTP, which can contribute to the understanding of the spatial-temporal distribution of alpine wetlands on the QTP and their responses to climate change, facilitating regional water resources sustainable management, and support decision making.

5. Conclusions

In summary, using the GEE platform and long-term Landsat time series image data in this study, the distribution and changes in the Maqu alpine wetland from 1990 to 2020 were analyzed, and the impact of climate change on these alpine wetlands was explored. The results of this study provide research ideas and methods for the study of a wider range of alpine wetlands. The main conclusions of this study are as follows.
(1) A long-term time series of annual wetland data for the Maqu alpine wetlands from 1990 to 2020 was created. The annual average overall accuracy of the classification results was 84.63%, and the kappa coefficient was 0.81. The annual classification can accurately reflect the local details and temporal changes in the land cover. PCC was used to detect the changes in the wetland classification dataset, and the main years of transition were 2003 and 2012.
(2) The spatial distributions of the swamp, swamp meadow, and wet meadow formed a continuous gradient, and the transformation between wetland types was mainly from marsh wetland to swamp meadow and wet meadow, i.e., from wet to dry. During the past 31 years, the total wetland area decreased by 23.35%, and the total decrease in the swamp area reached 27.15%. In terms of the relevant geographical characteristics, the decrease in the wetland area was concentrated on slopes < 3°, and the wetland loss was the largest on the shady slopes.
(3) From 1990 to 2020, the increases in temperature, precipitation, and evaporation in the Maqu wetland area resulted in surface drought and decreased vegetation coverage. The driving factors of the wetland changes were mainly temperature and precipitation, which were the main natural driving forces, causing the continuous degradation of the Maqu wetlands. All types of wetlands usually slowly adapt to the changes in environmental conditions.

Author Contributions

Conceptualization and methodology, B.Z. and Z.N.; validation and formal analysis, B.Z.; data curation, B.Z. and X.H.; writing—original draft preparation, B.Z.; writing—review and editing, B.Z. and Z.N.; supervision, Z.N.; project administration, D.Z.; funding acquisition, D.Z. All authors have read and agreed to the published version of the manuscript.

Funding

This research was funded by the Second Tibetan Plateau Scientific Expedition and Research program (Grant no. 2019QZKK0106), and the international services and collaborative applications of global remote sensing data and products for typical land covers at 10 m scale using domestic satellite data (2021YFE0194700), the National Natural Science Foundation of China (grant: 41971390), the Strategic Priority Research Program of the Chinese Academy of Sciences (XDA19030203).

Conflicts of Interest

The authors declare no conflict of interest.

References

  1. Brinson, M.M.; Malvárez, A.I.J.E.c. Temperate Freshwater Wetlands: Types, Status, and Threats; Cambridge University Press: Cambridge, UK, 2002; Volume 29, pp. 115–133. [Google Scholar]
  2. Gao, Q.Z.; Guo, Y.Q.; Xu, H.M.; Ganjurjav, H.; Li, Y.; Wan, Y.F.; Qin, X.B.; Ma, X.; Liu, S. Climate change and its impacts on vegetation distribution and net primary productivity of the alpine ecosystem in the Qinghai-Tibetan Plateau. Sci. Total Environ. 2016, 554, 34–41. [Google Scholar] [CrossRef]
  3. Cui, M.M.; Ma, A.Z.; Qi, H.Y.; Zhuang, X.L.; Zhuang, G.Q.; Zhao, G.H. Warmer temperature accelerates methane emissions from the Zoige wetland on the Tibetan Plateau without changing methanogenic community composition. Sci. Rep. 2015, 5, srep11616. [Google Scholar] [CrossRef] [Green Version]
  4. Toney, J.L.; García-Alix, A.; Jiménez-Moreno, G.; Anderson, R.S.; Seki, O. New insights into Holocene hydrology and temperature from lipid biomarkers in western Mediterranean alpine wetlands. Quat. Sci. Rev. 2020, 240, 106395. [Google Scholar]
  5. Shen, M.; Zhang, G.; Cong, N.; Wang, S.; Kong, W.; Piao, S. Increasing altitudinal gradient of spring vegetation phenology during the last decade on the Qinghai–Tibetan Plateau. Agric. For. Meteorol. 2014, 189–190, 71–80. [Google Scholar]
  6. Yao, T.; Bolch, T.; Chen, D.; Gao, J.; Immerzeel, W.; Piao, S.; Su, F.; Thompson, L.; Wada, Y.; Wang, L.; et al. The imbalance of the Asian water tower. Nat. Rev. Earth Environ. 2022, 1–15. [Google Scholar] [CrossRef]
  7. Winter, T.C. The vulnerability of wetlands to climate change: A hydrologic landscape perspective. JAWRA J. Am. Water Resour. Assoc. 2000, 36, 305–311. [Google Scholar]
  8. Niu, Z.G.; Zhang, H.Y.; Wang, X.W.; Yao, W.B.; Zhou, D.M.; Zhao, K.Y.; Zhao, H.; Li, N.N.; Huang, H.B.; Li, C.C.; et al. Mapping wetland changes in China between 1978 and 2008. Chin. Sci. Bull. 2012, 57, 2813–2823. [Google Scholar] [CrossRef] [Green Version]
  9. Wang, R.; He, M.; Niu, Z.G. Responses of Alpine Wetlands to Climate Changes on the Qinghai-Tibetan Plateau Based on Remote Sensing. Chin. Geogr. Sci. 2020, 30, 189–201. [Google Scholar] [CrossRef]
  10. Ding, M.; Zhang, Y.; Sun, X.; Liu, L.; Wang, Z.; Bai, W. Spatiotemporal variation in alpine grassland phenology in the Qinghai-Tibetan Plateau from 1999 to 2009. Chin. Sci. Bull. 2012, 58, 396–405. [Google Scholar]
  11. Xue, Z.S.; Zhang, Z.S.; Lu, X.G.; Zou, Y.C.; Lu, Y.L.; Jiang, M.; Tong, S.Z.; Zhang, K. Predicted areas of potential distributions of alpine wetlands under different scenarios in the Qinghai-Tibetan Plateau, China. Glob. Planet. Change 2014, 123, 77–85. [Google Scholar] [CrossRef]
  12. Wu, G.L.; Ren, G.H.; Wang, D.; Shi, Z.H.; Warrington, D. Above- and below-ground response to soil water change in an alpine wetland ecosystem on the Qinghai-Tibetan Plateau, China. J. Hydrol. 2013, 476, 120–127. [Google Scholar] [CrossRef]
  13. Chu, L.; Huang, C.; Liu, G.H.; Liu, Q.S.; Zhao, J. Analysis on Vegetation Changes of Maqu Alpine Wetlands in the Yellow River Source Region. In Proceedings of the Conference on Land Surface Remote Sensing II, Beijing, China, 13–16 October 2014. [Google Scholar]
  14. Chen, H.; Zhu, Q.; Peng, C.; Wu, N.; Wang, Y.; Fang, X.; Gao, Y.; Zhu, D.; Yang, G.; Tian, J.; et al. The impacts of climate change and human activities on biogeochemical cycles on the Q inghai-Tibetan Plateau. Glob. Change Biol. 2013, 19, 2940–2955. [Google Scholar]
  15. Syphard, A.D.; Garcia, M.W. Human- and beaver-induced wetland changes in the Chickahominy River watershed from 1953 to 1994. Wetlands 2001, 21, 342–353. [Google Scholar] [CrossRef]
  16. Mabwoga, S.; Thukral, A.J.S. Characterization of change in the Harike wetland, a Ramsar site in India, using landsat satellite data. SpringerPlus 2014, 3, 576. [Google Scholar]
  17. Marie, T.; Lai, X.; Huber, C.; Chen, X.; Uribe, C.; Huang, S.; LaCaux, J.-P.; LaFaye, M.; Yesou, H. Monitoring Temporal Evolution of the Presence Intermediate Host of the Schistosomiasis and its Risk Transmission Based on Dragon Times Series in Poyang Lake Area Jiangxi Province, PR China. In Proceedings of the ESA Living Planet Symposium, Bergen, Norway, 28 June–2 July 2010; p. 190. [Google Scholar]
  18. Coppin, P.; Jonckheere, I.; Nackaerts, K.; Muys, B.; Lambin, E. Digital change detection methods in ecosystem monitoring: A review. Int. J. Remote Sens. 2004, 25, 1565–1596. [Google Scholar] [CrossRef]
  19. Yang, T.; Guan, X.; Qian, Y.; Xing, W.; Wu, H. Efficiency Evaluation of Urban Road Transport and Land Use in Hunan Province of China Based on Hybrid Data Envelopment Analysis (DEA) Models. Sustainability 2019, 11, 3826. [Google Scholar]
  20. Barnieh, B.A.; Jia, L.; Menenti, M.; Zhou, J.; Zeng, Y.L. Mapping Land Use Land Cover Transitions at Different Spatiotemporal Scales in West Africa. Sustainability 2020, 12, 8565. [Google Scholar] [CrossRef]
  21. Soliman, G.; Soussa, H. Wetland change detection in Nile swamps of southern Sudan using multitemporal satellite imagery. J. Appl. Remote Sens. 2011, 5, 053517. [Google Scholar] [CrossRef]
  22. Zhou, H.P.; Jiang, H.; Huang, Q.H. Landscape and Water Quality Change Detection in Urban Wetland: A Post-classification Comparison Method with IKONOS Data. In Proceedings of the 3rd International Conference on Environmental Science and Information Application Technology (ESIAT), Xi’an, China, 20–21 August 2011; pp. 1726–1731. [Google Scholar]
  23. Pouliot, D.; Latifovic, R.; Fernandes, R.; Olthof, I. Evaluation of annual forest disturbance monitoring using a static decision tree approach and 250 m MODIS data. Remote Sens. Environ. 2009, 113, 1749–1759. [Google Scholar]
  24. Wu, L.; Li, Z.; Liu, X.; Zhu, L.; Tang, Y.; Zhang, B.; Xu, B.; Liu, M.; Meng, Y.; Liu, B. Multi-Type Forest Change Detection Using BFAST and Monthly Landsat Time Series for Monitoring Spatiotemporal Dynamics of Forests in Subtropical Wetland. Remote Sens. 2020, 12, 341. [Google Scholar]
  25. Huang, H.; Chen, Y.; Clinton, N.; Wang, J.; Wang, X.; Liu, C.; Gong, P.; Yang, J.; Bai, Y.; Zheng, Y.; et al. Mapping major land cover dynamics in Beijing using all Landsat images in Google Earth Engine. Remote Sens. Environ. 2017, 202, 166–176. [Google Scholar]
  26. Gorelick, N.; Hancher, M.; Dixon, M.; Ilyushchenko, S.; Thau, D.; Moore, R. Google Earth Engine: Planetary-scale geospatial analysis for everyone. Remote Sens. Environ. 2017, 202, 18–27. [Google Scholar]
  27. Mutanga, O.; Kumar, L. Google Earth Engine Applications. Remote Sens. 2019, 11, 591. [Google Scholar]
  28. Liu, D.; Chen, N.; Zhang, X.; Wang, C.; Du, W. Annual large-scale urban land mapping based on Landsat time series in Google Earth Engine and OpenStreetMap data: A case study in the middle Yangtze River basin. ISPRS J. Photogramm. Remote Sens. 2019, 159, 337–351. [Google Scholar]
  29. Zhang, Y.; Wang, G.; Wang, Y. Changes in alpine wetland ecosystems of the Qinghai–Tibetan plateau from 1967 to 2004. Environ. Monit. Assess. 2010, 180, 189–199. [Google Scholar]
  30. Abatzoglou, J.T.; Dobrowski, S.Z.; Parks, S.A.; Hegewisch, K.C. TerraClimate, a high-resolution global dataset of monthly climate and climatic water balance from 1958–2015. Sci. Data 2018, 5, 170191. [Google Scholar]
  31. Klingaman, T.E.; Oliver, L.R. Palmer Amaranth (Amaranthus palmeri) Interference in Soybeans (Glycine max). Weed Sci. 1994, 42, 523–527. [Google Scholar] [CrossRef]
  32. Pressey, R.L.; Adam, P. A review of wetland inventory and classification in Australia. In Classification and Inventory of the World’s Wetlands; Springer: Dordrecht, The Netherlands, 1995; pp. 81–101. [Google Scholar]
  33. Zhang, Y.L.; Wang, C.L.; Bai, W.Q.; Wang, Z.F.; Tu, Y.L.; Yangjaen, D.G. Alpine wetlands in the Lhasa River Basin, China. J. Geogr. Sci. 2010, 20, 375–388. [Google Scholar] [CrossRef]
  34. Zheng, Y.M.; Niu, Z.G.; Gong, P.; Li, M.N.; Hu, L.L.; Wang, L.; Yang, Y.X.; Gu, H.J.; Mu, J.R.; Dou, G.J.; et al. A method for alpine wetland delineation and features of border: Zoig Plateau, China. Chin. Geogr. Sci. 2017, 27, 784–799. [Google Scholar] [CrossRef] [Green Version]
  35. Huo, L.L.; Chen, Z.K.; Zou, Y.C.; Lu, X.G.; Guo, J.W.; Tang, X.G. Effect of Zoige alpine wetland degradation on the density and fractions of soil organic carbon. Ecol. Eng. 2013, 51, 287–295. [Google Scholar] [CrossRef]
  36. Ren, G.H.; Deng, B.; Shang, Z.H.; Hou, Y.; Long, R.J. Plant communities and soil variations along a successional gradient in an alpine wetland on the Qinghai-Tibetan Plateau. Ecol. Eng. 2013, 61, 110–116. [Google Scholar]
  37. Yan, X.; Niu, Z.G. Reliability Evaluation and Migration of Wetland Samples. IEEE J. Sel. Top. Appl. Earth Obs. Remote Sens. 2021, 14, 8089–8099. [Google Scholar] [CrossRef]
  38. Breiman, L.J.M.L. Random forests. Comput. Sci. Mach. Learn. 2001, 45, 5–32. [Google Scholar]
  39. Ghorbanian, A.; Zaghian, S.; Asiyabi, R.; Amani, M.; Mohammadzadeh, A.; Jamali, S. Mangrove Ecosystem Mapping Using Sentinel-1 and Sentinel-2 Satellite Images and Random Forest Algorithm in Google Earth Engine. Remote Sens. 2021, 13, 2565. [Google Scholar]
  40. Beven, K.J.; Kirkby, M.J. A physically based, variable contributing area model of Basin hydrology/Un modèle à base physique de zone d’appel variable de l’hydrologie du bassin versant. Hydrol. Sci. Bull. 1979, 24, 43–69. [Google Scholar] [CrossRef] [Green Version]
  41. McFeeters, S.K. The use of the Normalized Difference Water Index (NDWI) in the delineation of open water features. Int. J. Remote Sens. 1996, 17, 1425–1432. [Google Scholar]
  42. Xu, H.Q. Modification of normalised difference water index (NDWI) to enhance open water features in remotely sensed imagery. Int. J. Remote Sens. 2006, 27, 3025–3033. [Google Scholar] [CrossRef]
  43. Chandrasekar, K.; Sesha Sai, M.V.R.; Roy, P.S.; Dwevedi, R.S. Land Surface Water Index (LSWI) response to rainfall and NDVI using the MODIS Vegetation Index product. Int. J. Remote Sens. 2010, 31, 3987–4005. [Google Scholar]
  44. Pci, Y.A.N.; Youjing, Z.; Yuan, Z. A Study on Information Extraction of Water Enhanced Water Index (EWI) and GIS System in Semi-arid Regions with the Based Noise Remove Techniques. Remote Sens. Inf. 2007, 6, 62–67. [Google Scholar]
  45. Feyisa, G.L.; Meilby, H.; Fensholt, R.; Proud, S.R. Automated Water Extraction Index: A new technique for surface water mapping using Landsat imagery. Remote Sens. Environ. 2014, 140, 23–35. [Google Scholar] [CrossRef]
  46. Tucker, C.J. Red and photographic infrared linear combinations for monitoring vegetation. Remote Sens. Environ. 1979, 8, 127–150. [Google Scholar]
  47. Roujean, J.-L.; Breon, F.-M. Estimating PAR absorbed by vegetation from bidirectional reflectance measurements. Remote Sens. Environ. 1995, 51, 375–384. [Google Scholar] [CrossRef]
  48. Gitelson, A.A.; Gritz, Y.; Merzlyak, M.N. Relationships between leaf chlorophyll content and spectral reflectance and algorithms for non-destructive chlorophyll assessment in higher plant leaves. J. Plant Physiol. 2003, 160, 271–282. [Google Scholar] [CrossRef]
  49. Gao, J.; Li, X.L.; Brierley, G. Topographic influence on wetland distribution and change in Maduo County, Qinghai-Tibet Plateau, China. J. Mt. Sci. 2012, 9, 362–371. [Google Scholar] [CrossRef]
  50. Metz, M.; Mitasova, H.; Harmon, R.S. Accurate stream extraction from large, radar-based elevation models. Hydrol. Earth Syst. Sci. Discuss. 2010, 7, 3213–3235. [Google Scholar]
  51. Lippitt, C.D.; Rogan, J.; Li, Z.; Eastman, J.R.; Jones, T.G. Mapping selective logging in mixed deciduous forest: A comparison of Machine Learning Algorithms. Photogramm. Eng. Remote Sens. 2008, 74, 1201–1211. [Google Scholar] [CrossRef] [Green Version]
  52. Boriah, S. Time Series Change Detection: Algorithms for Land Cover Change; University of Minnesota: Minneapolis, MN, USA, 2010. [Google Scholar]
  53. Todorova, M.; Grozeva, N.; Dermendgieva, D. Technology. Soil properties and salt content of soil from Inland salt meadow near Radnevo town. Agric. Sci. Technol. 2014, 6, 68–71. [Google Scholar]
  54. Douda, J.; Čejková, A.; Douda, K.; Kochánková, J. Development of alder carr after the abandonment of wet grasslands during the last 70 years. Ann. For. Sci. 2009, 66, 712. [Google Scholar]
  55. Simard, M.; Lecomte, N.; Bergeron, Y.; Bernier, P.Y.; Paré, D. FForest productivity decline caused by successional paludification of boreal soils. Ecol. Appl. 2007, 17, 1619–1637. [Google Scholar]
Figure 1. Map showing the location of the study area.
Remotesensing 14 04147 g001
Figure 2. Flowchart of the long-term time series wetland change detection and analysis of the driving climate forces.
Remotesensing 14 04147 g002
Figure 3. Swamp–swamp meadow–wet meadow spatial successional gradient distribution pattern in the ideal state.
Remotesensing 14 04147 g003
Figure 4. User accuracy and producer accuracy for each class. (a) user accuracy, (b) producer accuracy.
Remotesensing 14 04147 g004
Figure 5. Maqu wetland classification map and partially enlarged map for 2020.
Remotesensing 14 04147 g005
Figure 6. Maqu wetland classification maps from 1990 to 2019.
Remotesensing 14 04147 g006
Figure 7. Proportions of the wetland types in Maqu in 2020.
Remotesensing 14 04147 g007
Figure 8. Overall changes in the Maqu wetland area from 1990 to 2020.
Remotesensing 14 04147 g008
Figure 9. Changes in the areas of the wetlands and grassland during the different periods.
Remotesensing 14 04147 g009
Figure 10. Maqu wetland type transitions from 1990 to 2020.
Remotesensing 14 04147 g010
Figure 11. Topographic features of the wetland distribution and changes. (a) Elevation, (b) Slope, (c) Aspect.
Remotesensing 14 04147 g011
Figure 12. Trends of the climate factors in the Maqu wetlands from 1990 to 2020.
Remotesensing 14 04147 g012
Figure 13. Distribution and local enlarged details of wetlands in the four periods (AC) represents three different local enlarged details of wetlands in 1990, 2003, 2012 and 2020).
Remotesensing 14 04147 g013
Table 1. Landsat image data for the study area used in this study.
PeriodLandsat SatelliteNumber of Images
1990–2011Landsat 5 TM570
2012Landsat 7 ETM+21
2013–2020Landsat 8 OLI285
Table 2. Landsat image data for the study area used in this study.
TypeClassDescriptionImage Example
WetlandWater bodyFreshwater surfaces, including water course of a plain river in the basin and some lakes Remotesensing 14 04147 i001
SwampIn a wet state for a long time, with special vegetation and soil-forming processes, peat accumulation in some areas Remotesensing 14 04147 i002
Swamp meadowDistributed in wide valleys with medium-lower altitudes, low-lying terrain, poor drainage, and excessively wet soil, in the transition zone between swamp and wet meadow Remotesensing 14 04147 i003
Wet meadowDistributed on the flood plain and island areas with poorly drained soils, composed of Kobresia, Carex, and Gramineae. Remotesensing 14 04147 i004
Non-
wetland
GrasslandDistributed on plains and gently sloping areas, mainly herbaceous plants grow Remotesensing 14 04147 i005
ShrublandDistributed in alpine areas, alpine dwarf forests, and other shrub lands that cannot be easily converted to trees Remotesensing 14 04147 i006
Bare landNon-vegetated land, including built-up
areas and exposed rock.
Remotesensing 14 04147 i007
SnowDistributed in steep alpine areas, partly in the shadow of mountains Remotesensing 14 04147 i008
Table 4. Areas changes (KM2) in the various types of wetlands during the different periods.
Wetland Type19902003201220201990–20032003–20122012–20201990–2020
Water184.86143.39145.06143.94−41.47+1.67−1.12−40.92
Swamp65.8944.6143.2540.81−21.28−1.36−2.44−25.08
Swamp meadow298.81232.89258.52257.69−65.92+25.63−0.83−41.12
Wet meadow698.11536.67584.53569.04−161.44+47.86−15.49−129.07
Total1247.67957.561031.3610,111.484−290.11+73.80−19.88−236.19
Table 5. Correlation coefficients between the areas of the types of wetland and the climatic factors.
Driving ForcesWaterSwampSwamp MeadowWet MeadowTotal
Annual average temperature−0.629 *−0.695 *−0.656 *−0.748 *−0.754 *
Average growing season temperature−0.73 *−0.661 *−0.662 *−0.717 *−0.744 *
Annual precipitation0.471 *0.4 *0.2980.3190.357
Growing season precipitation0.469 *0.405 *0.2880.2990.342
PI0.1630.0840.319 *0.2260.236
ET−0.482 *−0.561 *−0.466 *−0.467 *−0.501 *
Notes: * denotes p < 0.05. PI is the Palmer index, ET is evapotranspiration.
Table 6. Areas of conversion within wetland types during the different periods.
Area Change (km2)1990–20032003–20122012–2020
Water body–Swamp7.594.625.18
Swamp–Swamp meadow5.632.214.30
Swamp meadow–Wet meadow38.7318.407.86
Wet meadow–Grassland101.3563.1585.53
Publisher’s Note: MDPI stays neutral with regard to jurisdictional claims in published maps and institutional affiliations.

