Article

A Call for a Reform of the Influenza Immunization Program in Mexico: Epidemiologic and Economic Evidence for Decision Making

by
Roberto Tapia-Conyer
1,2,
Miguel Betancourt-Cravioto
1,
Alejandra Montoya
1,
Jorge Abelardo Falcón-Lezama
1,*,
Myrna María Alfaro-Cortes
1 and
Rodrigo Saucedo-Martínez
1
1
Vaccinology Section, Sociedad Mexicana de Salud Pública, Mexico City 11590, Mexico
2
School of Medicine, Universidad Nacional Autónoma de México, Mexico City 04510, Mexico
*
Author to whom correspondence should be addressed.
Vaccines 2021, 9(3), 286; https://doi.org/10.3390/vaccines9030286
Submission received: 18 January 2021 / Revised: 3 March 2021 / Accepted: 11 March 2021 / Published: 19 March 2021
(This article belongs to the Section Influenza Virus Vaccines)

Abstract

:
Limited information is available to determine the effectiveness of Mexico’s national influenza vaccination guidelines and inform policy updates. We aim to propose reforms to current influenza vaccination policies based on our analysis of cost-effectiveness studies. This cross-sectional epidemiological study used influenza case, death, discharge and hospitalization data from several influenza seasons and applied a one-year decision-analytic model to assess cost-effectiveness. The primary health outcome was influenza cases avoided; secondary health outcomes were influenza-related events associated with case reduction. By increasing vaccination coverage to 75% in the population aged 12–49 years with risk factors (diabetes, high blood pressure, morbid obesity, chronic renal failure, asthma, pregnancy), and expanding universal vaccination coverage to school-aged children (5–11 years) and adults aged 50–59 years, 7142–671,461 influenza cases; 1–15 deaths; 7615–262,812 healthcare visits; 2886–154,143 emergency room admissions and 2891–97,637 hospitalizations could be prevented (ranges correspond to separate age and risk factor groups), with a net annual savings of 3.90 to 111.99 million USD. Such changes to the current vaccination policy could potentially result in significant economic and health benefits. These data could be used to inform the revision of a vaccination policy in Mexico with substantial social value.

1. Introduction

Every year, influenza affects millions of people of all ages around the world, which results in an economic burden of approximately 87,100 million (95% confidence interval (CI): 47,200–149,500) US dollars (USD) due to direct and indirect costs, which include healthcare visits, hospitalization days and productivity loss due to the disease [1]. In Latin America, the annual incidence of influenza-like illness (ILI) ranges from 4.7% to 15.4% [2]. Worldwide, influenza cases are estimated to result in three to five million cases of severe disease and 290,000–650,000 deaths [3]. Influenza vaccination is one of the most effective interventions to prevent the transmission of the disease and to reduce the risk of death and severity of influenza-related complications such as pneumonia, bronchitis, sinus or ear infections, and exacerbation of chronic conditions in all age groups [4,5]. However, some population groups may be more susceptible to transmission and to developing more severe disease, particularly those suffering from comorbidities [6,7].
In 2004, the influenza vaccine became part of the Mexican Universal Vaccination Program. As of 2010, Mexico’s national vaccination schedule recommends yearly influenza immunization in several target groups: children aged 6 to 59 months, adults aged ≥ 60 years, pregnant women, at-risk individuals aged 5 to 59 years and health professionals [8]. These target groups are eligible to receive the vaccine free of charge at any public health facility during the influenza immunization season (October to April); people not included in these groups can only access influenza vaccines in the private sector. Vaccine coverage rates within the aforementioned groups included in the vaccination program vary between 9.9% (95% CI, 8.2–11.9) and 33.9% (95% CI, 32.3–35.4) [9].
The current official immunization guidelines are due for review as they were last revised in 2010 after the influenza A H1N1 pandemic [8]. Therefore, a sound body of evidence is needed to understand the epidemiology and impact of the influenza vaccine on the burden of disease and to guide necessary adjustments and enhancements to these guidelines, which will result in economic and health benefits.
Mexico’s current influenza vaccination guidelines exclude age groups whose coverage has been demonstrated as cost-effective in other countries [10,11,12,13]. Such age groups include school-aged children 5 to 11 years old and adults 50 to 59 years old with no risk factors. From the societal perspective, inclusion of these groups would be highly beneficial since the former has one of the highest incidence rates and risk of transmission to the general population [13,14,15,16,17,18,19], and the latter group exhibits the highest mortality rates attributable to influenza within an economically active population, which has a significant impact on loss of productivity [10,11]. Among the age groups currently included in the immunization program, those aged 5 to 59 years old with risk factors show a low vaccination coverage, despite having the highest susceptibility to influenza-related complications and death [5,15,20].
The objective of this paper is to provide guidance to the national influenza vaccination policy in Mexico. Our proposal for policy reform is based on our analysis of the health and economic benefits of expanding the current national influenza vaccination program using an integrated strategy. We analyzed an expansion strategy for three populations: expanding universal vaccination coverage to all school-aged children (5 to 11 years), increasing vaccination coverage to 75% in people aged 12 to 49 years with risk factors (diabetes mellitus, uncontrolled hypertension, morbid obesity (body mass index ≥40 kg/m2), chronic renal failure (CRF), asthma, pregnancy), and expanding universal vaccination coverage to all adults aged 50 to 59 years. Our analysis is based on the findings of two previous cost-effectiveness studies conducted by the authors of the present manuscript; one of which has been published and the other is in press [21,22].

2. Materials and Methods

In this paper, we generate a series of public policy recommendations on the basis of epidemiological and economic analysis of expanding vaccination coverage for influenza in Mexico, whose methodologies can be found in previous publications [21,22]. We conducted a two-phase study. First, the burden of disease (infections, hospitalizations, deaths, lethality, potential lost life years (PLLY), and presence of risk factors) was characterized based on the confirmed cases of influenza in Mexico and their healthcare costs during the 2009–2010 to 2017–2018 influenza seasons. Lethality rate was defined as the proportion of deaths among people having a confirmed case of influenza, whereas PLLY was defined as the estimate of the average years a person would have lived if this person had not died prematurely, which was based on the age group of a deceased person. Next, a cost-effectiveness analysis was conducted for a typical one-year season for which the health and economic benefits were estimated upon implementing the following three strategies: (1) expanding universal vaccination to all school-aged children (5 to 11 years); (2) increased vaccination coverage of the population aged 12 to 49 years with risk factors to 75% and (3) expanding universal vaccination to all adults aged 50 to 59 years.
The primary information sources were the Influenza Epidemiological Surveillance System (SISVEFLU, as per its acronym in Spanish) [23], the Epidemiological and Statistical Registry of Mortality (SEED, as per its acronym in Spanish) [24], and the Automated Hospital Discharge System (SAEH, as per its acronym in Spanish) [25]. Additionally, population estimates from the National Population Council (CONAPO, as per its acronym in Spanish) [26] were considered for age group breakdowns and projections, and data projected by the US Centers for Disease Control and Prevention (CDC) were used for influenza incidence rates through indirect standardization [27]. For the purposes of the study, the case definition of influenza was taken from the current Mexican guidelines for epidemiological surveillance and treatment of influenza [28]. Hospital discharges and influenza-associated deaths were coded according to the International Statistical Classification of Diseases and Related Health Problems, 10th Revision (Supplementary Text S1) [29].

2.1. Epidemiological Analysis

For the epidemiological characterization of confirmed influenza cases in the SISVEFLU database, the morbidity and mortality patterns were described for each season of the study period for both A and B-type circulating viruses in order to outline the trend and seasonality by epidemiological week. Hospital discharge information from the SAEH was used to estimate the number of hospitalizations and average length of stay due to influenza-associated causes.

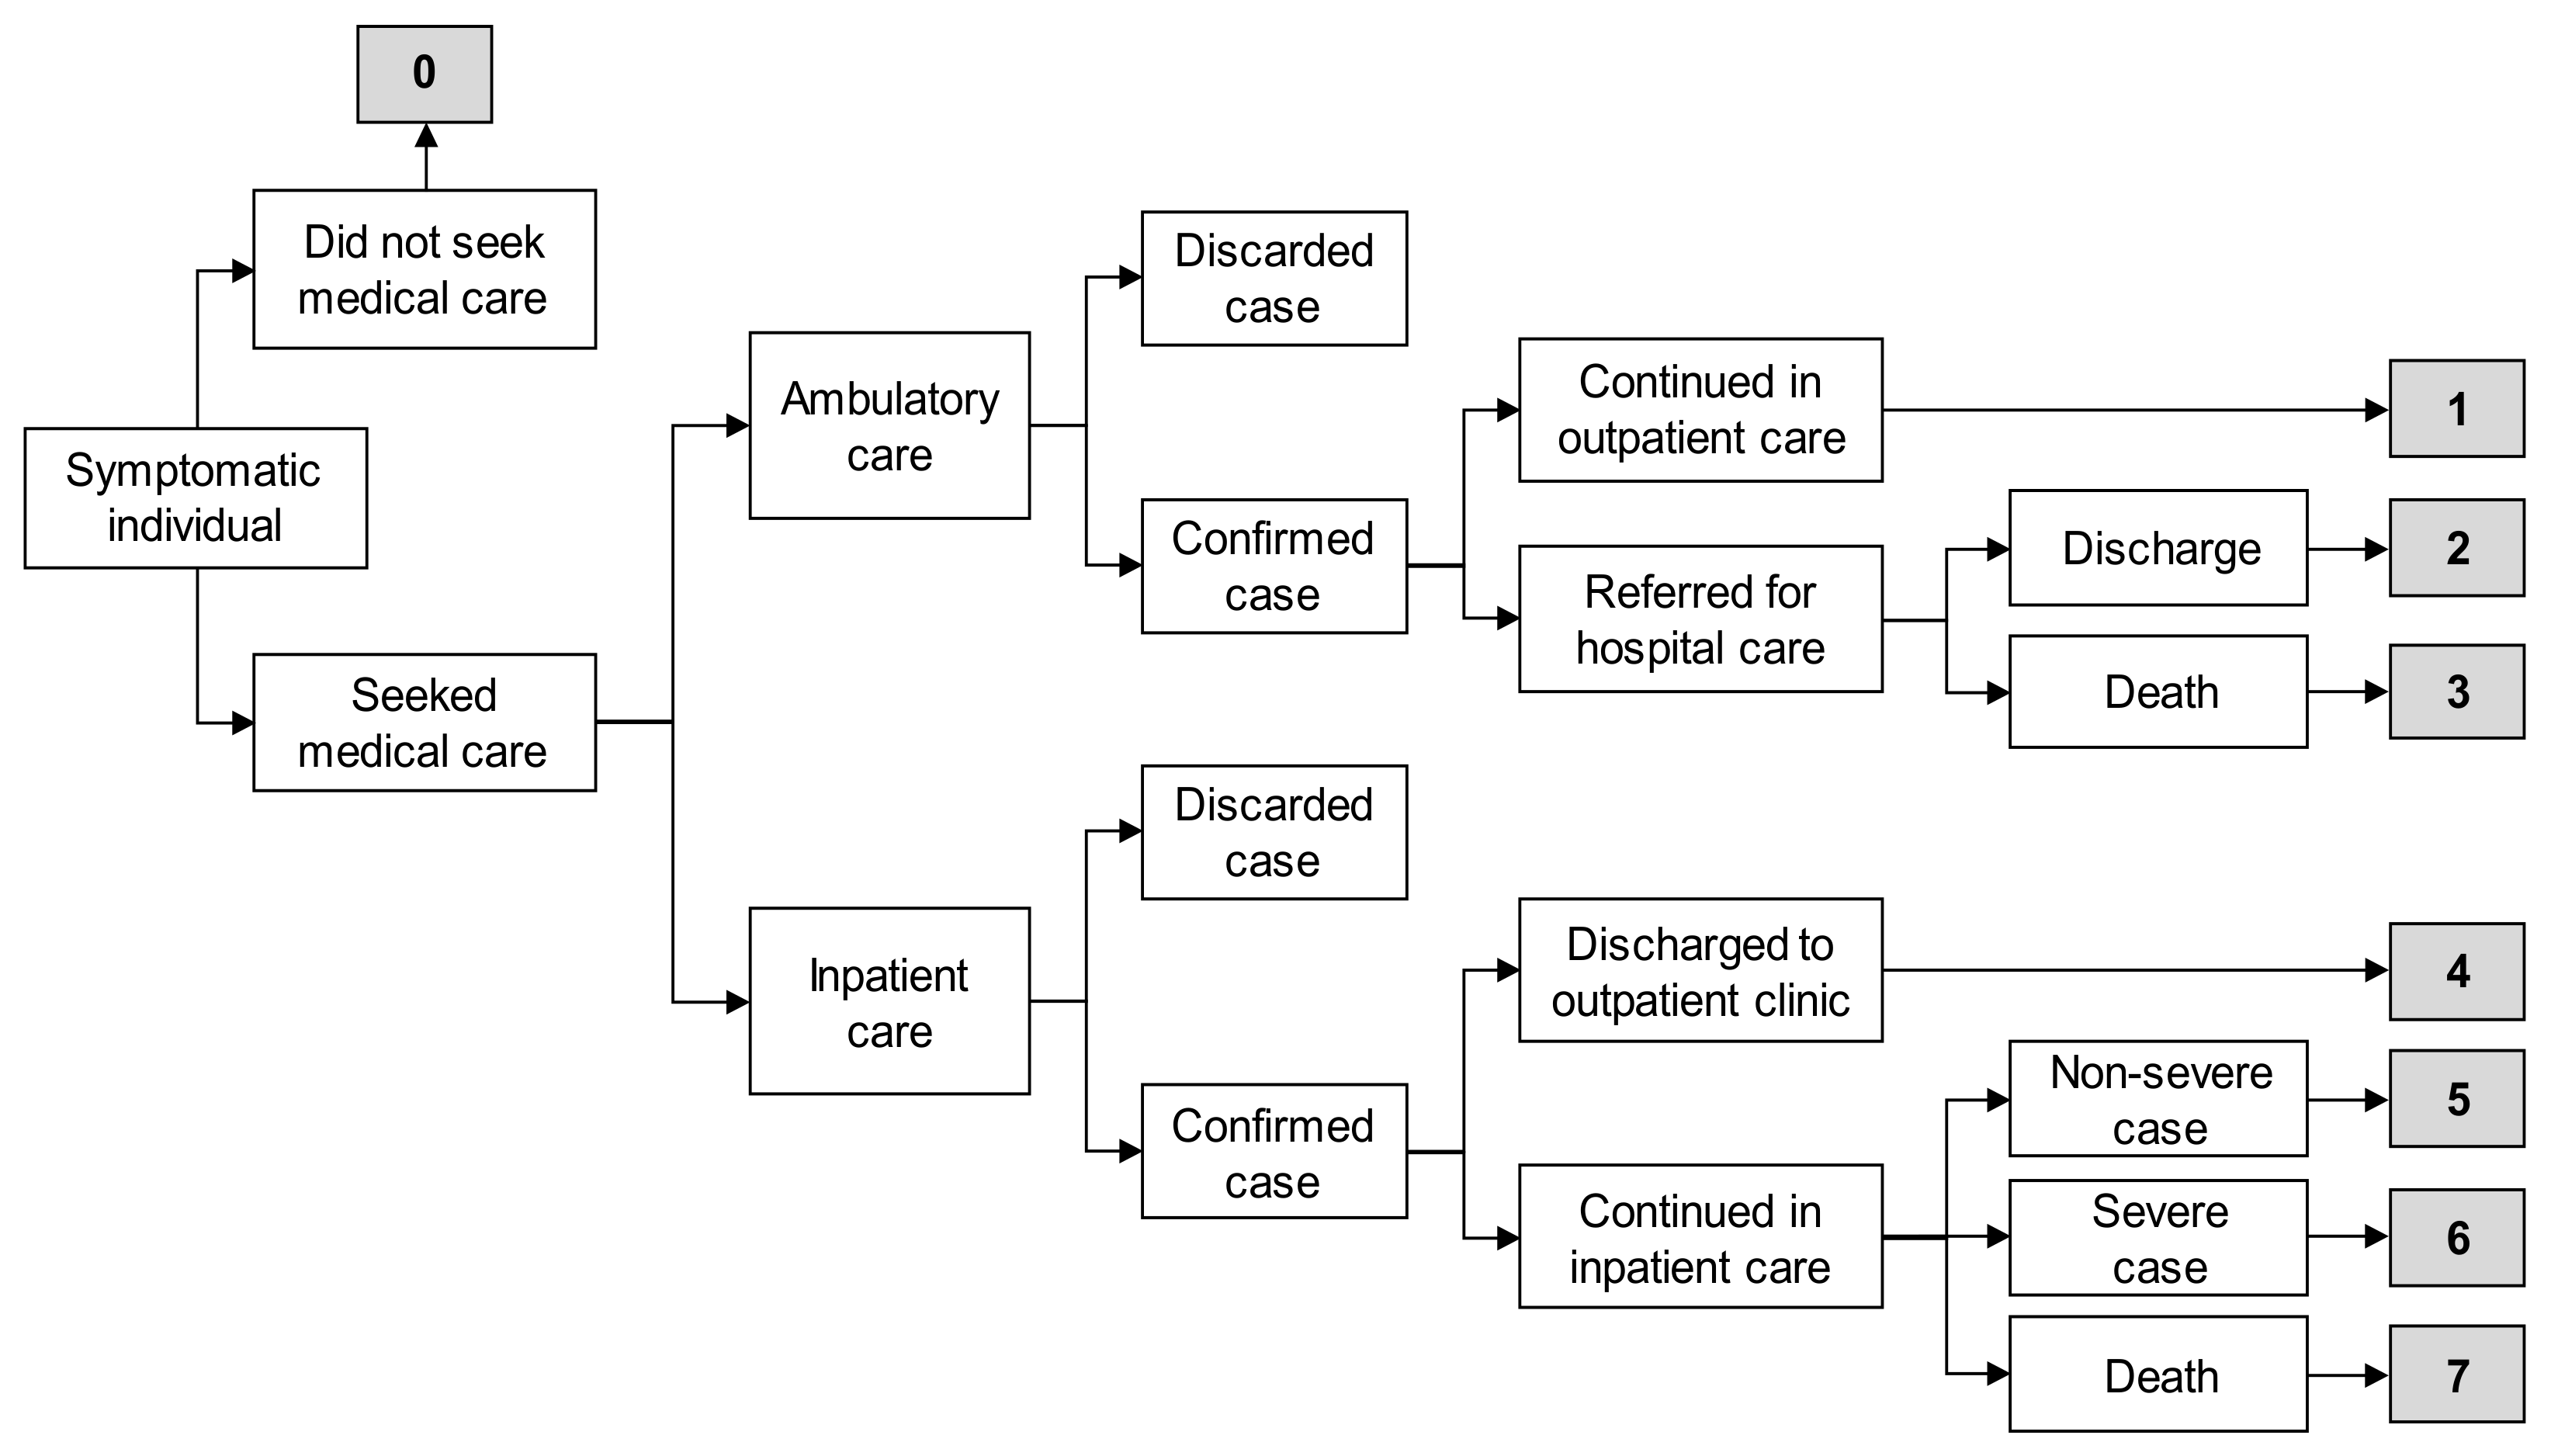
2.2. Economic Analysis

The characterization of the economic analysis was thoroughly described previously [21]. To assess the cost effectiveness of expanding the influenza vaccination schedule, a decision-tree analytical model was developed [30]. Eight scenarios were created based on SISVEFLU clinical data regarding the type of care influenza patients received (outpatient or inpatient care), diagnostic test results and treatment outcome (recovery, complication, or death). The probability of occurrence was estimated for each scenario (Figure 1).
Influenza cases were estimated based on the incidence published by the United States CDC [28], which was applied to the Mexican population structure [26] for each group of interest: (1) school-aged population (5 to 11 years old) [21], (2) population aged 12 to 49 years with risk factors, and considering the six most frequent conditions and/or the influenza-related conditions with the highest impact on the health of the Mexican population: diabetes mellitus, uncontrolled hypertension, CRF, morbid obesity, pregnancy and asthma [31,32,33], and (3) population aged 50 to 59 years without risk factors [22]. Each at-risk population group was studied separately without considering the possibility of comorbidities. Therefore, the groups cannot be pooled together to estimate the overall prevalence of risk factors in the population aged 12 to 49 years and should be analyzed independently as there is no way to assess patients with combined comorbidities.
To determine the size of the population aged 12 to 49 years with risk factors, we obtained the prevalence rates of the six most frequent conditions and/or the influenza-related conditions with the highest impact on the health of the Mexican population from national surveys: diabetes mellitus, uncontrolled hypertension, CRF, grade III or morbid obesity (body mass index ≥ 40 kg/m2), pregnancy and asthma (calculated based on the prevalence rates by age group as reported in national surveys [24,25,29] and Table 1 and Table 2).
Estimated cases were allocated into the different scenarios, applying the probability of occurrence for each scenario to distribute the cases and to estimate the direct (laboratory diagnosis, medical consultations, drugs, days of hospitalization) and indirect costs (days of medical disability leave, years of life lost) [21] according to the data recorded in SISVEFLU regarding the treatment provided and the guidelines set forth in the Clinical Practice Guideline [34] (Table 3).
Regarding direct and indirect costs, we considered laboratory diagnosis, medical consultations, drugs and days of hospitalization to be direct costs; indirect costs were based on days of medical disability leave and years of life lost. Terms are defined as follows.
For laboratory diagnosis, confirmation of influenza is based on real-time polymerase chain reaction results. In primary health care monitoring units, sample collection for confirmation is only required for 10% of cases, whereas 100% of cases are subject to mandatory sample collection for confirmation in secondary and tertiary health care monitoring units [31]. Throat swab culture is recommended for cases with suspected bacterial coinfection.
Regarding medical consultations, cases detected and managed in outpatient clinics (scenario 1) require two medical consultations; the first for clinical diagnosis and prescription of treatment, and the second to confirm complete recovery. Patients admitted to the hospital via an outpatient clinic (scenario 2) require one ambulatory consultation and two specialty consultations, the first to begin treatment at the hospital and the second at discharge. For scenario 3 (admission to hospital via an outpatient clinic that results in death), we considered one initial ambulatory consultation where clinical diagnosis and referral occurs and three specialty consultations at the hospital. An emergency consultation was mandatory for all hospital-managed patients admitted through the emergency room (ER) (scenarios 4–7). In these scenarios, patients had one, two, three and four medical consultations in scenarios 4, 5, 6, and 7 respectively, assuming a proportional increase in the number of medical consultations with the disease severity.
Regarding drugs, for individuals not requesting medical care (scenario 0) and only requiring over-the-counter drugs, we assumed the use of amantadine for influenza treatment and paracetamol for acute pain management. For all confirmed cases, either ambulatory or inpatient care, we assumed the prescription of oseltamivir for influenza treatment and paracetamol for acute pain management. The use of ceftriaxone was assumed for antibiotic treatment in patients with a bacterial coinfection (scenarios 2, 3, 5, 6, and 7).
Regarding days of hospitalization, for patients admitted via an outpatient clinic who were referred for hospitalization and later discharged (scenario 2), we assumed a one-day hospital stay, mostly for monitoring of symptoms and clinical evolution. For patients admitted via an outpatient clinic who were referred for hospitalization that resulted in death (scenario 3), we considered the average hospital stay (8.3 days) for patients with influenza [32]. Very importantly, we assumed that a hospital stay is provided independently of the admitting area or laboratory confirmation of the case, and that those unit costs are already accounted for. Patients admitted to the hospital for observation via the ER who were discharged for follow-up at an outpatient clinic (scenario 4) were considered to have had a two-day hospital stay to monitor their progress until discharge. Patients with non-severe cases admitted via the ER for medical care (scenario 5) were considered to have the average 8.3-day hospital stay. For patients with severe cases admitted to hospital via the ER (scenario 6), we assumed a 50% longer hospital stay (12.45 days) than patients with nonsevere cases. Finally, for patients admitted via the ER whose outcome was death (scenario 7), we assumed the average hospital stay of 8.3 days.
Days of medical leave were estimated based on the guidelines of the Mexican Institute of Social Security. For patients diagnosed in outpatient clinics without hospital admission (scenario 1), a three-day medical leave was assumed. For patients diagnosed in outpatient clinics with a hospital referral (scenario 2), a seven-day medical leave was assumed after a one-day hospital stay, for a total of eight days of leave. For patients admitted via the ER and later discharged for follow-up at an outpatient clinic (scenario 4), a three-day medical leave was assumed after a two-day hospital stay, for a total of five days of leave. For those admitted via the ER and hospitalized as non-severe cases (scenario 5), a seven-day medical leave was assumed after an eight-day hospital stay, for a total of 15 days of absence. For patients admitted via the ER and hospitalized as severe cases (scenario 6), a 14-day medical leave was assumed after a 12-day hospital stay, for a total of 26 days of absence [33].
For the calculation of years of life lost, the age of each influenza-confirmed death registered in SISVEFLU was considered individually. The lower limit was the age of one year for all subjects and the upper limit was the ages of 73 and 78 years for males and females, respectively, following Mexico’s current life expectancy. These ages were later weighed according to the population distribution by sex and discounted using a 5% discount rate.
The determination of unit costs per item, including the vaccination cost and the weighted average cost of affiliation of the population per season, was based on official information sources described in a previous publication [21] (Table 4); cost estimates are reported in US dollars.
To estimate direct medical costs, we considered public unit costs of each of the institutions that comprise the Mexican Health System, and then weighed them by the proportion of the population affiliated with each institution for the influenza seasons from 2009–2010 to 2018–2019. Absenteeism due to influenza was estimated using the average daily wage of an individual (obtained from the 2018 National Survey of Household Income and Expenditure) [26]. Finally, costs associated with premature deaths were projected depending on the age of an individual at the time of their death, and costs were discounted using the World Health Organization’s recommended 5% discount rate.
Costs were originally obtained in Mexican pesos (MXN) and later converted to 2018 constant prices using the National Consumer Price Index published by Mexico’s National Bureau of Statics and Geography. Data are presented in USD using the average exchange rate published in the Official Federal Gazette between January 2019 and August 2019 (USD 1 = MXN 19.2155).
Mexico currently uses the trivalent inactivated influenza vaccine in the national immunization program. The price per dose of influenza vaccine was obtained from Mexico’s Ministry of Health for 2018 (MXN 57.68, USD 3.00), whereas the cost of administration (MXN 4.54, USD 0.24) and the cost of transportation and storage (MXN 0.55, USD 0.03) were obtained from Gutierrez and Bertozzi’s study and converted to 2019 prices [28].
Each of the three expansion strategies was evaluated considering the reduction in the number of influenza cases (including associated deaths) from the perspective of the external payer and society as the primary objective. The reduction in healthcare visits, diagnostic tests, treatments, hospitalizations, sick leave and PLLY derived from such reductions were defined as secondary health outcomes in the study, considering a 5% discount rate according to the World Health Organization guidelines for performing economic analysis [35]. The term of the analysis was a typical one-year influenza season, which was used to reflect the seasonality of the disease. The efficacy of the vaccine was set at 50%, which is the average effectiveness of the influenza vaccine in the northern hemisphere of the Americas as published elsewhere for the influenza seasons from 2009–2010 to 2017–2018 [21,22], while the actual coverage of the influenza vaccine was obtained from national surveys (Table 5 and Table 6). Analyses were done using Microsoft Excel (2013) software.

3. Results

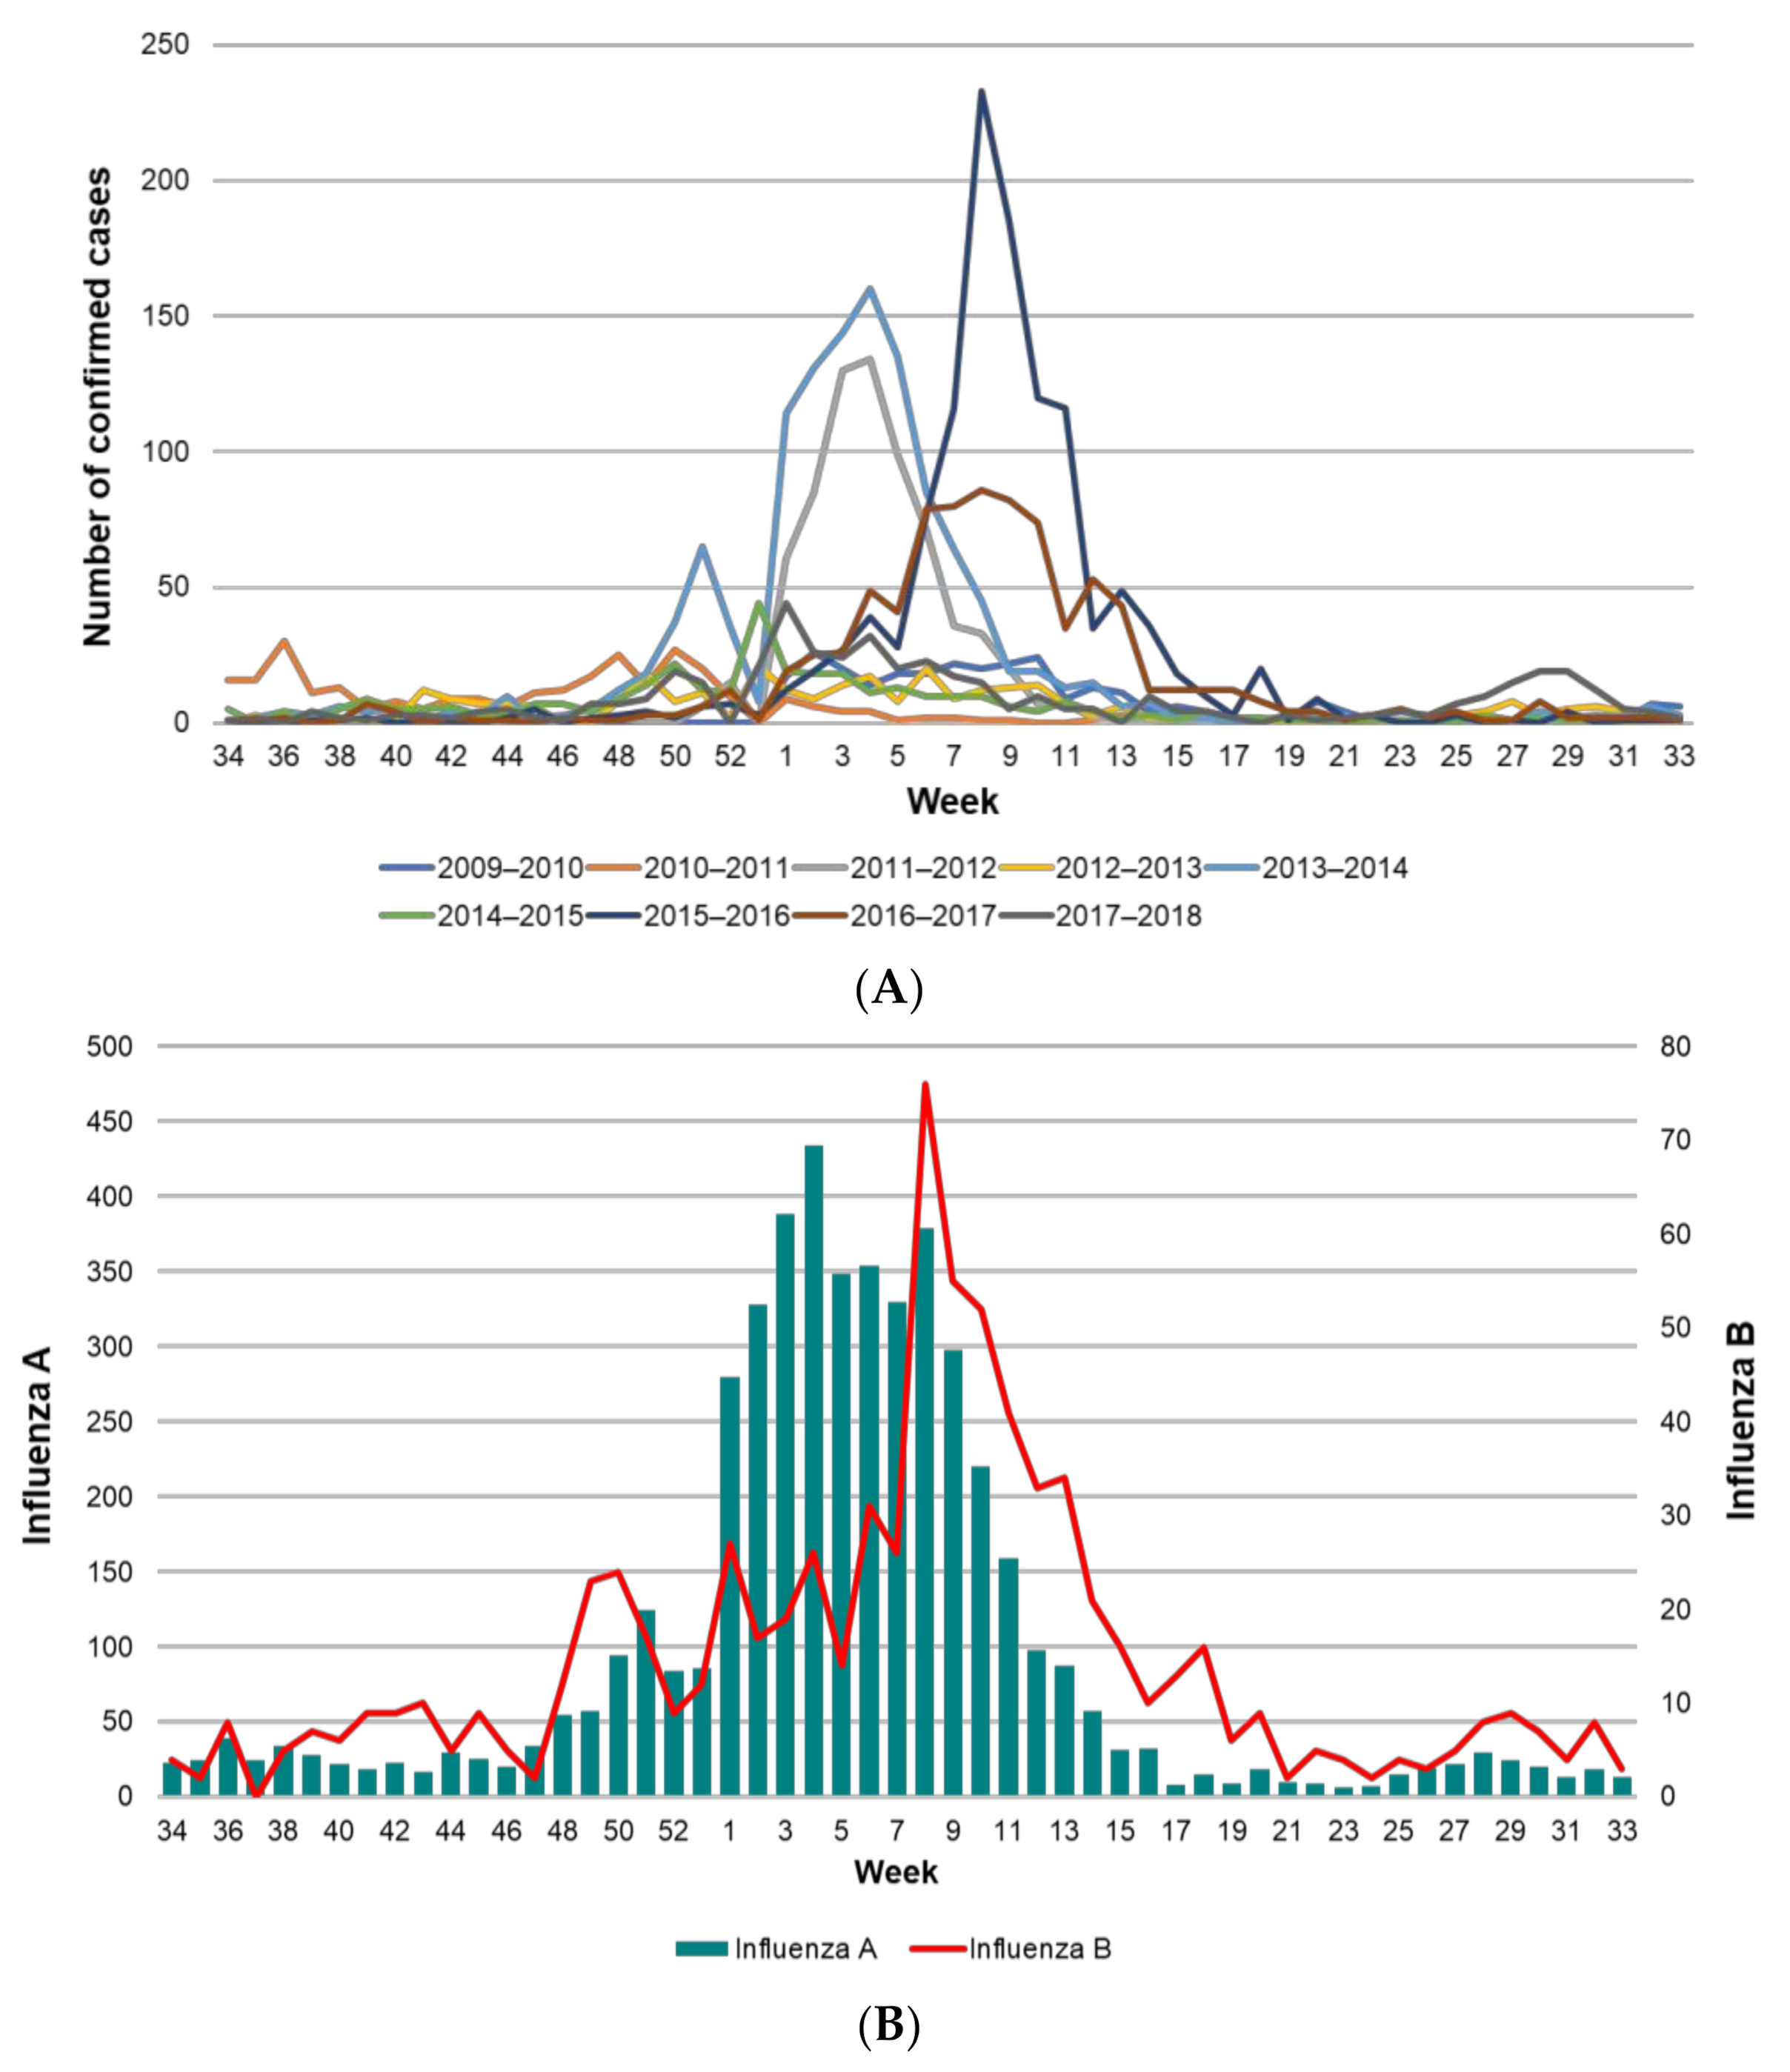
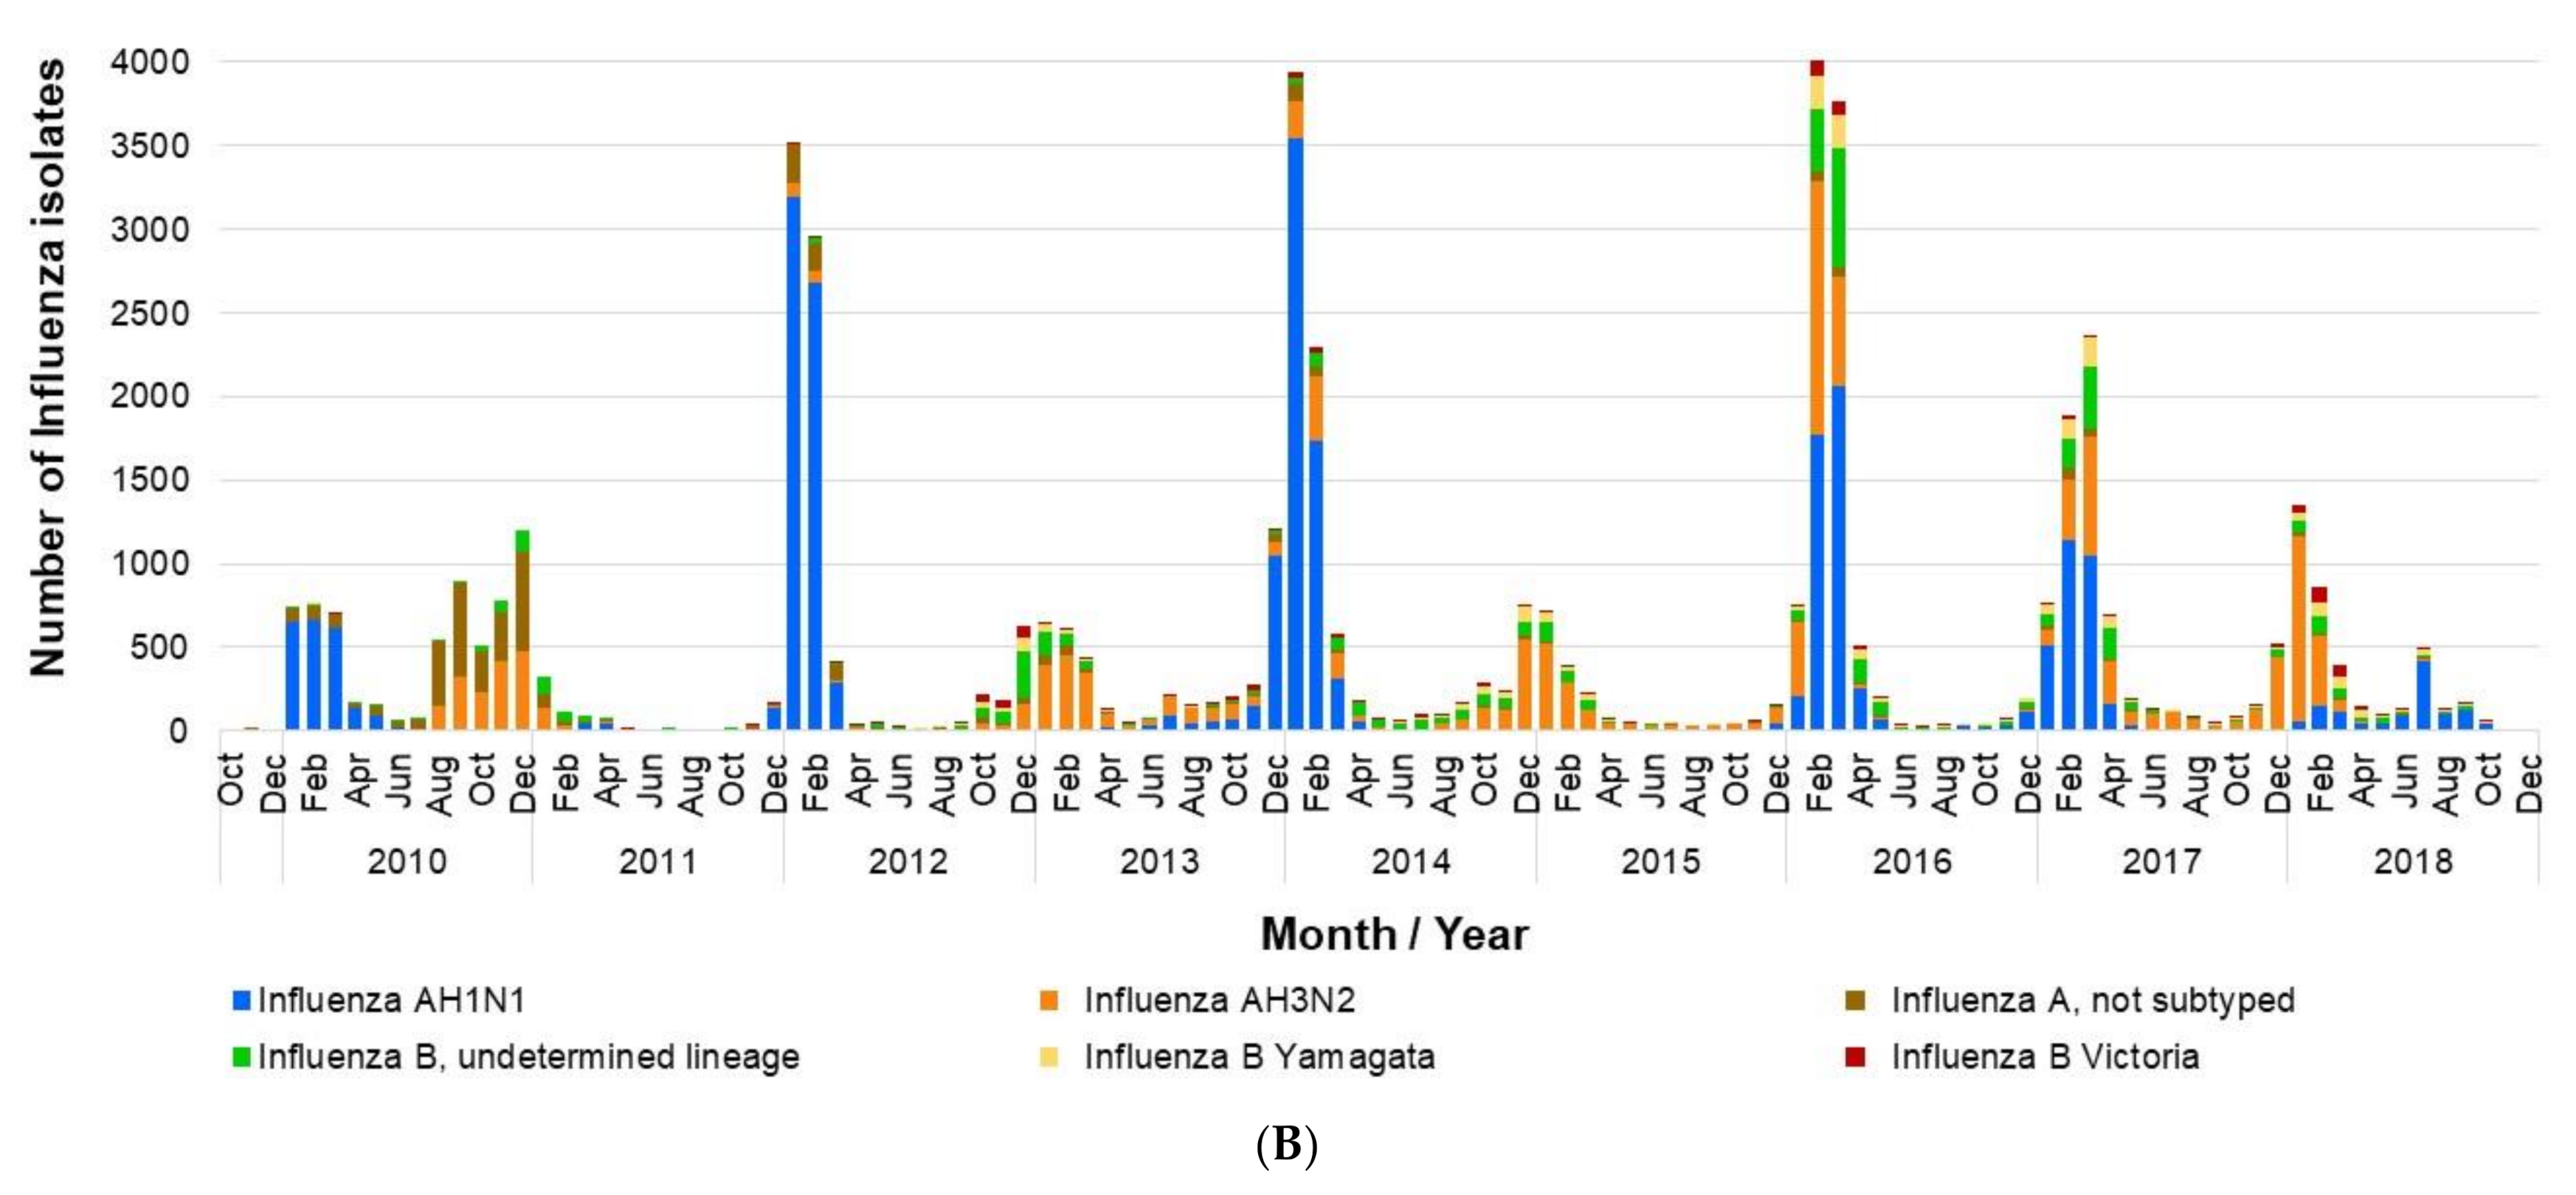
3.1. Influenza Burden of Disease

Using the surveillance criteria for influenza, SISVEFLU recorded a total of 390,862 suspected cases (Influenza-Like Illness and Severe Acute Respiratory Infection) during the study period, of which 50,900 (13.03%) were confirmed with a diagnostic test. The trend and seasonality observed during the epidemiological weeks that were included in each study season were as expected, with increased activity between week 46 and week 20 of the following year; cases peaked between weeks three and nine (Figure 2). It is worth emphasizing that excess cases were observed during the 2011–2012, 2013–2014, 2015–2016, and 2017–2018 seasons (Figure 2A). Analysis by type of infecting virus showed a bimodal pattern for influenza B, with two peaks during the year at weeks 49 and 8; most cases occurred between weeks 40 and 10. This suggests a longer duration of infectious activity of influenza B compared with influenza A (Figure 2B).

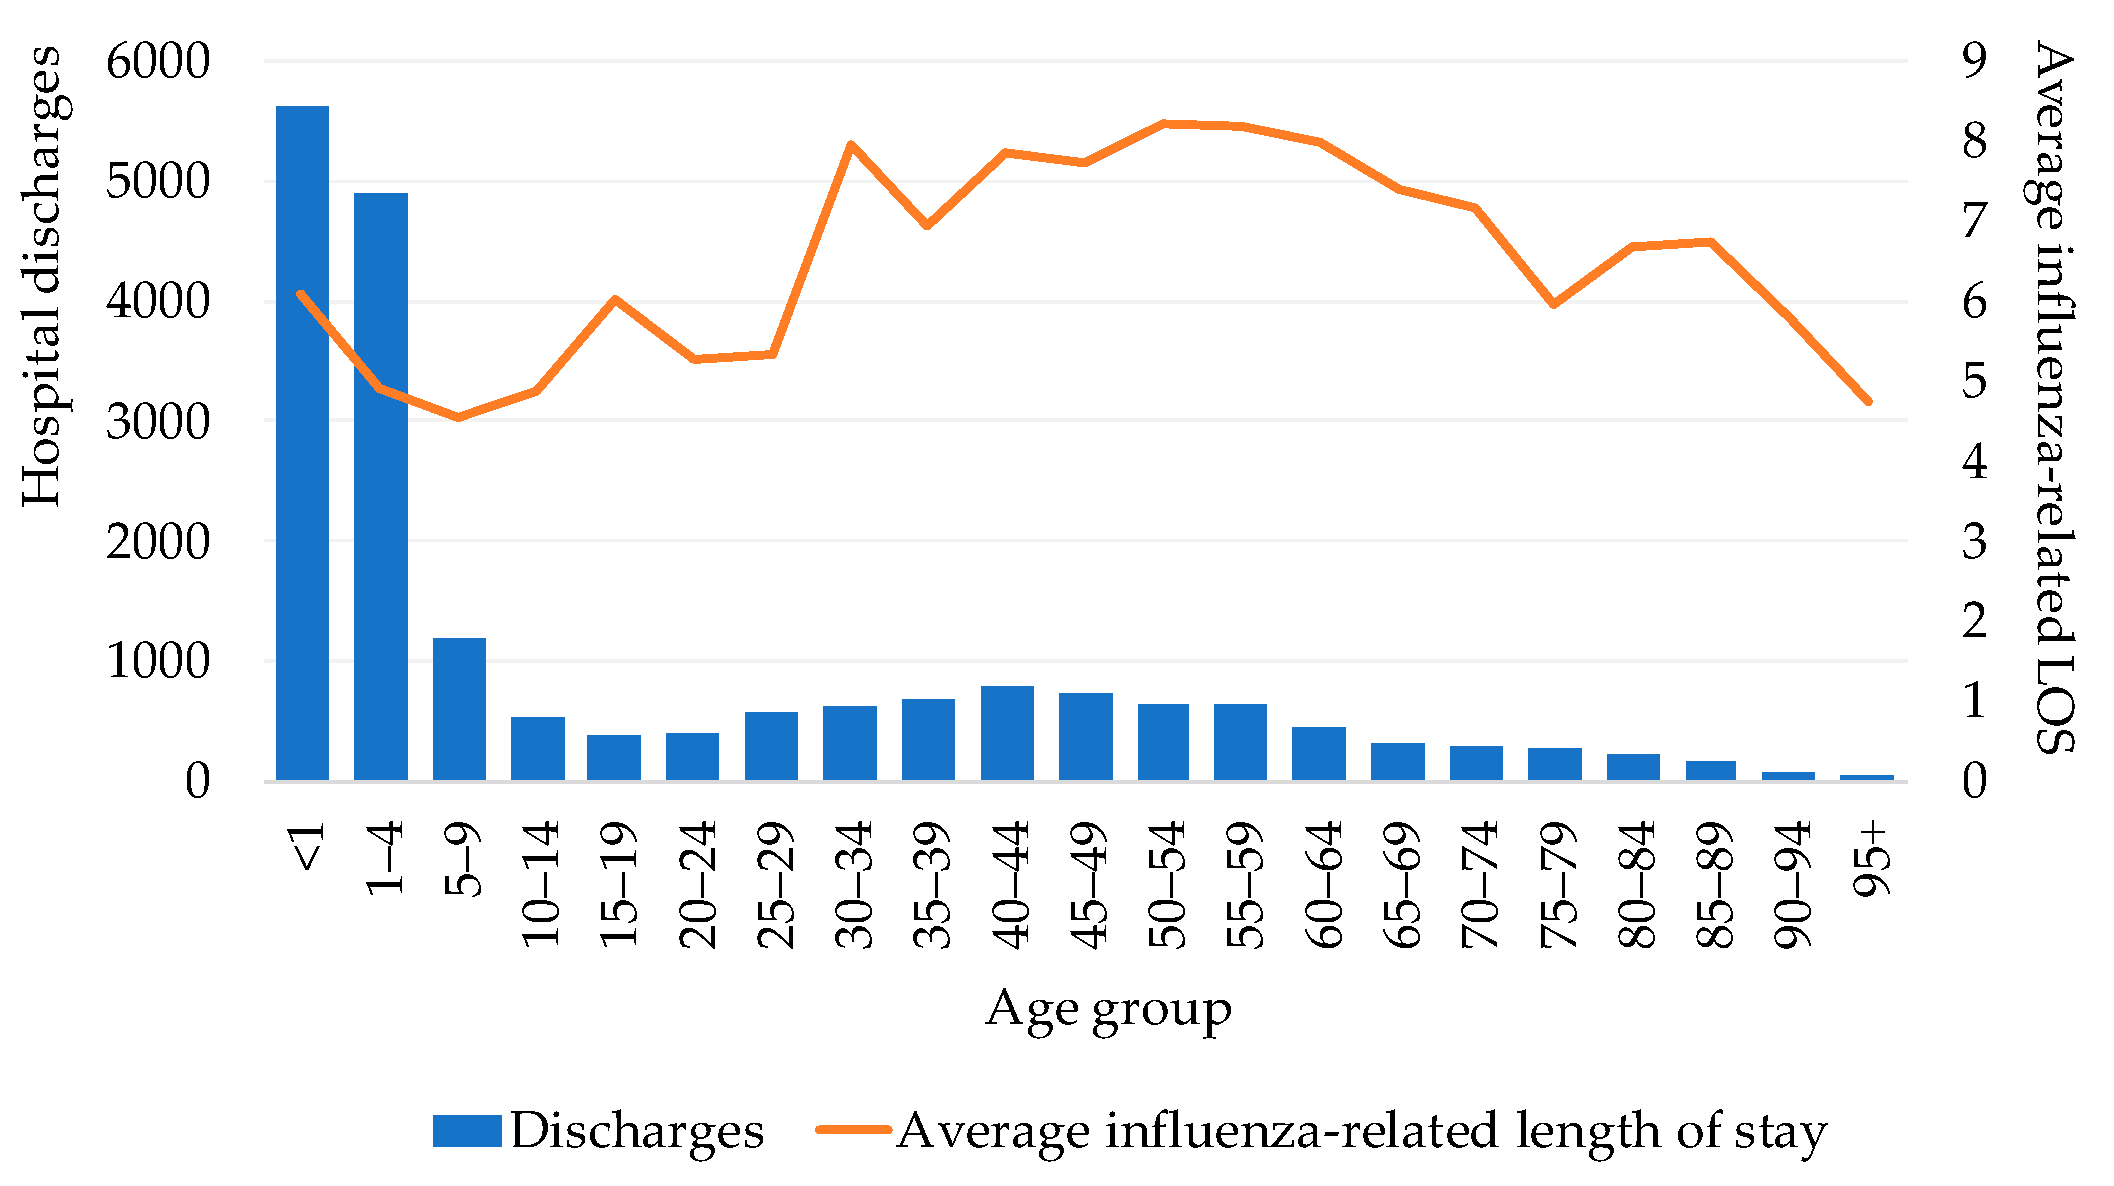
3.2. Hospital Discharges and Length of Stay

Using SAEH data [25], the number of influenza-related hospital discharges was 8631 during the study period, which represented 56,667 hospital days and an average length of stay of 6.6 hospital bed-days per hospitalized patient (Figure 3). Influenza-related hospital admissions were similar for males and females but were less frequent among young adults compared with children under five years of age and adults over 65 years of age. The longest average length of stay was seen in the 50 to 59 years old group (8.3 days), followed by the 30 to 34 and 60 to 64 years old groups (8.1 and 8.0 days, respectively). The age groups with the shortest average length of stay were five to nine years old (4.5 days) and 10 to 24 years old (4.7 days) (Figure 3).

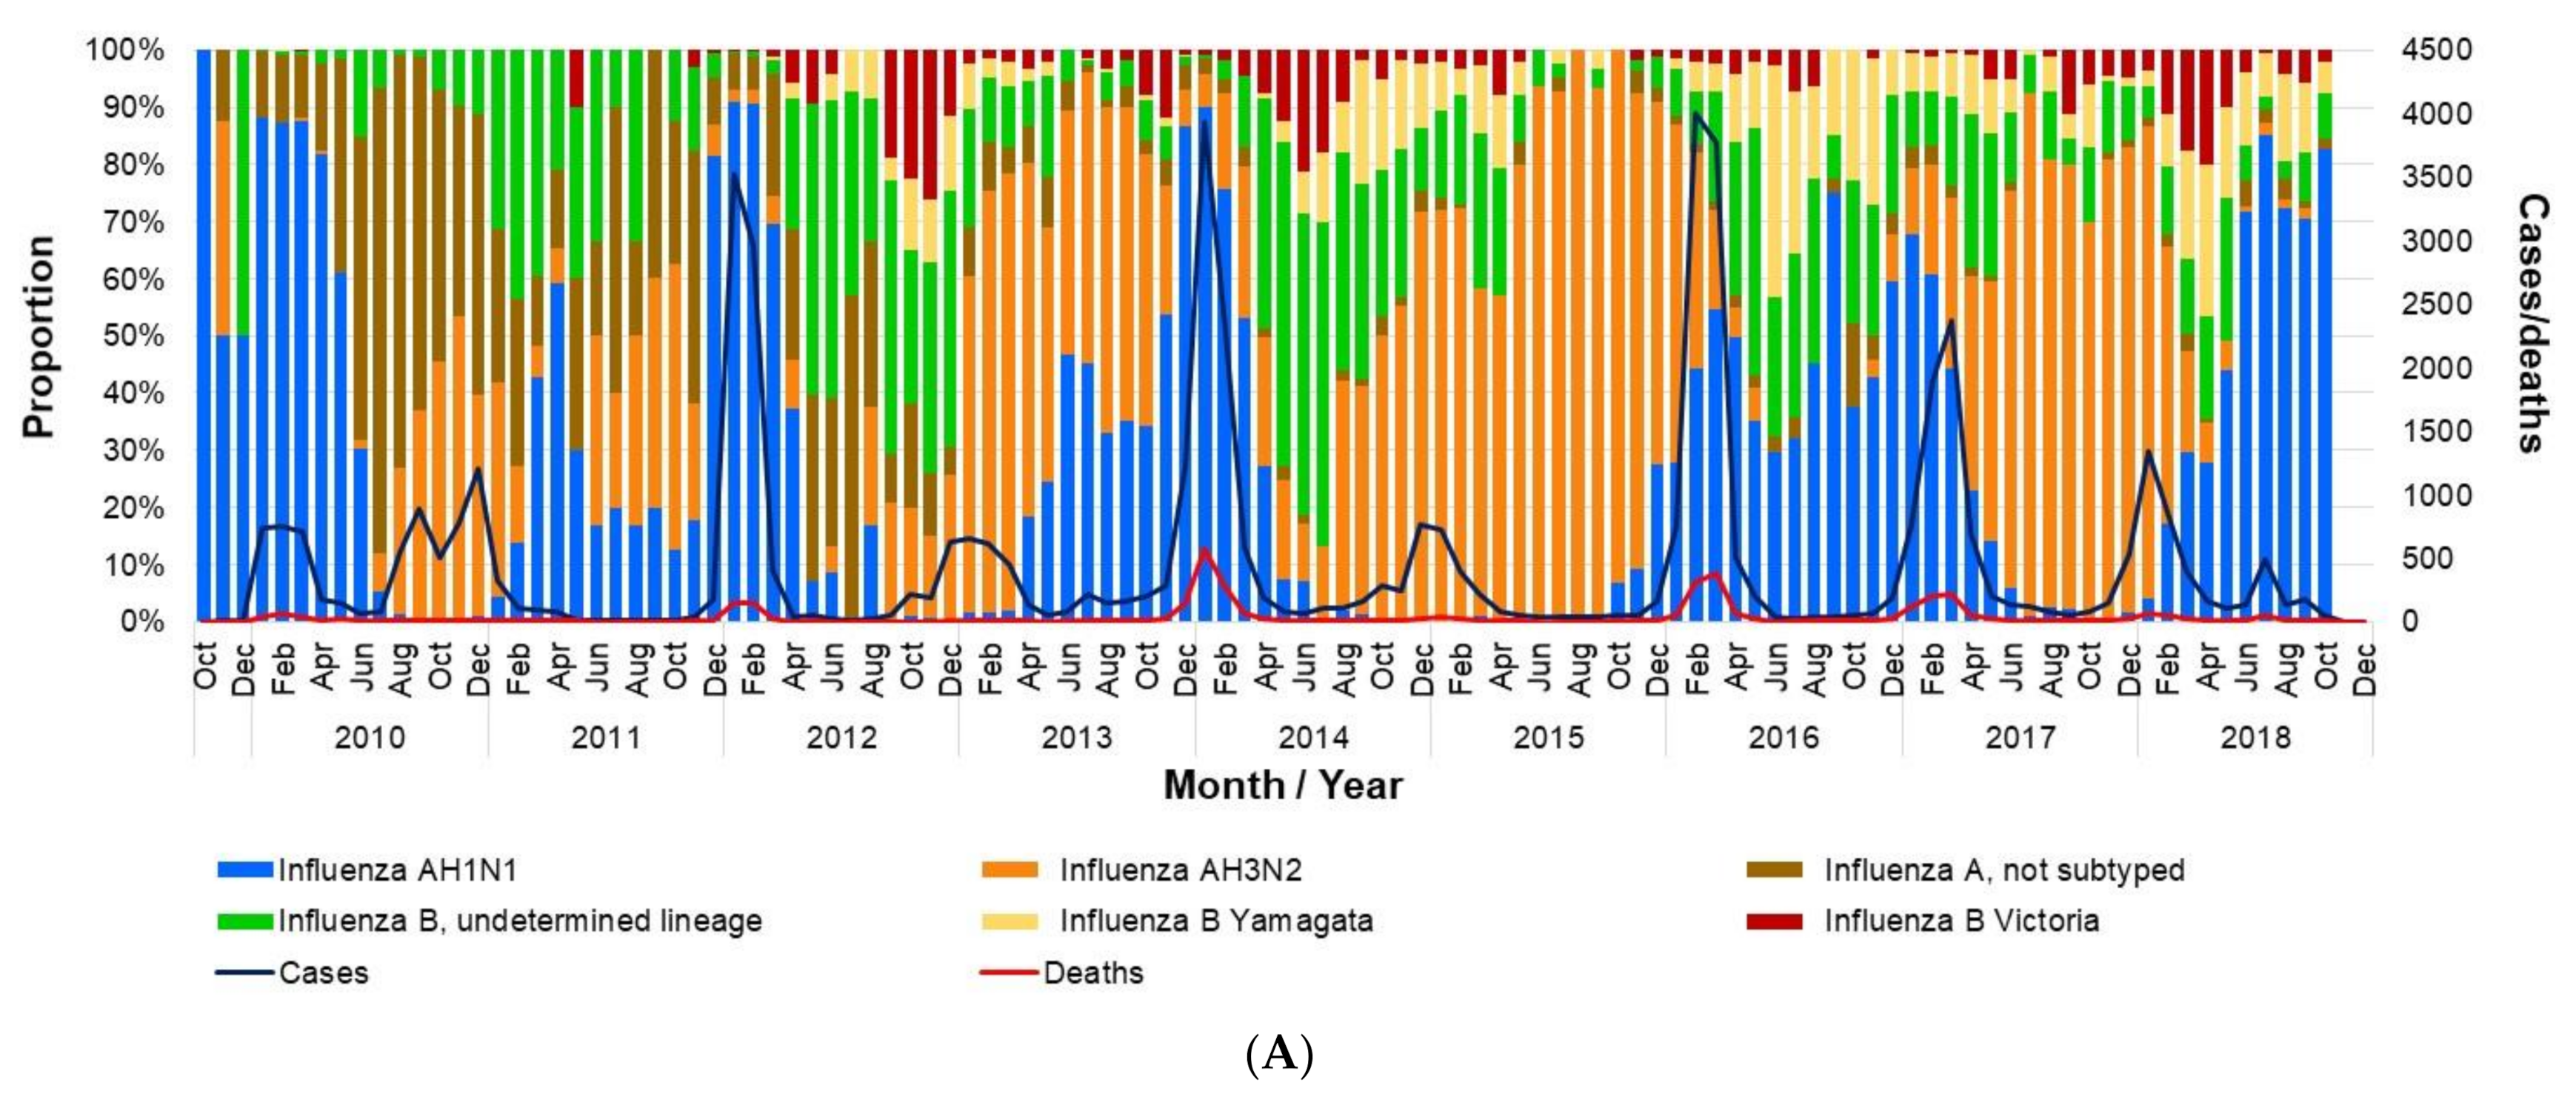
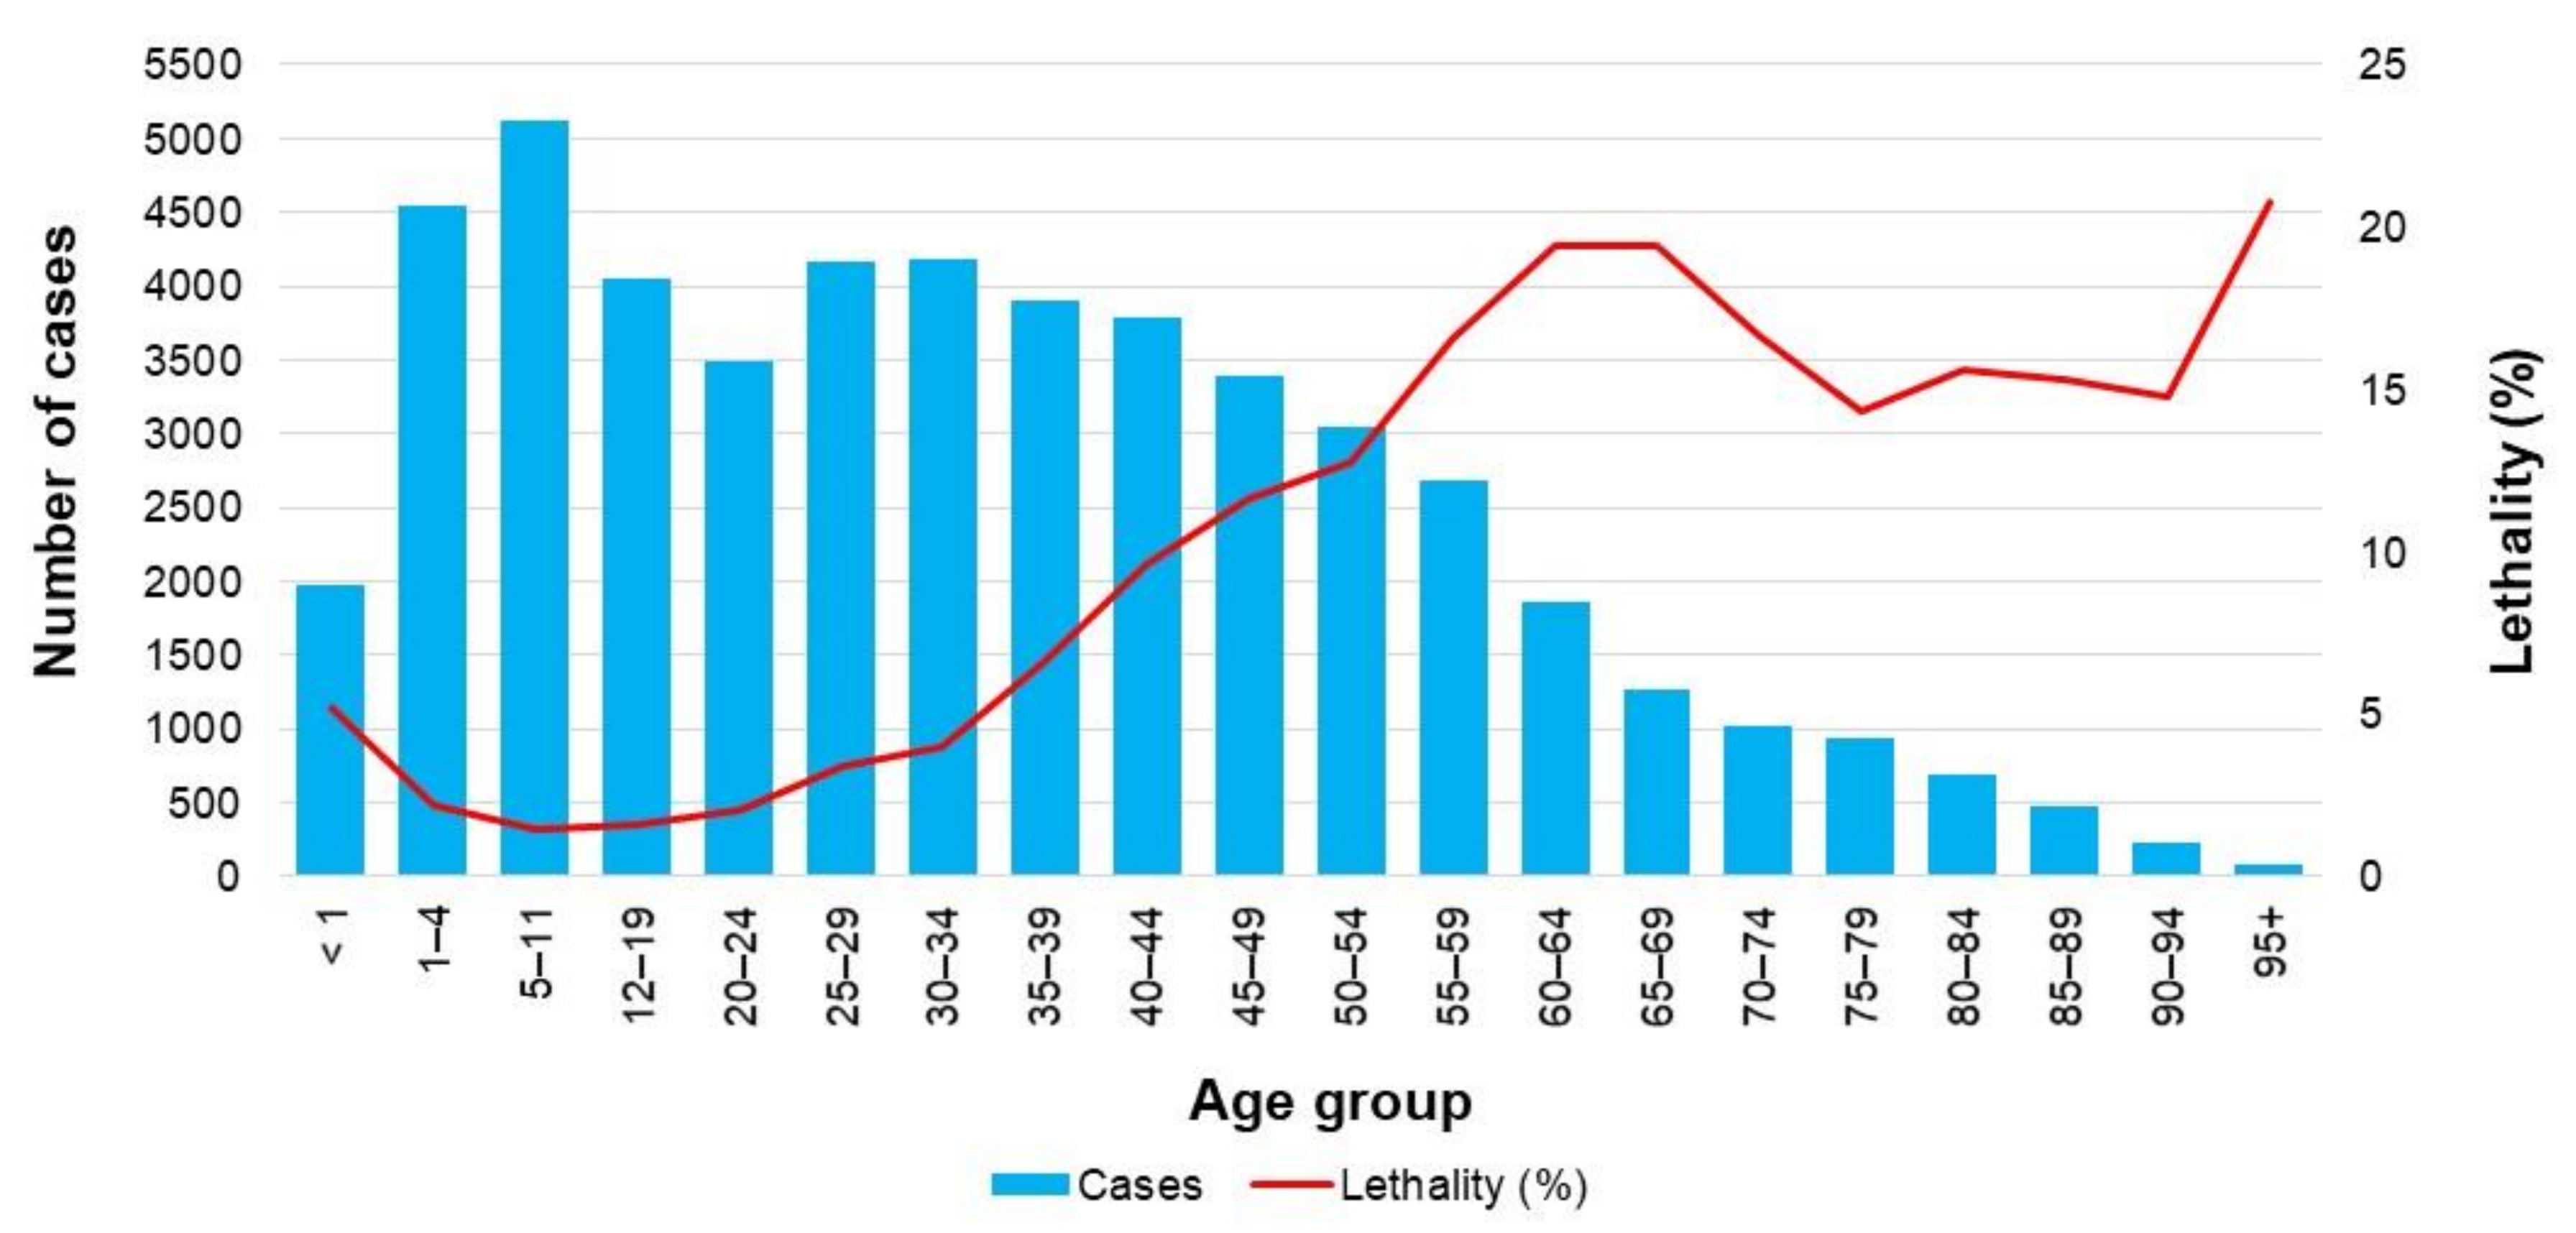
3.3. Deaths and Lethality

The number of deaths recorded during the study period was 3717, most of which were associated with influenza A infection. Deaths due to influenza show a strong seasonality with biannual modes, likely influenced by the replacement of strains. They were highest when the AH1N1 subtype was dominant, and lower when AH3N2 was dominant (Figure 4A). Regarding influenza B, the number of isolates (confirmed cases) was low throughout the study period (Figure 4B). Considering the mean life expectancy of the Mexican population, it is estimated that there were 24.5 PLLY for each influenza death, representing a total of 91,124 PLLY during the study seasons.
The average lethality rate of influenza was 7.3 deaths per 100 confirmed cases. Importantly, the highest number of influenza cases occurred in both the one to four-year-old and five to 11-year-old age groups, and this number tended to decrease with age, while lethality rose significantly after 50 years of age and peaked between 60 and 69 years of age (Figure 5).

3.4. Risk Factors in Influenza Cases and Deaths

Obesity, hypertension and diabetes were the most frequent risk factors in both influenza cases not resulting and resulting in death. The presence of risk factors among the latter was up to three-fold higher than that observed in cases that did not result in death (Figure 6).

3.5. Economic Analysis

Assuming a 50% vaccine efficacy, achieving 75% sustained coverage in the population aged 12 to 49 years with risk factors would result in a number of prevented cases of influenza ranging from a minimum of 7142 among individuals with CRF to a maximum of 82,590 among people with diabetes (Table 7).
Regarding the effectiveness of increasing vaccination coverage by age group, for each of the six risk factors analyzed we performed an analysis by age group. First, we estimated the population living with each risk factor based on the estimated prevalence (Table 1). Later, we estimated the total cases of influenza that would occur in a typical season, and later estimated the total cases of influenza for a particular risk factor considering the coverage of the current vaccination program (Table 6). Finally, we estimated the number of influenza cases considering a 75% vaccination coverage, and hence the differential in estimated cases of influenza averted (Table 8, Table 9, Table 10, Table 11, Table 12 and Table 13).
This reduction in influenza cases, in turn, represents a reduction in healthcare visits ranging from 7615 to 92,887; of ER admissions ranging from 2886 to 32,096 and of hospital admissions ranging from 2891 to 32,210. Moreover, the number of deaths prevented would range from 1.1 to 19.4.
This reduction in cases, deaths and associated events would result in an annual net savings between 3.90 and 44.45 million USD, of which between 2.84 and 35.84 million USD would represent direct savings, and between 1.06 and 8.61 million USD would represent indirect savings (Table 14). It should be noted that these estimated savings have accounted for the investment required to expand vaccination coverage, which amounts to 0.5 to 5.5 million USD, depending on the risk group.
Universal expansion of vaccination to both the school-aged (five to 11 years old) population and the age group 50 to 59 years, assuming a 50% vaccination coverage and a 50% vaccine efficacy, would prevent an estimated 870,961 cases of influenza (Table 15). This would result in an annual reduction of 383,610 healthcare visits, 187,167 ER admissions and 130,728 hospital admissions. Additionally, 27 influenza-related deaths would be prevented.
The reduction in cases and deaths would have a positive direct economic impact on both the healthcare system and society. Previous analyses [21,22] showed that expanding universal coverage to these two age groups would result in a net savings of 161.80 million USD, even when considering the 37.95 million USD investment required for the vaccination program. Positive health impacts and economic savings would still be achieved when using a conservative scenario in which vaccination coverage decreases from 50% to 30% and vaccine efficacy decreases from 50% to 19% [21,22].
The cost of influenza-related healthcare was distributed differentially among the groups. The cost of hospital admissions was the most relevant cost in all three expansion strategies (people aged 12 to 49 years with risk factors in Table 14, and children aged five to 11 years and adults aged 50 to 59 years in Table 15). In contrast, indirect cost (sick leave and premature death) represented 8.9% of healthcare cost in the adult population and represented up to a quarter of the healthcare cost for the population aged 5–11 years, mainly due to the high cost associated with premature death in this age group.

4. Discussion

4.1. Major Findings

Despite the current influenza vaccination policy, a considerable burden of disease persists, which takes a toll on society and amounts to an average of 213.4 million USD per year. This is equivalent to 1.2-fold of the total increase in the public budget allocated to health care services in Mexico in 2020 [36]. Our findings suggest that more than 60% of influenza costs are due to inpatient care, which emphasizes the need for continued reduction of the burden resulting from severe cases and complications of influenza.
We found that a 75% increase in vaccination coverage for any of the risk groups (diabetes, uncontrolled hypertension, morbid obesity, asthma or pregnancy) in the population aged 12 to 49 years would be cost-saving, resulting in savings ranging from 11.7 to 53.6 million USD per year. The benefits of reducing the disease burden would be remarkable. For instance, increasing immunization coverage solely in the population with diabetes would result in 82,590 prevented influenza cases, 92,887 fewer healthcare visits, 32,096 fewer ER admissions, 32,210 fewer hospital admissions and 12.8 fewer deaths. This intervention would be especially relevant to health care services in Mexico since, according to the 2018 National Health Survey, the coverage of influenza vaccination in the risk groups is particularly low, ranging from 9.1% among pregnant women to 35.3% among patients with diabetes mellitus [31], despite the recommendation of 100% vaccination coverage by the Clinical Guidelines as part of healthcare strategies for these at-risk populations [32]. Moreover, epidemiological characterization showed that the prevalence of risk factors was up to three-fold higher among cases that resulted in death. Therefore, this strategy could be among those offering the greatest potential for reducing influenza-related mortality in the Mexican population.
The expansion of universal coverage to the population between 50 and 59 years old without risk factors is widely recommended. It is a cost-effective strategy that would protect a population that is not currently included in the vaccination program but has the highest influenza-related mortality rate in the country (four deaths per 100,000 people) [22]. Moreover, this strategy has proven to be effective in other countries as an alternative to protect the population with unknown chronic underlying conditions [10]. This is relevant because in Mexico, as in most Latin American countries, a high proportion of the population living with chronic conditions is unaware of their health status and would assume to be not covered by the vaccination program. For example, 29% of people with diabetes and 40% with high blood pressure are unaware that they have these conditions [37,38].
Our findings show that the expansion of universal coverage to the school-aged population (five to 11 years) would also be a cost-effective strategy with great potential to reduce the burden of influenza, not only in this particular age but also for the overall population [21]. Currently the school-aged population represents 12.33% of the total population (15.5 million) and has the highest influenza incidence rate (13.9%) and attack rate (20 to 30%) during typical influenza season. Moreover, because influenza spreads faster in indoor environments such as schools, children are considered as “superspreaders” of the disease [18]. Therefore, vaccination of this population has great potential to indirectly protect the remainder of the population by means of herd immunity [13]. This strategy would be one of the most feasible, as the target population can be easily reached through school-based vaccination campaigns.
Even though the ideal scenario would be to achieve universal influenza vaccination coverage for individuals over six months of age, there are operational and financial constraints. Our findings provide evidence that supports the need to at least expand universal coverage to the population aged six months to 11 years and aged 50 to 59 years and ensure sustained vaccination coverage to 75% of the population aged 12 to 49 years with risk factors.

4.2. Implications and Recommendations for the Health System

4.2.1. Reinforcing the Coverage of Current Policies

Consistent with reports from other countries [39,40], we presented evidence that to reduce the burden of disease due to influenza in the population aged 12 to 49 years with risk factors, a sustained vaccination coverage of 75% is required. This cost-saving strategy comes with challenges for the health care system, which include ensuring an adequate supply and timely availability of vaccines, as well as the necessary human and financial resources for implementation [40]. In addition to considering the purchase of vaccines, there is need for an integrated approach to purchasing supplies, having properly trained and sufficient healthcare workers, and robust cold chain logistics with adequate inventory management, which may be difficult in middle-income countries. It is also essential to identify and address barriers for vaccination, such as lack of vaccine access and hesitancy to receive the vaccine [39,40]. In other words, public health providers should ensure timely availability of the vaccine, efficient vaccine distribution and the implementation of proactive and effective communication, promotion, training and application strategies for vaccination of the population with risk factors for whom vaccination is recommended. In light of the current COVID-19 pandemic, strategies to promote influenza vaccination, particularly among those with risk factors, are urgently needed, as both the SARS-CoV-2 and influenza viruses cause respiratory illness.

4.2.2. Universal Vaccination to Groups Currently Not Covered

During the past four decades, influenza vaccination efforts in most countries have focused mainly on population groups that have the highest frequency of the most severe and lethal complications [11]. However, programs must have a vision towards universalization. In Mexico, expanding the influenza vaccination program would generate significant health benefits and economic savings from a societal perspective [13,14,15,16,17,18,19]. To this end, the health care system should perform an in-depth feasibility analysis considering technical, funding and programmatic factors [41].

4.2.3. Reinforcing Evidence-Based Decision Making

SISVEFLU currently operates as the main surveillance system through Influenza Health Monitoring Units (USMI, as per its acronym in Spanish). Nonetheless, SISVEFLU only considers a limited number of clinics and hospitals, and this hinders extrapolation of information for the estimation of influenza cases at the national and local levels [23]. The current structure of this platform limits a proper outcome follow-up for each confirmed case. Hence, we propose the adoption of digital health best practices through the deployment of a nominal information system that enables real-time tracking of vaccination coverage, and the timely identification of case occurrence, allowing the implementation of preventive and contention measures to hamper the spread of disease [42,43]. Finally, a nominal information system would allow for systematic and recurrent evaluations of the vaccination program to guide policies and facilitate adjustments whenever necessary.

4.3. Limitations

This study was based on administrative and epidemiological surveillance registries; hence, we identified and minimized bias related to inherent quality and data representativeness as much as possible. The economic impact was analyzed using information from SISVEFLU, which, as per design, does not comply with the criteria for presenting a nation as a whole for the estimation of incidence. Therefore, the estimation of cases was based on the incidence rates reported by the Centers for Disease Control and Prevention (CDC), as described elsewhere [21].
When studying the population aged 12 to 49 years with risk factors for influenza complications, we did not include healthcare workers because there is no reliable information about current influenza vaccination coverage in this group.
For economic analysis, costs were estimated using the assumption that there would be no need to create an alternative mechanism for service provision, but rather that the strategies to improve the program would be implemented within the already existing one, an assumption that might underestimate the true cost of interventions. Additionally, official sources of information were used to analyze costs, and we were unable to account for indirect cost variations resulting from socioeconomic or other differences in the population. There is also the issue of comorbidity, which may have led to the overestimation of health and economic savings. We considered six risk factors separately (five comorbid conditions and pregnancy) and calculated the savings as if each risk factor corresponded to a single patient. However, as there are pathological associations, especially between diabetes mellitus, obesity, and hypertension, and in the case of a single patient having two or more concomitant risk factors, the savings would correspond to the cost of a single patient rather than two or more patients. In the present analysis, calculations were made to assess the individual pathologies separately, leading to an overestimation of savings. Finally, we recognize the absence of cost data from vaccine-related adverse events as a limitation of the study.

4.4. Relevance of the Study

To our knowledge, this is the first nationwide study conducted in the Latin America region to perform in-depth analyses of the epidemiology of influenza, its healthcare-related costs and the cost-effectiveness of a policy reform. Our results apply specifically to Mexico but are relevant for middle-income countries. Therefore, the present findings could contribute to the evaluation of current public health policies in other countries in the Latin America region and provide evidence and recommendations for strengthening vaccination programs by highlighting the core challenges to enhancing such programs.
Despite the advances in the region, vaccination policies still have important weaknesses; hence there is a need to identify and implement strategies to improve upon these shortcomings [44]. The authors hope that the results of this study will contribute, as a first approach, to applicable middle and long-term strategies in the Latin America region by way of a regionally coordinated health policy aimed towards joint progress and reduction of inequalities of vaccination programs among the countries of the region.

5. Conclusions

Our findings show that expanding universal vaccination coverage to all school-aged children (five to 11 years), increasing coverage in the population aged 12 to 49 years with risk factors, and expanding universal vaccination coverage to all adults aged 50 to 59 years could potentially result in significant health and economic benefits. These findings could be used as a major source of evidence for improving the Mexican vaccination policy. For that to be possible, the health care system should perform an in-depth feasibility analysis considering technical, funding and programmatic factors. Expanding vaccine access and making efforts to increase vaccine coverage are expected to benefit all levels of society, including vulnerable populations. Such expansion efforts should aim to provide equal access to vaccination as a tool for disease prevention without limitations of sex, socio-economic status and demographical conditions (e.g., the indigenous population with limited access to health care).

Supplementary Materials

The following are available online at https://www.mdpi.com/2076-393X/9/3/286/s1, Figure S1: A call for a reform of the influenza immunization program in Mexico: Epidemiologic and economic evidence for decision making; Text S1: ICD-10 codes used for case selection.

Author Contributions

Conceptualization, M.B.-C. and R.T.-C.; methodology, J.A.F.-L., R.S.-M., M.M.A.-C., and A.M.; formal analysis, M.B.-C., J.A.F.-L., R.S.-M., M.M.A.-C., A.M., and R.T.-C.; investigation, M.B.-C., J.A.F.-L., R.S.-M., M.M.A.-C., A.M., and R.T.-C.; resources, R.T.-C.; data curation, J.A.F.-L., M.M.A.-C., and A.M.; writing—original draft preparation, M.B.-C., J.A.F.-L., R.S.-M., A.M., and M.M.A.-C.; writing—review and editing, M.B.-C., J.A.F.-L., R.S.-M., M.M.A.-C., A.M., and R.T.-C.; supervision, R.T.-C.; project administration, R.T.-C.; funding acquisition, R.T.-C. All authors have read and agreed to the published version of the manuscript.

Funding

This research and the article processing charges were fully funded by Sanofi Pasteur.

Institutional Review Board Statement

Not applicable. The data used in this study were anonymized before analysis. Permission for use of the data from SISVEFLU was granted by Mexico’s General Directorate of Epidemiology (Ministry of Health) upon written request (DGE-DG-08137-2018).

Informed Consent Statement

Not applicable.

Data Availability Statement

All of the datasets generated and/or analyzed during the current study are available in the Bases de datos sobre defunciones (death databases) repository, http://www.dgis.salud.gob.mx/contenidos/basesdedatos/std_defunciones_gobmx.html (accessed on 20 February 2021), and the Egresos hospitalarios Secretaría de Salud (hospital discharges, Ministry of Health) repository, www.dgis.salud.gob.mx/contenidos/basesdedatos/da_egresoshosp_gobmx.html (accessed on 20 February 2021), with the exception of data from influenza cases obtained from SISVEFLU, which were analyzed with permission from Mexico’s General Directorate of Epidemiology (Ministry of Health) and are not publicly available in compliance with Mexico’s Personal Data Protection Law (http://www.diputados.gob.mx/LeyesBiblio/pdf/LFPDPPP.pdf (accessed on 20 February 2021)).

Conflicts of Interest

The authors declare no conflict of interest. The funder had no role in the design of the study; in the collection, analyses, or interpretation of data; in the writing of the manuscript, orin the decision to publish the results.

References

  1. Molinari, N.A.; Ortega-Sanchez, I.R.; Messonnier, M.L.; Thompson, W.W.; Wortley, P.M.; Weintraub, E.; Bridges, C.B. The annual impact of seasonal influenza in the US: Measuring burden of disease and costs. Vaccine 2007, 25, 5086–5096. [Google Scholar] [CrossRef] [PubMed]
  2. Savy, V.; Ciapponi, A.; Bardach, A.; Glujovsky, D.; Aruj, P.; Mazzoni, A.; Gibbons, L.; Ortega-Barria, E.; Colindres, R.E. Burden of influenza in Latin America and the Caribbean: A systematic review and meta-analysis. Influenza Other Respir. Viruses 2013, 7, 1017–1032. [Google Scholar] [CrossRef] [PubMed]
  3. World Health Organization. Available online: https://www.who.int/news-room/fact-sheets/detail/influenza-(seasonal) (accessed on 21 October 2020).
  4. Ehreth, J. The global value of vaccination. Vaccine 2003, 21, 596–600. [Google Scholar] [CrossRef]
  5. Centers for Disease Control and Prevention. Available online: http://www.cdc.gov/h1n1flu/highrisk.htm (accessed on 21 October 2020).
  6. Yang, K.C.; Hung, H.F.; Chen, M.K.; Chen, S.L.; Fann, J.C.; Chiu, S.Y.; Yen, A.M.F.; Huang, K.C.; Chen, H.H.; Wang, S.T.; et al. Cost-effectiveness analysis of universal influenza vaccination: Application of the susceptible-infectious-complication-recovery model. Int. J. Infect. Dis. 2018, 73, 102–108. [Google Scholar] [CrossRef] [Green Version]
  7. Leidner, A.J.; Murthy, N.; Chesson, H.W.; Biggerstaff, M.; Stoecker, C.; Harris, A.M.; Acosta, A.; Dooling, K.; Bridges, C.B. Cost-effectiveness of adult vaccinations: A systematic review. Vaccine 2019, 37, 226–234. [Google Scholar] [CrossRef]
  8. Secretaría de Salud [Ministry of Health]. Available online: https://www.gob.mx/salud/articulos/esquema-de-vacunacion (accessed on 21 October 2020). (In Spanish)
  9. Romero-Martínez, M.; Shamah-Levy, T.; Vielma-Orozco, E.; Heredia-Hernández, O.; Mojica-Cuevas, J.; Cuevas-Nasu, L.; Rivera-Dommarco, J.; Grupo de trabajo Ensanut 2018–19. Encuesta nacional de salud y nutrición 2019–19: Metodología y perspectivas [National health and nutrition survey 2018–19: Methodology and perspectives]. Salud Publica Mex. 2019, 61, 917–923. (In Spanish) [Google Scholar] [CrossRef]
  10. Mereckiene, J.; Cotter, S.; Nicoll, A.; Lopalco, P.; Noori, T.; Weber, J.; D’Ancona, F.; Levy-Bruhl, D.; Dematte, L.; Giambi, C.; et al. Seasonal influenza immunization in Europe. Overview of recommendations and vaccination coverage for 3 seasons: Pre-pandemic (2008/09), pandemic (2009/10) and post-pandemic (2010/11). Eurosurveillance 2014, 19, 20780. [Google Scholar] [CrossRef] [Green Version]
  11. Grohskopf, L.A.; Alyanak, E.; Broder, K.R.; Walter, E.B.; Fry, A.M.; Fernigan, D.B. Prevention and control of seasonal influenza with vaccines: Recommendations of the Advisory Committee on Immunization Practices–United States, 2019-20 influenza season. MMWR Recomm. Rep. 2019, 68, 121. [Google Scholar] [CrossRef] [Green Version]
  12. Nichol, K.L. Cost-effectiveness and socio-economic aspects of childhood influenza vaccination. Vaccine 2011, 29, 7554–7558. [Google Scholar] [CrossRef]
  13. Baguelin, M. Assessing optimal target populations for influenza vaccination programmes: An evidence synthesis and modelling study. PLoS Med. 2013, e1001527. [Google Scholar] [CrossRef]
  14. Skowronski, D.M.; Leir, S.; De Serres, G.; Murti, M.; Dickinson, J.A.; Winter, A.L.; Olsha, R.; Croxen, M.A.; Drews, S.J.; Charest, H.; et al. Children under 10 years of age were more affected by the 2018/19 influenza A(H1N1)pdm09 epidemic in Canada: Possible cohort effect following the 2009 influenza pandemic. Eurosurveillance 2019, 24, 15. [Google Scholar] [CrossRef]
  15. Mertz, D.; Kim, T.H.; Johnstone, J.; Lam, P.P.; Science, M.; Kuster, S.P.; Fadel, S.A.; Tran, D.; Fernandez, E.; Bhatnagar, N.; et al. Populations at risk for severe or complicated influenza illness: Systematic review and meta-analysis. BMJ 2013, 347, f5061. [Google Scholar] [CrossRef] [Green Version]
  16. Petrie, J.G.; Ohmit, S.E.; Cowling, B.J.; Johnson, E.; Cross, R.T.; Malosh, R.E.; Thompson, M.G.; Monto, A.S. Influenza transmission in a cohort of households with children: 2010-2011. PLoS ONE 2013, 8, e75339. [Google Scholar] [CrossRef] [Green Version]
  17. Weidemann, F.; Remschmidt, C.; Buda, S.; Buchholz, U.; Ultsch, B.; Wichmann, O. Is the impact of childhood influenza vaccination less than expected: A transmission modelling study. BMC Infect. Dis. 2017, 17, 258. [Google Scholar] [CrossRef] [Green Version]
  18. Pannaraj, P.S.; Want, H.L.; Rivas, H.; Wiryawan, H.; Smit, M.; Green, N.; Aldrovandi, G.M.; El Amin, A.N.; Mascola, L. School-located influenza vaccination decreases laboratory-confirmed influenza and improves school attendance. Clin. Infect. Dis. 2014, 59, 325–332. [Google Scholar] [CrossRef] [Green Version]
  19. Cowling, B.J.; Chan, K.H.; Feng, S.; Chan, E.L.Y.; Lo, J.Y.C.; Peiris, J.S.M.; Chiu, S.S. The effectiveness of influenza vaccination in preventing hospitalizations in children in Hong Kong, 2009–2013. Vaccine 2014, 32, 5278–5284. [Google Scholar] [CrossRef] [Green Version]
  20. O’Halloran, A.C.; Lu, P.J.; Williams, W.W.; Bridges, C.B.; Singleton, J.A. Influenza vaccination coverage among people with high-risk conditions in the US. Am. J. Prev. Med. 2016, 50, e15–e26. [Google Scholar] [CrossRef] [Green Version]
  21. Falcón-Lezama, J.A.; Saucedo-Martínez, R.; Betancourt-Cravioto, M.; Alfaro-Cortes, M.M.; Bahena-González, R.I.; Tapia-Conyer, R. Influenza in the school-aged population in Mexico: Burden of disease and cost-effectiveness of vaccination in children. BMC Infect. Dis. 2020, 20, 1–17. [Google Scholar] [CrossRef] [Green Version]
  22. Betancourt-Cravioto, M.; Falcón-Lezama, J.A.; Saucedo-Martínez, R.; Alfaro-Cortes, M.M.; Bahena-González, R.I.; Tapia-Conyer, R. Public health and economic benefits of influenza vaccination of the population aged 50 to 59 years without risk factors for influenza complications in Mexico. Vaccines 2021, 9, 188. [Google Scholar] [CrossRef]
  23. Sistema de Vigilancia Epidemiológica de Influenza SISVEFLU [Influenza Epidemiological Surveillance System SISVEFLU]. Available online: https://www.gob.mx/salud/iner/documentos/formato-sisveflu (accessed on 30 October 2020). (In Spanish).
  24. Secretaría de Salud–SEED [Ministry of Health–SEED]. Available online: http://www.dgis.salud.gob.mx/contenidos/basesdedatos/std_defunciones_gobmx.html (accessed on 21 October 2020). (In Spanish)
  25. Secretaría de Salud–SAEH [Ministry of Health–SAEH]. Available online: www.dgis.salud.gob.mx/contenidos/basesdedatos/da_egresoshosp_gobmx.html (accessed on 21 October 2020). (In Spanish)
  26. Consejo Nacional de Población–CONAPO [National Population Council–CONAPO]. Available online: https://datos.gob.mx/busca/dataset/proyecciones-de-la-poblacion-de-mexico-y-de-las-entidades-federativas-2016-2050 (accessed on 21 October 2020). (In Spanish)
  27. Centers for Disease Control and Prevention. Available online: https://www.cdc.gov/flu/about/burden/index.html (accessed on 21 October 2020).
  28. Dirección General de Epidemiología [General Directorate of Epidemiology]. Available online: https://epidemiologia.salud.gob.mx/gobmx/salud/documentos/manuales/12_Manual_VE_Influenza.pdf (accessed on 30 October 2020). (In Spanish).
  29. World Health Organization. Available online: https://icd.who.int/browse10/2016/en (accessed on 21 October 2020).
  30. Ryder, H.F.; McDonough, C.; Tosteson, A.N.A.; Lurie, J.D. Decision analysis and cost-effectiveness analysis. Semin. Spine Surg. 2009, 21, 216–222. [Google Scholar] [CrossRef] [Green Version]
  31. Secretaría de Salud [Ministry of Health]. Available online: https://ensanut.insp.mx/encuestas/ensanut2018/descargas.php (accessed on 21 October 2020). (In Spanish)
  32. Secretaría de salud [Ministry of Health]. Available online: http://www.dgis.salud.gob.mx/contenidos/basesdedatos/std_nacimientos_gobmx.html (accessed on 21 October 2020). (In Spanish)
  33. Institute for Health Metrics and Evaluation (IHME). Available online: http://www.healthdata.org/policy-report/findings-global-burden-disease-study-2017 (accessed on 21 October 2020).
  34. Secretaría de Hacienda y Crédito Público [Ministry of Finance and Public Credit]. Available online: ppef.hacienda.gob.mx/work/models/PPEF2020/paquete/egresos/Proyecto_Decreto.pdf (accessed on 30 October 2020). (In Spanish)
  35. WHO Guide to Cost-effectiveness Analysis. Available online: https://www.who.int/choice/publications/p_2003_generalised_cea.pdf (accessed on 11 November 2020).
  36. Centro Nacional de Excelencia Tecnológica en Salud (CENETEC), Secretaría de Salud [National Center for Technological Excellence in Health (CENETEC), Ministry of Health]. Available online: http://www.cenetec.salud.gob.mx/descargas/gpc/CatalogoMaestro/384_SS_09_influenza_estacional/EyR_SS_384_09.pdf (accessed on 21 October 2020). (In Spanish)
  37. Campos-Nonato, I.; Hernandez-Barrera, L.; Pedroza-Tobias, A.; Medina, C.; Barquera, S. Hypertension in Mexican adults: Prevalence, diagnosis and type of treatment. Ensanut MC 2016. Salud Publica Mex. 2018, 60, 233–243. [Google Scholar] [CrossRef] [Green Version]
  38. Basto-Abreu, A.; Barrientos-Gutierrez, T.; Rojas-Martinez, R.; Aguilar-Salinas, C.A.; Lopez-Olmedo, N.; De la Cruz-Gongora, V.; Rivera-Dommarco, J.; Shamah-Levy, T.; Romero-Martinez, M.; Barquera, S.; et al. Prevalence of diabetes and poor glycemic control in Mexico: Results from Ensanut 2016. Salud Publica Mex. 2020, 62, 50–59. [Google Scholar] [CrossRef]
  39. Nowak, G.J.; Cacciatore, M.A.; Len-Ríos, M.E. Understanding and increasing influenza vaccination acceptance: Insights from a 2016 national survey of US adults. Int. J. Environ. Res. Public Health 2018, 15, 711. [Google Scholar] [CrossRef] [Green Version]
  40. Nowak, G.J.; Sheedy, K.; Bursey, K.; Smith, T.M.; Basket, M. Promoting influenza vaccination: Insights from a qualitative meta-analysis of 14 years of influenza-related communications research by U.S. Centers for Disease Control and Prevention (CDC). Vaccine 2015, 33, 2741–2756. [Google Scholar] [CrossRef]
  41. Organización Panamericana de la Salud [Pan American Health Organization]. Available online: https://iris.paho.org/bitstream/handle/10665.2/49179/9789275316320_spa.pdf?sequence=1&isAllowed=y (accessed on 21 October 2020). (In Spanish).
  42. Danovaro, M.C. Immunization Registries in Latin America and the Caribbean. Pan American Health Organization; World Health Organization. Available online: https://www.who.int/immunization/research/forums_and_initiatives/01_Danovaro_GVIRF14_Concept_Outline_Landscape.pdf?ua=1 (accessed on 13 January 2021).
  43. Danovaro-Holliday, M.C.; Contreras, M.P.; Pinto, D.; Molina-Aguilera, I.B.; Miranda, D.; García, O.; Velandia-Gonzalez, M. Assessing electronic immunization registries: The Pan American Health Organization experience. Rev. Panam. Salud Publica 2019, 43, e28. [Google Scholar] [CrossRef]
  44. Tapia-Conyer, R.; Betancourt-Cravioto, M.; Saucedo-Martínez, R.; Motta-Murguía, L.; Gallardo-Rincón, H. Strengthening vaccination policies in Latin America: An evidence-based approach. Vaccine 2013, 31, 3826–3833. [Google Scholar] [CrossRef]
Figure 1. Scenarios for economic evaluation [21]. Based on data from the Influenza Epidemiological Surveillance System (SISVEFLU, as per its acronym in Spanish), eight health outcome scenarios were considered for estimating the costs of influenza cases. We took into consideration if patients did not request medical care (scenario 0), sought ambulatory care (scenarios 1 through 3), or sought hospital care (scenarios 4 through 7). Scenario 0: Symptomatic individual did not seek medical care, self-medicated with over-the-counter drugs, and had a complete recovery. Scenario 1: Symptomatic individual visited an outpatient clinic, had a positive polymerase chain reaction (PCR) result for influenza, was managed only in ambulatory care, and had a complete recovery. Scenario 2: Symptomatic individual visited an outpatient clinic, had a positive PCR result for influenza and was referred for hospital care due to severity, had a complete recovery, and was discharged. Scenario 3: Symptomatic individual visited an outpatient clinic, had a positive PCR result for influenza and was referred for hospital care due to severity, and died. Scenario 4: Symptomatic individual visited a hospital emergency room (ER), had a positive PCR result for influenza, was discharged to an outpatient clinic for follow-up, and had a complete recovery. Scenario 5: Symptomatic individual visited a hospital ER, had a positive PCR result for influenza, was admitted to hospital for follow-up with non-severe clinical status, and had a complete recovery. Scenario 6: Symptomatic individual visited a hospital ER, had a positive PCR result for influenza, was admitted for follow-up with severe clinical status, and had a complete recovery. Scenario 7: Symptomatic individual visited a hospital ER, had a positive PCR result for influenza, was admitted to hospital for follow-up, and died.
Vaccines 09 00286 g001
Figure 2. Confirmed influenza cases in Mexico from 2009 to 2018. (A) Confirmed cases of influenza per epidemiological week by season (2009–2018); (B) cases of influenza type A and B by epidemiological week (2009–2018). Different scales were used for influenza A and B.
Vaccines 09 00286 g002
Figure 3. Hospital discharges and average length of stay by age group (2010–2016). LOS = length of stay.
Vaccines 09 00286 g003
Figure 4. Influenza isolates in Mexico by month (2009–2018). (A) Proportion of influenza isolates by type, total cases, and deaths per month; (B) number of influenza isolates by type. The data used in this figure were obtained from Mexico’s influenza surveillance system, SISVEFLU.
Vaccines 09 00286 g004aVaccines 09 00286 g004b
Figure 5. Total number of confirmed cases and lethality rate of influenza (2009–2018). Lethality rate was defined as the proportion of deaths among people having a confirmed case of influenza. The data used in this figure were obtained from Mexico’s influenza surveillance system, SISVEFLU.
Vaccines 09 00286 g005
Figure 6. Distribution of observed risk factors. COPD = chronic obstructive pulmonary disease; CRF = chronic renal failure; HIV/AIDS = human immunodeficiency virus-acquired immune deficiency syndrome. The data used in this figure were obtained from Mexico’s influenza surveillance system, SISVEFLU.
Vaccines 09 00286 g006
Table 1. Sources of information on prevalence of risk factors in the Mexican population.
Disease
or Risk Factor
Age Group (Years)Source of Information for the Estimation of Prevalence
Diabetes20–59ENSANUT 2018; self-report of previous medical diagnosis with the following question:
3.1 Has any doctor told you that you are diabetic (or have high blood glucose)?
Uncontrolled hypertension20–59ENSANUT 2018; self-report of previous medical diagnosis with the following question:
4.1 Has any doctor told you that you have hypertension?
Determination of uncontrolled hypertension based on blood pressure measurement during the survey under these criteria: systolic blood pressure ≥ 140 mmHg and diastolic blood pressure ≥ 90 mmHg.
Morbid obesity20–59ENSANUT 2018; Body Mass Index (BMI) estimated from weight and height measurements.
B M I = W e i g h t   k g h e i g h t 2
Morbid obesity is considered as BMI ≥40 kg/m2.
Chronic renal failure20–59ENSANUT 2018; self-report of previous medical diagnosis with the following question:
6.1 Has any doctor ever told you that you have some kind of kidney disease, like kidney failure?
Asthma5–59Global Burden of Disease 2017; prevalence of asthma cases was obtained in 2017.
Pregnancy15–49SINAC 2017; total number of live births in 2017 was considered (latest year of available data) as proxy for pregnancy during the period of interest.
ENSANUT = Mexican National Health and Nutrition Surveys; SINAC = Mexico Births Information System.
Table 2. Prevalence of risk factors in different age group populations.
Age Group (Years)DiabetesUncontrolled HypertensionMorbid ObesityChronic Renal FailureAsthmaPregnancy
5–9NDNDNDND6.5ND
10–14NDNDNDND4.5ND
15–19NDNDNDND4.5397,395
20–240.41.13.350.34.1604,429
25–290.70.84.900.42.6514,830
30–342.01.84.940.32.2342,685
35–394.42.76.301.12.3163,567
40–447.35.46.100.52.338,175
45–4910.18.04.830.72.23419
50–5416.912.06.960.72.2ND
55–5919.412.86.401.42.3ND
Total6.75.15.31.03.22,064,500
Data sources are indicated in Table 1.
Table 3. Prescribed treatment per scenario.
ScenarioNo Medical CareOutpatient OnlyHospitalization:
Referred from
Outpatient Clinic
Hospitalization:
Admitted through ER
01234567
Health OutcomeNot
Demanding Medical Care
Outpatient OnlyHospitalizationOutpatientHospitalization
DischargeDeathNon-
Severe
SevereDeath
Clinical Diagnosis
 Outpatient consultations 1 111
 ER consultations 1 1111
 PCR 1 0.10.10.11111
Direct costs
 Outpatient consultations 1 1
 Specialist consultations 1 231234
 Amantadine 21
 Oseltamivir 2 1111111
 Paracetamol 211111111
 Bacteriologic culture 2 11 111
 Ceftriaxone 2 11 111
 Hospitalization days 18.328.312.458.3
Indirect costs
 Medical disability days 38 51526
 Years of life lost 3 X X
1 Data represent the number of consultations. 2 Data represent the number of prescriptions, unit purchased (over-the-counter medications) or culture tests ordered. 3 Estimation of the indicator (years of life lost) applies only to the populations in the scenarios indicated by X. Abbreviations: ER = emergency room; PCR = polymerase chain reaction. Data are the authors elaboration of data from Clinical Guidelines, Instituto Mexicano del Seguro Social (IMSS), Automated Hospital Discharge System (SAEH), and Influenza Epidemiological Surveillance System (SISVEFLU).
Table 4. Average weighted cost by institution (million USD).
Unit Cost2009–20102010–20112011–20122012–20132013–20142014–20152015–20162016–20172017–2018
Outpatient consultations331.74323.79332.10345.34356.53367.07384.25416.33443.64
Specialist consultations528.72512.30524.01544.56561.67578.31606.14657.76701.45
ER consultations362.78363.93375.38389.29403.43414.65429.28459.08484.20
Hospitalization days3147.493040.893112.413240.173340.333441.463618.093939.794214.67
Amantadine32.9534.0735.4736.8238.3039.3440.4542.9045.00
Oseltamivir81.1883.9487.4090.7294.3796.9499.67105.69110.87
Paracetamol2.822.862.963.063.183.263.353.563.73
Ceftriaxone8.378.618.959.309.669.9310.2210.8611.40
PCR1576.291641.951712.281776.731849.831899.511948.372059.962155.92
Bacteriologic culture147.42152.44158.71164.75171.37176.03181.00191.94201.34
These data were previously reported [22].
Table 5. Sources of information for seasonal influenza immunization coverage.
Disease or Risk Factor Age Group (Years)Source of Information for Estimation of Immunization Coverage
Diabetes20–59ENSANUT 2018; vaccine application self-report in the 2018–2019 season or vaccine application registered in the immunization card between September 2018 and date of survey
Uncontrolled hypertension20–59ENSANUT 2018; vaccine application self-report in the 2018–2019 season or vaccine application registered in the immunization card between September 2018 and date of survey
Morbid obesity20–59ENSANUT 2018; vaccine application self-report in the 2018–2019 season or vaccine application registered in the immunization card between September 2018 and date of survey
Chronic renal failure20–59ENSANUT 2018; vaccine application self-report in the 2018–2019 season or vaccine application registered in the immunization card between September 2018 and date of survey
Pregnancy15–49ENSANUT 2018; vaccine application self-report in the 2018–2019 season or vaccine application registered in the immunization card between September 2018 and date of survey
Asthma5–59ENSANUT 2018; vaccine application self-report in the 2018–2019 season or vaccine application registered in the immunization card between September 2018 and date of survey. As the survey does not include information on asthma, national prevalence was considered for this purpose
ENSANUT = Mexican National Health and Nutrition Surveys.
Table 6. Seasonal influenza immunization coverage in the 12 to 49 years old population with risk factors.
Age Group (Years)DiabetesUncontrolled HypertensionMorbid ObesityChronic Renal FailureAsthmaPregnancy
5–9NDNDNDND26.83ND
10–14NDNDNDND26.83ND
15–19NDNDNDND26.8314.6
20–2434.822.219.419.326.8314.6
25–2935.726.247.635.628.6610.6
30–3435.233.830.834.727.009.3
35–3933.635.223.826.728.357.2
40–4433.529.238.235.225.459.4
45–4936.040.323.739.027.406.6
50–5433.327.225.128.627.25ND
55–5938.633.035.949.528.44ND
Total35.332.130.734.927.49.1
ND = No data available for these groups. The source for these data is indicated in Table 5.
Table 7. Differentials in prevented influenza cases, deaths and associated events resulting from a 75% increase in vaccination coverage among the population aged 12 to 49 years with risk factors (assuming 50% vaccine efficacy).
Risk FactorDiabetesUncontrolled HypertensionMorbid ObesityChronic renal FailureAsthmaPregnancy
Current estimated
vaccination coverage (%) 1
35.332.130.734.927.49.1
Prevented influenza cases 82,59065,14665,362714270,83950,781
Prevented deaths12.810.419.45.11.71.1
Associated events
 Healthcare visits92,88773,78775,201761579,63654,521
 ER admissions32,09622,69619,474288622,53920,759
 Hospitalization32,21022,79119,549289122,57120,955
1 Details of seasonal influenza immunization coverage according to risk factors are provided in Table 6. ER = emergency room.
Table 8. Effectiveness of increasing influenza vaccination coverage to 75% compared to current vaccination coverage: results for the population with diabetes by age group.
Age
Group (Years)
Total Population
2018–2019
Estimated PrevalencePopulation with Risk FactorIncidence
of Influenza
(per 100,000)
Estimated Cases of InfluenzaEstimated Cases of Influenza with Current Vaccination CoverageEstimated Cases of Influenza with 75% Vaccination CoverageDifferential of Estimated Cases of Influenza Averted
20–2410,803,0510.443,2127050.5304725091904605
25–2910,174,6270.771,2227050.5502241353138997
30–349,367,6702187,3537050.513,20910,87882562622
35–398,848,8194.4389,3487050.527,45122,60617,1575449
40–448,391,6047.3612,5877050.543,19135,56726,9948573
45–497,678,04110.1775,4827050.554,67545,02534,17210,853
50–546,617,80616.91,118,40912,382.1138,483114,04186,55227,489
55–595,453,29519.41,057,93912,382.1130,995107,87581,87226,003
Total67,334,913 4,255,554 416,073342,636260,04682,590
Table 9. Effectiveness of increasing influenza vaccination coverage to 75% compared to current vaccination coverage: results for the population with uncontrolled hypertension by age group.
Age
Group (Years)
Total Population
2018–2019
Estimated PrevalencePopulation with Risk FactorIncidence
of Influenza
(per 100,000)
Estimated Cases of InfluenzaEstimated Cases of Influenza with Current Vaccination CoverageEstimated Cases of Influenza with 75% Vaccination CoverageDifferential of Estimated Cases of Influenza Averted
20–2410,803,0511.1121,9137050.58595721653721844
25–2910,174,6270.884,6957050.55971501337321281
30–349,367,6701.8170,5177050.512,02210,09375142579
35–398,848,8192.7240,8617050.516,98214,25610,6143643
40–448,391,6045.4450,7347050.531,77926,67919,8626817
45–497,678,0418.0613,4307050.543,25036,30827,0319277
50–546,617,80612.0796,41412,382.198,61382,78661,63321,152
55–595,453,29512.8698,58212,382.186,49972,61654,06218,554
Total67,334,913 3,177,147 303,713254,967189,82065,146
Table 10. Effectiveness of increasing influenza vaccination coverage to 75% compared to current vaccination coverage: results for the population with morbid obesity by age group.
Age
Group (Years)
Total Population
2018–2019
Estimated PrevalencePopulation with Risk FactorIncidence
of Influenza
(per 100,000)
Estimated Cases of InfluenzaEstimated Cases of Influenza with Current Vaccination CoverageEstimated cases of Influenza with 75% Vaccination CoverageDifferential of Estimated Cases of Influenza Averted
20–2410,803,0513.3361,8757050.525,51421,59815,9465651
25–2910,174,6274.9498,1087050.535,11929,72821,9497779
30–349,367,6704.9462,8057050.532,63027,62120,3947228
35–398,848,8196.3557,5887050.539,31333,27824,5718708
40–448,391,6046.1511,6427050.536,07330,53622,5467990
45–497,678,0414.8370,7267050.526,13822,12616,3365790
50–546,617,8067.0460,76812,382.157,05348,29535,65812,637
55–595,453,2956.4349,27612,382.143,24836,60927,0309579
Total67,334,912-3,572,788-295,088249,792184,43065,362
Table 11. Effectiveness of increasing influenza vaccination coverage to 75% compared to current vaccination coverage: results for the population with renal disease by age group.
Age
Group (Years)
Total Population
2018–2019
Estimated PrevalencePopulation with Risk FactorIncidence
of Influenza
(per 100,000)
Estimated Cases of InfluenzaEstimated Cases of Influenza with Current Vaccination CoverageEstimated Cases of Influenza with 75% Vaccination CoverageDifferential of Estimated Cases of Influenza Averted
20–2410,803,0510.327,0087050.5190415721190382
25–2910,174,6270.440,6997050.5286923691793575
30–349,367,6700.330,9137050.5218017991362437
35–398,848,8191.193,7977050.56613545941331326
40–448,391,6040.541,1197050.5289923931812581
45–497,678,0410.754,5147050.5384431732402771
50–546,617,8060.748,97212,382.16064500637901216
55–595,453,2951.474,71012,382.19251763657821855
Total67,334,913 411,732 35,62429,40722,2647143
Table 12. Effectiveness of increasing influenza vaccination coverage to 75% compared to current vaccination coverage: results for the population with asthma by age group.
Age
Group (Years)
Total Population
2018–2019
Estimated PrevalencePopulation with Risk FactorIncidence
of Influenza
(per 100,000)
Estimated Cases of InfluenzaEstimated Cases of Influenza with Current Vaccination CoverageEstimated Cases of Influenza with 75% Vaccination CoverageDifferential of Estimated Cases of Influenza Averted
5–911,045,9626.5718,2599602.768,97259,52343,10816,415
10–1411,131,8564.5500,9349602.748,10341,51330,06511,449
15–1911,048,3794.5497,1778581.842,66736,82226,66710,155
20–2410,803,0514.1437,8427050.530,87026,64119,2947347
25–2910,174,6272.6266,0057050.518,75516,18511,7224464
30–349,367,6702.2207,8867050.514,65712,64991613488
35–398,848,8192.3201,8707050.514,23312,28388963387
40–448,391,6042.3190,8377050.513,45511,61284093202
45–497,678,0412.2168,6027050.511,88710,25974302829
50–546,617,8062.2147,53112,382.118,26715,76511,4174348
55–595,453,2952.3127,41712,382.115,77713,61698613755
Total100,561,110 3,464,359 297,644256,867186,02770,839
Table 13. Effectiveness of increasing influenza vaccination coverage to 75% compared to current vaccination coverage: results for pregnant women by age group.
Age
Group (Years)
Total Population
2018–2019
Estimated PrevalencePopulation with Risk FactorIncidence
of Influenza
(per 100,000)
Estimated Cases of InfluenzaEstimated Cases of Influenza with Current Vaccination CoverageEstimated cases of Influenza with 75% Vaccination CoverageDifferential of Estimated Cases of Influenza Averted
15–1911,048,379361,1928581.830,99729,58719,37310,213
20–2410,803,051611,5327050.543,11641,15426,94814,207
25–2910,174,627542,5707050.538,25436,51323,90912,605
30–349,367,670363,0847050.525,59924,43516,0008435
35–398,848,819180,2447050.512,70812,13079434187
40–448,391,60445,1057050.53180303519881048
45–497,678,04136827050.526024816286
Total66,312,1912,107,409154,114147,10296,32150,781
Table 14. Differentials in the net costs of influenza-related healthcare resulting from a 75% increase in vaccination coverage over the current coverage in the population aged 12 to 49 years with risk factors (million USD).
CostsDiabetesUncontrolled HypertensionMorbid ObesityChronic Renal FailureAsthmaPregnancy
Direct costs
 Diagnosis−4.10−2.95−2.60−0.36−1.75−2.97
 Healthcare visits−3.79−2.87−2.75−0.32−1.76−2.98
 Medications−0.41−0.32−0.32−0.04−0.20−0.35
 Hospitalizations−33.06−23.06−19.85−2.66−13.01−22.08
 Vaccination5.524.455.170.543.535.39
Direct costs subtotal−35.84−24.75−20.35−2.84−13.19−22.99
Indirect costs
 Sick leave−7.47−5.44−4.98−0.60−3.15−5.35
 Premature death−1.14−0.93−1.85−0.46−0.09−0.16
Indirect costs subtotal−8.61−6.37−6.83−1.06−3.24−5.51
Total costs−44.45−31.12−27.18−3.90−16.43−28.5
Table 15. Preventable cases of influenza, associated events, and net costs from the expansion of universal coverage to the population aged five–11 years and 50–59 years.
5–11 Years50–59 YearsTotal
Preventions
 Influenza cases671,461199,500870,961
 Deaths151227
Events associated with preventable cases
 Healthcare visits262,812120,798383,610
 ER admission154,14333,024187,167
 Hospitalization97,63733,091130,728
Net costs
 Direct costs
 Diagnosis −13.27−4.37−17.64
 Healthcare visits−14.58−4.48−19.06
 Medications−2.59−0.77−3.36
 Hospitalizations−93.51−41.66−135.17
 Vaccination27.4210.5337.95
 Direct costs subtotal−96.53−40.75−137.28
 Indirect costs
 Sick leave−14.43−8.07−22.50
 Premature death−1.03−0.99−2.02
 Indirect costs subtotal−15.46−9.06−24.52
 Total costs−111.99−49.81−161.80
Net cost = costs − benefits. A negative cost value represents savings. ER = emergency room.
Publisher’s Note: MDPI stays neutral with regard to jurisdictional claims in published maps and institutional affiliations.

