
Public Health and Economic Benefits of Influenza Vaccination of the Population Aged 50 to 59 Years without Risk Factors for Influenza Complications in Mexico: A Cross-Sectional Epidemiological Study

Abstract
:1. Introduction
2. Materials and Methods
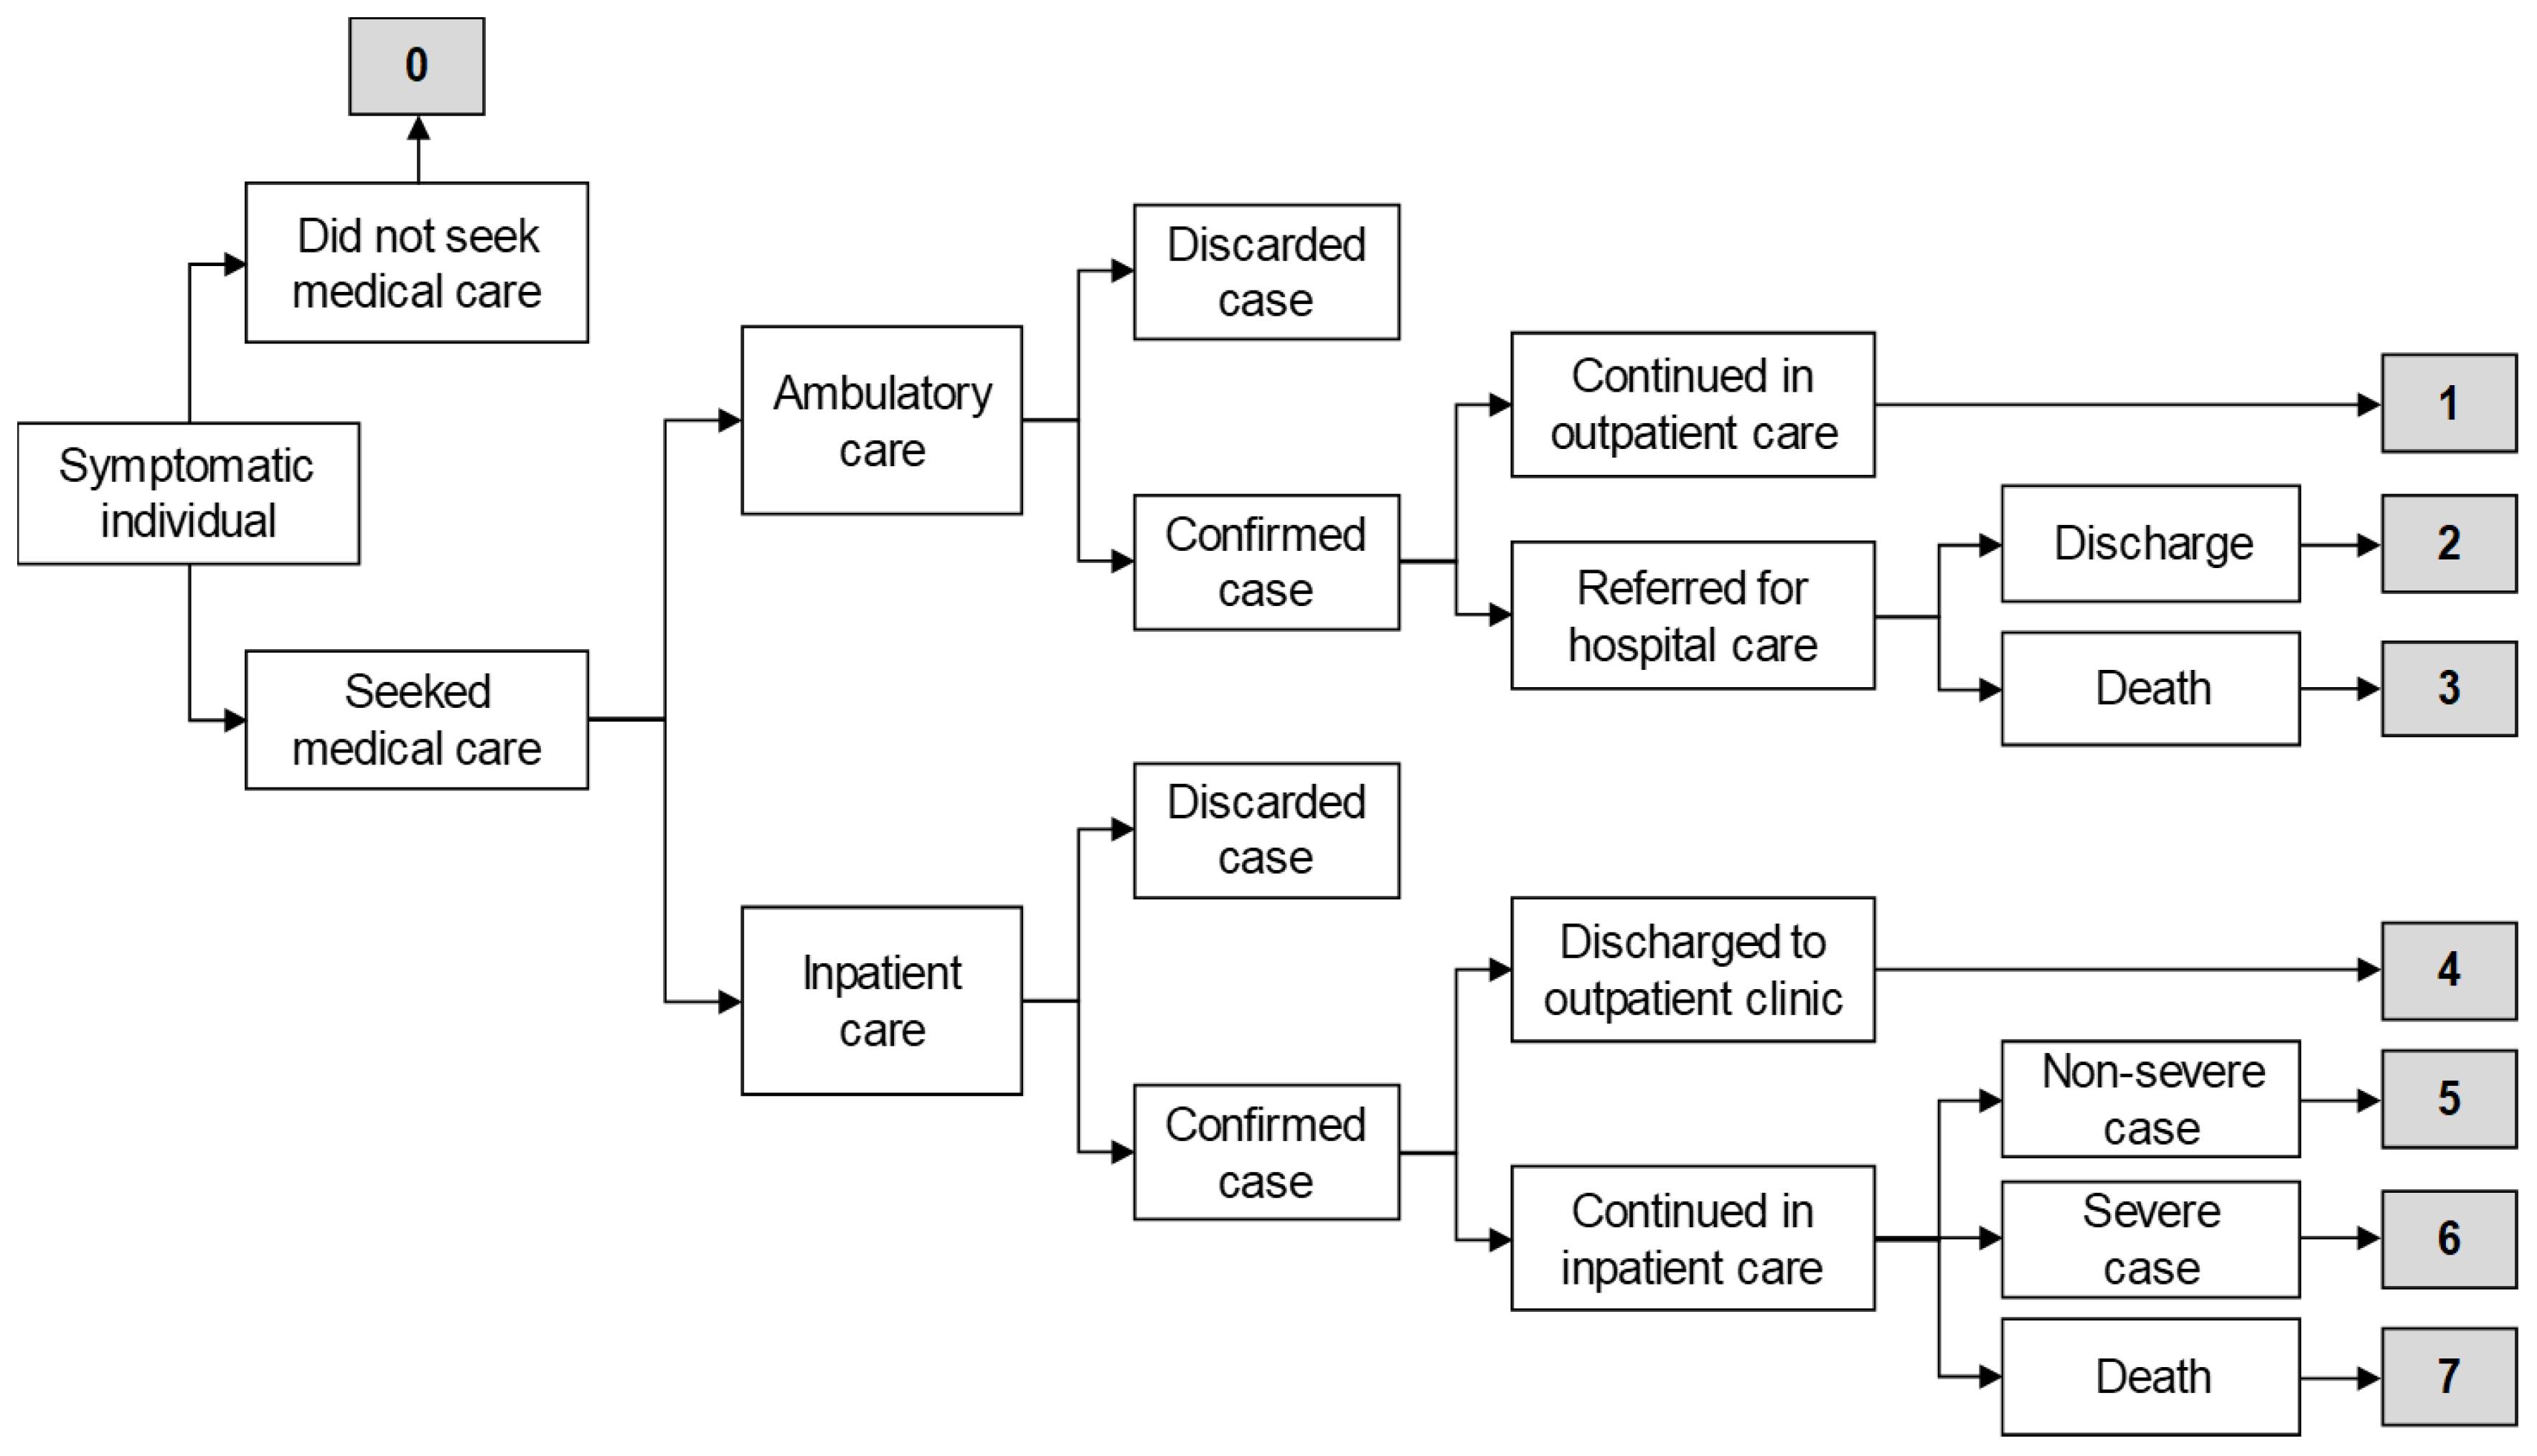
2.1. Case Classifications
- Scenario 0: Symptomatic individual did not seek medical care, self-medicated with over-the-counter drugs, and had a complete recovery.
- Scenario 1: Symptomatic individual visited an outpatient clinic, had a positive PCR result for influenza, was managed only in ambulatory care, and had a complete recovery.
- Scenario 2: Symptomatic individual visited an outpatient clinic, had a positive PCR result for influenza and was referred for hospital care due to severity, had a complete recovery, and was discharged.
- Scenario 3: Symptomatic individual visited an outpatient clinic, had a positive PCR result for influenza and was referred for hospital care due to severity, and died.
- Scenario 4: Symptomatic individual visited a hospital emergency room (ER), had a positive PCR result for influenza, was discharged to an outpatient clinic for follow-up, and had a complete recovery.
- Scenario 5: Symptomatic individual visited a hospital ER, had a positive PCR result for influenza, was admitted to hospital for follow-up with non-severe clinical status, and had a complete recovery.
- Scenario 6: Symptomatic individual visited a hospital ER, had a positive PCR result for influenza, was admitted for follow-up with severe clinical status, and had a complete recovery.
- Scenario 7: Symptomatic individual visited a hospital ER, had a positive PCR result for influenza, was admitted to hospital for follow-up, and died.
2.2. Laboratory Diagnosis
2.3. Medical Consultations
2.4. Drugs
2.5. Days of Hospitalization
2.6. Days of Medical Disability Leave
2.7. Years of Life Lost
2.8. National Estimates of Influenza Cases
2.9. Estimation of the Population Without Risk Factors for Influenza Complications
2.10. Unit Costs for the Estimation of Economic Burden of Influenza
2.11. Costs of Vaccination
2.12. Vaccine Coverage and Effectiveness
2.13. Influenza Outcomes
2.14. Sensitivity Analysis
3. Results
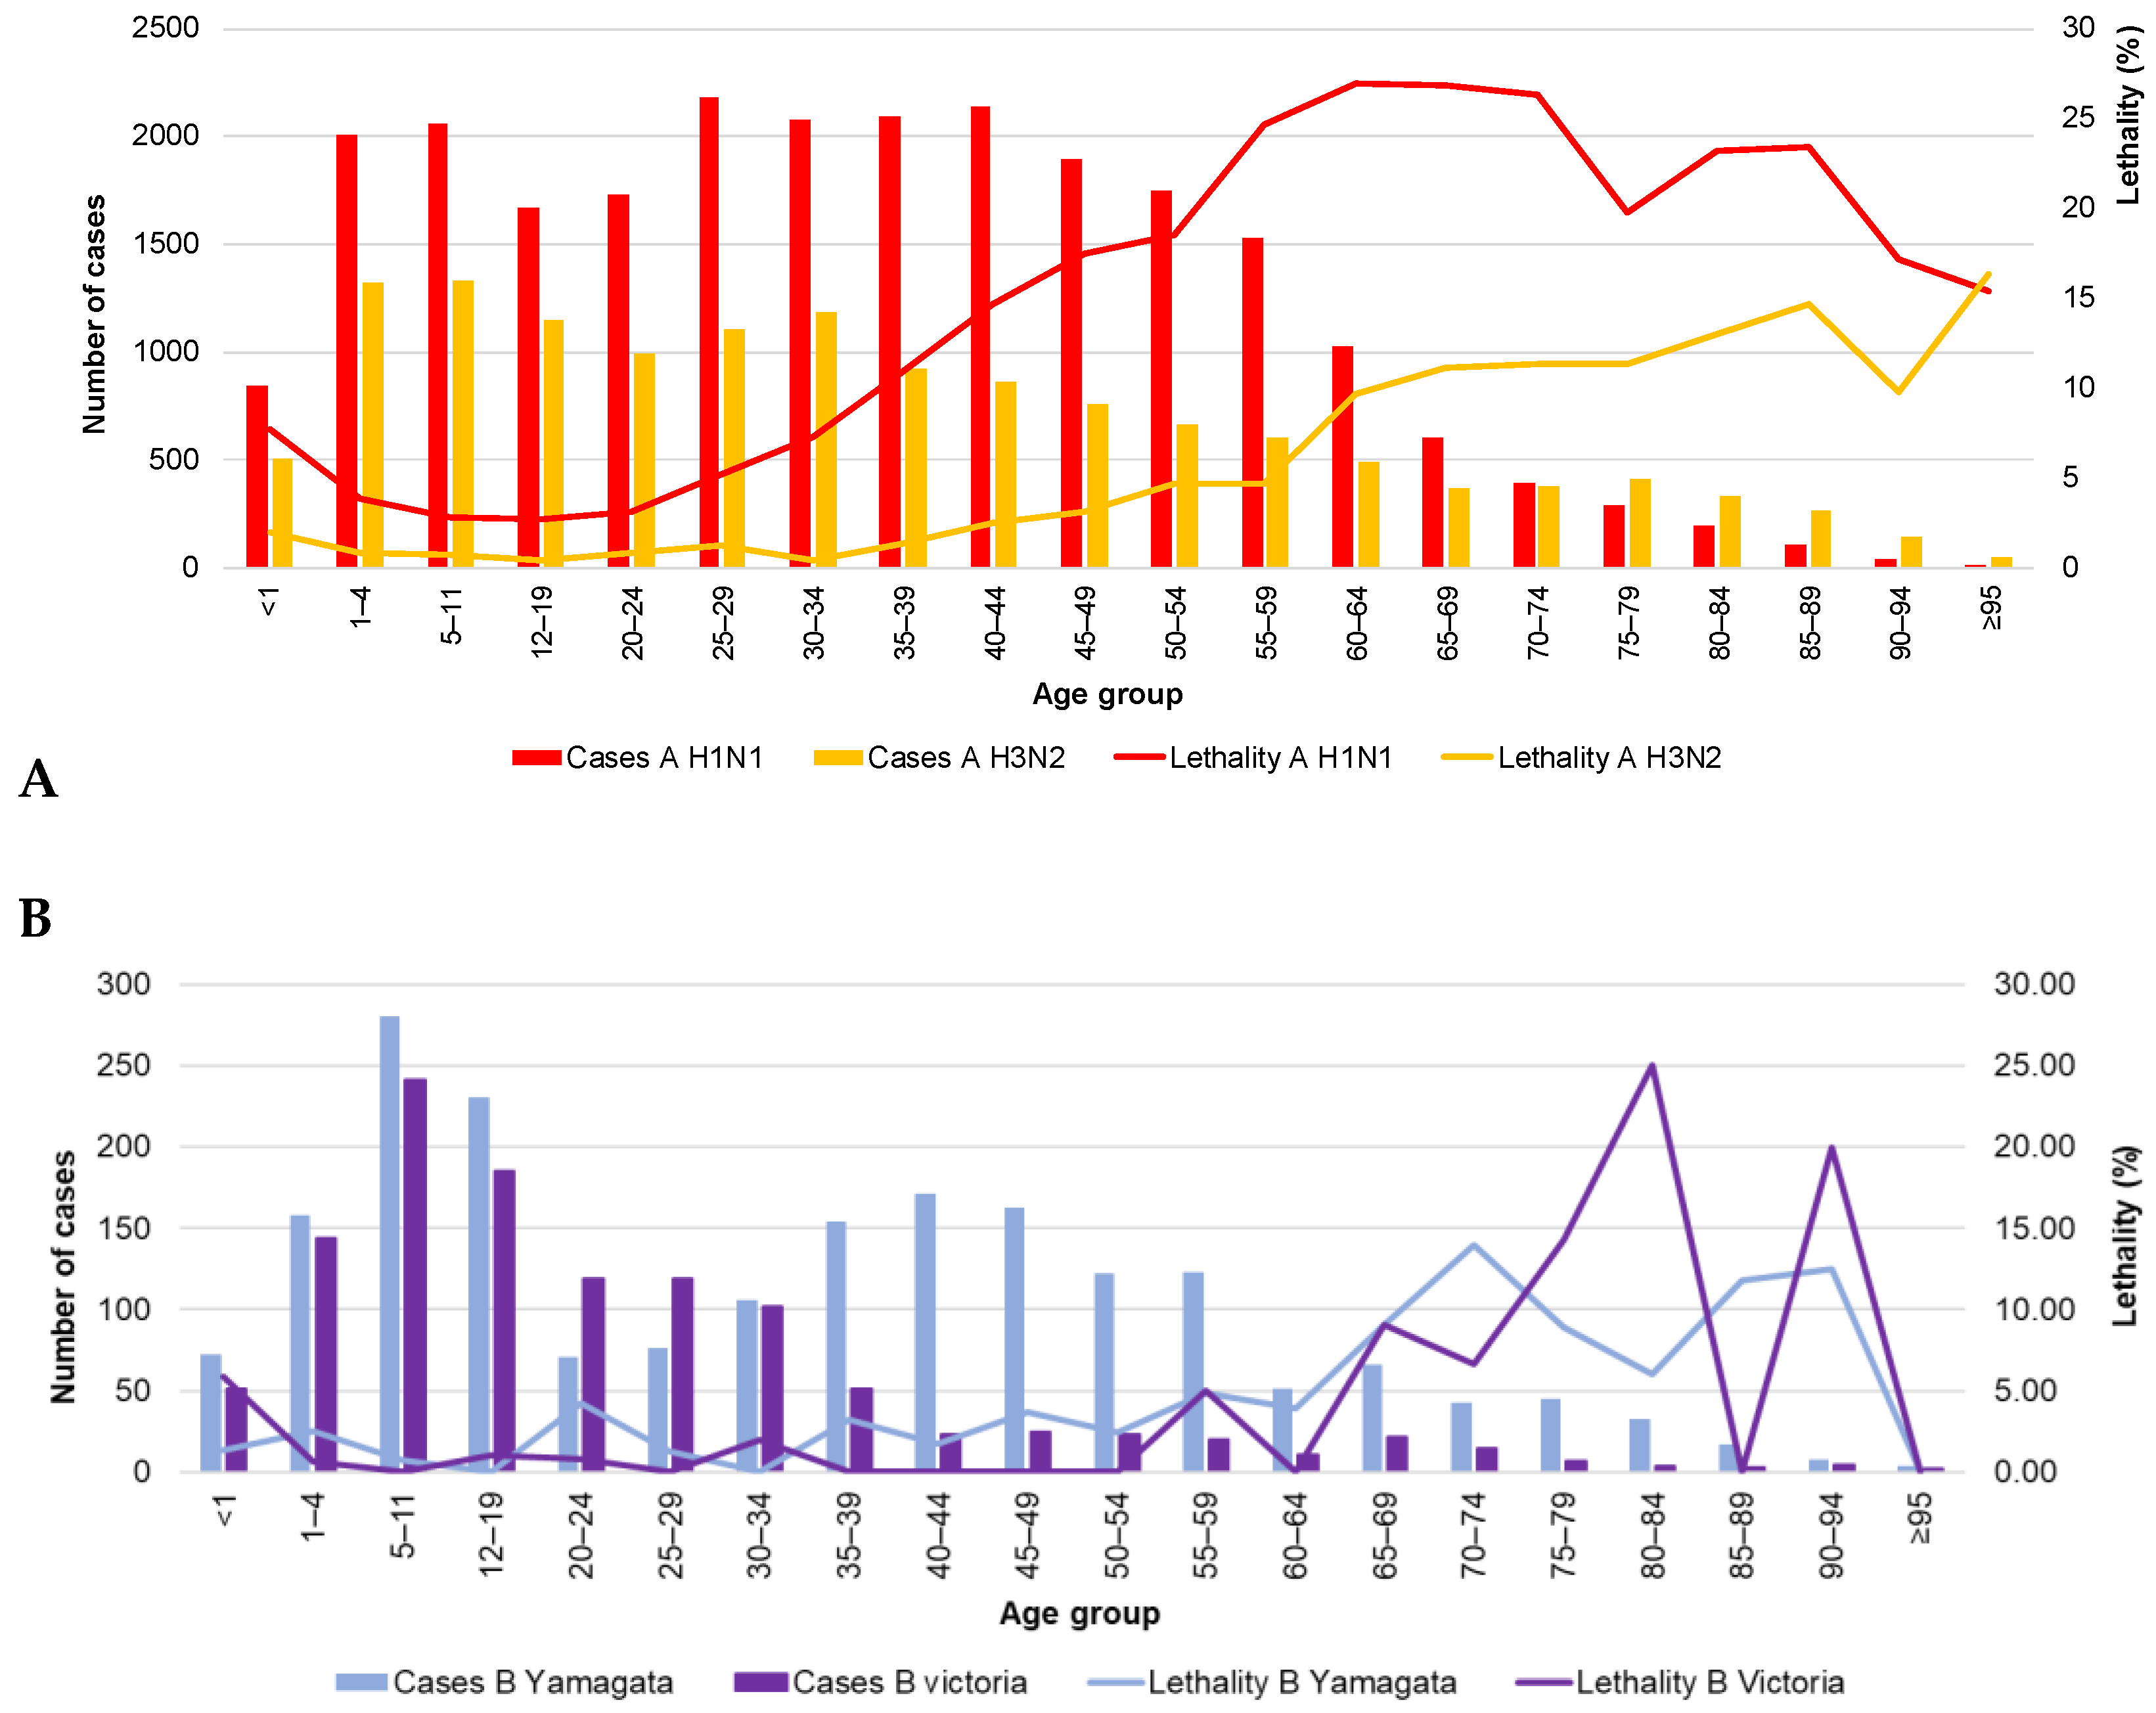
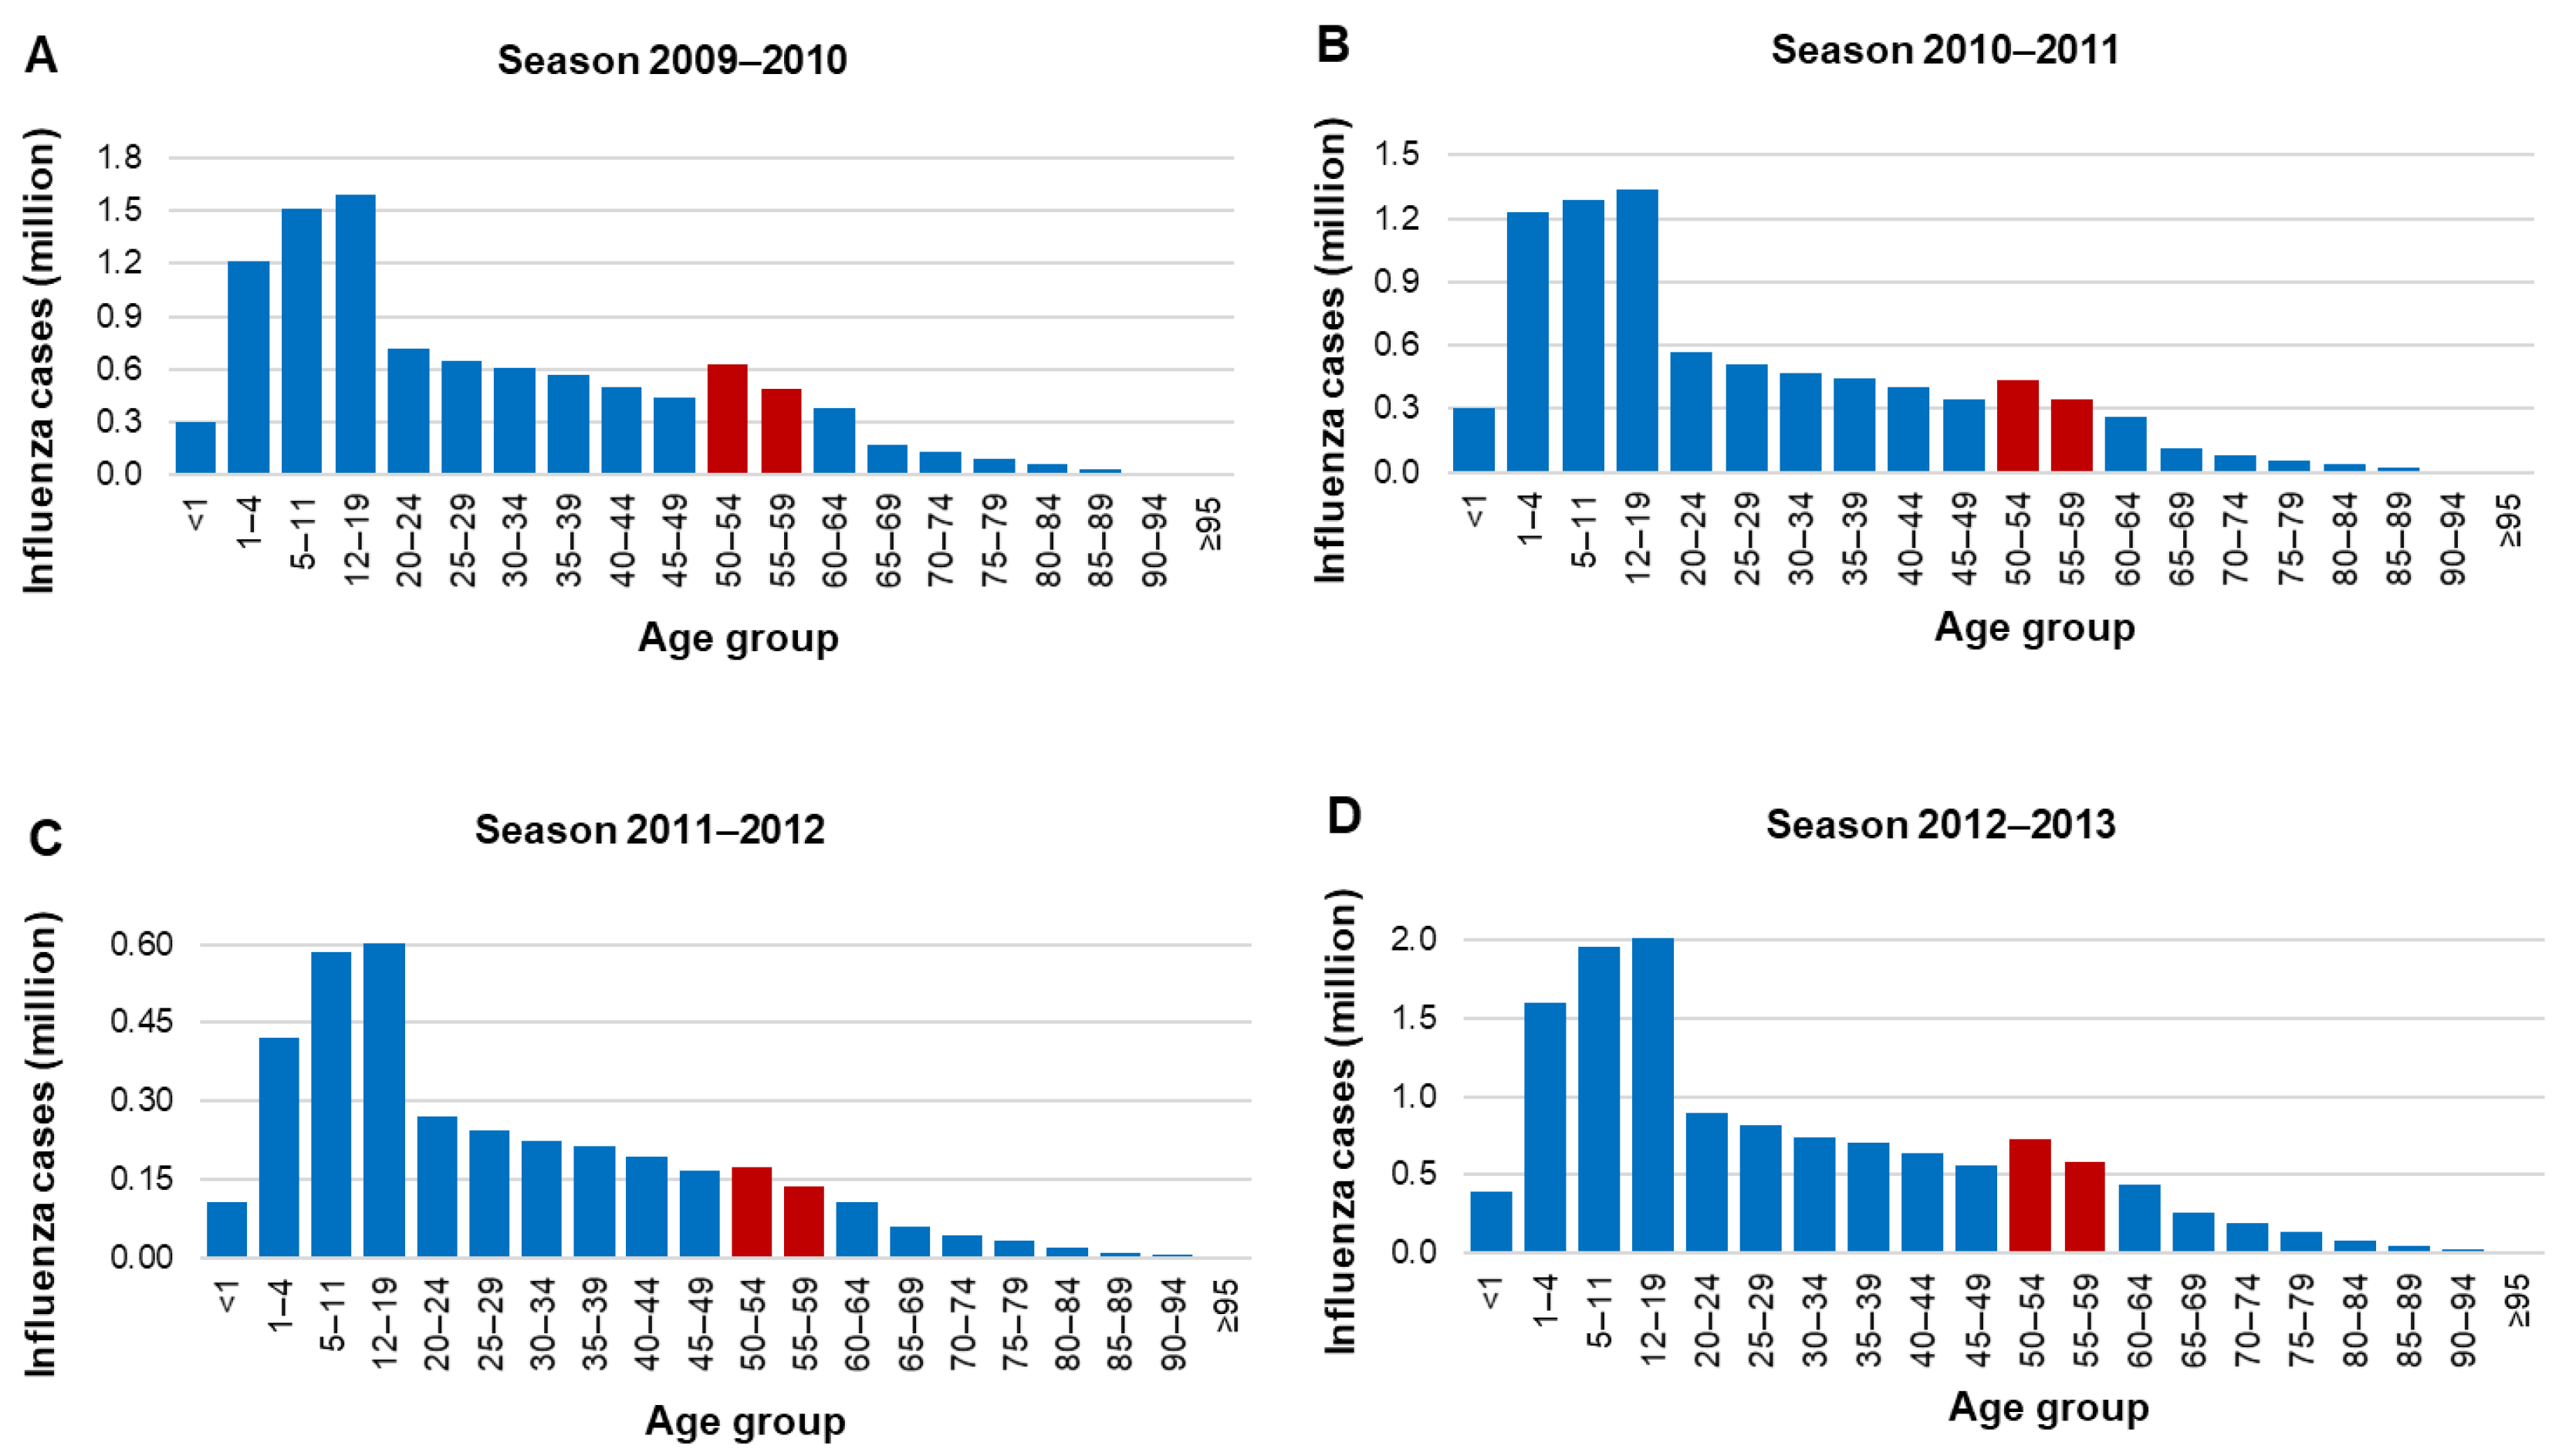
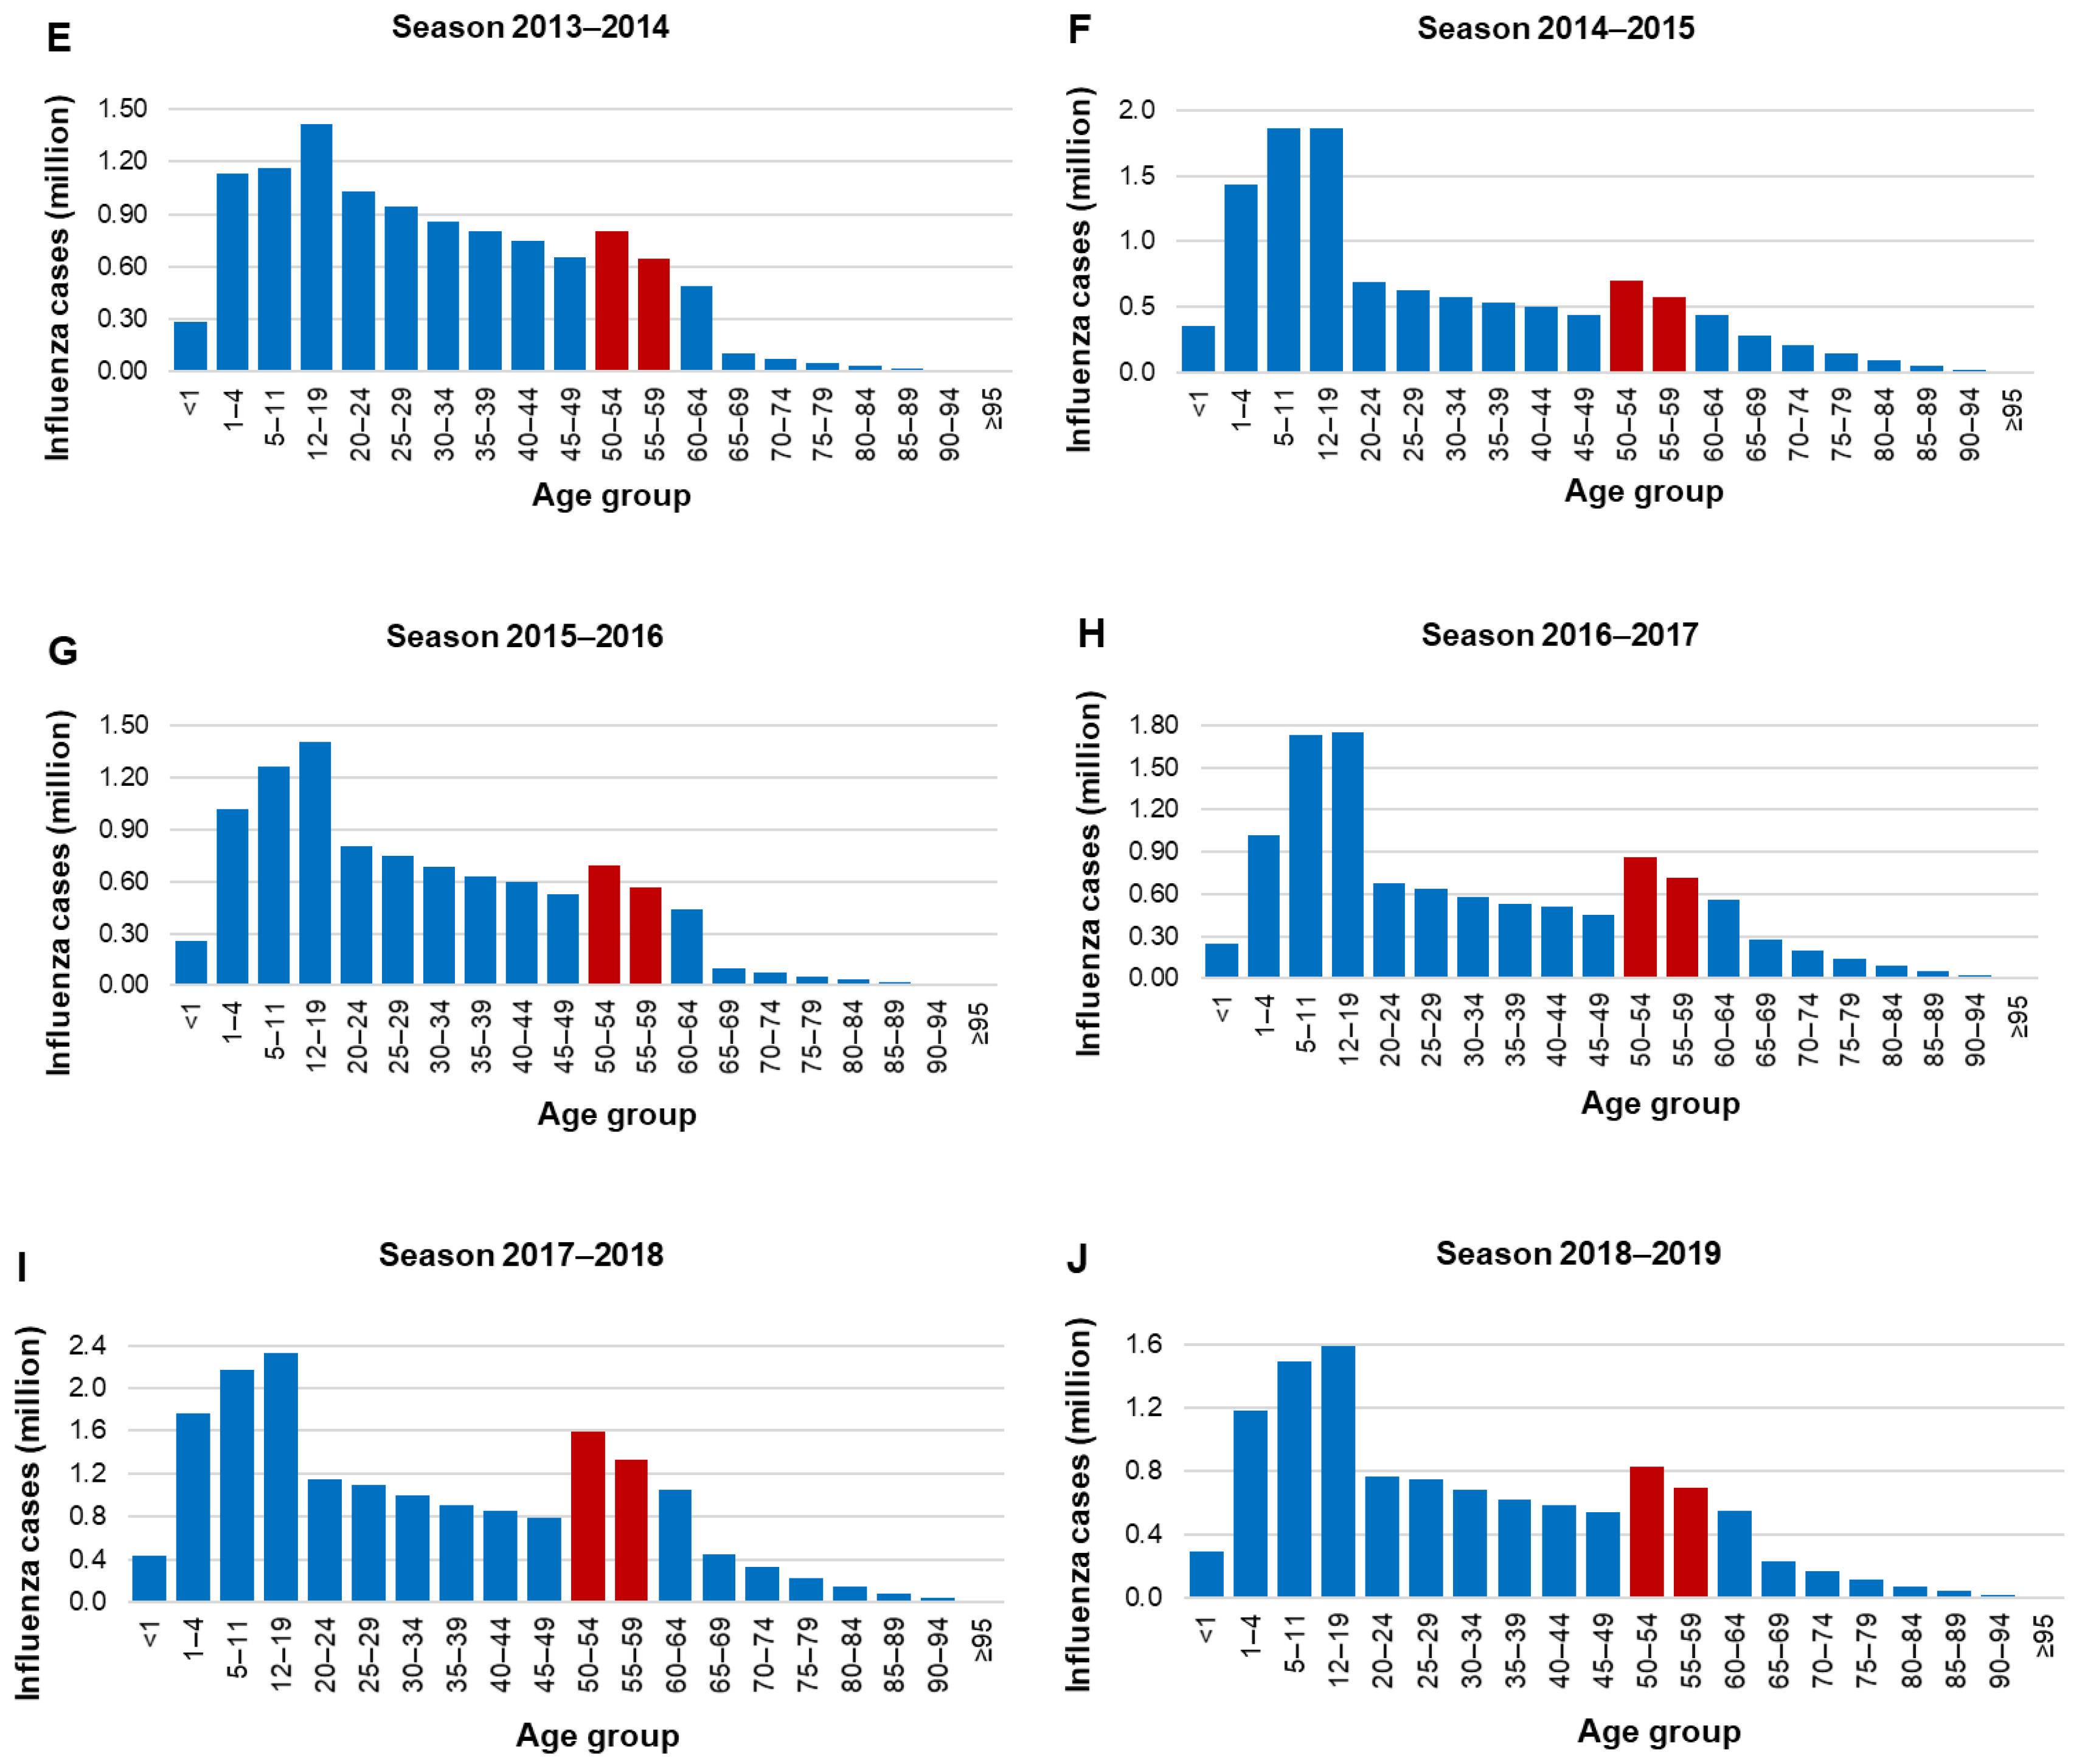
3.1. Epidemiology
3.2. Hospital Discharges
3.3. Mortality
3.4. Cost-Effectiveness
3.5. Sensitivity Analysis
4. Discussion
5. Conclusions
Supplementary Materials
Author Contributions
Funding
Institutional Review Board Statement
Informed Consent Statement
Data Availability Statement
Acknowledgments
Conflicts of Interest
References
- Putri, W.C.W.S.; Muscatello, D.J.; Stockwell, M.S.; Newall, A.T. Economic burden of seasonal influenza in the United States. Vaccine 2018, 36, 3960–3966. [Google Scholar] [CrossRef] [PubMed]
- World Health Organization. Seasonal Influenza Fact Sheet. 2018. Available online: https://www.who.int/news-room/fact-sheets/detail/influenza-(seasonal) (accessed on 4 January 2020).
- Savy, V.; Ciapponi, A.; Bardach, A.; Glujovsky, D.; Aruj, P.; Mazzoni, A.; Gibbons, L.; Ortega-Barría, E.; Colindres, R.E. Burden of influenza in Latin America and the Caribbean: A systematic review and meta-analysis. Influenza Other Respir. Viruses 2013, 7, 1017–1032. [Google Scholar] [CrossRef]
- Barberis, I.; Myles, P.; Ault, S.K.; Bragazzi, N.L.; Martini, M. History and evolution of influenza control through vaccination: From the first monovalent vaccine to universal vaccines. J. Prev. Med. Hyg. 2016, 57, E115–E120. [Google Scholar] [CrossRef]
- Hannoun, C. The evolving history of influenza viruses and influenza vaccines. Expert Rev. Vaccines 2013, 12, 1085–1094. [Google Scholar] [CrossRef] [PubMed]
- Bouvier, N.M. The future of influenza vaccines: A historical and clinical perspective. Vaccines 2018, 6, 58. [Google Scholar] [CrossRef] [PubMed] [Green Version]
- Kostova, D.; Reed, C.; Finelli, L.; Cheng, P.Y.; Gargiullo, P.M.; Shay, D.K.; Singleton, J.A.; Meltzer, M.I.; Lu, P.J.; Bresee, J.S. Influenza illness and hospitalizations averted by influenza vaccination in the United States; 2005–2011. PLoS ONE 2013, 8, e66312. [Google Scholar] [CrossRef]
- Doyon-Plourde, P.; Fakih, I.; Tadount, F.; Fortin, É.; Quach, C. Impact of influenza vaccination on healthcare utilization—A systematic review. Vaccine 2019, 37, 3179–3189. [Google Scholar] [CrossRef]
- Yang, K.C.; Hung, H.F.; Chen, M.K.; Chen, S.L.; Fann, J.C.; Chiu, S.Y.; Yen, A.M.F.; Huang, K.C.; Chen, H.H.; Wang, S.T. Cost-effectiveness analysis of universal influenza vaccination: Application of the susceptible-infectious-complication-recovery model. Int. J. Infect. Dis. 2018, 73, 102–108. [Google Scholar] [CrossRef] [Green Version]
- Leidner, A.J.; Murthy, N.; Chesson, H.W.; Biggerstaff, M.; Stoecker, C.; Harris, A.M.; Acosta, A.; Dooling, K.; Bridges, C.B. Cost-effectiveness of adult vaccinations: A systematic review. Vaccine 2019, 37, 226–234. [Google Scholar] [CrossRef]
- World Health Organization. International Travel and Health—Seasonal Influenza. 2020. Available online: https://www.who.int/ith/vaccines/seasonal_influenza/en/ (accessed on 11 November 2020).
- Centers for Disease Control and Prevention. Prevention and Control of Seasonal Influenza with Vaccines; 2019-20. Available online: https://www.cdc.gov/flu/professionals/acip/index.htm (accessed on 4 January 2020).
- Ministerio de Salud (MINSA) de Panama. Esquema Nacional de Vacunación 2017; Ministry of Health of Panama: Panama City, Panama, 2017. Available online: http://www.minsa.gob.pa/sites/default/files/programas/esquema_nacional_de_vacunacion_2017_1.pdf (accessed on 23 January 2020).
- Ministerio de Salud. Puesta al día Calendario de Vacunación [Vaccination Calendar Update]. Available online: https://diprece.minsal.cl/wp-content/uploads/2019/07/PNI-2019.pdf (accessed on 21 January 2020).
- European Center for Disease Prevention and Control. Seasonal Influenza Vaccination in Europe. 2017. Available online: https://www.ecdc.europa.eu/sites/portal/files/documents/influenza-vaccination-2007%E2%80%932008-to-2014%E2%80%932015.pdf (accessed on 4 January 2020).
- European Center for Disease Prevention and Control. Seasonal Influenza Vaccination and Antiviral Use in EU/EEA Member States. 2018. Available online: https://www.ecdc.europa.eu/sites/portal/files/documents/Seasonal-influenza-antiviral-use-EU-EEA-Member-States-December-2018_0.pdf (accessed on 4 January 2020).
- European Center for Disease Prevention and Control. Influenza: Recommended Vaccinations. 2019. Available online: https://vaccine-schedule.ecdc.europa.eu/Scheduler/ByDisease?SelectedDiseaseId=15&SelectedCountryIdByDisease=-1 (accessed on 4 January 2020).
- Gomez-Dantes, O.; Sesma, S.; Becerril, V.M.; Knaul, F.M.; Arreola, H.; Frenk, J. Sistema de salud de México [Mexican health system]. Salud Pública Méx. 2011, 53, 220–232. [Google Scholar]
- World Health Organization. WHO Vaccine-Preventable Diseases: Monitoring System. 2019 Global Summary. Available online: https://apps.who.int/immunization_monitoring/globalsummary/schedules (accessed on 4 January 2020).
- Valcárcel Nazco, C.; García Lorenzo, B.; Del Pino Sedeño, T.; García Pérez, L.; Brito García, N.; Linertová, R.; Rodríguez, J.F.; Iglesia, I.I.; Aguilar, P.S. Cost-effectiveness of vaccines for the prevention of seasonal influenza in different age groups: A systematic review. Rev. Esp. Salud. Publica 2018, 92, e201810075. [Google Scholar]
- De Waure, C.; Veneziano, M.A.; Cadeddu, C.; Capizzi, S.; Specchia, M.L.; Capri, S.; Ricciardi, W. Economic value of influenza vaccination. Hum. Vaccin. Immunother. 2012, 8, 119–129. [Google Scholar] [CrossRef] [PubMed] [Green Version]
- Dabestani, N.M.; Leidner, A.J.; Seiber, E.E.; Kim, H.; Graitcer, S.B.; Foppa, I.M.; Bridges, C.B. A review of the cost-effectiveness of adult influenza vaccination and other preventive services. Prev. Med. 2019, 26, 105734. [Google Scholar] [CrossRef] [PubMed]
- Secretaría de Salud–SEED. Bases de Datos Sobre Defunciones. [Mortality Databases]. Available online: http://www.dgis.salud.gob.mx/contenidos/basesdedatos/std_defunciones_gobmx.html (accessed on 18 January 2019).
- Secretaría de Salud–SAEH. Egresos Hospitalarios Secretaría de Salud. [Hospital Discharges Ministry of Health]. Available online: www.dgis.salud.gob.mx/contenidos/basesdedatos/da_egresoshosp_gobmx.html (accessed on 4 January 2020).
- World Health Organization. International Statistical Classification of Disease and Related Health Problems. 10th Revision (ICD-10). Available online: https://icd.who.int/browse10/2016/en (accessed on 4 January 2020).
- Consejo Nacional de Población–CONAPO. Proyecciones de la Población de México y de las Entidades Federativas, 2016–2050 [Projections of the Population of Mexicao and the Federal Entities, 2016–2050]. Available online: https://datos.gob.mx/busca/dataset/proyecciones-de-la-poblacion-de-mexico-y-de-las-entidades-federativas-2016-2050 (accessed on 18 January 2019).
- Dirección General de Epidemiología. Manual para la Vigilancia Epidemiológica de Influenza [Manual for Epidemiological Influenza Surveillance]. 2014. Available online: http://187.191.75.115/gobmx/salud/documentos/manuales/12_Manual_VE_Influenza.pdf (accessed on 4 January 2020).
- Instituto de Diagnóstico y Referencia Epidemiológicos. Lineamientos para la Vigilancia Epidemiológica de Influenza. [Guidelines for Epidemiological Surveillance of Influenza]. 2017. Available online: http://www.ssm.gob.mx/portal/page/influenza/LINEAMIENTOS%20DE%20INFLUENZA.pdf (accessed on 4 January 2020).
- Falcón-Lezama, J.A.; Saucedo-Martínez, R.; Betancourt-Cravioto, M.; Alfaro-Cortes, M.M.; Bahena-González, R.I.; Tapia-Conyer, R. Influenza in the school-aged population in Mexico: Burden of disease and cost-effectiveness of vaccination in children. BMC Infect. Dis. 2020, 20, 1–17. [Google Scholar] [CrossRef] [PubMed] [Green Version]
- Centro Nacional de Excelencia Tecnológica en Salud (CENETEC); Secretaría de Salud. Prevención Diagnóstico y Tratamiento de la Influenza Estacional: Evidencias y Recomendaciones. [Prevention; Diagnosis and Treatment of Seasonal Influenza: Evidence and Recommendations]. Catálogo Maestro de Guías de Práctica Clínica. 2015; SS-384-09. Available online: http://www.cenetec.salud.gob.mx/descargas/gpc/CatalogoMaestro/384_SS_09_influenza_estacional/EyR_SS_384_09.pdf (accessed on 24 September 2019).
- Instituto Mexicano del Seguro Social. Dirección de Prestaciones Médicas. Recomendaciones para Trabajadores IMSS ante el Virus de Influenza AH1N1. [Directorate of Medical Benefits. Recommendations for IMSS Workers for the AH1N1 Influenza Virus]. 2013. Available online: http://www.imss.gob.mx/sites/all/statics/pdf/profesionales-salud/Guia_influenza.pdf (accessed on 4 January 2020).
- Acharya, A.; Adam, T.; Baltussen, R.M.P.M.; Barendregt, J.J.; Brock, D.; Charette, C.; Chisholm, D.H.; Evans, D.B.; Gribble, S.; Hutubessy, R.C.W.; et al. Discounting. In WHO Guide to Cost-Effectiveness Analysis; Tan-Torres, T., Baltussen, R., Adam, T., Hutubessy, R., Acharya, D.B., Murray, C.J.L., Eds.; World Health Organization: Geneva, Switzerland, 2003; pp. 67–72. Available online: https://www.who.int/choice/publications/p_2003_generalised_cea.pdf (accessed on 11 November 2020).
- Centers for Disease Control and Prevention. Disease Burden of Influenza. 2018. Available online: https://www.cdc.gov/flu/about/burden/index.html (accessed on 4 January 2020).
- Molinari, N.A.; Ortega-Sanchez, I.R.; Messonnier, M.L.; Thompson, W.W.; Wortley, P.M.; Weintraub, E.; Bridges, C.B. The annual impact of seasonal influenza in the US: Measuring disease burden and costs. Vaccine 2007, 25, 5086–5096. [Google Scholar] [CrossRef] [PubMed]
- Ruiz-Palacios, G.M.; Beigel, J.H.; Guerrero, M.L.; Bellier, L.; Tamayo, R.; Cervantes, P.; Alvarez, F.P.; Galindo-Fraga, A.; Aguilar-Ituarte, F.; Lopez, J.G. Public health and economic impact of switching from a trivalent to a quadrivalent inactivated influenza vaccine in Mexico. Hum. Vaccin. Immunother. 2019, 18, 1–9. [Google Scholar] [CrossRef] [Green Version]
- Van der Molen, T.; Miravitlles, M.; Kocks, J.W. COPD management: Role of symptom assessment in routine clinical practice. Int. J. Chron. Obstruct. Pulmon. Dis. 2013, 8, 461–471. [Google Scholar] [CrossRef] [PubMed] [Green Version]
- Balzi, D.; Barchielli, A.; Buiatti, E.; Franceschini, C.; Lavecchia, R.; Monami, M.; Santoro, G.M.; Carrabba, N.; Margheri, M.; Olivotto, I.; et al. Effect of comorbidity on coronary reperfusion strategy and long-term mortality after acute myocardial infarction. Am. Heart J. 2006, 151, 1094–1100. [Google Scholar] [CrossRef]
- Longmore, R.B.; Spertus, J.A.; Alexander, K.P.; Gosch, K.; Reid, K.J.; Masoudi, F.A.; Krumholz, H.M.; Rich, M.W. Angina frequency after myocardial infarction and quality of life in older versus younger adults: The Prospective Registry Evaluating Myocardial Infarction: Event and Recovery study. Am. Heart J. 2011, 161, 631–638. [Google Scholar] [CrossRef]
- Nguyen, N.T.; Nguyen, X.M.; Lane, J.; Wang, P. Relationship between obesity and diabetes in a US adult population: Findings from the National Health and Nutrition Examination Survey, 1999–2006. Obes. Surg. 2011, 21, 351–355. [Google Scholar] [CrossRef] [Green Version]
- Fraser, S.D.; Roderick, P.J.; May, C.R.; McIntyre, N.; McIntyre, C.; Fluck, R.J.; Shardlow, A.; Taal, M.W. The burden of comorbidity in people with chronic kidney disease stage 3: A cohort study. BMC Nephrol. 2015, 16, 193. [Google Scholar] [CrossRef] [Green Version]
- Instituto Nacional de Estadística y Geografía (INEGI). Encuesta Nacional de Ingresos y Gastos en los Hogares. [National Survey of Household Income and Expenditure]. Available online: https://www.inegi.org.mx/contenidos/programas/enigh/nc/2018/doc/enigh2018_ns_presentacion_resultados.pdf (accessed on 4 January 2020).
- Gutiérrez, J.P.; Bertozzi, S.M. Influenza vaccination in the elderly population in Mexico: Economic considerations. Salud Pública Méx. 2005, 47, 234–239. [Google Scholar] [CrossRef] [Green Version]
- Secretaría de Salud. Esquema de Vacunación. [Vaccination Scheme]. Available online: https://www.gob.mx/salud/articulos/esquema-de-vacunacion (accessed on 4 January 2020).
- Secretaría de Salud. Memoria documental Programa de Acción Específico de Vacunación Universal 2013–2018. [Documentary Report of the Universal Vaccination Action-Specific Program 2013–2018]. Available online: https://www.gob.mx/cms/uploads/attachment/file/409143/CENSIA_PROGRAMA_DE_VACUNACION_UNIVERSALactualizado_29oct.pdf (accessed on 4 January 2020).
- Secretaría de Salud. Programa de Vacunación Universal y Semanas Nacionales de Salud. Lineamientos Generales 2015. [Universal Vaccination Program and National Health Weeks]. 2015 General Guidelines. Available online: http://www.censia.salud.gob.mx/contenidos/descargas/vacunas/Lineamientos_PVUySNS2015.PDF (accessed on 4 January 2020).
- Anderson, L.J.; Shekelle, P.; Keeler, E.; Uscher-Pines, L.; Shanman, R.; Morton, S.; Aliyev, G.; Nuckols, T.K. The cost of interventions to increase influenza vaccination: A systematic review. Am. J. Prev. Med. 2018, 54, 299–315. [Google Scholar] [CrossRef] [PubMed]
- Backer, J.A.; Van Boven, M.; Van der Hoek, W.; Wallinga, J. Vaccinating children against influenza increases variability in epidemic size. Epidemics 2019, 26, 95–103. [Google Scholar] [CrossRef] [PubMed]
- Barratt, J.; Mishra, V.; Acton, M. Latin American Adult Immunisation Advocacy Summit: Overcoming regional barriers to adult vaccination. Aging Clin. Exp. Res. 2019, 31, 339–344. [Google Scholar] [CrossRef]
- Principi, N.; Camilloni, B.; Esposito, S.; ESCMID Vaccine Study Group (EVASG). Influenza immunization policies: Which could be the main reasons for differences among countries? Hum. Vaccin. Immunother. 2018, 14, 684–692. [Google Scholar] [CrossRef] [PubMed] [Green Version]
- Taksler, G.B.; Rothberg, M.B.; Cutler, D.M. Association of influenza vaccination coverage in younger adults with influenza-related illness in the elderly. Clin. Infect. Dis. 2015, 61, 1495–1503. [Google Scholar] [CrossRef] [PubMed]
- Centers for Disease Control and Prevention. United States-Mexico Public Health. Available online: https://www.cdc.gov/usmexicohealth/index.html (accessed on 14 January 2020).
- European Centre for Disease Prevention and Control. Timeline on the Pandemic (H1N1) 2009. Available online: https://www.ecdc.europa.eu/en/seasonal-influenza/2009-influenza-h1n1-timeiline (accessed on 14 January 2020).
- Centers for Disease Control and Prevention. National, Regional, and State Level Outpatient Illness and Viral Surveillance (FLUVIEW). Available online: https://gis.cdc.gov/grasp/fluview/fluportaldashboard.html (accessed on 14 January 2020).


| No Medical Care | Outpatient Only | Hospitalization: Referred from Outpatient Clinic | Hospitalization: Admitted through ER | |||||
|---|---|---|---|---|---|---|---|---|
| Scenario | 0 | 1 | 2 | 3 | 4 | 5 | 6 | 7 |
| Health Outcome | Not Demanding Medical Care | Outpatient Only | Hospitalization, Discharge | Hospital Care, Death | Outpatient | Hospitalization, Non-Severe | Hospitalization, Severe | Hospitalization, Death |
| Clinical diagnosis | ||||||||
| Outpatient consultations 1 | 1 | 1 | 1 | |||||
| ER consultations 1 | 1 | 1 | 1 | 1 | ||||
| PCR | 0.1 | 0.1 | 0.1 | 1 | 1 | 1 | 1 | |
| Direct costs | ||||||||
| Outpatient consultations 1 | 1 | |||||||
| Specialist consultations 1 | 2 | 3 | 1 | 2 | 3 | 4 | ||
| Amantadine 2 | 1 | |||||||
| Oseltamivir 2 | 1 | 1 | 1 | 1 | 1 | 1 | 1 | |
| Paracetamol 2 | 1 | 1 | 1 | 1 | 1 | 1 | 1 | 1 |
| Bacteriologic culture 2 | 1 | 1 | 1 | 1 | 1 | |||
| Ceftriaxone 2 | 1 | 1 | 1 | 1 | 1 | |||
| Hospitalization days | 1 | 8.3 | 2 | 8.3 | 12.45 | 8.3 | ||
| Indirect costs | ||||||||
| Medical disability days | 3 | 8 | 5 | 15 | 26 | |||
| Years of life lost 3 | X | X | ||||||
| Confirmed Cases | Deaths | |||||||||||||||||
|---|---|---|---|---|---|---|---|---|---|---|---|---|---|---|---|---|---|---|
| Initial Classification 2 | ILI | SARI | Total | ILI | SARI | Total | ||||||||||||
| Season 3 | Influenza Type | Influenza Type | Influenza Type | Influenza Type | Influenza Type | Influenza Type | ||||||||||||
| A | B | Total | A | B | Total | A | B | Total | A | B | Total | A | B | Total | A | B | Total | |
| 2009–2010 4 | 87 | 1 | 88 | 67 | 0 | 67 | 154 | 1 | 155 | 4 | 0 | 4 | 5 | 0 | 5 | 9 | 0 | 9 |
| 2010–2011 | 116 | 5 | 121 | 78 | 1 | 79 | 194 | 6 | 200 | 0 | 0 | 0 | 1 | 0 | 1 | 1 | 0 | 1 |
| 2011–2012 | 235 | 3 | 238 | 173 | 1 | 174 | 408 | 4 | 412 | 2 | 0 | 2 | 19 | 0 | 19 | 21 | 0 | 21 |
| 2012–2013 | 90 | 22 | 112 | 47 | 18 | 65 | 137 | 40 | 177 | 0 | 0 | 0 | 2 | 1 | 3 | 2 | 1 | 3 |
| 2013–2014 | 249 | 12 | 261 | 352 | 10 | 362 | 601 | 22 | 623 | 18 | 0 | 18 | 78 | 1 | 79 | 96 | 1 | 97 |
| 2014–2015 | 40 | 33 | 73 | 67 | 30 | 97 | 107 | 63 | 170 | 4 | 0 | 4 | 4 | 0 | 4 | 8 | 0 | 8 |
| 2015–2016 | 202 | 82 | 284 | 254 | 44 | 298 | 456 | 126 | 582 | 10 | 1 | 11 | 44 | 2 | 46 | 54 | 3 | 57 |
| 2016–2017 | 101 | 60 | 161 | 182 | 41 | 223 | 283 | 101 | 384 | 2 | 1 | 3 | 43 | 1 | 44 | 45 | 2 | 47 |
| 2017–2018 | 108 | 25 | 133 | 66 | 17 | 83 | 174 | 42 | 216 | 1 | 1 | 2 | 10 | 4 | 14 | 11 | 5 | 16 |
| 2018–2019 5 | 10 | 2 | 12 | 2 | 2 | 4 | 12 | 4 | 16 | 1 | 0 | 1 | 0 | 0 | 0 | 1 | 0 | 1 |
| Period 2009–2019 | 1238 | 245 | 1483 | 1288 | 164 | 1452 | 2526 | 409 | 2935 | 42 | 3 | 45 | 206 | 9 | 215 | 248 | 12 | 260 |
| Influenza Type | Subtype | Indicator | 2009–2010 | 2010–2011 | 2011–2012 | 2012–2013 | 2013–2014 | 2014–2015 | 2015–2016 | 2016–2017 | 2017–2018 | 2018–2019 | Period 2009–2019 |
|---|---|---|---|---|---|---|---|---|---|---|---|---|---|
| A | H1N1 | Cases | 128 | 11 | 366 | 16 | 509 | 27 | 316 | 184 | 65 | 11 | 1633 |
| Deaths | 8 | 0 | 19 | 0 | 94 | 5 | 50 | 41 | 7 | 1 | 225 | ||
| Lethality (%) | 6.25% | 0% | 5.19% | 0% | 18.47% | 18.52% | 15.82% | 22.28% | 10.77% | 9.09% | 13.78% | ||
| H3N2 | Cases | 6 | 77 | 5 | 103 | 73 | 77 | 128 | 91 | 103 | 1 | 664 | |
| Deaths | 0 | 0 | 0 | 2 | 2 | 2 | 2 | 3 | 3 | 0 | 14 | ||
| Lethality (%) | 0% | 0% | 0% | 1.94% | 2.74% | 2.60% | 1.56% | 3.30% | 2.91% | 0% | 2.11% | ||
| Not subtyped | Cases | 20 | 106 | 37 | 18 | 19 | 3 | 12 | 8 | 6 | 0 | 229 | |
| Deaths | 1 | 1 | 2 | 0 | 0 | 1 | 2 | 1 | 1 | 0 | 9 | ||
| Lethality (%) | 5.00% | 0.94% | 5.41% | 0% | 0% | 33.33% | 16.67% | 12.50% | 16.67% | 0% | 3.93% | ||
| Total A | Cases | 154 | 194 | 408 | 137 | 601 | 107 | 456 | 283 | 174 | 12 | 2526 | |
| Deaths | 9 | 1 | 21 | 2 | 96 | 8 | 54 | 45 | 11 | 1 | 248 | ||
| Lethality (%) | 5.84% | 0.52% | 5.15% | 1.46% | 15.97% | 7.48% | 11.84% | 15.90% | 6.32% | 8.33% | 9.82% | ||
| B | Victoria | Cases | 0 | 0 | 1 | 2 | 4 | 1 | 4 | 1 | 5 | 0 | 18 |
| Deaths | 0 | 0 | 0 | 0 | 0 | 0 | 0 | 0 | 0 | 0 | 0 | ||
| Lethality (%) | 0% | 0% | 0% | 0% | 0% | 0% | 0% | 0% | 0% | 0% | 0% | ||
| Yamagata | Cases | 0 | 0 | 0 | 8 | 4 | 24 | 34 | 34 | 25 | 2 | 131 | |
| Deaths | 0 | 0 | 0 | 0 | 0 | 0 | 0 | 1 | 3 | 0 | 4 | ||
| Lethality (%) | 0% | 0% | 0% | 0% | 0% | 0% | 0% | 2.94% | 12.00% | 0% | 3.05% | ||
| Undetermined lineage | Cases | 1 | 6 | 3 | 30 | 14 | 38 | 88 | 66 | 12 | 2 | 260 | |
| Deaths | 0 | 0 | 0 | 1 | 1 | 0 | 3 | 1 | 2 | 0 | 8 | ||
| Lethality (%) | 0% | 0% | 0% | 3.33% | 7.14% | 0% | 3.41% | 1.52% | 16.67% | 0% | 3.08% | ||
| Total B | Cases | 1 | 6 | 4 | 40 | 22 | 63 | 126 | 101 | 42 | 4 | 409 | |
| Deaths | 0 | 0 | 0 | 1 | 1 | 0 | 3 | 2 | 5 | 0 | 12 | ||
| Lethality (%) | 0% | 0% | 0% | 2.50 | 4.55 | 0% | 2.38% | 1.98% | 11.90% | 0% | 2.93% | ||
| Total influenza | Cases | 155 | 200 | 412 | 177 | 623 | 170 | 582 | 384 | 216 | 16 | 2935 | |
| Deaths | 9 | 1 | 21 | 3 | 97 | 8 | 57 | 47 | 16 | 1 | 260 | ||
| Lethality (%) | 5.81% | 0.50% | 5.10% | 1.69% | 15.57% | 4.71% | 9.79% | 12.24% | 7.41% | 6.25% | 8.86% | ||
| ICD-10 | Main Diagnosis | Discharges | Total Bed-Days | Average Bed-Days |
|---|---|---|---|---|
| J09X | Influenza due to certain identified influenza virus | 162 | 1851 | 11.4 |
| J100 | Influenza with pneumonia, other influenza virus identified | 92 | 1007 | 10.9 |
| J101 | Influenza with other respiratory manifestations, other influenza virus identified | 56 | 347 | 6.2 |
| J108 | Influenza with other manifestations, other influenza virus identified | 15 | 62 | 4.1 |
| J110 | Influenza with pneumonia, virus not identified | 307 | 2923 | 9.5 |
| J111 | Influenza with other respiratory manifestations, virus not identified | 394 | 2431 | 6.2 |
| J118 | Influenza with other manifestations, virus not identified | 39 | 210 | 5.4 |
| Total | 1065 | 8831 | 8.3 | |
| Age Group | Season 1 | Average Mortality | ||||
|---|---|---|---|---|---|---|
| 2010–2011 | 2011–2012 | 2012–2013 | 2013–2014 | 2014–2015 | ||
| <1 | 0.8 | 1.3 | 1.0 | 1.2 | 0.4 | 0.9 |
| 1–4 | 0.1 | 0.1 | 0.4 | 0.2 | 0.1 | 0.2 |
| 5–11 | 0.0 | 0.0 | 0.0 | 0.1 | 0.0 | 0.0 |
| 12–17 | 0.1 | 0.0 | 0.0 | 0.1 | 0.0 | 0.0 |
| 18–49 | 0.1 | 0.2 | 0.0 | 0.7 | 0.0 | 0.2 |
| 50–59 | 0.8 | 0.9 | 0.0 | 2.0 | 0.1 | 0.8 |
| ≥60 | 1.3 | 1.0 | 0.1 | 2.0 | 0.3 | 0.9 |
| Total | 0.2 | 0.3 | 0.1 | 0.8 | 0.1 | 0.3 |
| Outcomes | No Influenza Immunization | Influenza Immunization | Influenza-Related Events Averted |
|---|---|---|---|
| Influenza cases | 797,918 | 598,418 | 199,500 |
| Outpatient consultations | 268,004 | 200,996 | 67,008 |
| Specialty consultations | 215,136 | 161,347 | 53,790 |
| Emergency room consultations | 132,082 | 99,058 | 33,024 |
| Hospitalizations | 132,349 | 99,258 | 33,091 |
| Scenario | 0 | 1 | 2 | 3 | 4 | 5 | 6 | 7 | Cost |
|---|---|---|---|---|---|---|---|---|---|
| Direct costs | |||||||||
| Laboratory diagnosis | 1.55 | 0.01 | 0.0000 | 8.27 | 4.87 | 2.78 | 0.01 | 17.48 | |
| Medical consultations | 6.37 | 0.03 | 0.0001 | 4.55 | 3.90 | 3.05 | 0.01 | 17.90 | |
| Drugs | 1.39 | 0.82 | 0.00 | 0.0000 | 0.44 | 0.26 | 0.15 | 0.00 | 3.06 |
| Hospitalizations | 0.0018 | 32.32 | 72.33 | 61.80 | 0.09 | 166.61 | |||
| Total direct costs | 1.39 | 8.74 | 0.09 | 0.00 | 45.57 | 81.37 | 67.78 | 0.10 | 205.04 |
| Indirect costs | |||||||||
| Productivity loss | 0.00 | 6.78 | 0.04 | 6.04 | 9.77 | 9.65 | 32.27 | ||
| Premature death | 0.08 | 3.88 | 3.96 | ||||||
| Total indirect costs | 0.00 | 6.78 | 0.04 | 0.08 | 6.04 | 9.77 | 9.65 | 3.88 | 36.23 |
| Total costs of influenza | 1.39 | 15.52 | 0.13 | 0.08 | 51.61 | 91.14 | 77.42 | 3.99 | 241.27 |
| Population to Vaccinate | Cost (US Dollars) |
|---|---|
| Total population 50–59 years | 6,444,501 |
| At 50% vaccination coverage | |
| Vaccinated population | 3,222,250 |
| Cost of immunization | |
| Cost per dose | 3.002 |
| Application of vaccine | 0.236 |
| Storage and transportation | 0.028 |
| Unit cost per person immunized | 3.267 |
| Total cost of immunization | |
| Population 50–59 years | 10,525,569.95 |
| No Influenza Immunization | Influenza Immunization | Net Costs | |
|---|---|---|---|
| Direct costs | |||
| Laboratory diagnosis | 17.48 | 13.11 | −4.37 |
| Medical consultations | 17.90 | 13.42 | −4.48 |
| Drugs | 3.06 | 2.30 | −0.77 |
| Hospitalizations | 166.61 | 124.95 | −41.66 |
| Vaccination population aged 50–59 years | 10.53 | 10.53 | |
| Net direct costs (Third party payer perspective) | 205.04 | 164.30 | −40.74 |
| Indirect costs | |||
| Productivity loss | 32.27 | 24.20 | −8.07 |
| Premature death | 3.96 | 2.97 | −0.99 |
| Net indirect costs | 36.23 | 27.17 | −9.06 |
| Net total costs of influenza (Societal perspective) | 241.27 | 191.47 | −49.80 |
| Scenario | Base Case | Conservative | Optimistic |
|---|---|---|---|
| 0–Not demanding medical care | 132,939 | 30,314 | 253,110 |
| 1–Outpatient only | 33,471 | 7632 | 63,727 |
| 2–Hospitalization, discharge | 67 | 15 | 127 |
| 4–Outpatient | 17,885 | 4078 | 34,053 |
| 5–Hospitalization, non-severe | 9645 | 2199 | 18,363 |
| 6–Hospitalization, severe | 5494 | 1253 | 10,460 |
| Total | 199,500 | 45,493 | 379,840 |
| Events Avoided | Base Case | Conservative | Optimistic |
|---|---|---|---|
| Vaccination coverage | 50% | 30% | 70% |
| Vaccine effectiveness | 50% | 19% | 68% |
| Influenza cases | 199,500 | 45,493 | 379,840 |
| Outpatient consultations | 67,008 | 15,280 | 127,580 |
| Specialty consultations | 53,790 | 12,266 | 102,414 |
| Emergency room consultations | 33,024 | 7531 | 62,876 |
| Hospitalizations | 33,091 | 7546 | 63,003 |
| Deaths | 12.1 | 2.8 | 23.0 |
| Influenza-Associated Costs Averted | Base Case | Conservative | Optimistic |
|---|---|---|---|
| Vaccination coverage | 50% | 30% | 70% |
| Vaccine effectiveness | 50% | 19% | 68% |
| Direct Costs | |||
| Laboratory diagnosis | −4.37% | −1.00% | −8.3% |
| Medical consultations | −4.48% | −1.02% | −8.5% |
| Drugs | −0.77% | −0.17% | −1.5% |
| Hospitalizations | −41.66% | −9.50% | −79.3% |
| Influenza immunization 50–59 years | +10.53% | +6.32% | +14.7% |
| Total direct costs (Third-party payer perspective) | −40.74% | −5.38% | −82.9% |
| Indirect costs | |||
| Productivity loss | −8.07% | −1.84% | −15.4% |
| Premature death | −0.99% | −0.23% | −1.9% |
| Total indirect costs | −9.06% | −2.07% | −17.2% |
| Total costs of influenza | −49.80% | −7.44% | −100.1% |
Publisher’s Note: MDPI stays neutral with regard to jurisdictional claims in published maps and institutional affiliations. |
© 2021 by the authors. Licensee MDPI, Basel, Switzerland. This article is an open access article distributed under the terms and conditions of the Creative Commons Attribution (CC BY) license (http://creativecommons.org/licenses/by/4.0/).
Share and Cite
Betancourt-Cravioto, M.; Falcón-Lezama, J.A.; Saucedo-Martínez, R.; Alfaro-Cortés, M.M.; Tapia-Conyer, R. Public Health and Economic Benefits of Influenza Vaccination of the Population Aged 50 to 59 Years without Risk Factors for Influenza Complications in Mexico: A Cross-Sectional Epidemiological Study. Vaccines 2021, 9, 188. https://doi.org/10.3390/vaccines9030188
Betancourt-Cravioto M, Falcón-Lezama JA, Saucedo-Martínez R, Alfaro-Cortés MM, Tapia-Conyer R. Public Health and Economic Benefits of Influenza Vaccination of the Population Aged 50 to 59 Years without Risk Factors for Influenza Complications in Mexico: A Cross-Sectional Epidemiological Study. Vaccines. 2021; 9(3):188. https://doi.org/10.3390/vaccines9030188
Chicago/Turabian StyleBetancourt-Cravioto, Miguel, Jorge Abelardo Falcón-Lezama, Rodrigo Saucedo-Martínez, Myrna María Alfaro-Cortés, and Roberto Tapia-Conyer. 2021. "Public Health and Economic Benefits of Influenza Vaccination of the Population Aged 50 to 59 Years without Risk Factors for Influenza Complications in Mexico: A Cross-Sectional Epidemiological Study" Vaccines 9, no. 3: 188. https://doi.org/10.3390/vaccines9030188