

Coupling Landscape Connectedness, Ecosystem Service Value, and Resident Welfare in Xining City, Western China

1
College of Resources and Environmental Sciences, Henan Agricultural University, Zhengzhou 450002, China
2
Henan Engineering Research Center of Land Consolidation and Ecological Restoration, Henan Agricultural University, Zhengzhou 450002, China
*
Author to whom correspondence should be addressed.
Systems 2023, 11(10), 512; https://doi.org/10.3390/systems11100512
Submission received: 27 July 2023
/
Revised: 3 October 2023
/
Accepted: 11 October 2023
/
Published: 13 October 2023
(This article belongs to the Special Issue Service Ecosystems: Resilience and Sustainability)
Abstract
:Landscape connectedness, ecosystem service value (ESV), and resident welfare are intricately interconnected, and understanding their relationships is crucial for promoting regional sustainable development. Utilizing six stages of land use data from 1995, 2000, 2005, 2010, 2015, and 2020 in Xining City, Qinghai Province, this study identified landscape connectedness changes by landscape pattern indices, calculated ecosystem service value by the equivalent factor method, and quantified residents’ well-being by comprehensive evaluation indices. To investigate the coupled and coordinated states among the three, a coupling coordination model is adopted. Furthermore, the relative development degree model is employed to reveal the relative developmental level of the three, clarify the lagging factors in their coupling coordination. The gray relational model is employed to identify key factors affecting the coupling mechanism. Key findings include the following: (1) The development trend of landscape types was moving toward diversification and balance, and the total value of ecosystem services has been declining. The comprehensive level of resident welfare has increased annually, but the structure has changed. (2) The coupling relationship among landscape connectedness, ecosystem service value, and resident welfare is strong and has remained at a high correlation level but has been in a state of discord. (3) The main constraint of the discord in the early stage was resident welfare, but the constraining factors in the later stage shifted to ecosystem services and landscape connectedness. The largest patch index and water resource supply were the key influencing factors in the system coupling mechanism. The research findings can provide a reference for the sustainable development of Xining City, regional land use policies, and ecological intervention planning.
1. Introduction
The Millennium Ecosystem Assessment (MA) indicates that 60% of global ecosystem services are in a state of degradation or unsustainability [1]. As human activities and climate change continue to intensify, a series of ecological and environmental issues have arisen, including increased carbon emissions, rapid global warming, and rising sea levels, all of which severely damage the environment in which humans live [2,3]. In the context of global environmental change and human disturbance, strengthening the understanding of the relationship between humans and nature is the key to achieving sustainable development [4]. Sustainable development, as a behavioral vector in the complex natural-social-economic system, has focused on the interrelationship between ecosystem services and human well-being. Human well-being is a state of healthy, happy, and materially affluent living. Ecosystem services refer to life-sustaining products and services directly or indirectly derived by humans from ecosystem structures, processes, and functions [5]. These include provisioning, regulating, supporting, and providing cultural services [6]. As the basis for natural environmental conditions formed and maintained by ecosystems and ecological processes, changes in ecosystem services can directly or indirectly affect human well-being [7]. Exploring the impacts of various factors, such as ecosystem processes and land use or landscape pattern changes, on the relationships between ecosystem services and human well-being is very critical [8]. Land use changes not only serve as a significant driving force for global change but also directly affect the structure and function of ecosystems, ultimately influencing their ability to provide ecosystem services [9]. Landscape pattern changes, primarily manifested as land-use/land-cover changes, can impact ecosystem functions and structures by altering surface biophysical parameters, thus affecting the provision of ecosystem services [10,11]. In addition, land use change can directly cause changes in landscape connectedness. Landscape connectedness, as a link between landscape patterns and ecological processes, expresses the degree to which a landscape facilitates or hinders ecological flows. Landscapes with good connectedness can realize their ecological functions more effectively [12,13,14]. Some studies point out that land use or landscape pattern changes can not only change biodiversity and habitat [15,16,17] but also alter ecosystem processes, affecting well-being in the process of balancing ecosystem services. Therefore, there is a close relationship between landscape patterns, ecosystem services, and human well-being. This relationship is a complex, nonlinear, multilevel relationship affected by various factors, and studying this relationship as a whole is of great importance for understanding natural ecosystems and socioeconomic systems [18,19], enhancing human well-being [20], and guiding national or regional sustainable development toward increasingly rational and harmonious directions [21].
Following MA’s establishment of the connection between ecosystem services and human well-being, the scientific community has been analyzing the relationships between land-use changes and ecosystem services [22,23], landscape patterns and ecosystem services [24], and ecosystem services and human well-being [25,26], with the aim of incorporating ecological, economic, and social aspects into a coordinated global development framework. Landscape indices are simple quantitative indicators that can condense information on landscape patterns at high density, reflecting certain aspects of their structural composition and spatial configuration, and whose change characteristics have a certain degree of significance in terms of the connectedness degree [27,28]. The widely used method for evaluating ESV is the market alternative method, also known as the value equivalent method. Value equivalent factors are essentially the equivalent coefficients that are obtained via a comprehensive scoring system developed by many ecosystem research experts. Human well-being is usually quantified by various evaluation indicators, including subjective, objective, and the combination of subjective and objective. The harmonious development of landscape patterns, ecosystem services, and human well-being has gradually become a frontier of human-earth system research and an important topic for sustainable development [20,29,30]. For example, research assessing the impact of land-use changes in Chile’s temperate forests between 1986 and 2011 on the spatial patterns of native forest habitat diversity identified area loss, increased patch numbers, and biodiversity loss as explanations for the decline in ecosystem service provision [31]. Mitchell et al. argued that landscape patterns significantly influenced ecosystem service values, with landscape fragmentation acting as a driver of ecosystem service degradation [32]. High-intensity human activities and accelerated land use transformation have seriously affected ecosystem stability and landscape connectedness, threatening regional ecological security and sustainable development [33]. As landscape fragmentation is becoming increasingly serious due to global environmental changes and human activities, restoring or rebuilding connectivity between landscapes and promoting ecological flows of materials and energy between patches has become one of the most important means to maintain landscape integrity and continuity and to improve regional ecosystem service functions [34,35,36]. Horcea-Milcu et al. analyzed the relationship between ecosystem services and human well-being in Eastern Europe, concluding that people in impoverished areas are more dependent on ecosystem services [37]. Zhen et al. revealed that changes in urban ecological land use structure led to changes in ecosystem service values, which were mainly affected by urbanization [38]. A few studies revealed that the alpine meadow ecosystems on the Qinghai-Tibet Plateau are severely degraded under the combined effects of climate change and human activities, with both vegetation and soil exhibiting different degradation trends. Long-term neglect of scientific management of grassland resources, extensive operations, and overgrazing have seriously threatened critical biodiversity for human survival, resulting in a significant loss of ecosystem services [39,40]. Li et al. explored the spatiotemporal evolution of ecosystem service values, resident well-being levels, and the coupled relationship between them in the Beijing-Tianjin-Hebei region using a coupled coordination model [41]. While there is extensive literature [42,43,44] on the coupling relationships and mechanisms between two systems, research on the coupled coordination and interaction mechanisms between landscape connectedness, ecosystem services, and human well-being is still limited. In this context, Hu et al. revealed the complex relationships between landscape patterns, ecosystem service values, and human well-being in the Xishuangbanna Nature Reserve based on coupled coordination [45]. However, the coupling coordination state and mechanism of the three have not been further explored. Many scholars [19,24] argue that clarifying the relationships among landscape pattern, ecosystem services, and human well-being can effectively reveal the intrinsic interactions between human and natural systems, understand ecosystem service processes and mechanisms, and gain insights into regional ecological and environmental changes. This understanding contributes to land-use planning and ecological conservation policy formulation and implementation and promotes sustainable regional development.
Based on the previous research on landscape patterns, ecosystem services, and human well-being, a knowledge gap still exists in current research. The research on the detailed coupling state and the underlying factors of the coupling relationship among the three remains insufficient. Most research focuses on two aspects: landscape pattern, ecosystem services, and human well-being. Few studies consider the interaction among the three systems from an integration perspective. The factor interpretation and mechanism of the coupling relationship among the three are still unclear.
Over the past few decades, China has prioritized economic development, leading to significant environmental and societal changes [46]. The northwest region of China is characterized by a fragile ecological environment and complex ecological conditions. Meanwhile, Qinghai Province is the source of the Yangtze, Yellow, and Lancang rivers, holding crucial ecological significance in China and Asia. Xining City, located at the junction of the Qinghai-Tibet Plateau and the Loess Plateau, serves as the political, economic, and cultural center of Qinghai Province, with a vulnerable yet significant ecological environment [47]. In the 20 years since the implementation of the Western Development Strategy, Xining has experienced rapid development in various aspects, including the economy, society, and resident well-being. However, under the pressure of rapid socioeconomic development and population growth, the local fragile ecological environment faces landscape fragmentation, ecosystem degradation, and an overall unhealthy ecological condition [48]. Therefore, strengthening research on the relationships among landscape pattern changes, ecosystem service values, and resident well-being in Xining City is crucial for reducing regional ecological risks, maintaining ecosystem health, exploring future sustainable development policies, and promoting harmonious coexistence between humans and nature within the context of Chinese modernization. The methodology of this study mainly includes the landscape pattern indices, the equivalent factor method, the comprehensive assessment index system method, the coupling and coordination development model, the relative development degree model, and the gray correlation analysis. The objectives of this study are to (1) quantify the changes in landscape connectedness in Xining City; (2) assess the spatiotemporal variations in ecosystem service values; (3) comprehensively evaluate resident well-being; (4) explore the changes in the coupled coordination state between landscape connectedness, ecosystem service values, and resident well-being; and (5) identify the key coupling factors influencing the harmonious development of these three aspects and reveal the underlying constraints.
2. Materials and Methods
2.1. The Study Area
Xining City (101°77′ E, 36°62′ N) is located in the eastern part of Qinghai Province (Figure 1). As the provincial capital, Xining City administers five districts and two counties, covering an area of approximately 7,660 km2. Chengzhong, Chengdong, Chengxi, and Chengbei districts are core areas with typically urban character, while other counties or districts have typically natural character but are within city borders. As of the end of 2022, the resident population of Xining City was 2.48 million people, and the regional GDP was CNY 1644.35 billion. The terrain is high in the northwest and low in the southeast, and the altitude range is 2143–4870 m. The city exhibits a “four mountains and three rivers” distribution, with the Huangshui River, a tributary of the Yellow River, running through the city from west to east. Xining has a semiarid plateau continental climate, with an average annual precipitation of 381 mm and strong evaporation, and is generally a water-poor region. Cultivated land, grassland, and unused land are the core types of LUCC, accounting for 73% of the total area [49]. The area of dry land is relatively large, the unused land is dominated by barren grass, and the ecological effect is low. Xining City is a major grain crop production area and an urban development focus in the Qinghai-Tibet region [50]. In the past 20 years, driven by the development of the western region and the construction of an ecological environment, Xining City, as a typical arid area in the west and a typical rapid urbanization area on the Qinghai-Tibet Plateau, has experienced rapid economic growth, and the intensification of human activities has had a great impact on the pattern of land use and ecosystem service functions [51].
2.2. Data Sources
The data used in this study mainly include national administrative boundaries, digital elevation models (DEM), land use/cover change, and socioeconomic statistical data. The DEM is sourced from the Geographic Spatial Data Cloud, while socioeconomic data primarily come from the Xining City Statistical Yearbooks (1995–2020), China Agricultural Product Price Survey Yearbooks, and local records. The land use raster data with a spatial resolution of 30 m in 1995, 2000, 2005, 2010, 2015, and 2020 were from the Resource and Environmental Science and Data Center of the Chinese Academy of Sciences (https://www.resdc.cn/, accessed on 5 December 2022). Based on the Chinese Land Use Status Classification, the study area’s land use types are divided into six categories: cropland, forestland, grassland, water bodies, construction land, and unused land [52]. For specific data sources, see Table 1.
2.3. Methods
2.3.1. Calculation of Landscape Connectedness
Landscape connectedness is a functional indicator of the extent to which a landscape facilitates ecological flows, describing the organic connections of landscape elements in terms of spatial patterns or ecological processes [27]. This connection may be species flow between biological groups or direct material, energy, and information flow between landscape elements, and it provides a theoretical basis and technical approach for exploring the spatial heterogeneity of landscapes and revealing the relationship between spatial patterns and ecological processes [53,54]. This study employs Fragstats 4.2 software to calculate landscape-level landscape pattern indices and investigate the changing characteristics of landscape connectedness [55,56]. Currently, landscape pattern indices have developed to a stage where there are many indices, few types, and vague ecological significance, and many landscape indices are difficult to interpret ecologically when used individually [57]. Utilizing existing landscape pattern index changes to analyze the landscape connectedness. Based on previous studies [56], the metrics at the land landscape level were selected to characterize the degree of fragmentation and connectedness of the landscape structure with the number of patches (NP), patch density (PD), edge density (ED), largest patch index (LPI), and aggregation index (AI), and the stability of the landscape structure with the landscape shape index (LSI) and Shannon diversity index (SHDI), respectively, with specific meanings [58] presented in Table 2.
In this paper, the entropy weight method is used to calculate the weight value of each index. This method can largely avoid subjective factors in the calculation of evaluation index weights, making the assessment more realistic and scientifically rigorous. The index weight steps determined by the entropy weight method are as follows: Firstly, the extreme value standardization method is used to eliminate the effects of different dimensions, including positive and negative effects [59].
Index with a positive effect:
Index with a negative effect:
where is the normalized value; and and represent the maximum and minimum values of the jth index, respectively [45].
Secondly, the information entropy of each index is obtained. In general, the smaller the entropy value, the greater the degree of dispersion between the systems and the greater the weight. The entropy of the jth evaluation index is as follows:
where can be calculated as
2.3.2. Ecosystem Service Value Assessment
To evaluate the value of ecosystem services, the complex system (structure and process) should be decomposed into different service functions, and these functions should be able to produce direct and indirect benefits for human beings from the ecosystem, including resource supply, environmental regulation, cultural entertainment, and production support [60,61]. In this study, based on the Millennium Ecosystem Assessment (MA), ecosystem services are divided into four categories [5]. Considering China’s national conditions and relatively poor water resources in western China, we further subdivided four categories of ecosystem services into 11 services. Water resource supply services are included, and further consideration of ecosystem maintenance services for soil and water conservation and nutrient cycling will make ecosystem service value assessments more comprehensive. Based on Costanza et al.’s method and a questionnaire completed by 500 ecology scholars in China, an equivalent factor of ESV per unit area suitable for an evaluation of ecosystem service value at the Chinese scale was summarized by Xie et al. [62,63]. After that, Xie et al. modified and developed the method for evaluating the value equivalent factor in unit area and proposed an integrated method for dynamic evaluation of the Chinese terrestrial ecosystem service value [64]. The assessment of ecosystem service value differentiated various types of ecosystem services and constructed value equivalents for different types of ecosystem services based on quantifiable standards. The assessment is conducted using the equivalent factor method, which combines these value equivalents with the distribution area of the ecosystem. In this study, the dynamic assessment method for the value of China’s terrestrial ecosystem services is applied to estimate the value of 11 ecosystem services in Xining City based on actual conditions [64]. The equivalent factors of cropland, forestland, grassland, water, and unused land are based on the previous research [51,64]. The cropland in the whole area of Xining City is weighted by the value equivalent of dry land and irrigated land. According to the geographical location and climatic conditions of Xining City, the coniferous, broad-leaved, and mixed coniferous and broad-leaved forests in the vegetation cover belong to the forested land, and the three equivalent weights are obtained. The shrub belongs to the shrub forest; the grassland will be the grassland; the meadow value equivalent weighted correction; waters include wetlands and waters; and unused land uses the average of desert and bare land equivalents. Construction land is based on the research results of Liu et al. to obtain the ecosystem service value equivalents per unit area for Xining City [65].
In this study, based on the revised ecological service equivalent table per unit area of China’s ecosystems, the economic value created per unit area of grain output was revised based on the grain production and market value of Xining City from 1995 to 2020. The revised method is that a standard economic value equivalent coefficient for ecosystem services is 1/7 of the economic value of food production per unit area of farmland, calculated as follows:
In Equation (6), is the economic value (CNY/ha) of the food production service function provided by the unit area of farmland ecosystem; i is the type of crops; is the national average price (CNY/ton) of crop i in a certain year; is the yield per unit area of crop i (ton/ha); is the planting area of crop i (ha); and M is the planting area of all crops (ha) [64].
Based on the calculation of the planting area and total yield of major grain crops (wheat) in Xining City, the average grain yield per unit area for the city from 1995 to 2020 is obtained, which is 3.12 tons/ha. The average grain price is 3176.28 CNY/ton, resulting in an ecosystem service value of 1414.40 CNY/ha for one standard equivalent factor. The ecosystem service value coefficients per unit area for different land use types in Xining City are shown in Table 3 as follows:
The calculation process for the value of ecosystem services is as follows:
In Equation (7), represents the value of the type of ecosystem service for land class in the study area; represents the area of land class ; represents the coefficient of the jth type of ecosystem service value for land class ; and represents the total value of ecosystem services [64].
Additionally, this study adopts sensitivity analysis to examine the validity of the ecosystem service value coefficients and results. The sensitivity index can verify the accuracy of the selection of ecosystem service value coefficients and the estimation of ecosystem service values. The sensitivity index is used to express the temporal changes and the degree of dependency of ecosystem service values on the per-unit area ecosystem service value coefficients. This reveals the significance of the elasticity between the “value coefficients” and the “total value” for various land-use types [66]. In this study, the value coefficient of one type of land-use category’s ecosystem services is adjusted each time (increased or decreased by 50%), and the sensitivity index of each land-use type’s ecosystem service values in Xining from 1995 to 2020 is calculated. The smaller the elasticity is, the lower the sensitivity, the more reliable the results, and the more consistent the results are with the actual situation in Xining.
In Equation (8), represents sensitivity; stands for the value of ecosystem services; denotes the ecosystem service value coefficient; and represent the values before and after adjusting the ecosystem service value coefficient, respectively; and i refers to a specific land-use type. If , it indicates that is highly elastic with respect to VC, the accuracy of the research results is relatively poor, and the credibility is low. Conversely, if , it implies that lacks elasticity with respect to , the accuracy of the research results is relatively high, and the results are reliable [67].
2.3.3. Assessment of Resident Welfare
The MA defines human well-being as encompassing the basic material needs for a high-quality life: health, good social relationships, security, and freedom of choice and action [68]. Research on human well-being in China focuses on the quantitative assessment of welfare from a sustainability science perspective [44,69]. Referring to the design of human well-being indicator systems both domestically and internationally [41,70,71,72] and considering the regional characteristics, current ecological and environmental conditions, and economic and social development levels of Xining [73]. Given the multidimensionality and regional differences in residents’ welfare, the primary indicators selected for the Xining residents’ welfare assessment system are divided into three categories: basic needs, safety and health needs, and psychological needs. The secondary indicators comprise nine aspects, and a total of 32 representative multidimensional assessment indicators were selected [74]. Considering the scale effect and data availability of residents’ welfare, macro-statistical indicators characterizing residents’ basic needs, such as per capita GDP, per capita income of urban and rural residents, grain output, and total output value of industry and agriculture, are selected. Among them, per capita grassland area, livestock inventory, and meat output are crucial indicators related to the well-being of plateau pastoralists. The total power of agricultural machinery indirectly reflects the level of agricultural modernization. For residents’ safety and health needs, we primarily select indicators such as urban green space coverage and per capita park green space area to represent ecological safety levels. Healthcare infrastructure conditions reflect residents’ health-related welfare demands. In terms of psychological needs, we primarily select indicators such as rural grassroots organizations and travel agencies to represent social communications. Additionally, multiple indicators, such as education, fiscal expenditure, and television population coverage rate, can better quantify residents’ psychological needs. Using statistical analysis methods [44], we establish a relatively comprehensive indicator system for assessing the welfare of Xining residents (Table 4). The weights of each index are assigned using the entropy method.
2.3.4. Coupling Coordination Degree Model
The concept of coupling degree originates from physics and refers to the extent to which two or more systems interact and influence each other. The coupling relationship and coordination degree determine the development status of the system. On this basis, this study draws on the methods of other scholars [41,75] to establish a coupling coordination degree model for the landscape connectedness subsystem, ecosystem service subsystem, and resident welfare subsystem (Equation (10)) to explore the temporal changes in the coupling coordination between these three subsystems at the urban scale of Xining from 1995 to 2020. The comprehensive evaluation method is used to calculate the annual comprehensive evaluation values of each subsystem:
In Equation (9), , , and represent the comprehensive evaluation values of the landscape connectedness, , and resident welfare subsystems, respectively; , and represent the weights of the index for landscape connectedness, , and resident welfare, respectively; , , and represent the standardized values of the index for landscape connectedness, , and resident welfare, respectively.
The calculations for the coupling coordination degree model are as follows:
In Equations (10) and (11), C represents the coupling degree, , , and represent the comprehensive development indices of the landscape connectedness,, and resident welfare subsystems, respectively, and represents the coordination degree. is the coupling coordination development level index , where , , and represent weights. This study considers that among the three subsystems, landscape connectedness and ecosystem services hold equal positions in the natural ecology, so the weights can be set as , , and The specific coupling degree standards [76] are presented in Table 5.
2.3.5. Relative Development Degree Model
The coupling coordination degree model of the systems can reflect the coordinated development relationship of landscape connectedness, ecosystem services, and resident welfare in spatiotemporal development, but it cannot express the relative development degree among the systems [77,78]. Based on this, the relative development degree model is introduced to measure the relative development level between the three systems, with the formula:
We take the relative development degree of resident welfare and landscape connectedness as an example for description. In Equation (12), B1 represents resident welfare, and B2 represents landscape connectedness. The calculation principles for the relative development degree of landscape-connectedness ecosystem services and resident welfare-ecosystem services systems are the same as above. To facilitate the interpretation of the relative development of system coupling, we determine it according to Table 6, based on previous research findings [79,80].
2.3.6. Gray Relational Analysis
Gray theory compares the geometric similarity of two variable time series. The more similar the shape, the higher the correlation between the two variables. This method measures the degree of association between factors based on the similarity or dissimilarity of their development trends and quantifies or orders factors in systems with incomplete information [81]. Therefore, using the gray relational degree method, we determine the dominant objects of coupling association between the two subsystems, analyze the key factors of interaction among the three subsystems, and further reveal the coupling mechanism among them. Since landscape connectedness and ecosystem services reflect the state of the natural ecological system and resident welfare belongs to the social system, this study only identifies the key factors of landscape connectedness and ecosystem services affecting resident welfare [45]. The formulas for the gray relational coefficient and gray relational degree are as follows:
In Equation (13), represents different years; is the standardized value of human welfare in that year; is the standardized value of landscape connectedness or in that year; and the resolution factor is the index of distinguishability in the range of (0,1). In most cases, a value of 0.5 is used.
In Equation (14), is the gray relational degree, which numerically represents the impact of a factor on the objective value, ranging from 0 to 1. The closer this value is to 1, the stronger the correlation, indicating that the impact of the indicator on the other system is greater, which is the key factor determining whether the two systems can develop together. Generally, when falls within the ranges of (0, 0.35], (0.35, 0.6], (0.6, 0.85], and (0.85, 1], the indicators of the two systems have low correlation, medium correlation, relatively high correlation, and high correlation, respectively [45].
3. Results
3.1. Land Use and Land Cover Change
3.1.1. Temporal Characteristics of Land Use and Land Cover Change
The land use types in Xining in 1995 were ranked by area: grassland > forestland > cultivated land > unused land > construction land > water bodies (Table 7). From 1995 to 2020, the area of land use types in Xining showed a pattern of “two increases and three decreases.” The areas of grassland and construction land increased. The areas of cultivated land, forestland, and unused land have been continuously decreasing. The proportion of construction land increased from 3.31% in 1995 to 4.47% in 2020, mainly due to the significant reduction in rural settlements and the relocation and merging of herder settlements. The main direction of land use transfer was from forestland to grassland. Overall, the most rapid changes in Xining over the 25 years were the increase in construction land (34.82%) and the decrease in unused land (17.62%).
3.1.2. Spatial Characteristics of Land Use and Land Cover Change
The main land use type in the city is grassland (Figure 2), which accounts for approximately half of the total area of the study region (Table 7) and has the widest distribution. From 1995 to 2020, the area of grassland increased more in western Datong and Huangyuan counties. The construction land in this area has expanded significantly in the past 25 years in the urban area of Xining City, which has a high population density.
3.2. Landscape Connectedness Changes
Overall, the landscape connectedness of Xining City underwent complex changes from 1995 to 2020 (Table 8). At the landscape scale, the number of patches and patch density exhibited an M-shaped change trend. The number of patches and patch density increased, fragmentation intensified (1995–2000), then decreased (2000–2005), followed by another increase (2005–2010), and finally, the landscape structure stabilized (2010–2020). At the same time, the landscape shape index continuously declined over the 25 years, with a more even distribution of patch types. The Shannon diversity index and aggregation index increased annually from 2000 to 2020, indicating that the landscape types in the study area became richer and more diverse and the landscape structure was more stable. Fragmented patches tended to aggregate, and landscape connectivity strengthened, which is related to the growth and aggregation of construction land patches around water bodies during the corresponding time periods (Figure 2). Before 2000, landscape fragmentation intensified, heterogeneity increased, human activities severely disturbed landscape patterns, and land use was disordered, mainly reflected in the large-scale conversion of forestland to grassland (1995–2000). After 2000, the degree of landscape fragmentation weakened, and most of the ecological patches and anthropogenic patch aggregations in the landscape pattern stabilized, as evidenced by increased connectivity in the landscape structure after 2010.
3.3. Ecosystem Service Value Changes and Sensitivity Analysis
3.3.1. Changes in Ecosystem Service Value on a Time Scale
The total ESV in Xining from 1995 to 2020 shows a decreasing trend (Table 9). In 1995, the total ESV of Xining was CNY 8.40 billion, while in 2020, it was CNY 8.19 billion. The total ESV decreased by CNY 0.21 billion over 25 years, a change rate of −2.49%. The ESV of grasslands shows an increasing trend, while the ESVs of other land use types, such as forestland, cultivated land, and construction land, all show a decreasing trend. In terms of the ESV change rate from 1995 to 2020, construction land had the largest change rate at 34.82%, followed by unused land at −17.62%. This shows that human activities have a strong and time-sensitive impact on ecosystem services, and unused land has become a more active part of the ecosystem due to human activities.
The order of ecosystem service values by primary type is regulating services > supporting services > provisioning services > cultural services (Figure 3). By secondary type, it is climate regulation > hydrological regulation > soil conservation > gas regulation > maintaining biodiversity > environment purification > aesthetic landscape provision > raw material production > food production > maintaining nutrient cycling > water resource supply. In the primary types, the value proportion of regulation services is the highest, with proportions greater than 65% in each research period. The total value decreased from CNY 5.52 billion in 1995 to CNY 5.46 billion in 2020. Support services come next with a proportion of approximately 24%. The total value decreased from CNY 2.05 billion in 1995 to CNY 2.02 billion in 2020. The proportions of supply services and cultural services are relatively small, both below 8%. In the secondary types, from 1995 to 2020, the highest service value in single ecosystem services in Xining is climate regulation, with total values exceeding CNY 2 billion in each research period and proportions above 25% (Table 10). The next highest is hydrological regulation, with total values over CNY 1.7 billion and proportions above 20%. The structure of each single ecosystem service did not change significantly, with only numerical changes. From 1995 to 2020, the value of each ecosystem service in Xining decreased (Table 10). The water resource supply capacity of the ecosystem decreased significantly, with the service value decreasing from CNY −133.09 million in 1995 to CNY −228.02 million in 2020. This is consistent with the results of previous studies [49,51]. The next largest decrease was in food production supply services.
3.3.2. Changes in the Ecosystem Service Value on a Spatial Scale
To describe the spatial distribution of ecosystem service values in more detail, this study divides ESV into four levels: low value (0–500 CNY/ha), medium value (500–1500 CNY/ha), high value (1500–2500 CNY/ha), and extremely high value (>2500 CNY/ha). Figure 4 shows the distribution of ecosystem service values in Xining during the research period. High-value areas are mainly distributed in the mountainous areas in the northwest and southwest. Low-value areas are mainly distributed in the eastern part of the city. Most areas have medium ecosystem service values. From 1995 to 2000, the high-value area in the north significantly decreased, the extremely high-value area that had been small in size for many years dropped sharply, and the medium-value area increased. After 2000, the medium-value area further encroached on the high-value area from the periphery and advanced to the west. Low-value areas also gradually expanded at the confluence of many rivers, corresponding to the ecological processes of some forestland being converted to grassland and construction land being concentrated in the eastern valley areas.
3.3.3. Sensitivity Analysis
After adjusting the ecosystem service value coefficients in the study area, the sensitivity index for each land-use category in Xining from 1995 to 2020 is less than 1, indicating that the results are reliable (Table 11). Among them, the sensitivity index of forestland is the highest, ranging from 0.7938 to 0.9253, meaning that when the ecosystem service value coefficient of forestland increases by 1%, the total value of ecosystem services will increase by 0.7938 to 0.9253 percentage points. This is mainly because the ecosystem service value coefficient of forestland in Xining’s land-use types is relatively large. The next largest sensitivity coefficient is for grassland, mainly due to its large area. Over the past 25 years, the sensitivity indices of grassland, construction land, and water areas in Xining have all increased to varying degrees, indicating that their impact on the total value of ecosystem services has gradually increased. In contrast, the sensitivity indices of cultivated land, forestland, and unused land have decreased, suggesting that their ecosystem service value coefficients’ influence on the total value of ecosystem services has declined. Therefore, paying close attention to the changes of grassland, construction land, water, and other ecosystems is of great significance to exploring the changes in ecosystem service value.
3.4. Resident Welfare Changes
The welfare of residents in Xining City has been increasing year by year (Figure 5), with the comprehensive evaluation index rising from 0.1626 in 1995 to 0.8040 in 2020, with the fastest growth occurring from 2015 to 2020. The comprehensive evaluation index of safety and health needs and psychological needs has been increasing significantly each year, while the basic needs evaluation index first declined (1995–2005) and then increased (2005–2020). The comprehensive level of resident welfare has increased annually, but the structure has changed.
3.5. Changes in the Coupling Relationship among Landscape Patterns, Ecosystem Services, and Resident Welfare
3.5.1. Coupling Coordination Degree
Overall, the coupling state of the three systems presents an inverted “U” development trend, with the coupling degree first increasing and then decreasing, and the development relationship of the three systems always in a mismatched state (Table 12). The coupling degree of the three systems in 1995 was 0.27, between 0 and 0.3, at a low-level coupling stage. Then, the adaptation phase began in 2000, starting to balance and cooperate, showing a benign coupling trend. In 2005, it peaked at 0.88, and from 2010 on, the three systems remained in a high-level coupling state, exhibiting a strong mutual influence relationship with strong correlation and driving effects. In 2015, the coupling degree decreased, returning to the adaptation phase until the coupling degree dropped to 0.13, and the three systems returned to the low-level coupling stage. From 1995 to 2020, the coupling coordination degree of landscape pattern, ESV (ecosystem service value), and human welfare in Xining City was in the range of (0.1, 0.4), and the overall development relationship of the three systems was not coordinated, with the three systems in a state of moderate mismatch from 1995 to 2000; mild mismatch from 2005 to 2015; and severe mismatch in 2020.
3.5.2. Relative Development Degree
Considering the uncoordinated development status of the three coupled systems, this study compares and discriminates the pairwise relative development degrees of landscape connectedness, ecosystem services, and resident welfare. We track the analysis of the dominant constraining factors in the overall development stage of Xining City from 1995 to 2020. The unbalanced development of the three systems has experienced a transformation from “resident welfare and landscape connectedness lagging” to “resident welfare and ecosystem services lagging” to “ecosystem services lagging” and finally to “ecosystem services and landscape connectedness lagging” (Table 13). From 1995 to 2000, the primary constraining factor in the uncoordinated coupling of the three systems was the lag in resident welfare. Until 2015–2020, the main constraining factor shifted from the lag in resident welfare to the lag in ecosystem services and landscape connectedness. The coupling of the three systems shows an inverted “U” relationship, and the development relationship has always been in an uncoordinated state. Analyzing the relative development degree reveals that the coordinated development type shifts from the early stage of resident welfare lagging to the later stage of ecosystem services and landscape connectedness lagging. This indicates that resident welfare, ecosystem services, and landscape connectedness are developing in opposite directions.
3.6. Gray Relational Degree
The gray relational degrees of various landscape pattern indices with resident welfare range from 0.668 to 0.675 (Table 14). The correlation degree between the two falls within the range of (0.6, 0.85], indicating that the two systems are highly correlated. Among them, the largest patch index has the highest relational degree with resident welfare, with a gray relational degree of 0.675. The patch number and patch density also exhibit relatively high correlations. The gray relational degrees of various ecosystem service indices with resident welfare range from 0.670 to 0.718, indicating a high correlation level between the two systems. The highest correlation coefficient between water supply and resident welfare is 0.718. All ecosystem services in Xining City exhibit relatively high correlations with resident welfare. Among them, the top five services with a higher correlation to resident welfare are water supply, food production, environmental purification, biodiversity, and the provision of aesthetic landscape value.
4. Discussion
4.1. Drivers of Landscape Connectedness, ESV, and Resident Welfare Change
The objective of this study was to reveal the interaction coupling mechanisms between landscape connectedness, ESV, and resident welfare and that changes in landscape structure and ecosystem service value are closely related to land-use changes. Ecosystem services are essential sources of various material products and services for humans, contributing to overall well-being [69,82]. However, many human activities exceed the carrying capacity of the natural environment, negatively impacting regional ecology and sustainable development. Excessive agricultural production, mining, and construction activities, for example, have increased the complexity and discontinuity of natural landscapes [83]. This has led to landscape fragmentation and the continuous degradation of ecosystem services [84]. Human activities can alter landscape structure through land-use changes, which in turn affect ecosystem structure and function [85], ultimately influencing the ability of ecosystems to provide services [32].
This paper reveals that changes in landscape connectedness and ecosystem service value have important impacts on changes in resident welfare, mainly through land-use change. We quantified the changes in land-use types in Xining City and observed significant land-use changes during the study period. In terms of land-use transitions, grasslands have been the primary land-use type, but the area of grasslands continues to increase, especially between 1995 and 2000. The increase in grasslands is predominantly due to the conversion of forests (approximately 2/3 of the increase), which decreased by 102.94 ha2 during the five years, and 1/3 from unused land. After 2000, the amount of cultivated land decreased, with agricultural land being converted to construction land, leading to the partial development of unused land. Between 1995 and 2000, the total value of ecosystem services decreased significantly, with hydrological and climate regulation abilities decreasing the fastest, while other services experienced varying degrees of reduction. This suggests that the ecosystem services of grasslands are far lower than those of forests. The decrease in forest area and the expansion of grasslands have severely damaged the structure of ecosystems and reduced the overall value of ecosystem services. This could be a possible reason for the decline in water resource supply and food production services between 2000 and 2020, as individual ecosystem services interact with each other [86,87]. In general, the early phase saw large areas of high-ecosystem-value forests being transformed into grasslands with slightly lower values, and the impact on ecosystem services cannot be ignored. In the later period, some agricultural land was converted to construction land, negatively affecting the value of ecosystem services. This can also be confirmed in the “M” shape change trend of landscape structure. Before 2000, it was mainly the expansion of grassland and the intensification of human activities that caused the instability and fragmentation of the landscape structure. The overall level of landscape connectedness has declined. After the implementation of the Western Development Strategy in 2000, development became orderly, urbanization reached a certain stage, disturbance decreased, and human activity patches gradually aggregated. The landscape fragmentation weakened, and anthropogenic interference with the overall connectivity of Xining’s landscape structure improved. Consequently, land use change and increasing human activities have a significant correlation with the unstable and fragmented landscape structure [57].
4.2. Coupling State and Factors of Landscape Connectedness, ESV, and Resident Welfare
Based on the coupling coordination model results, the coupling state of the three systems is in a constant state of fluctuation. The early period (1995–2000) exhibited good landscape structure, high connectivity and integrity of patches, high ecosystem service values, low urbanization levels, and generally low resident welfare, with the three systems being in a moderately unbalanced state. During the mid-term (2005–2015), with urgent urban development and increasing resident welfare, landscape connectedness gradually fragmented. However, human activities had a generally improved impact on the landscape structure of Xining City, resulting in mild damage to landscape connectedness and ecosystem structures, with a slight unbalance in the development relationship among the three systems. In the later period (2015–2020), resident welfare experienced significant development, landscape structure underwent substantial changes, dominant patch agglomerations became more apparent, and patch fragmentation and heterogeneity stabilized. Some scholars have argued that landscape structure directly affects ESV and the level of human well-being, leading to an imbalance in the structure of ESV and abnormal development in the structure of resident welfare [88]. Meanwhile, the value of ecosystem services continued to decline, causing the three systems to diverge and even shift to a severely unbalanced state. At the same time, the relative development of the three systems revealed a shift from lagging resident welfare in the early period to lagging ecosystem services and landscape connectedness in the later period, suggesting that resident welfare is moving in the opposite direction from ecosystem services and landscape connectedness. The decline in ecosystem service values negatively impacts resident welfare, and the negative effect caused by the two has far exceeded the positive effect brought by improvements to resident welfare [45].
This study reveals a high correlation between landscape structure and the well-being of residents. Among them, the maximum patch index has the highest correlation with resident well-being, followed by patch number and patch density. Patch number and density have always been the primary factors influencing landscape structure in the process of human-land interaction [89]. The maximum patch index within the landscape pattern indices is a key coupling mechanism factor because forestland has been converted to grassland on a large scale, and cultivated and unused land has been occupied by construction land. Grassland is an essential means of production and production site for the majority of farmers and herders, while the expansion of construction land is an inevitable outcome of urban development. Patches of grassland and construction land types form dominant patches as regional agglomeration degrees increase. At this point, the most advantageous patches tend to highlight their influence, becoming the key factors in coupling. The ecosystem service of water resource supply has the highest correlation with local resident well-being, making it a key coupling impact factor. The prominence of water resource supply among the 11 ecosystem services is closely related to the intensifying contradiction between local water supply and demand, which also reflects the urgent need for improvements in ecological and environmental conditions [90]. Ecosystems provide essential materials for human survival and ensure the operation of human systems [91]. Water is a crucial habitat element for the ecology of the northwestern region, and it is imperative to ensure the amount of water needed to restore and maintain the healthy development of ecosystems [92]. Water resource supply plays a vital role in the stable functioning of other ecosystem services and various ecological environment constructions. Moreover, this study concludes that all ecosystem services have a high correlation with residents’ well-being, which is consistent with previous research findings [93].
4.3. Limitations and Implications
This study has certain limitations and can provide a reference for future research. First of all, the description of landscape patterns can be further deepened, and the comprehensive evaluation system of landscape connectedness can be improved. This paper mainly quantifies the change rule of landscape pattern on a macroscale without exploring the internal relationship of ecological indicators. Secondly, it is necessary to improve the comprehensive evaluation index system of residents’ welfare to fully reflect the richness and complexity of residents’ welfare. The main goal of this study is to evaluate the residents’ welfare in the whole region, so we chose the objective indicator evaluation method. The objective indicator evaluation method can quantify and compare residents’ welfare at the same time, but it is prone to conceptual absolutism [94]. Traditional factors such as income, material, and spiritual life can be the core drivers of welfare [95], but to avoid the paradox of happiness, we need to refine the meaning and assessment methods of welfare in a more comprehensive and hierarchical way [96]. However, some appropriate social surveys can make the research results more valuable for reference. In the future, social surveys covering happiness levels could be conducted in order to provide a more accurate assessment of residents’ well-being. Finally, modern research demonstrates that ecosystem services are the basis for human survival and contemporary civilization, and maintaining ecosystem services is the foundation for sustainable development [97]. Future research can also further reveal the driving mechanism of the coupling of the three by conducting qualitative and quantitative studies of land ecosystem processes and human activity simulations.
In order to quantify the coupling relationship of the system, many research methods and models are used in this paper. Landscape connectedness changes are characterized by landscape pattern indices, ecosystem service changes by value indices, and residents’ well-being changes by comprehensive evaluation indices. To investigate the coupled and coordinated states among the three, a coupling coordination model is adopted. Furthermore, the relative development degree model is employed to reveal the relative developmental level of the three, clarify the lagging factors in their coupling coordination, and identify key factors affecting the coupling mechanism through the gray relational model. In terms of research methods, we have carried out a relatively complete research analysis, and this quantitative method will make the correlation between the three more clear.
For decades, grassland has been the primary source of income for residents in Xining City, and promoting local economic development through the livestock industry is essential [38]. In this process, rural towns tend to agglomerate, and human activities have some impact on the landscape structure. Both the spatial expansion of urban growth and the ecological process of landscape change are self-organizing processes, but they can have a significant impact on the course of the system through different development policies and land use control strategies [98]. On the basis of the coupling and coordination relationships and the relative degrees of development among the three systems of landscape connectedness, ecosystem service value, and residents’ welfare, we analyzed the main influencing factors of the association-coupling model, which can be used in land use planning by considering ecological protection planning control. At the same time, relying on the concept of sustainable development, the corresponding flexible control and development strategies could be formulated [99].
According to the previous analysis, under the original development pattern of the city, the well-being of the residents may improve for a period of time, but to a rather limited extent. The continuous expansion of construction land and grassland promotes the growth of human activity patches, and the functional demand and value solution for ecosystem services will continue to rise [100]. The shrinking of ecological function patches such as forests and watersheds adversely affects the connectedness of the landscape structure, which in turn affects the flow of ecosystem services and information, and the goods and services provided by ecosystem services become rather limited to meet the relative level of development of the population’s well-being. In the future, the polarization between human activities and the ecological environment will become more and more serious, which is not conducive to sustainable development. By carrying out ecological protection in time for the trend of ecosystem service degradation in Xining City over the past 25 years in accordance with the principle of ecological prioritization and prevention, the government could intervene with ecological measures on the lagging landscape structure from the perspective of land use. For example, in this study, grassland, as a relatively concentrated landscape patch occupying a large area, has a greater impact on the ecological landscape structure and ecosystem service function in terms of its change and expansion trend. At the same time, livestock land and water areas play an important role in the local socio-economic ecosystem and the well-being of the residents. Therefore, close attention to, observation, and monitoring of the more connected and ecologically important patch types has become a high priority in the field of ecological and landscape planning. In this scenario, the promotion of forest and grass cultivation to increase the forest area, protect wetlands and water bodies, and avoid excessive encroachment of grasslands into the forest area can prevent further reduction of the forest area. Secondly, the orderly implementation of forest closure and grassland cultivation and the formulation of reasonable ecological compensation standards will help prevent the instability of ecosystem services and landscape structure from negatively affecting the well-being of the population, rectify the continued imbalance in the development relationships between the three systems, and ensure the stable functioning of ecosystem services, contributing to the happiness and ecological security of resident welfare in a more abundant and lasting way.
5. Conclusions
This study evaluates landscape connectedness, ecosystem service value, and residents’ well-being quantitatively through comprehensive analysis and mainly uses the coupling coordination model and relative development degree model to reveal the coupled development relationship between landscape connectedness, ecosystem services, and residents’ well-being in Xining City from 1995 to 2020. The results show that:
The development trend of landscape types was moving toward diversification and balance, and the total value of ecosystem services has been declining. The comprehensive level of resident welfare has increased annually, but the structure has changed.
The coupling relationship among landscape connectedness, ecosystem service value, and resident welfare is strong and has remained at a high correlation level but has been in a state of discord.
The main constraint of the discord in the early stage was resident welfare, but the constraining factors in the later stage shifted to ecosystem services and landscape connectedness. The largest patch index and water resource supply were the key influencing factors in the system coupling mechanism.
Author Contributions
Conceptualization, L.L. and H.W.; Data curation, C.Y.; Funding acquisition, H.W.; Investigation, C.Y.; Methodology, C.Y.; Visualization, C.Y.; Writing—original draft, C.Y.; Writing—review and editing, H.W. All authors have read and agreed to the published version of the manuscript.
Funding
This research was funded by the Second Tibetan Plateau Scientific Expedition and Research Program (2019QZKK0608).
Data Availability Statement
Not applicable.
Conflicts of Interest
The authors declare no conflict of interest.
References
- Churchill, E. Environmental degradation and human well-being: Report of the millennium ecosystem assessment. Popul. Dev. Rev. 2005, 31, 389–398. [Google Scholar]
- Cao, Y.; Kong, L.; Zhang, L.; Ouyang, Z. The balance between economic development and ecosystem service value in the process of land urbanization: A case study of China’s land urbanization from 2000 to 2015. Land Use Policy 2021, 108, 105536. [Google Scholar] [CrossRef]
- He, C.; Liu, Z.; Wu, J.; Pan, X.; Fang, Z.; Li, J.; Bryan, B.A. Future global urban water scarcity and potential solutions. Nat. Commun. 2021, 12, 4667. [Google Scholar] [CrossRef] [PubMed]
- Ostrom, E. General Framework for Analyzing Sustainability of Social-Ecological Systems. Science 2009, 325, 419–422. [Google Scholar] [CrossRef]
- Costanza, R.; D’Arge, R.; de Groot, R.; Farber, S.; Grasso, M.; Hannon, B.; Limburg, K.; Naeem, S.; O’Neill, R.V.; Paruelo, J.; et al. The value of the world’s ecosystem services and natural capital. Nature 1997, 387, 253–260. [Google Scholar] [CrossRef]
- Costanza, R.; de Groot, R.; Sutton, P.; van der Ploeg, S.; Aderson, S.J.; Kubiszewski, I.; Farber, S.; Turner, R.K. Changes in the global value of ecosystem services. Glob. Environ. Chang. 2014, 26, 152–158. [Google Scholar] [CrossRef]
- Wei, H.; Liu, H.; Xu, Z.; Ren, J.; Lu, N.; Fan, W.; Zhang, P.; Dong, X. Linking ecosystem services supply, social demand and human well-being in a typical mountain-oasis-desert area, Xinjiang, China. Ecosyst. Serv. 2018, 31, 44–57. [Google Scholar] [CrossRef]
- Kates, R.W.; Parris, T.M.; Leiserowitz, A.A. What is sustainable development? Goals, indicators, values, and practice. Environ. Sci. Policy Sustain. Dev. 2005, 47, 8–21. [Google Scholar]
- Mengist, W.; Soromessa, T.; Legese, G. Ecosystem services research in mountainous regions: A systematic literature review on current knowledge and research gaps. Sci. Total Environ. 2020, 702, 134581. [Google Scholar] [CrossRef]
- Cao, Q.; Yu, D.; Georgescu, M.; Han, Z.; Wu, J. Impacts of land use and land cover change on regional climate: A case study in the agro-pastoral transitional zone of China. Environ. Res. Lett. 2015, 10, 124025. [Google Scholar] [CrossRef]
- Yushanjiang, A.; Zhang, F.; Yu, H.; Kung, H.-t. Quantifying the spatial correlations between landscape pattern and ecosystem service value: A case study in Ebinur Lake Basin, Xinjiang, China. Ecol. Eng. 2018, 113, 94–104. [Google Scholar] [CrossRef]
- Fu, B.J.; Chen, L.X.; Wang, J.; Meng, Q.H.; Zhao, W.W. Land Use Structure and Ecological Processes. Quat. Sci. 2003, 23, 247–255. [Google Scholar]
- Liu, H.Y.; Li, Z.F. Effects of Land Use/Cover Change on Wetland Landscape of Honghe Nature Reserve. Acta Geogr. Sin. 2007, 62, 1215. [Google Scholar]
- Sun, X.B.; Liu, Y.H. Effects of Land Use Change on Wetland Landscape Connectivity and Optimization Assessment of Connectivity -A Case Study of Wetlands in the Coastal Zone of Yancheng Jiangsu. J. Nat. Resour. 2010, 25, 892–903. [Google Scholar]
- Sanchirico, J.N.; Mumby, P. Mapping ecosystem functions to the valuation of ecosystem services: Implications of species-habitat associations for coastal land-use decisions. Theor. Ecol. 2009, 2, 67–77. [Google Scholar] [CrossRef]
- Maes, J.; Paracchini, M.L.; Zulian, G.; Dunbar, M.B.; Alkemade, R. Synergies and trade-offs between ecosystem service supply, biodiversity, and habitat conservation status in europe. Biol. Conserv. 2012, 155, 1–12. [Google Scholar] [CrossRef]
- Fu, B.; Zhang, L.; Xu, Z.; Zhao, Y.; Wei, Y.; Skinner, D. Ecosystem services in changing land use. J. Soils Sediments 2015, 15, 833–843. [Google Scholar] [CrossRef]
- Wang, X.; Dong, X.; Liu, H.; Wei, H.; Fan, W.; Lu, N.; Xu, Z.; Ren, J.; Xing, K. Linking land use change, ecosystem services and human well-being: A case study of the manas river basin of Xinjiang, China. Ecosyst. Serv. 2017, 27, 113–123. [Google Scholar] [CrossRef]
- Dong, X.B.; Liu, M.X. Relationships among LUCC, ecosystem services and human well-being. J. Beijing Norm. Univ. (Nat. Sci.) 2022, 58, 465–475. [Google Scholar]
- Wu, J. Landscape sustainability science: Ecosystem services and human well-being in changing landscapes. Landsc. Ecol. 2013, 28, 999–1023. [Google Scholar] [CrossRef]
- Niu, W.Y. The theoretical connotation of sustainable development: The 20th Anniversary of UN Conference on Environment and Development in Rio de Janeiro, Brazil. China Popul. Resour. Environ. 2012, 22, 9–14. [Google Scholar]
- Riao, D.; Zhu, X.; Tong, Z.; Zhang, J.; Wang, A. Study on Land Use/Cover Change and Ecosystem Services in Harbin, China. Sustainability 2020, 12, 6076. [Google Scholar] [CrossRef]
- Gomes, E.; Inacio, M.; Bogdzevi, K.; Kalinauskas, M.; Karnauskait, D.; Pereira, P. Future land-use changes and its impacts on terrestrial ecosystem services: A review. Sci. Total Environ. 2021, 781, 146716. [Google Scholar] [CrossRef] [PubMed]
- Duan, X.Y.; Chen, Y.; Wang, L.Q.; Zheng, G.D.; Tao, L. The impact of land use and land cover changes on the landscape pattern and ecosystem service value in San jiang yuan region of the Qinghai-Tibet Plateau. J. Environ. Manag. 2023, 325, 116539. [Google Scholar] [CrossRef]
- Summers, J.K.; Smith, L.M.; Case, J.L.; Linthurst, R.A. A review of the elements of human well-being with an emphasis on the contribution of ecosystem services. Ambio 2012, 41, 327–340. [Google Scholar] [CrossRef]
- Yang, W.; Tao, J.; Lu, Q. Methodologies of human well-bein g assessment from the ecosystem service perspective. Acta Ecol. Sin. 2021, 41, 730–736. [Google Scholar]
- Chen, L.X.; Fu, B.J. The Ecological Significance and Application of Landscape Connectivity. Chin. J. Ecol. 1996, 15, 37–42. [Google Scholar]
- Mcgarigal, K.S.; Cushman, S.A.; Neel, M.C.; Ene, E. Spatial Pattern Analysis Program for Categorical Maps; Fragstats: Amherst, MA, USA, 2002. [Google Scholar]
- Wang, B.J.; Tang, H.P. Human well-being and its applications and prospects in ecology. J. Ecol. Rural Environ. 2016, 32, 697–702. [Google Scholar]
- Fan, M.; Xiao, Y.T. Impacts of the grain for Green Program on the spatial pattern of land uses and ecosystem services in mountainous settlements in southwest China. Glob. Ecol. Conserv. 2020, 21, e00806. [Google Scholar] [CrossRef]
- Rodriguez-Echeverry, J.; Echeverria, C.; Oyarzun, C.; Morales, L. Impact of land-use change on biodiversity and ecosystem services in the chilean temperate forests. Landsc. Ecol. 2018, 33, 439–453. [Google Scholar] [CrossRef]
- Mitchell, M.G.E.; Suarez-Castro, A.F.; Martinez-Harms, M.; Maron, M.; McAlpine, C.; Gaston, K.J.; Johansen, K.; Rhodes, J.R. Reframing landscape fragmentation’s effects on ecosystem services. Trends Ecol. Evol. 2015, 30, 190–198. [Google Scholar] [CrossRef] [PubMed]
- Wang, F.; Yuan, X.; Zhou, L.; Zhang, M. Integrating ecosystem services and landscape connectivity to construct and optimize ecological security patterns: A case study in the central urban area Chongqing municipality, China. Environ Sci Pollut Res. 2022, 29, 43138–43154. [Google Scholar] [CrossRef] [PubMed]
- Goodwin, B.J.; Fahrig, L. How does landscape structure influence landscape connectivity? Oikos 2002, 99, 552–570. [Google Scholar] [CrossRef]
- Haddad, N.M.; Brudvig, L.A.; Clobert, J.; Davies, K.F.; Gonzalez, A.; Holt, R.D.; Lovejoy, T.E.; Sexton, J.O.; Austin, M.P.; Collins, C.D.; et al. Habitat fragmentation and its lasting impact on Earth’s ecosystems. Sci. Adv. 2015, 1, e1500052. [Google Scholar] [CrossRef]
- Fletcher, R.J., Jr.; Didham, R.K.; Banks-Leite, C.; Barlow, J.; Ewers, R.M.; Rosindell, J.; Holt, R.D.; Gonzalez, A.; Pardini, R.; Damschen, E.I.; et al. Is habitat fragmentation good for biodiversity? Biol. Conserv. 2018, 226, 9–15. [Google Scholar] [CrossRef]
- Horcea-Milcu, A.-I.; Leventon, J.; Hanspach, J.; Fischer, J. Disaggregated contributions of ecosystem services to human well-being: A case study from eastern europe. Reg. Environ. Chang. 2016, 16, 1779–1791. [Google Scholar] [CrossRef]
- Zhen, S.J.; Cao, G.C.; Yuan, J.; Jiang, G. The assessment of changes of urban ecological land spatial structure and its ecosystem service value in Xining. Yunnan Geogr. Environ. Res. 2016, 28, 56–62. [Google Scholar]
- Wu, G.L.; Du, G.Z. Discussion on ecological construction and sustainable development of degraded Alpine grassland ecosystem of the Qinghai-Tibetan Plateau. Chin. J. Nat. 2007, 29, 159–164. [Google Scholar]
- Li, J.H.; Yang, G.J.; Wang, S.P. Vegetation and soil characteristics of degraded alpine meadows on the Qinghai-Tibet Plateau, China: A review. Chin. J. Appl. Ecol. 2020, 31, 2109–2118. [Google Scholar]
- Li, A.; Mi, C.H.; Yang, Y.Y.; Shi, R.G.; Hu, S.W.; Li, J. Spatial-temporal differentiation and coupling coordination between ecosystem services and human well-being in Beijing-Tianjin-Hebei region. Ecol. Econ. 2023, 39, 170–178. [Google Scholar]
- Clerici, N.; Cote-Navarro, F.; Escobedo, F.J.; Rubiano, K.; Camilo Villegas, J. Spatio-temporal and cumulative effects of land use-land cover and climate change on two ecosystem services in the colombian andes. Sci. Total Environ. 2019, 685, 1181–1192. [Google Scholar] [CrossRef] [PubMed]
- Wu, J. Linking landscape, land system and design approaches to achieve sustainability. J. Land Use Sci. 2019, 14, 173–189. [Google Scholar] [CrossRef]
- Cheng, X.; Tao, Y.; Ou, W. Research Progress on the Relationship between Ecosystem Service and Human Well-being. J. Ecol. Rural Environ. 2021, 37, 885–893. [Google Scholar]
- Hu, Z.; Yang, X.; Yang, J.; Yuan, J.; Zhang, Z. Linking landscape pattern, ecosystem service value, and human well-being in xishuangbanna, southwest China: Insights from a coupling coordination model. Glob. Ecol. Conserv. 2021, 27, e01583. [Google Scholar] [CrossRef]
- Tang, J.; Li, Y.; Cui, S.; Xu, L.; Ding, S.; Nie, W. Linking land-use change, landscape patterns, and ecosystem services in a coastal watershed of southeastern China. Glob. Ecol. Conserv. 2020, 23, e01177. [Google Scholar] [CrossRef]
- Han, Z.; Song, W.; Deng, X. Responses of Ecosystem Service to Land Use Change in Qinghai Province. Energies 2016, 9, 303. [Google Scholar] [CrossRef]
- Chen, K.L.; Su, M.X.; Li, S.C.; Lu, J.H.; Chen, Y.Y.; Zhang, F.; Liu, Z.J. The health assessment of the urban ecosystem of Xining city. Geogr. Res. 2010, 29, 214–222. [Google Scholar]
- Fu, Y.; Xiao, J.S.; Jiao, R.X.; Sa, W.J.; Li, X.L. Analysis and simulation prediction on LUCC of Xining city based on RS and GIS. Trans. Chin. Soc. Agric. Eng. 2009, 25, 211–218. [Google Scholar]
- Feng, S.; Gao, X.; Kang, J.; Wu, G.; Zou, C.; Yang, J. Research on Land Use/cover Change and Urban Expansion in Xining City in Recent 30 Years. Arid Zone Res. 2012, 29, 129–136. [Google Scholar]
- Wang, X.M.; Chai, Y.W.; Cheng, C.; Pu, Y.Z. Impact assessment of ecological service value in the rapid urbanization areas of Qinghai-Tibet Plateau: A case study of Xining. China Popul. Resour. Environ. 2014, 24 (Suppl. S2), 435–439. [Google Scholar]
- Liu, J.; Zhuang, D.; Zhang, Z.; Gao, Z.; Deng, X. The establishment of land-use spatial-temporal database and its relative studies in China. Geoinf. Sci 2002, 4, 3–7. [Google Scholar]
- Wu, C.G.; Zhou, Z.X.; Wang, P.C.; Xiao, W.F.; Teng, M.J. The concept and measurement of landscape connectivity and its applications. Acta Ecol. Sin. 2010, 30, 1903–1910. [Google Scholar]
- Zhang, J.; Qu, M.; Wang, C.; Zhao, J.; Cao, Y. Quantifying landscape pattern and ecosystem service value changes: A case study at the county level in the Chinese Loess Plateau. Glob. Ecol. Conserv. 2020, 23, e1110. [Google Scholar] [CrossRef]
- Cushman, S.A.; McGarigal, K.; Neel, M.C. Parsimony in landscape metrics: Strength, universality, and consistency. Ecol. Indic. 2008, 8, 691–703. [Google Scholar] [CrossRef]
- Hou, L.; Wu, F.; Xie, X. The spatial characteristics and relationships between landscape pattern and ecosystem service value along an urban-rural gradient in Xi’an city, China. Ecol. Indic. 2020, 108, 105720. [Google Scholar] [CrossRef]
- Lv, Y.; Chen, L.; Fu, B. Analysis of the integrating approach on landscape pattern and ecological processes. Prog. Geogr. 2007, 26, 1–10. [Google Scholar]
- O’Neill, R.V.; Krummel, J.R.; Gardner, R.H.; Sugihara, G.; Jackson, B.; DeAngelis, D.L.; Milne, B.T.; Turner, M.G.; Zygmunt, B.; Christensen, S.W.; et al. Indices of landscape pattern. Landsc. Ecol. 1988, 1, 153–162. [Google Scholar] [CrossRef]
- Zhu, Y.; Tian, D.; Yan, F. Effectiveness of Entropy Weight Method in Decision-Making. Math. Probl. Eng. 2020, 2020, 3564835. [Google Scholar] [CrossRef]
- Zhang, Z.; Xia, F.; Yang, D.; Huo, J.; Wang, G.; Chen, H. Spatiotemporal characteristics in ecosystem service value and its interaction with human activities in Xinjiang, China. Ecol. Indic. 2020, 110, 105826. [Google Scholar] [CrossRef]
- Zhao, S.D.; Zhang, Y.M. Concepts, contents and challenges of ecosystem—Introduction to ‘Ecosystems and Human Well-being: A Framework for Assessment’. Adv. Earth Sci. 2004, 19, 650–657. [Google Scholar]
- Xie, G.D.; Lu, C.X.; Len, Y.F.; Zheng, D.; Li, S.C. Ecological assets valuation of the Tibetan Plateau. J. Nat. Resour. 2003, 18, 189–196. [Google Scholar]
- Xie, G.D.; Zhen, L.; Lu, C.X.; Xiao, Y.; Chen, C. Expert knowledge based valuation method of ecosystem services in China. J. Nat. Resour. 2008, 23, 911–919. [Google Scholar]
- Xie, G.D.; Zhang, C.X.; Zhang, L.M.; Chen, W.H.; Li, S.M. Improvement of the evaluation method for ecosystem service value based on per Unit area. J. Nat. Resour. 2015, 30, 1243–1254. [Google Scholar]
- Liu, Q.; Li, G.; Zhang, C.; Zhao, L.; Zhu, Y.M. Study on dynamic changes in ecosystem service values in Qinglong County based on coefficient correction. Chin. J. Eco-Agric. 2019, 27, 971–980. [Google Scholar]
- Aschonitis, V.G.; Gaglio, M.; Castaldelli, G.; Fano, E.A. Criticism on elasticity-sensitivity coefficient for assessing the robustness and sensitivity of ecosystem services values. Ecosyst. Serv. 2016, 20, 66–68. [Google Scholar] [CrossRef]
- Kreuter, U.P.; Harris, H.G.; Matlock, M.D.; Lacey, R.E. Change in ecosystem services values in the san antonio area, Texas. Ecol. Econ. 2001, 39, 333–346. [Google Scholar] [CrossRef]
- Millennium Ecosystem Assessment (MEA). Ecosystems and Human Well-Being: Health Synthesis; Island Press: Washington, DC, USA, 2005. [Google Scholar]
- Huang, G.L.; Jiang, Y.Q.; Liu, Z.F.; Nie, M.; Liu, Y.; Li, J.W.; Wu, J. Advances in human well-being research: A sustainability science perspective. Acta Ecol. Sin. 2016, 36, 7519–7527. [Google Scholar]
- Leisher, C.; Samberg, L.H.; Van Buekering, P.; Sanjayan, M. Focal Areas for Measuring the Human Well-Being Impacts of a Conservation Initiative. Sustainability 2013, 5, 997–1010. [Google Scholar] [CrossRef]
- Yang, H. Changes in human well-being and rural livelihoods under natural disasters. Ecol. Econ. 2018, 151, 184–194. [Google Scholar] [CrossRef]
- Liu, D.; Zhang, J.; Gong, J.; Qian, C. Spatial and temporal relations among land-use intensity, ecosystem services, and human well-being in the longzhong loess hilly region:A case study of the anding district, gansu province. Acta Ecol. Sin. 2019, 39, 637–648. [Google Scholar]
- Li, H.M.; Zhang, A.L. Ecological protection and well-being. Acta Ecol. Sin. 2013, 33, 825–833. [Google Scholar]
- Li, A.; Yang, Y.Y.; Shi, R.G.; Hu, S.W.; Mi, C.H. Research progress on human well-being and its relationship with ecosystem services. J. Agric. Resour. Environ. 2022, 39, 948–957. [Google Scholar]
- Wei, H.; Yang, Y.; Han, Q.; Li, L.; Huang, J.; Liu, M.; Chen, W. Evaluation and System Coupling of Beautiful Qinghai–Tibet Plateau Construction Based on Point of Interest Data. Systems 2022, 10, 149. [Google Scholar] [CrossRef]
- Zhao, J.J.; Liu, Y.; Zhu, Y.K.; Qin, S.L.; Wang, Y.H.; Miao, C.H. Spatiotemporal differentiation and influencing factors of the coupling and coordinated development of new urbanization and ecological environment in the Yellow River Basin. Resour. Sci. 2020, 42, 159–171. [Google Scholar] [CrossRef]
- Liu, H.; Zhang, Y.; Zheng, W.S. Evaluation on spatio-temporal development and interaction of intensive urban land use and urbanization: Case studies of the cities in the Bohai Rim Region. Geogr. Res. 2011, 30, 1805–1817. [Google Scholar]
- Bi, G.H.; Yang, Q.Y.; Liu, S. Coupling coordination development between ecological civilization construction and urbanization in China. Econ. Geogr. 2017, 37, 50–58. [Google Scholar]
- Yang, R.; Liu, Y.S.; Long, H.L. The study on non-agricultural transformation co-evolution characteristics of “population-land-industry”: Case study of the Bohai Rim in China. Geogr. Res. 2015, 34, 475–486. [Google Scholar]
- Zhu, W.J.; Sun, H. Research on the coupling relative development of land use benefit system in Jiangsu Province. Chin. J. Soil Sci. 2019, 50, 520–528. [Google Scholar]
- Kuo, Y.; Yang, T.; Huang, G. The use of grey relational analysis in solving multiple attribute decision-making problems. Comput. Ind. Eng. 2008, 55, 80–93. [Google Scholar] [CrossRef]
- Leviston, Z.; Walker, I.; Green, M.; Price, J. Linkages between ecosystem services and human wellbeing: A Nexus Webs approach. Ecol. Indic. 2018, 93, 658–668. [Google Scholar] [CrossRef]
- De Groot, R.; Brander, L.; van der Ploeg, S.; Costanza, R.; Bernard, F.; Braat, L.; Christie, M.; Crossman, N.; Ghermandi, A.; Hein, L.; et al. Global estimates of the value of ecosystems and their services in monetary units. Ecosyst. Serv. 2012, 1, 50–61. [Google Scholar] [CrossRef]
- Liu, M.; Xu, Y.Y.; Hu, Y.M.; Li, C.L.; Sun, F.Y.; Chen, T. A Century of the Evolution of the Urban Area in Shenyang, China. PLoS ONE 2014, 9, e098847. [Google Scholar] [CrossRef] [PubMed]
- Liu, B.; Pan, L.B.; Qi, Y.; Guan, X.; Li, J.S. Land Use and Land Cover Change in the Yellow River Basin from 1980 to 2015 and Its Impact on the Ecosystem Services. Land 2021, 10, 1080. [Google Scholar] [CrossRef]
- Xu, D.; Ding, X. Assessing the impact of desertification dynamics on regional ecosystem service value in North China from 1981 to 2010. Ecosyst. Serv. 2018, 30, 172–180. [Google Scholar] [CrossRef]
- Yu, Z.; Liu, X.; Zhang, J.; Xu, D.; Cao, S. Evaluating the net value of ecosystem services to support ecological engineering: Framework and a case study of the Beijing Plains afforestation project. Ecol. Eng. 2018, 112, 148–152. [Google Scholar] [CrossRef]
- Liu, M.; Wei, H.; Dong, X.; Wang, X.-C.; Zhao, B.; Zhang, Y. Integrating Land Use, Ecosystem Service, and Human Well-Being: A Systematic Review. Sustainability 2022, 14, 6926. [Google Scholar] [CrossRef]
- Niedertscheider, M.; Kuemmerle, T.; Müller, D.; Erb, K.H. Exploring the effects of drastic institutional and socio-economic changes on land system dynamics in Germany between 1883 and 2007. Glob. Environ. Chang. 2014, 28, 98–108. [Google Scholar] [CrossRef]
- Ouyang, Z.Y.; Zhao, T.Q.; Wang, X.K.; Miao, H. Ecosystem services analyses and valuation of China terrestrial surface water system. Acta Ecol. Sin. 2004, 24, 2091–2099. [Google Scholar]
- Raudsepp-Hearne, C.; Peterson, G.D.; Tengö, M.; Bennett, E.M.; Holland, T.; Benessaiah, K.; MacDonald, G.K.; Pfeifer, L. Untangling the Environmentalist’s Paradox: Why Is Human Well-being Increasing as Ecosystem Services Degrade? BioScience 2010, 60, 576–589. [Google Scholar] [CrossRef]
- Wang, F.; Liang, R.L.; Yang, X.L.; Chen, M.J. A study of ecological water requirements in northwest China: Theoretical analysis. J. Nat. Resour. 2002, 17, 1–8. [Google Scholar]
- Jones, S.K.; Boundaogo, M.; DeClerck, F.A.; Estrada-Carmona, N.; Mirumachi, N.; Mulligan, M. Insights into the importance of ecosystem services to human well-being in reservoir landscapes. Ecosyst. Serv. 2019, 39, 100987. [Google Scholar] [CrossRef]
- Xia, P.X.; Yang, X.Y.; Gao, Q.C. Reviews on the Method of Well-being Measurement. J. Stat. Inf. 2011, 26, 3–9. [Google Scholar]
- Wang, S.Y. Driving factors and spatiotemporal differentiation of human well-being change in China. Prog. Geogr. 2016, 35, 632–643. [Google Scholar]
- Tang, F.L.; Lei, P.F. Income Gap, Human happiness and public expenditure policy: Based on empirical research of the survey data of CGSS. Econ. Perspect. 2014, 4, 41–55. [Google Scholar]
- Ouyang, Z.Y.; Wang, R.S.; Zhao, J.Z. Ecosystem services and their economic valuation. Chinese J. Appl. Ecol. 1999, 10, 635–640. [Google Scholar]
- You, H.; Yang, X. Urban expansion in 30 megacities of China: Categorizing the driving force profiles to inform the urbanization policy. Land Use Policy 2017, 68, 531–551. [Google Scholar] [CrossRef]
- Li, B.; Wang, Y.; Wang, T.; He, X.; Kazak, J.K. Scenario Analysis for Resilient Urban Green Infrastructure. Land 2022, 11, 1481. [Google Scholar] [CrossRef]
- Li, W.; Xie, S.; Wang, Y.; Huang, J.; Cheng, X. Effects of urban expansion on ecosystem health in Southwest China from a multi-perspective analysis. J. Clean. Prod. 2021, 294, 126341. [Google Scholar] [CrossRef]
Figure 1.
Location of the study area. (a) China, (b) Qinghai Province and (c) Xining City.

Figure 2.
Spatial distribution of land use type changes in Xining from 1995 to 2020.

Figure 3.
Xining’s four ecosystem service values from 1995 to 2020 (unit: billion CNY).

Figure 4.
Spatial distribution of ecosystem service values in Xining from 1995 to 2020.

Figure 5.
Time-varying changes in the comprehensive evaluation index of resident welfare in Xining City from 1995 to 2020. Note: BN—Basic Needs; SHN—Security and Health Needs; PN—Psychological Needs; RW—Resident Welfare.
Figure 5.
Time-varying changes in the comprehensive evaluation index of resident welfare in Xining City from 1995 to 2020. Note: BN—Basic Needs; SHN—Security and Health Needs; PN—Psychological Needs; RW—Resident Welfare.


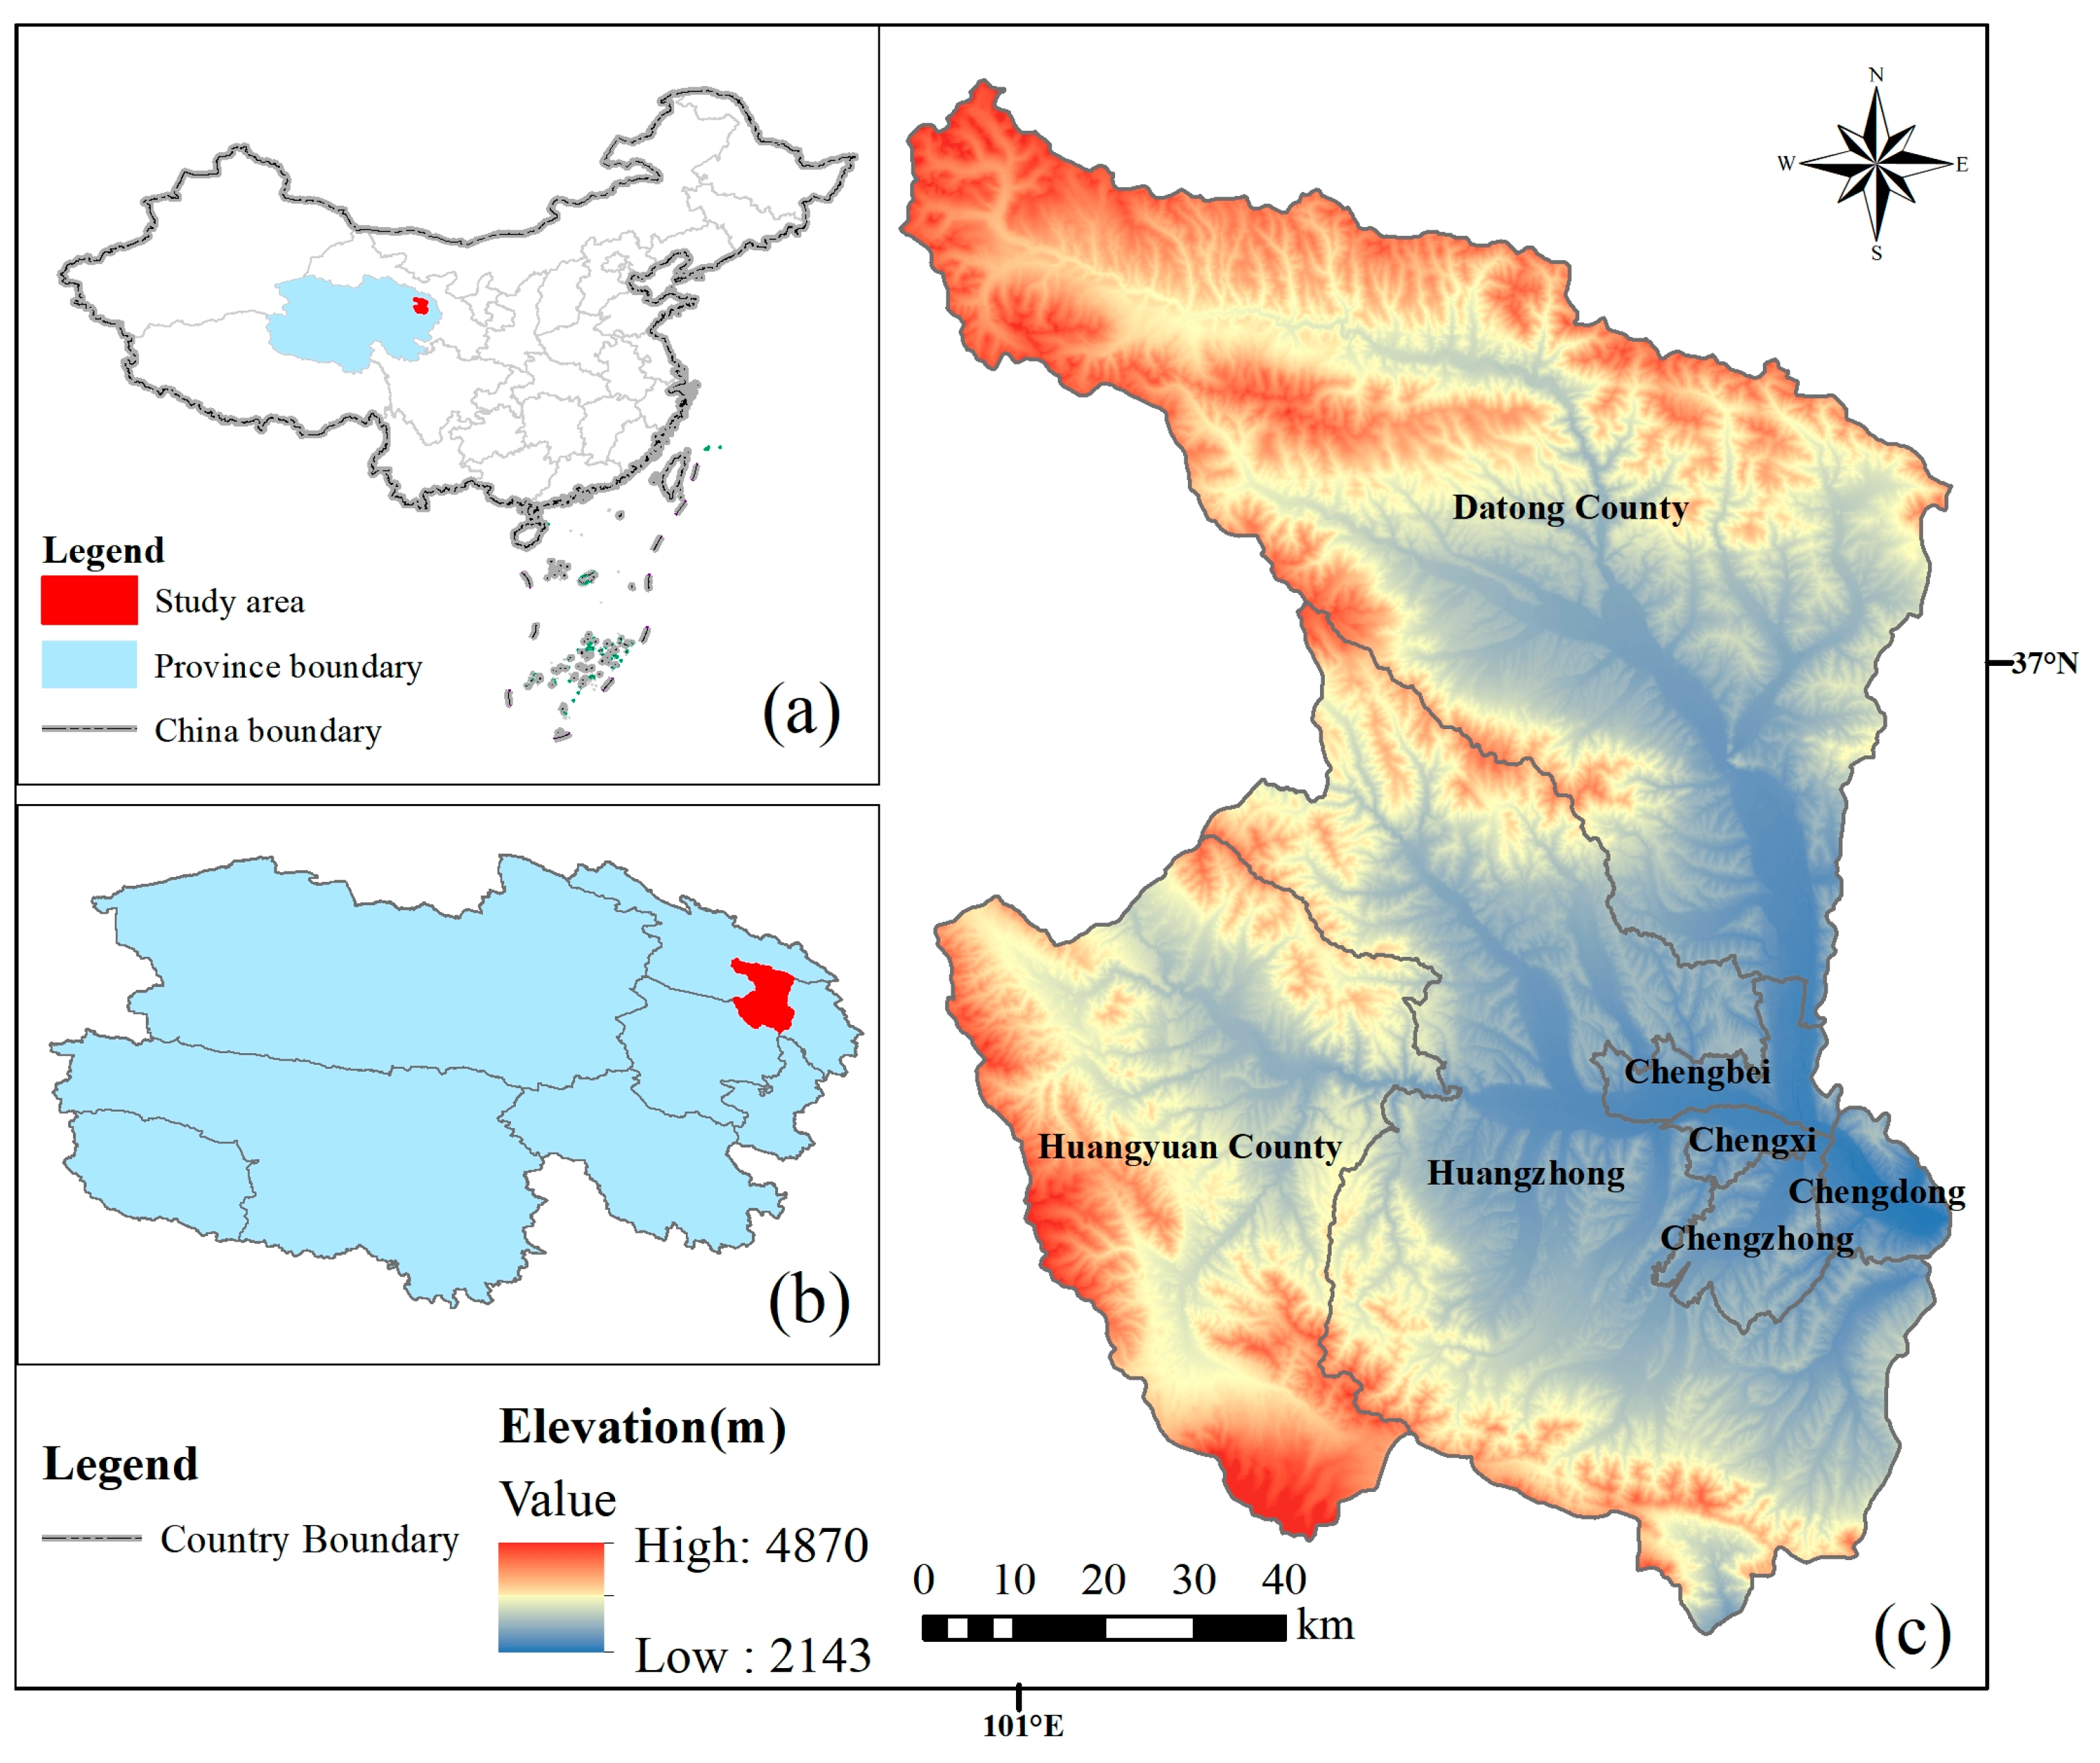
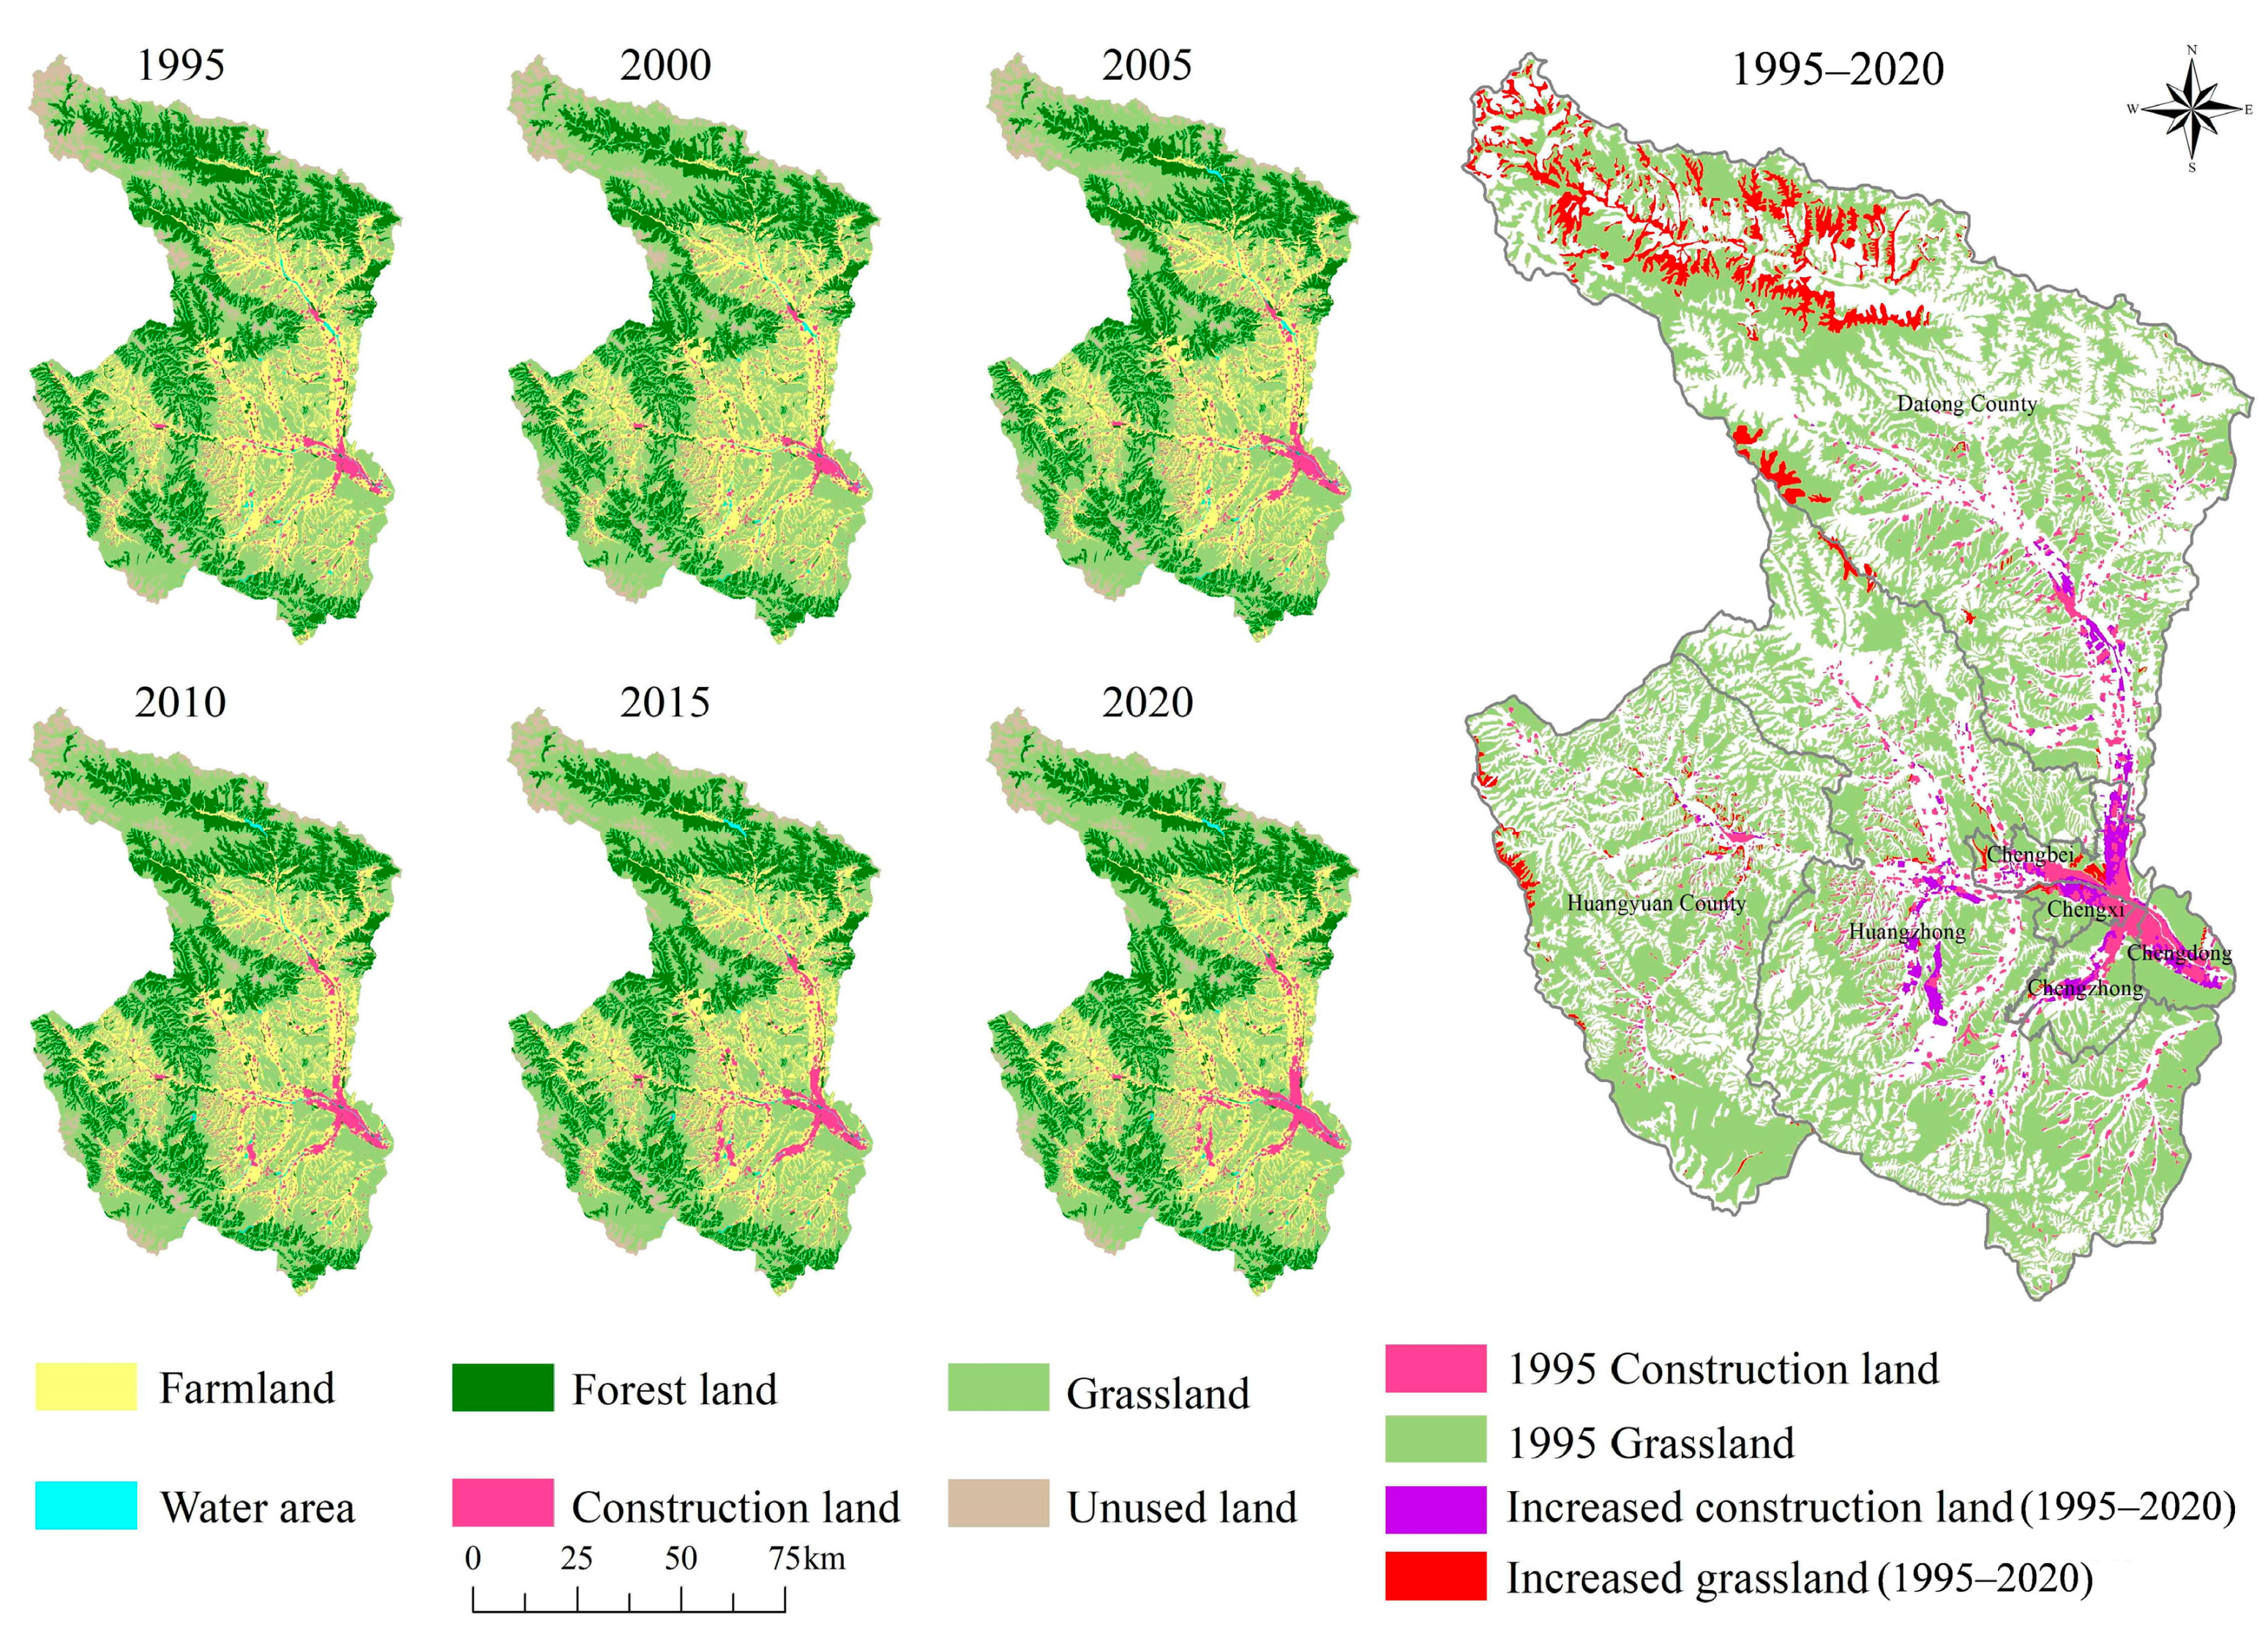
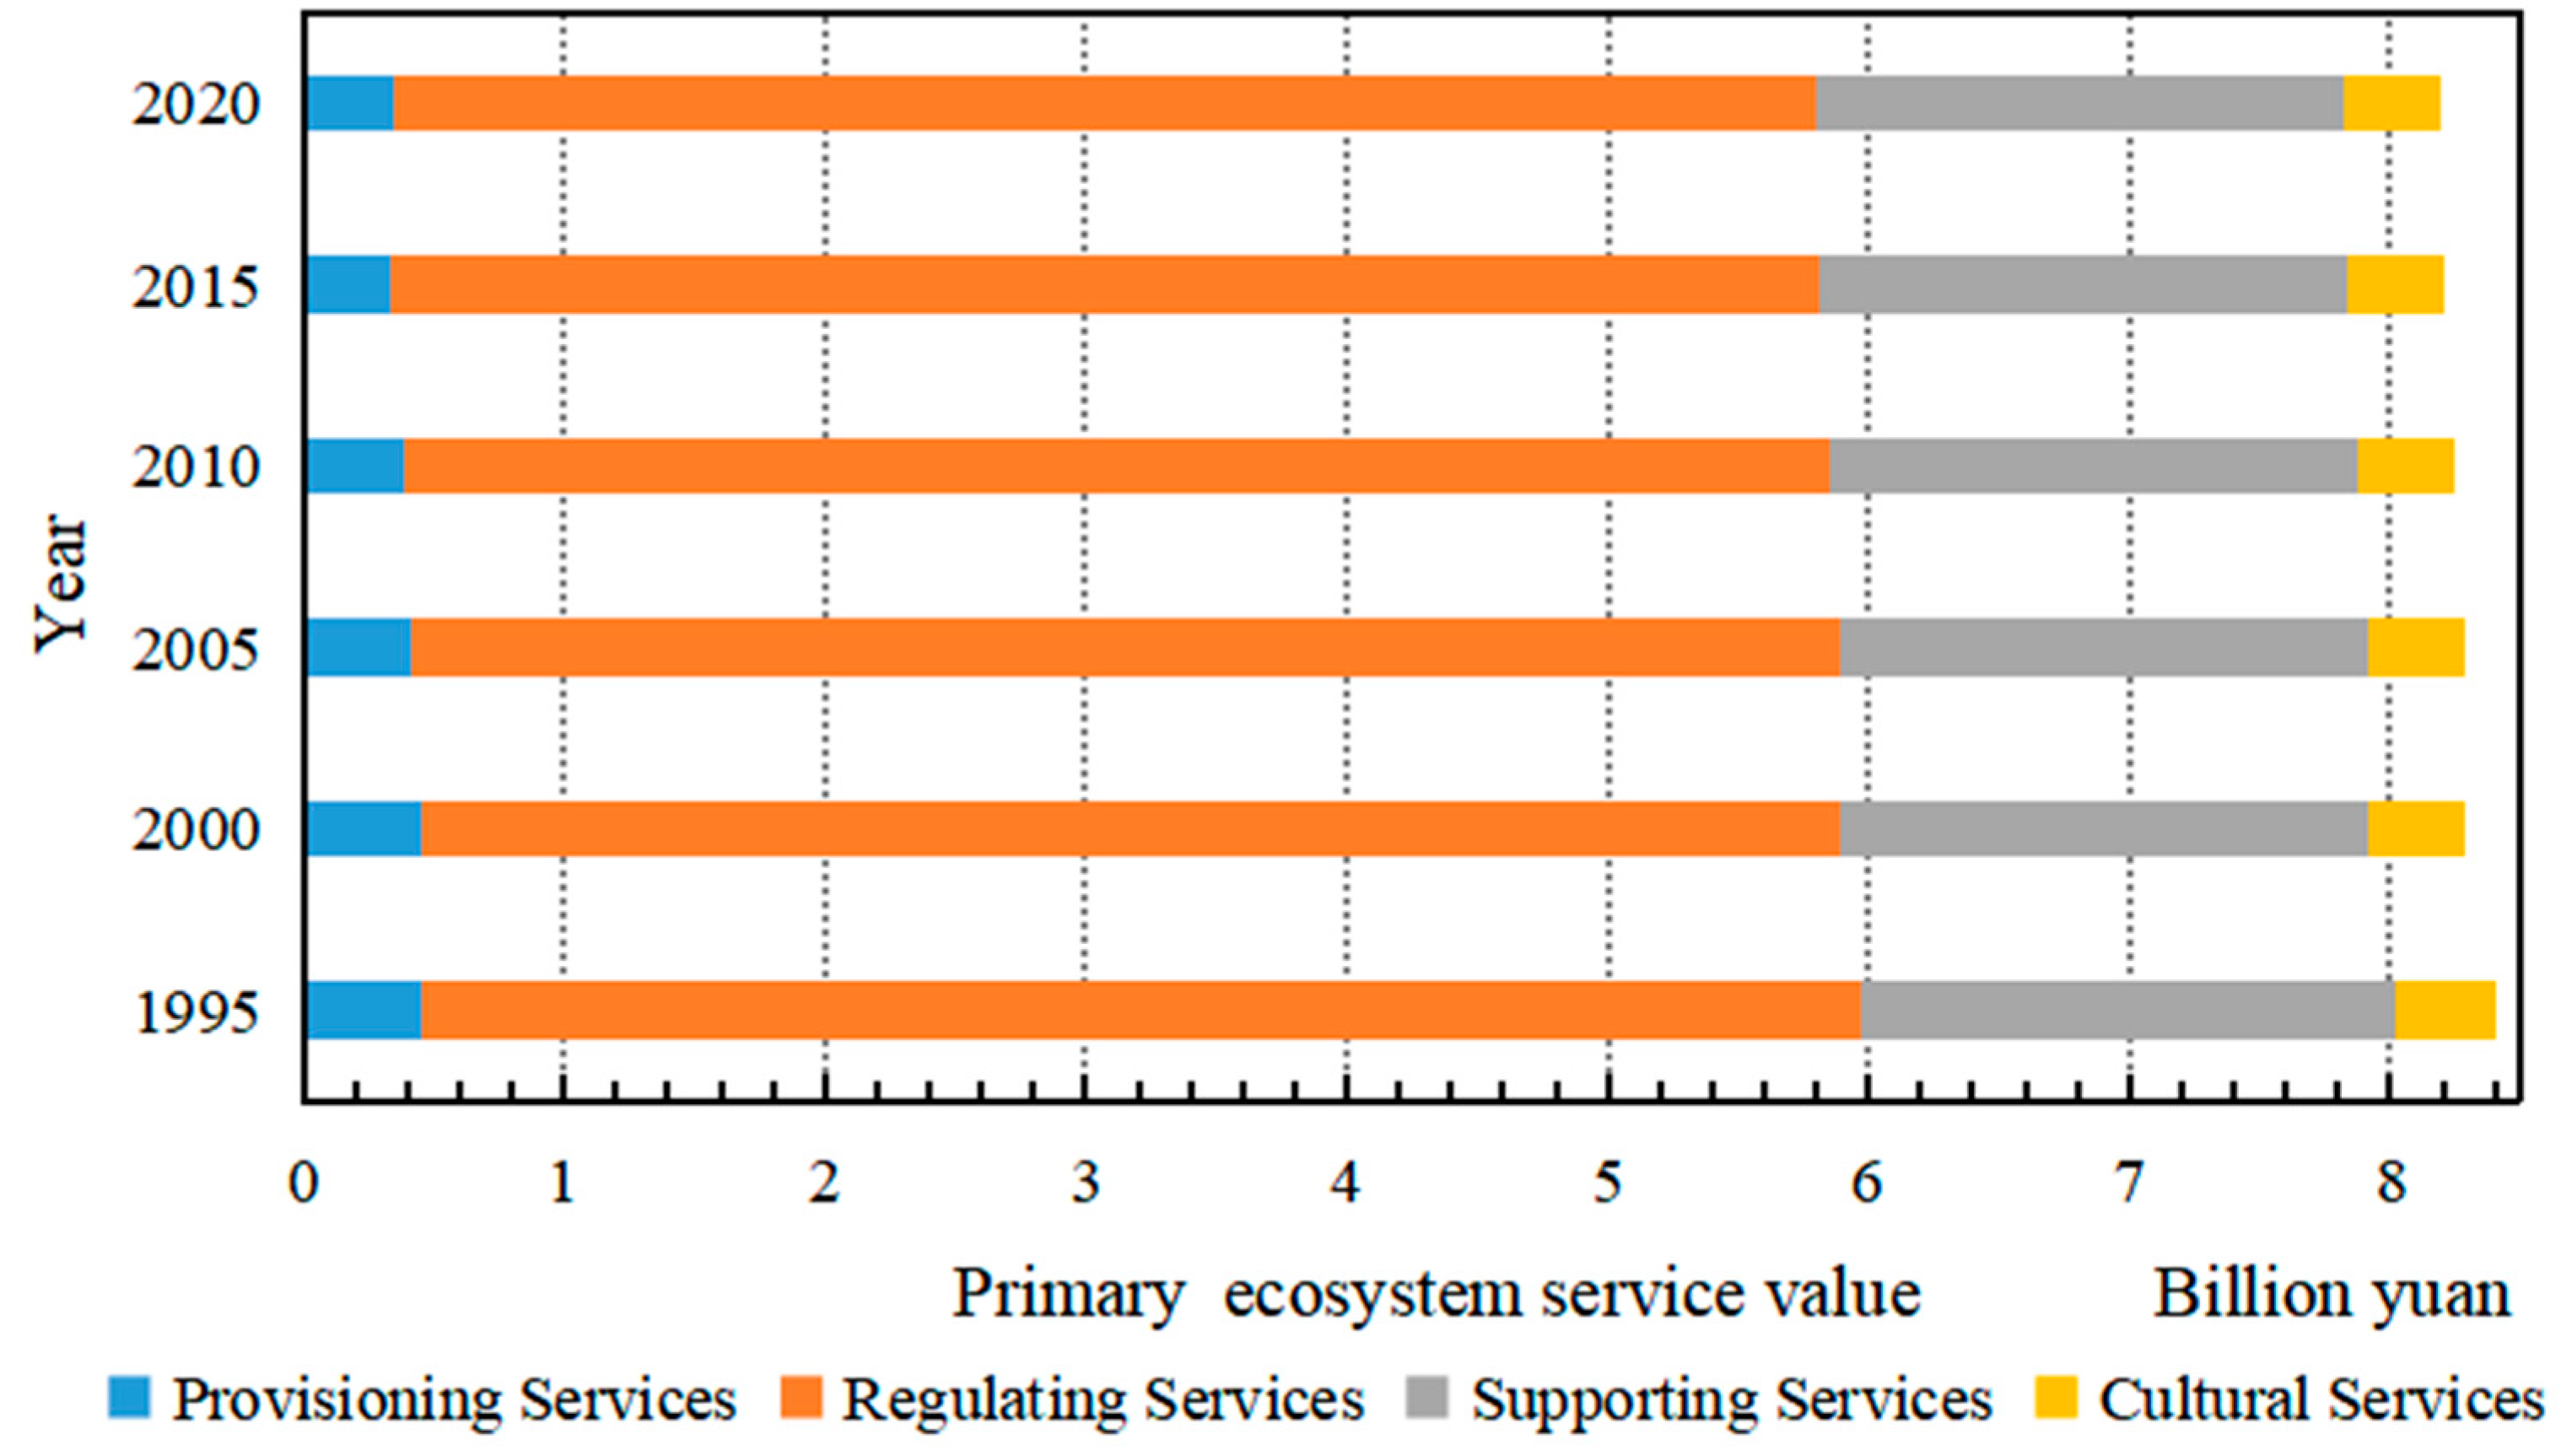
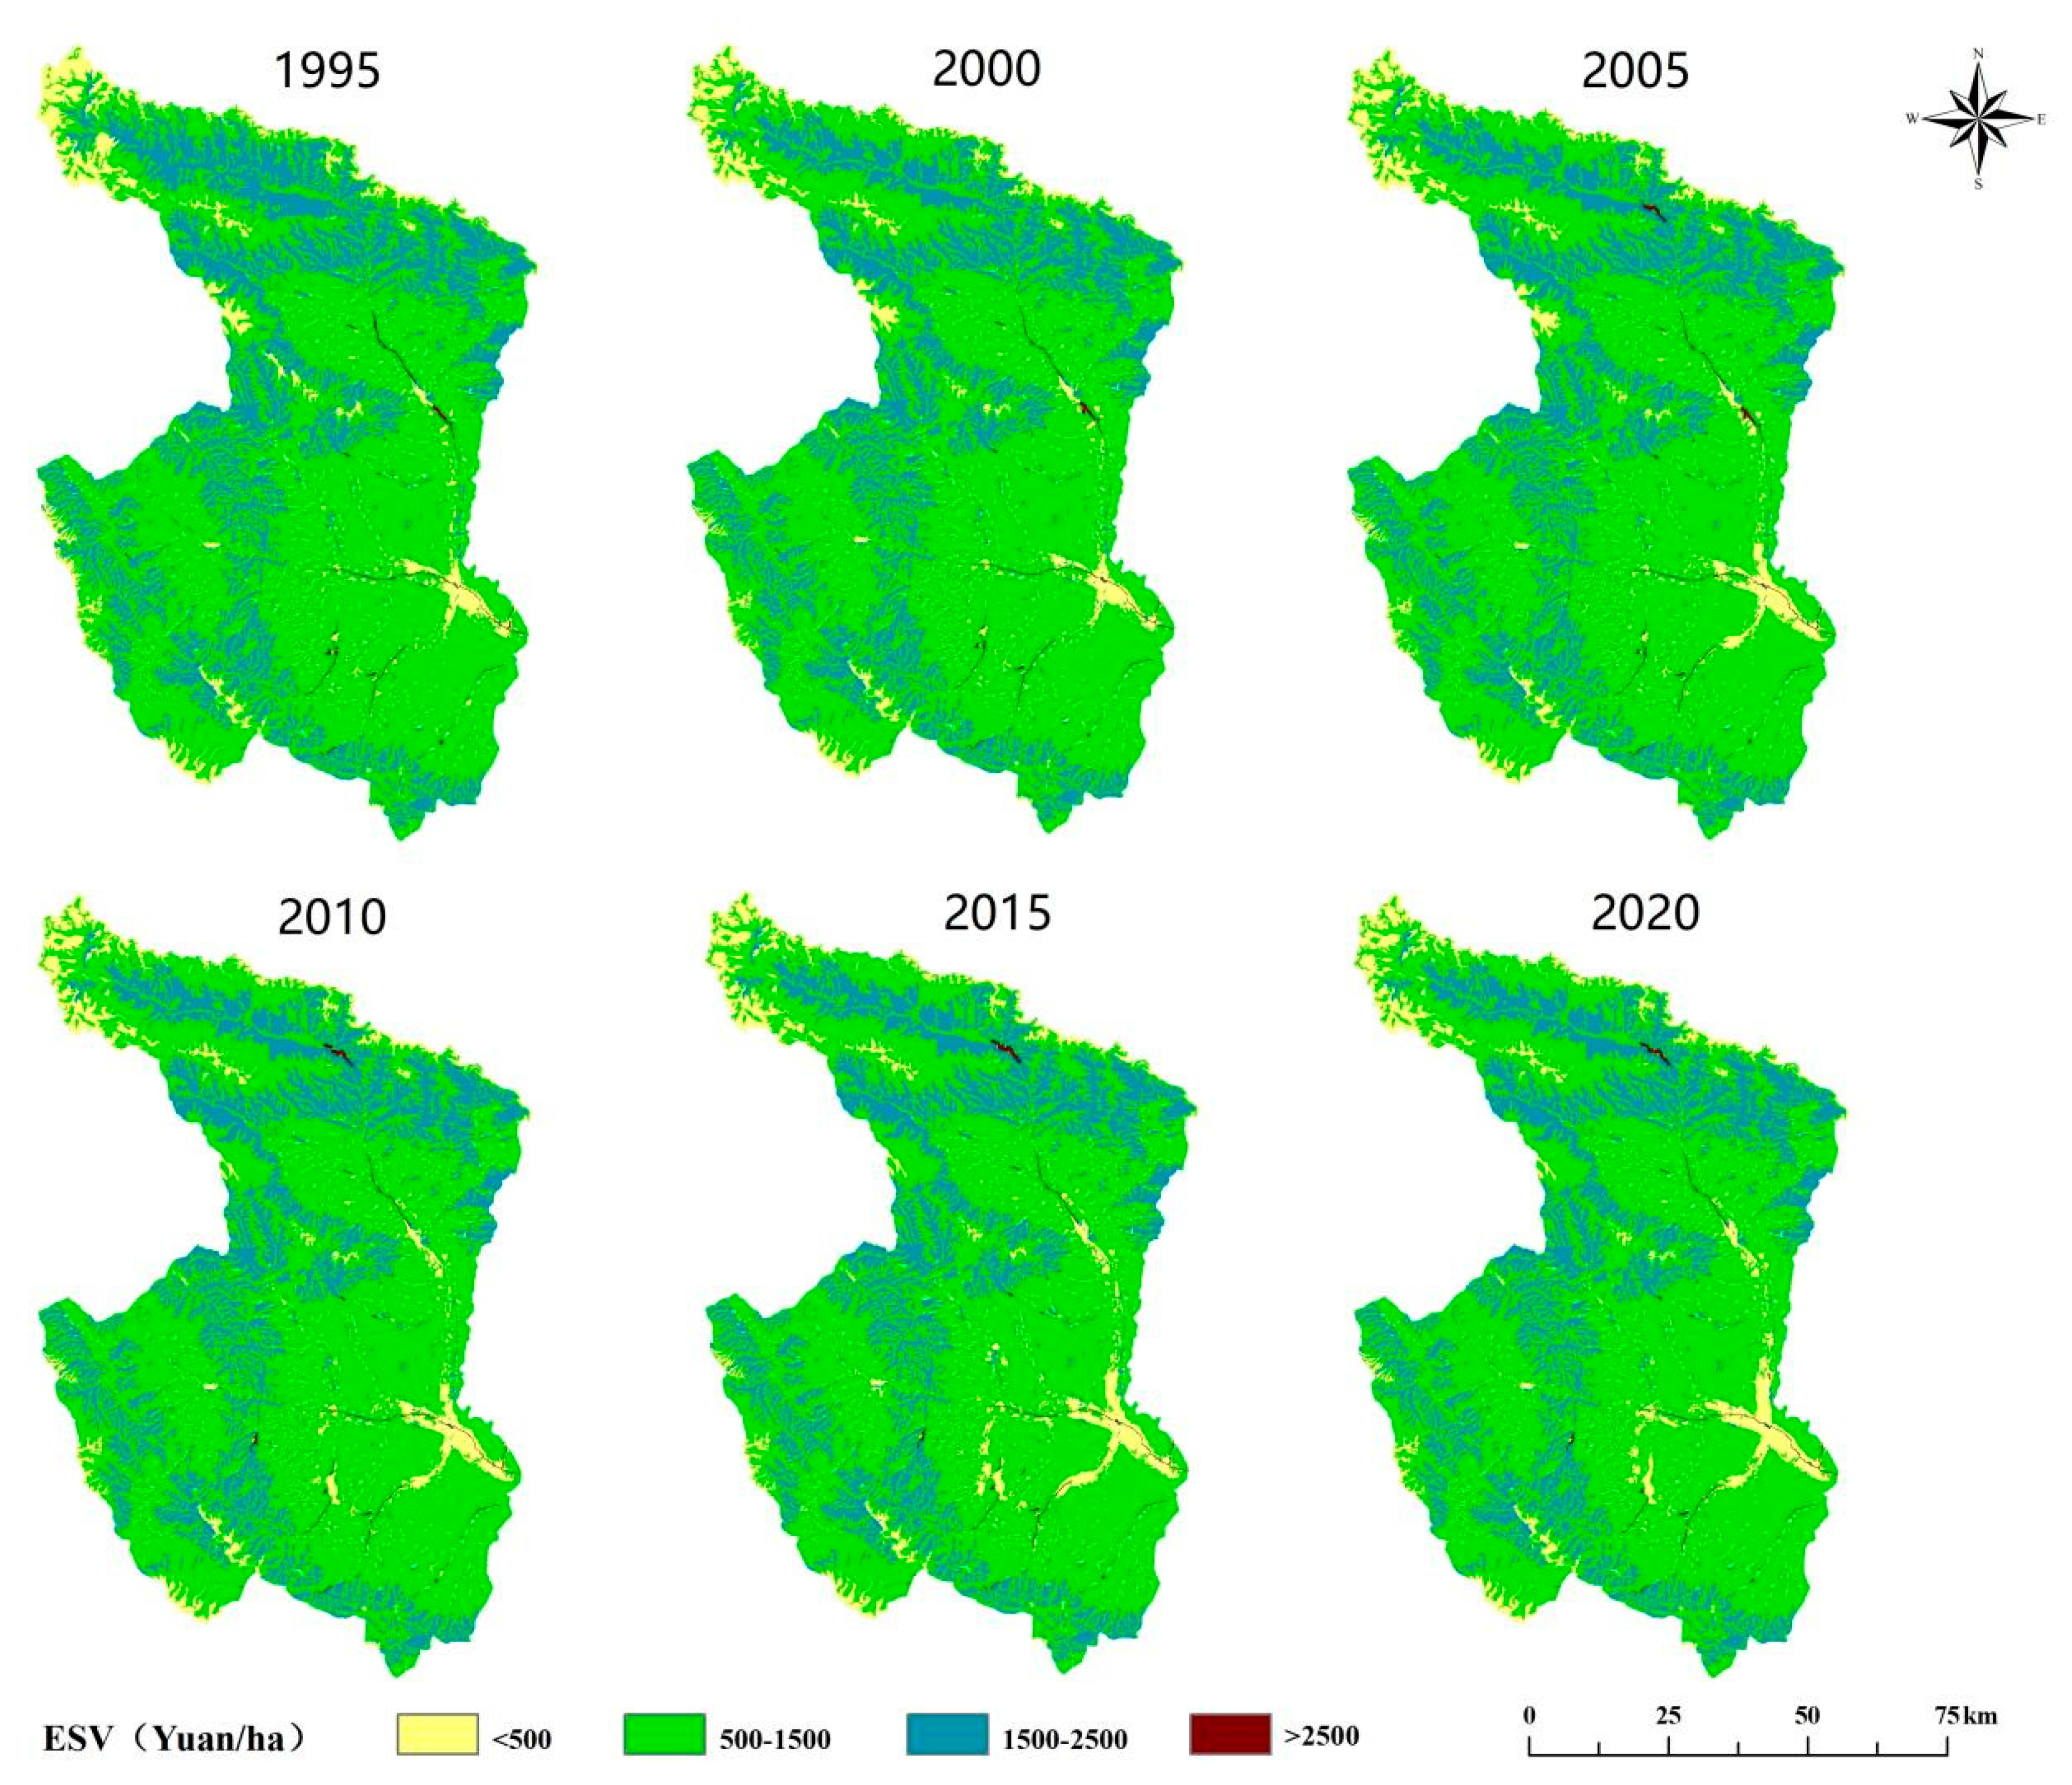
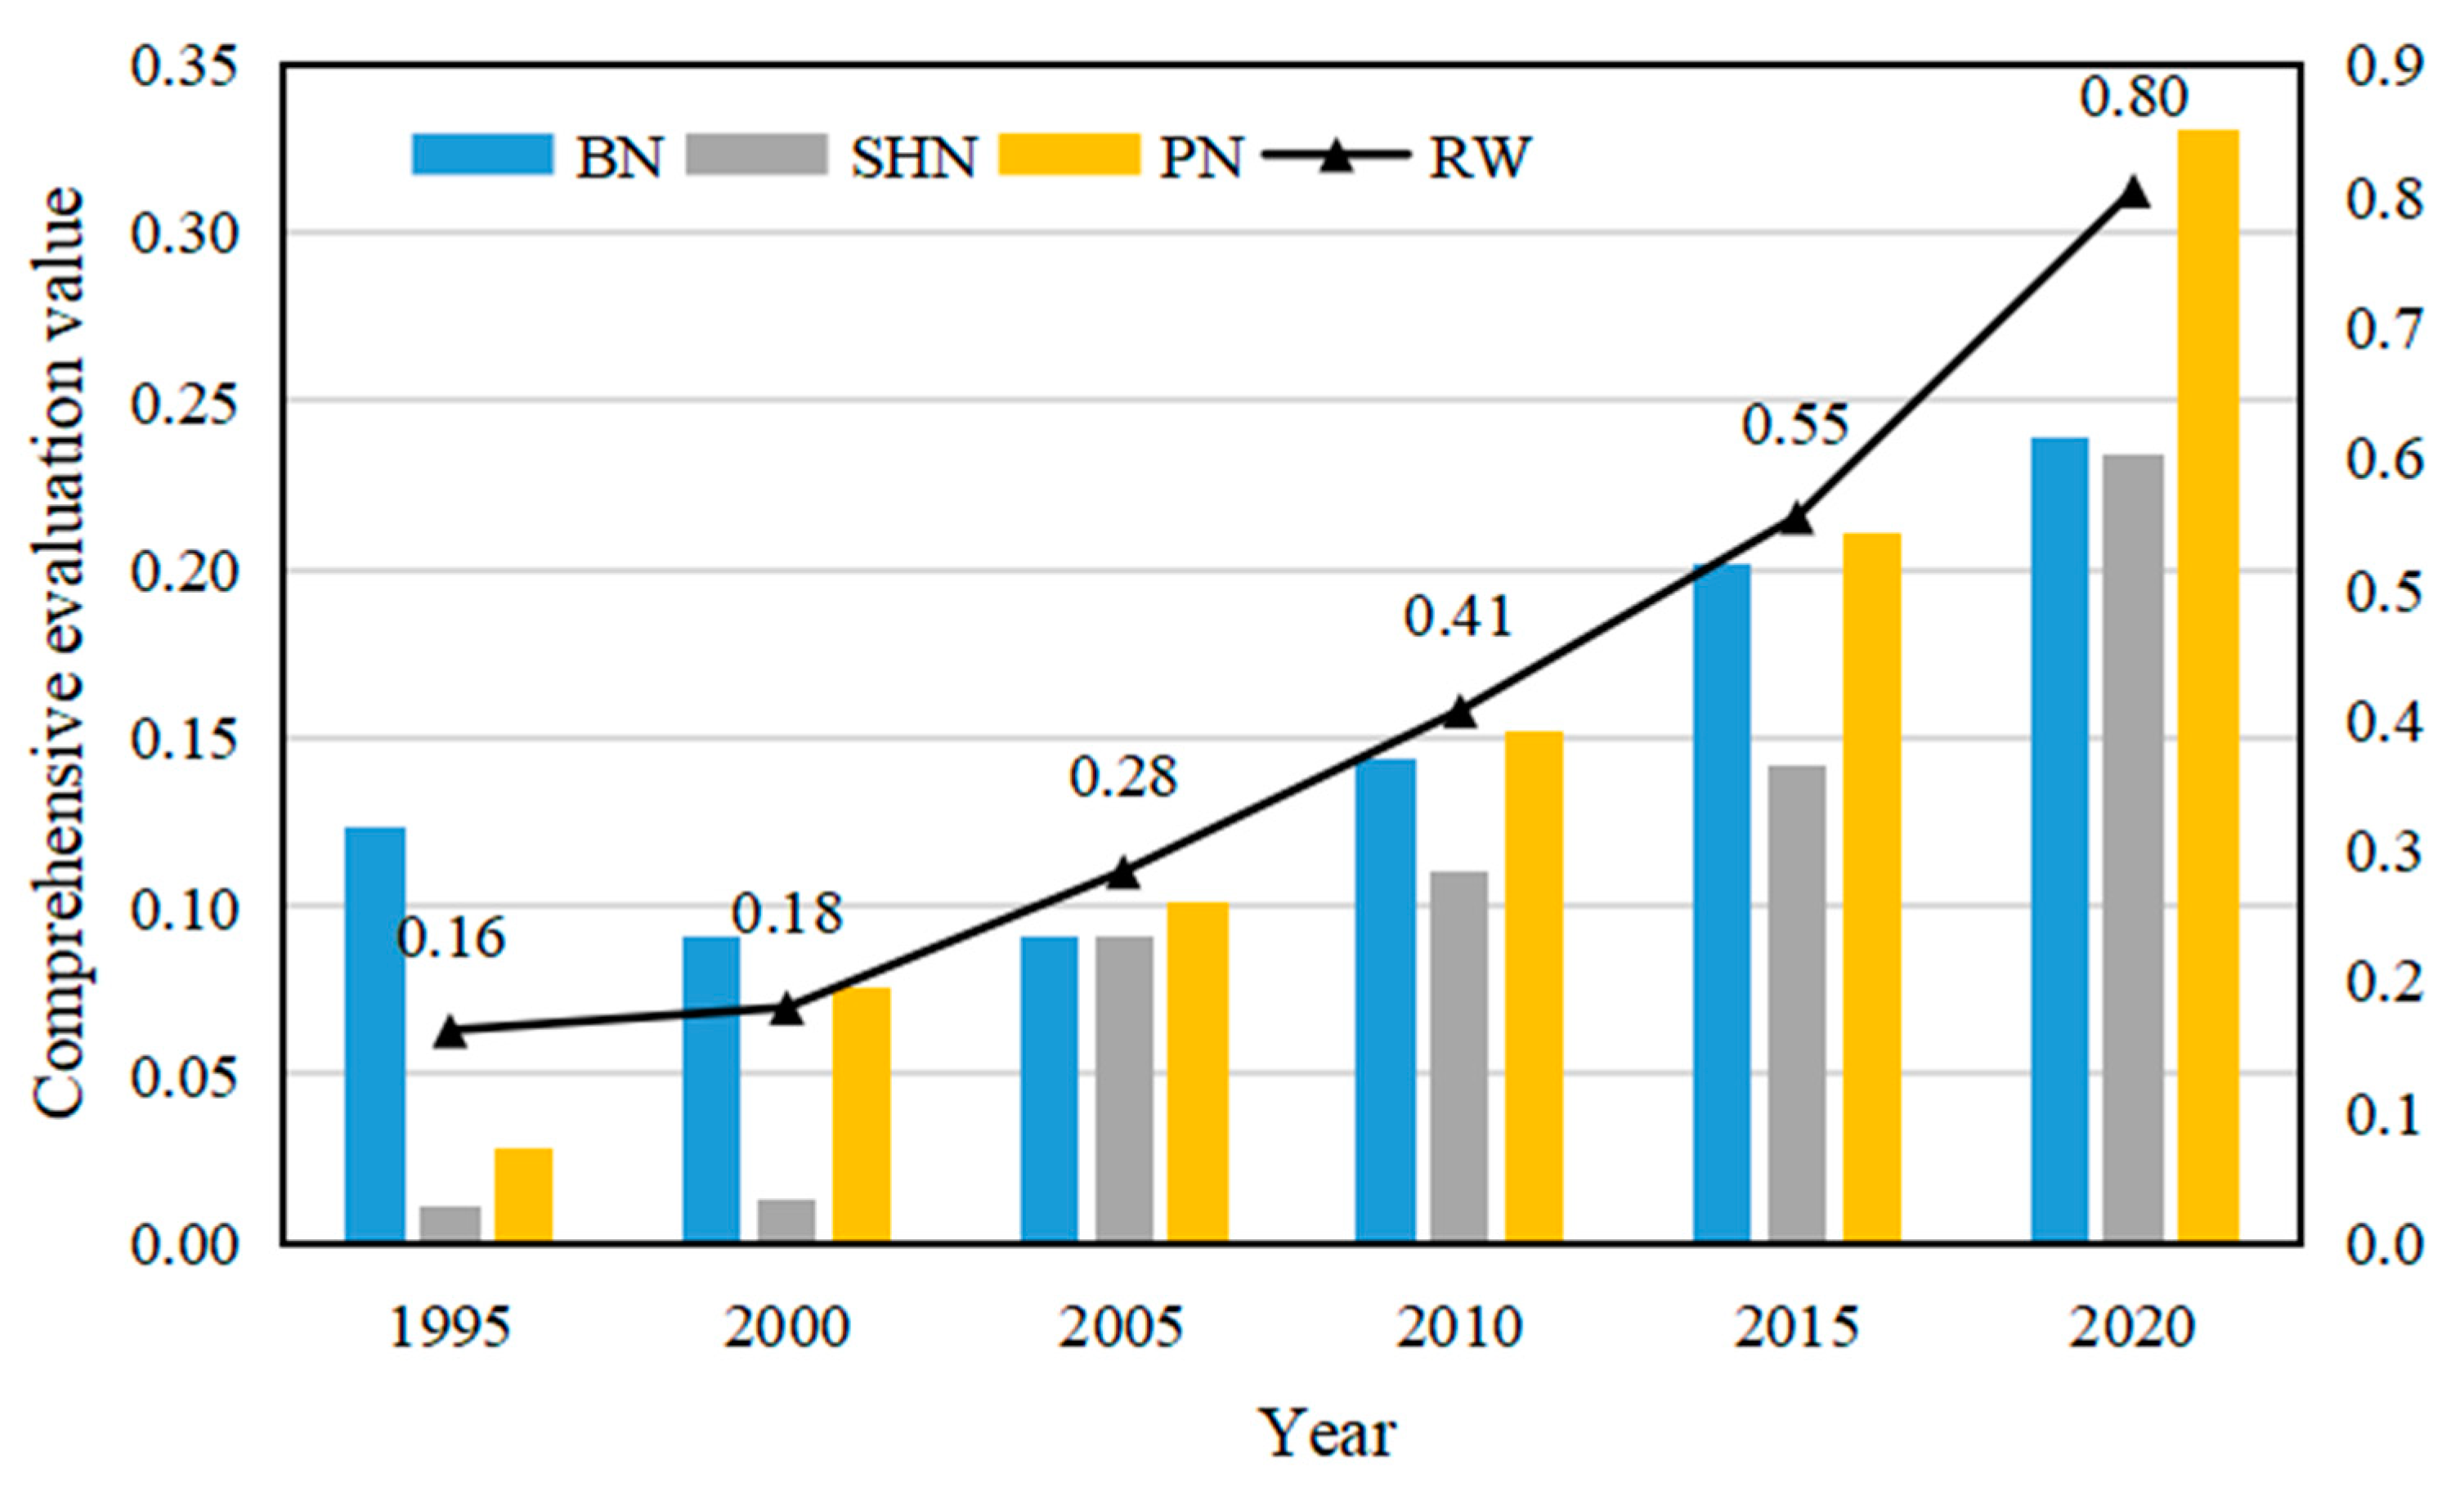
Table 1.
Data sources.
| Data Name | Data Format | Data Source | Data Purpose |
|---|---|---|---|
| National Administrative Boundary | Vector data | Geographic Spatial Data Cloud (https://www.gscloud.cn, accessed on 20 December 2022) | The study area |
| Digital Elevation Models (DEM) | Raster data with a spatial resolution of 30 m | Geographic Spatial Data Cloud (https://www.gscloud.cn, accessed on 20 December 2022) | The study area |
| Land Use/Cover Change (LUCC) | Raster data with a spatial resolution of 30 m | Resource and Environmental Science and Data Center of the Chinese Academy of Sciences (https://www.resdc.cn/, accessed on 5 December 2022) | Statistics of land use type area in 6 periods |
| Socioeconomic Statistical Data | Statistical data | Xining City Statistical Yearbooks (1995–2020), China Agricultural Product Price Survey Yearbooks, and local records (http://tjj.qinghai.gov.cn/, accessed on 10 December 2022) | Calculate the economic value of ESV and assess the well-being of residents |
Table 2.
Landscape pattern metrics for calculating landscape connectedness.
| Landscape Metric | Connotation | Weight |
|---|---|---|
| Number of Patches (NP) (C1) | Reflects the distribution status of the landscape; higher NP indicates higher fragmentation. | 0.2208 |
| Patch Density (PD) (C2) | Represents the number of patches per unit area; higher PD values indicate greater landscape heterogeneity and fragmentation. | 0.2014 |
| Largest Patch Index (LPI) (C3) | Proportion of the largest patch’s area to the total landscape area; larger values indicate lower fragmentation and greater connectedness. | 0.1134 |
| Edge Density (ED) (C4) | Length of edges per unit area; a larger ED indicates a more fragmented landscape. | 0.1129 |
| Landscape Shape Index (LSI) (C5) | Describes landscape shape features, reflecting the complexity of landscape spatial patterns; higher LSI values indicate more separated patches, more irregular shapes, or greater fragmentation. | 0.1130 |
| Shannon Diversity Index (SHDI) (C6) | Represents landscape heterogeneity, reflecting the richness and complexity of landscape types; higher SHDI values indicate more fragmentation. | 0.1264 |
| Aggregation Index (AI) (C7) | Indicates the degree of aggregation of different patch types within the landscape; larger AI values suggest that the patch type has lower fragmentation and greater connectedness. | 0.1120 |
Table 3.
Ecosystem service value coefficients per unit area for Xining City (CNY/ha).
| Primary Service | Secondary Type | Cropland | Forestland | Grassland | Water | Constructed Land | Unused Land |
|---|---|---|---|---|---|---|---|
| Provisioning Services | Food Production | 1202 | 294 | 175 | 926 | 14 | 7 |
| Raw Material Production | 566 | 668 | 252 | 516 | 0 | 21 | |
| Water Resource Supply | 27 | 343 | 141 | 7694 | −10,622 | 14 | |
| Regulating Services | Gas Regulation | 948 | 2193 | 899 | 1888 | 0 | 92 |
| Climate Regulation | 509 | 6572 | 2369 | 4165 | 0 | 71 | |
| Environmental Purification | 141 | 1967 | 780 | 6471 | 3479 | 290 | |
| Hydrological Regulation | 383 | 4892 | 1733 | 89,439 | 0 | 170 | |
| Supporting Services | Soil Conservation | 1456 | 2673 | 1094 | 2291 | 28 | 106 |
| Nutrient Maintenance | 170 | 203 | 88 | 177 | 0 | 7 | |
| Biodiversity | 184 | 2438 | 992 | 7369 | 481 | 99 | |
| Cultural Services | Aesthetic Landscape | 85 | 1071 | 441 | 4682 | 14 | 42 |
Table 4.
Indicators for Evaluating Resident Welfare in Xining City.
| Objective Layer | First-Level Index | Second-Level Index | Third-Level Index | Effect | Weight |
|---|---|---|---|---|---|
| Resident Welfare | Basic Needs | Basic economic level | Per Capita GDP (in CNY 10,000 per person) (X1) | + | 0.0343 |
| Urban Resident Per Capita Disposable Income (in CNY 10,000) (X2) | + | 0.0314 | |||
| Rural Resident Per Capita Net Income (in CNY 10,000) (X3) | + | 0.0350 | |||
| Total Agricultural Output Value (in CNY 10,000) (X4) | + | 0.0423 | |||
| Tertiary Industry Share in GDP (X5) | + | 0.0169 | |||
| Total Industrial Output Value (in CNY 10,000) (X6) | + | 0.0374 | |||
| Basic material | Per Capita Cultivated Land Area (in hectares per person) (X7) | + | 0.0494 | ||
| Per Capita Grassland Area (in hectares per person) (X8) | + | 0.0686 | |||
| Livestock Inventory (X9) | + | 0.0132 | |||
| Total Grain Output (in 10,000 tons) (X10) | + | 0.0131 | |||
| Total Meat Production (in tons) (X11) | + | 0.0184 | |||
| Total Agricultural Machinery Power (in 10,000 kilowatts) (X12) | + | 0.0133 | |||
| Resource acquisition ability | Fixed Telephone Users (in 10,000 households) (X13) | + | 0.0288 | ||
| Highway Cargo Turnover (in 10,000 ton kilometers) (X14) | + | 0.0289 | |||
| Number of Motor Vehicles at Year-End (X15) | + | 0.0406 | |||
| Cargo Volume (in 10,000 tons) (X16) | + | 0.0225 | |||
| Security and Health Needs | Health | Per Capita Medical and Health Institutions (per 10,000 people) (X17) | + | 0.0175 | |
| Number of Hospital Beds (X18) | + | 0.0409 | |||
| Number of Old-Age Insurance Participants (in 10,000 people) (X19) | + | 0.0622 | |||
| Number of Doctors per 10,000 People (X20) | + | 0.0242 | |||
| Ecological security | Urban Green Space Coverage Rate (NDVI) (X21) | + | 0.0183 | ||
| Per Capita Park Green Space Area (in square meters) (X22) | + | 0.0221 | |||
| Personal protection | Basic Medical Insurance Participants (in 10,000 people) (X23) | + | 0.0691 | ||
| Insurance Income (in CNY 10,000) (X24) | + | 0.0423 | |||
| Occupation security | Urban Registered Unemployment Rate (%) (X25) | - | 0.0275 | ||
| Psychological Needs | Social communication | Number of Rural Grassroots Organizations and Committees (X26) | + | 0.0278 | |
| Number of Travel Agencies (X27) | + | 0.0489 | |||
| Culture and Education | Education Fiscal Expenditure (in CNY 10,000) (X28) | + | 0.0396 | ||
| Number of Primary School Students (X29) | + | 0.0131 | |||
| Number of Regular High School Students (X30) | + | 0.0137 | |||
| Number of Regular College and University Students (X31) | + | 0.0258 | |||
| Television Population Coverage Rate (%) (X32) | + | 0.0131 |
Table 5.
Evaluation criteria for coupling degree and coupling coordination degree.
| Coupling Degree | Coupling Type | Coupling Coordination Degree | Coupling Coordination Type | Coupling Coordination Degree | Coupling Coordination Type |
|---|---|---|---|---|---|
| 0 ≤ C ≤ 0.3 | Low-level Coupling | 0 ≤ D < 0.1 | Extremely Uncoordinated | 0.5 ≤ D < 0.6 | Barely Coordinated |
| 0.3 < C ≤ 0.5 | Antagonistic Stage | 0.1 ≤ D < 0.2 | Severely Uncoordinated | 0.6 ≤ D < 0.7 | Primary Coordination |
| 0.5 < C ≤ 0.8 | Running-in Stage | 0.2 ≤ D < 0.3 | Moderately Uncoordinated | 0.7 ≤ D < 0.8 | Intermediate Coordination |
| 0.8 < C ≤ 1 | High-level Coupling | 0.3 ≤ D < 0.4 | Slightly Uncoordinated | 0.8 ≤ D < 0.9 | Good Coordination |
| 0.4 ≤ D < 0.5 | On the Verge of Uncoordination | 0.9 ≤ D < 1 | Excellent Coordination |
Table 6.
Relative development degree evaluation criteria.
| Relative Development Degree | Coordinated Development Characteristics |
|---|---|
| (0, 0.8] | B1 lags behind B2 |
| (0.8, 1.2] | B1 synchronizes with B2 |
| (1.2, ∞] | B1 is ahead of B2 |
Table 7.
Structure of land use types in Xining from 1995 to 2020 (unit: ha).
| Land Use Type | 1995 | 2000 | 2005 | 2010 | 2015 | 2020 | 1995–2020 |
|---|---|---|---|---|---|---|---|
| Cropland | 1456.63 | 1459.42 | 1419.85 | 1405.64 | 1365.63 | 1370.81 | −85.82 |
| 19.18% | 19.21% | 18.69% | 18.50% | 17.98% | 18.05% | −1.13% | |
| Forestland | 1758.75 | 1655.81 | 1653.48 | 1654.80 | 1654.04 | 1652.66 | −106.09 |
| 23.15% | 21.80% | 21.77% | 21.78% | 21.77% | 21.76% | −1.39% | |
| Grassland | 3712.07 | 3869.27 | 3876.62 | 3886.76 | 3893.12 | 3886.46 | 174.40 |
| 48.87% | 50.94% | 51.03% | 51.17% | 51.25% | 51.16% | 2.29% | |
| Water | 21.99 | 20.91 | 24.41 | 21.83 | 22.84 | 21.55 | −0.44 |
| 0.29% | 0.28% | 0.32% | 0.29% | 0.30% | 0.28% | −0.01% | |
| Constructed land | 251.68 | 248.45 | 279.52 | 301.60 | 344.16 | 339.31 | 87.63 |
| 3.31% | 3.27% | 3.68% | 3.97% | 4.53% | 4.47% | 1.16% | |
| Unused land | 395.37 | 342.60 | 342.60 | 325.89 | 316.69 | 325.69 | −69.67 |
| 5.20% | 4.51% | 4.51% | 4.29% | 4.17% | 4.29% | −0.91% |
Table 8.
Landscape-level indices in Xining City from 1995 to 2020.
| Year | NP | PD | LPI | ED | LSI | SHDI | AI |
|---|---|---|---|---|---|---|---|
| 1995 | 2628 | 0.3459 | 16.2270 | 30.7104 | 68.8328 | 1.2890 | 95.3954 |
| 2000 | 2675 | 0.3521 | 16.5527 | 30.1886 | 67.6961 | 1.2604 | 95.4730 |
| 2005 | 2652 | 0.3491 | 16.5367 | 30.1744 | 67.6650 | 1.2684 | 95.4755 |
| 2010 | 2681 | 0.3529 | 16.5106 | 30.1535 | 67.6186 | 1.2670 | 95.4786 |
| 2015 | 2660 | 0.3502 | 16.5060 | 30.1459 | 67.6030 | 1.2731 | 95.4799 |
| 2020 | 2633 | 0.3466 | 16.5243 | 30.1364 | 67.5823 | 1.2742 | 95.4814 |
Note: NP—Number of Patches; PD—Patch Density; LPI—Largest Patch Index; ED—Edge Density; LSI—Landscape Shape Index; SHDI—Shannon Diversity Index; AI—Aggregation Index.
Table 9.
Changes in ecosystem service value for different land use types in Xining from 1995 to 2020 (billion CNY).
Table 9.
Changes in ecosystem service value for different land use types in Xining from 1995 to 2020 (billion CNY).
| Land Use Type | 1995 | 2000 | 2005 | 2010 | 2015 | 2020 |
|---|---|---|---|---|---|---|
| Cropland | 0.8262 | 0.8277 | 0.8053 | 0.7972 | 0.7745 | 0.7775 |
| Forestland | 4.1000 | 3.8600 | 3.8546 | 3.8576 | 3.8559 | 3.8527 |
| Grassland | 3.3282 | 3.4691 | 3.4757 | 3.4848 | 3.4905 | 3.4845 |
| Water area | 0.2761 | 0.2627 | 0.3066 | 0.2742 | 0.2869 | 0.2706 |
| Construction land | −0.1662 | −0.1641 | −0.1846 | −0.1992 | −0.2273 | −0.2241 |
| Unused land | 0.0363 | 0.0315 | 0.0315 | 0.0300 | 0.0291 | 0.0299 |
| Total | 8.4005 | 8.2870 | 8.2890 | 8.2446 | 8.2096 | 8.1911 |
Table 10.
Xining’s single ecosystem service values from 1995 to 2020 (billion CNY).
| Primary Service | Secondary Type | 1995 | 2000 | 2005 | 2010 | 2015 | 2020 | 1995–2020 |
|---|---|---|---|---|---|---|---|---|
| Provisioning Services | Food Production | 0.2945 | 0.2945 | 0.2901 | 0.2884 | 0.2839 | 0.2842 | −3.51% |
| Raw Material Production | 0.2953 | 0.2923 | 0.2903 | 0.2897 | 0.2875 | 0.2875 | −2.62% | |
| Water Resource Supply | −0.1331 | −0.1319 | −0.1623 | −0.1876 | −0.2321 | −0.2280 | −71.32% | |
| Regulating Services | Gas Regulation | 0.8652 | 0.8564 | 0.8534 | 0.8527 | 0.8494 | 0.8488 | −1.90% |
| Climate Regulation | 2.1215 | 2.0904 | 2.0901 | 2.0914 | 2.0907 | 2.0880 | −1.58% | |
| Environmental Purification | 0.7695 | 0.7582 | 0.7708 | 0.7772 | 0.7922 | 0.7892 | 2.56% | |
| Hydrological Regulation | 1.7628 | 1.7294 | 1.7592 | 1.7377 | 1.7458 | 1.7328 | −1.70% | |
| Supporting Services | Soil Conservation | 1.0984 | 1.0876 | 1.0830 | 1.0816 | 1.0766 | 1.0760 | −2.04% |
| Nutrient Maintenance | 0.0936 | 0.0929 | 0.0923 | 0.0921 | 0.0915 | 0.0915 | −2.28% | |
| Biodiversity | 0.8562 | 0.8452 | 0.8487 | 0.8488 | 0.8512 | 0.8492 | −0.81% | |
| Cultural Services | Aesthetic Landscape | 0.3767 | 0.3719 | 0.3733 | 0.3726 | 0.3729 | 0.3719 | −1.27% |
Table 11.
Sensitivity index of ecosystem service values in Xining in 1995 and 2020.
| Land Use Type | ESV (CNY 10,000) | Sensitivity Coefficient | Change in Sensitivity Index | ||
|---|---|---|---|---|---|
| 1995 | 2020 | 1995 | 2020 | ||
| Cropland VC + 50% | 11,583.57 | 10,901.09 | 0.1691 | 0.1632 | 0.0059 |
| Cropland VC − 50% | 3861.19 | 3633.70 | 0.1875 | 0.1810 | 0.0065 |
| Forestland VC + 50% | 64,002.33 | 60,141.50 | 0.8237 | 0.7938 | 0.0299 |
| Forestland VC − 50% | 21,334.11 | 20,047.17 | 0.9253 | 0.8917 | 0.0336 |
| Grassland VC + 50% | 51,253.22 | 53,661.12 | 0.6703 | 0.7198 | 0.0494 |
| Grassland VC − 50% | 17,084.41 | 17,887.04 | 0.7517 | 0.8071 | 0.0554 |
| Water area VC + 50% | 3242.03 | 3177.65 | 0.0580 | 0.0583 | 0.0003 |
| Water area VC − 50% | 1080.68 | 1059.22 | 0.0632 | 0.0635 | 0.0003 |
| Construction land VC + 50% | −2162.84 | −2915.91 | 0.0344 | 0.0476 | 0.0132 |
| Construction land VC − 50% | −720.95 | −971.97 | 0.0379 | 0.0523 | 0.0145 |
| Unused land VC + 50% | 432.09 | 355.95 | 0.0076 | 0.0064 | 0.0012 |
Note: VC denotes the ecosystem service value coefficient.
Table 12.
Assessment of the coupling coordination development of landscape connectedness, ecosystem services, and resident welfare in Xining City from 1995 to 2020.
Table 12.
Assessment of the coupling coordination development of landscape connectedness, ecosystem services, and resident welfare in Xining City from 1995 to 2020.
| Year | Coupling Degree | Coupling Coordination Degree | Coupling Stage | Coupling Coordination State |
|---|---|---|---|---|
| 1995 | 0.2770 | 0.2062 | Low-level coupling | Moderate mismatch |
| 2000 | 0.5401 | 0.2569 | Adaptation phase | Moderate mismatch |
| 2005 | 0.9584 | 0.3399 | High-level coupling | Mild mismatch |
| 2010 | 0.8180 | 0.3469 | High-level coupling | Mild mismatch |
| 2015 | 0.7677 | 0.3310 | Adaptation phase | Mild mismatch |
| 2020 | 0.1374 | 0.1421 | Low-level coupling | Severe mismatch |
Table 13.
Comparison of the relative development of the coupling coordination of the three systems: landscape connectedness, ecosystem services, and resident welfare in Xining City from 1995 to 2020.
Table 13.
Comparison of the relative development of the coupling coordination of the three systems: landscape connectedness, ecosystem services, and resident welfare in Xining City from 1995 to 2020.
| Year | HWLP | LPESV | HWESV | Development Type | Dominant Constraining Factors |
|---|---|---|---|---|---|
| 1995 | 0.4614 | 0.3651 | 0.1685 | Resident welfare lags behind landscape connectedness, and both lag behind ecosystem services | Resident welfare, landscape connectedness |
| 2000 | 0.2954 | 1.6336 | 0.4826 | Resident welfare is ahead of ecosystem services, and both lag behind landscape connectedness | Resident welfare, ecosystem services |
| 2005 | 0.6246 | 1.2206 | 0.7624 | Landscape connectedness and resident welfare develop synchronously, and both are ahead of ecosystem services | Ecosystem services |
| 2010 | 0.6115 | 2.5237 | 1.5433 | Landscape connectedness is ahead of ecosystem services, and both lag behind resident welfare and ecosystem services | Ecosystem services, landscape connectedness |
Note: HWLP represents the relative development degree of resident welfare and landscape connectedness systems; LPESV represents the relative development degree of landscape connectedness and ecosystem service systems; and HWESV represents the relative development degree of resident welfare and ecosystem service systems.
Table 14.
Gray relational degrees and ranking of landscape connectedness and ecosystem services with resident welfare in Xining City.
Table 14.
Gray relational degrees and ranking of landscape connectedness and ecosystem services with resident welfare in Xining City.
| Landscape Patterns | Relational Degree | Ecosystem Services | Relational Degree | Ecosystem Services | Relational Degree |
|---|---|---|---|---|---|
| Patch Number (C1) | 0.674 | Food Production (Y1) | 0.670 | Soil Conservation (Y8) | 0.670 |
| Patch Density (C2) | 0.674 | Raw Material Production (Y2) | 0.670 | Maintaining Nutrient Cycling (Y9) | 0.670 |
| Largest Patch Index (C3) | 0.675 | Water Supply (Y3) | 0.718 | Biodiversity (Y10) | 0.671 |
| Edge Density (C4) | 0.669 | Gas Regulation (Y4) | 0.670 | Aesthetic Landscape (Y11) | 0.670 |
| Landscape Shape Index (C5) | 0.669 | Climate Regulation (Y5) | 0.670 | ||
| Shannon Diversity Index (C6) | 0.668 | Environmental Purification (Y6) | 0.672 | ||
| Aggregation Index (C7) | 0.672 | Hydrological Regulation (Y7) | 0.670 |
Disclaimer/Publisher’s Note: The statements, opinions and data contained in all publications are solely those of the individual author(s) and contributor(s) and not of MDPI and/or the editor(s). MDPI and/or the editor(s) disclaim responsibility for any injury to people or property resulting from any ideas, methods, instructions or products referred to in the content. |
© 2023 by the authors. Licensee MDPI, Basel, Switzerland. This article is an open access article distributed under the terms and conditions of the Creative Commons Attribution (CC BY) license (https://creativecommons.org/licenses/by/4.0/).
Share and Cite
MDPI and ACS Style
Yu, C.; Li, L.; Wei, H. Coupling Landscape Connectedness, Ecosystem Service Value, and Resident Welfare in Xining City, Western China. Systems 2023, 11, 512. https://doi.org/10.3390/systems11100512
AMA Style
Yu C, Li L, Wei H. Coupling Landscape Connectedness, Ecosystem Service Value, and Resident Welfare in Xining City, Western China. Systems. 2023; 11(10):512. https://doi.org/10.3390/systems11100512
Chicago/Turabian StyleYu, Chunlin, Ling Li, and Hejie Wei. 2023. "Coupling Landscape Connectedness, Ecosystem Service Value, and Resident Welfare in Xining City, Western China" Systems 11, no. 10: 512. https://doi.org/10.3390/systems11100512
Note that from the first issue of 2016, this journal uses article numbers instead of page numbers. See further details here.