
Evaluating Students’ Acceptance Intention of Augmented Reality in Automation Systems Using the Technology Acceptance Model


Department of Industrial Education and Technology, National Changhua University of Education, No. 1, Jin-De Rd., Changhua 500, Taiwan
*
Author to whom correspondence should be addressed.
Sustainability 2024, 16(5), 2015; https://doi.org/10.3390/su16052015
Submission received: 30 December 2023
/
Revised: 17 February 2024
/
Accepted: 27 February 2024
/
Published: 29 February 2024
(This article belongs to the Special Issue Sustainable E-learning and Education with Intelligence—2nd Edition)
Abstract
:This study aims to evaluate the factors influencing the acceptance of augmented reality among students within an automation system. The researchers of this study adopted the technology acceptance model (TAM) and gathered data to examine the path relationships among key variables: perceived usefulness, perceived ease of use, attitude toward use, and behavioral intention to use, all of which impact system acceptance. A survey was administered to students to gauge their perspectives on integrating augmented reality into the automation system. The study sample consisted of 41 students enrolled in the automation system course where augmented reality was utilized in teaching. Utilizing the partial least square approach, the hypothesis model was analyzed. The results revealed a lack of significant correlation between perceived ease of use and perceived usefulness in relation to augmented reality usage. However, perceived ease of use positively influences students’ behavioral intention to use, while perceived usefulness significantly affects behavioral intention to use through augmented reality. Notably, perceived usefulness exhibits a significant relationship with both behavioral intention to use and attitude toward use in the context of augmented reality usage. Moreover, perceived ease of use positively affects attitude toward use for students within the context of automation systems with augmented reality. Furthermore, no significant relationships were observed between attitude toward use and behavioral intention to use, nor between perceived ease of use and perceived usefulness regarding augmented reality usage. This study offers valuable insights for educators in the field of engineering and technology who are engaged in training and sustainability development programs.
1. Introduction
Augmented reality (AR) refers to the “augmentation” of a real environment through virtual (computer graphic) objects. Through interactive digital information virtually superimposed on the physical world, AR improves individual’s perception of their physical surroundings [1].
As a technology with an increased presence in the field of education [2], AR has proven to enhance students’ learning motives by leveraging information and communication technologies [3,4]. The onset of the COVID-19 pandemic underscored the importance of digital resources for both blended and online teaching environments. To effectively integrate technology-enhanced learning solutions, educators must possess proficiency in digital tools and pedagogical competencies [5,6].
Kaufman [7] emphasized the growing interest among students and educators in adopting augmented reality for learning purposes. Abdallah et al. [8] highlighted the functionality of augmented reality wearable devices in scanning the actual field device image, facilitating data acquisition, and enabling integration between virtual and real environments for image processing and labeling tasks.
Information and communications technologies significantly impact learning outcomes [9]. Many universities have reevaluated their strategies for adopting technologies that align with pedagogical objectives. Needs satisfaction and perceived usability are crucial in shaping individuals’ intentions to use information and communications technologies (ICTs) [10]. Educators must adapt their teaching methods to align with evolving educational landscapes and technological advancements, ensuring effectiveness in teaching and learning. The proliferation of digital platforms such as the Internet, mobile apps, and social media has posed challenges to traditional education systems. The rapid pace of technological advancement requires a paradigm shift among educators to adopt new teaching methods that enhance students’ cognition, skills, and attitudes [11]. Consequently, educators must continuously upgrade their skills and teaching approaches to effectively utilize emerging technologies, ensuring that applied tools are functional and user-friendly for educators and learners. Moreover, educators must familiarize themselves with new technologies and programs to support students’ diverse learning needs and enhance their engagement in various learning modalities. Technology-based instruction provides an opportunity for students to engage with learning content in visual and virtual environments, facilitating active learning experiences [12].
The ADDIE (analysis, design, development, implementation, and evaluation) teaching design model [13] offers a structured approach to instructional development, enabling educators to design, implement, and assess teaching activities more effectively. It is a commonly used systematic instructional model comprising five iterative steps: analysis, design, development, implementation, and evaluation, which can be adjusted and refined repeatedly according to specific instructional contexts. This study employed the ADDIE model to systematically analyze, design, develop, implement, and evaluate augmented reality (AR) integration into the automation system (AS) to ensure instructional quality and teaching effectiveness.
1.1. Objectives
Based mainly on the TAM, this study proposes an integrated theoretical framework for understanding university students’ acceptance of AR and their behavioral intention to use it. Investigating the relationships between behavioral intention to use (BI), attitude toward use (ATT), perceived usefulness (PU), and perceived ease of use (PEOU) of AR is essential in developing a comprehensive linear structural model of system acceptance among university students. This model can provide school administrators and teachers with insights to enhance the implementation of augmented reality (AR) in automation system (AS) teaching practices.
1.2. Research Framework
This study aims to determine university students’ acceptance and intention to use AR within an automation system (AS) as a supplementary tool in engineering education while also identifying potential variables influencing acceptance. Previous research [14,15,16] frequently explored students’ acceptance of AR technology in educational settings using the technology acceptance model (TAM) [17,18]. Trivunović and Kosanović [19] highlighted that the TAM model offers valuable insights into the factors influencing the acceptance and utilization of technology in teaching and learning processes. The proposed TAM constructs explain the complexity of technology acceptance among students.
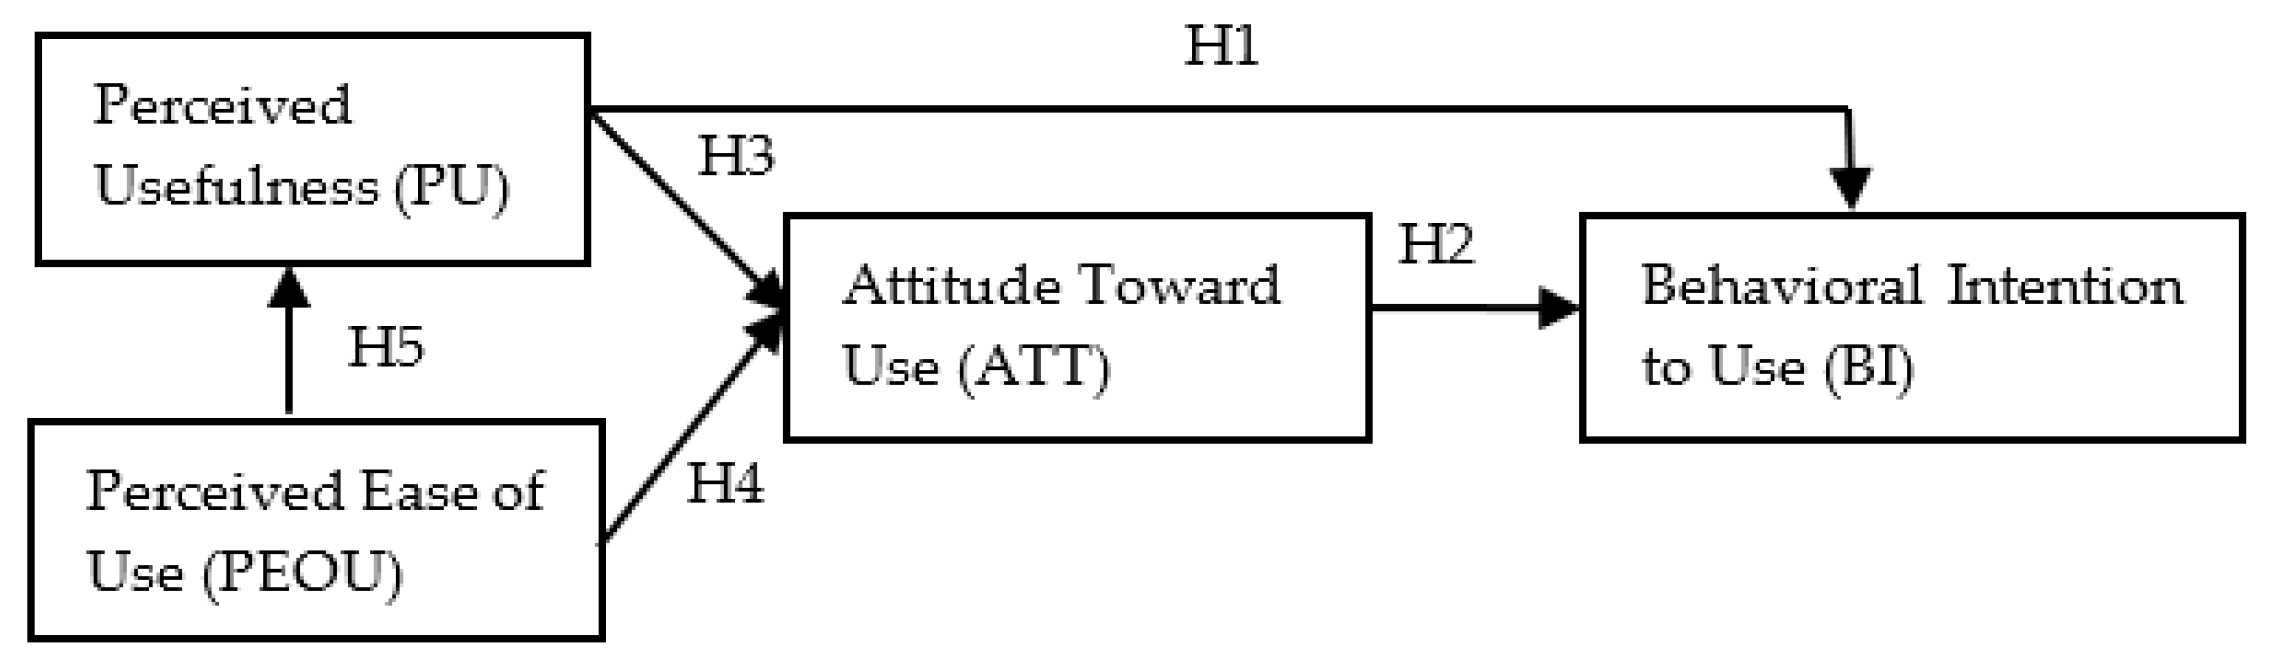
This study employed an adjusted and shortened version of the augmented reality acceptance model (based on the TAM model), as proposed by Cabero-Almenara et al. [20]. Hypotheses were formulated based on the research model depicted in Figure 1. The figure illustrates the adapted model, suggesting that PEOU and PU are predictors of BI and actual usage. Within the TAM framework, PU represents the extent to which users perceive that utilizing the technology can enhance their work performance, while PEOU reflects users’ perceptions of the ease of use associated with the technology. These factors collectively influence users’ BI toward augmented reality.
1.3. Research Hypotheses
Based on the research purposes and literature review, this study formulated the following hypotheses:
H1:
Perceived usefulness positively influences the behavioral intention to use augmented reality (PU→BI).
H2:
Attitude toward use positively influences the behavioral intention to use augmented reality (ATT→BI).
H3:
Perceived usefulness positively influences the attitude toward augmented reality usage (PU→ATT).
H4:
Perceived ease of use positively influences the attitude toward augmented reality usage (PEOU→ATT).
H5:
Perceived ease of use positively influences the perceived usefulness of augmented reality usage (PEOU→PU).
2. Augmented Reality (AR) in Education
A systematic review of related research and applications has underscored the pedagogical potential of augmented reality (AR), indicating that its utilization enhances student learning experiences [21]. AR’s role as a teaching aid is widely acknowledged within the education sector [22], contributing to the ongoing transformation of the education landscape through interactive and immersive learning tools driven by technological advancements in the 21st century.
Despite its availability to educational institutions in recent years, the adoption of AR technology has been somewhat slow. However, the emergence of the COVID-19 pandemic has highlighted the importance of leveraging augmented reality content in the learning environment [23]. Thus, augmented reality is increasingly recognized as a relatively new and viable technology for teaching and learning across all education levels [24,25,26]. Yavuz et al. [27] pointed out the affordability and sustainability of mobile AR applications for widespread adoption in various sectors, including education. AR applications featuring experiential modes have shown potential for use in online, blended, and in-person teaching. Students’ acceptance of AR content delivered through mobile applications emphasizes AR’s functionality as a teaching supplement [28].
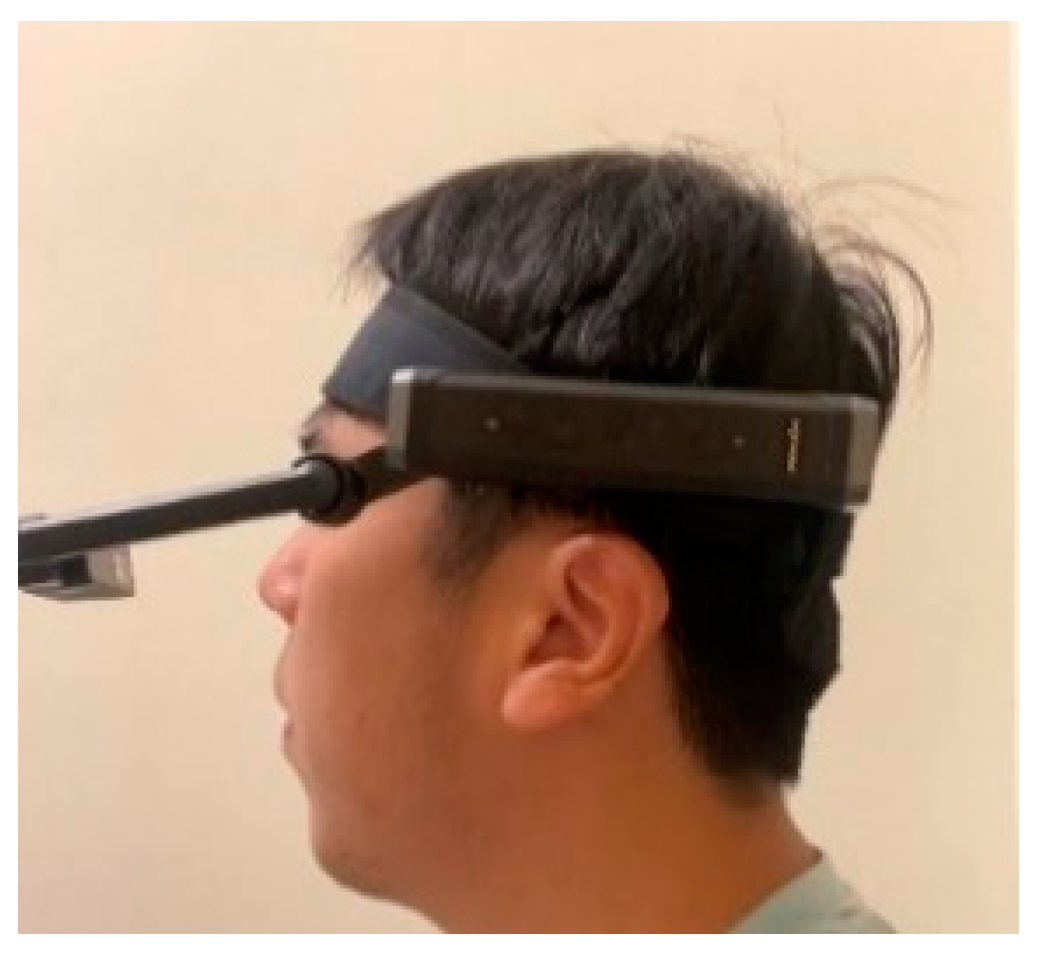
Table 1 presents the specifications of wearable augmented reality hardware utilized in this study. Custom applications were developed for the device, tailored to the operating system environment, to facilitate communication with the back-end virtual and real integration system. Figure 2 illustrates the implementation of wearable augmented reality (AR) glasses employed in this study.
3. AR-Introduced Automated System
Advancements in holographic technology have facilitated the development of hardware and software solutions that support augmented reality applications in various industries [29]. Several instances demonstrate the practical utilization of augmented reality in industrial settings. For instance, Danielsson et al. [30] provided an overview of AR smart glasses for manufacturing assembly operators. Meanwhile, Makris et al. introduced an augmented reality system to assist operators in collaborative human–robot assembly tasks [31]. Furthermore, augmented reality also finds application beyond operator support, as evidenced by Goel et al., who employed bibliometric and network visualization techniques to synthesize augmented reality and virtual reality applications in the apparel industry [32].
This study incorporated AR into the automation system (AS) teaching within a programmable control technology course. Students were tasked with preparing themselves for the application of the proposed system. They were required to write a report upon completing the system implementation. The proposed architecture of the automation system (AS) incorporates augmented reality (AR) technology, with system operation primarily achieved through the input and output controls of the programmable logic controller (PLC). Users interact with the automatic storage equipment operation through the human–machine interface to execute various tasks. Additionally, relevant equipment information within the AS is connected to an edge gateway via the Internet and the remote server, allowing access to all monitoring data and facilitating remote machine networking.
The global manufacturing industry is rapidly transitioning towards smart factories, driven by the growing demand for remote operation and automation. To enhance capacity and optimize operations, emerging technologies such as big data, artificial intelligence, and virtual and real integration are increasingly used for capacity improvement and optimization. This study incorporated designed technology into automated systems, leveraging AR technology to monitor equipment production status, parameters, and abnormal records. Moreover, operators can receive maintenance warnings and access equipment abnormal records through augmented reality inspection and operation, thereby reducing troubleshooting time only when equipment failures occur and enhancing real-time monitoring of production status. During production line inspections, AR portable wearable devices enable operators to directly visualize actual data and conditions of plant equipment.
4. Methodology
4.1. Research Design
To obtain high-quality research outcomes, it is imperative to systematically plan and implement the process in line with the research objectives. As part of the system development process, the augmented reality (AR) and automation system (AS) applications underwent development based on the ADDIE (analysis, design, development, implementation, and evaluation) model instructional design. The ADDIE model offers a structured approach to research design, incorporating an iterative process complete with essential steps for the development of an effective system. In this process, the five main stages of the ADDIE model method serve as a guideline for system development, as detailed below.
4.1.1. Analysis
The analysis stage involves assessing the learning experience and requirements using augmented reality (AR) and establishing instructional goals. Yu et al. [33] utilized focus group interviews to understand participants’ needs, expectations, and experiences, while Sholihin et al. [34] performed analysis through classroom observations. Another commonly employed approach is questionnaire surveys, which can identify users’ development needs [35].
4.1.2. Design
The design stage involves developing appropriate and well-designed learning content. Given that learning content often entails professional knowledge, expert opinions are frequently leveraged during the design stage [36]. Meanwhile, other methods [37,38] apply multimedia principles to design their augmented reality (AR) within an automation system (AS) or refer to related materials for instructional design.
4.1.3. Development
The development stage involves constructing the model, during which several decisions are made. Firstly, the augmented reality (AR) type, such as immersive AR, is selected based on available resources and funding constraints. Secondly, the development tool, such as Unity, is chosen for its usability and cross-platform support [39]. Thirdly, the AR display is selected based on the desired immersion level [40].
4.1.4. Implementation
The implementation stage refers to the preparation and execution of the AR environment where students actively engage in learning. Prior to course instruction, a pre-knowledge test is administered to the students. The learning outcomes at each stage are evaluated to identify issues and potential solutions.
4.1.5. Evaluation
The evaluation stage comprises two sub-criteria. One is a formative evaluation, which involves analysis and testing after the first four stages of the ADDIE model. For instance, Asad et al. [41] performed an evaluation after the analysis stage to identify and address problems encountered during the process. Similarly, evaluation is also conducted to identify potential system issues at the end of AR development [42]. The other sub-criterion is the summative evaluation, which involves assessing the learning outcomes and gathering feedback from learners post-learning. It is essential to determine learners’ satisfaction and gather their suggestions for future development. The evaluation stage aligns with the dynamic ADDIE model [43].
4.2. Participants
The participants in this study comprised 41 sophomore students enrolled in the programmable control technology course offered by the Department of Industrial Education and Technology at the National Changhua University of Education in Taiwan. The author taught the course using augmented reality (AR) in automation systems (AS).
4.3. Research Instrument
The research instrument consisted of a questionnaire divided into two sections. The first section included questions regarding demographics, while the second section comprised four variables: PU, PEOU, ATT, and BI toward augmented reality. Responses for these variables were measured using a five-point Likert scale, ranging from 1 (strongly disagree) to 5 (strongly agree). Finally, the collected data were analyzed using a statistical tool from partial least square (PLS).
4.4. Reliability and Validity
Cronbach’s α coefficient and composite reliability (CR) were used to assess the internal consistency reliability of the collected data. According to Hair et al. [44], reliability measures range from 0 to 1, with low values indicating lower limits of acceptability. Bagozzi and Yi [45] suggested that the CR value must be larger than 0.6 for reliability. Thus, the internal consistency reliability for the collected data was deemed acceptable as it met the recommendation for item reliability.
Following expert content validity analysis, item analysis, and factor analysis, this study identified four dimensions and 16 items: PU (4 items), PEOU (4 items), ATT (4 items), and BI (4 items). The Cronbach’s α coefficient obtained for these dimensions were 0.842, 0.756, 0.856, and 0.861, respectively, indicating high reliability on the sub-scale level. The overall Cronbach’s α coefficient for the total scale was 0.931, indicating high reliability across all dimensions.
5. Data Analysis
After the course teaching, a survey was conducted using the revised scales [46,47], achieving a 100% rate of return. Table 2 presents the descriptive statistics of the TAM questionnaire utilized in this study.
In the dimension of PU, the highest average score of the TAM scale was 4.48, indicating that most students perceived learning augmented reality (AR) in automation system (AS) as useful. In the dimension of PEOU, the highest average score on the TAM scale was 4.46, demonstrating that students found augmented reality (AR) in automation systems (AS) to be clear and understandable. In the dimension of ATT, the highest average score of the TAM scale was 4.56, indicating that most students were satisfied with the learning experience of augmented reality (AR) in automation systems (AS). In the dimension of BI, the highest average score of the TAM scale was 4.58, indicating that students expressed strong behavioral intention to use augmented reality (AR) in automation systems (AS) for learning purposes.
6. Results
This study employed the partial least square (PLS) method for analyzing the structural model due to its ability to impose fewer demands on residual distributions and its suitability for studies with smaller samples [48]. PLS also offers the advantage of examining a broader range of constructs and/or indicators without necessitating compliance with multivariate normal distributions. Additionally, it enables testing theories in their early stages of development [49] and demonstrates better predictive ability. Given the modest sample size and high correlation between constructs in this study, PLS was deemed ideal for exploring path relationships between the constructs.
6.1. Path Analysis
To further determine the relationships among the variables using path analysis, this study constructed a path to understand the utilization of augmented reality (AR) in automation systems (AS). The outcome of path analysis of the restriction model, presented in Table 3, demonstrates that the t-values of all paths are statistical, highlighting significant differences.
6.2. Estimating the Effect of Perceived Ease of Use on Behavioral Intention to Use
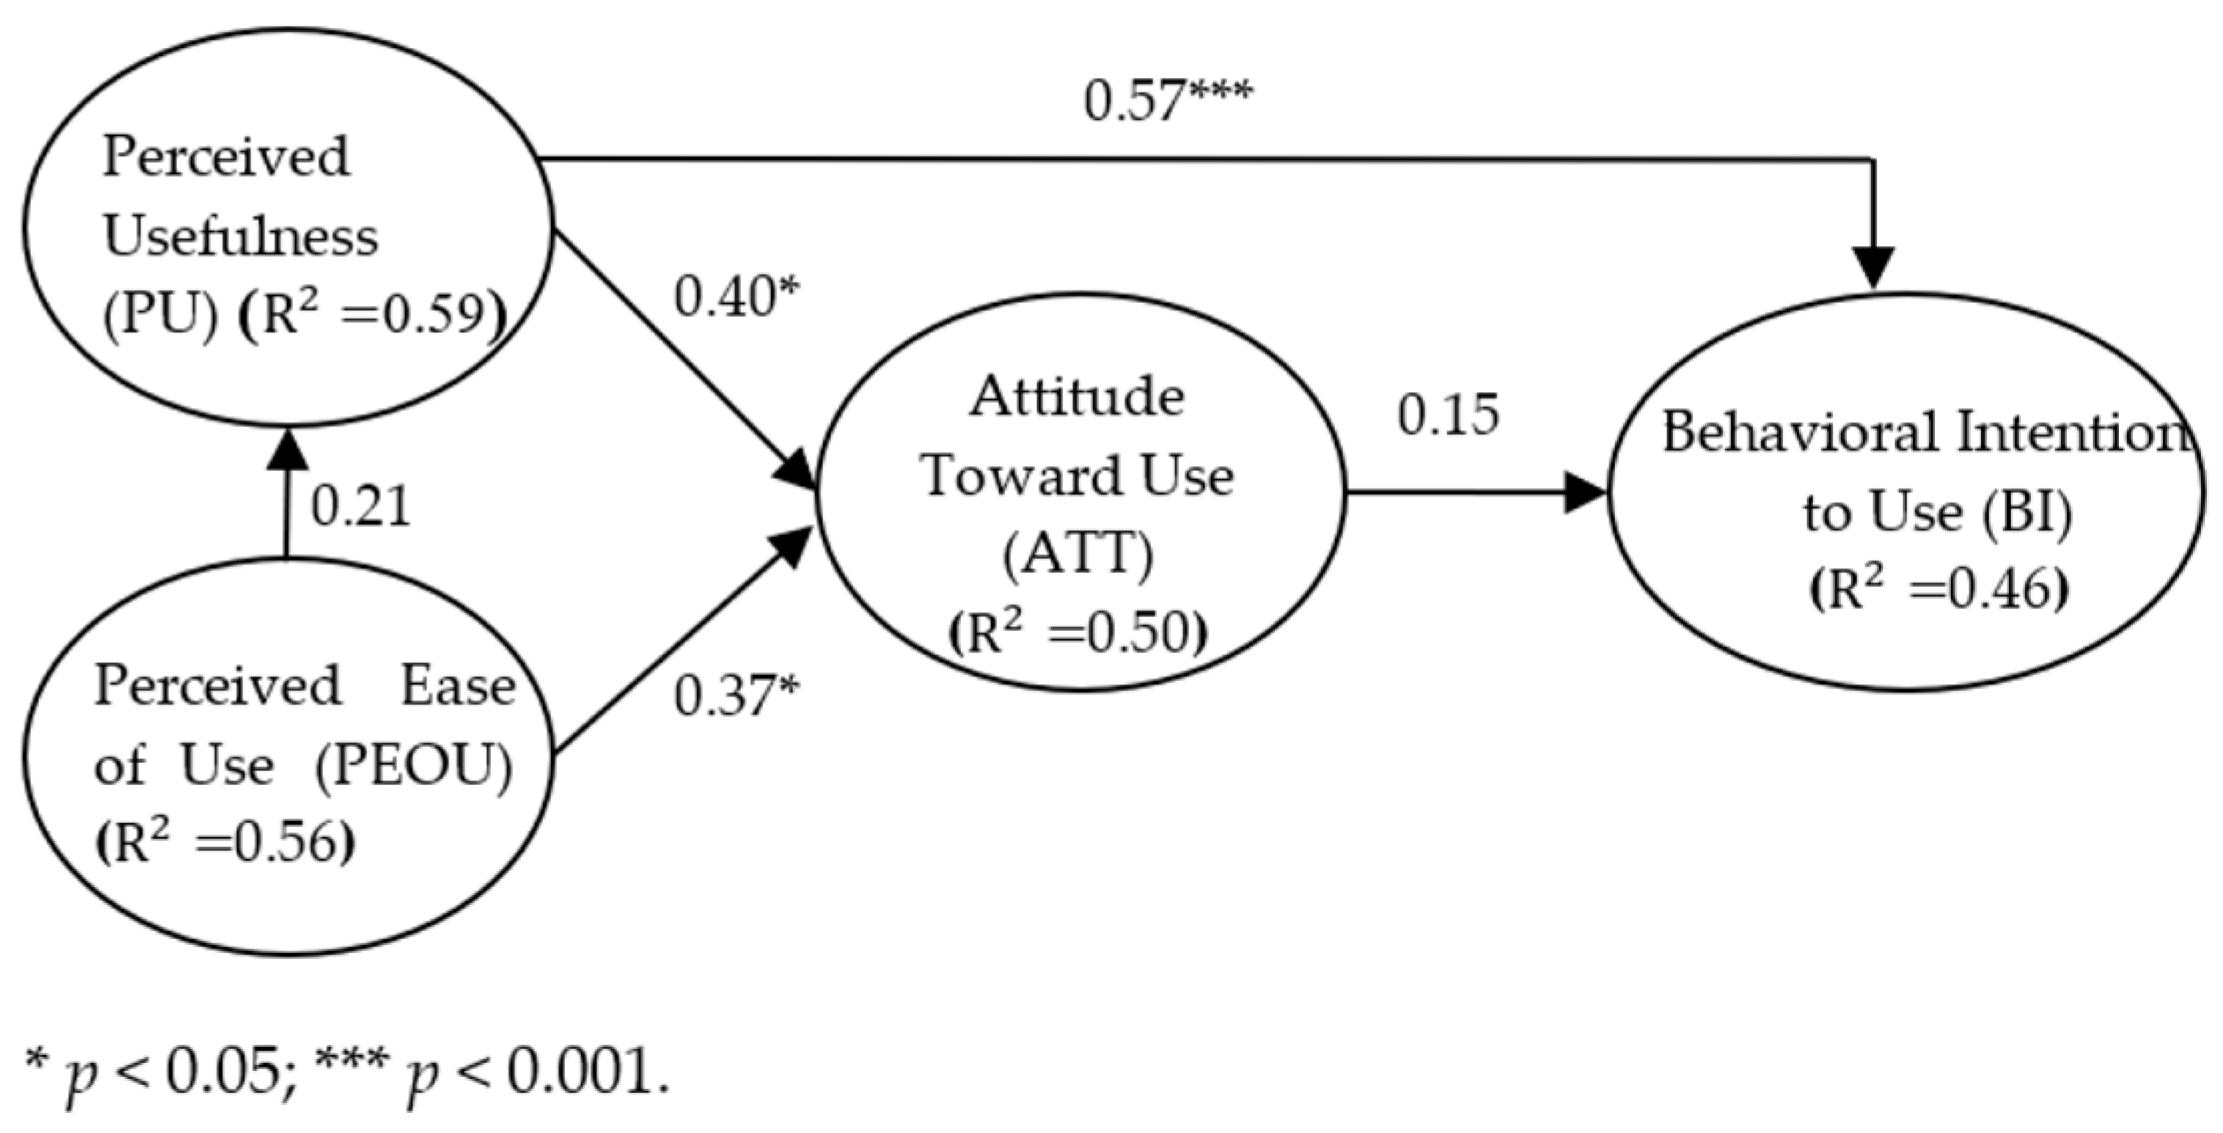
This study examined the relationships analyzed in path analysis, as illustrated in Figure 3:
Path 1: PEOU→(0.21) PU→(0.57) BI = 0.21 × 0.57 = 0.12
Path 2: PEOU→(0.37) ATT→(0.15) BI = 0.37 × 0.15 = 0.06
Path 3: PEOU→(0.21) PU→(0.40) ATT→(0.15) BI = 0.21 × 0.40 × 0.15 = 0.01
Total indirect effect = 0.12 + 0.06 + 0.01 = 0.19
The indirect effect of PEOU on BI was estimated at 0.12 (0.21 × 0.57), mediated by PU. Additionally, the indirect effect of PEOU on BI was estimated at 0.06 (0.37 × 0.15), mediated by ATT. Furthermore, the indirect effect of PEOU on BI was estimated at 0.01 (0.21 × 0.40 × 0.15), mediated by PU and ATT. Therefore, the total indirect effect of PEOU on BI was estimated at 0.19 (0.12 + 0.06 + 0.01).
6.3. Estimating the Effect of Perceived Usefulness on Behavioral Intention to Use
Path 1: PU→(0.57) BI
Path 2: PU→(0.40) ATT→(0.15) BI = 0.40 × 0.15 = 0.06
Total indirect effect = 0.57 + 0.06 = 0.63
The direct effect of PU on BI was estimated at 0.57. Meanwhile, the indirect effect of PU on BI was estimated at 0.06 (0.40 × 0.15), mediated by ATT. The total effect (both direct and indirect) of PU on BI was estimated at 0.63 (0.57 + 0.06).
6.4. Estimating the Effect of Attitude toward Use on Behavioral Intention to Use
- Path: ATT→(0.15) BI
The direct effect of ATT on BI was estimated to be 0.15. The relationships among the four variables are summarized in Table 4, which outlines the estimated direct and indirect effects within the path analysis model. In this model, the direct effect of ATT on BI is 0.15, signifying that a 1-unit change in ATT results in a 0.15-unit change in BI. Similarly, the direct effect of PU on BI in this model is 0.57, indicating that a unit change in PU corresponds to a 0.57-unit change in BI. Furthermore, in addition to the direct effect, PU exhibited an indirect effect of 0.06 on BI, implying that a unit change in PU leads to a 0.06-unit change in BI through ATT.
When all other variables in the model remain constant, a total effect of 0.15 indicates that a 0.15 predicted unit change in BI is attributed to a 1-unit change in the ATT. Similarly, when all other variables in the model remain unchanged, a total effect of 0.63 suggests that a 0.63 predicted unit change in BI is due to a 1-unit change in the PU. Furthermore, when all other variables in the model remain unchanged, a total effect of 0.19 suggests that a 0.19 predicted unit change in BI arises from a 1-unit change in the PEOU.
The three internal variables (ATT, PU, and PEOU) exhibit moderate effects on BI, with values of 0.15, 0.63, and 0.19, respectively. Table 5 summarizes the hypotheses following the completion of testing.
7. Discussion
Learning with augmented reality (AR) in automation systems (AS) has been found to offer more effective support than certain activities with higher cognitive presence. Three variables identified as significant factors in TAM (PU, PEOU, and ATT) were shown to have a significant influence on students’ usage intention. Our findings, indicating that TAM can predict BI, align with the findings of numerous previous studies [50,51,52,53].
PU demonstrated both indirect and direct effects on learners’ acceptance of augmented reality (AR) in automation systems (AS), consistent with findings in the literature [54,55,56,57]. Compared with traditional instruction methods, the augmented reality approach adopted in this study requires more time to accomplish learning tasks and encourages the application of higher-level thinking skills. Several previous studies confirmed that social cognition and cultural knowledge can be more effectively acquired through problem-solving and practice in a social context [58].
This study explored the relationships among PEOU, PU, ATT, and BI among university students. The results suggest that participants exhibited interest in using augmented reality (AR) in automation systems (AS). Furthermore, they demonstrated enhanced task completion and a heightened sense of accomplishment when using augmented reality (AR) in automation systems (AS). These findings are consistent with previous studies [59,60].
The five hypotheses underwent testing through path analysis. The results indicated that perceived ease of use had no significant positive effect on students’ perceived usefulness of augmented reality usage. Notably, perceived usefulness emerged as a critical predictor (β = 0.40) of students’ attitudes toward using augmented reality. Furthermore, perceived ease of use demonstrated a significant positive impact (β = 0.37) on students’ attitude toward use, aligning with the theoretical framework proposed in the research model, although diverging from prior studies regarding augmented reality usage [27,61]. Furthermore, attitude toward use did not emerge as a significant, influential predictor (β = 0.15) of students’ intention to use augmented reality. Other studies have reported similar outcomes [12,59,60]. In addition, perceived usefulness positively impacted (β = 0.57) students’ behavioral intention to use augmented reality. Despite Huang and Liaw’s [14] observation that perceived usefulness is often considered a significant predictor of students’ behavioral intention to use various digital technologies, it is important to note that these studies may have employed different TAM constructs. Wojciechowski and Cellary [62] did not find a significant effect of perceived usefulness on behavioral intention to use.
8. Conclusions
This study developed an integrated theoretical framework to understand university students’ acceptance intention and behavioral intention to use augmented reality (AR) in automation systems (AS) using the technology acceptance model (TAM). The finding that TAM can effectively predict BI aligns with numerous previous studies in the field.
The TAM questionnaire developed for this study comprised domains divided into perceived usefulness (PU), perceived ease of use (PEOU), attitude toward use (ATT), and behavioral intention to use (BI) to use augmented reality (AR). The results of this study indicate that not all the factors exhibited significant relationships with students’ BI of augmented reality (AR) in automation systems (AS). Notably, this study emphasizes the pivotal roles of PU and PEOU as key factors for leveraging AR as an alternative teaching method, with PU significantly influencing students’ BI of augmented reality.
The significance of these findings to university decision-makers lies in recognizing that students who embrace AR technology often view it as a valuable tool for leveraging their educational experience. University administrators should heed the insights gleaned from this study to inform infrastructure development efforts. To effectively integrate this technology, universities should provide students with learning opportunities that enable them to discover the comprehensive and effective features of AR, particularly as its adoption becomes more widespread among end-users.
Despite the contributions of this study, several limitations remain. Firstly, while this study adopted the TAM framework, it did not utilize all the TAM factors. Future research could address this limitation by delving into other TAM factors, such as computer self-efficacy (CSE), which may also influence the acceptance of augmented reality. Secondly, the study’s sample size was limited, suggesting that future investigations should involve educators with insights into the factors influencing augmented reality acceptance.
Author Contributions
The authors contributed meaningfully to this study. W.-J.S. and B.-L.W.—research topic; W.-J.S., B.-L.W. and Y.-C.L.—data acquisition and analysis; W.-J.S.—methodology support; W.-J.S. and B.-L.W.—original draft preparation; W.-J.S., B.-L.W. and Y.-C.L.—writing review and editing. All authors have read and agreed to the published version of the manuscript.
Funding
This research received no external funding.
Institutional Review Board Statement
Not applicable.
Informed Consent Statement
Not applicable.
Data Availability Statement
Data are contained within the article.
Conflicts of Interest
The authors declare no conflicts of interest.
References
- Costa, G.M.; Petry, M.R.; Moreira, A.P. Augmented reality for human-robot collaboration and cooperation in industrial applications: A systematic literature review. Sensors 2022, 22, 2725. [Google Scholar] [CrossRef] [PubMed]
- Amores-Valencia, A.; Burgos, D.; Branch-Bedoya, J.W. The influence of augmented reality (AR) on the motivation of high school students. Electronics 2023, 12, 4715. [Google Scholar] [CrossRef]
- Amores-Valencia, A.; Burgos, D.; Branch-Bedoya, J.W. Influence of motivation and academic performance in the use of augmented reality in education: A systematic review. Front. Psychol. 2022, 13, 1011409. [Google Scholar] [CrossRef] [PubMed]
- Kırıkkaya, E.B.; Başgül, M.Ş. The effect of the use of augmented reality applications on the academic success and motivation of 7th grade students. J. Balt. Sci. Educ. 2019, 18, 362–378. [Google Scholar] [CrossRef]
- Crompton, H.; Burke, D.; Jordan, K.; Wilson, S.W.G. Learning with technology during emergencies: A systematic review of K-12 education. Br. J. Educ. Technol. 2021, 52, 1554–1575. [Google Scholar] [CrossRef]
- Daniela, L. Smart pedagogy as a driving wheel for technology-enhanced learning. Technol. Knowl. Learn. 2021, 26, 711–718. [Google Scholar] [CrossRef]
- Kaufmann, H. The potential of augmented reality in dynamic geometry education. In Proceedings of the 12th international Conference on Geometry and Graphics, Kaufmann, Hannes, Salvador, Brazil, 6–10 August 2006. [Google Scholar]
- Abdallah, I.; Dertimanis, V.; Mylonas, H.; Tatsis, K.; Chatzi, E.; Dervilis, N.; Worden, K.; Maguire, E. Fault diagnosis of wind turbine structures using decision tree learning algorithms with big data. In Safety and Reliability–Safe Societies in a Changing World; CRC Press: Boca Raton, FL, USA, 2018; pp. 3053–3061. [Google Scholar]
- Radcliffe, D. Technological and pedagogical convergence between work-based and campus-based learning. Educ. Technol. Soc. 2002, 5, 54–59. [Google Scholar]
- Wang, L.; Rau, P.; Salvendy, G. Older adults’ acceptance on information technology. Educ. Gerontol. 2011, 37, 1081–1099. [Google Scholar] [CrossRef]
- Wan, Z.; Wan, Y.; Tengku, B.S.; Tengku, Y.; Noniwati, A. Evaluating student’s acceptance of google classroom in co-curricular photography course using technology acceptance model (TAM). Int. J. Technol. Vocat. Educ. Train. 2023, 4, 28–34. [Google Scholar]
- Bonk, C.J. The World Is Open: How Web Technology Is Revolutionizing Education; Jossey-Bass: San Francisco, CA, USA, 2011. [Google Scholar]
- Gagne, R.M.; Wager, W.W.; Golas, K.G.; Keller, J.M. Principles of Instructional Design; Thomson Wadsworth: Toronto, ON, USA, 2005. [Google Scholar]
- Huang, H.M.; Liaw, S.S. An analysis of learners’ intentions toward virtual reality learning based on constructivist and technology acceptance approaches. Int. Rev. Res. Open Distrib. Learn. 2018, 19, 91–115. [Google Scholar] [CrossRef]
- Cabero-Almenara, J.; Fernández-Batanero, J.M.; Barroso-Osuna, J. Adoption of augmented reality technology by university students. Heliyon 2019, 5, e01597. [Google Scholar] [CrossRef]
- Mailizar Johar, R. Examining students’ intention to use augmented reality in a project-based geometry learning environment. Int. J. Instr. 2021, 14, 773–790. [Google Scholar] [CrossRef]
- Davis, F.D. Perceived usefulness, perceived ease of use, and user acceptance of information technology. MIS Q. 1989, 13, 319–340. [Google Scholar] [CrossRef]
- Davis, F.D.; Bagozzi, R.P.; Warshaw, P.R. User acceptance of computer technology: A comparison of two theoretical models. Manag. Sci. 1989, 35, 982–1003. [Google Scholar] [CrossRef]
- Trivunović, B.; Kosanović, M. Acceptance factors of technology use in higher education teaching process: TAM model. In Zbornik radova TREND 2021: XXVII Skup trendovi razvoja “On-line nastava na univerzitetima”; Katić, V., Ed.; University of Novi Sad, Faculty of Technical Sciences: Novi Sad, Serbia, 2021; pp. 119–121. Available online: http://www.trend.uns.ac.rs/stskup/trend_2021/radovi/T1.2/T1.2-5.pdf (accessed on 5 January 2024).
- Cabero-Almenara, J.; Barroso-Osuna, J.; Llorente Cejudo, M.d.C. Technology Acceptance Model & augmented reality: Study in progress. Rev. Lasallista Investig. 2016, 13, 18–26. [Google Scholar]
- Ibáñez, M.B.; Delgado-Kloos, C. Augmented reality for STEM learning: A systematic review. Comput. Educ. 2018, 123, 109–123. [Google Scholar] [CrossRef]
- Akçayır, M.; Akçayır, G. Advantages and challenges associated with augmented reality for education: A systematic review of the literature. Educ. Res. Rev. 2017, 20, 1–11. [Google Scholar] [CrossRef]
- Garcia Estrada, J.; Prasolova-Førland, E. Improving adoption of immersive technologies at a Norwegian university. In Proceedings of the 2022 8th International Conference of the Immersive Learning Research Network, Vienna, Austria, 30 May–4 June 2022; pp. 347–351. [Google Scholar]
- Chien, Y.C.; Su, Y.N.; Wu, T.T.; Huang, Y.M. Enhancing students’ botanical learning by using augmented reality. Univers. Access Inf. Soc. 2019, 18, 231–241. [Google Scholar] [CrossRef]
- Wang, X.M.; Hu, Q.N.; Hwang, G.J.; Yu, X.H. Learning with digital technology-facilitated empathy: An augmented reality approach to enhancing students’ flow experience, motivation, and achievement in a biology program. Interact. Learn. Environ. 2022, 31, 6988–7044. [Google Scholar] [CrossRef]
- Weng, C.; Otanga, S.; Christianto, S.M.; Chu, R.J.C. Enhancing students’ biology learning by using augmented reality as a learning supplement. J. Educ. Comput. Res. 2020, 58, 747–770. [Google Scholar] [CrossRef]
- Yavuz, M.; Çorbacıoğlu, E.; Başoğlu, A.N.; Daim, T.U.; Shaygan, A. Augmented reality technology adoption: Case of a mobile application in Turkey. Technol. Soc. 2021, 66, 101598. [Google Scholar] [CrossRef]
- Stojšić, I.; Ostojić, N.; Stanisavljević, J. Students’ acceptance of mobile augmented reality applications in primary and secondary biology education. Int. J. Cogn. Res. Sci. Eng. Educ. 2022, 10, 129–138. [Google Scholar] [CrossRef]
- Chu, Y.B.; Chang, C.W. A mobile augmented reality interface on additive manufacturing. In Advances in Electrical and Electronic Engineering and Computer Science; Zakaria, Z., Emamian, S.S., Eds.; Springer: Singapore, 2021; pp. 1–12. [Google Scholar]
- Danielsson, O.; Holm, M.; Syberfeldt, A. Augmented reality smart glasses in industrial assembly: Current status and future challenges. J. Ind. Inf. Integr. 2020, 20, 100175. [Google Scholar] [CrossRef]
- Makris, S.; Karagiannis, P.; Koukas, S.; Matthaiakis, A.S. Augmented reality system for operator support in human-robot collaborative assembly. CIRP Ann. 2016, 65, 61–64. [Google Scholar] [CrossRef]
- Goel, P.; Mahadevan, K.; Punjani, K.K. Augmented and virtual reality in apparel industry: A bibliometric review and future research agenda. Foresight 2023, 25, 167–184. [Google Scholar] [CrossRef]
- Yu, S.J.; Hsueh, Y.L.; Sun, J.C.; Liu, H.Z. Developing an intelligent virtual reality interactive system based on the ADDIE model for learning pour-over coffee brewing. Comput. Educ. Artif. Intell. 2021, 2, 100030. [Google Scholar] [CrossRef]
- Sholihin, M.; Sari, R.C.; Yuniarti, N.; Ilyana, S. A new way of teaching business ethics: The evaluation of virtual reality-based learning media. Int. J. Manag. Educ. 2020, 18, 100428. [Google Scholar] [CrossRef]
- Akman, E.; Çakır, R. The effect of educational virtual reality game on primary school students’ achievement and engagement in mathematics. Interact. Learn. Environ. 2020, 31, 1467–1484. [Google Scholar] [CrossRef]
- Asad, M.M.; Sherwani, F.; Hassan, R.B.; Sahito, Z.; Khan, N. Workforce safety education and training for oil and gas industry: A conceptual framework for virtual reality-based HAZFO expert 2.0. J. Eng. Des. Technol. 2022, 20, 1122–1131. [Google Scholar] [CrossRef]
- Alrehaili, E.A.; Al Osman, H. A virtual reality role-playing serious game for experiential learning. Interact. Learn. Environ. 2022, 30, 922–935. [Google Scholar] [CrossRef]
- Clark, R.C.; Mayer, R.E. E-Learning and the Science of Instruction: Proven Guidelines for Consumers and Designers of Multimedia Learning; John Wiley & Sons: Hoboken, NJ, USA, 2016. [Google Scholar]
- Astuti, T.N.; Sugiyarto, K.H.; Ikhsan, J. Effect of 3D visualization on students’ critical thinking skills and scientific attitude in chemistry. Int. J. Instr. 2020, 13, 151–164. [Google Scholar] [CrossRef]
- Stavroulia, K.E.; Christofi, M.; Baka, E.; Michael-Grigoriou, D.; Magnenat-Thalmann, N.; Lanitis, A. Assessing the emotional impact of virtual reality-based teacher training. Int. J. Inf. Learn. Technol. 2019, 36, 192–217. [Google Scholar] [CrossRef]
- Asad, M.M.; Hassan, R.B.; Sherwani, E.F. Instructional models for enhancing the performance of students and workforce during educational training. Acad. Arena 2014, 6, 27–31. [Google Scholar]
- Chang, C.Y.; Sung, H.Y.; Guo, J.L.; Chang, B.Y.; Kuo, F.R. Effects of spherical video-based virtual reality on nursing students’ learning performance in childbirth education training. Interact. Learn. Environ. 2022, 30, 400–416. [Google Scholar] [CrossRef]
- Allen, W.C. Overview and evolution of the ADDIE training system. Adv. Dev. Hum. Resour. 2006, 8, 430–441. [Google Scholar] [CrossRef]
- Hair, F.; Black, C.; Babin, J.; Anderson, E. Multivariate Data Analysis, 7th ed.; Pearson Education Limited: London, UK, 2014. [Google Scholar]
- Bagozzi, R.P.; Yi, Y. On the Evaluation of Structural Equation Models. J. Acad. Mark. Sci. 1988, 16, 74–94. [Google Scholar] [CrossRef]
- Lai, C.M.; Huang, H.M.; Liaw, S.S.; Huang, W.W. A study of user’s acceptance on three dimensional virtual reality applied in medical education. Bull. Educ. Psychol. 2009, 40, 341–362. [Google Scholar]
- Shyr, W.J.; Chiou, C.F.; Yang, F.C.; Li, P.C. Energy management competency development based on the internet of things (IOT). Int. J. Eng. Educ. 2017, 33, 1380–1385. [Google Scholar]
- Chin, W.W.; Marcolin, B.L.; Newsted, P.R. A partial least squares latent variable modeling approach for measuring interaction effects. Inf. Syst. Res. 2003, 14, 189–217. [Google Scholar] [CrossRef]
- Fornell, C.; Bookstein, F.L. Two structural equation models: LISREL and PLS applied to consumer exit-voice theory. J. Mark. Res. 1982, 19, 440–452. [Google Scholar] [CrossRef]
- Cheng, Y.M.; Lou, S.J.; Kuo, S.H.; Shih, R.C. Investigating elementary school students’ technology acceptance by applying digital game-based learning to environmental education. Australas. J. Educ. Technol. 2013, 29, 96–110. [Google Scholar] [CrossRef]
- Fang, X.; Zhao, F. Personality and enjoyment of computer game play. Comput. Ind. 2010, 61, 342–349. [Google Scholar] [CrossRef]
- Lee, W.; Xiong, L.; Hu, C. The effect of Facebook users’ arousal and valence on intention to go to the festival: Applying an extension of the technology acceptance model. Int. J. Hosp. Manag. 2012, 31, 819–827. [Google Scholar] [CrossRef]
- Park, Y.; Son, H.; Kim, C. Investigating the determinants of construction professionals’ acceptance of web-based training: An extension of the technology acceptance model. Autom. Constr. 2012, 22, 377–386. [Google Scholar] [CrossRef]
- Polancic, G.; Hericko, M.; Rozman, I. An empirical examination of application frameworks success based on technology acceptance model. J. Syst. Softw. 2010, 83, 574–584. [Google Scholar] [CrossRef]
- Hong, J.C.; Hwang, M.Y.; Hsu, H.F.; Wong, W.T.; Chen, M.Y. Applying the technology acceptance model in a study of the factors affecting usage of the Taiwan digital archives system. Comput. Educ. 2011, 57, 2086–2094. [Google Scholar] [CrossRef]
- Pai, F.Y.; Huang, K.I. Applying the technology acceptance model to the introduction of healthcare information systems. Technol. Forecast. Soc. Chang. 2011, 78, 650–660. [Google Scholar] [CrossRef]
- Teo, T. Examining the influence of subjective norm and facilitating conditions on the intention to use technology among pre-service teachers: A structural equation modeling of an extended technology acceptance model. Asia Pac. Educ. Rev. 2010, 11, 253–262. [Google Scholar] [CrossRef]
- Admiraal, W.; Huizenga, J.; Akkerman, S.; Dama, G.T. The concept of flow in collaborative game-based learning. Comput. Hum. Behav. 2011, 27, 1185–1194. [Google Scholar] [CrossRef]
- Kearney, P. Cognitive assessment of game-based learning. Br. J. Educ. Technol. 2007, 38, 529–531. [Google Scholar] [CrossRef]
- Huizenga, J.; Admiraal, W.; Akkerman, S.; Dam, G.T. Mobile game-based learning in secondary education: Engagement, motivation and learning in a mobile city game. J. Comput. Assist. Learn. 2009, 25, 332–344. [Google Scholar] [CrossRef]
- Koutromanos, G.; Mikropoulos, T.A. Mobile augmented reality applications in teaching: A proposed Technology Acceptance Model. In Proceedings of the 2021 7th International Conference of the Immersive Learning Research Net-Work-iLRN, Eureka, CA, USA, 17 May–10 June 2021; pp. 273–280. [Google Scholar]
- Wojciechowski, R.; Cellary, W. Evaluation of learners’ attitude toward learning in ARIES augmented reality environments. Comput. Educ. 2013, 68, 570–585. [Google Scholar] [CrossRef]
Figure 1.
Technology acceptance model.

Figure 2.
Wearable augmented reality (AR) glasses.

Figure 3.
Path analysis of the research model.


Table 1.
Specifications of wearable augmented reality hardware.
| Built-in Display (Built-in Audio) | |
|---|---|
| AR View | Monocular |
| FOV (Horizontal) | 16.8 degrees |
| Weight | 180 g |
| Built-in audio | Yes (ear speaker) |
| Microphone | Yes (noise canceling) |
| Connectivity | Wi-Fi, Bluetooth |
| Charging | USB-C |
| Camera | 12 MP and 4 K 30 FPS video |
| Memory | 6 GB RAM—64 GB internal memory |
| Battery | 1000 mAh internal battery |
| Battery life | 2–3 h |
| Controls | Touchpad, head motion, and voice |
| Operating system | Android 8.1 |
| Chip | 8 Core 2.52 GHz Qualcomm XR1 |
| Compliances | IP 67, water, dust, and drop resistant, and PPE |
Table 2.
Descriptive statistics of the TAM questionnaire (N = 41).
| Dimension | Item | Mean | SD |
|---|---|---|---|
| PU | 1. I believe that employing augmented reality (AR) in automation systems (AS) can improve my learning outcomes. | 4.43 | 0.634 |
| 2. I believe that employing augmented reality (AR) in automation systems (AS) can improve my learning ability. | 4.31 | 0.649 | |
| 3. I consider learning augmented reality (AR) in automation systems (AS) valuable. | 4.48 | 0.745 | |
| 4. I anticipate using augmented reality (AR) in automation systems (AS) can increase my learning efficiency. | 4.34 | 0.693 | |
| PEOU | 5. The augmented reality (AR) interfaces in automation systems (AS) are clear and understandable. | 4.46 | 0.595 |
| 6. The software associated with augmented reality (AR) in automation systems (AS) is easy to use. | 4.24 | 0.767 | |
| 7. The hardware components of augmented reality (AR) in automation systems (AS) are user-friendly. | 4.29 | 0.782 | |
| 8. The links between software and hardware of augmented reality (AR) in automation systems (AS) are easy to learn. | 4.27 | 0.707 | |
| ATT | 9. I find augmented reality (AR) in automation systems (AS) is a great system. | 4.51 | 0.637 |
| 10. I am satisfied with my learning experience of augmented reality (AR) in automation systems (AS). | 4.56 | 0.549 | |
| 11. I strongly believe that the technology of augmented reality (AR) in automation system (AS) technology is conducive to effective learning. | 4.39 | 0.666 | |
| 12. I am enthusiastic about utilizing augmented reality (AR) in automation systems (AS) as a learning tool. | 4.43 | 0.634 | |
| BI | 13. I am willing to use augmented reality (AR) for learning purposes. | 4.58 | 0.590 |
| 14. I feel happy using augmented reality (AR) for learning. | 4.48 | 0.675 | |
| 15. I am interested in increasing the frequency of utilizing augmented reality (AR) for learning. | 4.36 | 0.698 | |
| 16. I hope to continue utilizing augmented reality (AR) for learning purposes in the future. | 4.51 | 0.637 |
Table 3.
Path analysis of restriction model of augmented reality (AR) in automation system (AS) acceptance.
Table 3.
Path analysis of restriction model of augmented reality (AR) in automation system (AS) acceptance.
| Criterion | Predictors | β | t |
|---|---|---|---|
| Behavioral intention to use (BI) | Attitude toward use (ATT) | 0.15 | 0.83 |
| Perceived usefulness (PU) | 0.57 | 5.53 *** | |
| Attitude toward use (ATT) | Perceived usefulness (PU) | 0.40 | 2.16 * |
| Perceived ease of use (PEOU) | 0.37 | 2.41 * | |
| Perceived usefulness (PU) | Perceived ease of use (PEOU) | 0.21 | 1.12 |
* p < 0.05; *** p < 0.001.
Table 4.
Summary of estimated direct and indirect effects.
| Relationships (Paths) | Direct Effect (1) | Indirect Effect (2) | Total Effect (1 + 2) |
|---|---|---|---|
| 1: ATT→BI | 0.15 | 0.15 | |
| 2: PU→BI | 0.57 | 0.06 | 0.63 |
| 3: PEOU→BI | 0.19 | 0.19 |
Table 5.
Hypotheses summary.
| Hypothesis | Statement | Results |
|---|---|---|
| H1 | PU has a positive effect on BI | Supported |
| H2 | ATT has a positive effect on BI | Unsupported |
| H3 | PU has a positive effect on ATT | Supported |
| H4 | PEOU has a positive effect on ATT | Supported |
| H5 | PEOU has a positive effect on PU | Unsupported |
Disclaimer/Publisher’s Note: The statements, opinions and data contained in all publications are solely those of the individual author(s) and contributor(s) and not of MDPI and/or the editor(s). MDPI and/or the editor(s) disclaim responsibility for any injury to people or property resulting from any ideas, methods, instructions or products referred to in the content. |
© 2024 by the authors. Licensee MDPI, Basel, Switzerland. This article is an open access article distributed under the terms and conditions of the Creative Commons Attribution (CC BY) license (https://creativecommons.org/licenses/by/4.0/).
Share and Cite
MDPI and ACS Style
Shyr, W.-J.; Wei, B.-L.; Liang, Y.-C. Evaluating Students’ Acceptance Intention of Augmented Reality in Automation Systems Using the Technology Acceptance Model. Sustainability 2024, 16, 2015. https://doi.org/10.3390/su16052015
AMA Style
Shyr W-J, Wei B-L, Liang Y-C. Evaluating Students’ Acceptance Intention of Augmented Reality in Automation Systems Using the Technology Acceptance Model. Sustainability. 2024; 16(5):2015. https://doi.org/10.3390/su16052015
Chicago/Turabian StyleShyr, Wen-Jye, Bo-Lin Wei, and Yu-Chuan Liang. 2024. "Evaluating Students’ Acceptance Intention of Augmented Reality in Automation Systems Using the Technology Acceptance Model" Sustainability 16, no. 5: 2015. https://doi.org/10.3390/su16052015
Note that from the first issue of 2016, this journal uses article numbers instead of page numbers. See further details here.