
The Influence of Augmented Reality (AR) on the Motivation of High School Students


1
Research Institute for Innovation & Technology in Education (UNIR iTED), Universidad Internacional de La Rioja, 26006 Logroño, Spain
2
Facultad de Minas, Universidad Nacional de Colombia, Medellín 17003, Colombia
*
Author to whom correspondence should be addressed.
Electronics 2023, 12(22), 4715; https://doi.org/10.3390/electronics12224715
Submission received: 6 October 2023
/
Revised: 15 November 2023
/
Accepted: 16 November 2023
/
Published: 20 November 2023
(This article belongs to the Section Computer Science & Engineering)
Abstract
:Augmented reality (AR) is a technology whose presence has increased in the field of education in recent years. However, its role in secondary education has not been thoroughly explored. Therefore, this research aims to analyse the influence of AR on the motivation of students at this stage while considering gender and previous information and communication technology (ICT) experience. This research uses a quantitative methodology that follows Keller’s Attention, Relevance, Confidence and Satisfaction (ARCS) motivational model. We implemented this instructional design model for a sample of 321 students from the same educational centre. They were divided into two categories: an experimental group (n = 159) and a control group (n = 162). The control group were studied in a slide-based learning environment, while the experimental group worked with an AR mobile application. For data collection, we used the Instructional Materials Motivation Survey (IMMS). The results showed that the students who used AR displayed greater motivation, highlighting great interest in the integration of this technology into the learning process. However, no significant differences were obtained in the motivation of the students according to gender and previous experience with the use of ICT. In conclusion, this research shows that the use of AR improves motivation in secondary education.
1. Introduction
In the educational field, motivation as a quality in students in the teaching–learning process has changed from having no relevance to becoming a crucial issue. This significant difference has gradually introduced itself into the classroom, posing a great challenge for educational centres and their bodies of teachers, students, and parents. However, the challenge of capturing the attention and interest of students has become a significant problem, since the latent neglect and apathy that the students demonstrate has grown exponentially, especially in the educational stage of secondary education [1,2].
Motivation has had a long tradition in the field of psychology, where extensive scientific papers assert the importance of this concept [3,4]. However, motivation has been largely forgotten in the educational field until a few years ago. It is thus necessary to understand its impact on the learning process [5].
In this sense, the teaching and learning process is a joint task by teachers and students, in which the latter perform an essential task, which necessitates true motivation in order to carry out the task [6]. This last point speaks to the current problem: poor levels of participation and motivation, resulting in a drop in grades and an exponential growth in school failure. The use of information and communication technologies (ICT) intends to address this great challenge; in particular, the use of augmented reality (AR) as an educational technology can incentivise students [7,8]. Thanks to the use of electronic devices such as smartphones, tablets, and laptops, this educational technology can be introduced to facilitate interaction among students, producing a fun and enthusiastic classroom environment [9].
For this reason, an AR mobile application was developed to present content and objects in 3D through personalized graphic markers with the purpose of improving the motivation of students in secondary education. This application, called ComputAR, consists of a menu system on computers and their components, which is why it was implemented in the ICT curricular subject. Its content includes a didactic unit on computer equipment and hardware, and it fits perfectly with the proposal conducted. The students in the experimental group used this application, while the control group worked with slides in their learning environment. Finally, the students were evaluated based on the content addressed thanks to the work conducted by different teachers who taught classes in both groups. Based on the proposal of this study, we set the following aims:
- Analyse if the degree of attention, relevance, confidence, and satisfaction evaluated was influenced using AR.
- Determine whether gender presents a significant difference in the motivation of the students before the use of AR.
- Ascertain if the students’ previous experience with the use of ICT has an impact on their motivation when using AR.
Based on these aims, we propose the following hypotheses:
- Student motivation is influenced by using AR learning objects.
- Gender does not present a significant difference in motivation based on the use of AR.
- Students’ previous experience with the use of ICT leads to a significant difference in their motivation before the use of AR.
This article is structured as follows. The Section 2 addresses the existing research related to the work proposal, specifically the investigations that examine AR and the motivation of secondary education students. The Section 3 presents the methodology and the materials used. The Section 4 shows the results obtained from the data collection questionnaires. The Section 5 discusses the hypotheses, and finally, the Section 6 develops the conclusions based on a comparison of the proposed objectives and the results obtained.
2. Literature Review
2.1. Motivation as a Conditioning Factor in Education
The term ‘motivation’ comes from the Latin word motivus or mottus and means ‘cause of movement’. This definition has been developed over the years based on the scope of the work in question. Several authors refer to motivation as the force that produces a certain behaviour in an individual when they intend to achieve a goal [10,11]. From another perspective, motivation has been defined as internal situations that incite, direct, and carry out behaviour towards a specific purpose [12].
Regarding the field of education, Moronta et al. [13] defined motivation as a state in students that requires meditation and disturbance, reappearing and subsisting in the students’ focus when conducting tasks during any of the teachings. This presupposes the increased attention of the students, which takes place in each subject in the entire teaching–learning process, producing the skills and abilities necessary to meet objectives [14]. In addition, this state must be present in teachers and students since the involvement of one party without the other is useless. In this way, teachers must dynamically develop both the theoretical and practical parts [15], and students must work with the same impetus on the activities or projects proposed to achieve certain goals [16]. Obviously, there is a close connection between the objectives and the motivation of the students; depending on the proposed goal, the motivation that a student presents can be of one type or another.
In the educational field, students show attitudes, feelings, and goals during the development of the tasks or objectives that they intend to achieve. Meanwhile, teachers manage the teaching and learning process not only through the design of didactic programs that include objectives, content, and skills but also with the role they play, which can produce positive effects such as motivation [17].
Academic motivation is centred on three dimensions: the motivational component of value, which reflects the hidden purpose when an activity is completed together with the importance given by the students during the process of undertaking it; the motivational component of the goals, which is related to the self-perception and convictions that the students show based on their abilities; and the affective motivational component, which is based on sensations and emotional responses (both positive and negative) in the students when they achieve an objective [18].
Once the different existing motivations have been analysed and detailed, the most relevant motivation theories must be cited wherever emphasis has been placed within the educational field, and those that have a special connection with this field must be identified. In this sense, a classification of the different motivational theories is made based on four existing psychological perspectives based on motivation: biological, behavioural, cognitive, and social. This categorization has evolved throughout history based on the different reactions or emotions that have been perceived as intertwined in all types of behaviours [19]. Currently, the biological and cognitive approaches mainly stand out due to the large amount of in-depth research conducted on them [20].
Thus, motivation is the force that guides students to choose and carry out an activity among all the possibilities that can occur on certain occasions, allowing for their expectations or goals to be reached. Therefore, this study approaches the analysis of motivation through the ARCS model of Keller [21], which is based on the existence of both personal and environmental singularities that act on motivation [22]. This instructional design model is usually implemented in educational contexts where the use of virtual technology prevails via conducting a quantitative analysis of its categories [22,23]. We conducted a comparison between the experimental and control groups based on the evaluations issued by the data collection instruments used.
2.2. Augmented Reality in Education
According to Cabero-Almenara and García-Jiménez [24] and Di-Serio et al. [25], AR presents these typical characteristics:
- The combination of real and virtual objects in a real context using technological devices
- The interaction of physical and digital information in real time
- The alteration and enrichment of the real context
- Virtual information (can be audio, video, images, or 3D models)
The projection of virtual images on real-world objects can improve reality [26] thanks to the simplification of the real context, since a better visualization of reality is obtained [27]. Another aspect to highlight is the possible alteration of the real world through virtual content [28].
In this sense, the incorporation of new tools such as AR in the educational field produces positive attitudes towards it, enhancing the interest of students [29,30]. This educational technology offers a fantastic opportunity for use in the teaching and learning process [31,32]. Likewise, the considerable number of new applications and software based on AR, together with the advancement of 5G technology, has allowed for a greater and better use of this technology in the educational field [33,34].
Regarding the motivation presented by students in relation to their gender, the investigations of [35,36] have affirmed that the behaviour presented by male students is different from that presented by female students; therefore, there is a significant difference in motivation with the use of AR. However, other authors suggest that the difference shown is negligible [37,38].
Another factor to analyse is the student’s previous experience with the use of ICT. In this sense, some investigations emphasize the influence of this variable on the motivation presented by students [39,40]. Therefore, it is vital to understand the relevance of gender and previous ICT experience when implementing the educational technology of AR in any of the educational stages [41,42]. It is crucial to more accurately assess if the evolutionary stages of the human being influence the difference between genders in relation to the motivation that students present when working with AR [43,44,45].
However, it is also necessary to mention some challenges that must be overcome in order to properly implement the technology. The small number of studies that focus on didactic use stand out [46], along with the small amount or absence of training that teachers have on ICT, particularly on AR [47], as well as the insufficiency of innovative and motivating experiences [48], the lack of resources and AR learning objects in certain subjects [49], the lack of substantiation of theoretical models for their incorporation [50], and the complicated labour situation that teachers face given the minimal logistical support provided by their educational centres [51].
This study thus examines whether the use of AR in the teaching and learning process improves the motivation of students in the secondary education stage. To do this, we introduce the ARCS model by Keller [21], which is based on achievement motivation and tries to connect student behaviours with knowledge so that goals can be achieved. According to Keller [21], expectations are the mechanism that encourages and gives meaning to the student during the learning process; motivation is linked to the activities to be conducted and the success of their achievement. This model was developed for face-to-face environments that introduce the use of electronic devices [52,53,54] and is related to instructional design with the purpose of improving the teaching and learning process for teachers and students [55].
Based on these results, Lee and Hao [56] indicate that the ARCS model displays a change in the traditional paradigm, where collaborative work is enhanced in motivational learning environments, allowing teachers to integrate them into the classroom in search of a satisfactory teaching method for students. Furthermore, they point out that this model brings together teaching processes, motivation, instruction, multimedia applications, questionnaires, and evaluation.
It is worth highlighting the large number of studies that reflect the effectiveness of the ARCS model applied to different real learning contexts—for example, the research carried out by Loorbach et al. [57]. Most of these investigations were brought together in the literature review carried out by Li and Keller [58], where the educational stages of primary, secondary, university, and technical schools were addressed.
Finally, Amores et al. [7] carried out a systematic review of the literature, where they compile research that had theoretically supported the ARCS model when it was used with augmented reality in the field of education. This work highlights the differences and limitations of the works analysed. Our investigation puts these circumstances to the test.
3. Methods
3.1. Participants
We conducted this research on a sample recruited for convenience; a total of 321 students in the secondary education stage of the Colegio Cerrado de Calderón (Málaga), aged 14–17, were assigned to an experimental group (159 students) and a control group (162 students). All of the students who were studying the subject of ICT participated in this study, since it combined a didactic unit on computer equipment and architecture as well as the computer’s main components.
The reason as to why this sample was chosen is the lack of motivation that the students presented in the secondary education stage, especially in the last courses of the compulsory stage and in the first of the post-obligatory. Furthermore, the content addressed in this research was developed in the subject of Digitalization, which was taught in the said educational stage. This subject presented high levels of failure and low motivation rates, since the students did not consider it very relevant.
Percentages by gender corresponded to 33.33% females and 66.67% males in both groups. In addition, only 2.80% of the students had repeated a course, which was distributed almost equally in both groups (four and five repeating students were in the control and experimental groups, respectively).
Regarding the course of origin, 24.92% and 37.07% of the students were in the third and fourth years of compulsory secondary education, respectively; 23.68% of the students were in the first year of the baccalaureate, and 14.33% of the students were in their second year of the baccalaureate.
We expected that some of the students would have important levels of knowledge about innovative technologies. In this regard, 23.68% of the students showed that they had previous experience with the use of ICT, while 76.32% said they did not. However, in no case did the students experiment in the teaching process with mobile devices, much less with the educational technology of AR. Table 1 shows the percentages of the participants for the experimental and control groups.
The percentages of ages of the participants are as follows: 29.60% were 14 years old, 33.96% were 15 years old, 21.49% were 16 years old, and only 14.95% were 17 years old.
Since all of the students were minors, pertinent permission was requested from the research ethics committee of the International University of La Rioja (UNIR), which favourably evaluated the research, with code PI:065/2022. After the necessary permits were obtained, and in compliance with the legal system, informed consent was given by the parents/mothers/legal guardians where voluntary, anonymous, and disinterested collaboration was requested. In addition, ethical procedures constantly adhered to the standards of the Declaration of Helsinki.
Additionally, personal data were collected according to Organic Law 3/2018 on the Protection of Personal Data and Guarantee of Digital Rights, such as information associated with the existence and occupation of the participants but never related to their identity (name, surname, ID, etc.). Specifically in this regard, they were asked for data relating to the variables of sex, age, group class, and type of student (repeater or non-repeater). However, no participant generated a personal ID, as it was not required for the research.
In relation to the data collected through the Microsoft Forms application, their anonymity was guaranteed by eliminating the Internet Protocol (IP). Anonymity was guaranteed among all the databases that may have been involved in the process, making it impossible to know who answered the online set of questions. Moreover, the data were housed independently from those of the institutions participating in this research. In this way, the anonymity of the databases was absolute. Microsoft Forms for online surveys adheres to the highest quality standards in terms of security and data protection, as can be seen in its own security policy, which complies with European and Spanish regulations.
Finally, to avoid possible biases, the questionnaires were carried out in digital format in the Computer Room, where each student had a computer. The students accessed these questionnaires through their education domain emails to guarantee the sending of a single response. However, given the configuration of the form, the email from where it had been sent was hidden, thus guaranteeing anonymity.
3.2. Methodology and Instruments
This research uses a quantitative methodology. This type of method designs all the aspects of the study before data collection, given that the independent variable cannot be altered. A quantitative methodology offers an empirical–analytical approach based on the mean and the standard deviation of the answers.
To understand the impact of the use of AR in a learning process about motivation, we only conducted a quasi-experimental study of a post-test with the experimental and control groups. This was intended to compare both groups, as it was the best way to reveal the influence of this educational technology on secondary education students. For this, we used an instrument called the Instructional Materials Motivation Survey (IMMS), included in Keller’s ARCS model [21]. Students from both groups completed this questionnaire once the experiment in question finished. Again, it is important to emphasize that the experimental group used AR in the teaching and learning process, while the control group worked in a slide-based learning environment.
To address the external variables of gender and previous ICT experience, we conducted a study of correlations between the motivation presented by the students and these variables. This type of study is essential to respond to the objectives set out in the research [59].
To find out if the distribution followed was normal, the corresponding Kolmogorov–Smirnov or Shapiro–Wilk test was performed on each of the groups according to the number of members. Finally, for the data that did not follow a normal distribution, we used the non-parametric test, the Mann–Whitney U test, since it involved two independent groups. Given that some data present a normal distribution, the student’s parametric t-test for the independent samples was performed.
The IMMS allows us to ascertain the situation of people when they react to instructional materials. It consists of thirty-six items that are grouped into four dimensions in the said model (attention, relevance, confidence, and satisfaction) and is developed through a Likert-type scale, where 1 means ‘totally disagree’, 2 means ‘disagree’, 3 means ‘neutral (neither disagree nor agree)’, 4 means ‘agree’, and 5 means ‘totally agree’.
This instrument has been endorsed and used in a multitude of investigations, some of them closely related to this project [57,60,61]. All of these authors concluded that the IMMS must be adapted to the characteristics of the students and the instructional program of each investigation.
In addition to these investigations, this questionnaire has been applied to other projects that are more intricately linked to this work. Notably, it has been used to examine the degree of motivation of students when using different technologies such as video games [62], videos in virtual training [63], MOOCs [64], and AR [65,66,67,68,69,70,71,72].
Given these considerations, we adapted the questionnaire to the educational technology used and to the diverse groups that were part of the research (experimental and control). We also adapted both questionnaires to the profiles of the secondary education students, since this provided greater credibility and validity to the research [25].
We applied Cronbach’s alpha statistic to both questionnaires to test the validity of the instrument once the modifications regarding the educational research technology were made to the original. First, we analysed the questionnaire applied to the control groups; Cronbach’s alpha was 0.857, which translates into extremely high reliability. In addition, we calculated Cronbach’s alpha for each of the dimensions of this questionnaire. Table 2 shows the data obtained and reflects how the scores of the dimensions are greater than or equal to 0.7, which translates into good reliability.
Second, we analysed the questionnaire applied to the experimental groups; Cronbach’s alpha was 0.901, which translates into extremely high reliability. We also calculated Cronbach’s alpha for each of the dimensions of the questionnaire. Table 3 shows the data obtained and reflects how the scores of the dimensions are higher than or close to 0.7, which translates into high reliability.
We also performed an item–total correlation to analyse whether, by removing any item, the reliability of any of the IMMS questionnaires (control and experimental) improved. We confirmed that the high reliability value of the two questionnaires would not be significantly affected by removing any of the items.
Finally, we applied an item–total correlation to each of the dimensions to discover whether the reliability index of the different dimensions improved if any item was eliminated. The results obtained in each of the dimensions did not show significant improvement in the reliability of the IMMS instruments analysed; therefore, we decided not to eliminate any item from the dimensions.
The complete questionnaires are thus supported, since applying the statistic to the different instruments in general, to the dimensions, and to the respective items would not significantly improve their reliability if any element were to have been removed.
Data collection was carried out in the last scheduled session for both the experimental and control groups.
3.3. Materials and Procedure
Given the nature of this research, we used Keller’s ARCS model [21], which is a guide for the development of didactic materials that favours the efficient performance of its phases and promotes an evaluation through student feedback. Furthermore, we considered an instructional design model for the analysis of student motivation [73]. The four components of this model (attention, relevance, confidence, and satisfaction) provide optimal and necessary conditions for learning, thus granting it recognition as an educational model [22]. The ARCS model by Keller [21] considers the following phases: analysis, design, development, and pilot, as shown in Figure 1.
In the analysis phase, the existing problems were found in relation to the research proposed, and a systematic review of the existing literature was developed based on the proposal of Kitchemhan [74]. According to the cited authors, this protocol requires an exhaustive, objective, and reliable general description, which is governed by defined and strict steps. Finally, the research design was chosen, emphasizing the selection of technological tools that allow for the visualization of AR objectives, content, and the information collection instruments necessary to conduct the investigation.
In the design phase, the content, materials, and mobile application to be implemented in the classroom, as well as the instruments for data collection, were selected and projected. It is important to emphasize that the phase began by designing the necessary material for the control group, which was later translated for the AR mobile application used in the experimental group. The presentation designed combined all of the content of the didactic unit: the concepts, the activities, and the exercises. However, the proposed mobile application only contained the theory; therefore, activities and exercises were managed through the Microsoft Teams educational platform. Finally, the motivational questionnaires for the instructional materials were designed, guaranteeing the anonymity of the students and the protection of their data using the Microsoft Forms tool.
In the development phase, the necessary resources and materials were built to conduct the educational experience in both the experimental and control groups. In addition, the data collection instruments were developed. These were the instructional material motivational questionnaires (IMMS), for which Cronbach’s alpha was calculated in order to confirm their reliability.
Regarding the creation of the control group materials, the Microsoft PowerPoint application was used for the theoretical content and the activities or exercises. The students used OneNote, OneDrive, Genially, Canva, and PowerPoint. These programs were combined with the Microsoft Teams platform, which allows for the integration of these tools.
For the experimental group, the AR mobile application ComputAR was developed using the Vuforia Engine software platform (version 10), which supports this educational technology and is based on graphic markers and functionalities such as virtual buttons. This software was combined with the Unity 3D development environment (version 2019.4.1f1), Android Studio (version 2021.2.1), and Virtual Studio 2019, giving it spectacular power for creating AR assets. Additionally, 3D objects were used from free repositories, promoting the use of open educational resources (OER). Finally, we opted for the creation of graphic markers through code, giving it greater customization. Figure 2 shows the code that was developed to the needs of this research.
ComputAR was developed for the Android operating system and consists of a menu system on computers that project objects in AR through graphic markers, as shown in Figure 3.
To view each of these devices, it was necessary to press any button and capture the associated graphic marker. Figure 4 shows a 3D model of the computer in question.
The students worked on the components of a computer using the hardware menu, which provided a brief explanation of the components and an AR visualization.
Finally, the pilot phase brought the classroom implementation, the data collection in October–December 2022, and the subsequent evaluation together. Since the content and materials are identical in both groups, the session schedule was the same, except for one extra session in the experimental group for the installation and use of the ComputAR application.
Regarding classroom implementation, a timeline of the different computers highlighted their characteristics and impact. A digital artefact was created in which the background was an image of an open desktop computer, incorporating the definitions and images of the different components of a desktop computer in their correct place. Finally, a presentation was designed; each slide needed to include a part and accessory of the desktop computer along with technical specifications, price, the web address of the product and image, and total budget. This last piece needed to be shown in class so that the students could become salespeople for the very computer they had designed.
The strategies were chosen in order to meet the objectives proposed. Using an active methodology, the teacher created motivating conditions for students to become involved in the learning process, based on their cognitive abilities and at their own pace. Some of the instructional techniques used were brainstorming for the introduction of the content, analysing cases for the different machines and computers, and making an interactive presentation. In the motivational strategies section, the use of real-world examples and research was encouraged to enhance student attention. In addition, the communication of objectives and prerequisites and future usefulness was introduced to improve student confidence and relevance. Finally, they were given control of their learning with the purpose of seeking positive results for their personal satisfaction.
Table 4 shows the instructional design for the students who formed the experimental group. The duration of each session was 60 min.
For data collection, the questionnaires were applied using a form on the network to later analyse and interpret the data obtained. Based on these data, we conducted a validation process of the instruments, obtaining elevated levels for Cronbach’s alpha (specifically, 0.863 for the control group and 0.901 for the experimental group).
Finally, an analysis of the different measurement instruments elucidated the veracity of the hypotheses to verify the achievement of the objectives set and reveal the influence of AR on the motivation of students. We conducted a discussion and formed conclusions based on the results obtained, which reveals the success of the proposal and indicates future lines of research.
4. Results
This section describes the analysis of the data obtained in the IMMS that was used for this research. These instruments were used for both groups (control and experimental); therefore, it was necessary to verify the differences or similarities that they presented through the respective hypotheses. The analysis was conducted using the Excel software (version 2019) and the SPSS program (version 26).
4.1. Results of the Post-Test Study
This method develops a series of checks based on the motivation dimension. First, we show the descriptive results of the differences between the IMMS questionnaires of both groups. These are later used to perform the respective normality control with the Kolmogorov–Smirnov test. Next, we conduct a series of hypothesis contrasts based on the means of the questionnaires for both groups. Finally, we obtain the correlations of the results in the complete questionnaire and in each of the dimensions, and we examine the variables of gender and previous experience with the use of ICT. This process is applied to both the control and experimental groups to ascertain whether there is a significant difference in the motivation of the students in the two groups.
4.1.1. Statistical Analysis
This procedure compares the differences registered among the dimensions of attention, relevance, confidence, and satisfaction of the IMMS questionnaires according to the group. Table 5 shows the results of the dimensions based on the means and standard deviation.
The scores obtained for the complete IMMS questionnaire reflect that the experimental group agrees with the different items raised; however, the control group is closer to the neutral position, neither agreeing nor disagreeing. This is because the mean obtained in the questionnaire completed by the students who developed their learning with the AR educational technology (4.054) was higher than the mean of the control group (3.457). This difference between the groups is reflected quantitatively with a value of 0.597. However, it is important to emphasize that both groups experienced motivation during the teaching process; the results of their averages are high.
These results reveal differences between the means of the dimensions of the IMMS questionnaire for both groups. The confidence dimension obtained a mean value of 4.014 for the experimental group. This shows that the students agreed with the items that comprised this dimension. For the control group, the mean value of this dimension was 3.593, which means that the students slightly agreed. The difference between the confidence shown by the students who worked on the ComputAR application and that shown by the students who learned with slides was 0.421.
Regarding the dimension of attention, the difference between the means of the experimental and control groups was 0.616. The students who learned through AR indicated that they agreed with the questions raised for this item; the average value was 4.077. The students who learned using slides were above neutral—that is, they neither agreed nor disagreed, but they were closer to agreement, since the mean value corresponded to 3.461.
Finally, the dimensions of satisfaction and relevance showed a mean difference of 0.578 and 0.760, respectively. Regarding satisfaction, the students of the experimental group stated that they agreed with the items of this dimension; the mean value was 4.1405. The students in the control group only slightly agreed (mean value of 3.563). The relevance dimension reflected greater motivational distance between the groups, since the students who worked with AR indicated that they agreed with the questions raised (mean value of 4.008). However, the students in the control group stated that they agreed, albeit very slightly (but also somewhat disagreed), with an average of 3.248.
All of the dimensions of the IMMS questionnaire in the experimental group obtained a mean value above 4, and the satisfaction dimension achieved the highest value (4.1405). Within this group, the dimension that had a lower mean value was relevant. These results show that the students who worked with AR agreed with the issues raised. For the control group, the confidence dimension had the highest mean value (3.593). As in the experimental group, the relevance dimension obtained the lowest mean value for the control group. These data show that the students who learned using slides slightly agreed. Meanwhile, the standard deviation of the different questionnaires and of the dimensions shows a slight variability in the responses of the students in the experimental and control groups.
We conducted the Kolmogorov–Smirnov test to verify the assumption of the normality of the data. It was intended to evaluate the null hypothesis in cases when data come from a normal distribution; otherwise, the alternative hypothesis, which shows that values do not come from a normal distribution, was chosen. Table 6 shows the values obtained from the Kolmogorov–Smirnov test.
The results obtained reflect significance levels that are generally lower than 0.05. Therefore, the alternative hypothesis that the data did not behave under the assumption of normality was chosen. However, the IMMS questionnaire for the control group obtained a significance value of 0.099; therefore, we accepted the null hypothesis; the data from the control group followed a normal distribution. Likewise, the attention dimension for this questionnaire was the only one that obtained a significance value greater than 0.05, specifically 0.200. Therefore, the data of this dimension, corresponding to the IMMS questionnaire of the control group, followed a normal distribution. These considerations are especially important when making the corresponding comparison of hypotheses.
4.1.2. Application of Hypothesis Tests
From this descriptive study, we conducted an analysis of the contrasting hypotheses raised for the IMMS questionnaires in both groups.
As the data did not follow a normal distribution, except in the IMMS questionnaire and in the attention dimension for the control group, we used non-parametric tests. In the case of non-parametric tests, we performed the Mann–Whitney U test, since it involved two independent groups.
Table 7 shows the results obtained by performing this test based on the complete IMMS questionnaire and the dimensions of attention, relevance, confidence, and satisfaction.
The results confirm that there were incredibly significant differences in motivation (specifically in the dimensions of attention, relevance, confidence, and satisfaction) between students who used AR as an educational technology and those who did not, since the significance value was less than 0.05. On the other hand, the value of the effect size establishes that the magnitude of the difference in means between the control and experimental groups is large if greater than 0.5, and this case was 0.6181; therefore, it was high.
For the global IMMS questionnaire and for the attention dimension, the student’s parametric t-test is performed for the equality of means—where the t value, the degree of freedom (df), the p-value (bilateral significance), and the effect size (r) are known—as the data from the control group presented a normal distribution.
Table 8 below shows the data obtained by performing the student’s t-test for the global IMMS questionnaire and for the attention dimension in both groups.
Again, these groups presented a significant difference in the overall IMMS questionnaire and in the attention dimension, since the significance value was less than 0.05—specifically, 0.000. On the other hand, the value of the effect size for IMMS and for the attention dimension establishes that the magnitude of the mean difference between the control and experimental group is high if at 0.5, and this case was at 0.6013 and 0.6469, respectively; therefore, when it exceeded this value, it was high. Therefore, the null hypothesis about the equality of the mean values was rejected, and the alternative hypothesis that shows the inequality of the mean values was accepted. In short, the results confirm the existence of a significant difference in the global IMMS questionnaire and in the attention dimension between the students of the experimental group and those of the control group.
4.2. Analysis of the Variable Gender
This procedure contrasts the differences between the genders of the students based on the motivation shown in the IMMS questionnaire. For these purposes, Table 9 shows the results of the measures of central tendency for the experimental group.
The values of the means and medians in the female students were higher than in the male students, both in the global questionnaire and in the different dimensions (attention, relevance, confidence, and satisfaction), which a priori shows that women presented a higher level of motivation than men. The women experienced greater motivation for the implementation of AR than the men. Nevertheless, the results obtained in the motivation questionnaire for the experimental group showed elevated levels of motivation in both men and women; they said that they agreed with the issues raised; therefore, the work with the ComputAR application was incredibly positive.
On the other hand, thanks to the Kolmogorov–Smirnov test, the assumption of normality was verified. Below, Table 10 shows the values obtained from this test for both men and women.
As a result of the data obtained, it was confirmed that they did not follow a normal distribution except in the attention, satisfaction, and relevance dimensions. The level of significance for women was higher than 0.05; therefore, the data followed a normal distribution.
Finally, Figure 5 shows the differences in the means obtained in the IMMS questionnaire and in the different dimensions according to the gender of the students in the experimental group.
A priori, the results affirm that AR influenced the students who were part of this research, since in all of the cases, they said they agreed with the questions raised.
Given that some data of the attention, satisfaction, and relevance dimensions for women presented a normal distribution, parametric tests were used, specifically the student’s t-test, for independent samples. For the data from the global IMMS questionnaire and from the confidence dimension that did not follow a normal distribution, non-parametric tests were used—in this case, the Mann–Whitney U test—since there were two independent groups (men and women).
Table 11 shows the data obtained by performing this test based on the complete IMMS questionnaire and according to the gender of the students in the experimental group.
As the significance value was greater than 0.05 for both the IMMS questionnaire and the different dimensions, the null hypothesis about the equality of the mean values was accepted. On the other hand, the effect size value established that the motivation shown among male and female students was very small, since all of the values were below 0.1, except the attention dimension. In short, the results confirm that the men and women in the experimental group did not show significant differences in the motivation developed.
Table 12 shows the data obtained by performing the student’s t-test for the attention, relevance, and satisfaction dimensions in the experimental group.
These results confirm that the attention, satisfaction, and relevance dimensions did not present a significant difference according to the gender of the students. This statement enhances the contrast of hypotheses conducted with non-parametric tests for these same dimensions, confirming previous data. On the other hand, the value of the effect size was similar to the result previously obtained, where a low value was presented. In conclusion, the results confirm that there was no significant difference in the dimensions analysed according to the gender of the students in the experimental group.
4.3. Analysis of the Variable Previous ICT Experience
This procedure contrasts the differences registered between the previous ICT experience of the students based on the motivation shown in the IMMS questionnaire. Table 13 shows the results of the measures of central tendency for the experimental group.
The values of the means and medians in the students who did not have previous experience with the use of ICT were higher than those in the students who did, both in the global questionnaire and in the different dimensions. This a priori shows that the students who did not have previous experience with the use of ICT presented a higher level of motivation than those who did. Thus, the students who had not used ICT experienced greater motivation for the implementation of AR than the students who had used ICT. Nevertheless, the results obtained in the motivation questionnaire for the experimental group showed high levels of motivation in all of the students, regardless of whether or not they had previously used ICT; they stated that they agreed with the issues raised; therefore, the work with the ComputAR application was very positive.
The verification of the assumption of data normality was conducted with the Shapiro–Wilk test for the group of students who had previous experience with the use of ICT and the Kolmogorov–Smirnov test for the group of students with no prior experience. This is because the group that had previous experience in ICT comprised only 38 students. These tests allowed us to contrast null hypotheses, where the data came from a normal distribution, and alternative hypotheses, which showed that the values did not come from a normal distribution. Below, Table 14 shows the values obtained from the Shapiro–Wilk and Kolmogorov–Smirnov tests for students who had previous experience in ICT and students who did not.
As a result of the data obtained, it was confirmed that they did not follow a normal distribution; except in the confidence dimension, the level of significance for students who did have previous experience was greater than 0.05; therefore, the null hypothesis was accepted that these data followed a normal distribution.
Finally, Figure 6 shows the differences in the means obtained in the IMMS questionnaire and in the different dimensions according to the previous ICT experience of the students in the experimental group.
A priori, the results affirm that AR influenced the students who were part of this research; in all of the cases, they said that they agreed with the questions raised. The lowest cases were for the confidence and relevance dimensions, where the students who had previous experience using ICT stated that they slightly agreed.
Since the data of the students who had previous experience using ICT for the confidence dimension presented a normal distribution, the parametric test was used—specifically, the student’s t-test. Since the rest of the data from the overall IMMS questionnaire and from the different dimensions did not follow a normal distribution, non-parametric tests were used—in this case, the Mann–Whitney U test—since there were two independent groups.
Table 15 shows the data obtained by performing this test based on the complete IMMS questionnaire and the dimensions of confidence, attention, satisfaction, and relevance according to the students in the experimental group, regarding previous experience with the use of ICT.
The analysis of the data referring to the motivation presented by the students in the experimental group who had previously used ICT and those who had not indicates that, once AR had been applied as a learning tool, they presented significant differences according to previous experience with the use of ICT both in the global IMMS questionnaire and in the confidence dimension. Therefore, the null hypothesis was rejected, showing that there was no equality in the values of the means. In this sense, the value of the effect size between these groups of students was moderate both in the IMMS questionnaire and in the confidence dimension, since their values were between 0.1 and 0.3.
Meanwhile, the data analysed for the attention, satisfaction, and relevance dimensions did not present significant differences depending on the students who had previously experimented with ICT and those who had not, since the significance value was greater than 0.05. Therefore, the null hypothesis about the equality of the mean values was accepted.
In conclusion, the results confirm that both the global IMMS questionnaire and the confidence dimension demonstrated relatively high and significant differences between students who had previous experience with the use of ICT and those who did not. However, for the attention, satisfaction, and relevance dimensions, these differences were not significant between these groups, as has been verified.
Table 16 shows the data obtained by performing the student’s t-test for the confidence dimension according to the students in the experimental group, regarding previous experience in ICT.
These results confirm that the confidence dimension presented a significant difference according to students’ previous experience with the use of ICT. This statement enhances the contrast of hypotheses conducted with non-parametric tests for the confidence dimension, since they confirmed previous data. The null hypothesis was rejected by obtaining significance values lower than 0.05. In this sense, the effect size value had a value close to 0.5, which is considered high. In short, the results confirm the existence of a significant difference in the confidence dimension according to the students of the experimental group, regarding previous experience with the use of ICT.
5. Discussion
This section discusses the analysed results with the purpose of evaluating and verifying the hypotheses proposed as well as the objectives set in the investigation.
5.1. Student Motivation Is Influenced Using AR Learning Objects (H1)
Regarding the descriptive results of the different items of the IMMS questionnaires for both groups, they were demonstrated to have a positive trend according to the evaluations, which indicates that the two experiences that were implemented turned out to be positive.
Secondary education students who took part in the experimental group and who used the ComputAR application based on AR learning objects demonstrated a higher level of motivation than the students in the control group who worked in a slide-based environment. This indicates that AR technology creates greater motivation in students, confirming the results of other research that goes along this line [67].
In general, the scores obtained for the complete IMMS questionnaire reflect that the experimental group agreed with the different items raised; however, the control group was closer to the neutral position, neither agreeing nor disagreeing. This is because the mean obtained in the questionnaire completed by the students who developed their learning with AR educational technology was higher than the mean of the control group. However, it is important to emphasize that both groups experienced motivation during the teaching process, since the results of their averages are high, coinciding with other studies where the control and experimental groups were analysed [25,70]. Therefore, these results verify the first hypothesis proposed in this research.
The students who used AR as a teaching tool demonstrated a high degree of motivation, both globally and in each of the dimensions that comprised the IMMS questionnaire. This instrument for collecting information made it possible to gauge the impact of this educational technology on the attention, relevance, confidence, and satisfaction manifested by the students. These results are in line with findings in other studies and confirm that AR is an especially useful tool for the teaching and learning process [25,50,68,72].
Lastly, the students who worked on AR emphasized that they agreed with the issues raised. On the contrary, the data from the control group demonstrated that the students who based their learning on slides slightly agreed. Nonetheless, the standard deviation of the differently completed questionnaires, as well as their respective dimensions, showed slight variability in the responses of the students in the respective experimental and control groups. In this way, there was a significant difference in motivation—more specifically in the dimensions of attention, relevance, confidence, and satisfaction—shown by the students who used this educational technology and those who based their learning on slides. Verification by contrasting the hypotheses of the mean differences obtained for overall motivation and for the different dimensions between both groups shows high significance caused by the use of AR. These results are in line with those of other studies where the use of AR improved student motivation [8,36,69]. The first proposed objective was thus met, since, with this study, it was possible to analyse whether the degree of attention, relevance, confidence, and satisfaction were influenced using AR.
One implication of this study is that students in the secondary education stage should work with educational technologies, such as AR, that promote interaction, dynamism, innovation, and interest. Combined with active methodologies, these technologies produce a multiplying effect on the motivation experienced by students in the teaching process.
5.2. Gender Does Not Present a Significant Difference in Motivation Based on the Use of AR (H2)
This investigation examined the influence of AR on the motivation of secondary school students. It also intended to analyse whether these factors showed significant differences based on the gender of the students. For this, it was necessary to include the variable in the questionnaires; the experimental group comprised 66.67% men and 33.33% women.
The results for the students in the experimental group, once AR was used in the classroom with reference to the IMMS questionnaire, showed that men and women did not present significant differences according to gender in any of the dimensions of attention, relevance, confidence, and satisfaction. Therefore, gender does not present a significant difference in motivation when AR is used. These results align with those obtained in other studies [37,38] and therefore verify the second hypothesis.
In conclusion, the second proposed objective was met; the results reveal that gender does not present a significant difference in the motivation of students when using AR in the teaching process.
Despite this, the mean values in the female students were higher than in the male students, both in the global questionnaire and in the different dimensions (attention, relevance, confidence, and satisfaction). In this way, women experienced greater motivation for the implementation of AR than men.
The second implication involves the teachers who teach classes in the secondary education stage. In theory, education professionals should not consider the gender of students when implementing AR in the classroom. However, the students should always be analysed, since on certain occasions, there may be differences in the cognitive process between male and female students.
5.3. The Student’s Previous ICT Experience Presents a Significant Difference in Their Motivation before the Use of AR (H3)
It is reasonable to assume that, with the number of technological devices that students use in their daily lives, they have used ICT in their educational experiences. However, this statement is called into question, given the exceptionally low levels of use of these technologies in the classroom, where only 24% of students incorporate their use. Even so, it is relevant to know what impact this variable has on the motivation of the students.
The data referring to the motivation presented by the students in the experimental group who have previously used ICT and in those who have not showed a significant difference, both in the IMMS questionnaire and in the confidence dimension. Meanwhile, these differences are not significant between these groups for the attention, satisfaction, and relevance dimensions. Therefore, these results partially verify the third hypothesis of this investigation if the dimensions of the IMMS questionnaire are considered. However, in a generic way, motivation does present a significant difference with respect to previous experience with the use of AR, which verifies the third hypothesis.
The students who had not used ICT experienced greater motivation for the implementation of AR than the students who had used ICT. Nevertheless, the results obtained in the motivation questionnaire for the experimental group show high levels of motivation in all of the students, regardless of whether or not they had previously used ICT, since they stated that they agreed with the issues raised. Therefore, the work with the ComputAR mobile application was very positive.
Regarding this point, students who had previous experience with the use of ICT and those who did not showed various levels of motivation, especially in the confidence that the use of AR produced in them. However, the attention, satisfaction, and relevance shown by the students were not altered by previous experience. These data align with the findings from other investigations [39,40,42]. In short, the third objective—to know whether the student’s previous experience with the use of ICT has an impact on their motivation when using AR—was met.
The third implication highlights the concept of the digital native—that is, current students who have used technological devices from an early age; however, this has not been integrated into the teaching and learning process. This fact affects the motivation and interest shown by students in the classroom; therefore, it is necessary that such technologies be introduced correctly and efficiently.
In short, AR is an innovative and fun tool, ideal for the teaching and learning process, since it makes it easier for them to undertake class activities. Additionally, the ComputAR application has been positively valued for its ease of use and its simple and attractive design.
6. Conclusions
Regarding the degree of attention, relevance, confidence, and satisfaction shown by students based on the use of AR, this research shows that this educational technology has a great influence on the dimensions mentioned, producing a high degree of motivation among students. Other studies where AR has been used in the classroom with students of the same age group have obtained similar conclusions [66,67,68,71,72].
Likewise, this study demonstrates the non-existence of significant differences in motivation and in the different dimensions of confidence, attention, relevance, and satisfaction between the students of the experimental group, who experienced using the ComputAR application and graphic markers, and the students from the control group, who worked in a slide-based learning environment. Other authors have advanced this finding in their studies with AR [25,65,69,70].
Therefore, AR is a highly recommended tool for the teaching and learning process, since it is an innovative technology that can help students understand abstract concepts in a more dynamic and fun way. In addition, augmented reality is ideal for working on subjects such as physics, biology, history, and technical drawing, since it provides a spatial vision of objects that facilitates visualization. Finally, this technology provides students with the possibility of carrying out activities and tasks in an attractive and intuitive way [40,68,71].
Regarding the predictor variables used in this research—gender and previous experience with the use of ICT—the results obtained regarding the motivation of students who used AR in their educational experience demonstrate the following conclusions:
- There are no significant differences in the motivation of the students in the experimental group according to gender—neither in general nor in each of the dimensions of confidence, attention, satisfaction, and relevance.
- There are significant differences in motivation, particularly in the confidence dimension, for the students of the experimental group according to their previous experience with the use of ICT.
- There are no significant differences in the attention, satisfaction, and relevance dimensions shown by the students of the experimental group according to their previous experience with the use of ICT.
When addressing this research, a series of limitations have been found that have made it difficult to achieve the different objectives set. These limitations are set out below:
- The variety of mobile devices (smartphones and tablets) presented by the students who have been part of the research made verification and version control of the ComputAR augmented reality application an arduous and tedious task.
- The lack of free, quality 3D objects limited their inclusion in the ComputAR mobile application.
- The impossibility of introducing audiovisual content into the ComputAR application occurred because in-person training was followed.
- The little-to-no training of teachers regarding this educational technology led to a complex internal training process.
- There was notable difficulty in carrying out interviews with minor students; consequently, taping recordings and carrying out one-on-one interviews was an impediment.
Future studies might make use of 3D identification screens for AR. Students’ learning motivation can be increased by introducing different sensory experiences to boost focus in the classroom. Future research should incorporate AR into other kinds of board games in order to maximize these impacts on knowledge acquisition. Finally, we advise future studies to include learner interviews to gain a deeper knowledge of how AR integration in health education board games affects learning outcomes and learning emotions. Qualitative data would further illustrate detailed improvements in students’ understanding of health education and in the emotions of learning. It would also help disclose the precise feelings students have when participating in AR-based health education.
Supplementary Materials
The following supporting information can be downloaded at https://bit.ly/3Z7FIqU (accessed on 9 September 2023).
Author Contributions
Conceptualization, A.A.-V., D.B. and J.W.B.-B.; methodology, A.A.-V., D.B. and J.W.B.-B.; software, A.A.-V.; validation, A.A.-V., D.B. and J.W.B.-B.; formal analysis, A.A.-V.; investigation, A.A.-V.; resources, A.A.-V.; data curation, A.A.-V.; writing—original draft preparation, A.A.-V.; writing—review and editing, A.A.-V., D.B. and J.W.B.-B.; visualization, A.A.-V., D.B. and J.W.B.-B.; supervision, A.A.-V., D.B. and J.W.B.-B. All authors have read and agreed to the published version of the manuscript.
Funding
This research has been partially funded by the Research Institute for Innovation and Technology in Education (UNIR iTED), at Universidad Internacional de La Rioja (UNIR).
Data Availability Statement
The datasets generated for this study can be found in the manuscript and Supplementary Material and are free to use.
Acknowledgments
The authors would like to thank the Facultad de Minas at the Universidad Nacional de Colombia (UNAL), Medellín, Colombia.
Conflicts of Interest
The authors declare no conflict of interest.
References
- Amores-Valencia, A.; De-Casas-Moreno, P. El uso de las TIC como herramienta de motivación para alumnos de enseñanza secundaria obligatoria. Estudio de caso Español. Hamut’ay 2019, 6, 37–49. [Google Scholar] [CrossRef]
- Cuéllar-Álvarez, J.; García-Martínez, M. Caracterización del estilo comunicativo pedagógico para la motivación estudiantil en adolescentes: Characterization of the pedagogic talkative style for the student motivation in adolescents. Rev. Maest. Soc. 2023, 20, 108–112. Available online: https://bit.ly/3KuHQE7 (accessed on 9 May 2023).
- Berrío-Quispe, M.L.; Chávez-Bellido, D.E.; Gutiérrez-Avellaneda, M.M.; Gonzales-Sánchez, A.C. Práctica pedagógica afectiva en el proceso de aprendizaje de estudiantes universitarios. Encuentros 2023, 17, 217–227. [Google Scholar] [CrossRef]
- Area-Moreira, M.; Cepeda-Romero, O.; Feliciano-García, L. Perspectivas de los alumnos de Educación Primaria y Secundaria sobre el uso escolar de las TIC. Rev. Educ. Siglo XXI 2018, 36, 229–253. [Google Scholar] [CrossRef]
- León-Alvarado, M.E.; Alcivar-Gallegos, E. Efectos de la aplicación de proyectos de objetos virtuales de aprendizaje (ovas) en la motivación y el rendimiento académico de los estudiantes. Rev. Cient. Multidiscip. 2023, 7, 5954–5971. [Google Scholar] [CrossRef]
- Colás-Bravo, M.P.; De-Pablos-Pons, J.; Ballesta-Pagán, J. Incidencia de las TIC en la enseñanza en el sistema educativo español: Una revisión de la investigación. Rev. Educ. Distancia 2018, 56, 1–23. [Google Scholar] [CrossRef]
- Amores-Valencia, A.; Burgos, D.; Branch-Bedoya, J.W. Influence of motivation and academic performance in the use of augmented reality in education. A systematic review. Front. Psychol. 2022, 13, 1011409. [Google Scholar] [CrossRef]
- Kirikkaya, E.B.; Başgül, M.S. The effect of the use of augmented reality applications on the academic success and motivation of 7th grade students. J. Balt. Sci. Educ. 2019, 18, 362–378. [Google Scholar] [CrossRef]
- Cabero-Almenara, J.; Barroso-Osuna, J. The educational possibilities of augmented reality. J. New Approaches Educ. Res. 2016, 5, 44–50. [Google Scholar] [CrossRef]
- Macías-González, L.; Manresa-Yee, C. Mayores y nuevas tecnologías: Motivaciones y dificultades. Ariadna 2013, 1, 6–11. [Google Scholar] [CrossRef]
- Cabero-Almenara, J. Reflexiones educativas sobre las tecnologías de la información y la comunicación (TIC). Rev. Tecnol. Cienc. Educ. 2015, 1, 19–27. [Google Scholar] [CrossRef]
- Prieto-Andreu, J.M. Metaanálisis sobre experiencias didácticas gamificadas en Educación Física. Rev. Complut. Educ. 2022, 34, 179–190. Available online: https://bit.ly/432NHb7 (accessed on 10 May 2023). [CrossRef]
- Moronta, I.; Santana, M.Y.; Montes-De-Oca, G. Variables psicológicas de autoconcepto académico y la motivación escolar en universitarios de País Vasco y República Dominicana: Un estudio correlacional. Cuad. Pedag. Univ. 2023, 20, 111–120. [Google Scholar] [CrossRef]
- Arcia-Fuentes, P.A.; Falconett-Díaz, V.V. Factores asociados: Motivación, hábitos y técnicas de estudio en estudiantes de primer ingreso en tres licenciaturas de la UDELAS. Redes 2023, 15, 8–21. Available online: https://bit.ly/3Kbh8io (accessed on 7 May 2023).
- Muñoz-Jiménez, A.P.; González-Moreno, P.A. Motivación y formación continua de docentes de artes en educación básica en el estado de Chihuahua, México. ArtsEduca 2022, 34, 9–22. [Google Scholar] [CrossRef]
- Medina-Gorozabel, G.; Giler-Medina, P. Estrategias de motivación de logros y aprendizaje de Matemática en estudiantes de Educación Media. Prometeo 2023, 3, 17–27. [Google Scholar] [CrossRef]
- Espinoza-Catalán, A.M.; Albornoz, N. Sexismo en Educación Superior: ¿Cómo se Reproduce la Inequidad de Género en el contexto Universitario? Psykhe 2023, 32, 1–37. [Google Scholar] [CrossRef]
- Fernández-Paredes, L. Las tres dimensiones de la Motivación: Valor, afectividad y expectativa. Rev. Camp. Educ. 2020, 17, 9–12. Available online: https://www.campuseducacion.com/revista-digitaldocente/numeros/17/ (accessed on 9 May 2023).
- Lee, Y.; Lee, J.; Hwang, Y. Relating motivation to information and communication technology acceptance: Elf-determination theory perspective. Comput. Hum. Behav. 2015, 51, 418–428. [Google Scholar] [CrossRef]
- Park, N.; Kim, Y.C.; Shon, H.; Shim, H. Factors influencing smartphone use and dependency in South Korea. Comput. Hum. Behav. 2013, 29, 1763–1770. [Google Scholar] [CrossRef]
- Keller, J.M. Motivational Design for Learning and Performance: The ARCS Model Approach; Springer: New York, NY, USA, 2010. [Google Scholar]
- Galicia-Alarcón, L.; Balderrama-Trápaga, J.; Edel-Navarro, R. Revisión del modelo atención, relevancia, confianza y satisfacción (ARCS). Model. Tecnol. Educ. 2014, 47, 41–54. Available online: https://acortar.link/GeAuTU (accessed on 8 May 2023).
- Vázquez-Gama, M.E. Propuesta de Intervención Con el Modelo Motivacional ARCS de John Keller al Ambiente Virtual de Aprendizaje Moodle. Ph.D. Thesis, Universidad de Guadalajara, Guadalajara, Jalisco, México, 2021. Available online: https://bit.ly/3BJRbEc (accessed on 11 May 2023).
- Cabero-Almenara, J.; García-Jiménez, F. Realidad Aumentada. Tecnología Para la Formación, 1st ed.; Síntesis: Madrid, Spain, 2015. [Google Scholar]
- Di-Serio, A.; Ibáñez, M.B.; Delgado-Kloos, C. Impact of an augmented reality system on students’ motivation for a visual art course. Comput. Educ. 2013, 68, 586–596. [Google Scholar] [CrossRef]
- Cuendet, S.; Bonnard, Q.; Do-Lenh, S.; Dillenbourg, P. Designing augmented reality for the classroom. Comput. Educ. 2013, 68, 557–569. [Google Scholar] [CrossRef]
- García-González, I.; Peña-López, I.; Johnson, L.; Smith, R.; Levine, A.; Haywood, K. Informe Horizon: Edición Iberoamericana; New Media Consortium: Austin, TX, USA, 2010; Available online: https://acortar.link/mRRZ8o (accessed on 9 May 2023).
- Carrión-Vaca, G.E. Comparativa de Tres Herramientas de Realidad Aumentada Utilizando una Metodología de Medición de Software ISO. Ph.D. Thesis, Universidad Técnica del Norte, Imbabura, Ecuador, 2018. Available online: https://bit.ly/3G2Vt8R (accessed on 11 May 2023).
- Fonseca-Escudero, D.; Redondo-Domínguez, E.; Valls, F. Motivación y mejora académica utilizando realidad aumentada para el estudio de modelos tridimensionales arquitectónicos. Educ. Knowl. Soc. 2016, 17, 45–64. [Google Scholar] [CrossRef]
- Seifert, T.; Hervás-Gómez, C.; Toledo-Morales, P. Diseño y validación del cuestionario sobre percepciones y actitudes hacia el aprendizaje por dispositivos móviles. Pixel-Bit 2019, 54, 45–64. [Google Scholar] [CrossRef]
- Buchner, J.; Buntins, K.; Kerres, M. The impact of augmented reality on cognitive load and performance: A systematic review. J. Comput. Assist. Learn. 2022, 38, 285–303. [Google Scholar] [CrossRef]
- Lagunes-Domínguez, A.; Torres-Gastelú, C.; Angulo-Armenta, J.; Martínez-Olea, M. Prospectiva hacia el Aprendizaje Móvil en Estudiantes Universitarios. Form. Univ. 2017, 10, 101–108. [Google Scholar] [CrossRef]
- Gómez-García, G.; Rodríguez-Jiménez, C.; Marín-Marín, J.A. La trascendencia de la Realidad Aumentada en la motivación estudiantil. Una revisión sistemática y meta-análisis. Alteridad 2020, 15, 36–46. [Google Scholar] [CrossRef]
- Martínez, A.B. Espacios desiertos y nueva temporalidad. La educación superior virtual en tiempos del COVID-19. Acción Reflex. Educ. 2022, 47, 129–146. Available online: https://bit.ly/3Mk5iVI (accessed on 11 May 2023).
- Buchner, J. Generative learning strategies do not diminish primary students’ attitudes towards augmented reality. Educ. Inf. Technol. 2021, 26, 701–717. [Google Scholar] [CrossRef]
- Hanafi, H.F.; Said, C.S.; Wahab, M.H.; Samsuddin, K. Improving students’ motivation in learning ICT course with the use of a mobile augmented reality learning environment. IOP Conf. Ser. Mater. Sci. Eng. 2017, 226, 012114. [Google Scholar] [CrossRef]
- Bursztyn, N.; Walker, A.; Shelton, B.; Pederson, J. Assessment of student learning using augmented reality Grand Canyon field trips for mobile smart devices. Geosphere 2017, 13, 260–268. [Google Scholar] [CrossRef]
- López-Belmonte, J.; Pozo-Sánchez, S.; López-Belmonte, G. The effectiveness of augmented reality in infant education: A BLS and CPR learning study in 5-year-old students. Pixel-Bit 2019, 55, 157–178. [Google Scholar] [CrossRef]
- Bressler, D.M.; Bodzin, A.M. A mixed methods assessment of students’ flow experiences during a mobile augmented reality science game. J. Comput. Assist. Learn. 2013, 29, 505–517. [Google Scholar] [CrossRef]
- Ibáñez, M.B.; Di-Serio, Á.; Villarán, D.; Kloos, C.D. Experimenting with electromagnetism using augmented reality: Impact on flow student experience and educational effectiveness. Comput. Educ. 2014, 71, 1–13. [Google Scholar] [CrossRef]
- Elfeky, A.I.M.; Elbyaly, M.Y.H. The effectiveness of virtual classrooms in developing academic motivation across gender groups. Ann. For. Res. 2023, 66, 2005–2020. Available online: https://www.e-afr.org/article/view-2023/pdf/2021.pdf (accessed on 11 May 2023).
- Gallego-Pérez, O.M. Estudio y Análisis Sobre Las Posibilidades Educativas de la Realidad Aumentada Como Herramienta de Producción de Experiencias Formativas Por Parte del Alumnado Universitario. Ph.D. Thesis, Universidad de Córdoba, Córdoba, Spain, 2018. Available online: https://bit.ly/3Iwiguz (accessed on 11 May 2023).
- Amores-Valencia, A.J.; Burgos, D.; Branch, J.W. The influence of gender in the use of augmented reality in education: A systematic literature review. In Proceedings of the 2021 XI International Conference on Virtual Campus (JICV), Salamanca, Spain, 30 September–1 October 2021; pp. 83–87. [Google Scholar] [CrossRef]
- Dirin, A.; Alamäki, A.; Suomala, J. Gender differences in perceptions of conventional video, virtual reality and augmented reality. Int. J. Interact. Mob. Technol. 2019, 13, 93–103. [Google Scholar] [CrossRef]
- Park, C.; Kim, D.G.; Cho, S.; Han, H.J. Adoption of multimedia technology for learning and gender difference. Comput. Hum. Behav. 2019, 92, 288–296. [Google Scholar] [CrossRef]
- Lorenzo-Lledó, G.; Lorenzo-Lledó, A.; Lledó-Carreres, A. Tendencias globales en el uso de la realidad aumentada en la educación: Estructura intelectual, social y conceptual. Rev. Investig. Educ. 2022, 40, 475–493. [Google Scholar] [CrossRef]
- González-Segredo, L.; Hernández-Cabrera, J. La Realidad Aumentada en Las Aulas de Educación Infantil. Master’s Thesis, Universidad de La Laguna, San Cristóbal de La Laguna, Tenerife, Spain, 2022. Available online: https://bit.ly/3bW1pXu (accessed on 12 May 2023).
- Castro-Marcos, O. Minecraft Educativo: Una Propuesta de Gamificación en Educación Primaria a Través de Videojuegos y Realidad Aumentada. Master’s Thesis, Universidad de Oviedo, Oviedo, Spain, 2022. Available online: https://bit.ly/3QFe7sg (accessed on 12 May 2023).
- Aguilar-Acevedo, F.; Flores-Cruz, J.A.; Hernández-Aguilar, C.A.; Pacheco-Bautista, D. Diseño e implementación de un simulador basado en realidad aumentada móvil para la enseñanza de la física en la educación superior. Rev. Elec. Tecnol. Educ. 2022, 80, 66–83. [Google Scholar] [CrossRef]
- Cabero-Almenara, J.; Barroso-Osuna, J.; Llorente-Cejudo, C.; Fernández-Martínez, M. Educational uses of augmented reality (AR): Experiences in educational science. Sustainability 2019, 11, 4990. [Google Scholar] [CrossRef]
- Fernández-Robles, B.; Martínez-Pérez, S. Experiencia formativa sobre el uso de realidad aumentada con estudiantes del grado de Pedagogía. Rev. Tecnol. Cienc. Educ. 2023, 24, 119–140. [Google Scholar] [CrossRef]
- Chang, N.C.; Chen, H.H. A motivational analysis of the ARCS model for information literacy courses in a blended learning environment. Libri 2015, 65, 129–142. [Google Scholar] [CrossRef]
- Laurens-Arredondo, L. Mobile augmented reality adapted to the ARCS model of motivation: A case study during the COVID-19 pandemic. Educ. Inf. Technol. 2022, 27, 7927–7946. [Google Scholar] [CrossRef] [PubMed]
- Zang, W. Design a civil engineering micro-lecture platform based on the ARCS model perspective. Int. J. Emerg. Technol. Learn. 2017, 12, 107–118. [Google Scholar] [CrossRef]
- Wang, S.; Christensen, C.; Xu, Y.; Cui, W.; Tong, R.; Shear, L. Measuring Chinese middle school students’ motivation using the Reduced Instructional Materials Motivation Survey (RIMMS): A validation study in the adaptive learning setting. Front. Psychol. 2020, 11, 1803–1813. [Google Scholar] [CrossRef]
- Lee, L.; Hao, K. Designing and evaluating digital game-based learning with the ARCS motivation model, humor, and animation. Int. J. Technol. Hum. Interact. 2015, 11, 80–95. [Google Scholar] [CrossRef]
- Loorbach, N.; Peters, O.; Karreman, J.; Steehouder, M. Validation of the Instructional Materials Motivation Survey (IMMS) in a self-directed instructional setting aimed at working with technology. J. Educ. Technol. 2015, 46, 204–218. [Google Scholar] [CrossRef]
- Li, K.; Keller, J.M. Use of the ARCS model in education: A literature review. Comput. Educ. 2018, 122, 54–62. [Google Scholar] [CrossRef]
- Nieto-Martín, S. Principios, Métodos y Técnicas Esenciales Para la Investigación Educativa, 1st ed.; Dykinson: Madrid, Spain, 2010. [Google Scholar]
- Cardoso-Júnior, A.; Delbone-de-Faria, R.M. Psychometric assessment of the Instructional Materials Motivation Survey (IMMS) instrument in a remote learning environment. Rev. Bras. Educ. Méd. 2021, 45, 197–211. [Google Scholar] [CrossRef]
- Hauze, S.W.; Marshall, J.M. Validation of the Instructional Materials Motivation Survey: Measuring student motivation to learn via mixed reality nursing education simulation. Int. J. E-Learn. 2020, 19, 49–64. Available online: https://acortar.link/KrnXj8 (accessed on 12 May 2023).
- Proske, A.; Roscoe, R.; McNamara, D. Game-based practice versus traditional practice in computer-based writing strategy training: Effects on motivation and achievement. Educ. Technol. Res. Devel. 2014, 62, 481–505. [Google Scholar] [CrossRef]
- Che, Y. A study of learning effects on e-learning with interactive thematic video. J. Educ. Comp. Res. 2012, 47, 279–292. [Google Scholar] [CrossRef]
- Castaño-Garrido, C.; Maiz-Olazabalaga, I.; Garay-Ruiz, U. Percepción de los participantes sobre el aprendizaje en un MOOC. RIED 2015, 18, 197–221. Available online: https://bit.ly/3vUoY9B (accessed on 9 May 2023). [CrossRef]
- Baabdullah, A.M.; Alsulaimani, A.A.; Allamnakhrah, A.; Alalwan, A.A.; Dwivedi, Y.K.; Rana, N.P. Usage of augmented reality (AR) and development of e-learning outcomes: An empirical evaluation of students’ e-learning experience. Comput. Educ. 2022, 177, 43–63. [Google Scholar] [CrossRef]
- Ventoulis, E.; Xinogalos, S. “AR The Gods of Olympus”: Design and pilot evaluation of an augmented reality educational game for Greek mythology. Multimodal Technol. Interact. 2023, 7, 2. [Google Scholar] [CrossRef]
- Hsieh, M.C.; Chen, S.H. Intelligence augmented reality tutoring system for mathematics teaching and learning. J. Internet Technol. 2019, 20, 1673–1681. [Google Scholar]
- Marín-Díaz, V.; Cabero-Almenara, J.; Gallego-Pérez, O.M. Motivación y realidad aumentada: Alumnos como consumidores y productores de objetos de aprendizaje. Aula Abierta 2018, 47, 337. [Google Scholar] [CrossRef]
- Lin, H.C.K.; Lin, Y.H.; Wang, T.H.; Su, L.K.; Huang, Y.M. Effects of incorporating augmented reality into a board game for high school students’ learning motivation and acceptance in health education. Sustainability 2021, 13, 3333. [Google Scholar] [CrossRef]
- Wei, X.; Weng, D.; Liu, Y.; Wang, Y. Teaching based on augmented reality for a technical creative design course. Comput. Educ. 2015, 81, 221–234. [Google Scholar] [CrossRef]
- Moreno-Guerrero, A.J.; Alonso-García, S.; Navas-Parejo, M.R.; Campos-Soto, M.N.; Gómez-García, G. Augmented reality as a resource for improving learning in the physical education classroom. Int. J. Environ. Res. Public Health 2020, 17, 3637. [Google Scholar] [CrossRef] [PubMed]
- Tarng, W.; Lin, Y.J.; Ou, K.L. A virtual experiment for learning the principle of Daniell cell based on augmented reality. Appl. Sci. 2021, 11, 762. [Google Scholar] [CrossRef]
- Góngora-Parra, Y.; Martínez-Leyet, O.L. Del diseño instruccional al diseño de aprendizaje con aplicación de las tecnologías. Teoría de la Educación. Educ. Cult. Soc. Inform. 2012, 13, 342–360. Available online: https://acortar.link/iso3YT (accessed on 12 May 2023).
- Kitchenham, B.; Charters, S. Guidelines for Performing Systematic Literature Reviews in Software Engineering; EBSE Technical Report; Keele University: Keele, UK, 2007; Volume 1, pp. 1–57. Available online: https://acortar.link/HtayDM (accessed on 12 May 2023).
Figure 1.
Investigation phases.

Figure 2.
Graphic marker.

Figure 3.
Computer section screen (ComputAR).

Figure 4.
Atari 800 computer (ComputAR).

Figure 5.
Mean differences in motivation according to gender.

Figure 6.
Mean differences in motivation according to previous ICT experience (experimental group).


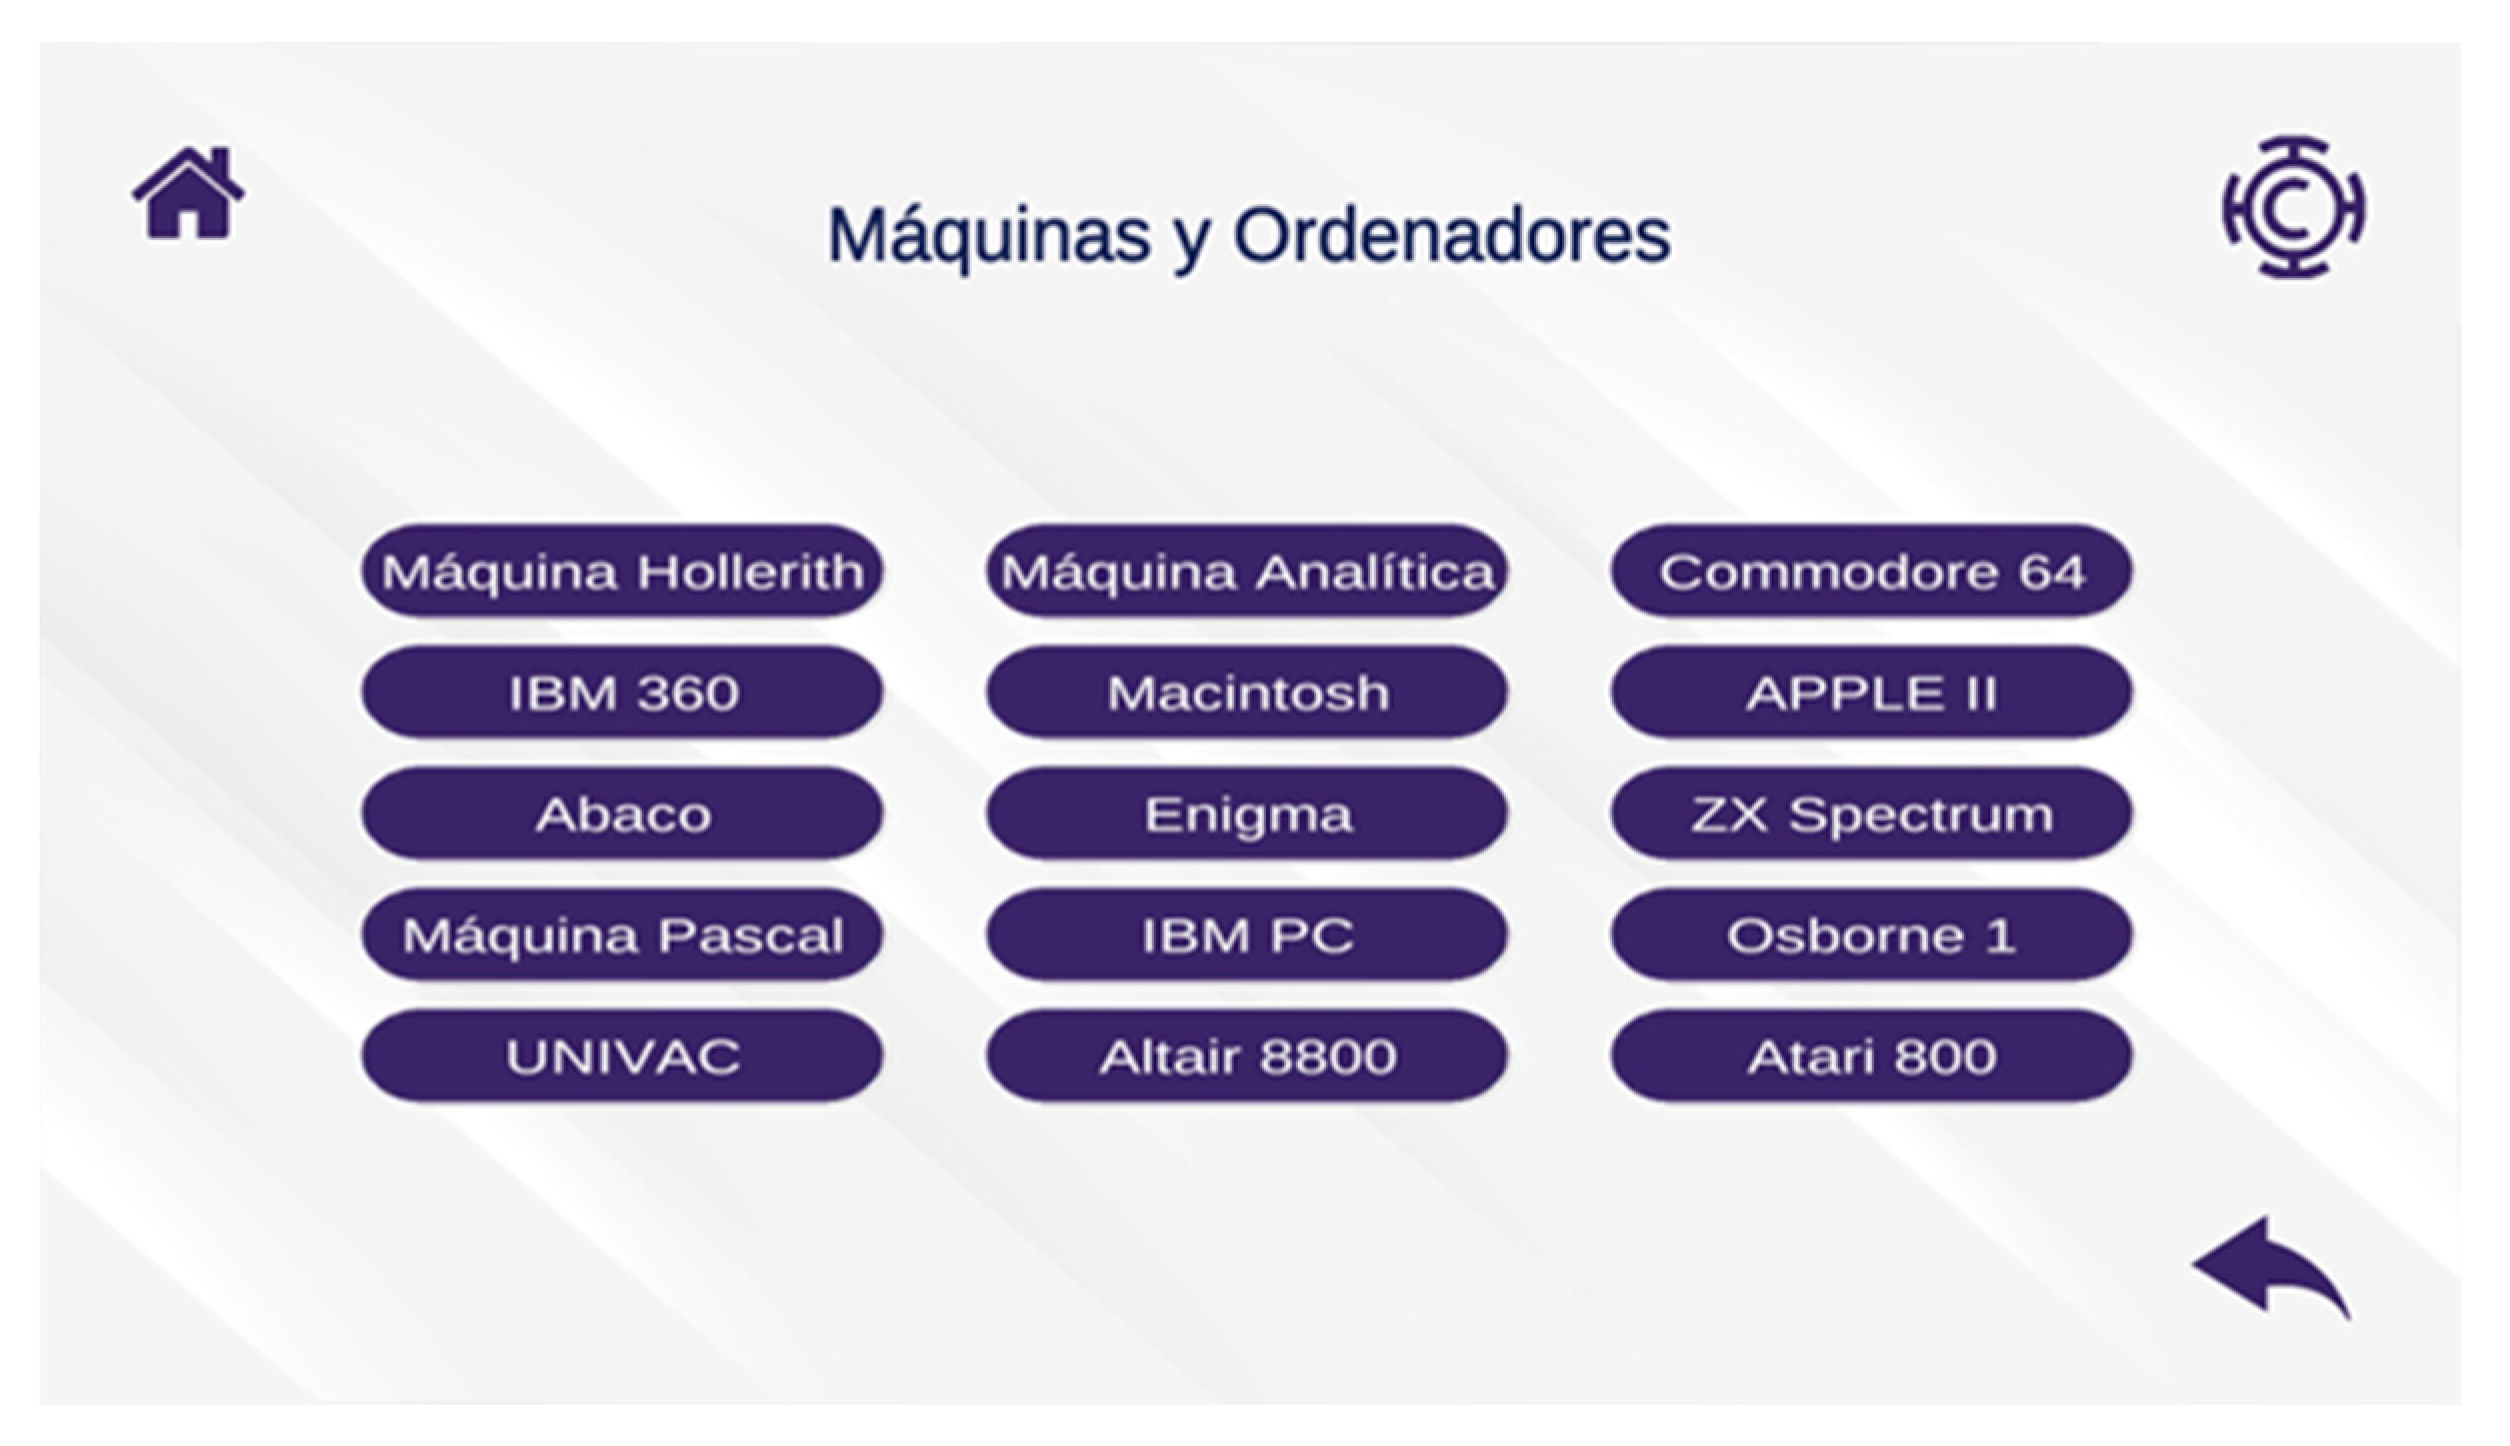
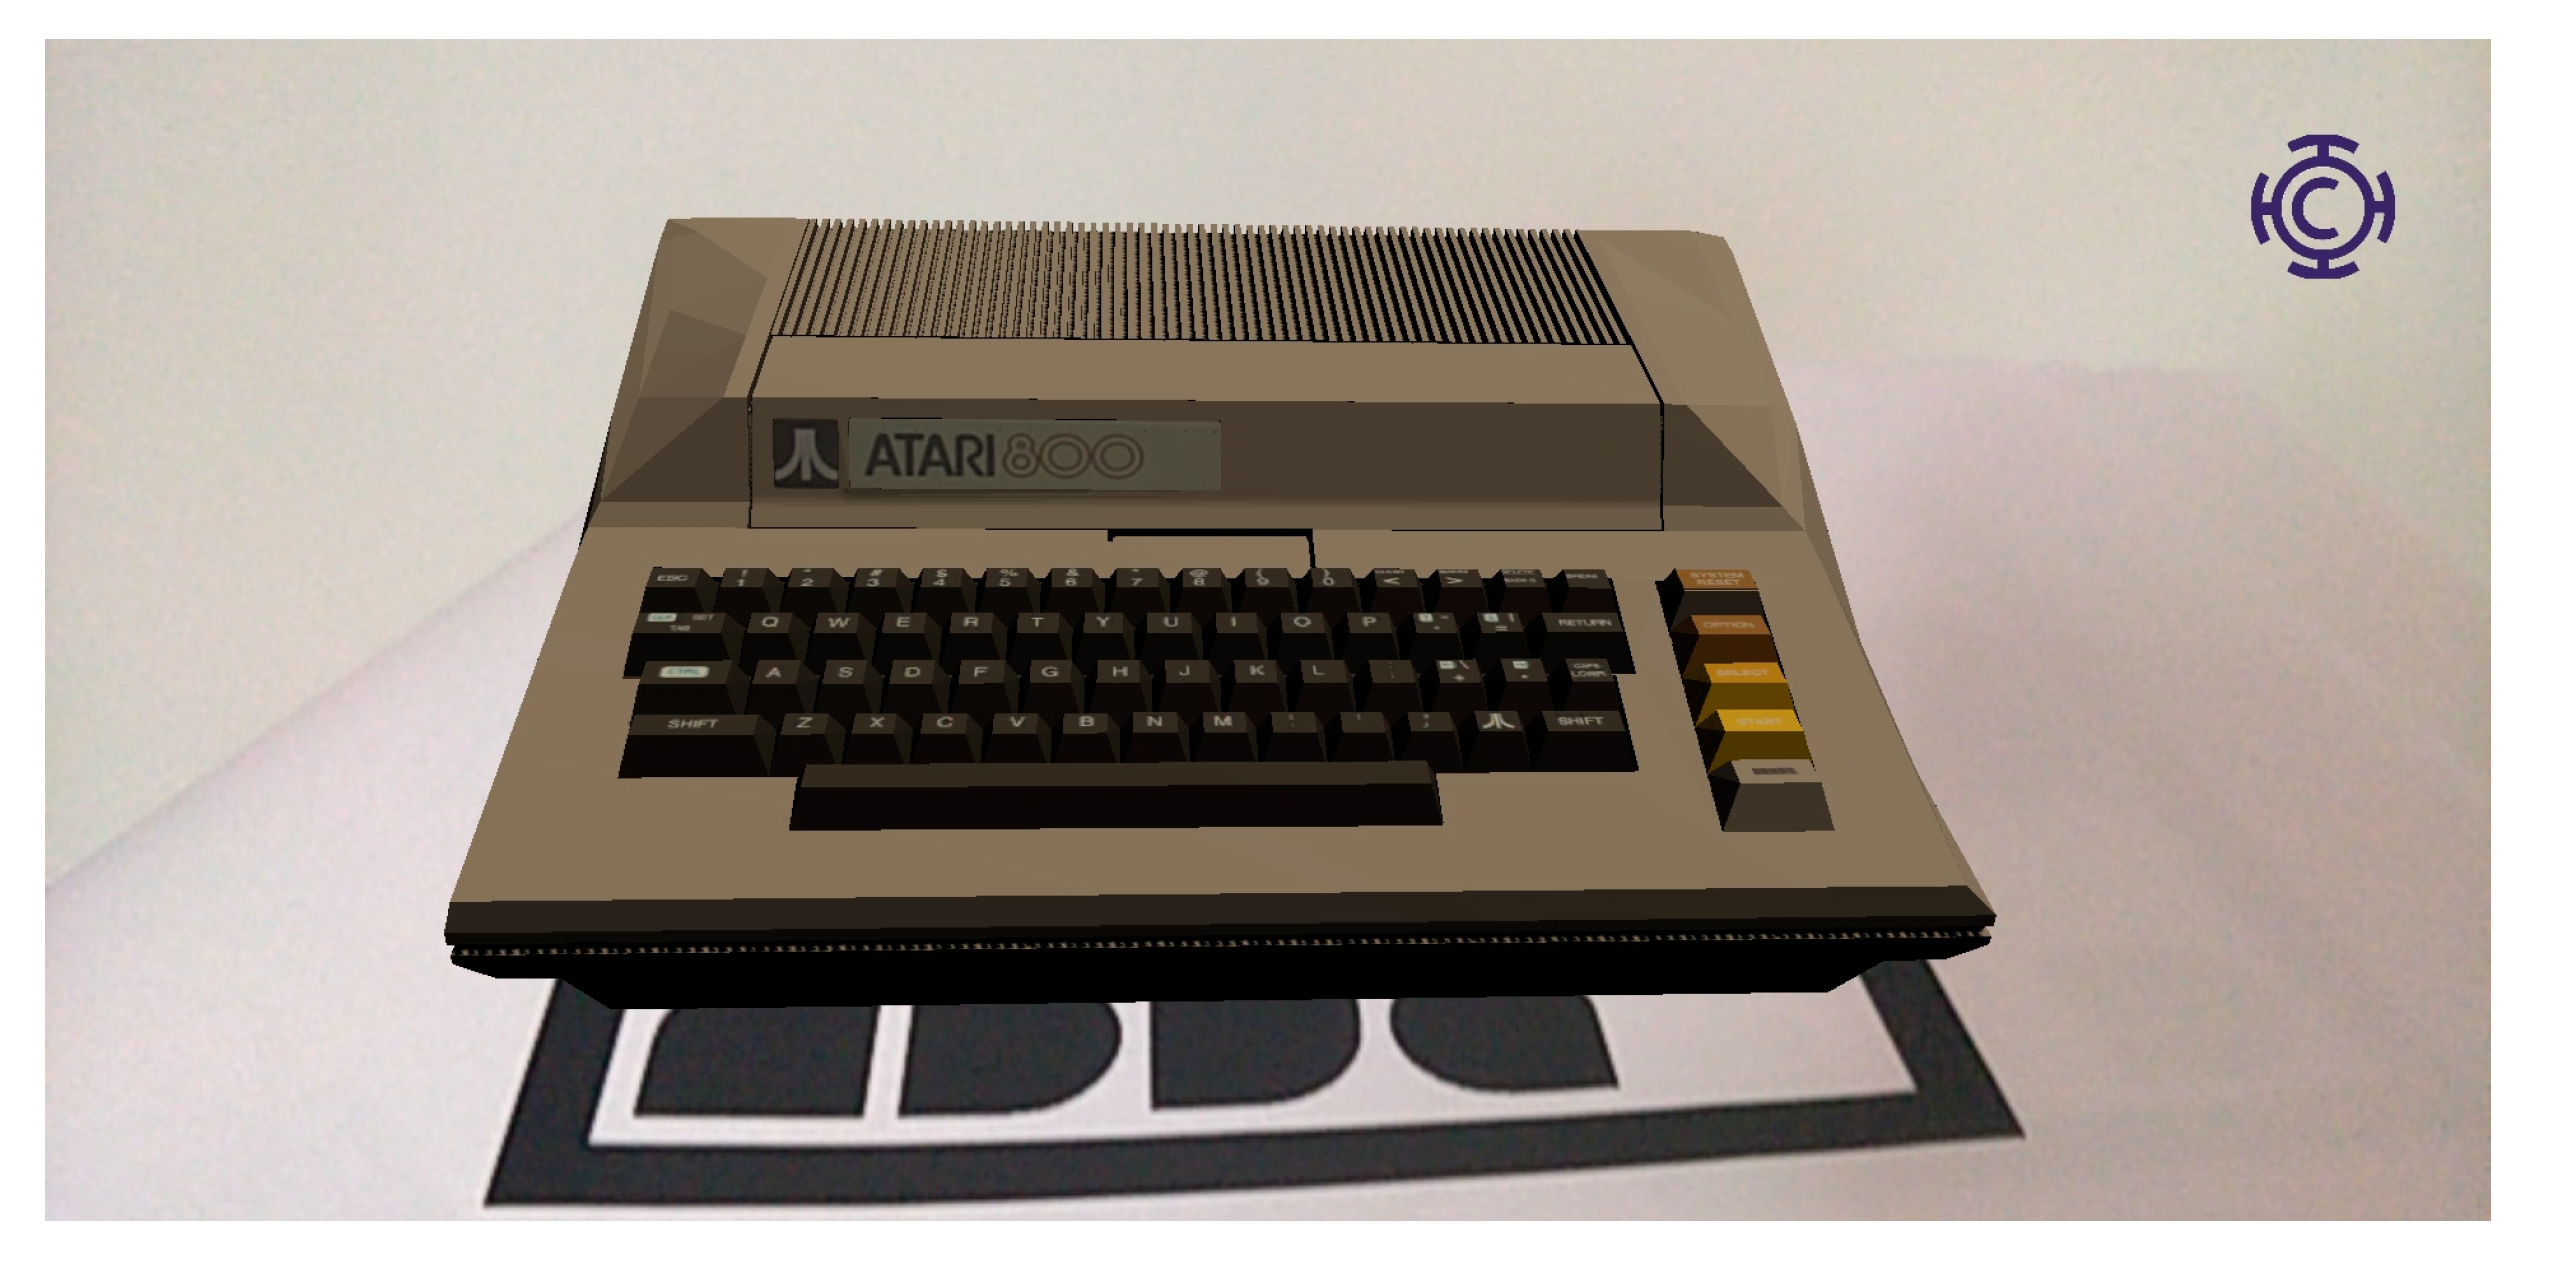
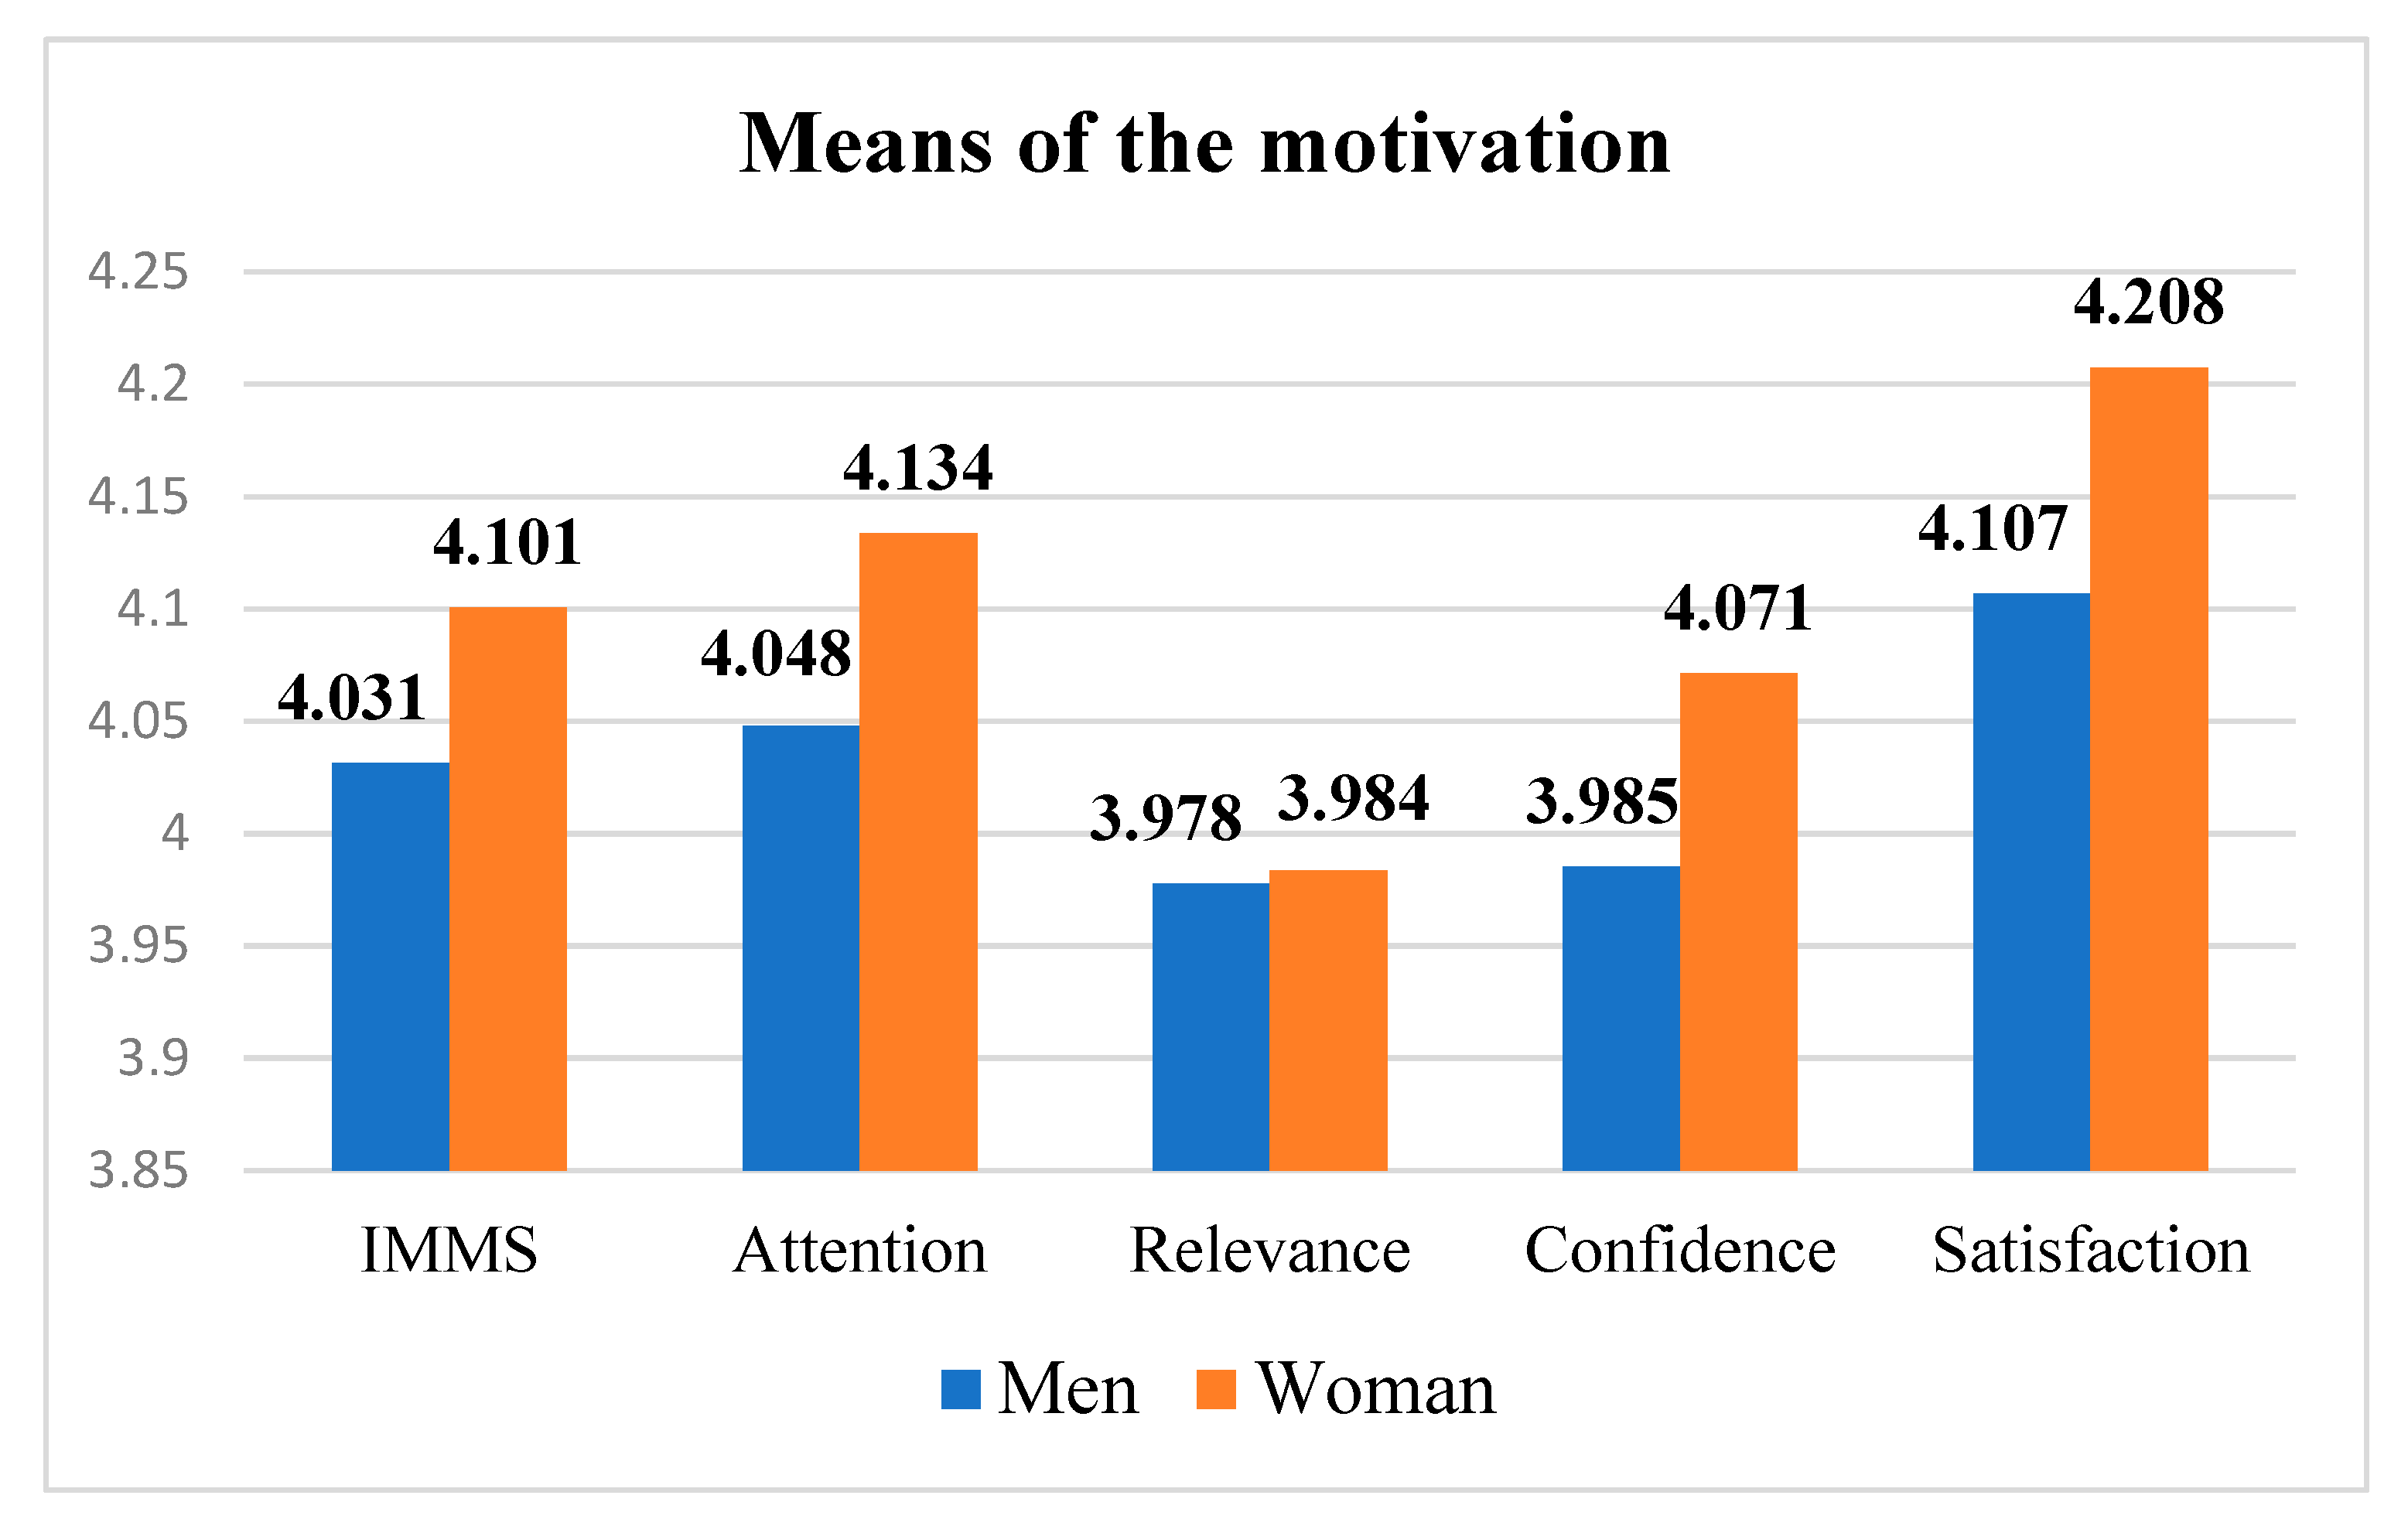
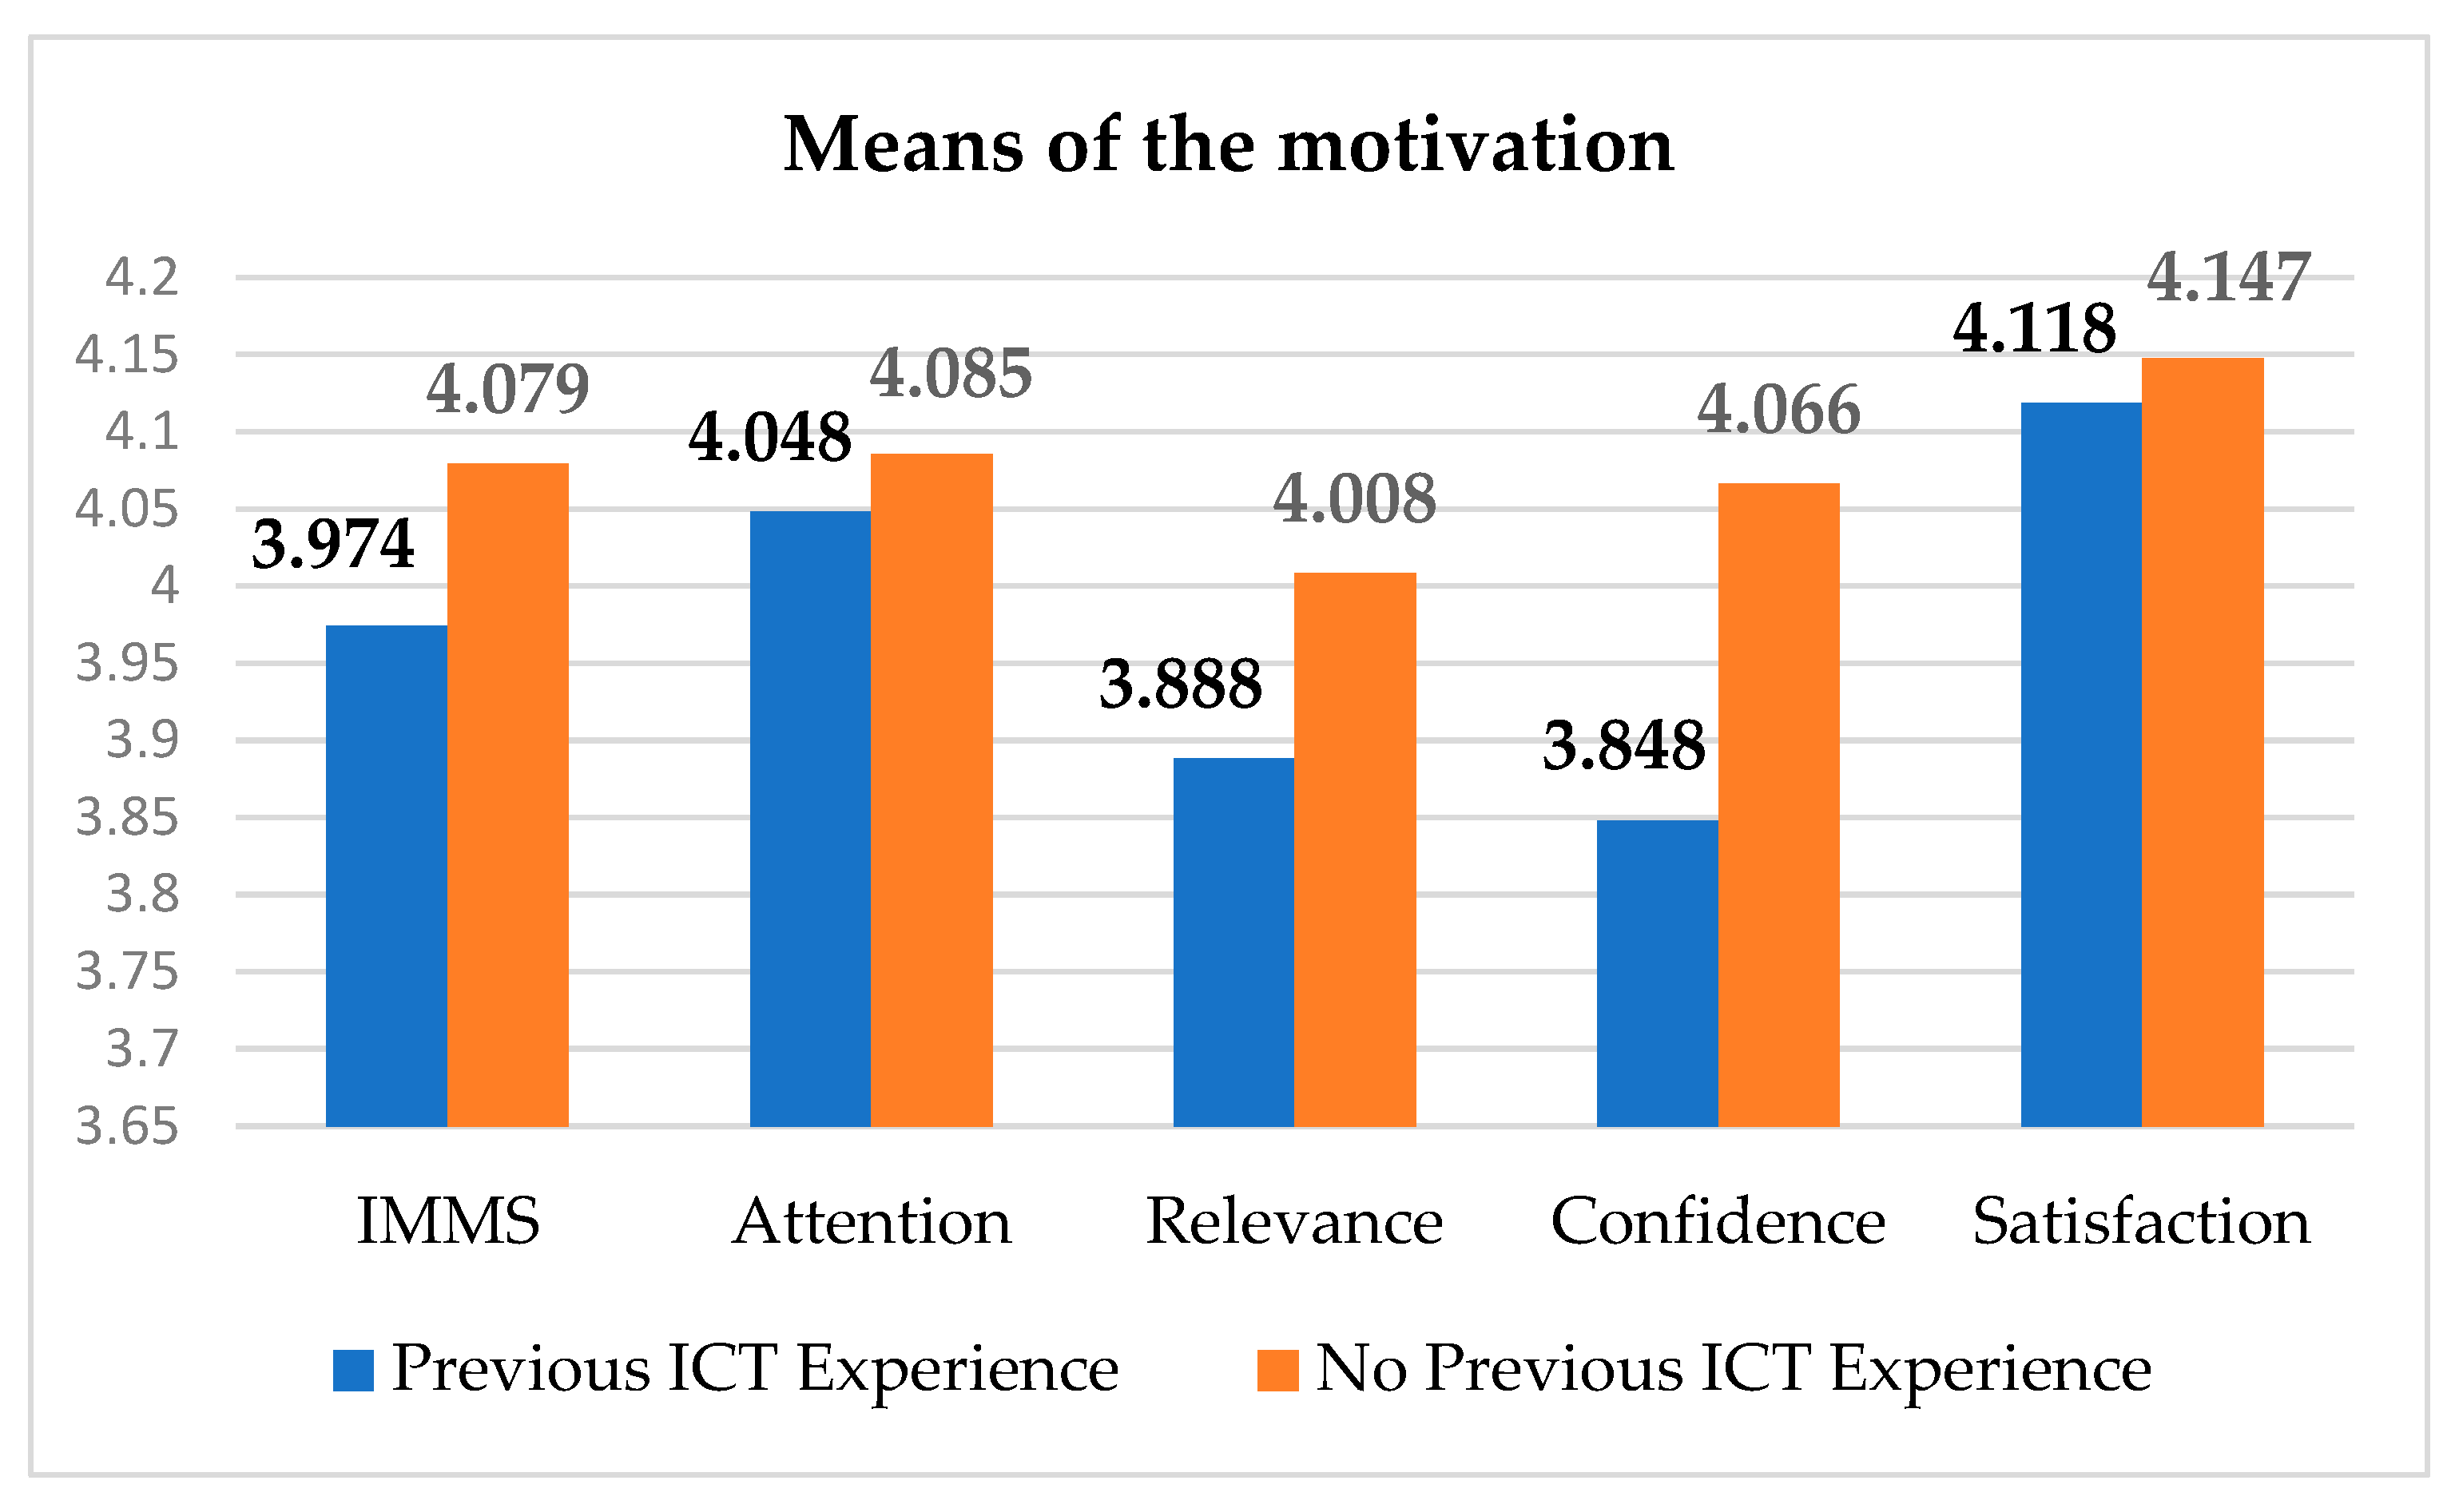
Table 1.
Percentages of students in the control and experimental groups according to previous ICT experience.
Table 1.
Percentages of students in the control and experimental groups according to previous ICT experience.
| Group | Previous ICT Experience | No Previous ICT Experience |
|---|---|---|
| Control | 23.46% | 76.54% |
| Experimental | 23.90% | 76.10% |
Table 2.
Cronbach’s alpha for each dimension (control group).
| Dimension | Cronbach’s Alpha |
|---|---|
| Attention | 0.705 |
| Relevance | 0.702 |
| Confidence | 0.700 |
| Satisfaction | 0.701 |
Table 3.
Cronbach’s alpha for each dimension (experimental group).
| Dimension | Cronbach’s Alpha |
|---|---|
| Attention | 0.800 |
| Relevance | 0.731 |
| Confidence | 0.664 |
| Satisfaction | 0.702 |
Table 4.
Sequencing for the experimental group.
| Sessions | Experimental Group |
|---|---|
| Session 1 | Install and manage the ComputAR application Brainstorm about computers |
| Session 2 | Research and write the necessary information (origin, historical influence, characteristics) about machines and computers using the OneNote collaborative tool |
| Sessions 3–4 | Develop a timeline that shows the 3D images of the different machines and computers using the Canva tool |
| Session 5 | Explain the components of a computer using the ComputAR application |
| Sessions 6–7 | Make an interactive infographic that shows the concepts and pictures of the components using Genially |
| Sessions 8–9 | Design a presentation that shows the different components with their technical specifications and prices as well as an image of the product using the PowerPoint tool |
| Session 10 | Give presentations from a business point of view for 3–5 min |
| Session 11 | Complete the Instructional Materials Motivation Survey (IMMS) |
Table 5.
Descriptive statistics of the IMMS instrument.
| Item | Research | Mean | Typical Deviation |
|---|---|---|---|
| IMMS | Control | 3.457 | 1.1051 |
| Experimental | 4.054 | 0.8660 | |
| Attention | Control | 3.461 | 1.0428 |
| Experimental | 4.077 | 0.8522 | |
| Relevance | Control | 3.248 | 1.1181 |
| Experimental | 4.008 | 0.8726 | |
| Confidence | Control | 3.593 | 1.1521 |
| Experimental | 4.014 | 0.8959 | |
| Satisfaction | Control | 3.563 | 1.0888 |
| Experimental | 4.141 | 0.8304 |
Table 6.
Test of normality for means differences of the IMMS instrument.
| Item | Research | Statistic | df | p-Value |
|---|---|---|---|---|
| IMMS | Control | 0.064 | 162 | 0.009 |
| Experimental | 0.157 | 159 | 0.000 | |
| Attention | Control | 0.061 | 162 | 0.200 |
| Experimental | 0.145 | 159 | 0.000 | |
| Relevance | Control | 0.092 | 162 | 0.002 |
| Experimental | 0.130 | 159 | 0.000 | |
| Confidence | Control | 0.116 | 162 | 0.000 |
| Experimental | 0.091 | 159 | 0.000 | |
| Satisfaction | Control | 0.091 | 162 | 0.002 |
| Experimental | 0.142 | 159 | 0.000 |
Note: degree of freedom (df).
Table 7.
Mann–Whitney U test for motivation in both groups.
| Items | Z | U | p-Value | r |
|---|---|---|---|---|
| IMMS | −11.075 | 3674.0 | 0.000 | 0.6181 |
| Attention | −10.272 | 4349.0 | 0.000 | 0.3785 |
| Relevance | −10.667 | 4024.0 | 0.000 | 0.5733 |
| Confidence | −6.782 | 7254.5 | 0.000 | 0.4553 |
| Satisfaction | −8.157 | 6121.0 | 0.000 | 0.5954 |
Note: effect size (r).
Table 8.
Student’s t-test for motivation in both groups (attention dimension).
| Items | T | df | p-Value | r |
|---|---|---|---|---|
| IMMS | 12,927 | 319 | 0.000 | 0.6013 |
| Attention | 11,468 | 319 | 0.000 | 0.6469 |
Note: degree of freedom (df); effect size (r).
Table 9.
Basic statistics according to the gender of the students.
| Items | Gender | N | Mean | Median | Typical Deviation |
|---|---|---|---|---|---|
| IMMS | Men | 106 | 4.0312 | 4.1389 | 0.4154 |
| Women | 53 | 4.1006 | 4.1944 | 0.3555 | |
| Attention | Men | 106 | 4.0480 | 4.1667 | 0.4560 |
| Women | 53 | 4.1336 | 4.2500 | 0.4766 | |
| Relevance | Men | 106 | 3.9776 | 4.0000 | 0.4939 |
| Women | 53 | 3.9835 | 4.0000 | 0.4365 | |
| Confidence | Men | 106 | 3.9853 | 4.0000 | 0.4572 |
| Women | 53 | 4.0713 | 4.1111 | 0.4209 | |
| Satisfaction | Men | 106 | 4.1069 | 4.1667 | 0.5517 |
| Women | 53 | 4.2075 | 4.3333 | 0.4444 |
Table 10.
Kolmogorov–Smirnov test of normality for motivation (experimental group).
| Items | Gender | Statistical | df | p-Value |
|---|---|---|---|---|
| IMMS | Men | 0.168 | 106 | 0.000 |
| Women | 0.165 | 53 | 0.001 | |
| Attention | Men | 0.175 | 106 | 0.000 |
| Women | 0.117 | 53 | 0.068 | |
| Relevance | Men | 0.125 | 106 | 0.000 |
| Women | 0.119 | 53 | 0.059 | |
| Confidence | Men | 0.088 | 106 | 0.041 |
| Women | 0.123 | 53 | 0.045 | |
| Satisfaction | Men | 0.150 | 106 | 0.000 |
| Women | 0.121 | 53 | 0.052 |
Note: degree of freedom (df).
Table 11.
Mann–Whitney U test for motivation according to gender.
| Items | Z | U | p-Value | r |
|---|---|---|---|---|
| IMMS | −0.869 | 2571.5 | 0.385 | 0.0689 |
| Attention | −1.347 | 2441.5 | 0.178 | 0.0793 |
| Relevance | −0.011 | 2806.0 | 0.991 | 0.1068 |
| Confidence | −1.001 | 2536.0 | 0.317 | 0.0618 |
| Satisfaction | −1.347 | 2597.0 | 0.436 | 0.0008 |
Note: effect size (r).
Table 12.
Student’s t-test for motivation according to gender (experimental group).
| Items | T | df | p-Value | r |
|---|---|---|---|---|
| Attention | −1.100 | 157 | 0.273 | 0.1848 |
| Relevance | −0.074 | 157 | 0.941 | 0.1938 |
| Satisfaction | −1.153 | 157 | 0.251 | 0.0124 |
Note: degree of freedom (df); effect size (r).
Table 13.
Basic statistics according to the previous ICT experience of the students.
| Items | ICT Experience | N | Mean | Median | Typical Deviation |
|---|---|---|---|---|---|
| IMMS | Yes | 38 | 3.9744 | 4.0000 | 0.3484 |
| No | 121 | 4.0794 | 4.1944 | 0.4088 | |
| Attention | Yes | 38 | 4.0482 | 4.1250 | 0.4596 |
| No | 121 | 4.0854 | 4.1667 | 0.4659 | |
| Relevance | Yes | 38 | 3.8882 | 3.9375 | 0.4046 |
| No | 121 | 4.0083 | 4.1250 | 0.4921 | |
| Confidence | Yes | 38 | 3.8480 | 3.8889 | 0.3938 |
| No | 121 | 4.0661 | 4.1111 | 0.4501 | |
| Satisfaction | Yes | 38 | 4.1184 | 4.1667 | 0.4728 |
| No | 121 | 4.1474 | 4.3333 | 0.5345 |
Table 14.
Shapiro–Wilk and Kolmogorov–Smirnov tests of normality for motivation according to previous ICT experience (experimental group).
Table 14.
Shapiro–Wilk and Kolmogorov–Smirnov tests of normality for motivation according to previous ICT experience (experimental group).
| Items | ICT Experience | Statistical | df | p-Value |
|---|---|---|---|---|
| IMMS | Yes | 0.886 | 38 | 0.001 |
| No | 0.186 | 121 | 0.000 | |
| Attention | Yes | 0.929 | 38 | 0.019 |
| No | 0.151 | 121 | 0.000 | |
| Relevance | Yes | 0.941 | 38 | 0.044 |
| No | 0.123 | 121 | 0.001 | |
| Confidence | Yes | 0.972 | 38 | 0.449 |
| No | 0.094 | 121 | 0.011 | |
| Satisfaction | Yes | 0.912 | 38 | 0.006 |
| No | 0.148 | 121 | 0.000 |
Note: degree of freedom (df).
Table 15.
Mann–Whitney U test for motivation according to previous ICT experience.
| Items | Z | U | p-Value | r |
|---|---|---|---|---|
| IMMS | −2.086 | 1783.0 | 0.037 | 0.1654 |
| Attention | −1.068 | 2035.5 | 0.286 | 0.2313 |
| Relevance | −1.635 | 1896.0 | 0.102 | 0.0847 |
| Confidence | −2.916 | 1579.5 | 0.004 | 0.0592 |
| Satisfaction | −0.746 | 2115.5 | 0.456 | 0.1297 |
Note: effect size (r).
Table 16.
Student’s t-test for motivation according to previous ICT experience (experimental group).
Table 16.
Student’s t-test for motivation according to previous ICT experience (experimental group).
| Items | T | df | p-Value | r |
|---|---|---|---|---|
| Confidence | −2.682 | 157 | 0.008 | 0.4890 |
Note: degree of freedom (df); effect size (r).
Disclaimer/Publisher’s Note: The statements, opinions and data contained in all publications are solely those of the individual author(s) and contributor(s) and not of MDPI and/or the editor(s). MDPI and/or the editor(s) disclaim responsibility for any injury to people or property resulting from any ideas, methods, instructions or products referred to in the content. |
© 2023 by the authors. Licensee MDPI, Basel, Switzerland. This article is an open access article distributed under the terms and conditions of the Creative Commons Attribution (CC BY) license (https://creativecommons.org/licenses/by/4.0/).
Share and Cite
MDPI and ACS Style
Amores-Valencia, A.; Burgos, D.; Branch-Bedoya, J.W. The Influence of Augmented Reality (AR) on the Motivation of High School Students. Electronics 2023, 12, 4715. https://doi.org/10.3390/electronics12224715
AMA Style
Amores-Valencia A, Burgos D, Branch-Bedoya JW. The Influence of Augmented Reality (AR) on the Motivation of High School Students. Electronics. 2023; 12(22):4715. https://doi.org/10.3390/electronics12224715
Chicago/Turabian StyleAmores-Valencia, Antonio, Daniel Burgos, and John W. Branch-Bedoya. 2023. "The Influence of Augmented Reality (AR) on the Motivation of High School Students" Electronics 12, no. 22: 4715. https://doi.org/10.3390/electronics12224715
Note that from the first issue of 2016, this journal uses article numbers instead of page numbers. See further details here.