Review

Driving the Ecological Transition of Agriculture through Voluntary Certification of Environmental Impacts: An Exploratory Literature Review on the Olive-Oil Sector

by
Aya Rezazga
1,2,
Carlos Ruiz
3,
Giuseppe Montanaro
4,
Giacomo Falcone
5 and
Georgios Koubouris
1,*
1
Institute of Olive Tree, Subtropical Crops and Viticulture (ELGO-DIMITRA), Leoforos Karamanli 167, GR-73100 Chania, Greece
2
Mediterranean Agronomic Institute of Chania (CIHEAM), Agrokipio, GR-73100 Chania, Greece
3
SEO/BirdLife, GEOLIT, Parque Científico y Tecnológico, Manzana 11, C/Sierra Morena, Complejo Tecnológico de Servicios Avanzados, Primera Planta, Local 1.1, 23620 Mengíbar, Jaén, Spain
4
Dipartimento delle Culture Europee e del Mediterraneo: Architettura, Ambiente, Patrimoni Culturali, Università degli Studi della Basilicata, 85100 Potenza, Italy
5
Department of Agriculture (AGRARIA), Mediterranean University of Reggio Calabria, Feo di Vito, 89122 Reggio Calabria, Italy
*
Author to whom correspondence should be addressed.
Sustainability 2024, 16(3), 1227; https://doi.org/10.3390/su16031227
Submission received: 10 December 2023 / Revised: 6 January 2024 / Accepted: 22 January 2024 / Published: 1 February 2024

Abstract

:
Human population growth has resulted in increased food consumption, followed by agrifood production intensification. Human activities have a significant impact on the environment, causing, among other things, air and water pollution and biodiversity degradation. In an international context where there is strong concern about environmental issues, it is also necessary to direct food production towards more sustainable models. In this context, the use of frameworks for certifying the environmental footprint of agrifood products can be a lever to promote sustainable production and consumption. The objective of this paper is to explore the opportunities for certifying the environmental footprint of products, focusing in particular on some of the main environmental claims: global warming, water depletion, and biodiversity loss. The olive sector was selected as a case study since it is the major tree crop in the Mediterranean countries, and it has strong impacts on human health and the environment. We employed a literature review in the SCOPUS database and the knowledge of experts in the main environmental certification sectors. The study revealed the possibility of adopting various mitigation strategies and improving environmental performance, while also pursuing certain market objectives related to certified products.

1. Introduction

The world’s population increased to eight billion in 2022 and is expected to be nine billion in 2037 [1]. While there has been a rush to produce more and more and better-quality food, which has had the effect of increasing the phenomenon of food loss and food waste [2], on the other hand, during recent decades, widespread poverty, food insecurity, and environmental degradation have resulted in terrible human misery and pose a threat to the stability of the world’s nations, regions’ economies, and ecological systems [3].
The models of production and consumption that have been consolidated in modern times based on an essentially neo-liberal economic system have largely relied on the use of natural resources as tools for rapid and low-cost progress. The primary effects of this trend were the unsustainable exploitation of natural resources (air, water, land, vegetation, etc.), environmental pollution, and climate change, which express in the alteration of climate patterns, primarily brought on by increasing greenhouse gas (GHG) emissions from human sources, such as industry and transportation, and from natural sources, such as animals, soil, and biomass. To date, anthropogenic activities have increased the average yearly temperature by approximately 1.0 °C over preindustrial levels, and if current emission rates continue, it is estimated to increase by 1.5 °C in the following three decades [4]. With this in mind, humanity is facing one of the most difficult challenges it has ever had to face, trying, by all means, to prevent the environment from collapsing to ensure a sustainable future for new generations. This change must necessarily be driven by new sustainable production and consumption models, to trigger a chain improvement process driven by the green market [5].
To fully understand the effectiveness and equality of the use of resources from the standpoint of growers, consumers, and governments, it is essential to assess the footprints of water, land, material, energy, and others in supply chains [6]. Recently, ethical and ecological consciousness has grown considerably, especially in advanced countries (e.g., U.S.A., E.U.), and has increasingly led consumers to change their eating habits, orienting them more and more towards healthy but also environmentally friendly products (e.g., plant-based food). In addition, this has also caused strong changes in the markets, which, for example, are increasingly abandoning the use of controversial ingredients such as palm oil [5].
Table olives and olive oil are fundamental elements of the global human diet, especially in European cuisine, and new eating habits increasingly place these products as centerpieces of diets. As reported by the International Olive Council (IOC), the average olive-oil production is estimated at 2,051,000 t between 2020 and 2021 (Figure 1) [7]. In Europe, there are about 5.1 Mha of olive-tree (Olea europaea L.) plantations, which make up about 49% of the world’s total area under olive cultivation and around 63% of the global production of olive oil in 2021 [8]. Sustainable agricultural practices could improve Europe’s ecology, society, and economy by being implemented in olive plantations [9].
The growing of olive groves and the function of olive mills consume significant amounts of resources; emit pollutants into the water, air, and soil; generate massive waste; and have a serious effect on the land and aquatic habitats [11,12,13]. Depending on the management used in olive growing, and the extraction of olive oil, these impacts could differ greatly among countries, as well as within a single country [14,15]. However, the cropping stage has great potential to offset the GHG emissions that occur during the olive-tree-growing and olive-mill stages, mainly because of the carbon stored in the soil and coarse biomass [16]. At all levels, from local to global, it is crucial to make the transition to agricultural systems that are sustainable. This requires strategies that further increase carbon sequestration and reduce pollutant emissions and natural resource depletion without compromising the production, quality, and safety of agricultural food.
Today, production techniques in agriculture can be based on different approaches, such as conventional farming, conservation agriculture, and organic farming. [17]. In particular, the latter two approaches have so far been considered sustainable, as they are essentially based on saving resources or using products of natural origin. In addition, organic farming also has great acceptance among consumers, who recognize its attributes of environmental quality and healthfulness [18], yet these aspects should be better investigated with appropriate accounting and communication tools. However, current organic certification does not explicitly communicate the level of environmental sustainability of a product. Other types of labels are needed to present clear information concerning the environmental impact category considered and the footprint generated by the product they are buying. When we mention ‘certification’, ‘eco-certification’, or ‘ecolabel’, respectively, we describe the processes of validating how sustainable are the company activities concerning a relevant protocol and designating a seal to identify compliant goods on the market [19].
The growing concern about the environmental footprint of enterprises has contributed to developing some standards aimed at guiding administrations in the implementation of environmental management systems (EMS) over the years. Various countries have addressed standardized kinds of pollution, indicatively pollution of air and water and solid waste, with relative success, at least on a local scale [20,21]. The aim of the present work is to explore the opportunities for certifying the environmental footprint of products, focusing in particular on some of the main environmental claims: global warming, water depletion, and biodiversity loss. To this end, an attempt was made to investigate the aspects described above concerning the olive-oil sector, which is one of the most important agrifood industries for the Mediterranean countries and, therefore, represents one of the key sectors for driving the ecological transition of the European agribusiness sector.
After the Introduction, Section 2 provides the framework of climate change, Section 3 describes organic farming as the first attempt at environmental certification, Section 4 presents information about life-cycle analysis, Section 5 elaborates on carbon footprint in agriculture, Section 6 presents water-footprint methodologies, Section 7 examines a relatively recent branch of environmental certification related to biodiversity, Section 8 describes the Environmental Product Declaration procedure, Section 9 gets more specific into the environmental footprint of the olive, Section 10 presents the limitations of the present study, and, finally, in the last Section 11, we summarize the conclusions and perspectives of this work.

2. Climate Change

One of the hottest problems of humanity is the struggle against climate change. The major emitters of GHG are the sectors of energy and transportation via the use of fossil fuels. However, it has been determined that the food industry is yet another important factor in climate change related to human activities [22]. Global warming (GW) is an estimation of the greenhouse gases released over the life of a product/process under investigation, and as a result, an estimation of the product’s or service’s contribution to climate change [23]. The recently observed rise in the planet’s average surface temperature, which is ascribed to an increase in human activity, is referred to as global warming [24], in particular, the atmosphere’s higher concentration in greenhouse gases carbon dioxide, nitrous oxide, and methane [24,25]. The increase in GHG levels is astronomically high and far beyond the range that is considered normal. The majority (76%) of these GHGs are produced when fossil fuels are burned, primarily CO2, followed by CH4 and N2O, which, respectively, contribute 16% and 6% of the total collective CO2-e based on global emissions from 2010. Agriculture is the primary source of these two gases [26]. The temperature of the Earth is influenced by a variety of elements, not just greenhouse gases. Volcanoes and variations in solar radiation are two examples of external but natural phenomena that affect world temperatures. Additionally, there are a variety of natural, intrinsic fluctuations in the Earth’s climate system [27].
According to [28], the contribution of food-production systems to anthropogenic emissions is significant and accounts for 19–29% of all greenhouse-gas emissions [29]. Agricultural production is responsible for between 80% and 86% of these emissions, with the remainder coming from preproduction (mostly fertilizer production) and postproduction activities, including primary and secondary processing, packing, shipping, etc. [30]. In Europe, the agrifood system accounts for about 14%, 13%, and 9% of total emissions of CO2, N2O, and CH4, respectively, between 2020 and 2021 [31]. For customers to make wise decisions, there is a lot of interest in calculating the carbon footprint (CF) of food goods, or the total amount of GHG emitted throughout the product’s life cycle [32]. Mathematical formulas are used to determine the overall global-warming potential (GWP) and express it concerning CO2. Therefore, the carbon dioxide equivalent (CO2-e) is the GWP measuring unit [33]. The calculation formula is as follows:
GWPtot (kg CO2-e) = [Amount of CO2×1] + [Amount of CH4×GWPCH4] + [Amount of N2O × GWPN2O]

3. Organic Farming

Addressing agricultural development and climate change adaptation and mitigation mainly employs three different approaches: conventional agriculture, conservation agriculture, and organic agriculture [17], which promote increased CO2 sequestration and reduced GHG emissions. Organic farming is a method of managing agricultural holdings that involves significant restrictions on the use of fertilizers and pesticides. This production method is based on various farming practices. It is concerned with environmental protection, and it seeks to promote sustainable agricultural development [34]. To maintain soil fertility and health, as well as to control insects, weeds, and other pests, organic farming relies on different agricultural techniques (soil cultivation, mineral-bearing rocks, crop rotation, the use of resistant varieties, etc.) and inputs (crop residues, animal manures, legumes, green manures, and off-farming organic wastes). The market within Europe for organic produce is growing rapidly in many countries. Organic farming is popular in Europe, with France having the largest agricultural area in this system, followed by Spain, while Italy and Germany also are key players (Figure 2).
Over the period 2012–2020, the proportion of EU agricultural land dedicated to organic farming increased by more than 50%, with a mean annual increase of 5.7%. Organic farming covered 9.1% of the EU agricultural land area in 2020. Permanent grassland received the greatest share of organic farming land in the EU (42%). The second dominant activity is green fodder (17%), followed by cereals (16%), while permanent crops (vineyards, fruit trees, and olives) represent 11% [36]. Organically produced food must meet predefined standards to be communicated and commercialized as ‘organic’ in the European Union. The regulatory framework for the production, processing, labeling, and control of organic products is established by European Council (EC) Regulation No 834/2007 [37]. Product labeling with organic certification logos is used to inform consumers at the point of sale that a product is certified organic. The organic label is essential in the handling and definition of organic food. Organic certification systems in Europe are implemented based on The European Standard ISO/IEC 17065 [38,39,40]. The United States Department of Agriculture (USDA) describes the five steps of organic certification starting with registration and ending with certification (Figure 3).
There is a transitional stage from conventional farming to organic that is named “conversion”. Organic production methods must be used during this time, but the finished product cannot be labeled as organic. This conversion period varies depending on the type of organic product produced. The conversion period is the time between the start of organic management and crop or animal-husbandry certification. It is the time required to neutralize any chemical residues left in the soil by conventional agricultural techniques previously used. For annual crops, this period is 24 months; for perennials, it can be up to 36 months [42]. With the growing interest in organic products, there are many organic labels available today, including Organic Farmers and Growers Certification, Organic Food Federation, Agriculture Biologic (AB), Italian Association for Organic Agriculture (AIAB), Australian Certified Organic, BIO Hellas, etc.

4. Life-Cycle Approach for Environmental Issues Assessment

4.1. Background

Due to the significant negative effects on human and ecosystem health, reducing environmental loads as GHG emissions has become challenging at the international scale and has environmental, economic, political, and diplomatic dimensions [43,44,45]. For instance, 22% (13 GtCO2-eq) of global net anthropogenic GHG emissions came from the agriculture, forestry, and other land use (AFOLU) sectors [46]. In addition, CH4 and N2O emissions from agriculture both account for about 70% of global anthropogenic emissions [47,48]. The sources of greenhouse-gas emissions in agroecosystems are many; they might come directly from the soil or indirectly via fertilizers or pesticide use, seed production, machinery use, and irrigation. To get a clearer comprehension of how humans impact the environment, various metrics, such as the water footprint (WF) and carbon footprint (CF), have been utilized [49]. Solid evaluation techniques are needed to improve food-production systems and create more sustainable diets. A tried-and-true quantitative technique for evaluating the environmental impact of a good or service is the Life Cycle Assessment (LCA).
The LCA is described as the “compilation and evaluation of the inputs, outputs and potential environmental consequences of a product system throughout its life cycle” in the International Organization for Standardization [50]. Therefore, the LCA is considered a tool for analyzing the environmental impact of produce at all points in its lifetime, from resource extraction to producing materials, product parts, as well as the initial product, to use and management following discarding, either through a new use, if it is recycled, or ultimately disposed (as defined, “from the cradle to the grave”). The term “product system” refers to the entirety of the individual processes included in the product life cycle [51]. For each life-cycle stage, starting with extracting raw materials through to manufacture, usage, and disposal of the product, we quantify inputs of natural resources (such as land, raw materials, water, and energy) and outputs such as produce, byproducts, GHG emissions, and waste. The LCA was first utilized in various environmental and energy-related sectors, in conjunction with pertinent techniques in the specific field or used to get superior results. These sectors include air pollution, electric power [52,53,54], and, obviously, the agricultural sector [55]. The LCA has an important role in the United Nations (UN) Agenda 2030 Sustainable Development Goal (SDG) 12 of “responsible consumption and production”, which calls for the adoption of more sustainable consumption patterns by the year 2030, and whose achievement necessitates a significant focus on the supply chain from producers to final consumers [56]. It is done by keeping track of the resources and energy utilized, as well as the trash that is released into the environment [56].

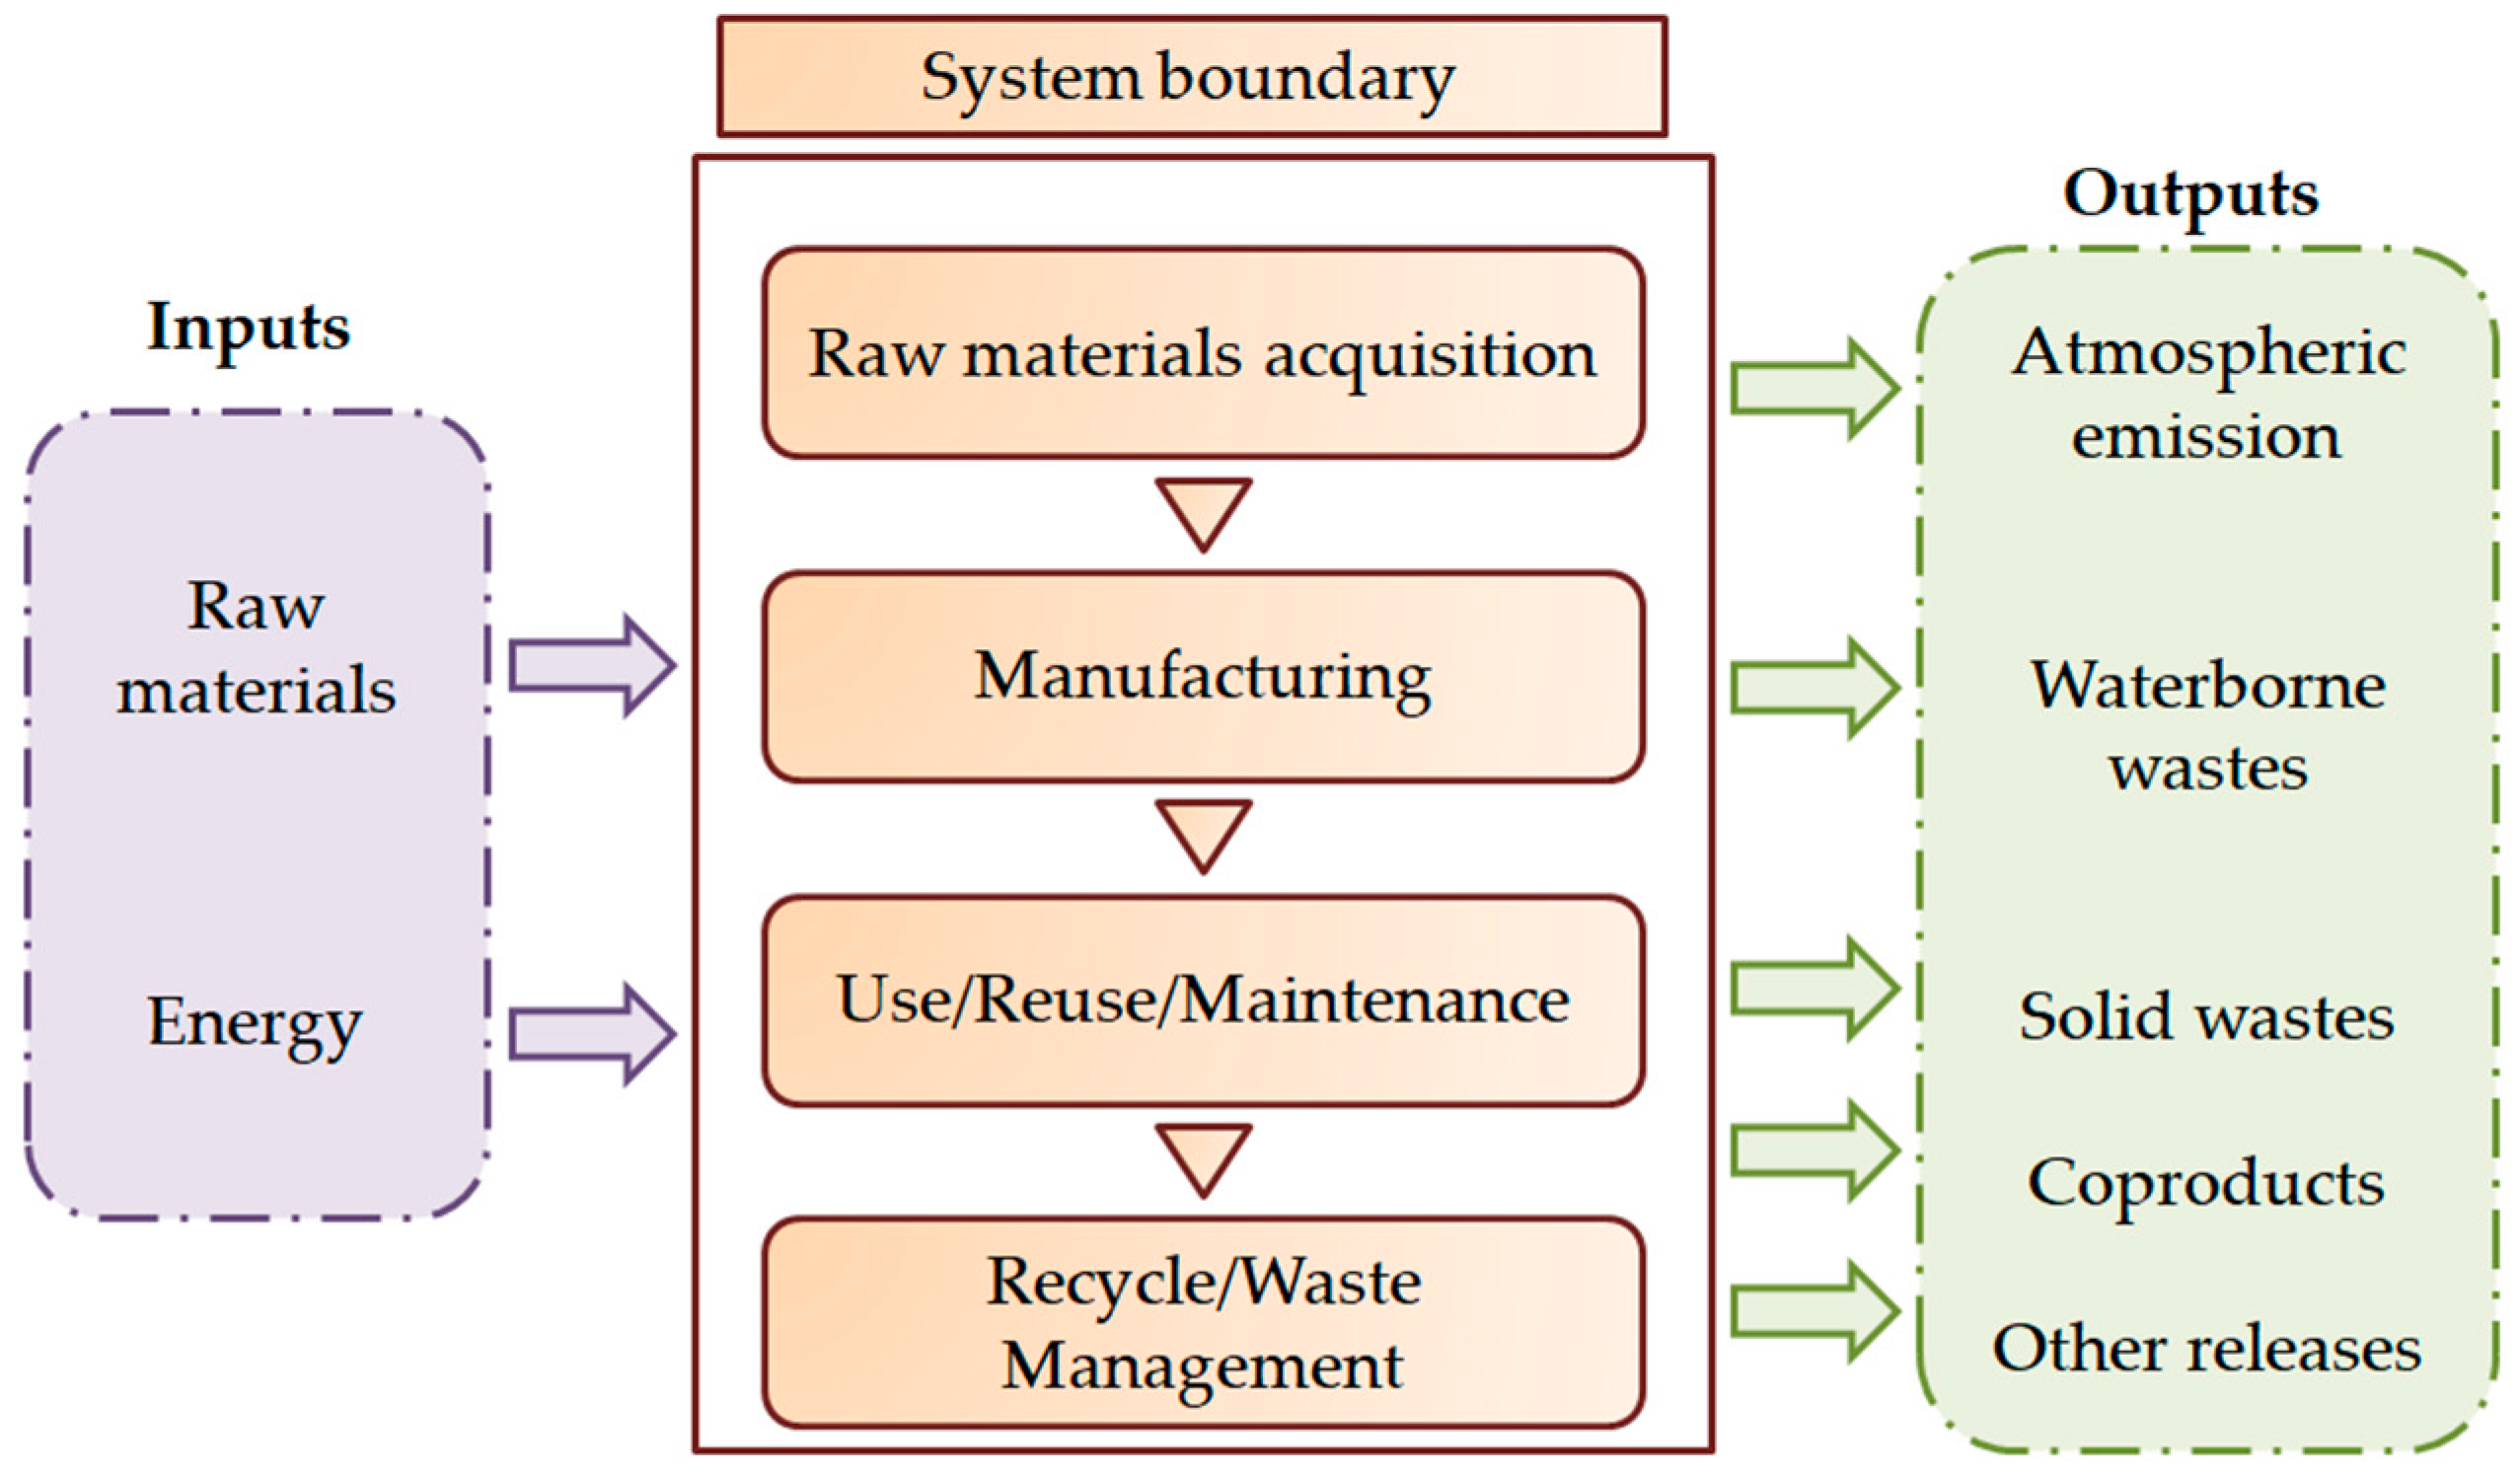
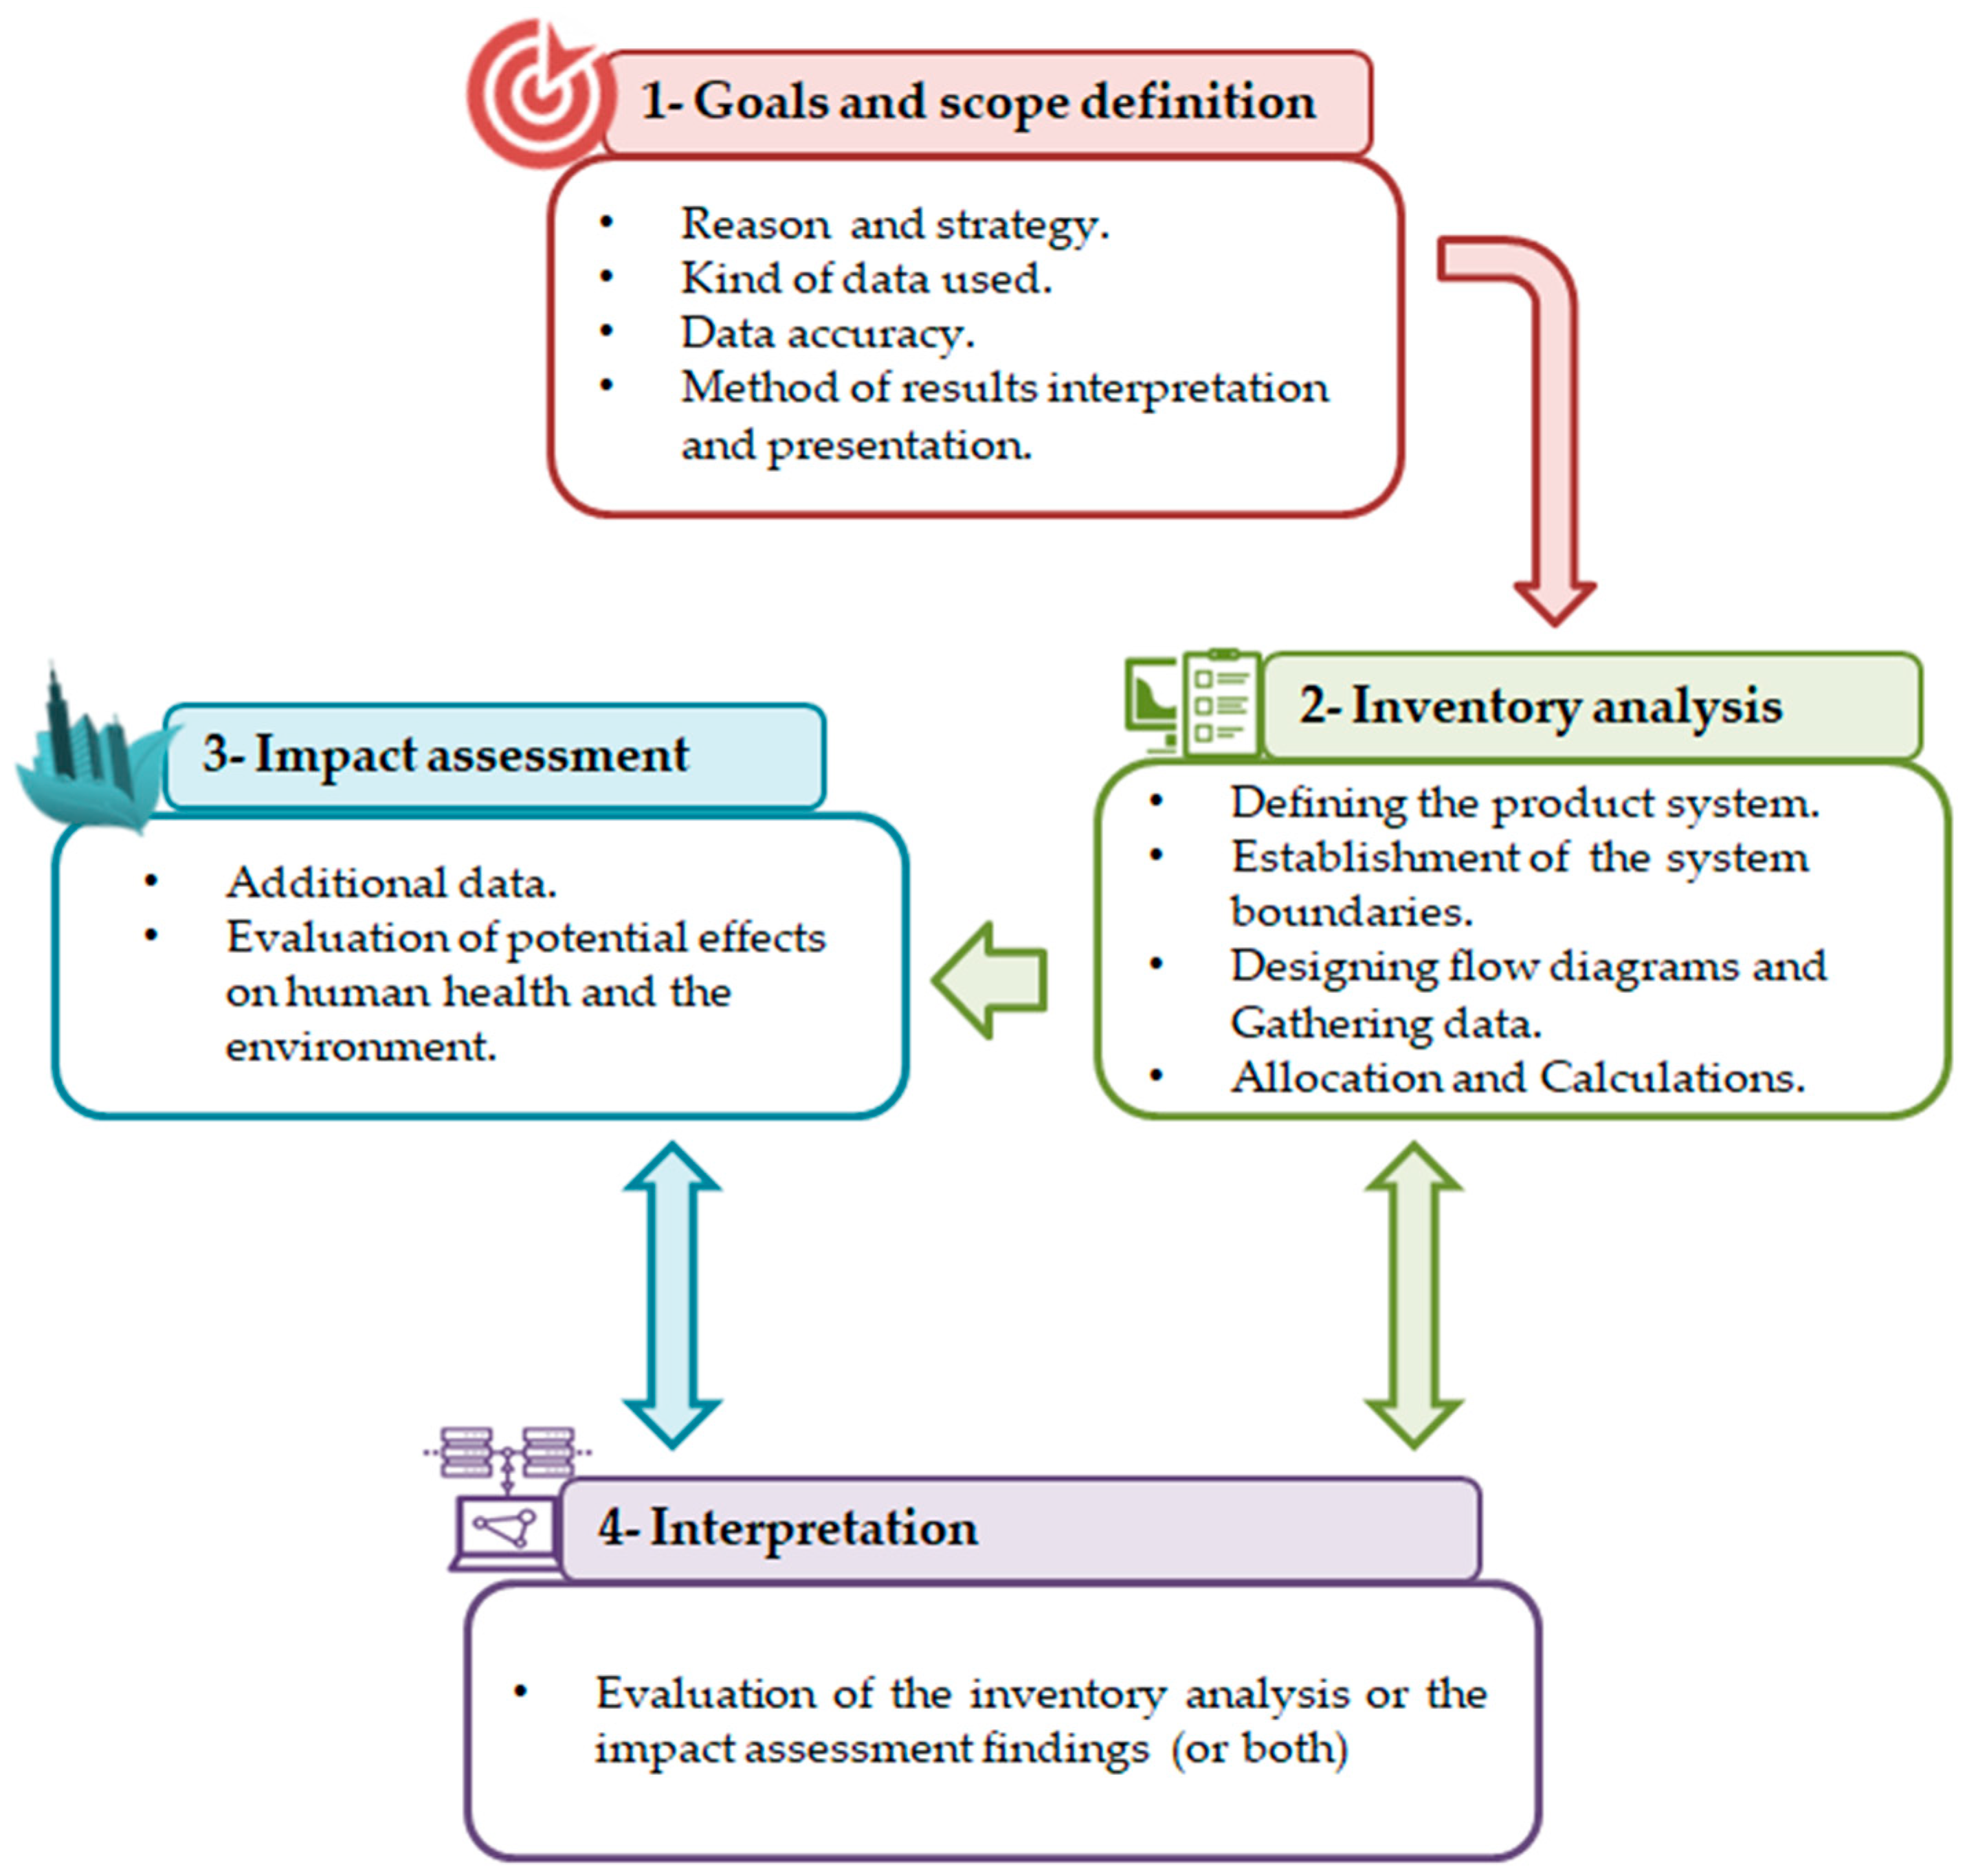
4.2. The Basic Concept of the LCA

The basic idea behind the LCA is to quantify the resources used (such as fuels, minerals, water, and land), as well as the emissions of different water and air pollutants (such as carbon dioxide, nitrate, etc.) that happen at every stage of producing and using a product (Figure 4). It also aims at classifying as well as grouping the impacts of the use of resources and emissions into pertinent classes of significance for the assessment of their environmental effect [57].
In general, three kinds of LCAs are described: process LCA (which is a bottom–up approach), the input–output type of LCA (that is a top–down method), and the combined process (also known as a hybrid approach) [59]:
  • Economic input–output (EIO)—the estimation of inventory data and the GHG emissions from a variety of commercial activities; the EIO-based LCA uses a top–down method. The EIO-based technique, which often relies on EIO databases that group certain sectors into a generic sector, assesses inventory data at a rougher granularity. If we use a traditional process-based LCA for comparison, the EIO-based LCA is superior due to its capacity to comprehensively gather data from an inventory of GHG emissions via transactions in several industries [60];
  • Process-based approach—the process-based LCA employs a bottom–up methodology to gather pertinent inventory data. The inventory data obtained from this method can be more accurate than the data from an inventory calculated via the method based on EIO-. Although it is challenging to gather data from an inventory on all the required inputs (for example, financial and technical services) at the level of processes, the inventory that is based on processes typically leads to system truncations [60];
  • Hybrid approach or combined process—the EIO-based LCA and the process-based LCA can be combined to create a hybrid LCA. The EIO-based hybrid, tiered hybrid, and hybrid integrated LCA are the three subcategories of the hybrid LCA [61]. By combining truncation of the system boundary in a method that is process based with the database of EIO, it is thought that the environmental consequences can be quantified by a hybrid LCA more thoroughly than an EIO-based or process-based approach. The environmental inventories of economic and process-based systems are connected by this method. The integrated hybrid LCA inventory uses, first, the data of processes and subsequently integrates data of the EIO via the connection of the downstream and upstream, where the data that are process specific are not accessible, using as a basis the premise that process-specific data are considered as more trustworthy and accurate compared to the data of the EIO [60]. In the literature, the hybrid LCA technique has been suggested as a way to either increase the accuracy of input–output analysis or decrease the error of truncation in the LCA process, which is defined as the error resulting from the “effect that is not included in the LCA system boundary” [62].
In Table 1, the advantages and the mean differences between the three approaches are presented.
There are two approaches to implementing LCA: the Consequential Life Cycle Assessment (CLCA) and the Attributional Life Cycle Assessment (ALCA). A useful description of the two is given by Ekvall (2019) [68]. “The previous ALCA aims to reduce the magnitude of the overall environmental impact associated with a specific produce resulting from a given activity and so gives evidence on the impact of activities, and the latter CLCA aims to detect alterations of the environmental effects resulting from a particular product.” Since change will most likely affect marginal processes, average data are employed by the ALCA while marginal data are used by the CLCA [68]. In the ALCA, the distribution of emissions among coproducts is often based on physical or economic connections, whereas in the case of the CLCA, the procedure is broadened to contain methods that are impacted by the entry of byproducts into the market. The results of the LCA studies are used to inform decisions that will inevitably result in change; hence, we may assume that CLCA research should be applied to all LCA studies. Nevertheless, other authors contend that the ALCA approach may be more suitable for assessing the function of a new product in a future stable condition as opposed to the changing condition at the stages of introduction or expansion in markets [69].

4.3. The Methodological Framework

Defining the aims and framework, inventory analysis, impact assessment, and interpretation are the four steps of this methodology (Figure 5), which is standardized following ISO 14040:2006 [70] and ISO 14044:2006 norms [71,72].
The stages of defining the goal and the scope of the LCA procedure establish the reason and strategy for incorporating life-cycle consequences on the environment into the procedure of making decisions. At that stage, it is necessary to decide what kind of data are required to provide benefit to the procedure of making decisions, the level of accuracy of the results to be valuable, and their proper interpretation and presentation [58]. It serves to define the production procedures. In this context, this entails determining the functional unit, establishing the limits of the process (among economy, the environment, and multiple other systems, and concerning cutoff), scheming stream illustrations with unit procedures, defining data quality in every step, describing distribution rules for multifunctional procedures, and illustrating the environmental impact to be investigated.
The second stage of an LCA process is the Life Cycle Inventory (LCI), and, after a census, its principal output is a table of “Activity Data” quantifying the magnitude of human activity happening in a specific time frame in terms of mass of material/energy [74]. Examples of activity data within the agriculture sector include amounts (e.g., t, kg) of fuel used, kW of power supply, fertilizers, lubricants, pesticides, plastic trays for harvest, iron/woody poles, irrigation water, seed input, hours of machinery used, etc. Hence, the LCI does not yet inform about the environmental (or human health) impacts.
The Life Cycle Impact Assessment (LCIA), according to ISO, is considered the third phase in the LCA. The LCIA translates the activity data listed under LCI into potential impacts on human health and the environment of the input resources and discharges, recognized in the LCI and known as the LCIA phase of an LCA. Activity data are converted into impacts using emission factors (EFs) and characterization factors (CFs) selected according to a specific impact category. For example, within the GWP impact category (whose indicator is t CO2 eq), the calculation of the LCIA generated by supplying to the soil 60 Kg/ha/y of synthetic N is
60 kg /Ha/y (Activity data) × 0.016 kg N2O/Ha/y (EF) × 265 CO2eq (CF) = 254.4 CO2eq/ha/y
where EF is the default Tier-1 emission factor for direct N2O emissions from N inputs to soils [74]. Note that CF is the characterization factor of the GWP environmental impact category converting the emissions in the unit of GWP because the effect of N2O is 265 times higher than that of CO2 when it comes to global warming.
The impacts on ecology and human well-being and resource exhaustion should be covered in LCA-based impact assessments through the identification of adequate impact categories (fossil or primary energy use, GWP, eutrophication, acidification, photochemical ozone formation, land use, aquatic ecotoxicity, abiotic depletion, terrestrial ecotoxicity, and human toxicity) and related CFs [75].
The explanation stage of LCA, according to ISO, is the “life cycle assessment stage when the outcomes of the inventory analysis or the impact assessment, or both, are evaluated concerning the defined aim and framework to achieve conclusions and suggestions”. ISO mentions the following factors: identification of important problems; a review that takes into account consistency, completeness, and sensitivity checks; conclusions, restrictions, and suggestions; the system function definitions of suitability, the functional unit, and the system limits; and restrictions determined by the sensitivity analysis and data quality evaluation [76].
The development of the simplified LCA, named streamlined LCA, was prompted by the complexity of applying a life-cycle assessment to various industries. This method proposes to deliver outcomes that are essentially equivalent to a detailed one while saving money and time during the data-collection process. Simplified LCAs might sometimes concentrate on the most significant environmental factors, prospective environmental effects, or specific stages of a life cycle [71].

4.4. LCA in the Agrifood Sector

The development of LCA methodology has its roots in the late 1960s when it began to broaden the horizon of environmental analysis of products to their entire life cycle. In 1969, The Midwest Research Institute first applied Resource and Environmental Profile Analysis (REPA) to Coca-Cola packaging, and this can be considered the first application of what would later be referred to as the Life Cycle Assessment [77]. Since its standardization in 1997, the LCA Methodology has gained increasing acceptance in all manufacturing sectors; in the agribusiness sector; also, it has established itself as the reference methodology for assessing the environmental footprint of products and processes, mainly due to the strong push from the LCA-Food conference series that has been held every two years since the first conference in Brussels in 1996 [55]. Since then, the LCA methodology has been used countless times in all the different agrifood and agroindustrial supply chains [78], and many steps forward have been taken concerning the many issues related to the application of this methodology to the agricultural sector. This, because of its biological nature, poses several problems in measuring the input and output flows of materials and energy occurring in the field and, given its multifunctional character, generates issues related to the outlook of the assessments [79].
Among the activities that characterize the agribusiness system, the LCA has been applied to open-field agricultural production [80], tree crops [81], processing activities [82], logistics [83], and byproduct management [84].
In this very broad scenario, the olive-oil sector has been given great prominence as evidenced by the work [85] and a recent review on the topic [86].
The interest in this methodology by the agribusiness sector is evidenced by the growing number of Environmental Product Declarations [https://www.environdec.com/library (accessed on 9 December 2023)] and the effort being made internationally to create systems based on a simplified LCA to further increase the use of this methodology [https://docs.score-environnemental.com/v/en/ (accessed on 9 December 2023)].

5. Carbon Footprint

A product’s “carbon footprint” is expressed as the totality of all equivalent carbon dioxide emissions per functional unit (e.g., ton, Ha, bottle, L), whether they are produced directly, indirectly, or over the course of the life cycle of a product. The actions of people, groups, governments, companies, organizations, procedures, industries, etc. are covered by it. Services and goods are considered products. Every direct (internal, on site) as well as indirect (external, off site, downstream, and upstream) emission must be considered [87]. The carbon footprint, which is a quantifiable representation of a given activity’s GHG emissions, is useful for managing emissions and evaluating mitigation strategies. After emissions have been quantified, the major sources of emissions are identified, and zones for emissions reduction and efficiency improvement can be prioritized [88]. This offers the chance to save expenses while improving environmental efficiency.

5.1. Estimation of the Carbon Footprint

The quantity of greenhouse gases released, withdrawn, or sequestered during a product’s life cycle should be quantified and added to determine the carbon footprint. The life cycle of a product comprises each stage of production, from the sourcing of raw materials to final packing, distribution, consumption, usage, and disposal [33]. Boundaries are established following the carbon footprinting goals and techniques. To account for greenhouse gases, there are standards and recommendations. Typical resources include the following.
  • World Business Council for Sustainable Development (WBCSD) and World Resource Institute (WRI) Climate Change Protocol. There are two criteria:
    (a)
    An Accounting and Reporting Standard for the Product Life Cycle, and
    (b)
    Corporate Accounting and Reporting Standard: Guidelines for Value Chain (Tier III) Accounting and Reporting. It covers the quantification of GHG reductions resulting from the application of mitigation strategies in its project protocol and offers sector-specific and generic accounting tools. The majority of GHG accounting standards, including ISO 14064 parts 1 [89] and 2 [50,90], are based on it;
  • ISO 14064 (Parts 1 and 2): this is a global standard for establishing limits, calculating GHG emissions, and reducing them. It also offers a guideline for organizing efforts to reduce greenhouse-gas emissions [89];
  • British Standard Institution (BSI) Publicly Available Specifications-2050 (PAS 2050 [91]): this defines the criteria for evaluating the life-cycle greenhouse-gas emissions of products and services;
  • ISO 14025 [92]: This is a guideline for LCA implementation;
  • ISO 14067 [93]: A standard for measuring a product’s carbon footprint is being developed [33].
The GHG emissions can be gathered by measurements of actual field-activity data taken in real time or by using estimations via models and emission variables. The aim (voluntary, mandated, or for internal management), viability, credibility, and cost and capacity factors all play a role in selecting the best method. The most popular and favored methods are emissions factors and models. Typically, emissions factors and models that employ data on the use of fuels, energy, and other inputs that result in emissions are used to compute emissions for items, organizations, and events (especially CO2) [33]. Carbon-footprint labels detail how much carbon dioxide equivalents were emitted during the production and distribution of a product, as well as its usage and disposal [94,95]. The aim of carbon-footprint labeling is to communicate to consumers the effect of their product selections on GHG emissions and assist them in finding low-carbon substitutes [96,97].
Around the world, we have seen the application of many schemes for labeling the carbon footprint. The first such label indicating a product’s carbon footprint was adopted by the British government-established commercial enterprise Carbon Trust in 2007 [98]. The same year, Tesco, a British retailer, promised to include a carbon footprint on each of its product labels [99]. Although many products were tagged, Tesco discontinued the label in 2012 due to the laborious process and the lack of cooperation from other retailers [100]. There are three main types of carbon labeling. The greenhouse-gas emissions linked to a product throughout its life cycle are disclosed on the Carbon Trust label. Other emissions labels express a desire to cut emissions [101]. A third form identifies the product as being carbon neutral, which is typically done by reclaiming carbon credits or compensating for carbon emissions. Because “carbon neutrality” can be attained through financial transactions without necessitating a reduction in carbon emissions, this third option in particular has drawn criticism.
The carbon footprint (CF) is calculated as follows: The entire amount of GHG released by the growing of each crop, represented in units of carbon equivalents (CE), is the CF of the agricultural cultivation process. It is calculated using the relationship shown below, according to [102,103].
Carbon Footprint = Agricultural Input × Emission factor per functional unit
where “carbon footprint” refers to the quantity of GHG emissions caused by a specific agricultural input. An “agricultural input” is a specific input, such as the quantity of fertilizers and insecticides used (in tons), gasoline or fuel used (in liters), or energy used (in kWh) (kilowatt hours). The CE of each input is the “emission factor.”
When we add the individual carbon costs of all the inputs utilized, it is possible to estimate the total cost CF (CFt) of producing a crop as follows.
CFt = CFF + CFN + CFP + CFIR + CFD + CFM
where CFF, CFN, CFP, CFIR, and CFD stand for the separate carbon footprints from fertilizer, direct Nitrogen fertilizer application, pesticides, irrigation, and mechanical crop-production processes. To account for methane emissions in the case of rice, another factor called CFM is utilized [103].
Globally, inventories of greenhouse gases are being conducted, and all viable means of mitigation are being identified and assessed [33]. Organizations utilize the carbon footprint, which has been marketed, to calculate their carbon footprint and take action to cut emissions. By creating multiple online calculators, this business savvy has increased public awareness of carbon emissions and made the general public aware of how much their actions contribute to global warming. The carbon footprint should be used as a potent instrument to encourage GHG reduction in organizations, activities, and the general public, and it ought to be regarded as a sign of sustainable development [33].

5.2. Carbon-Footprint Tools and Software

Here common tools and software for carbon-footprint implementation is reported.

5.2.1. AGRECALC

This is a software tool that gives visibility to farm GHGs and aids stakeholders along the food supply chain in taking assured, economic measures toward a net-zero future. It is the industry’s top farm carbon calculator. It aids agriculture’s change to a future with lower carbon emissions by benchmarking and tracking agricultural GHG. This seeks to advance the sustainability of global agriculture by lowering carbon emissions and boosting production effectiveness [104].

5.2.2. The Cool Farm Tool

The Cool Farm Tool is considered a GHG emissions calculator at the farm level that includes livestock and agricultural systems by calculating on-farm emissions of greenhouse gases and carbon sequestration. It has been utilized all over the world and enables farmers to assess various farming systems to determine the impacts on GHG emissions. Step-by-step instructions for using the tool are provided in video demos [105].

5.2.3. The Farm Carbon Toolkit

This tool was created for farmers by farmers. They have been working to increase knowledge of GHG in agriculture for more than ten years. They run programs with farmers that encourage action on the ground and offer tools and services to monitor impacts [106].

5.2.4. The Ex Ante Carbon Balance Tool (EX-ACT)

This instrument is used at the project level to calculate the net GHG effects of AFOLU initiatives and policies. Several materials that facilitate the use of the tool are available on the website, including instructions, and it is available for download from the Food and Agriculture Organization (FAO) [107].

5.2.5. COMET-Farm

This is a system for calculating carbon and greenhouse-gas emissions on all farms and ranches. It runs several models to specify the sources of GHG emissions and carbon sequestration using data on a farm’s management methods as well as spatially specific information about soil and climate conditions based on USDA databases (supplied in the tool automatically). Its foundation is a set of techniques outlined in the text “Quantifying Greenhouse Gas Fluxes in Agriculture and Forestry: Methods for Entity-Scale Inventory” [108].

5.2.6. UBB Agro-Carbon Emissions Calculator

This is a digital tool created by the United Bulgarian Bank (UBB) for agricultural sustainability that may be accessed immediately and without any cost at all on the bank’s website. The cutting-edge program enables all farmers, both clients and noncustomers of the banking institution, to determine their farm’s carbon footprint—the greenhouse gases it produces, measured in carbon dioxide equivalents—in just a few easy steps [109].

5.2.7. OpenLCA 2.0.3

OpenLCA 2.0.3 is free software with influential and elastic ways to model life-cycle systems. It can calculate social, environmental, and economic indicators; has plugins that provide several more specific elements; has an open architecture that facilitates data import and export; and is one of the best open-source and free software to model the life cycle of products [110]. Customers have a significant impact on climate-change mitigation through their lifestyle decisions, particularly eating decisions that can lower CO2 emissions. Compared to a typical “business as usual” diet, a diet high in plants generates around half the amount of greenhouse-gas emissions [111]. However, at the moment, consumers find it challenging to select a diet that is climate-friendly since they are unsure of the relative emission levels of various foods [112,113]. A decreased carbon footprint is not indicated by other ecological labels, for example, the organic label [22].

5.3. Carbon-Footprint Certification

A product’s carbon-footprint label indicates how much carbon dioxide equivalent is released during production, distribution, use, and disposal. It is expected that a carbon-footprint label will communicate to consumers the GHG emissions caused by the products they select and assist them in finding low-carbon solutions. The usefulness of carbon-labeling programs in reducing greenhouse-gas emissions over the long term is debatable, and these programs have encountered various operational challenges [60].

5.4. Standards of Carbon Labels

The techniques and benchmarks used to measure CO2 emissions differ from nation to nation, from region to region, and even within a single nation or region. Globally, there are numerous standards and accounting techniques for carbon footprints, including:
  • Life Cycle Assessment: although country-specific carbon-labeling requirements differ, the Life Cycle Assessment forms the basis of the fundamental carbon-footprint estimate. There are three different kinds of LCA: input-output LCA (top–down approach), combined process LCA, and process LCA (bottom–up approach, the Hybrid approach). The input–output LCA (top–down method) is the strategy that is most frequently utilized among them;
  • Standard 01—Publicly Available Specification (PAS): the predominant standard is PAS 2050, which was the first GHG emissions calculation standard for goods and services around the globe [114]. Initiating a uniform evaluation guide for GHG assessment at the product level is the aim of PAS2050. In general, PAS 2050 acknowledges two categories of carbon-footprint accounting techniques. The first strategy is known as the business-to-business strategy because it covers all phases of production, from the “cradle” (raw materials) through the “point of sale” (gate). The “raw material”, “production,” and “distribution to company clients” are some of these steps. The second strategy is referred to as “business to customer” and includes the whole supply chain until the product’s life ends. As a result, we also refer to it as a “cradle to grave” strategy [115];
  • Standard 02—Greenhouse Gas Protocol (GHG Protocol): the World Business Council for Sustainable Development and the World Resources Institute first formed the GHG Protocol in 1998; the most recent version was released in 2011. The initial iteration of PAS 2050 and the ISO standards for LCA serve as the foundation for the GHG Protocol, a commercial method for labeling carbon. The GHG Protocol Product-Level Standard and the GHG Protocol Corporate Standard are two sets of standards for evaluating greenhouse gases [60].

5.5. Examples of Carbon-Footprint Labels

5.5.1. Carbon-Neutral Certification

A certification that is called carbon neutral is a seal of approval provided to companies after offsetting the carbon footprint according to Scopes 1 and 2. The first step of Verus Carbon Neutral is to calculate a company’s carbon footprint that is seeking carbon-neutral certification. It then offsets the carbon footprint by buying back carbon credits. This type of offsetting permits companies to offset the GHG they cannot avoid via energy efficiency and other reduction strategies.

5.5.2. Carbon-Neutral Product Certification

To achieve carbon neutrality, we calculate the carbon footprint and reduce it to zero by combining effective in-house measures and secondary outside emission reduction projects [116]. Companies that achieve the certification have successfully annulled their carbon footprint through the internationally recognized PAS 2060 [117] carbon-neutral standard or SCS’s new Certification Standard for Carbon-Neutral Entities, Buildings, Products, and Services. To help reach carbon neutrality, SCS provides comprehensive service options that include measuring the carbon footprints of your products and advising you on how to buy verified carbon offsets from reliable suppliers that support the goals of your business [118].

5.5.3. Carbon Reduction Label

The Carbon Reduction Label serves as a public declaration that a product’s or service’s carbon footprint has been calculated and certified, and the owner has made a promise to decrease that footprint over the next two years. The computed footprint will have undergone meticulous measurement and be similar based on the PAS-2050 standard and Footprint ExpertTM. A complete life-cycle evaluation, including production, usage, and disposal, will be done for this. After two years, the certification must be repeated to demonstrate that actual reductions have been made [119].

5.5.4. CarbonCare

CarbonCare supports and acknowledges the work done by businesses, governments, and other groups to combat climate change through the three processes of measuring, reducing, and offsetting carbon footprints, or MRO. The applying entity will be given labels of various degrees of emissions decrease and/or offset compared to a specified base year. The company that applies for this should have a carbon audit report that has been confirmed in line with the CarbonCare® Label Protocol, a carbon-footprint management plan, and a statement of a minimum 5% carbon-decrease obligation in place before making a first-time application [120].

5.5.5. CarbonFree® Certified

The Certification label CarbonFree® Product is intended to inform about product emissions and to recognize businesses reducing their carbon footprint. This specific label was developed to meet the needs of the rising market for environmentally friendly products as well as consumer requests for credible, clear, and easily reachable information at the point of acquisition. Carbonfund.org has developed a credible, meaningful, and ecologically positive way for businesses to deliver carbon-neutral goods to their clients by defining a product’s carbon footprint, decreasing that footprint where feasible, and counterweighing the residual carbon emissions associated with the product [121].
When consumers are devoted to reducing CO2-e emissions and are price insensitive, labels can be very helpful in guiding purchasing decisions and encouraging suitable and voluntary modifications. Labels that provide more information about emissions can also encourage societal acceptance of more intrusive policy tools. A growing understanding of how dietary choices affect climate change would provide a chance to advance climate policy [22]. The suggested climate-score label is a straightforward, five-level front-of-package categorical label (A–E, dark green to dark red) that additionally includes the precise amount of CO2-e emissions per kilogram of a specific item. These are color-coded for quick and simple information transfer. Another front-of-package label that allows for equal placement of sustainability labels is the Nutri-Score, which was first implemented in France in 2017 [122] but faces intense criticism because it does not take into account the beneficial ingredients of olive products, and it classifies them only based on fat content. Unpackaged items like fruits and vegetables might be marked on the shelf, which is where electronic labels are being used more and more. According to different studies, absolute CO2-e figures are too intangible for the majority of persons to comprehend [123]; as the unit of emissions is typically not recognized, most customers find it challenging to use these quantities as a reference when buying. Similar issues with estimating calories and nutrients per unit of weight have been considered in the area of nutrition labeling for some time [22].

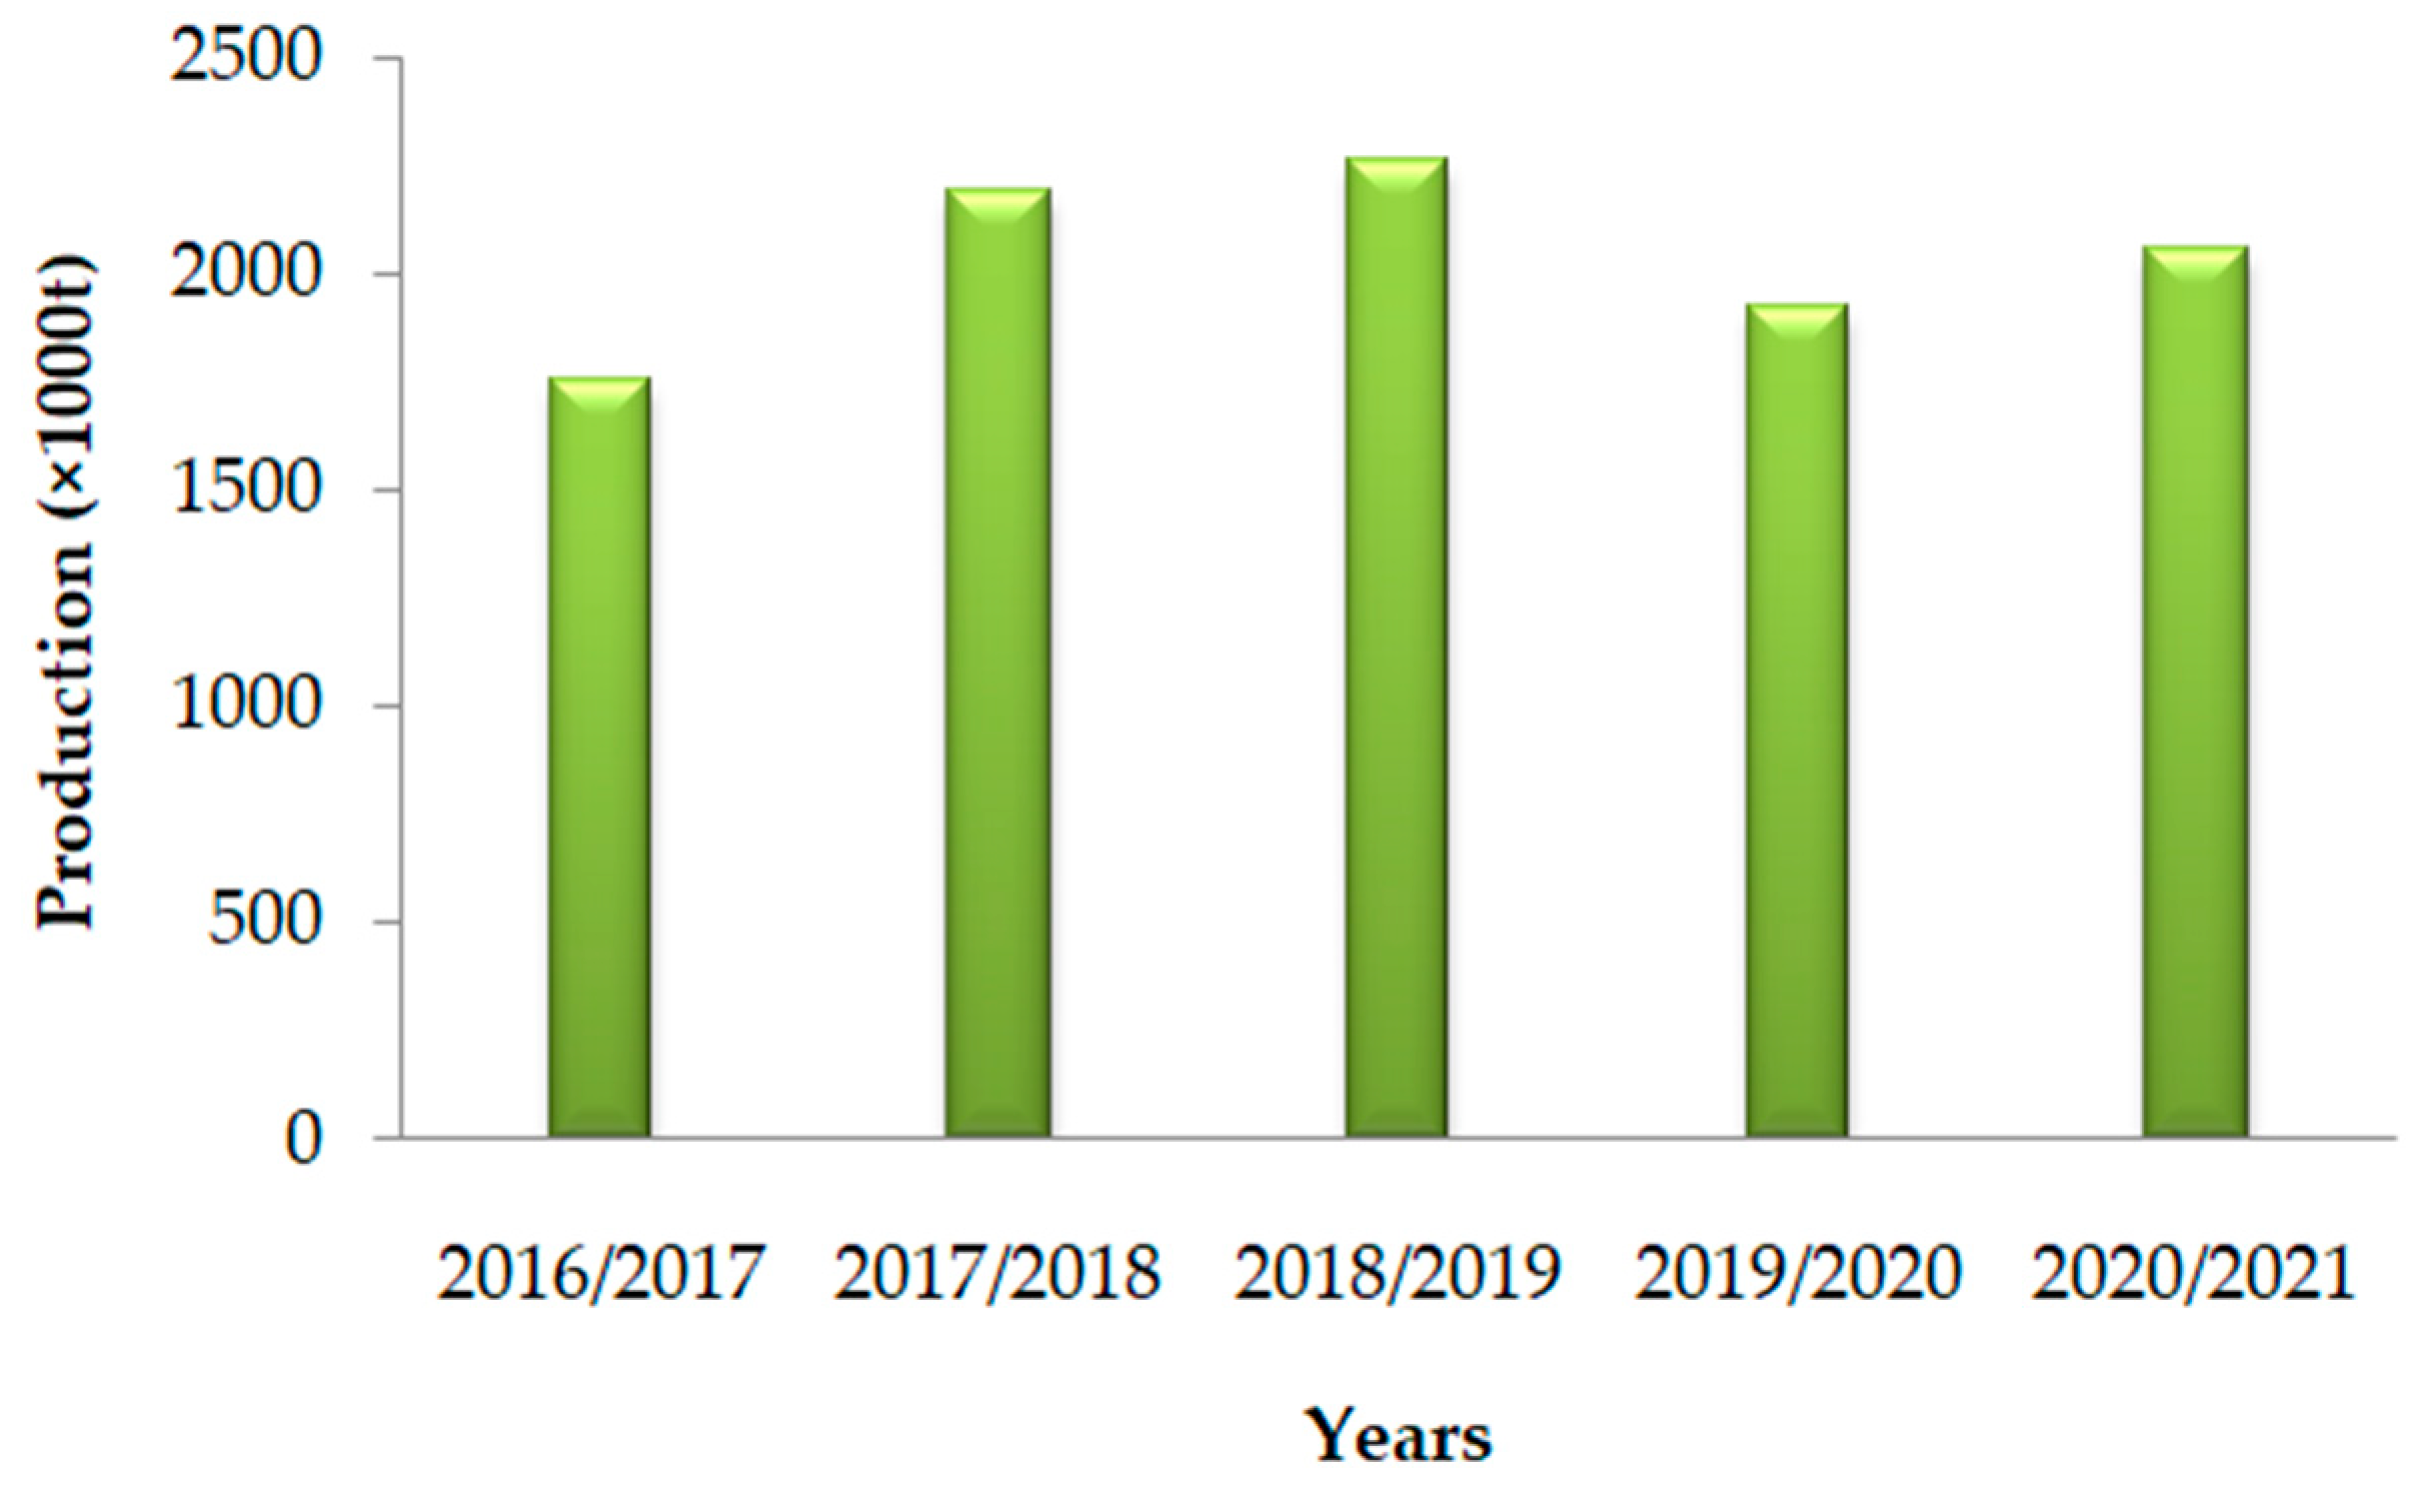
5.6. Olive-Oil Carbon Footprint

The industry of olive oil is one of the most significant agrifood sectors in the EU. Recent years have seen significant developments in this industry’s cultivation methods, extraction technology, and, most importantly, the improvement of quality and the choice of defining traits. The scientific community has focused particularly on the ecological effects related to the production of extra virgin olive oil (EVOO), in addition to those modifications principally tied to improving the quality of EVOO in terms of nutrition, organoleptic, hygiene, and typical characteristics. The olive-oil sector involves significant diversity resulting from various farming methods, production processes, and supply-chain management, as well as effects resulting from regional features [124,125].
The agricultural production phase of the system for producing olive oil has the biggest environmental impact compared to other phases [125]. Namely, the field stage of olive production might have a footprint of 460 kg CO2-e/ton of olive [126], which is higher than that of packaging and transportation [127]. When compared to the oil-extraction processing phase, 93.8% of the total CO2 produced per liter of olive oil was of fossil origin [128], which is around 1.5 to 1.6 kg CO2-e/L of olive oil [126]. The International Olive Oil Council (IOC) created an application to calculate the carbon footprint of olive oil. The tool is one of the products of the work of an expert group formed by the IOC in 2012 to quantify and report greenhouse-gas emissions based on a life-cycle assessment approach (Figure 6). According to the IOC, the effect of carbon sink (or carbon sequestration) of olive trees through biomass and soil is much larger than the GHG emissions per liter of virgin olive oil when appropriate agricultural practices (for example, no tillage, mulching of pruning residuals, cover crops, and organic fertilizers) are used. An olive grove of one hectare offsets the annual carbon footprint of one citizen; when we produce a liter of olive oil, 10.64 kg of atmospheric carbon dioxide (CO2) is captured; and global olive-oil production would captivate the emissions of a city with over seven million people. As a result, olive-oil production has the potential to aid in the fight against global warming by absorbing more CO2 from the atmosphere than it emits and storing it in the soil and biomass [129].
The calculation and communication of the CF in the olive-oil industry can provide clients who are more and more interested in environmental produce a novel, simple indicator (such as kg of CO2 emitted/sequestered for every bottle of oil bought) [130]. Even though the CO2 sequestered is released into the environment throughout other stages of the life cycle, a mean rate of 0.25 kg of carbon per kg of olives was expected regarding the biogenic carbon stored in the olive fruits [131].

6. Water Footprint

Water makes up two-thirds of the Earth’s surface and fills 1.4 billion cubic meters of space. But only 3% of that is freshwater (Figure 7), and 69% of that is trapped in glaciers and polar icecaps [132]. Since fresh water is necessary for supporting life on our planet, just around 1% of the world’s water resources are viable freshwater.
Due to the rise in global population over the past century, humanity is currently using resources and producing waste at a rate that is faster than the earth can replenish. The average global per-citizen consumption of products and services has increased, as has the global use of natural resources. Water is a natural resource that is becoming increasingly valuable throughout the world due to challenges like scarcity and overuse [133,134], which result in issues with society, the environment, and the economy [135,136]. Many nations in the world’s arid and semiarid regions are already at, or below, the 1000 m3 per person per year threshold for water scarcity [137]. Agriculture uses almost 70% of the world’s water resources, making it the biggest consumer of freshwater [138]. The Water Footprint (WF) method calculates the amount of water used (evaporated or absorbed into the product) and contaminated per functional unit, as per the CF. However, it can also be represented per day, month, or year, depending on the level of detail that is desired [139].
The WF is a measure that takes into account a consumer’s or producer’s direct (domestic water usage) and indirect (water needed to deliver agricultural and industrial goods) water use [140]. After Hoekstra presented the “water footprint” idea in 2002, the notion of considering supply chains for water use has grown in popularity [141]. The entire amount of freshwater utilized to generate the products and services consumed by a person or a community or delivered by a company is referred to as the WF of an individual, community, or business [140]; it may be computed for a specific good, for any clearly defined set of consumers (such as a single person, a city, a province, a state, or a whole country), or manufacturers (e.g., a private enterprise, a public organization, or economic sector) [23].
The two main methods for WF determination rely on (i) the LCA-based environmental impact [142] and (ii) the volumetric WF [141]. Within the latter, the green, blue, and grey water footprints are the three elements of water that are recorded in its calculation as water traces [23]. The term “blue water footprint” quantifies the irrigation water resources (surface and groundwater) evaporated from the soil and water body and transpired by the plant during the production cycle per unit yield. Consumption is the loss of water from the catchment area’s accessible ground-surface water body. Water losses occur when it evaporates, returns to a catchment region, the ocean, or is used to make a product. Consumption of rainwater (as long as it does not get lost via runoff or drainage) water per unit yield is referred to as the “green water footprint”. Given the usual contextual concentrations and the current ambient water-quality regulations, the amount of freshwater that is necessary to dilute the pollutants is known as the “grey water footprint” [141]. In agriculture, it is estimated as the amount of water per unit yield (m3/t) required to establish the N concentration in groundwater close to that of acceptable value (~0 mg N/L in natural body) after it has been increased due to N leaching, under the assumption that 10% of nitrogen fertilizer is leached [143]. The water footprint is an indicator of water usage that diverges from the traditional quantification of water removal in three ways (Figure 8). It does not account for the use of blue water, which goes back to its source. It also includes the use of green and grey water, and it is not just limited to blue water. Finally, it encompasses direct as well as indirect water usage, not just direct water use [141].
The difference between a region’s WF of production (WFprod) and WF of consumption (WFcons) must be clearly defined. The first is the total amount of water used for home purposes directly and indirectly. The second is the total amount of water used domestically through domestic consumption, including both direct and indirect water use. Virtual water flows import and export (VWi and VWe), which occur from commerce in industrial and agricultural products and bring the two into balance. Either a top–down or a bottom–up calculation method can be used to determine the WFcons. The top–down method’s formula for calculating the WFcons is as follows.
WFprod + virtual water import (VWi) − virtual water export (VWe).
The bottom–up strategy is founded on raw, unfiltered, consumer data. There are three parts to the WF: blue, green, and grey water. The WF can be expressed as a single total figure, but it is a complex indicator to express water usage, displaying various forms of water consumption and contamination in relation to time and geography [139].

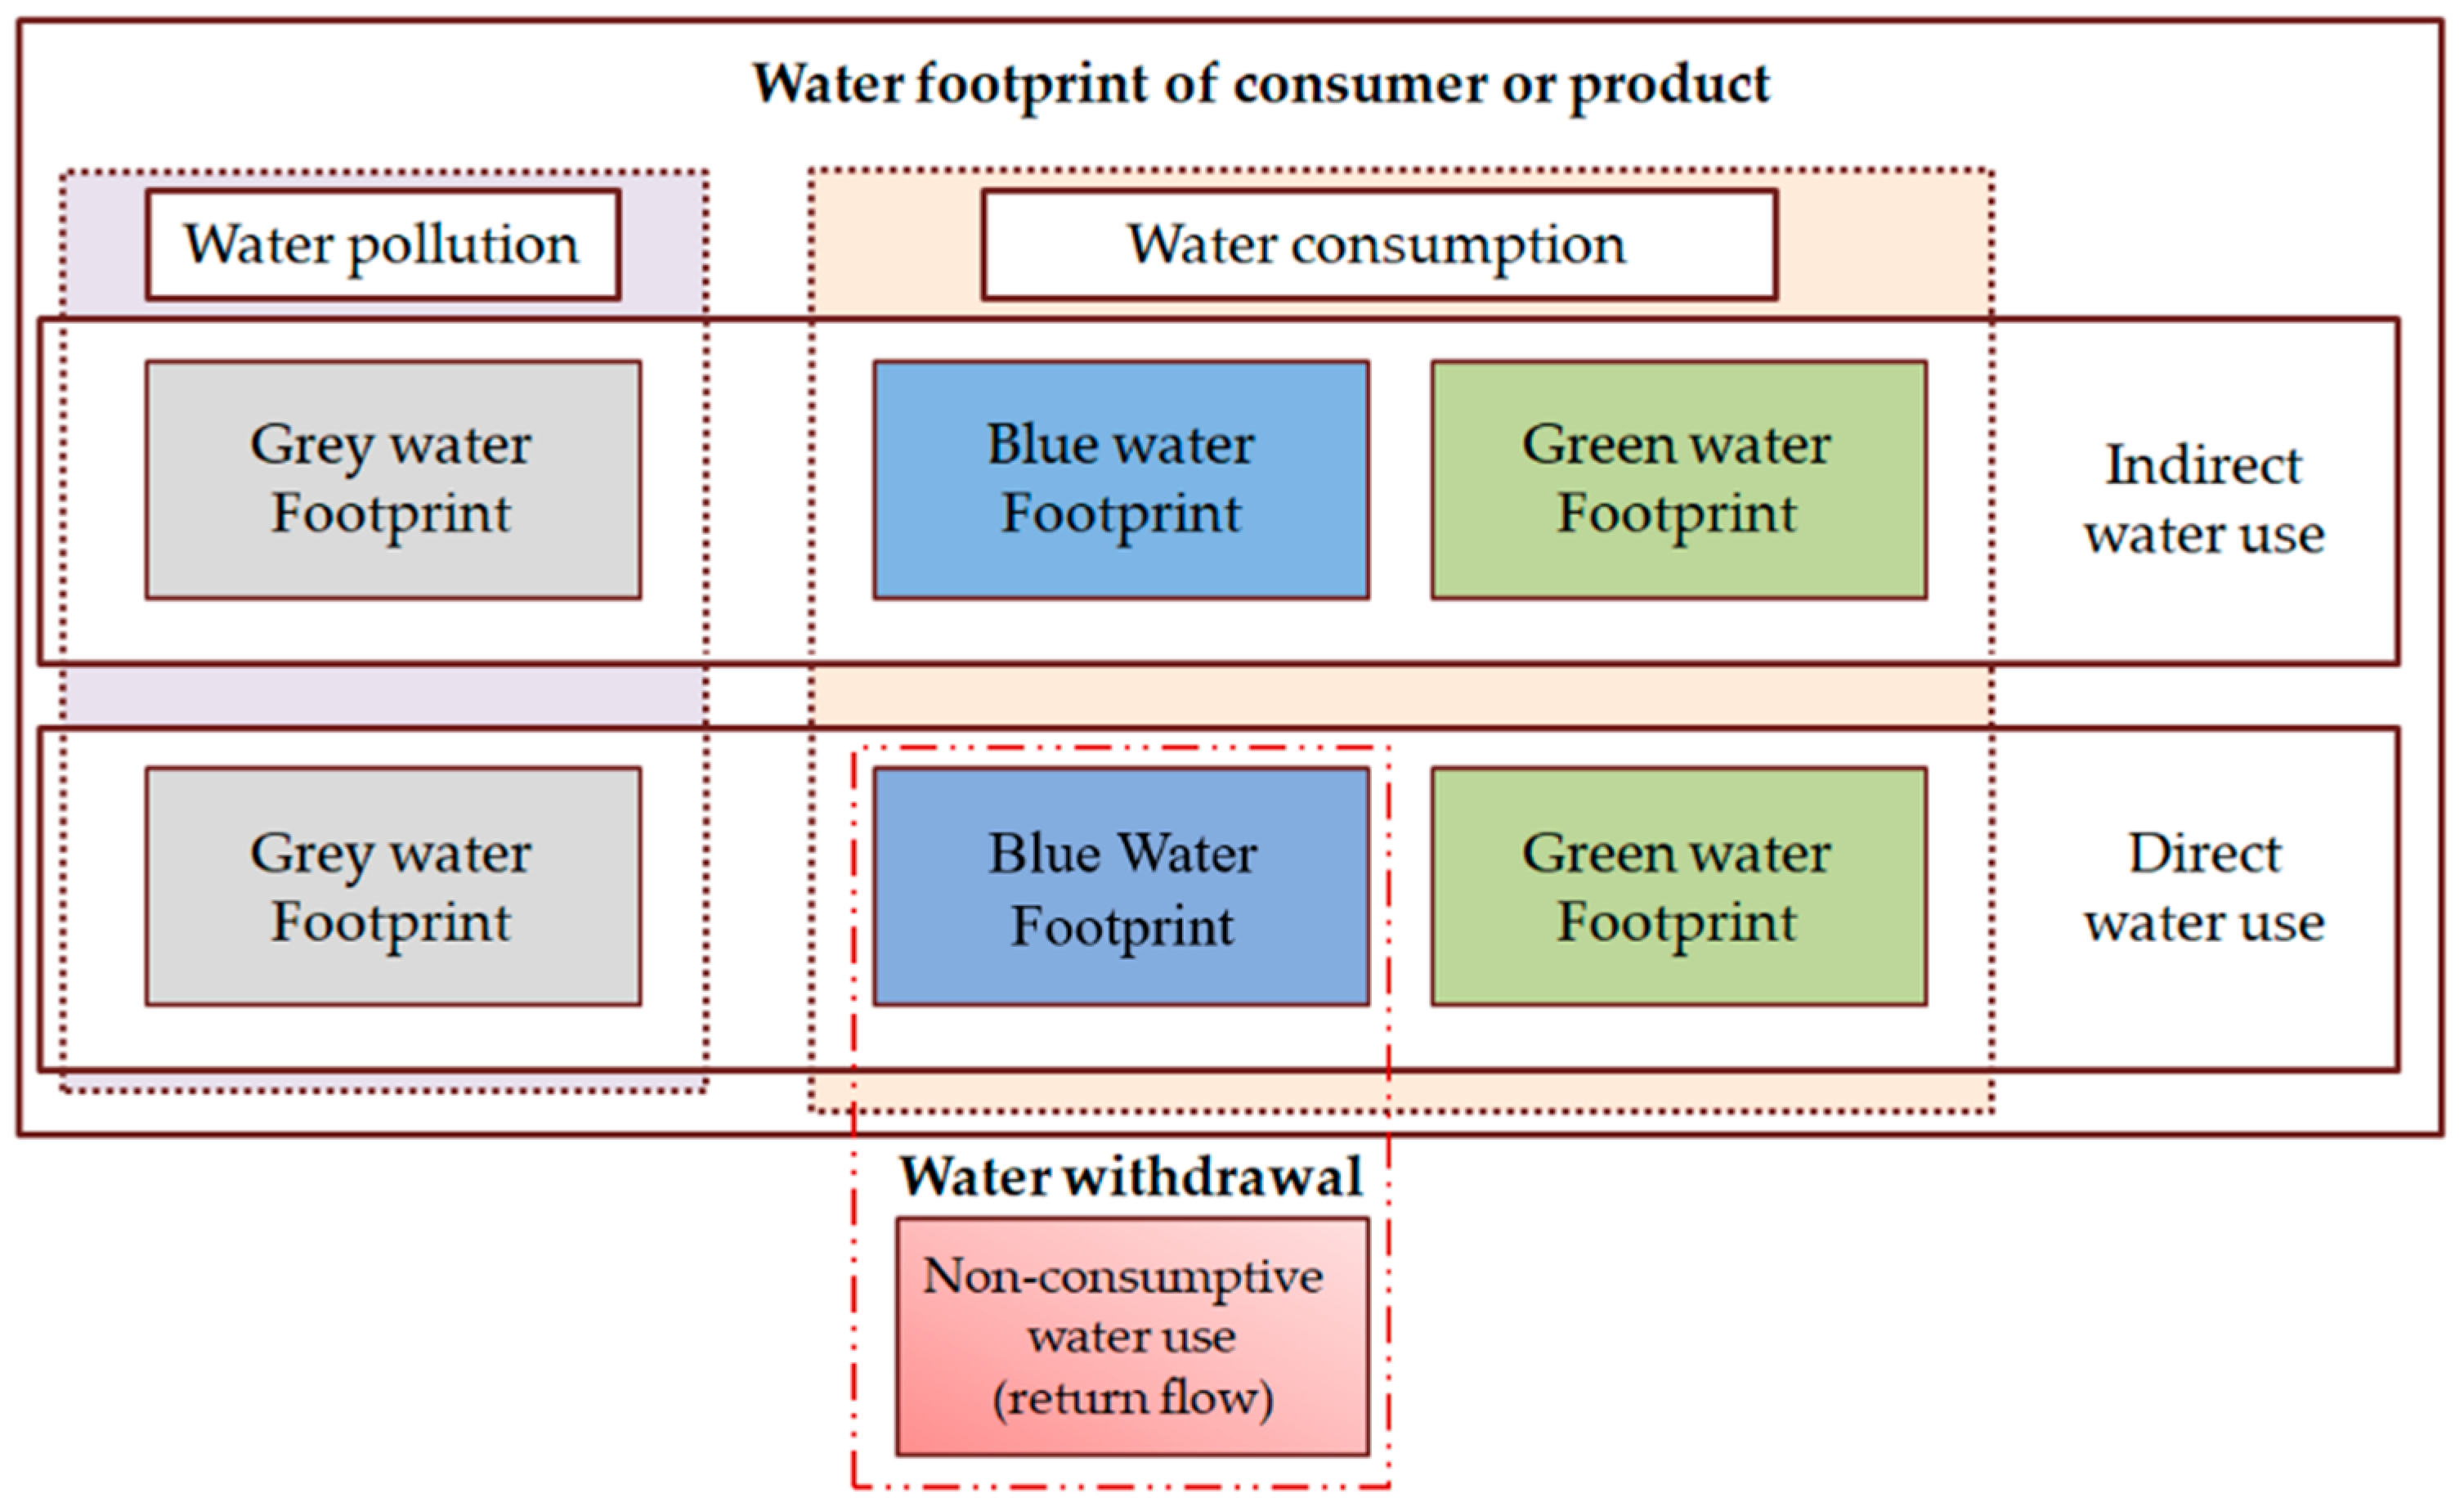
6.1. Water-Footprint Assessment

The chief aim of the water footprint idea is to highlight the unnoticed connections between global trade and the management of water resources and human consumption of water [23]. The Water Footprint Network (WFN) and LCA communities have established two basic approaches for the evaluation of the WF [140,144]. The WFN-based water footprint is useful in informing plans and actions in national and regional virtual water flow and trade; this approach can also aid in streamlining water management in the agriculture sector and allocating it as quantitative indicators. Blue, green, and gray water footprints consist of the three categories used in the WFN technique. Grey water footprints represent the fictitious volume of pollution, whereas green and blue water footprints represent the levels of water usage. As a result, we can use water footprints to calculate the consumption of freshwater and evaluate how industries’ wastewater discharges affect the environment [144].
A product’s influence on processes involving water resources, such as the procurement of raw materials, the supply chain, production, transference, use, and residue handling, is examined using the LCA approach’s water-footprint method. As a result, LCA-based water footprints could be employed to assess how products or companies affect aquatic habitats throughout their entire life cycle. A water footprint considers both the internal and external supply chains in addition to the enterprise’s water footprint [142]. LCA-linked methodologies for water footprint vary from straightforward water inventories to intricate impact-assessment models [145]. The methodologies mentioned above can generally be separated into quantitative and result-oriented water footprints. While impact-based water footprints try to quantify the repercussions derived from the consumption of water and need a description of separate flows before combination, volumetric approaches regulate the worldwide freshwater adoption of items on an inventory level. Characterization factors may indicate, for instance, a local freshwater shortage, depending on the methodology used [146], the quality of the water [147], ecosystem vulnerability [148], or the public’s sensitivity to harming human health [149].
According to Aldaya et al. (2012) [141], in the Network on Water Footprints (WFN), there are four major phases in a comprehensive water-footprint assessment:
  • Setting goals and scope: where is the largest WF location? What parts of the WF are unsustainable? Where can WF be cut back on?
  • Water-footprint accounting: What does the value chain’s green, blue, and grey WF represent?
  • Water-footprint sustainability assessment: Is the WF socially just, economically effective, and environmentally sustainable?
  • Water-footprint response formulation: How can WF be decreased in operations, the value chain, the sector, and the basin? Where should one start working?

6.2. Certification for Water Footprint

The quantity of water consumed both directly in the production process and indirectly throughout the supply chain is referred to as a product’s “water footprint”. Knowing precisely how much water is required to produce a good, deliver a service, or carry out an activity on behalf of an organization is necessary for effective water management (AENOR). The water footprint of olive production differs according to the various growing systems (intensive, traditional, and high density); the Water Footprint Network determined that olive production had a high WF value of 3015 L of water per kg [143], producing one ton of olive oil, accounting for olive oil’s 14,500 m3 water footprint [150].

6.3. Water-Footprint Label

The water-footprint label is a possible method to promote commerce and consumption in a way that is consistent with sustainable water use. A water-footprint label’s fundamental tenet is product openness. Customers might learn “the magnitude of contribution to the water use, pollution of water, and scarcity of water in various regions” with the help of such a label; this would allow them to differentiate between comparable products based on the various effects the supply chains of the products have on freshwater resources. A “yes” or “no” label considering if the produce meets a specific set of freshwater sustainability standards might serve as a simple water-footprint label. Additionally, it could offer additional specific details about the product’s exact water footprint and/or the effects of its manufacture on water quality, local water shortages, and ecosystems, i.e., the sustainability of the product’s water footprint [151]. The following section lists some of these water-footprint labels.

6.3.1. AENOR

The scope of the certification entitled AENOR is to validate the significance of the correct use of water in business strategies to preserve the ecological and societal worth of water, a rare and crucial resource for sustainable growth [152].

6.3.2. China Water Conservation Certification

One of the voluntary certifications offered by the China Quality Certification Centre is a resource-conservation certification, which certifies that products with the “JIE” suffix adhere to relevant certification standards for water conservation. The scope of the Water Conservation Certification includes industrial water treatment, urban water use, irrigation of agriculture, unconventional water-resource use, and more. China conducts resource-conservation certification to influence the public’s consumption of energy-saving items as well as the spread of cutting-edge technologies [153].

6.3.3. Smart Approved WaterMark (SAWM)

This is a program for certifying water efficiency that was established in 2004 at the height of the Millennium Drought. The main goal of the SAWM was to solve the problem of reducing domestic water use through the identification and certification of water-efficient technology and services, as stated in the National Water Initiative. The badge gives businesses a competitive edge in the market and encourages consumers to shop intelligently [154].

6.3.4. WaterSense

It provides labels to products that meet the EPA’s requirements for water performance and efficiency and is supported by independent, third-party certification [91].
To achieve freshwater sustainability goals, a tag giving the three diverse water footprints (green, blue, and grey WF) would be more effective compared to one presenting only the collective water footprint because offers customers the option to consider the comparative values of the water used or contaminated in the manufacturing process [151].
Governments may enforce measures like tax payment or obstacles to importation considering the footprint of water, but a label may be enough to motivate customers. This type of label could serve as the foundation for consumers to have higher awareness and for governmental policy choices [151].

6.4. Olive and Oil Production Water Footprint
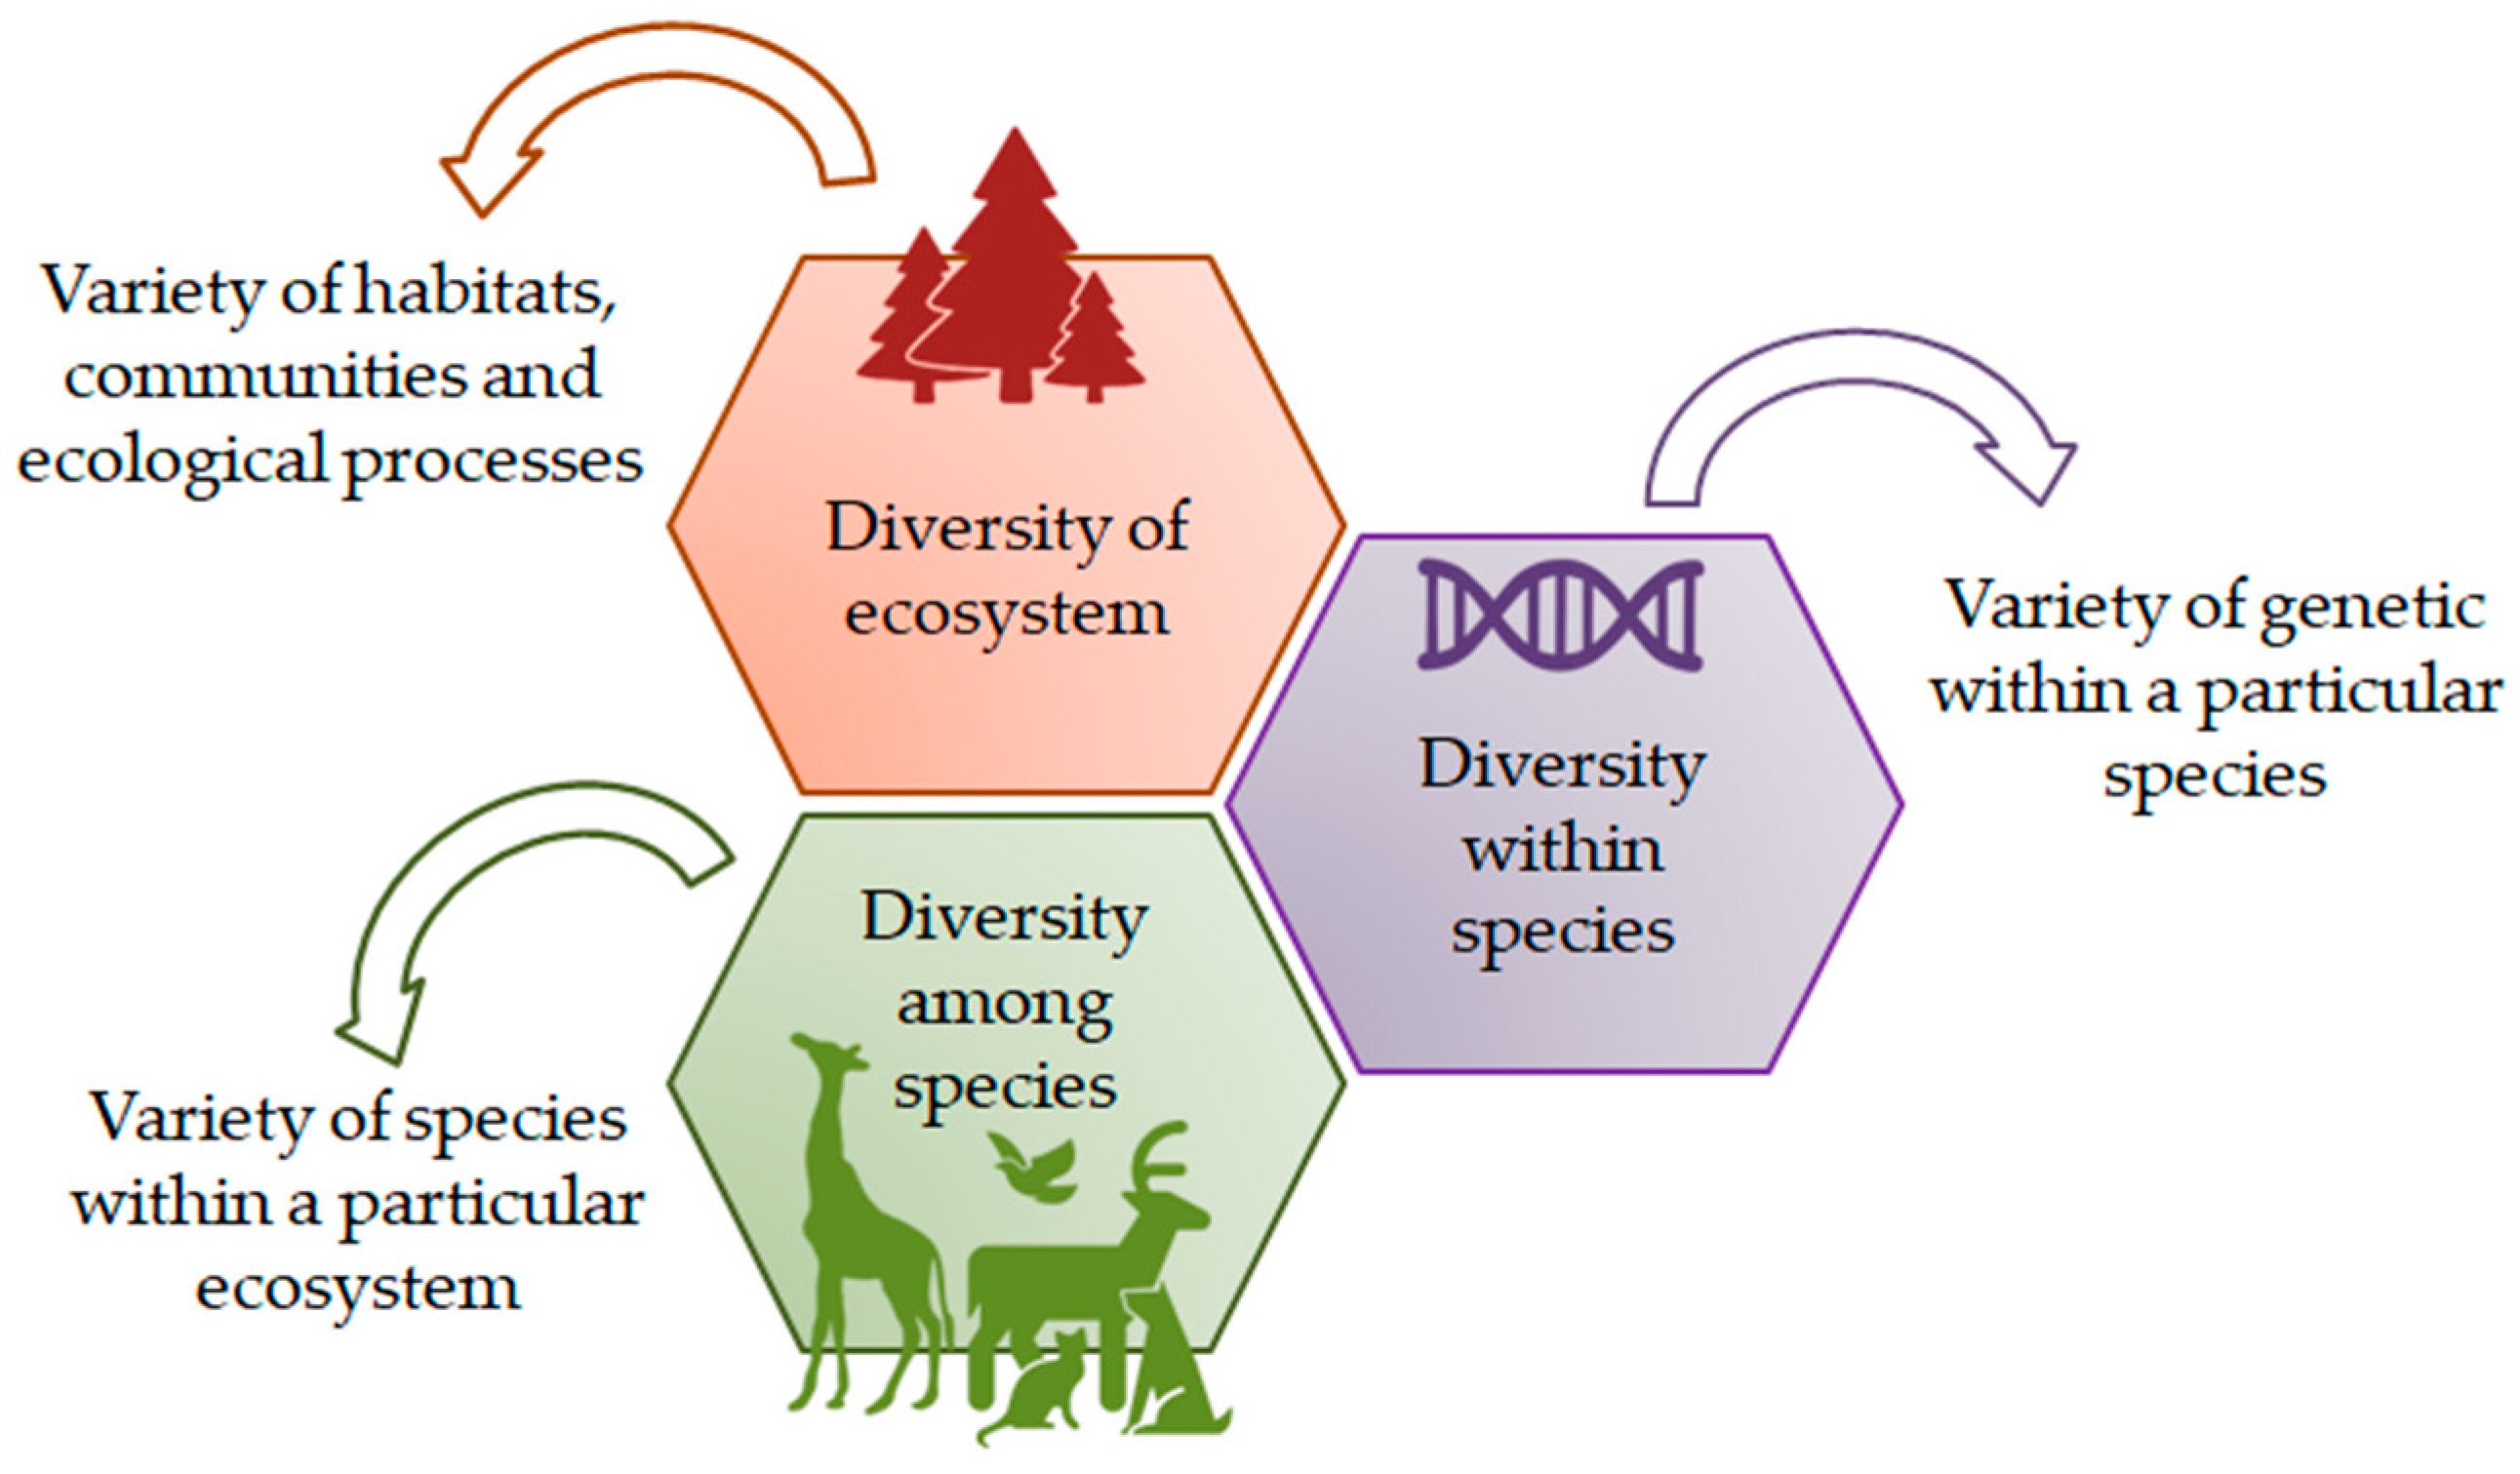
The footprint of water in olive-oil and table-olive production varies depending on various factors such as plantation density, climate, irrigation practices, and production methods. Blue water usage can be significant, especially in regions where irrigation is needed to supplement rainfall. On the other hand, in the case of rainfed olives, the green water footprint is markedly higher compared to that of the irrigated ones. When we produce one ton of olive oil, we consume 257 to 3000 m3 ton−1 of green water (average value 1418), 150–1852 m3 ton−1 of blue water (average value 1245), and it generates 1400–1600 m3 ton−1 of grey water [155].
In a rainfed olive plantation (about 330 trees per ha), it was estimated a long-term mean impact of about 1.02 m3 per kg yield and 0.16 m3 kg−1 for green and grey WF, respectively [156].
According to [157], for one liter of olive oil that is bottled, over 99.5% of the water footprint is connected to the production phase, and the other components, such as the bottle, label, and cap, are responsible for less than 0.5%. The components of the olive-production water footprint are as follows. Rainfed systems have a 71% green water footprint, and irrigated systems have a 12% green water footprint, 7% blue water footprint, and 10% grey water footprint. To ensure the long-term availability of blue water, it is crucial to consider justifiable water use in olive production [158].

7. Biodiversity

The Convention on Biological Diversity (CBD) defines biodiversity as “the diversity between living organisms from all foundations, counting, for example, marine, terrestrial, as well as other aquatic ecosystems and the environmental systems to which they belong; this encompasses variety within species, between species, and of ecosystems” (CBD). Genetic, population/species, community/ecosystem, and other components can all be used to quantify biological variety; each has compositional, structural, and functional characteristics. The uniqueness and diversity of elements in every component of biodiversity are referred to as composition. The actual arrangement or pattern of the pieces is referred to as structure. Function describes the interaction of the elements with ecological and evolutionary processes [159].

7.1. The Three Biodiversity Components

Three different components represent biodiversity (Figure 9).

7.1.1. Diversity of the Genetic Component

Heritable variation within and between populations of organisms is a prerequisite for genetic diversity. Gene and chromosome mutations provide new genetic variation in individuals, and in sexually reproducing organisms; recombination can disseminate this variation throughout the population. At all levels of an organization, other types of genetic variation can be found, such as the amount of Deoxyribonucleic acid (DNA) per cell and the structure and number of chromosomes [160].

7.1.2. Population/Species Diversity

The diversity of the population/species component refers to a community’s species diversity and relative abundances [161,162]. In general, there have been two methods for determining the number of species (species richness), both of which take into account the relative abundances of individuals within each species (species abundance). The creation of mathematical indexes, commonly referred to as diversity indices, has been one approach; the comparison of observed patterns of species abundance to theoretical models of species abundance is another [163].

7.1.3. Community/Ecosystem Component Diversity

This refers to a collection of several species, guilds, and patch types that coexist in a given space or environment and are actively interacting through trophic and spatial biotic and abiotic connections. The explicit inclusion of abiotic components in ecosystems further distances them from genes and species [160]. The relative abundance of species and guilds within a community can be used to determine a component’s composition. Spatial geometry and the arrangement of patch types can be used to determine a component’s structure, and disturbance regimes like fire and flooding can be used to determine a component’s function [159].

7.2. Biodiversity and Ecosystem Services

Ecosystem services are described as the assembly of positive results that nature delivers to society. Biodiversity is essential to ecosystems’ function and service delivery. According to the FAO, they are grouped into four categories of services:
  • Provisioning services are the physical benefits humans receive from ecosystems e.g., supply of water, food, wood, fibers, and fuels;
  • Regulating services represent the positive effects gained by regulating ecosystem procedures, e.g., regulating the fertility of soils, the quality of air, pollination of crops, and flood control;
  • Supporting services are essential for producing every other ecosystem service, e.g., when living spaces are provided to plants and animals, when diversity of species is allowed, and when genetic diversity is maintained;
  • Cultural services are intangible positive effects humans get from ecosystems, e.g., for engineering and aesthetic stimulus, spiritual happiness, and cultural identity.
The annual economic benefit of every ecosystem service globally is projected to be USD 16–54 trillion [164]. Preserving biodiversity in agroecosystems is crucial to maintaining the ecosystem services, which are essential for maintaining agricultural productivity.

7.3. Biodiversity Conservation and Agriculture

Biodiversity has been in sharp decline in recent decades. The main drivers of biodiversity loss, according to the Commission Staff Working Document “Impact Assessment”, a companion document to the “EU Biodiversity Strategy to 2020”, are habitat loss, pollution, overexploitation, invasive alien species, and climate change. From this list, it is clear that agriculture is among the key contributors to biodiversity decline, as it is involved in all of the above factors as one of the main drivers of these impacts. In a globalized agrifood market, agriculture has been intensified, and the consequences of this intensification are usually aggressive for biodiversity. Land uses have been changed; natural ecosystems have been lost; water is overexploited and polluted; and soil is overexploited, polluted, and lost. Moreover, intensive farming practices cause genetic erosion of agricultural biodiversity; of an estimated 350,000 higher plant species, around 80,000 are eatable, though, only around 150 are commonly grown, either for human or animal consumption. Of these, 30 produce 95% of the calorie and protein intake [165]. Ecosystems in between or surrounding farms are also affected by agricultural activity, not only by the reduction of their surface area, but also by the loss of connectivity for their members, or by direct effects such as water abstraction, eutrophication of water, effects of pesticides, etc.

7.4. Measuring the Effect of Farming Practices on Biodiversity

Measuring the effect of agriculture or farming practices on biodiversity is a very multifaceted mission, which can be estimated via different methods, although none are completely accurate or exhaustive. The complexity of ecosystems, even agroecosystems, makes it hard to regulate which organisms or what kind of interactions to monitor. In addition, the effects of agricultural activities are very varied and may be visible at different temporal and spatial scales, varying both in terms of the organisms potentially affected and the timing of the effects. Moreover, different practices can have both direct effects on one or several species, but also indirect effects by affecting the food chain or unbalancing the ecosystem.
On the other hand, obtaining accurate and reliable data on biodiversity in a given area is a great challenge, as in general, this information collection, in addition to an adequate sampling design, requires time, resources in the field, and expertise for the correct identification of records and interpretation of data. In addition, biodiversity can be affected by a combination of aspects extrinsic to the agricultural activity itself, such as climate change, pollution, or the effects of other activities of people on nature. The most direct, and at the same time the most difficult way to determine the impact of agricultural practices on biodiversity is to monitor the species present, sustained over time, in a way that reflects variations that can be attributed to different forms of agricultural management. The most common way, at least when we talk about environmental certification, is to assess the agricultural techniques used and to relate each of them to a greater or lesser impact on biodiversity. Another more general method for determining large-scale impacts is to assess habitat loss in favor of the favored agroecosystem or to estimate the degree of homogenization of a region, as an indicator of the overall loss of habitats, both natural and other agricultural habitats other than the dominant one.

7.5. Biodiversity Certification

The certification of the biodiversity footprint of farming activities has been less developed compared to other types of environmental footprints. Until recently, there were no standards directly aimed at biodiversity conservation, but different standards that included, among their certification criteria, aspects related to positive practices for biodiversity. Generally, these standards look at a very wide range of criteria and do not always include effective or relevant indicators in terms of estimating the impact of agricultural practices on biodiversity, or the actual benefit generated by potential good practices. An in-depth study of 36 certification bodies, 11 company policies, and 54 standards concluded that, in most cases, key concepts were not used to assess the effectiveness of the standard or policy in biodiversity conservation. Aspects such as a net decline or a net increase in biodiversity or the application of the mitigation hierarchy are rarely used, while more indirect aspects, such as the potential for ecosystem degradation, overexploitation of natural resources, protection of certain species, etc., are generally studied [166].
In general, the different certification schemes focus on aspects that are beneficial to biodiversity, but often lack direct indicators of their effect on biodiversity and are based on compliance with known positive practices. Among all these practices, the ones considered most effective are those linked to (i) the prevention of habitat destruction and degradation (or its restoration), such as restriction of land use changes, protection of certain habitats, protection of aquatic areas or water bodies, or maintenance of a proportion of ecological infrastructure and compensation areas; (ii) those directly linked to the protection of certain species, like species conservation measures and species-friendly management of ecological infrastructure, and (iii) biodiversity-friendly farm-management techniques, such as maintaining herbaceous cover on permanent crops.

7.6. Biodiversity Labels

7.6.1. Sustainably Grown

Concerning biodiversity, only generalities are indicated about land stewardship or the protection of the International Union for Conservation of Nature and Natural Resources (IUCN) red-listed species and their habitats, but no measures are specified. It has a very broad scope of action but is insufficient in terms of biodiversity certification (Certification Standard for Sustainably Grown Agricultural Crops|SCS Standards).

7.6.2. Nordic Swan Ecolabel

The Nordic Swan Ecolabel encourages biodiversity preservation and wise use of natural resources. By demanding that biological raw materials be acquired sustainably, it helps to safeguard biodiversity. The objective is to prevent the extinction of species and the degradation of ecosystems while ensuring that the supply of biological raw resources is balanced with regeneration, according to reliable third-party standards and certification programs that adhere to specific guidelines, including the following.
  • International laws and treaties must be complied with by manufacturers;
  • A neutral third party verifies that the business and its products adhere to the criteria;
  • The raw-material supply chain must be traceable from the extraction site to the finished product.
To prevent environmental burden shifting, the Nordic Swan Ecolabel also ensures that requirements addressing other environmental challenges, such as climate change, do not impact biodiversity [167].

7.6.3. High Environmental Value (HVE)

This ensures that all farming methods employed on a farm conserve the natural ecosystem and minimize the impact on the environment (soil, water, biodiversity, etc.). The Rural and Maritime Fishing Code recognizes this as a commendable mention, much like “mountain product” or “farm product” does. Farmers use a voluntary strategy to spread the word about their best practices [168].

7.6.4. Rainforest Alliance

The Rainforest Alliance sustainable agriculture standard 2020-RA-Sustainable-Agriculture-Standard-Farm-Requirements.pdf [169] has renewed the standard after joining the Rainforest Alliance with UTZ certification. It includes protection measures to ensure the conservation of natural ecosystems and protected areas. It requires the implementation of a self-produced plan to conserve the natural ecosystems. It set up rules to avoid damaging wild species. It also introduces measures to specifically preserve riparian buffers, and it is focused in various areas globally, but not in the Mediterranean or olive areas.

7.6.5. LEAF

LEAF is present in several Mediterranean countries (The LEAF Marque Standard|LEAF; Linking Environment and Farming). The standards cover multiple angles, from soil management and fertility to community engagement, also including energy efficiency and pollution control. From the point of view of biodiversity, it is included in the section “Landscape and nature conservation”. For this reason, farms should have a detailed map referencing key features like waterbodies, protected or high conservation areas, seminatural areas, a list of important species recorded in the area, traditional buildings, etc. A landscape and nature conservation and enhancement plan must be implemented, identifying actions to conserve habitats, and linked to the Biodiversity Action Plan if it exists at the local area or the country level. It must identify key species and select four of the focus species. It includes measures to ensure food and habitat for farmland birds all year long. Forty-nine percent of the certified businesses monitor native species, and this monitoring is done by the responsible businesses (farmers).

7.6.6. Bird Friendly

The Smithsonian Bird Friendly certification is focused on two products, coffee and cocoa. It was the first one specifically focused on biodiversity conservation. The certification criteria, once again, focus on agricultural practices. It requires the use of shade varieties of coffee, including criteria about the canopy height, foliage cover, and floristic diversity, and also about vegetation structural diversity. The cultivation must also be organic, to guarantee the absence of chemical pesticides (Normas para la produccin, el procesamiento y la comercializacin de caf bajo sombra “Bird Friendly”, biolatina.com). It does not apply direct biodiversity monitoring.

7.6.7. Olivares Vivos

It is the only certification specifically aimed at biodiversity and whose indicators reflect the net gain of biodiversity in different groups of flora and fauna. It requires:
The biodiversity measurements and the elaboration of the action plan are carried out by the certification body, with specialized personnel, while the implementation of the action plan is the responsibility of the farm, although with the advice of the certification body. It issues two certificates: the first, “In the transition to Olivares Vivos”, which guarantees the correct execution of the action plan, and the second, “Olivares Vivos”, which certifies that the plan has been implemented and that the initially established biodiversity recovery objectives have been achieved. This is a new certification on the market, which comes after several years of intense research in the field of ecology and environmental restoration [170,171,172,173], as well as market studies aimed at guaranteeing its commercial viability. Another differential fact of this certification is that it arises from a conservation project integrated by different nonprofit organizations, initially launched by SEO/BirdLife, the University of Jaén, the Spanish National Research Council, and the Provincial Council of Jaén, which developed the certification in Spain. Afterward, the University of Évora (Portugal), D.R.E.AM Italy, and ELGO DIMITRA (Greece) joined the project to develop the work for its implementation in other olive-growing areas of the European Mediterranean.

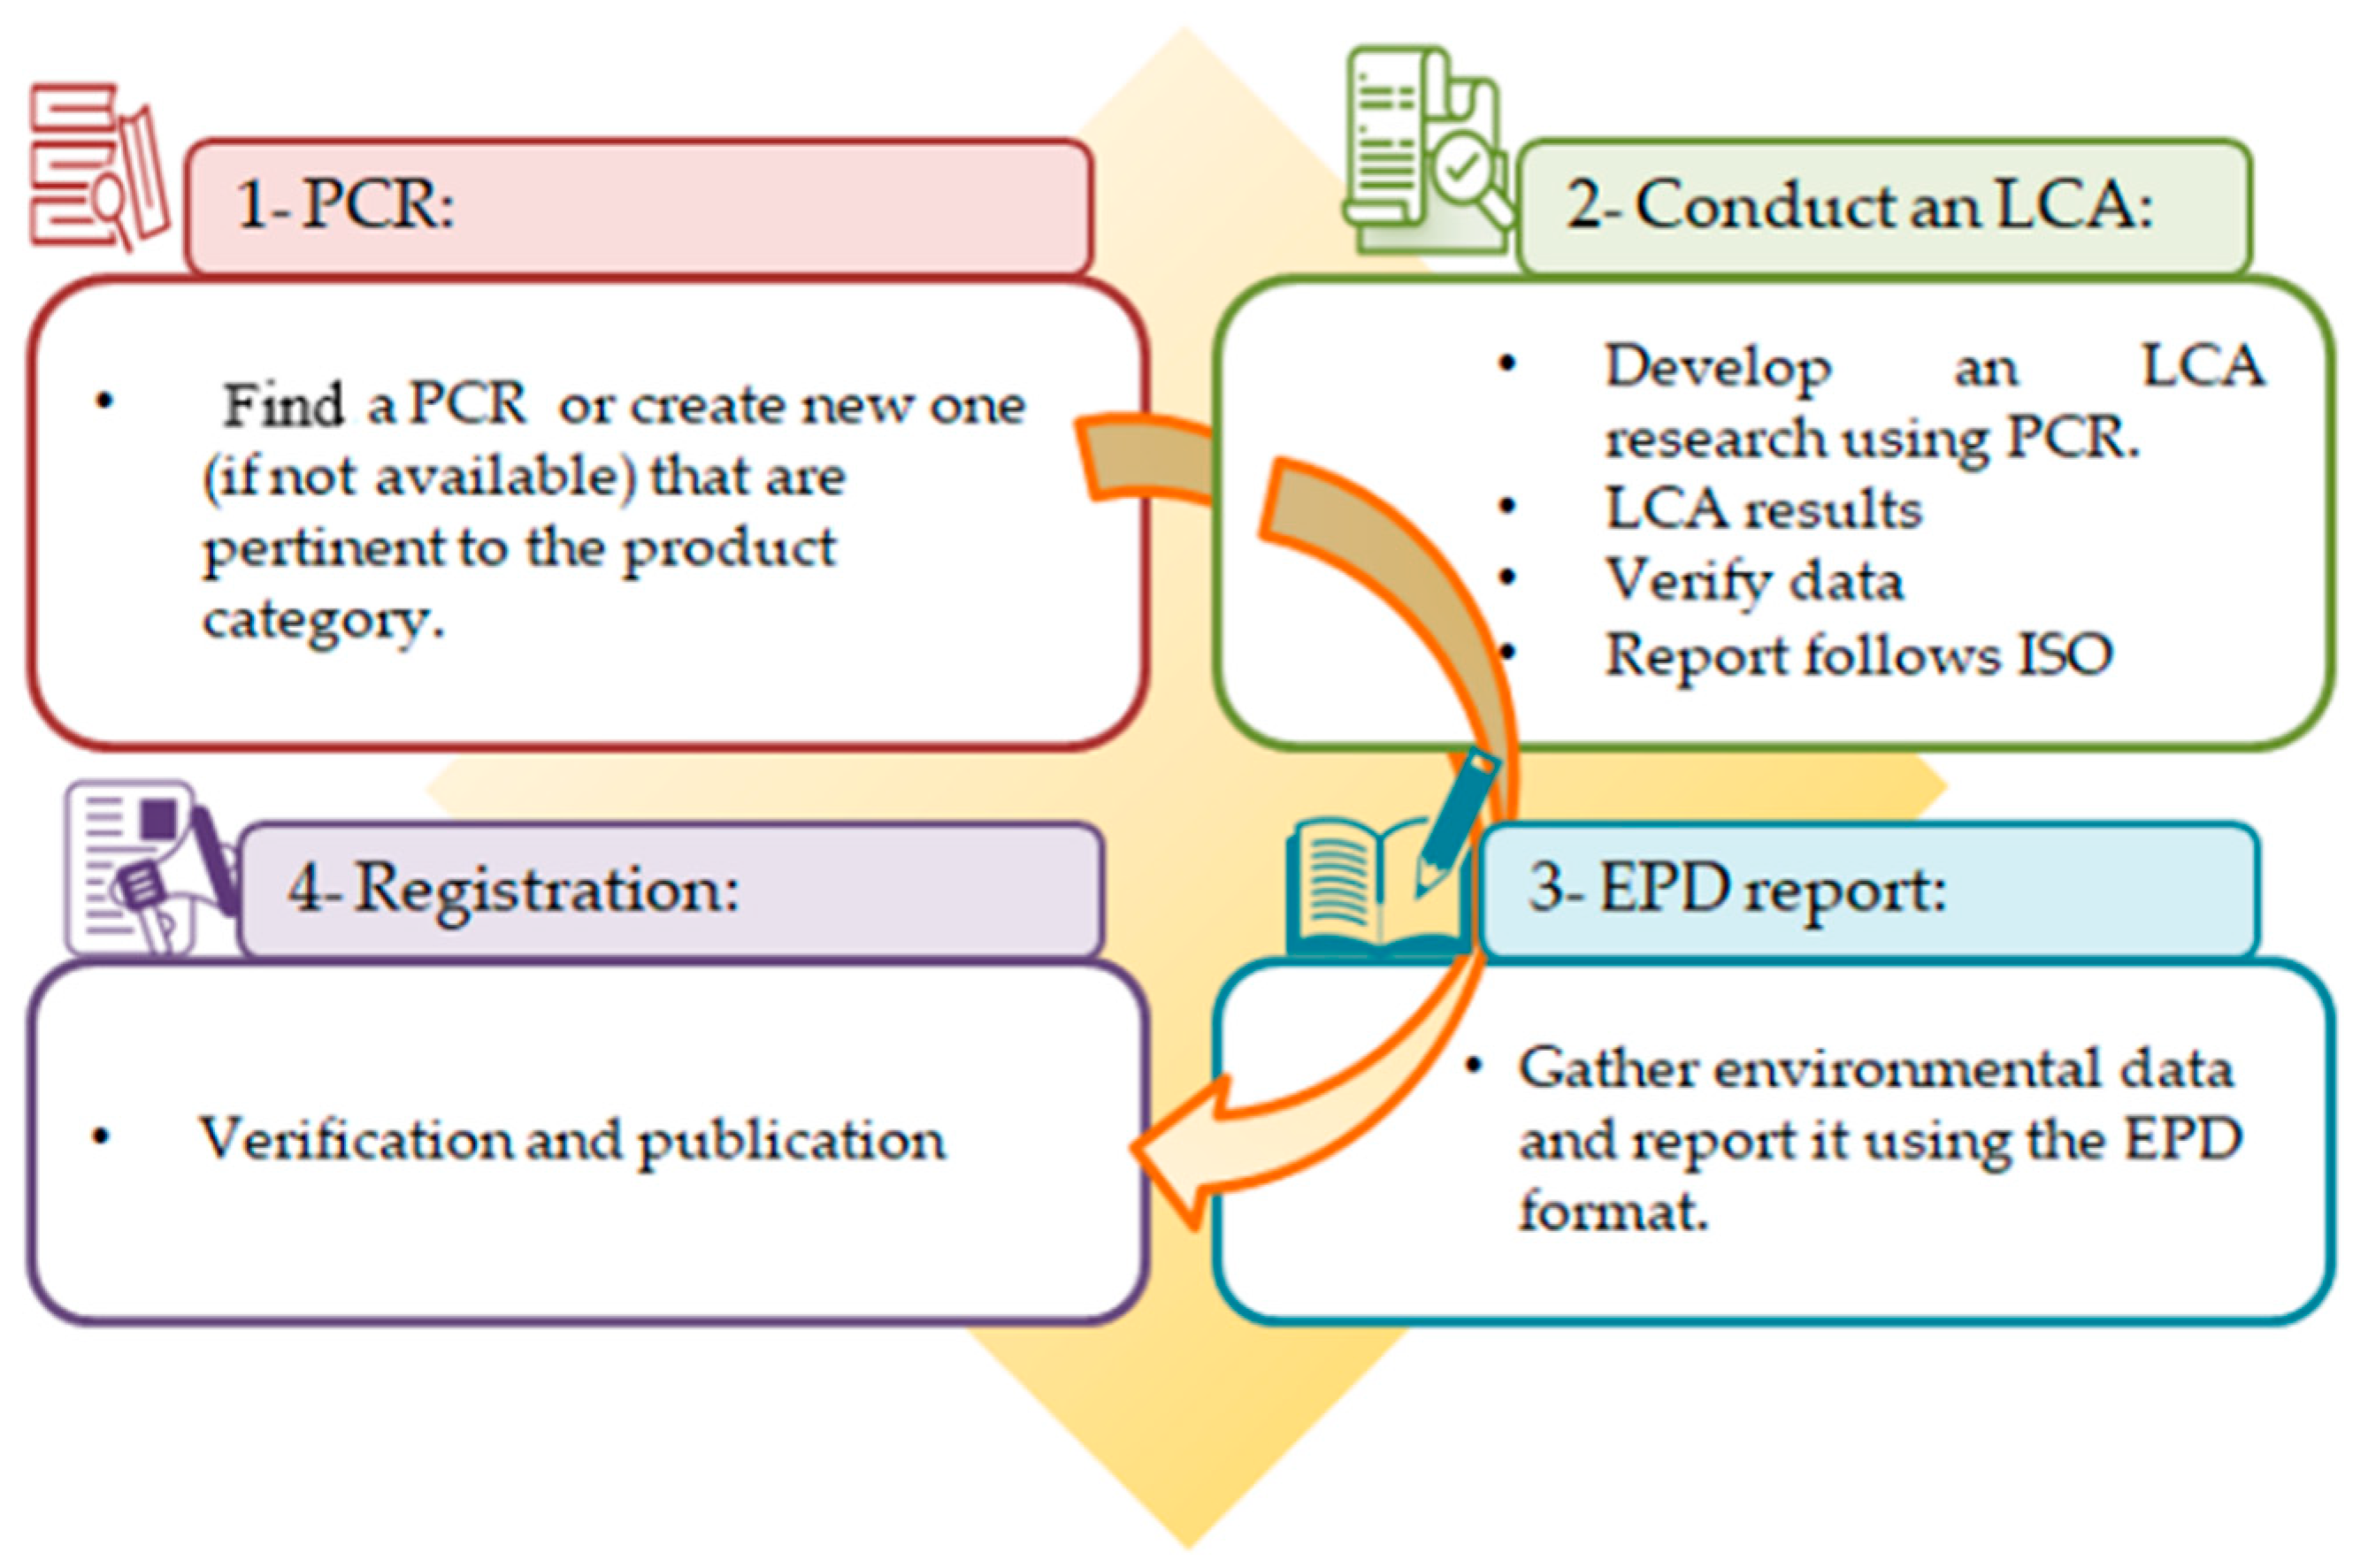
8. Environmental Product Declaration for Olive Oil (EPD)

A validated and registered document known as an Environmental Product Declaration (EPD) conveys transparent and comparable information on the environmental effect of items in their lifetime. A program that has as its basis ISO 14025, such as the International EPD® System, allows for the creation and registration of EPDs [174]. An Environmental Product Declaration’s overarching objective is to offer pertinent, validated, and comparable information to satisfy varied consumer and market needs.
A life-cycle assessment of the produce should be completed to characterize the environmental performance of the product from a life-cycle viewpoint when creating an EPD. The LCA study findings and other details needed by the reference Product Category Rules (PCRs) and General Programme Instructions (GPIs) must be assembled in the EPD reporting format. PCRs are papers that specify the guidelines and necessities for creating the EPDs of a particular class of goods and services. After that, an authorized independent validator must approve the EPD before it can be listed and announced in the International EPD System via the EPD Portal. EPDs cover the entire LCA of products and services, in contrast to other reporting formats like self-declared labels and eco-labels, which just report a portion of a lifespan viewpoint.

8.1. EPD® System

The steps for creating and presenting an EPD in The International EPD® System are summarized in Figure 10.
Environmental management systems (EMS), green public procurement (GPP), business-to-business communication, ecodesign, building assessment schemes, and business-to-consumer communication are some of the potential uses and applications of the EPD. Various EPD types include a single-company and product-specific EPD, which is the most typical kind of EPD. It describes the life cycle’s environmental impact of one or some very comparable items from a single manufacturer and is based on a reliable PCR. Project- and product-specific EPDs are helpful when users of the EPD want specific data for a particular project or product (such as in public procurement) and when, for example, the transportation calculation would vary from the one reported in a verified EPD.
A group EPD may contain products that are similar and made by the same business. Comparable foodstuffs from the same or multiple production places included in the identical PCR and produced by the same corporation with the same key processes in the core procedure could be reported in the same EPD with the prerequisite that the acknowledged ecological performance indicator differences between the included products do not differ by more than 10%. A sector EPD, also known as an industry-average EPD, is created by an industry association and lists the average product of numerous businesses in an undoubtedly defined industry or geographic region. Different EPD types can be found:
  • Machine-readable EPD: an EPD that has been converted into a machine-readable format contains some of the information from the original EPD. The data is kept in an independent database maintained by the International EPD® System in an XML file format. This database may be utilized for many applications and will provide new chances for the use of the communication of the ecological efficiency of products;
  • ECO EPDs from the ECO Platform: ECO EPDs are EN 15804-compliant EPDs that have been issued by recognized members of the ECO Platform EPD Program;
  • Precertified EPD: during the creation of a PCR for a novel produce class, the precertified EPD is the first step to releasing the environmental data about a product.

8.2. Olive EPDs

8.2.1. “GranFruttato” Extra Virgin Olive Oil Monini S.p.A. Environmental Product Declaration (EPD®)

Published in 2016 and valid until 2026, the brand MONINI stands for the Italian olive-oil tradition. It can conserve the most authentic examples of Italian oil art and promote the culture of extra virgin olive oil as a hallmark of made in Italy [176].

8.2.2. “Bios” Extra Virgin Olive Oil Monini S.p.A. Environmental Product Declaration (EPD®)

Bios extra virgin olive oil is made from olives that have been farmed organically and have received formal certification from the International Institute of Italian Ethics and Environmental Certification (ICEA).

8.2.3. Borges Extra Virgin Olive Oil Environmental Product Declaration (EPD®)

The Borges International Group (BIG) is an organization with a global reach. Currently, BIG is present on all five continents and has subsidiaries in the following nations: Spain, Tunisia, Portugal, the United States of America, Singapore, Brazil, India, France, China, Russia, Egypt, Morocco, and Italy. Through its sales network, BIG’s global presence is easily accessible in more than 110 nations. This EPD was published in 2016, revised in 2017, and is valid until 2026. Since this product does not contain any preservatives or additives, it exceeds 99% of the total contents listed in the Environmental Product Declaration, following the relevant national and European laws [177].

9. The Environmental Footprint of the Olive

Olive ecosystems could store CO2 at an amount close to 12.2 t C ha−1 per year as biomass, making it a crucial and important crop to mitigate climate change (see [178] for review). Under sustainable practices, a large amount of carbon might also be sequestered in the soil (up to about 1.0 t C per year) [179]. Accounting for these, the carbon sequestration ability within an LCA-based methodology would support the development of a more complete valuation of the olive sector’s ecological sustainability. The specific features of olive trees to be considered for new incorporation between several ecological effect assessment methods have been discussed in [178]. Briefly, it was pointed out that, for harmonizing methodologies that are based on LCA, the European Commission initiated the Product Environmental Footprint Category Rules (PEFCR) project in 2014. The project included olive oil inside a background of “cradle to grave” valuations of the concluding products’ footprint with a duration of life of over 100 years. The PEFCR project considered, only for olive and cork, the biological function of plants for captivating CO2 from the atmosphere throughout the field stage, accounting for the carbon sequestration of the olive tree biomass that happened during the production phase of olive.
The inclusion of olive biomass was based on its lifespan, which is greater than 100 years. However, a regular enclosure of biogenic carbon of olive-tree biomass in LCA is hampered by alterations in olive-tree farming schemes, such as the plantation density and lifespan duration, which impact the carbon-sequestration capability. Hence plantation density ranging from super-high-density systems (>1500 trees ha−1), traditional (centuries-old) systems (80–100 trees ha−1), and intensive (200–500 trees ha−1) systems create uncertainty on carbon sequestration’s abilities. According to the PEFCR, the modeled lasting soil carbon storing (e.g., via the RothC model) could be taken into account for carbon credits. However, the variable soil features (e.g., texture, clay, and moisture), as well as the environment (e.g., rainfall and temperature) and cultivation system (e.g., tillage and no tillage) suggest that the implementation of this type of modeling process could be specific, limiting its wider application.

10. Limitations

The present study was designed to review the literature on voluntary environmental certifications to support the ecological transition of agriculture with the various operational schemes identified. However, this study did not pursue a systematic metanalysis on certification schemes analyzing, for example, their share of application, differences in their deep structure, and/or constraints explaining their high/poor usage. In addition, this study did not discuss in detail the carbon- and water-footprint data, as they are influenced by a plethora of factors (e.g., plantation density and age, management practices, irrigation, location, variety, soil features, and environmental conditions).

11. Conclusions and Perspectives

The intensification of agriculture and the agrifood sector have a high environmental impact due to GHG emissions (especially carbon dioxide) and the unsustainable use of natural resources (water and biodiversity). However, agriculture also has the potential to sequester CO2 and contribute to climate-change mitigation. LCA plays an important role in quantifying those impacts, allowing important measures to be adopted to mitigate these risks. Because of the transparent information they provide about the producer’s environmental impact and the significant economic benefits, the water footprint, carbon footprint, biodiversity certification, and environmental product declaration have had significant success and acceptance by farmers, food companies, retailers, and consumers.
Olives and olive oil are essential components of the human diet, particularly in Mediterranean-type cuisine. Despite this, the certification process in the field of olive production is still limited, necessitating intervention with good strategies to encourage this culture, which contributes significantly to reducing the negative environmental impact. This paper reviewed the significant capability of olive groves to store carbon and the available methodologies for environmental impact analysis, supporting the ecological transition in the olive industry. However, certification processes do not adequately account for this carbon.
The study highlighted the need for a unique standard functional unit or a clear method driving its choice. Referring to the environmental impact by per Ha or unit yield creates unfair comparison across various plantation systems differing in yield.
Nowadays, there are several developing ecolabels for a food’s environmental impact rating to accomplish the European Commission food-label policy [180]. In most of these initiatives, the environmental impact of food production is quantified through the LCA framework. Although there is power in the LCA-based framework, it would be limiting in the agrifood sector because the LCA does not account for biogenic carbon, which is stored in (farm-scale) pools such as soil and biomass. In line with this, integration of LCA-based labeling with changes in soil carbon, as proposed in [156], also fits with the PEFCR abovementioned. Future research should focus on the full integration of the LCA framework with biogenic carbon within an ecolabel context, further legitimating the sustainable management of olive groves.

Author Contributions

Conceptualization, G.K.; methodology, G.K.; validation, A.R.; formal analysis, A.R.; investigation. A.R.; resources, G.K.; data curation, G.K.; writing—original draft preparation, A.R.; writing—review and editing, G.K., C.R., G.M., G.F.; visualization, A.R.; supervision, G.K.; funding acquisition, G.K. All authors have read and agreed to the published version of the manuscript.

Funding

This research was partially funded by (i) LIFE Olivares Vivos + Increasing the impact of Olivares Vivos in the EU, Reference: LIFE20 NAT/ES/001487; (ii) the General Secretariat for Research and Innovation of the Ministry of Development and Investments under the PRIMA Programme for the project Freeclimb (PRIMA is an Art.185 initiative supported and cofunded under Horizon 2020, the European Union’s Programme for Research and Innovation); (iii) PRIMA and Horizon2020 Framework programs for the Project Sustainolive with grant number 1811, and (iv) the European Union’s Horizon 2020 research and innovation program under grant agreement No. 101000427 for the project Gen4Olive.

Institutional Review Board Statement

Not applicable.

Informed Consent Statement

Not applicable.

Data Availability Statement

Data are available from the authors upon reasonable request.

Conflicts of Interest

Author Carlos Ruiz Gonzalez was employed by the company SEO/BirdLife. The remaining authors declare that the research was conducted in the absence of any commercial or financial relationships that could be construed as a potential conflict of interest.

References

  1. UN. World Population to Reach 8 Billion on 15 November 2022. 2023. Available online: https://www.un.org/en/desa/world-population-reach-8-billion-15-november-2022 (accessed on 15 April 2023).
  2. Falcone, G.; De Luca, A.I.; Stillitano, T.; Iofrida, N.; Strano, A.; Piscopo, A.; Branca, M.L.; Gulisano, G. Shelf-life extension to reduce food losses: The case of Mozzarella Cheese. Chem. Eng. Trans. 2017, 57, 1849–1854. [Google Scholar] [CrossRef]
  3. Pinstrup-Andersen, P.; Pandya-Lorch, R. Food security and sustainable use of natural resources: A 2020 Vision. Ecol. Econ. 1998, 26, 1–10. [Google Scholar] [CrossRef]
  4. Fawzy, S.; Osman, A.I.; Doran, J.; Rooney, D.W. Strategies for mitigation of climate change: A review. Environ. Chem. Lett. 2020, 18, 2069–2094. [Google Scholar] [CrossRef]
  5. Falcone, G.; Iofrida, N.; Stillitano, T.; De Luca, A.I. Impacts of food and diets’ life cycle: A brief review. Curr. Opin. Environ. Sci. Health 2020, 13, 75–79. [Google Scholar] [CrossRef]
  6. Hoekstra, A.Y.; Wiedmann, T.O. Humanity’s unsustainable environmental footprint. Science 2014, 344, 1114–1117. [Google Scholar] [CrossRef] [PubMed]
  7. FAO (Food and Agriculture Organization). Crops and Livestock Products. Available online: https://www.fao.org/faostat/en/#data/QCL/visualize (accessed on 9 December 2023).
  8. Camarsa, G.; Gardner, S.; Jones, W.; Eldridge, J.; Hudson, T.; Thorpe, E.; O’Hara, E. LIFE among Olives: Good Practice in Improving Environmental Performance in the Olive Oil Sector; Office for Official Publications of The European Union: Luxembourg, 2010. [Google Scholar]
  9. IOC. 2023. Available online: https://www.internationaloliveoil.org/1074-world-olive-oil-production-could-absorb-the-co2-emissions-of-a-city-the-size-of-hong-kong/ (accessed on 3 February 2023).
  10. IOC. International Olive Council. Available online: https://www.internationaloliveoil.org/wp-content/uploads/2021/12/IOC-Olive-Oil-Dashboard-1.html#production-2 (accessed on 3 February 2023).
  11. Stillitano, T.; Falcone, G.; De Luca, A.I.; Piga, A.; Conte, P.; Strano, A.; Gulisano, G. A Life Cycle Perspective to Assess the Environmental and Economic Impacts of Innovative Technologies in Extra Virgin Olive Oil Extraction. Foods 2019, 8, 209. [Google Scholar] [CrossRef] [PubMed]
  12. Stillitano, T.; Falcone, G.; Iofrida, N.; Spada, E.; Gulisano, G.; De Luca, A.I. A customized multi-cycle model for measuring the sustainability of circular pathways in agri-food supply chains. Sci. Total. Environ. 2022, 844, 157229. [Google Scholar] [CrossRef] [PubMed]
  13. Falcone, G.; Stillitano, T.; Iofrida, N.; Spada, E.; Bernardi, B.; Gulisano, G.; De Luca, A.I. Life cycle and circularity metrics to measure the sustainability of closed-loop agri-food pathways. Front. Sustain. Food Syst. 2022, 6, 1014228. [Google Scholar] [CrossRef]
  14. Beaufoy, G. The Environmental Impact of Olive Oil Production in the European Union: Practical Options for Improving the Environmental Impact; European Forum on Nature Conservation and Pastoralism: Lampeter, UK, 2001. [Google Scholar]
  15. Guarino, F.; Falcone, G.; Stillitano, T.; De Luca, A.I.; Gulisano, G.; Mistretta, M.; Strano, A. Life cycle assessment of olive oil: A case study in southern Italy. J. Environ. Manag. 2019, 238, 396–407. [Google Scholar] [CrossRef] [PubMed]
  16. Montanaro, G.; Nuzzo, V.; Xiloyannis, C.; Dichio, B. Climate change mitigation and adaptation in agriculture: The case of the olive. J. Water Clim. Chang. 2018, 9, 633–642. [Google Scholar] [CrossRef]
  17. Lichtfouse, E. (Ed.) Agroecology and Strategies for Climate Change; Springer Science & Business Media: Cham, Switzerland, 2011. [Google Scholar]
  18. Di Vita, G.; Zanchini, R.; Falcone, G.; D’amico, M.; Brun, F.; Gulisano, G. Local, organic or protected? Detecting the role of different quality signals among Italian olive oil consumers through a hierarchical cluster analysis. J. Clean. Prod. 2021, 290, 125795. [Google Scholar] [CrossRef]
  19. Tscharntke, T.; Milder, J.C.; Schroth, G.; Clough, Y.; DeClerck, F.; Waldron, A.; Rice, R.; Ghazoul, J. Conserving biodiversity through certification of tropical agroforestry crops at local and landscape scales. Conserv. Lett. 2015, 8, 14–23. [Google Scholar] [CrossRef]
  20. Nijkamp, P.; Bergh, C.J.M.v.D.; Soeteman, F.J. Regional Sustainable Development and Natural Resource Use. World Bank Econ. Rev. 1990, 4 (Suppl. S1), 153–188. [Google Scholar] [CrossRef]
  21. Trierweiller, A.C.; Peixe, B.C.S.; Tezza, R.; Bornia, A.C.; Campos, L.M. Measuring environmental management disclosure in industries in Brazil with Item Response Theory. J. Clean. Prod. 2013, 47, 298–305. [Google Scholar] [CrossRef]
  22. Lemken, D.; Zühlsdorf, A.; Spiller, A. Improving Consumers’ Understanding and Use of Carbon Footprint Labels on Food: Proposal for a Climate Score Label. Eurochoices 2021, 20, 23–29. [Google Scholar] [CrossRef]
  23. Galli, A.; Wiedmann, T.; Ercin, E.; Knoblauch, D.; Ewing, B.; Giljum, S. Integrating ecological, carbon and water footprint into a “footprint family” of indicators: Definition and role in tracking human pressure on the planet. Ecol. Indic. 2012, 16, 100–112. [Google Scholar] [CrossRef]
  24. Khandekar, M.L.; Murty, T.S.; Chittibabu, P. The Global Warming Debate: A Review of the State of Science. Pure Appl. Geophys. 2005, 162, 1557–1586. [Google Scholar] [CrossRef]
  25. Pattara, C.; Salomone, R.; Cichelli, A. Carbon footprint of extra virgin olive oil: A comparative and driver analysis of different production processes in Centre Italy. J. Clean. Prod. 2016, 127, 533–547. [Google Scholar] [CrossRef]
  26. U.S. Environmental Protection Agency. Global Greenhouse Gas Emissions Data. Available online: https://www.epa.gov/ghgemissions/global-greenhouse-gas-emissions-data (accessed on 9 March 2023).
  27. Ring, M.J.; Lindner, D.; Cross, E.F.; Schlesinger, M.E. Causes of the Global Warming Observed since the 19th Century. Atmos. Clim. Sci. 2012, 2, 401–415. [Google Scholar] [CrossRef]
  28. Pelletier, N.; Ibarburu, M.; Xin, H. A carbon footprint analysis of egg production and processing supply chains in the Midwestern United States. J. Clean. Prod. 2013, 54, 108–114. [Google Scholar] [CrossRef]
  29. Vermeulen, S.J.; Campbell, B.M.; Ingram, J.S.I. Climate change and food systems. Annu. Rev. Environ. Resour. 2012, 37, 195–222. [Google Scholar] [CrossRef]
  30. Avraamides, M.; Fatta, D. Resource consumption and emissions from olive oil production: A life cycle inventory case study in Cyprus. J. Clean. Prod. 2008, 16, 809–821. [Google Scholar] [CrossRef]
  31. FAOSTAT. 2022. Available online: https://www.fao.org/faostat/en/#data/GT/visualize (accessed on 12 March 2023).
  32. Röös, E. Analysing the Carbon Footprint of Food. Doctoral Dissertation, Swedish University of Agricultural Sciences, Uppsala, Sweden, 2013; p. 56. [Google Scholar]
  33. Pandey, D.; Agrawal, M.; Pandey, J.S. Carbon footprint: Current methods of estimation. Environ. Monit. Assess. 2010, 178, 135–160. [Google Scholar] [CrossRef] [PubMed]
  34. Stolze, M.; Piorr, A.; Häring, A.M.; Dabbert, S. Environmental Impacts of Organic Farming in Europe; Universität Hohenheim: Stuttgart-Hohenheim, Germany, 2000. [Google Scholar]
  35. Eurostat. Area under Organic Farming. 2022. Available online: https://ec.europa.eu/eurostat/databrowser/view/sdg_02_40/default/map?lang=en (accessed on 22 February 2023).
  36. European Commission. G0207—Area under Organic Farming. Available online: https://data.europa.eu/data/datasets/ecff4a08-6140-4331-a3e0-026239877903?locale=en (accessed on 19 January 2023).
  37. Janssen, M.; Hamm, U. Consumer perception of different organic certification schemes in five European countries. Org. Agric. 2011, 1, 31–43. [Google Scholar] [CrossRef]
  38. ISO/IEC 17065-2012; Conformity Assessment—Requirements for Bodies Certifying Products, Processes and Services. Available online: https://standards.iteh.ai/catalog/standards/iso/02abfae4-0b5e-4418-8ffc-f60f0b9eb16b/iso-iec-17065-2012 (accessed on 9 December 2023).
  39. Özkan, F.Z. A Comparative Study of ISO/IEC 17065: 2012 Standards, Accreditation Processes Implemented in Turkey Regarding Turkish Organic Agriculture Legislations. Agric. Sci. 2021, 12, 387–405. [Google Scholar] [CrossRef]
  40. FAO (Food and Agriculture Organization). Available online: https://www.fao.org/3/y5136e/y5136e00.htm (accessed on 14 January 2023).
  41. United States Department of Agriculture (USDA). Organic 101: Five Steps to Organic Certification. Available online: https://www.usda.gov/media/blog/2012/10/10/organic-101-five-steps-organic-certification (accessed on 26 January 2023).
  42. Reddy, B.S. Organic farming: Status, issues and prospects—A review. Agric. Econ. Res. Rev. 2010, 23, 343–358. [Google Scholar]
  43. Xu, X.; Huang, X.; Huang, J.; Gao, X.; Chen, L. Spatial-Temporal Characteristics of Agriculture Green Total Factor Productivity in China, 1998–2016: Based on More Sophisticated Calculations of Carbon Emissions. Int. J. Environ. Res. Public Health 2019, 16, 3932. [Google Scholar] [CrossRef]
  44. Chen, L.; Xu, X. Effect evaluation of the long-term care insurance (LTCI) system on the health care of the elderly: A review. J. Multidiscip. Healthc. 2020, 13, 863–875. [Google Scholar] [CrossRef] [PubMed]
  45. Han, H.; Zhang, X. Static and dynamic cultivated land use efficiency in China: A minimum distance to strong efficient frontier approach. J. Clean. Prod. 2020, 246, 119002. [Google Scholar] [CrossRef]
  46. IPCC. Summary for Policymakers. In Climate Change 2022: Mitigation of Climate Change; Contribution of Working Group III to the Sixth Assessment Report of the Intergovernmental Panel on Climate Change; Shukla, P.R., Skea, J., Slade, R., Al Khourdajie, A., van Diemen, R., McCollum, D., Pathak, M., Some, S., Vyas, P., Fradera, R., et al., Eds.; Cambridge University Press: Cambridge, UK; New York, NY, USA, 2022. [Google Scholar] [CrossRef]
  47. Dhakal, S.; Minx, J.C.; Toth, F.L.; Shan, Y. 2022: Emissions Trends and Drivers Supplementary Material. In Climate Change 2022: Mitigation of Climate Change: Contribution of Working Group III to the Sixth Assessment Report of the Intergovernmental Panel on Climate Change; Shukla, P.R., Skea, J., Slade, R., Al Khourdajie, A., van Diemen, R., McCollum, D., Pathak, M., Some, S., Vyas, P., Fradera, R., et al., Eds.; Cambridge University Press: Cambridge, UK, 2022; Available online: https://www.ipcc.ch/report/ar6/wg3/ (accessed on 9 December 2023).
  48. Bouwman, A.F.; Boumans, L.J.M.; Batjes, N.H. Emissions of N2O and NO from fertilized fields: Summary of available measurement data. Glob. Biogeochem. Cycles 2002, 16, 6-1–6-13. [Google Scholar] [CrossRef]
  49. Khan, S.; Hanjra, M.A. Footprints of water and energy inputs in food production–Global perspectives. Food Policy 2009, 34, 130–140. [Google Scholar] [CrossRef]
  50. ISO 14064-2; Greenhouse Gases-Part 2: Specification with Guidance at the Project Level for Quantification, Monitoring and Reporting of greenhouse Gas Emission Reductions or Removal Enhancements. International Organization for Standardization: Geneva, Switzerland, 2006.
  51. Jeroen, B.; Irene, K.; Joep, V.; Jan, O. Les Pesticides: Composition, Utilisation et Risqué; Fondation Agromisa: Wageningen, The Netherlans, 2004. [Google Scholar]
  52. Mouron, P.; Scholz, R.W.; Nemecek, T.; Weber, O. Life cycle management on Swiss fruit farms: Relating environmental and income indicators for apple-growing. Ecol. Econ. 2006, 58, 561–578. [Google Scholar] [CrossRef]
  53. Masanet, E.; Chang, Y.; Gopal, A.R.; Larsen, P.; Morrow, W.R.; Sathre, R.; Shehabi, A.; Zhai, P. Life-Cycle Assessment of Electric Power Systems. Annu. Rev. Environ. Resour. 2013, 38, 107–136. [Google Scholar] [CrossRef]
  54. Heijungs, R.; Lenzen, M. Error propagation methods for LCA—A comparison. Int. J. Life Cycle Assess. 2014, 19, 1445–1461. [Google Scholar] [CrossRef]
  55. Gulisano, G.; Strano, A.; De Luca, A.I.; Falcone, G.; Iofrida, N.; Stillitano, T. Evaluating the Environmental, Economic, and Social Sustainability of Agro-Food Systems Through Life Cycle Approaches. In Sustainable Food Systems from Agriculture to Industry: Improving Production and Processing; Academic Press: Cambridge, MA, USA, 2018; pp. 123–152. [Google Scholar] [CrossRef]
  56. United Nations (UN). Available online: https://sdgs.un.org/2030agenda (accessed on 6 February 2023).
  57. Proietti, S.; Sdringola, P.; Desideri, U.; Zepparelli, F.; Brunori, A.; Ilarioni, L.; Nasini, L.; Regni, L.; Proietti, P. Carbon footprint of an olive tree grove. Appl. Energy 2014, 127, 115–124. [Google Scholar] [CrossRef]
  58. Boye, J.; Arcand, Y. (Eds.) Green Technologies in Food Production and Processing; Springer Science & Business Media: Cham, Switzerland, 2012; Chapter 3; p. 44. [Google Scholar]
  59. EPA: United States Environmental Protection Agency. Available online: https://www.epa.gov/watersense/watersense-label (accessed on 6 February 2023).
  60. Li, T.; Wang, Q.; Su, B. A review of carbon labeling: Standards, implementation, and impact. Renew. Sustain. Energy Rev. 2016, 53, 68–79. [Google Scholar] [CrossRef]
  61. Li, S.; Qin, Y.; Subbiah, J.; Dvorak, B. Life cycle assessment of the U.S. beef processing through integrated hybrid approach. J. Clean. Prod. 2020, 265, 121813. [Google Scholar] [CrossRef]
  62. Suh, S.; Huppes, G. Methods for Life Cycle Inventory of a product. J. Clean. Prod. 2005, 13, 687–697. [Google Scholar] [CrossRef]
  63. Perkins, J.; Suh, S. Uncertainty Implications of Hybrid Approach in LCA: Precision versus Accuracy. Environ. Sci. Technol. 2019, 53, 3681–3688. [Google Scholar] [CrossRef]
  64. Horne, R.; Grant, T.; Verghese, K. Life Cycle Assessment: Principles, Practice, and Prospects; CSIRO Publishing: Clayton, Australia, 2009. [Google Scholar]
  65. Hauschild, M.Z.; Bonou, A.; Olsen, S.I. Life cycle interpretation. In Life Cycle Assessment: Theory and Practice; Springer: Berlin/Heidelberg, Germany, 2018; pp. 323–334. [Google Scholar]
  66. Hauschild, M.Z.; Rosenbaum, R.K.; Olsen, S.I. (Eds.) Life Cycle Assessment; Springer International Publishing: Cham, Switzerland, 2018. [Google Scholar] [CrossRef]
  67. Hunkeler, D. LCA Compendium—The Complete World of Life Cycle Assessment; LCA Consult & Review: Frankfurt am Main, Germany, 2014. [Google Scholar]
  68. Ekvall, T. Attributional and consequential life cycle assessment. In Sustainability Assessment at the 21st Century; IntechOpen: London, UK, 2019. [Google Scholar]
  69. Weidema, B.P.; Frees, N.; Nielsen, A.-M. Marginal production technologies for life cycle inventories. Int. J. Life Cycle Assess. 1999, 4, 48–56. [Google Scholar] [CrossRef]
  70. ISO 14040-2006; Environmental Management-Life Cycle Assessment, Principles and Framework. ISO: Geneva, Switzerland, 2006.
  71. Sonesson, U.; Berlin, J.; Hospido, A. Towards sustainable industrial food production using Life Cycle Assessment approaches. In Environmental Assessment and Management in the Food Industry; Woodhead Publishing: Sawston, UK, 2010; pp. 165–176. [Google Scholar]
  72. ISO 14044-2006; Environmental Management-Life Cycle Assessment, Requirements and Guidelines. ISO: Geneva, Switzerland, 2006.
  73. Pattara, C.; Russo, C.; Antrodicchia, V.; Cichelli, A. Carbon footprint as an instrument for enhancing food quality: Overview of the wine, olive oil and cereals sectors. J. Sci. Food Agric. 2016, 97, 396–410. [Google Scholar] [CrossRef]
  74. IPCC. 2019 Refinement to the 2006 IPCC Guidelines for National Greenhouse Gas Inventories; Calvo Buendia, E., Tanabe, K., Kranjc, A., Baasansuren, J., Fukuda, M., Ngarize, S., Osako, A., Pyrozhenko, Y., Shermanau, P., Federici, S., Eds.; IPCC: Geneva, Switzerland, 2019; Available online: https://www.ipcc-nggip.iges.or.jp/public/2019rf/vol4.html (accessed on 9 December 2023).
  75. SAIC (Scientific Applications International Corporation); Curran, M.A.; National Risk Management Research Laboratory (US); Office of Research and Development, Environmental Protection Agency, United States. Life-Cycle Assessment: Principles and Practice. 2006. Available online: http://people.cs.uchicago.edu/~ftchong/290N-W10/EPAonLCA2006.pdf (accessed on 9 December 2023).
  76. Curran, M.A. (Ed.) Life Cycle Assessment Handbook: A Guide for Environmentally Sustainable Products; John Wiley & Sons: Hoboken, NJ, USA, 2012. [Google Scholar]
  77. Guinée, J.B.; Heijungs, R.; Huppes, G.; Zamagni, A.; Masoni, P.; Buonamici, R.; Ekvall, T.; Rydberg, T. Life Cycle Assessment: Past, Present, and Future. Environ. Sci. Technol. 2010, 45, 90–96. [Google Scholar] [CrossRef]
  78. Notarnicola, B.; Salomone, R.; Petti, L.; Renzulli, P.A.; Roma, R.; Cerutti, A.K. Life Cycle Assessment in the Agro-Food Sector Case Studies, Methodological Issues and Best Practices; Springer: Cham, Switzerland, 2015. [Google Scholar]
  79. Notarnicola, B.; Sala, S.; Anton, A.; McLaren, S.J.; Saouter, E.; Sonesson, U. The role of life cycle assessment in supporting sustainable agri-food systems: A review of the challenges. J. Clean. Prod. 2017, 140, 399–409. [Google Scholar] [CrossRef]
  80. Houshyar, E.; Bacenetti, J. Efficiency analysis of watermelon under plastic film mulching systems. Clean. Environ. Syst. 2023, 8, 100107. [Google Scholar] [CrossRef]
  81. Vono, G.; Falcone, G.; Mistretta, M.; Fazari, A.; Strano, A. Life Cycle Inventory of the Italian citrus fruit supply chain: Modelling the agricultural phase inventory through statistical data processing. Clean. Environ. Syst. 2023, 10, 10013. [Google Scholar] [CrossRef]
  82. Namdari, M.; Rafiee, S.; Notarnicola, B.; Tassielli, G.; Renzulli, P.A.; Hosseinpour, S. Use of LCA indicators to assess Iranian sugar production systems: Case study—Hamadan Province. Biomass Convers. Biorefinery 2022, 1–14. [Google Scholar] [CrossRef]
  83. Rossi, M.; Favi, C.; Germani, M.; Omicioli, M. Comparative life cycle assessment of refrigeration systems for food cooling: Eco-design actions towards machines with natural refrigerants. Int. J. Sustain. Eng. 2021, 14, 1623–1646. [Google Scholar] [CrossRef]
  84. Bui, H.; Cisse, S.H.; Ceccaldi, M.; Perrin, A.; Benarbia, M.E.A.; Chicoteau, P. Mitigating the Environmental Impacts from Pig and Broiler Chicken Productions: Case Study on a Citrus Extract Feed Additive. Animals 2023, 13, 3702. [Google Scholar] [CrossRef]
  85. Salomone, R.; Cappelletti, G.M.; Malandrino, O.; Mistretta, M.; Neri, E.; Nicoletti, G.M.; Notarnicola, B.; Pattara, C.; Russo, C.; Saija, G. Life cycle assessment in the olive oil sector. In Life Cycle Assessment in the Agri-Food Sector Case Studies, Methodological Issues and Best Practices; Notarnicola, B., Salomone, R., Petti, L., Renzulli, P.A., Roma, R., Cerutti, A.K., Eds.; Springer: Cham, Switzerland, 2015; p. 390. [Google Scholar] [CrossRef]
  86. Rapa, M.; Ciano, S. A Review on Life Cycle Assessment of the Olive Oil Production. Sustainability 2022, 14, 654. [Google Scholar] [CrossRef]
  87. Wiedmann, T.; Minx, J. A definition of ‘carbon footprint’. Ecol. Econ. Res. Trends 2008, 1, 1–11. [Google Scholar]
  88. Carbon Trust. Carbon Footprinting. An Introduction for Organizations; Carbon Trust: London, UK, 2007. [Google Scholar]
  89. ISO 14064-1-2018; Specification with Guidance at the Organizational Level- for Quantification and Reporting of Greenhouse Gas Emissions and Removals. ISO: Geneva, Switzerland, 2018.
  90. WRI. The Greenhouse Gas Protocol. In A Corporate Accounting and Reporting Standard; WRI: Washington, DC, USA; Conches: Geneva, Switzerland, 2004. [Google Scholar]
  91. PAS 2050-2011; Specification for the Assessment of the Life Cycle Greenhouse Gas Emissions of Goods and Services. British Standards Institute: London, UK, 2008.
  92. ISO 14025-2006; Environmental Markings and Declarations-Type III Environmental Declarations, Principles and Procedures. ISO: Geneva, Switzerland, 2006.
  93. ISO 14067-2018; Greenhouse gases-Carbon Footprint of Products, Requirements and Guidelines for Quantification. ISO: Geneva, Switzerland, 2018.
  94. Hornibrook, S.; May, C.; Fearne, A. Sustainable Development and the Consumer: Exploring the Role of Carbon Labelling in Retail Supply Chains. Bus. Strat. Environ. 2013, 24, 266–276. [Google Scholar] [CrossRef]
  95. Vanclay, J.K.; Shortiss, J.; Aulsebrook, S.; Gillespie, A.M.; Howell, B.C.; Johanni, R.; Maher, M.J.; Mitchell, K.M.; Stewart, M.D.; Yates, J. Customer Response to Carbon Labelling of Groceries. J. Consum. Policy 2011, 34, 153–160. [Google Scholar] [CrossRef]
  96. Kimura, A.; Wada, Y.; Kamada, A.; Masuda, T.; Okamoto, M.; Goto, S.-I.; Tsuzuki, D.; Cai, D.; Oka, T.; Dan, I. Interactive effects of carbon footprint information and its accessibility on value and subjective qualities of food products. Appetite 2010, 55, 271–278. [Google Scholar] [CrossRef] [PubMed]
  97. Thøgersen, J.; Nielsen, K.S. A better carbon footprint label. J. Clean. Prod. 2016, 125, 86–94. [Google Scholar] [CrossRef]
  98. Carbon Trust. Available online: https://www.carbontrust.com/news-and-insights/insights/creating-change-through-carbon-footprinting (accessed on 27 December 2022).
  99. Boardman, B. Carbon labelling: Too complex or will it transform our buying? Significance 2008, 5, 168–171. [Google Scholar] [CrossRef]
  100. Vaughan, A. Tesco Drops Carbon-Label Pledge. The Guardian. 30 January 2012. Available online: https://www.theguardian.com/environment/2012/jan/30/tesco-drops-carbon-labelling (accessed on 9 December 2023).
  101. Upham, P.; Dendler, L.; Bleda, M. Carbon labelling of grocery products: Public perceptions and potential emissions reductions. J. Clean. Prod. 2011, 19, 348–355. [Google Scholar] [CrossRef]
  102. Cheng, K.; Pan, G.; Smith, P.; Luo, T.; Li, L.; Zheng, J.; Zhang, X.; Han, X.; Yan, M. Carbon footprint of China’s crop production—An estimation using agro-statistics data over 1993–2007. Agric. Ecosyst. Environ. 2011, 142, 231–237. [Google Scholar] [CrossRef]
  103. Sah, D.; Devakumar, A.S. The carbon footprint of agricultural crop cultivation in India. Carbon Manag. 2018, 9, 213–225. [Google Scholar] [CrossRef]
  104. Agrecalc. Agrecalc the Farm Carbon Calculator. Available online: https://www.agrecalc.com/ (accessed on 6 February 2023).
  105. MRV Platform for Agriculture. Available online: https://www.agmrv.org/knowledge-portal/resources/the-cool-farm-tool/ (accessed on 6 February 2023).
  106. Farm Carbon Toolkit. Available online: https://farmcarbontoolkit.org.uk/ (accessed on 6 February 2023).
  107. FAO (Food and Agriculture Organization). Economic and Policy Analysis of Climate Change. Available online: https://www.fao.org/in-action/epic/ex-act-tool/suite-of-tools/ex-act/en/ (accessed on 6 February 2023).
  108. COMET-Farm. Available online: https://comet-farm.com/ (accessed on 6 February 2023).
  109. SME Banking Club, UBB Presents an Innovative Agro Carbon Emission Calculator. Available online: https://smebanking.club/ubb-presents-an-innovative-agro-carbon-emissions-calculator/ (accessed on 19 December 2022).
  110. OpenLCA. Available online: https://www.openlca.org/ (accessed on 6 February 2023).
  111. Clark, M.A.; Domingo, N.G.G.; Colgan, K.; Thakrar, S.K.; Tilman, D.; Lynch, J.; Azevedo, I.L.; Hill, J.D. Global food system emissions could preclude achieving the 1.5° and 2 °C climate change targets. Science 2020, 370, 705–708. [Google Scholar] [CrossRef]
  112. Camilleri, A.R.; Larrick, R.P.; Hossain, S.; Patino-Echeverri, D. Consumers underestimate the emissions associated with food but are aided by labels. Nat. Clim. Chang. 2018, 9, 53–58. [Google Scholar] [CrossRef]
  113. Laureati, M.; Jabes, D.; Russo, V.; Pagliarini, E. Sustainability and organic production: How information influences consumer’s expectation and preference for yogurt. Food Qual. Prefer. 2013, 30, 1–8. [Google Scholar] [CrossRef]
  114. Guenther, M.; Saunders, C.M.; Tait, P.R. Carbon labeling and consumer attitudes. Carbon Manag. 2012, 3, 445–455. [Google Scholar] [CrossRef]
  115. Macgregor, J. Carbon Concerns: How Standards and Labelling Initiatives Must Not Limit Agricultural Trade from Developing Countries; ICTDS: Geneva, Switzerland, 2010. [Google Scholar]
  116. The CarbonNeutral Protocol. Available online: https://www.carbonneutral.com/how (accessed on 18 February 2023).
  117. PAS 2060-2009; Standard for Carbon Neutrality. British Standards Institution: London, UK, 2009.
  118. SCS Global Services. Carbon Neutral Certification. Available online: https://www.scsglobalservices.com/services/carbon-neutral-certification (accessed on 18 February 2023).
  119. ECOLABEL. Available online: https://www.ecolabelindex.com/ecolabel/carbon-reduction-label (accessed on 18 February 2023).
  120. ECOLABEL. Available online: https://www.ecolabelindex.com/ecolabel/carboncare (accessed on 18 February 2023).
  121. ECOLABEL. Available online: https://www.ecolabelindex.com/ecolabel/carbonfree-certified (accessed on 18 February 2023).
  122. Santé Publique France. Available online: https://www.santepubliquefrance.fr/determinants-de-sante/nutrition-et-activite-physique/articles/nutri-score (accessed on 6 February 2023).
  123. Meyerding, S.G.; Schaffmann, A.-L.; Lehberger, M. Consumer Preferences for Different Designs of Carbon Footprint Labelling on Tomatoes in Germany—Does Design Matter? Sustainability 2019, 11, 1587. [Google Scholar] [CrossRef]
  124. Rinaldi, S.; Barbanera, M.; Lascaro, E. Assessment of carbon footprint and energy performance of the extra virgin olive oil chain in Umbria, Italy. Sci. Total. Environ. 2014, 482–483, 71–79. [Google Scholar] [CrossRef] [PubMed]
  125. Salomone, R.; Ioppolo, G. Environmental impacts of olive oil production: A Life Cycle Assessment case study in the province of Messina (Sicily). J. Clean. Prod. 2012, 28, 88–100. [Google Scholar] [CrossRef]
  126. Espadas-Aldana, G.; Vialle, C.; Belaud, J.-P.; Vaca-Garcia, C.; Sablayrolles, C. Analysis and trends for Life Cycle Assessment of olive oil production. Sustain. Prod. Consum. 2019, 19, 216–230. [Google Scholar] [CrossRef]
  127. Michalopoulos, G.; Christodoulopoulou, L.; Giakoumaki, G.; Manolaraki, C.; Union, P.; Malliaraki, S.; Aggelaki, K.; Zontanou, E. Life Cycle Assessment of Extra Virgin Olive Oil Produced by Three Groups of Farmers in South Greece; RodaxAgro: Athens, Greece, 2011. [Google Scholar]
  128. Mohamad, R.S.; Verrastro, V.; Al Bitar, L.; Roma, R.; Moretti, M.; Al Chami, Z. Effect of different agricultural practices on carbon emission and carbon stock in organic and conventional olive systems. Soil Res. 2016, 54, 173–181. [Google Scholar] [CrossRef]
  129. IOC. 2023. Available online: https://carbonbalance.internationaloliveoil.org/en (accessed on 3 February 2023).
  130. Proietti, S.; Sdringola, P.; Regni, L.; Evangelisti, N.; Brunori, A.; Ilarioni, L.; Nasini, L.; Proietti, P. Extra Virgin Olive oil as carbon negative product: Experimental analysis and validation of results. J. Clean. Prod. 2017, 166, 550–562. [Google Scholar] [CrossRef]
  131. Nardino, M.; Pernice, F.; Rossi, F.; Georgiadis, T.; Facini, O.; Motisi, A.; Drago, A. Annual and monthly carbon balance in an intensively managed Mediterranean olive orchard. Photosynthetica 2013, 51, 63–74. [Google Scholar] [CrossRef]
  132. Gleick, P.H. Basic Water Requirements for Human Activities: Meeting Basic Needs. Water Int. 1996, 21, 83–92. [Google Scholar] [CrossRef]
  133. Van Oel, P.R.; Hoekstra, A.Y. Towards quantification of the water footprint of paper: A first estimate of its consumptive component. Water Resour. Manag. 2012, 26, 733–749. [Google Scholar] [CrossRef]
  134. Zhang, G.P.; Hoekstra, A.Y.; Mathews, R.E. Water Footprint Assessment (WFA) for better water governance and sustainable development. Water Resour. Ind. 2013, 1, 1–6. [Google Scholar] [CrossRef]
  135. Ridoutt, B.G.; Pfister, S. A revised approach to water footprinting to make transparent the impacts of consumption and production on global freshwater scarcity. Glob. Environ. Chang. 2010, 20, 113–120. [Google Scholar] [CrossRef]
  136. Lovarelli, D.; Bacenetti, J.; Fiala, M. Water Footprint of crop productions: A review. Sci. Total Environ. 2016, 548, 236–251. [Google Scholar] [CrossRef]
  137. Falkenmark, M. The massive water scarcity now threatening Africa: Why isn’t it being addressed? Ambio 1989, 18, 112–118. [Google Scholar]
  138. Pellegrini, G.; Ingrao, C.; Camposeo, S.; Tricase, C.; Contò, F.; Huisingh, D. Application of water footprint to olive growing systems in the Apulia region: A comparative assessment. J. Clean. Prod. 2016, 112, 2407–2418. [Google Scholar] [CrossRef]
  139. Hoekstra, A.Y.; Chapagain, A.K.; Aldaya, M.M.; Mekonnen, M.M. Water Footprint Manual: State of the Art 2009; Water Footprint Network: Enschede, The Netherlands, 2009; Volume 255. [Google Scholar]
  140. Vanham, D.; Bidoglio, G. A review on the indicator water footprint for the EU28. Ecol. Indic. 2013, 26, 61–75. [Google Scholar] [CrossRef]
  141. Aldaya, M.M.; Chapagain, A.K.; Hoekstra, A.Y.; Mekonnen, M.M. The Water Footprint Assessment Manual: Setting the Global Standard; Routledge: London, UK, 2012. [Google Scholar]
  142. ISO 14046-2014; Environmental Management-Water Footprint, Principles, Requirements and Guidelines. ISO: Geneva, Switzerland, 2014.
  143. Mekonnen, M.M.; Hoekstra, A.Y. The green, blue and grey water footprint of crops and derived crop products. Hydrol. Earth Syst. Sci. 2011, 15, 1577–1600. [Google Scholar] [CrossRef]
  144. Gu, Y.; Xu, J.; Wang, H.; Li, F. Industrial water footprint assessment: Methodologies in need of improvement. Environ. Sci. Technol. 2014, 48, 6531–6532. [Google Scholar] [CrossRef] [PubMed]
  145. ISO14040; Environmental Management—Life Cycle Assessment—Principles and Framework. ISO: Geneva, Switzerland, 2006; pp. 235–248.
  146. Frischknecht, R.; Steiner, R.; Jungbluth, N. The Ecological Scarcity Method-Eco-Factors 2006: A Method for Impact Assessment in LCA; Federal Office for the Environment FOEN: Zürich/Bern, Switzserland, 2009. [Google Scholar]
  147. Bayart, J.B.; Bulle, C.; Margni, M.; Vince, F.; Deschenes, L.; Aoustin, E. Operational characterisation method and factors for a new midpoint impact category: Freshwater deprivation for human uses. In Proceedings of the SETAC Europe: 19th Annual Meeting, Gothenburg, Sweden, 31 May–4 June 2009. [Google Scholar]
  148. Pfister, S.; Hellweg, S. The water “shoesize” vs. footprint of bioenergy. Proc. Natl. Acad. Sci. USA 2009, 106, E93–E94. [Google Scholar] [CrossRef] [PubMed]
  149. Motoshita, M.; Itsubo, N.; Inaba, A. Development of impact factors on damage to health by infectious diseases caused by domestic water scarcity. Int. J. Life Cycle Assess. 2011, 16, 65–73. [Google Scholar] [CrossRef]
  150. Rossi, L.; Regni, L.; Rinaldi, S.; Sdringola, P.; Calisti, R.; Brunori, A.; Dini, F.; Proietti, P. Long-Term Water Footprint Assessment in a Rainfed Olive Tree Grove in the Umbria Region, Italy. Agriculture 2019, 10, 8. [Google Scholar] [CrossRef]
  151. Manson, L.; Epps, T. Water footprint labelling and WTO rules. Rev. Eur. Comp. Int. Environ. Law 2014, 23, 329–341. [Google Scholar] [CrossRef]
  152. AENOR. Available online: https://www.en.aenor.com/certificacion/medio-ambiente/huella-hidrica (accessed on 6 February 2023).
  153. SQI (Shanghai Institute of Quality). Available online: http://www.nfqsc.org/SQI_Web/English/SQI_EN_Introduction_Details.aspx?NGUID=f5285f6931894565bc9efdc15eecfbcf (accessed on 13 January 2023).
  154. Smart Approved Water Mark. Available online: https://www.smartwatermark.org/about/ (accessed on 6 February 2023).
  155. De Gennaro, B.C.; Nardone, G. Sustainability of the agri-food system: Strategies and Performances. In Proceedings of the 50th SIDEA Conference, Lecce, Italy, 26–28 September 2014. [Google Scholar]
  156. Hélias, A.; van der Werf, H.M.G.; Soler, L.-G.; Aggeri, F.; Dourmad, J.-Y.; Julia, C.; Nabec, L.; Pellerin, S.; Ruffieux, B.; Trystram, G. Implementing environmental labelling of food products in France. Int. J. Life Cycle Assess. 2022, 27, 926–931. [Google Scholar] [CrossRef]
  157. Salmoral, G.; Aldaya, M.M.; Chico, D.; Garrido, A.; Llamas, R. The water footprint of olives and olive oil in Spain. Span. J. Agric. Res. 2011, 9, 1089–1104. [Google Scholar] [CrossRef]
  158. Salmoral, G.; Aldaya, M.M.; Chico, D.; Garrido, A.; Llamas, M.R. The Water Footprint of Olive Oil in Spain; Fundación Botín: Santander, Spain, 2010. [Google Scholar]
  159. Redford, K.H.; Richter, B.D. Conservation of biodiversity in a world of use. Conserv. Biol. 1999, 13, 1246–1256. [Google Scholar] [CrossRef]
  160. Swingland, I.R. Biodiversity, definition of. Encycl. Biodivers. 2001, 1, 377–391. [Google Scholar]
  161. Macarthur, R.H. Patterns of species diversity. Biol. Rev. 1965, 40, 510–533. [Google Scholar] [CrossRef]
  162. Maurer, B.A.; Mcgill, B.J. Measurement of species diversity. In Biological Diversity: Frontiers in Measurement and Assessment; Oxford University Press: Oxford, UK, 2011; pp. 55–65. [Google Scholar]
  163. Hamilton, A.J. Species diversity or biodiversity? J. Environ. Manag. 2005, 75, 89–92. [Google Scholar] [CrossRef] [PubMed]
  164. Costanza, R.; d’Arge, R.; de Groot, R.; Farber, S.; Grasso, M.; Hannon, B.; Limburg, K.; Naeem, S.; O’Neill, R.V.; Paruelo, J.; et al. The value of the world’s eco-system services and natural capital. Nature 1997, 387, 253–260. [Google Scholar] [CrossRef]
  165. Janick, J. New Crops for the Twenty-First Century. In Crop Science: Progress and Prospects; Nösberger, J., Geiger, H.H., Stuik, P.C., Eds.; CABI Publishing: Wallingford, UK, 2001; pp. 307–327. [Google Scholar]
  166. Global Nature Fund and the Lake Constance Foundation. Biodiversity in Standards and Labels for the Food Sector. Baseline Report. 2017. Available online: https://www.business-biodiversity.eu/en/baseline-report (accessed on 9 December 2023).
  167. Nordic Ecolabelling. Available online: https://www.nordic-ecolabel.org/nordic-swan-ecolabel/environmental-aspects/sustainable-raw-materials-and-biodiversity/biodiversity/ (accessed on 6 February 2023).
  168. Ministre de l’Agriculture et de la Souveraineté Alimentaire. Available online: https://agriculture.gouv.fr/la-haute-valeur-environnementale-une-mention-valorisante-pour-les-agriculteurs-et-leurs-pratiques (accessed on 6 February 2023).
  169. The Rainforest Alliance 2020 Sustainable Agriculture Standard (SAS). Available online: https://www.rainforest-alliance.org/resource-item/overview-of-key-documents-related-to-the-2020-sustainable-agriculture-standard/ (accessed on 9 December 2023).
  170. Rey, P.J.; Manzaneda, A.J.; Valera, F.; Alcántara, J.M.; Tarifa, R.; Isla, J.; Molina-Pardo, J.L.; Calvo, G.; Salido, T.; Gutiérrez, J.E.; et al. Landscape-moderated biodiversity effects of ground herb cover in olive groves: Implications for regional biodiversity conservation. Agric. Ecosyst. Environ. 2019, 277, 61–73. [Google Scholar] [CrossRef]
  171. Rey Pedro, J.; Camacho Francisco, M.; Tarifa, R.; Martínez-Núñez, C.; Salido, T.; Pérez, A.J.; García, D. Persistence of Seed Dispersal in Agroecosystems: Effects of Landscape Modification and Intensive Soil Management Practices in Avian Frugivores, Frugivory and Seed Deposition in Olive Croplands. Front. Ecol. Evolution. 2021, 9, 782462. [Google Scholar]
  172. Cano, D.; Martínez-Núñez, C.; Pérez, A.J.; Salido, T.; Rey, P.J. Small floral patches are resistant reservoirs of wild floral visitor insects and the pollination service in agricultural landscapes. Biol. Conserv. 2022, 276, 109789. [Google Scholar] [CrossRef]
  173. Martinez-Núñez, C.; Manzaneda, A.J.; Isla, J.; Tarifa, R.; Calvo, G.; Molina, J.L.; Salido, T.; Ruiz, C.; Gutierrez, J.E.; Rey, P.J. Low-intensity management benefits solitary bees in olive groves. J. Appl. Ecol. 2020, 57, 111–120. [Google Scholar] [CrossRef]
  174. EPD (Environmental Product Declaration). Available online: https://environdec.com/home (accessed on 14 January 2023).
  175. Allander, A. Successful Certification of an Environmental Product Declaration for an ABB Product. Corp. Environ. Strat. 2001, 8, 133–141. [Google Scholar] [CrossRef]
  176. EPD (Environmental Product Declaration). Available online: https://environdec.com/library/epd383 (accessed on 14 January 2023).
  177. EPD (Environmental Product Declaration). Available online: https://environdec.com/library/epd924 (accessed on 14 January 2023).
  178. Montanaro, G.; Amato, D.; Briglia, N.; Russo, C.; Nuzzo, V. Carbon Fluxes in Sustainable Tree Crops: Field, Ecosystem and Global Dimension. Sustainability 2021, 13, 8750. [Google Scholar] [CrossRef]
  179. Gómez-Muñoz, B.; Valero-Valenzuela, J.; Hinojosa, M.; García-Ruiz, R. Management of tree pruning residues to improve soil organic carbon in olive groves. Eur. J. Soil Biol. 2016, 74, 104–113. [Google Scholar] [CrossRef]
  180. Courtat, M.; Joyce, P.J.; Sim, S.; Sadhukhan, J.; Murphy, R. Towards credible, evidence-based environmental rating ecolabels for consumer products: A proposed framework. J. Environ. Manag. 2023, 336, 117684. [Google Scholar] [CrossRef]
Figure 1. Olive-oil production in the European Union (EU) between 2016 and 2021. Figure drawn using data from [10].
Sustainability 16 01227 g001
Figure 2. Acreage of organic agriculture in Europe in 2020. The map depicts farms in the conversion stage as well as fully organic [35] © European Union, 1995–2024.
Sustainability 16 01227 g002
Figure 3. Organic certification process, redrawn based on [41].
Sustainability 16 01227 g003
Figure 4. System boundaries of production and use for the Life Cycle Assessment (LCA), redrawn based on [58].
Sustainability 16 01227 g004
Figure 5. Framework for the Life Cycle Assessment technique, redrawn based on [64,65,73].
Sustainability 16 01227 g005
Figure 6. Example of carbon footprint results using the International Olive Oil Council’s (IOC) carbon-footprint tool [129].
Sustainability 16 01227 g006
Figure 7. The earth’s water distribution, redrawn based on [132].
Sustainability 16 01227 g007
Figure 8. Schematic representation of the components of a water footprint (WF) (adapted by [141]).
Sustainability 16 01227 g008
Figure 9. The three biodiversity components.
Sustainability 16 01227 g009
Figure 10. The International EPD® System’s steps for the creation and publication of an EPD, redrawn based on [175].
Sustainability 16 01227 g010
Table 1. The difference between the three types of Life Cycle Assessment (LCA) approaches.
ApproachData Collection MethodologyAdvantageSource
Economic input–outputTop–down methodCan collect environmental emissions inventory data through transactions across industries.
Instead of physical goods, monetary transactions between economic sectors are used.
Direct emissions and resource use from within each sector are identified and accumulated as the sector’s necessary inputs.
Comprehensively traces the supply chain by resolving the infinite and circular nature of transactions between sectors
The data from inventories are collected at the level of the whole economy.
It demonstrates relationships that are indirect and related to feedback between processes and sectors.
[62]
[63]
[64,65]
Process-based approachBottom–up methodMore accurate data
Can involve both direct emissions to the environment and upstream emissions in the supply processes for each process.
The supply chain is truncated when individual flows become seemingly insignificant.
Includes system-boundary choices and is constrained by inventory-collection resources.
[61]
[64]
[66]
Hybrid approach or combined processProcess-based and EIO-based methodCan more thoroughly quantify the environmental consequences.
High accuracy of input–output analysis.
Low truncation error.
Process data are collected separately.
[62]
[63]
[67]
Disclaimer/Publisher’s Note: The statements, opinions and data contained in all publications are solely those of the individual author(s) and contributor(s) and not of MDPI and/or the editor(s). MDPI and/or the editor(s) disclaim responsibility for any injury to people or property resulting from any ideas, methods, instructions or products referred to in the content.

