Life cycle and circularity metrics to measure the sustainability of closed-loop agri-food pathways
 Giacomo Falcone
  Teodora Stillitano Nathalie Iofrida
  Emanuele Spada
  Bruno Bernardi Giovanni Gulisano
  Anna Irene De Luca*
- Department of Agriculture (AGRARIA), Mediterranea University of Reggio Calabria, Reggio Calabria, Italy
This work aims to present a methodological proposal based on Life Cycle (LC) methodologies, and circularity performance indicators, to assess closed-loop pathways by providing comprehensive results on economic and environmental impacts generated by agri-food production systems. The methodological approach will be tested on olive oil production systems, one of the most important agri-food chains for Mediterranean countries, whose import and export significance is set to grow in light of the shrinking market supply of seed oils. Some insights for the co-products valorization are provided through the evaluation of the reuse of by-products as a possible resource capable to improve the sustainability of the olive oil farms. The integrated application of three different methodologies, Life Cycle Assessment (LCA), Environmental Life Cycle Costing (ELCC) and Material Circularity Indicator (MCI), enabled comparative evaluation of Extra Virgin Olive Oil (EVOO) production under a linear production model with production under a circular model. The circular scenario was better in most environmental impact categories, registering an improvement in Global Warming Potential (GWP) of nearly 30%. In economic terms, there was a lower production cost for the circular scenario and a lower environmental cost by reducing the use of synthetic products through the reuse of waste products. The circular scenario recorded a higher degree of circularity due to a reduction in virgin raw materials used in the production process and a reduction in non-recoverable waste. The implementation of circular strategies represents one of the possible trajectories to guide the ecological transition, and the proposed methodological framework can support the decisions of both producers and public decision-makers toward more sustainable and efficient production patterns.
1. Introduction
The benefits associated with improving resources and adopting Circular Economy (CE) practices are increasingly perceived by companies in any manufacturing sector. Despite this awareness, the adoption of circular practices is still lacking due to the presence of several barriers both technical related to the industrial stage and economic related to investments to initiate such practices (Roos Lindgreen et al., 2022). The current challenge lies with the ability of companies to be simultaneously competitive through continuous improvement of their business and attentive to society's consideration of the cost-benefit ratio related to socio-economic and environmental issues. On the other hand, it is also encountered that not always circular solutions lead to more sustainable outcomes; therefore, it is crucial to assess the sustainability impacts of CE practices before implementing them. To increase knowledge about the efficacy of circular approaches, appropriate measurements of circularity—and its sustainability—in real case studies could be useful to understand entrepreneurs, public policy and decision-makers who are interested in spreading such innovation (Chiaraluce, 2022). Simultaneous assessment of circularity and sustainability is still uncommon in the scientific literature (Stillitano et al., 2021), probably due to a lack of computational approaches and tools which have yet to be validated by scholars.
Since the CE has become the main topic when firms attempt to increase their business by facing resource scarcity and the need to reduce the environmental impacts, several easy-to-apply indicators have been developed over the years, to assess circularity at the micro-level referring only to the production context. Among them, the most widely used indicator is the Material Circularity Indicator (MCI), which focuses its analysis on material flows occurring about a process or product (Ellen MacArthur Foundation, 2015). However, a limitation lies in neglecting the nature of materials in circulation and overall, in not considering the impacts generated by circular strategies, by quantifying environmentally, economically, and socially with convenient measurement units. Therefore, for methodological completion, it is necessary to combine the MCI with other sustainability assessment tools such as Life Cycle (LC) ones (Goddin et al., 2019), i.e., Life Cycle Assessment (LCA), Life Cycle Costing (LCC), and Social Life Cycle Assessment (SLCA). LC approaches have long been recognized by the scientific community as tools enable to identify the potential hotspots in the life cycle phases of products, allowing to propose of mitigation strategies for more efficient and sustainable management (Ben Abdallah et al., 2022). CE is supposed to help the re-establishment of a new balance between ecological and economic systems, especially within the dynamics of agri-food systems (Cembalo et al., 2020), if the transition into circularity ensures reconciliation of the triple bottom line principles because not all circular practices are sustainable under all circumstances. Respecting circularity may cause environmental externalities, otherwise, it may not guarantee economic viability, making these two concepts not always interchangeable. So, measuring the effects on environmental, economic, and social dimensions is the sine qua non for assuring real sustainability based on the principles of the CE (Silvestri et al., 2022). Although the operational tools available to date are not yet at a level of maturity to overcome critical points for their effective integration in the agri-food sector (Stillitano et al., 2021), considerable efforts by the scientific community are being made in terms of methodological advances for circular economy studies (Niero and Kalbar, 2019). To go beyond these limitations, Stillitano et al. (2022) proposed a customized life cycle model with expanded assessment boundaries, including co-products valorization, into a multiple life cycle perspective (cradle-to-cradle), in an attempt to internalize circularity impacts. The model, conceived to be tested on the olive-oil sector, will offer guidance for life cycle scholars and practitioners, and help to legitimate firms' circularity claims.
Regarding LCA, this is one of the most applied metrics to measure the sustainability of CE pathways even if its use always turns out to be limited to evaluating only the environmental aspects of “supposed” circular systems, leaving the assessment of circularity out of the objectives of the study. LCA methodology has emerged over the past 20 years as one of the most effective tools for analyzing environmental issues related to the production of goods and services. The strong global push toward ecological transition has further put the spotlight on this methodology, which is now widely used in eco-design-oriented comparative analyses. Indeed, according to Stillitano et al. (2021), LCA is widely used for the evaluation of circular strategies for assessing the environmental loads of new technologies but also for the evaluation of circularity itself. The agribusiness sector is also a key player in this strong growth of LCA applications, representing a strategic sector for this “green revolution” since the sustainability of humankind depends on it.
In assessing the environmental impacts of new circular strategies, the implementation of the LCA methodology has been interpreted in various ways by scholars. Most research is limited to assessing the environmental impacts generated by the individual process of reuse, recycling, or recovery (e.g., Benalia et al., 2021) of wastes or by-products. This approach also does not allow for an assessment of the effects in terms of circularity, of these strategies, both concerning the product that generated the waste and by-products and the product that will use them once they are valorized (Stillitano et al., 2022). The solution may be to match the product life cycle whose circularity will be assessed with the life cycle whose environmental impacts will be assessed, integrating circular strategies within system boundaries.
Within the international scientific debate on sustainability assessment, Environmental Life Cycle Costing (ELCC) methodology has long attracted great interest. It has been defined as the logical counterpart of LCA analysis for economic evaluation, goes beyond mere cost accounting and is entirely compatible with LCA (Klöpffer and Renner, 2008). This methodology, in addition to the direct monetary flows of the product or service, allows for the estimation of external costs (externalities or environmental impacts), which are the equivalent monetary values of indirect damages that are not explicitly captured in the market (goods or services without a market) (Kerdlap and Cornago, 2021). In the context of a circular economy, the LCC approach can be applied to support the economic decision-making process for products and services. While the main circularity indicators are essentially based on the increase in the utility of resources within an economic model, an approach that assesses the life cycle value flows of a product, process or system is an important complement to both circularity and sustainability assessment. Several academics attempted to use ELCC aligned with LCA to integrate the environmental and economic assessment of closed-loop pathways in the agri-food sector. For example, applicative studies include bale wrap films collection from the agricultural sector (Mayanti and Helo, 2022), food packaging systems (Albuquerque et al., 2019), wastewater management systems to recover nutrients (Estévez et al., 2022). In all the studies analyzed, the most common practice for aligning both tools was to adopt a common database, consider the same functional units and system boundaries, and follow the same methodological steps. Although the use of such a structure does not guarantee synergy as debated by Heijungs et al. (2013), given the lack of standardization for the integration of LCA and LCC, this practice offers the opportunity for closer alignment between these tools (Bradley et al., 2018; Rödger et al., 2018).
In terms of LCA, ELCC, and MCI integration, only three studies have addressed the simultaneous application of these methodologies in the agribusiness sector, which focused on poultry production (Rocchi et al., 2021), urban agriculture (Rufí-Salís et al., 2021), and beer packaging (Niero and Kalbar, 2019).
Starting from these considerations, this work presents a methodological proposal based on LC methodologies, and circularity performance indicators, to assess closed-loop pathways by providing comprehensive results on economic and environmental impacts generated by agri-food production systems. The main objective is to analyze the environmental, economic and circularity performance of applying circular strategies in olive oil systems, by using LCA, ELCC, and MCI approaches. The olive oil sector is one of the main consumers of resources and producers of wastes in both olive cultivation (wood, branches, and leaves) and processing phases (olive pomace, olive mill wastewater, and olive stones). These wastes, if not properly managed, have a high environmental impact and high costs. The adoption of CE strategies throughout the olive-oil supply chain makes wastes amenable to transformation into by-products, allowing them to be valorized as a possible resource that can be converted into a source of income for the farm (e.g., energy, organic matter, irrigation water). To the best of our knowledge, this is the first integrated evaluation using life cycle and circularity metrics for the transition to CE in the olive oil sector. This work attempts to provide some insights into co-products valorization, through the reuse of by-products as a possible resource capable to improve the sustainability of olive oil farms.
2. Materials and methods
2.1. Case study description
Among the Mediterranean countries, Italy represents the third largest producer of olive oil, with 274,000 tons (about 9.1% of world production) and the second consumer, with 479,000 tons (15.3% of consumption worldwide), although the forecast statistics record a decrease in production levels (IOC, 2021). Olive cultivation is mostly confined to southern regions, Apulia, Calabria and Sicily, which overall account for about 70% of the national olive oil production (ISTAT, 2021). Focusing on the Calabria region, in which olive growing plays a significant economic role, particularly in rural contexts (Bernardi et al., 2021), the EVOO production counts for only 24% of total Italian production, because of the considerable qualitative heterogeneity of product, which involves the consequent difficulty in market placement. However, over the last few years, many olive farms are being characterized by the production of high-quality olive oil, due to both the more efficient farming management and the adoption of product and process innovations, to meet the consumer's needs and, therefore, moving toward a market more competitive (Hamam et al., 2022; Zanchini et al., 2022). In terms of circular economy, recently regional olive farms have been moving toward adopting closed-loop strategies mainly based on the valorization of pruning residues, olive oil mill wastewater and olive pomace, transforming them into co-products through techniques that foresee its reuse or recycling.
To analyze the performance of circular strategies with real data, we took over a “circular” olive oil farm (circular scenario) compared to a “linear” olive oil farm (linear scenario) as case studies (Figure 1). Both farms are in Catanzaro's province (Calabria), which maintains the largest share of olive trees spreading, and share the following characteristics: olive-growing area of 100 ha, Olea europea L. cultivar Carolea, orchards with 40-year-old trees, planting density of about 200 plants/ha, and a high level of farm mechanization. The olive oil production system in both farms was split into two main subsystems: the olive growing and harvesting phase, and the olive oil extraction phase. Regarding the first phase, in the circular scenario, pruning residues are shredded and buried in the ground, while in the linear scenario, shredded pruning residues are sent to external companies as biomass. As for EVO oil extraction, in the circular scenario, olive processing takes place in a continuous olive mill with a total capacity of 10,000 kg per hour. Centrifugal separation takes place in a two-stage decanter, where the paste is not diluted with water. The olive pomace obtained is separated from the olive pits. The latter is partly (10%) reused as thermal energy in the mill. The 33% of pomace nut-free, to which olive leaves are added, is used for organic fertilization of the farm's soils, and the remaining 67% is sent to a biogas plant. In the linear scenario, olive processing takes place in a continuous olive mill with a total capacity of 10,000 kg per hour. Centrifugal separation takes place in a three-phase decanter, where the paste has been diluted with 40% of water. All olive pomace obtained (100%) is sent to the pomace factory for olive pomace oil extraction. The olive pits are not separated from the pomace. Summing up, in the circular scenario, applications concern the pruning residues that are shredded and buried in the soil, the spreading in the field of 1/3 of the stoned two-phase pomace produced during oil extraction, and the use of olive pits extracted from the two-phase pomace to produce the thermal energy needed by the olive mill. In the linear scenario, on the other hand, the pruning residues are given to other farms as biomass, and the pomace obtained from the extraction stage is entirely given to the industrial plant for pomace oil extraction, without separating the olive pits.
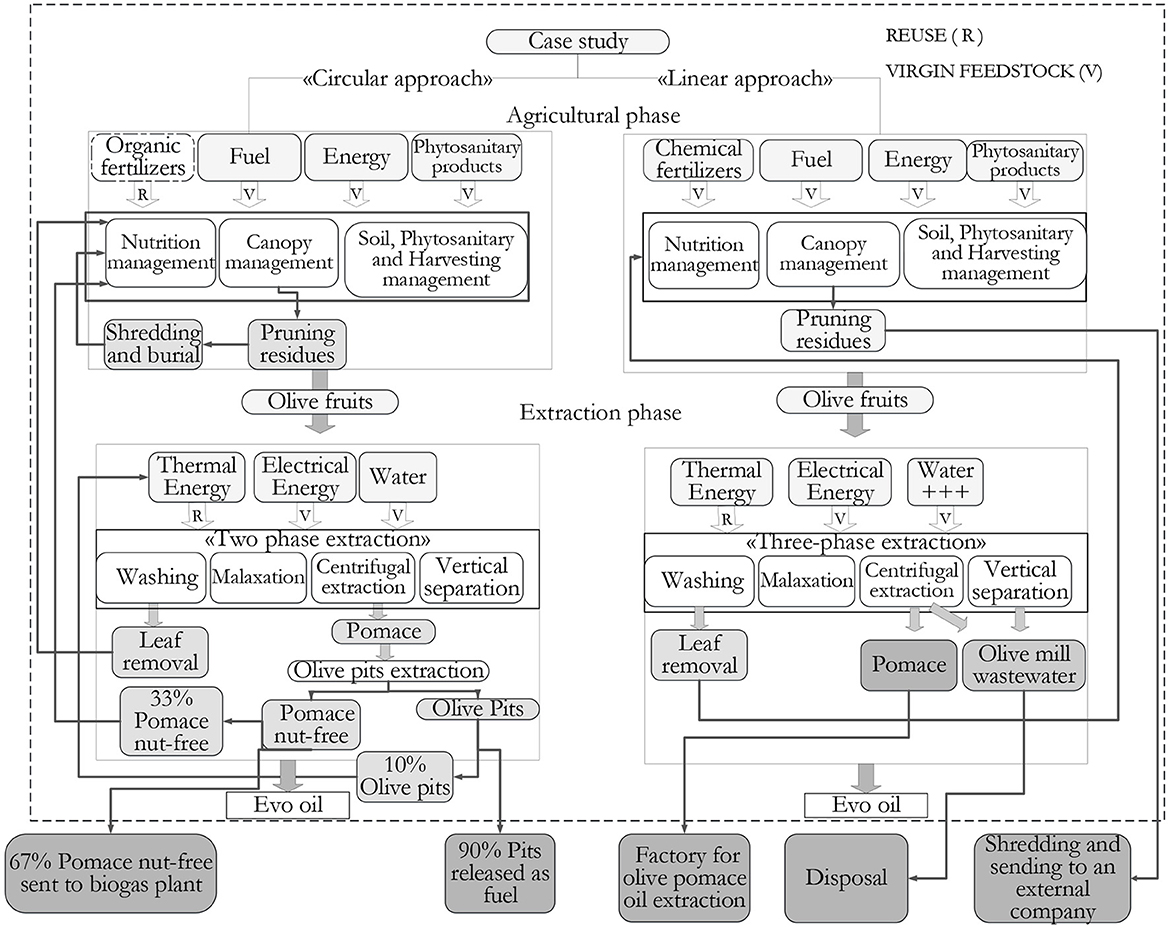
Figure 1. Circular and linear scenarios under assessment (Source: Authors' elaboration).
2.2. Life Cycle Assessment implementation to the case study
The environmental sustainability assessment was performed using the LCA methodology according to ISO 14040 and 14044 (ISO, 2021a,b). The first step, as described in the aforementioned standards, is to define the goal and scope of the study. The definition of the goal helps to clarify the reasons for carrying out the study, which main elements are to be investigated and to which target audience the study is addressed. Through the contextualization of the study, it is now possible to define the scope in which all the requirements for conducting the life cycle study are defined, such as those relating to the modeling of the production system, the means of obtaining data and the methods for evaluating the results (Hauschild et al., 2018). LCA will be applied to compare two Extra Virgin Olive Oil production systems. In particular, a conventional production system (linear scenario) will be compared with a production system in which circular strategies of reuse, recovery and recycling are introduced (circular scenario). The comparison will aim to verify whether the implementation of these strategies contributes to improving the environmental profiles of EVOO. In order to evaluate the impacts of the two different production techniques on the product, the functional unit will refer to the production of “1 kg of EVOO.” The system boundaries under consideration extend “from cradle to oil mill gate” and include upstream processes for olives production and core processes for olive oil milling. An economic allocation system was used for the mill products and in particular, by-products of the linear scenario were considered on the basis of the value paid by the pomace factories instead a zero value was attributed to the flows that are managed as waste, while in the circular scenario the percentage to be allocated to olive husk was determined based on its market price while that of pomace was determined on the basis of the surrogate value of the nitrogen component of fertilizers. Given the extensiveness of the biological cycle of the olive tree, it was decided to exclude the planting and early orchard development phases from the environmental analysis since the impact of these phases on the environmental profile of 1 kg of oil would have been negligible. The analyses were therefore limited to the average of four production years (2020/21, 2019/20, 2018/19, 2017/18) at the full maturity stage of the trees (corresponding to the constant production phase), including two years of full production and two years of low yields, in order to consider the alternating bearing phenomenon. The second step of the LCA is the compilation of the Life Cycle Inventory (Table 1).
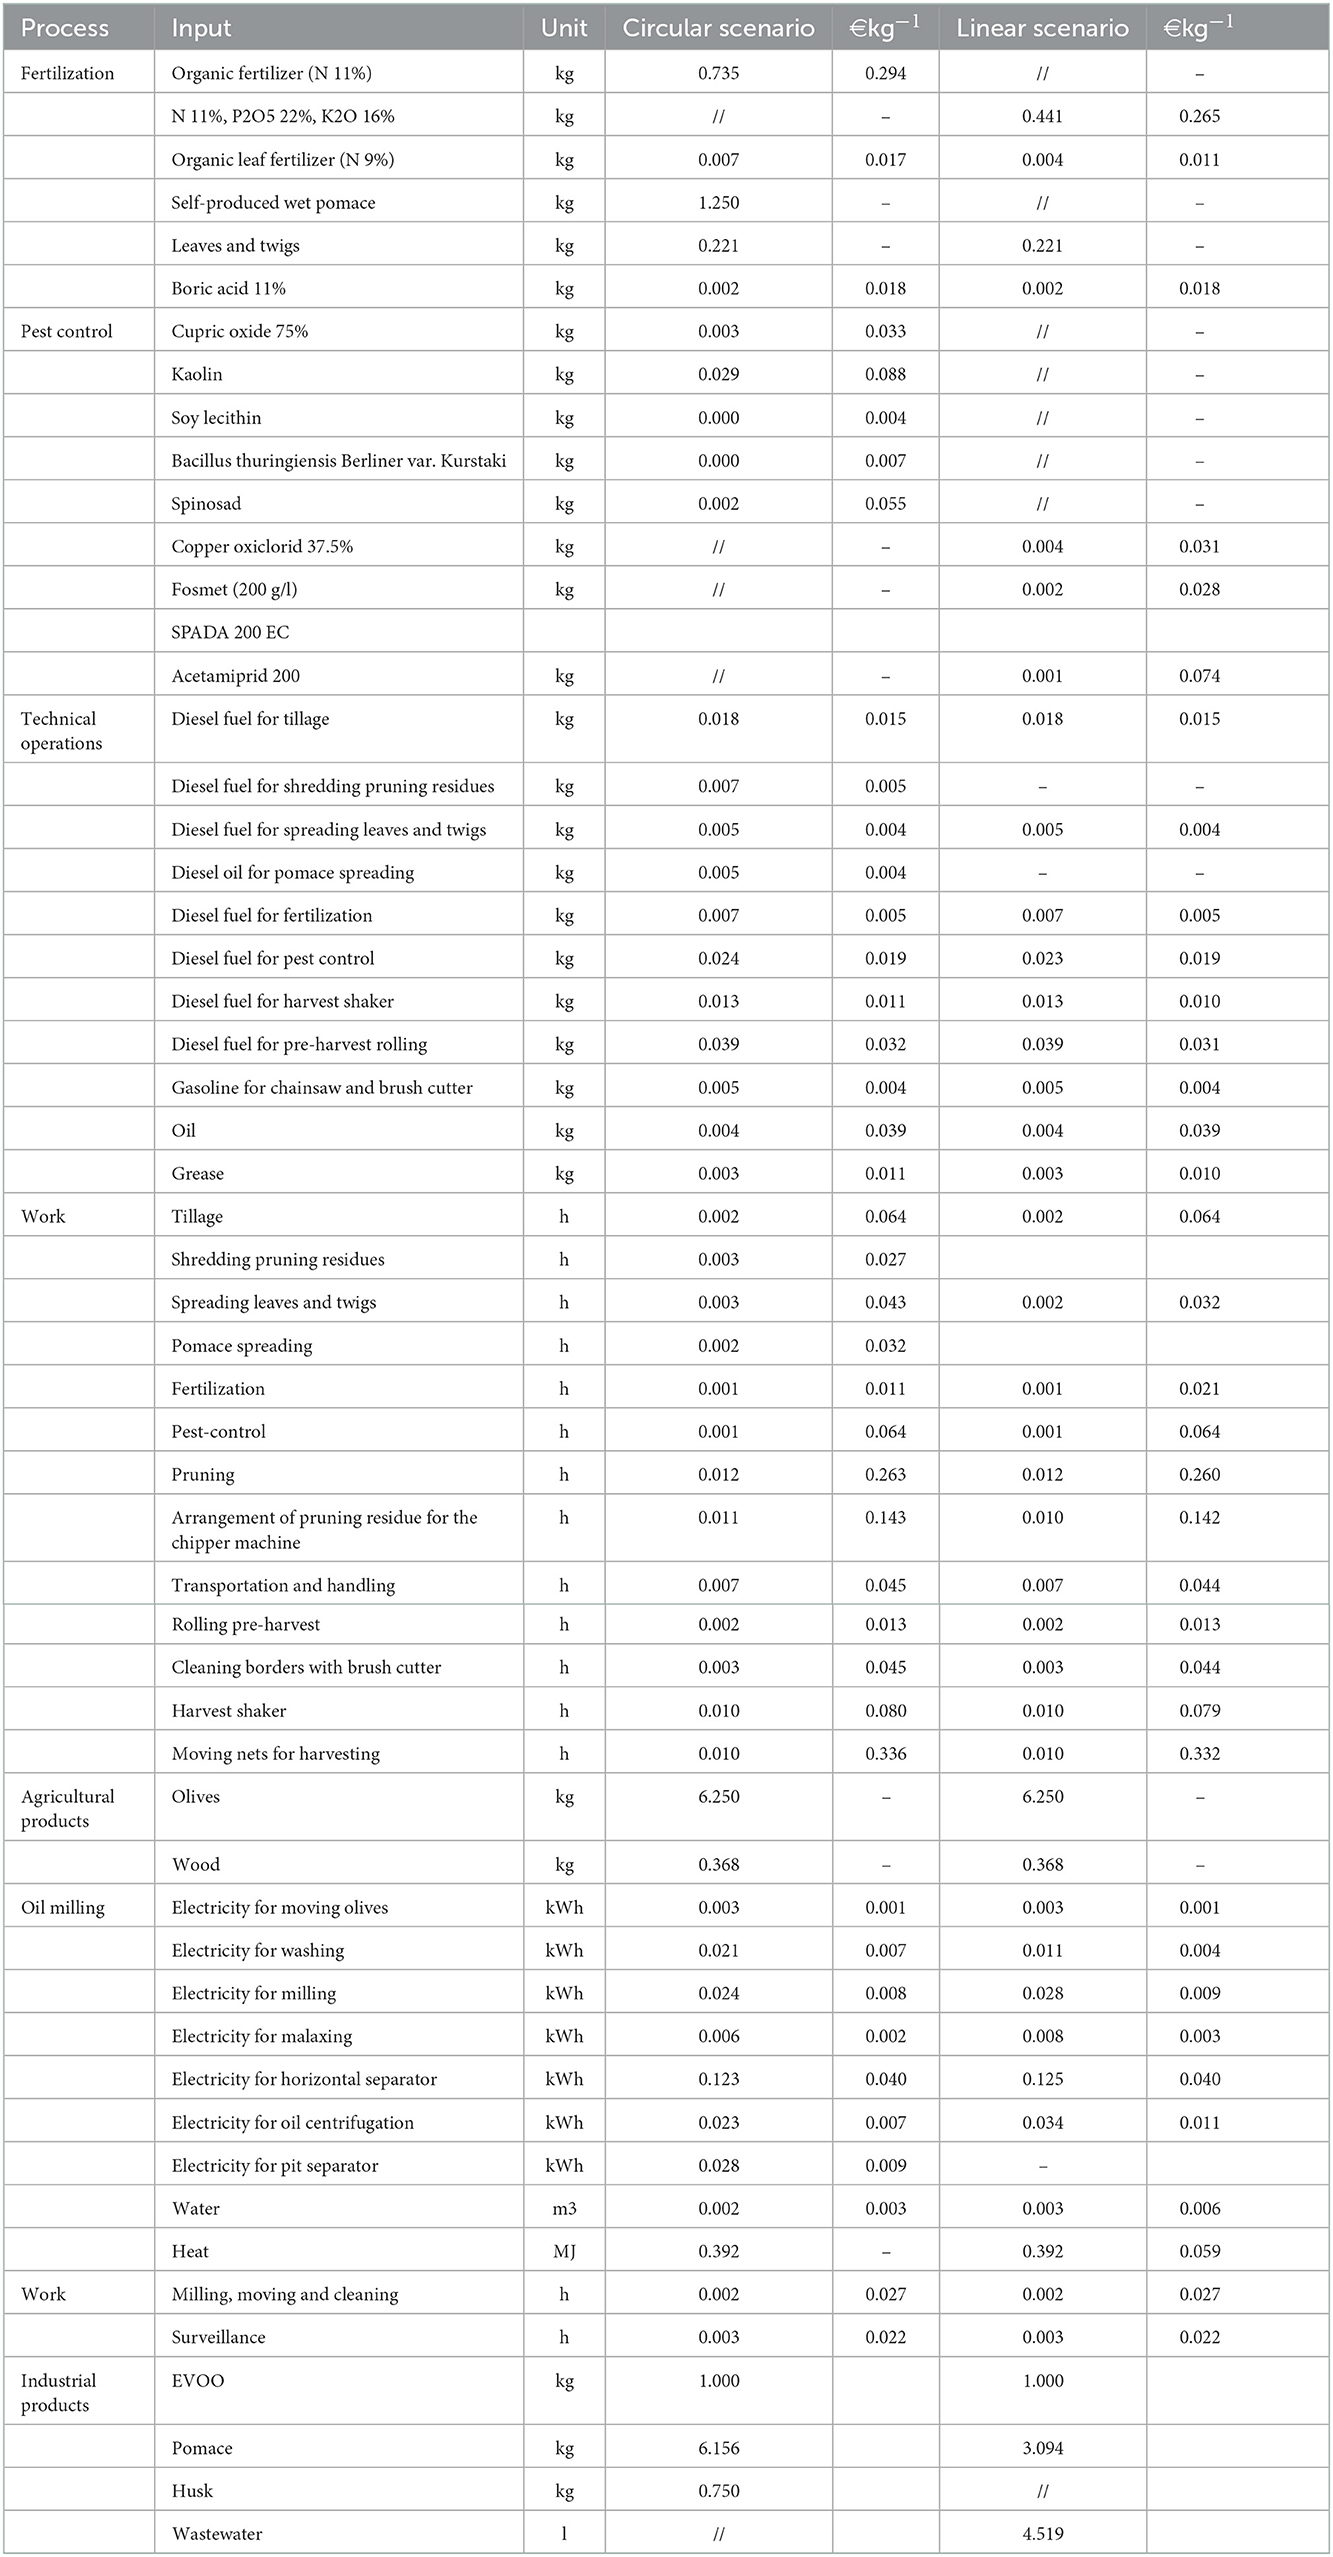
Table 1. Simplified environmental and economic life cycle inventory.
The processing data are “primary data” collected directly from the study companies through a specific questionnaire. In particular were collected: data on the duration of tillage operation, fuel consumption, maintenance and typology of machinery involved; data on quantity, typology, number of fertilizers and phytosanitary compounds, and the related periods of application; data on yield of olives and wood from pruning. Regarding the data on oil mill unitary processes, were collected the following elements: the energy consumption of the crusher measured using the tools of the Fluke 179 True RMS digital multimeter; the data on water consumption were measured using a flowmeter and the data on the fuel used for heating were measured using the flowmeter installed in the system. Through the methodology described by Zampori and Pant (2019), atmospheric emissions of N2O, NOX, NH3, and NO3 emissions in water were estimated. P emissions to water were estimated using SALCA-P emission models (Prasuhn, 2006). Emissions to soil, air and water were calculated according to the assumptions reported by Zampori and Pant (2019). Emissions from fuel combustion were estimated according to Nemecek and Kägi (2007). Secondary data on background processes were obtained from Ecoinvent 3.7 (Weidema et al., 2013).
All the steps described so far were also shared with the life cycle cost analysis, the inventory of which, however, was realized by monetizing the material and energy flows of the environmental inventory (see Table 1).
The environmental inventory data were processed using SimaPro 9.2 software (Goedkoop et al., 2013). Life Cycle Impact Assessment was carried out by the Re.Ci.Pe 2016 Midpoint Impact Assessment method (Huijbregts et al., 2017) through 18 impact categories.
2.3. Environmental Life Cycle Costing implementation to the case study
The economic analysis was carried out through the ELCC methodology, aligned with LCA to evaluate the internal and external costs of the scenarios under study. To align ELCC with LCA a common database was adopted, considering the same functional unit and system boundaries, and following the same methodological steps.
The internal costs include all costs incurred throughout the life cycle of each scenario. For the purpose of this analysis, the whole life cycle of the agricultural phase (60 years) per scenario was divided into six main stages: (1) planting stage (year 0), (2) unproductive stage (1st-4th year), (3) increasing production stage (5th-15th year), (4) constant production stage (16th-56th year), (5) decreasing production stage (57th-60th year), (6) end-of-life stage (60th year). All costs were organized into plantation costs, where the design cost (i.e., soil chemical analysis, choice of cultivar, and design of planting distance) and initial investment cost (i.e., the quota on land improvements, the purchasing of plant propagation material, the rental cost of machinery for holes diggings and tree grubbing up) were taken into account; operating costs during the production stages and linked to agricultural operations; and-end-of life costs, i.e., disposal costs arising from the plant removal. Concerning the olive oil extraction phase, the full life cycle (20 years) was split into three stages: (1) start-up stage, (2) operational stage, and (3) end-of-life stage. Within the start-up stage, design and initial investment costs for the extraction component were considered. The costs related to the operational stage included all operating costs of the olive oil extraction. At the end-of-life stage, the disposal cost resulting from the removal of the extraction plant was estimated as the residual value of the machinery and calculated at 50% of the cost of construction. Particularly, operating costs were split into variable (material and energy costs, human labor cost, interests on advance capital) and fixed costs (ownership costs of investments in machinery and land, i.e., depreciation, insurance, repairs and maintenance, interests on capital goods, rental shed, taxes, and administration overheads) for each life cycle stage.
The external costs concern the monetization of externalities by assigning a specific value to the environmental impacts of a product. To date, the main path for calculating externalities and integrating LCA-LCC is to monetize environmental impacts resulting from LCA studies, struggling to translate environmental impacts into economic impacts. Thus, starting from the LCA results obtained here, the Environmental Prices approach (de Bruyn et al., 2018), which expresses the WTP for less environmental pollution in Euros per kilogram of pollutant, is applied through the SimaPro software to evaluate external costs. Operatively, a monetary weight is given to each environmental indicator by applying the corresponding external cost factor. The environmental indicator referred to the reference unit selected for the LCA under study; the external cost factors accounted for different environmental impacts were taken from Environmental Prices Handbook. The environmental prices identified provide average values for the EU28, for emissions from an average emission source at an average emission site in the year 2015 and are distinguished according to the environmental categories assessed (de Bruyn et al., 2018; Durão et al., 2019).
Subsequently, preparatory to the investment analysis, the total revenues for the entire life cycle of each scenario were calculated by multiplying the product yields (olive and EVO oil) by their market price, which referred to the last harvest season, i.e. 2021/2022, including EU Agricultural Policy subsidies. Table 2 shows the main assumptions made in the study.
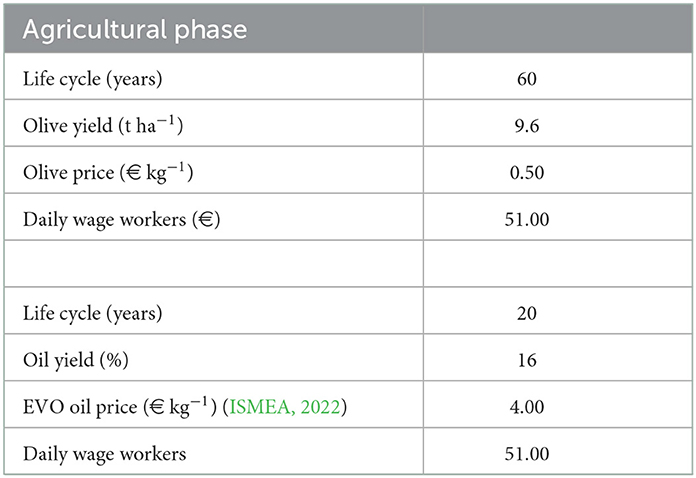
Table 2. Main technical and economic parameters adopted in the study for both scenarios.
2.4. Investment analysis
As a final step, an investment analysis was carried out by calculating specific indicators, i.e., Net Present Value (NPV), Internal Rate of Return (IRR), Discounted Gross Margin (DGM), and Payback Period (PBP). These represent the most common indicators used to compare investment options, which are based on the cash flow model (Stillitano et al., 2019; Ben Abdallah et al., 2022).
The NPV and IRR indicators were calculated according to Equations (1) and (2), respectively, as suggested by Moreno et al. (2017):
where, t is the time of the cash flow (year); n is the investment lifetime; CF is the net cash flow in the t-th year; r is the discount rate; I0 is the initial investment; and TP is the total oil production. NPV indicator value has been defined for the FU of 1 kg of EVO oil.
where IRR is the discount rate, which will make the NPV equal to zero.
When the conditions NPV > 0 and IRR > r occur, the investment is profitable; otherwise, it should be rejected.
The formula for calculating the PBP indicator is presented in Equation (3), as proposed by Tse et al. (2016):
where, LNC is the last period with a negative discount cumulative cash flow; ADC is the absolute value of discount cumulative cash flow at the end of the period LNC; DCA is the discount cash flow during the period after LNC. The payback period, defined as the expected number of years required to recover the initial investment, is often used as an indicator of a project's riskiness (Mastoras et al., 2022). In any case, the payback period must be shorter than the time horizon considered.
The DGM indicator provides information on project profitability as advised by Stillitano et al. (2019) defined in Equation (4):
where TRt is the total revenue in the t-th year; VCt is the variable cost in the t-th year; t is the time of the cash flow (year); n is the investment lifetime; r is the discount rate and TP is the total oil production. DGM indicator value has been defined for the FU of 1 kg of EVO oil.
To perform the profitability analysis of the scenarios under study all of the costs and revenues were discounted for the entire life cycle of 60 years (olive grove lifetime) and 20 years (oil mill lifetime), for the agricultural phase and extraction phase, respectively. To select a discount rate, the opportunity cost approach in terms of alternative investments with similar risks and times was used (De Luca et al., 2018). Here, a discount rate set to 2 and 5% was assumed for the agricultural phase and extraction phase, respectively. During the life cycle, constant prices by excluding adjustments for inflation were taken into account (Hussain et al., 2005).
2.5. Material Circularity Indicator implementation to the case study
The circularity assessment was performed by calculating the Material Circularity Indicator (MCI), which measures how much linear flow has been minimized and remedial flow maximized for its components and, at the same time, for how long and intensively (Rocchi et al., 2021). The MCI has a range of values from 0 (100% linear) to 1 (100% circular). According to the Ellen MacArthur Foundation (2015) and Goddin et al. (2019), the formula for calculating the MCI of a product is as follows (Equation 5):
where LFI represents the Linear Flow Index, i.e., the percentage of material flow originating from virgin sources and ending up as non-recoverable waste, while F(X) represents the utility-constructed factor of the linear component of material flows.
LFI is computed by dividing the amount of material flowing in a linear chain by the sum of the amounts of material flowing in a linear and a restorative chain. The index takes a value between 1 and 0, where 1 is a completely linear flow and 0 is a completely restorative flow. The index is derived by Equation (6):
where, V is the mass of virgin raw material used in manufacturing; W0 is the mass of non-recoverable waste attributed to the product, while M is the mass of the finished product. V and W0 are computed by the Equations (7) and (8), respectively:
where FR represents the recycled fraction of the feedstock, FU the fraction from reused sources, and FS the fraction of the biological materials used which originate from sustained production; while CR represent the fraction of the product collected for recycling at the end of its use phase, CU the fraction of the product going into component reuse, CC the mass of the product comprising uncontaminated biological materials that are composted, and CE the mass of the product comprising biological materials from sustained production used for energy recovery.
Finally, F(X) is defined in the Equation (9):
where the utility X considers the length and intensity of the product's use phase. The length component (L/Lav) accounts for any reduction (or increase) in the waste stream in a given amount of time for products that have a longer (or shorter) lifetime (L) than the industry average (Lav). The intensity of use component (U/Uav) reflects the extent to which a product is used to its full capacity, relating the average number of functional units achieved during the use of a product (U) and the average number of functional units achieved during the use of an industry-average product of similar type (Uav). These two components are combined as follows:
For assessing the circularity degree, inputs and outputs have been defined for each scenario. In the circular scenario, among the inputs, we find pruning residues, part of the biphasic pomace, and leaves and olive pits that are “reused components” in the production process; organic fertilizer from “recycled” sources; as well as pesticides, water, fuels, and energy from virgin raw materials. Among the outputs, we find the residual part of pomace and olive pits as “recoverable waste” for energy valorization. In the linear scenario, the inputs such as fertilizers, pesticides, water, fuels, and energy are all derived from virgin raw materials, while the outputs include the pruning residues as “recoverable waste” for “energy valorization,” the pomace and vegetation water that represent a waste “recoverable for other uses.”
Finally, to assess the uncertainty of MCI results, the variance of the data collected for the four production years (2020/21, 2019/20, 2018/19, 2017/18) was evaluated and then, the value of the MCI within the range of variance was calculated.
Furthermore, to integrate life cycle-based and circularity indicators and jointly evaluate the environmental and economic performance of the two scenarios also in the light of the increase or decrease of the circularity level measured by MCI, the marginal variation of the circular scenario compared to the linear scenario was assessed relying on the following equation (Equation 11):
where, MVIi, j represents the value of Marginal Variation of the i-th Impact indicator for the j-th scenario (1=linear/2=circular); ΔIi, j is the percentage deviation between the i-th Impact indicator for the j-th scenario; ΔMCIj represents the difference between the values of MCI for the j-th scenario.
Considering the environmental and economic impacts and the level of circularity of the linear scenario as baseline, the positive and negative deviations for the specific indicators was accounted and compared to the positive or negative deviation of the MCI.
3. Results
3.1. LCA results
The impact assessment using the Re.Ci.Pe method shows an advantage in almost all impact categories for the circular scenario (Table 3). The improvement of performance ranges from a reduction of 4% in “Fine Particulate Matter Formation” impact category to a reduction of 75.56% in the “Freshwater eutrophication” category. On average, therefore, there is an improvement of about 40% in all impact categories except for “Stratospheric ozone depletion,” “Terrestrial acidification,” and “Marine eutrophication,” categories where the circular scenario shows higher impacts. For the first of these three impact categories, the worsening is caused by field emissions and, in particular, dinitrogen monoxide emissions caused by the distribution of more nitrogen fertilizers. The same causes are also to be found for the other two impact categories, where the largest contributors are, for the “Terrestrial Acidification” category, the highest ammonia and nitrogen monoxide emissions and, for the “Marine Eutrophication” category, the highest nitrate emissions.
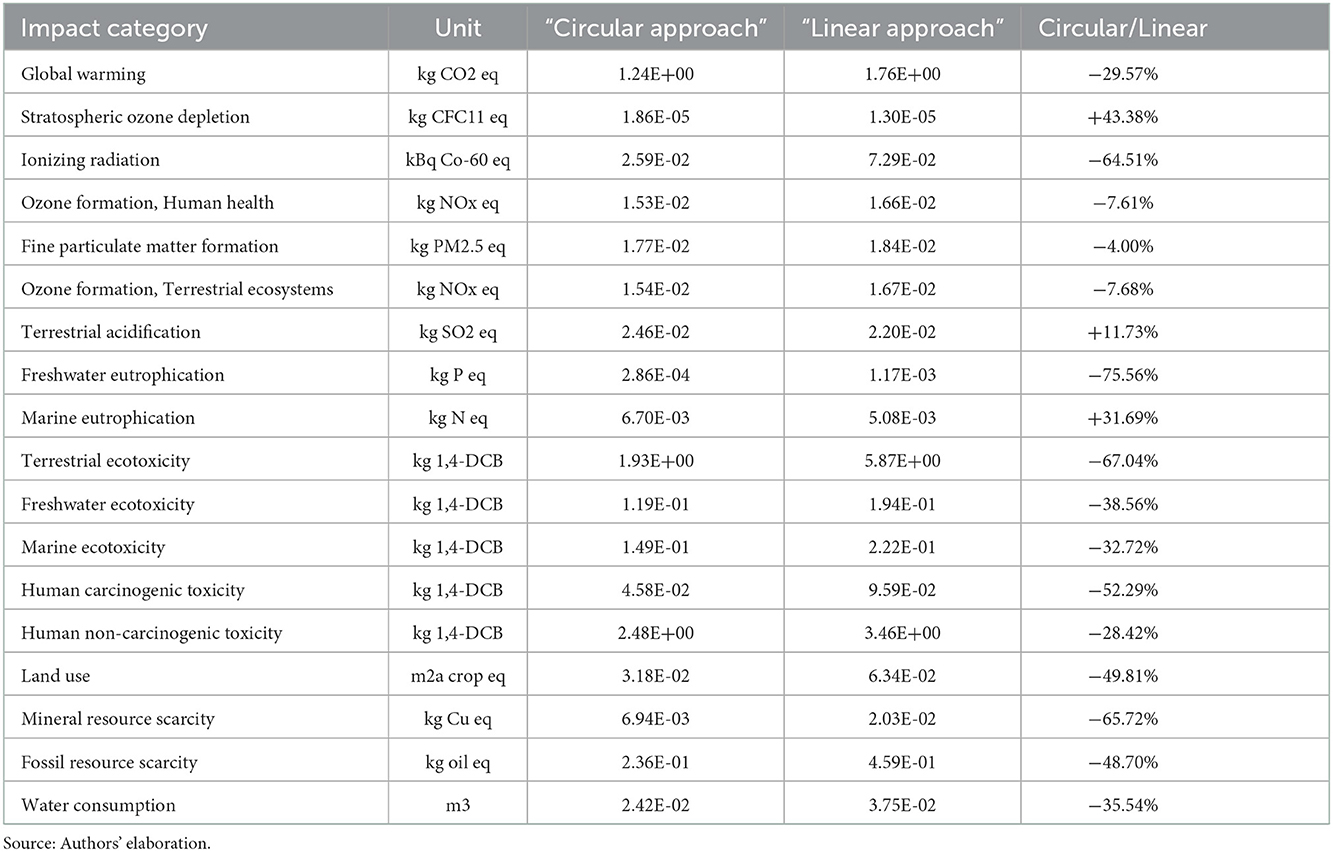
Table 3. Characterization of impacts related to 1 kg of EVOO.
The contribution analysis of impacts (Figure 2) also confirms that fertilization is the first hotspot related to nitrogen distribution. Indeed, the circular scenario uses almost double the amount of nitrogen and this results in higher emissions of N2O, NOx, NH3, and NO3, especially for “Stratospheric ozone depletion” (98.09%), and “Fine particulate matter formation” (95.87%). In the linear scenario, the impacts related to synthetic fertilizer production are more significant for “Ionizing radiation” (65.77%) and “Mineral Resources Scarcity” (66.20%). For both scenarios, the second hotspot is the production of pesticides, which affects mainly the following categories: “Marine ecotoxicity,” and “Freshwater ecotoxicity.” For the “Water consumption” category, the major contribution is due to the milling phase, especially for the circular scenario. Wastewater disposal only affects the linear scenario using a three-stage extraction system and causes a significant impact in the Freshwater eutrophication (36.38%) and Marine eutrophication (16.66%) categories. It should be noted that wastewater treatment generates a positive impact in terms of treated water available for the ecosystem.
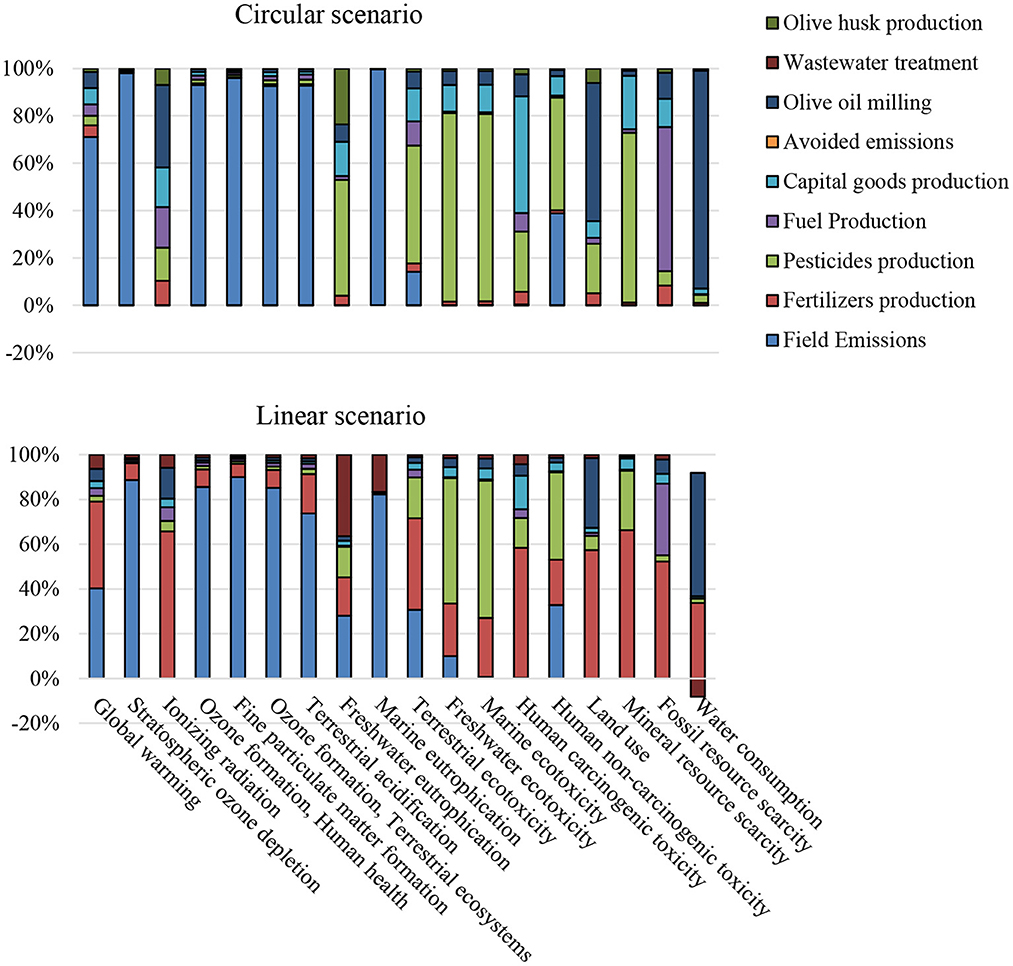
Figure 2. Contribution analysis of EVO oil production (Source: Authors' elaboration).
3.2. ELCC results
Table 4 shows the main results of the economic assessment referred to the internal costs of the agricultural phase. In line with the proposed methodology, all costs were quantified for each life cycle stage of the olive scenarios. In terms of investment cost in the planting stage, the worst performance is reached by the circular scenario, equal to 7,555.40 vs. …7,495.40 €ha−1 year−1 attained by the linear one. This is due to the higher costs for the purchase of both the pomace spreading and shredding machines. In contrast, as we move into the other stages of the life cycle, the circular scenario achieves the best performance, although a general increase in costs is found in both scenarios because of the more complex management of olive groves linked to harvesting and pruning operations that are carried out from these stages.
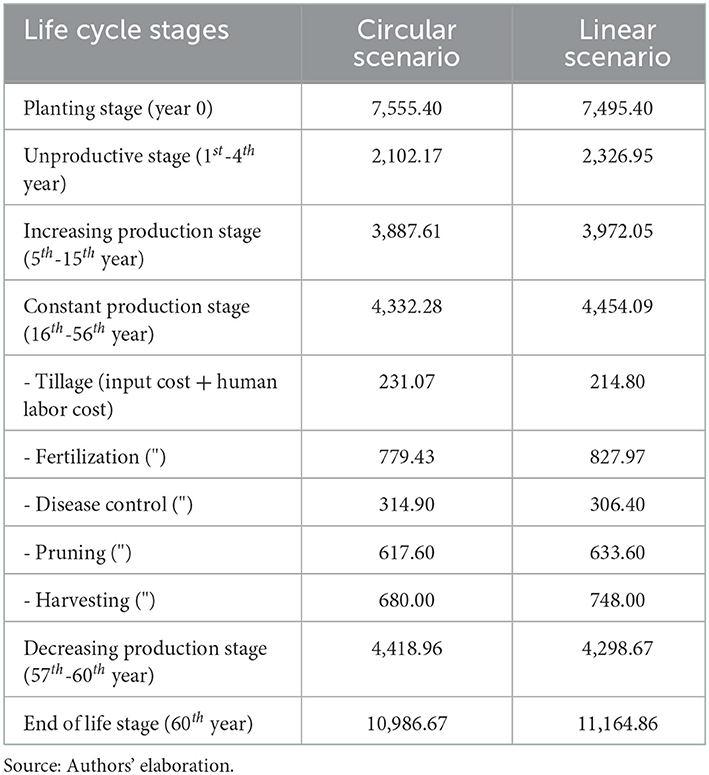
Table 4. Olive production costs of the circular vs. linear scenario per life cycle stages (€ ha−1 year−1).
Focusing on the constant production stage, the best results achieved by the circular scenario, with a value of 4,332.28 vs. …4,454.09 €ha−1 year−1 reached by the linear one, are mainly due to lower fertilizer purchase, because of the reuse of the co-products such as pruning residues, olive pomace and olive pits that return to the production cycle as an input. Specifically, olive pits return to the oil mill for producing thermal energy.
The olive oil production costs incurred during the extraction phase for the two scenarios examined are shown in Table 5, highlighting the variable and fixed costs per kg of product obtained. The extraction cost is higher in the circular scenario, with a value of 0.41 vs. …0.39 €kg−1 reached in the linear scenario, with an increase of 5.13%.
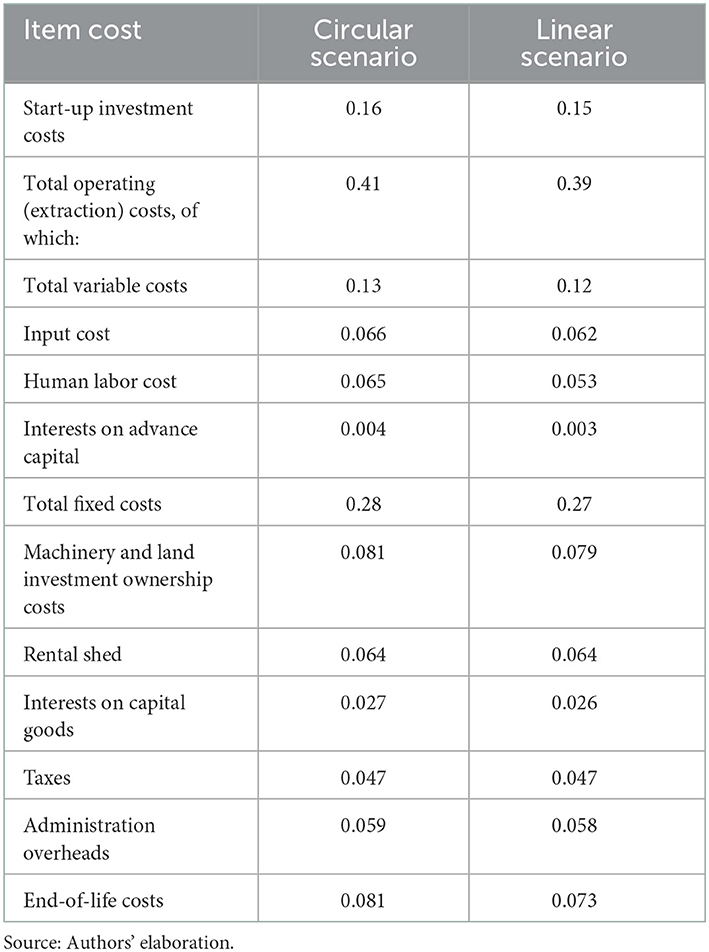
Table 5. Olive oil extraction costs of the circular vs. linear scenario (€kg−1).
This is mainly due to the higher start-up investment costs incurred for the purchase of an olive pit separator, used to extract olive pits from the two-phase pomace to produce the thermal energy required by the olive mill. These costs translate into the highest fixed costs (0.28 vs. …0.27 €kg−1) for the quota of the machinery and land investment ownership (i.e. depreciation, insurance, repairs, and maintenance). Concerning variable costs, the highest incidence reached by the circular scenario is due to the higher input cost (0.066 vs. …0.062 €kg−1), and human labor cost (0.065 vs. … 0.053 €kg−1) due to the increased use of manpower to manage the operations associated with the production of olive pits.
By adding the olive production cost and the operating cost of olive oil extraction, the total production cost of EVO oil for both scenarios was obtained, as shown in Figure 3. The cost of olive production was estimated by dividing the operating cost incurred in the constant production stage by the olive yield and then multiplying the value thus obtained by the amount of olives needed to obtain one kilogram of oil. The olive production cost was lower for the circular scenario with a value of 1.87 €kg−1 than that achieved in the linear scenario of 1.94 €kg−1, with a reduction of 3.62%. The final results showed the best performance reached by the circular system with an EVO oil production cost of 2.28 vs. … 2.33 €kg−1 obtained from the linear one (−2.16%).
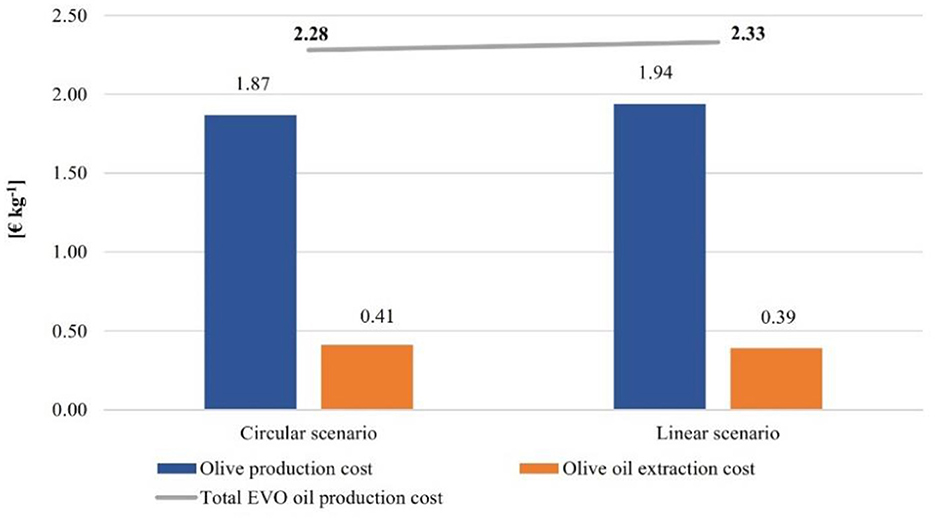
Figure 3. Total costs of EVO oil production per scenario (Source: Authors' elaboration).
The results of the evaluation of external costs per scenario are reported in Figure 4. In line with LCA results, the environmental cost contribution analysis revealed that the olive production phase is the most impactful compared to the extraction phase in both scenarios. However, the circular scenario showed the best results with a deviation of 3.71% compared to the linear scenario. The impact categories producing the greatest externalities were particulate matter formation with 64.83% of the total (vs. …64.77% of the linear scenario) and terrestrial acidification (17.5 vs. 14.0%). The climate change category achieved the lowest environmental costs in the circular scenario (5.96 vs. 8.04) due to lower emissions for fertilizer production.
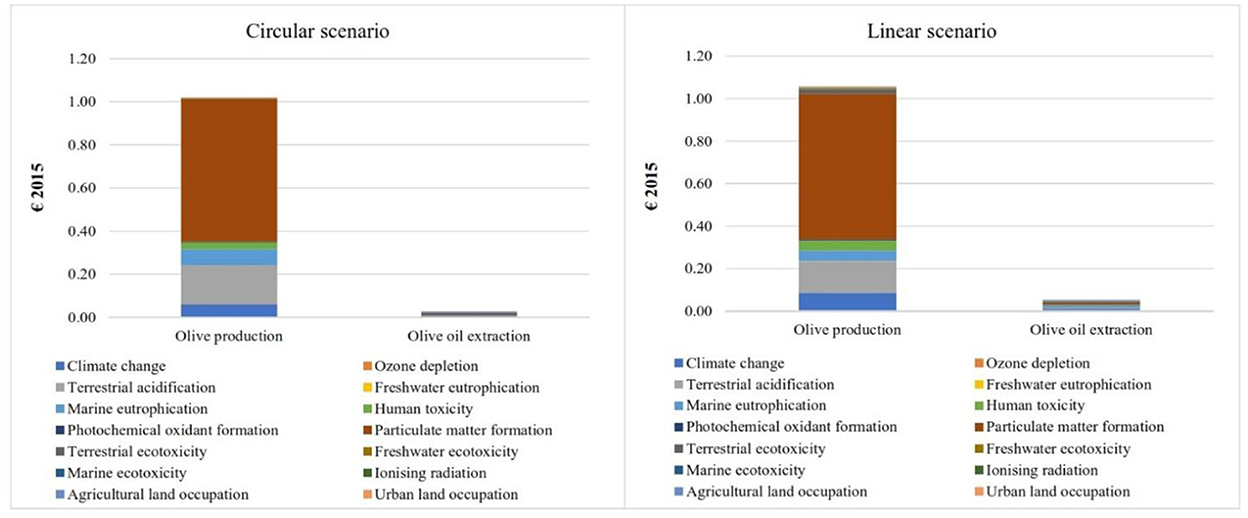
Figure 4. Environmental cost contribution analysis (Source: Authors' elaboration).
3.3. Investment analysis results
The findings of the investment feasibility analysis revealed that, in the EVO oil production phase, the circular system was the most economically feasible alternative, presenting an NPV equal to 0.91 €kg−1 (vs. 0.59 €kg−1 of the linear one) and an IRR of 40.30% (vs. 40.10%) (Table 6). Furthermore, according to the oil mill lifetime of 20 years, the proposed scenario had a payback period of 2.58 years (vs. 2.71 years), indicating a full recovery of the initial investment.
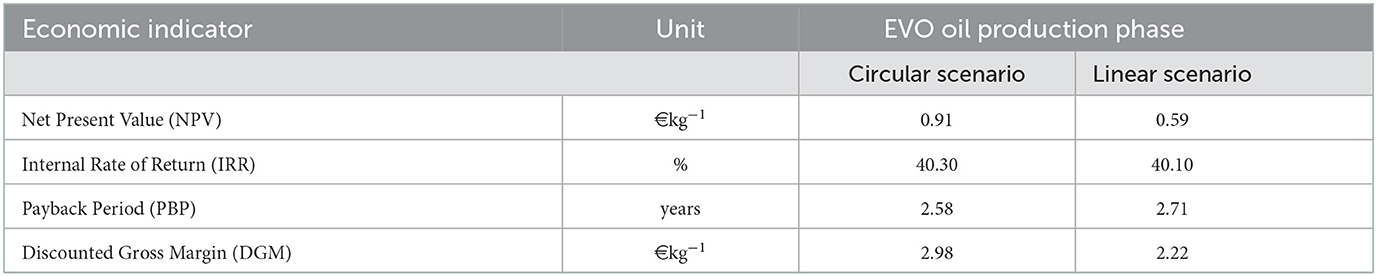
Table 6. Investment analysis of the circular vs. linear scenario.
Finally, also in terms of the DGM indicator, which amounts to 2.98 €kg−1 (vs. 2.22 €kg−1), the circular scenario was the most profitable and economically feasible alternative. The higher profitability of the circular system was positively affected by the lower input costs incurred in the agricultural phase and the increased revenue from the additional sale of olive pits, which reaches a selling price of 0.15 €kg−1 and are used for household heating.
It should be noted that the profitability of both scenarios has been positively affected by including European subsidies. A sensitivity analysis carried out by excluding public subsidies revealed adverse results for both systems, proving that olive grove management is not sustainable and economically viable. This suggests that olive growing in many Mediterranean countries is still heavily dependent on public intervention.
3.4. MCI results
The MCI results show that the best performance is effectively achieved by the circular scenario with a value of 0.68 out of 1, unlike the linear scenario in which the MCI reaches a value of 0.53 out of 1 (Table 7). This better result is due to both a lower quantity of virgin raw materials (V), because of the reuse of the co-products obtained in both agricultural and extraction phases, and lower production of unrecoverable waste (W). Owing to the lack of studies applying MCI to the olive oil system, it is difficult to contextualize its score. The only applications of the MCI to the agricultural system concerned tomato production in the study by Rufí-Salís et al. (2021), with an MCI value of 0.46 out of 1, and the poultry sector in Rocchi et al. (2021), with a value of 0.48 out of 1.
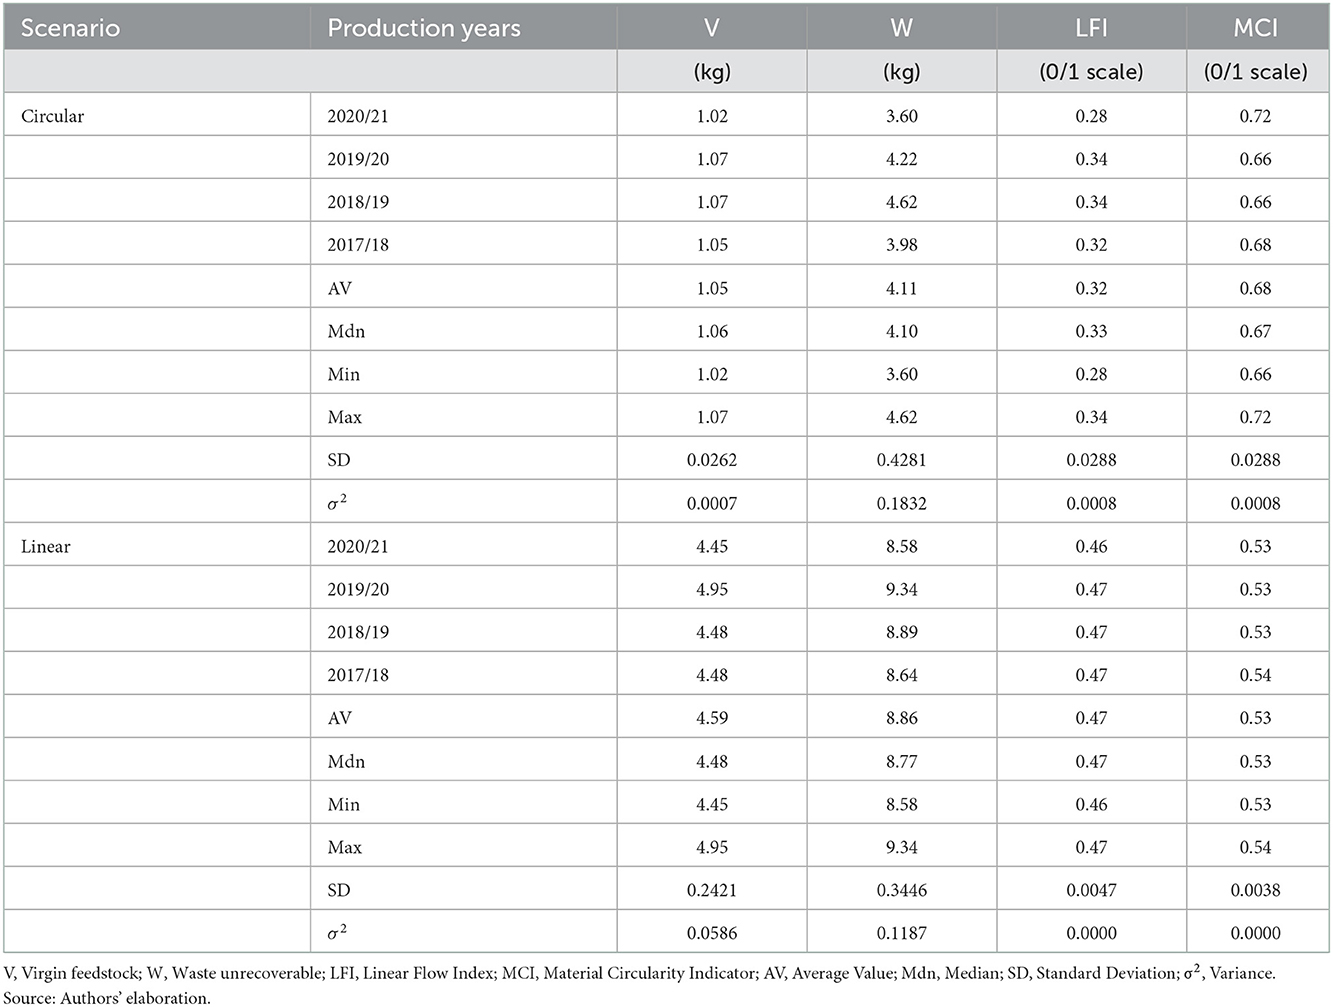
Table 7. MCI results.
The uncertainty analysis, carried out through the evaluation of data variance collected for the four production years (2020/21, 2019/20, 2018/19, 2017/18), showed a low uncertainty degree of MCI results (cfr. Table 7). The same analysis proves the significance of the results, as a low standard deviation of V and W values is found from the four production years. A difference of 15% emerges between the two scenarios; in particular, the virgin material flows are significantly lower in the circular scenario (about 22% compared to the linear scenario) as are those of the non-recoverable waste (<50% compared to the linear scenario).
4. Discussion
4.1. Environmental implications
The introduction of circular strategies in agriculture undoubtedly represents a crucial challenge in the pathways of ecological transition. In a global scenario with a world population of eight billion and projections suggesting that it will reach almost 10 billion by 2050 (United Nations, 2022), it is clear that food production will play an increasingly central role. To avoid exceeding the carrying capacity, it will be of growing importance to reduce the consumption of virgin resources, valorizing waste products that would otherwise have to be managed as waste, further burdening the system. The challenge is to grow by reducing resource exploitation, waste and environmental burdens.
The application of the LCA methodology has made it possible to show how much and in which manner the environmental profile of a product is changed for the better or the worse by adopting circular strategies. The subsequent application of the Material Circularity Indicator made it possible to assess the degree of circularity of the innovative scenario compared to the linear one, but without giving any indication of the environmental impacts. It is clear that in the assessment of circular strategies it is not enough to assess only the degree of circularity, just as it is not enough to assess only the environmental impacts: an integrated assessment of the two environmental aspects is required, adding also the assessment of the economic and social aspects. Starting from these assumptions, it is important to first check the robustness of the results. By comparing the environmental profile of the linear scenario with some EPD-certified oils, it was possible to observe substantial comparability for the impact categories in common between the EPD method and the Re.Ci.Pe. method (Global warming, Terrestrial acidification, Freshwater eutrophication). Considering that one liter of oil is equivalent to 916 gms, simply multiply our results by 0.916 to scale the values to the same Functional Unit used in EPD certifications (1 l of EVOO). It should also be considered that only upstream and core process impacts should be calculated, excluding bottling impacts. In terms of “Global Warming,” the linear scenario has an impact of 1.61 kg CO2 eq, which is comparable with both “Monini Gran Fruttato” oil (EPD, 2022) which has an impact of 1.88 kg CO2 eq and De Cecco oil (EPD, 2017) which has an impact of 1.41 kg CO2 eq.
The impact category “Terrestrial acidification” is the second category that can be compared between the different environmental analyses and has a value of 0.0202 kg SO2 eq for the linear scenario of the present study, 0.0253 kg SO2 eq for “Monini Gran Fruttato” oil (EPD, 2022) and 0.012 kg SO2 eq for “De Cecco” oil (EPD, 2017). The last category “Freshwater eutrophication” has a value of 0.0011 kg P eq for the linear scenario of this study, 0.0653 kg P eq for “Monini Gran Fruttato” oil (EPD, 2022), and 0.006 kg P eq for “De Cecco” oil (EPD, 2017).
These results are also consistent with the literature review carried out by Guarino et al. (2019) who analyzed the impacts in terms of “Global Warming” in 18 different studies, using one liter of olive oil as a reference unit.
Having verified the robustness of the results of the linear scenario, a critical comparison can be made with the circular scenario. As can be seen from the inventory analysis, the circular strategies allowed the replacement of part of the synthetic fertilizers with crop residues and by-products from the mill. This provided a double benefit related to the reduction of impacts but also the reduction of waste. If we had expanded the boundaries of the system by considering disposal-related impacts, the results would probably have been even more strongly in favor of the circular scenario.
As was also discussed during the analysis of the results, the adoption of circular strategies does not always bring only benefits, so their adoption must necessarily be evaluated through a life-cycle analysis in order to assess possible burden shifting. An expansion in the adoption of circular strategies could bring further significant benefits. For example, pomace could first be used for biogas production (Benalia et al., 2021) and digestate eventually used as fertilizer. Value could still be extracted from a product that is conventionally considered waste.
4.2. Economic and circularity implications
In addition to the environmental issues, several concerns can affect the economic performance of adopting circular strategies in olive oil systems. As discussed by Ncube et al. (2022), the difficulties to start closing the loop in the olive oil production sector appear to be economical and organizational, which, if overcome, become cost-effective paths.
As our study showed, circular techniques necessarily require greater investment in machinery and technology. In the circular scenario examined, more machines are required, i.e., shredding machines for pruning residues, pomace spreading and olive pit extractor, whose use allows the reuse of by-products as input and thus the reduction of chemical fertilizers and thermal energy from virgin raw material. Shredded pruning residues likewise offer an opportunity to improve soil functioning as tangible water and soil conservation measure, also reducing erosion and preserving soil moisture. This agricultural operation allows to reduce the appearance of weeds and thus the application of herbicides, as well as contributes to the improvement in fertility and C sequestration (Gómez-Muñoz et al., 2016; Taguas et al., 2021). The other application that takes part in the reduction of chemical fertilizer use is the spreading of two-stage pomace from olive oil extraction. The use of pomace is also finding increasing application as a soil conditioner and fertilizer due to the decreasing extraction of pomace oil in specific industries. Similar conclusions were reached by the study of Foti et al. (2022), who assert the current use in agriculture of olive pomace as a soil conditioner and fertilizer, as well as in bioenergy production and for the extraction of polyphenols intended for pharmaceutical, food, or cosmetic industries. Until a few decades ago, however, pomace oil extraction carried out with solvents was flourishing and the sale of pomace to processors was profitable. Because of the emergent apprehensions from the public about the use of organic solvents in food processing (Ncube et al., 2022), pomace has fully lost its economic value and it is ordinary for it to be taken for free by pomace factories.
Olive pit extraction is also considered a circular practice due to its use for thermal energy production (Stempfle et al., 2021). Considering that cold olive oil extraction does not require water at high temperatures, the use of olive pits in the mill is limited. Therefore to a large extent, it is sold as fuel for households, going to be a good source of biomass and income for the enterprise. As argued by Hermoso-Orzáez et al. (2020), olive pits with a high calorific power by thermochemical conversion could be converted into different forms of energy also contributing to the mitigation of global warming.
In addition to high investments in innovative material recovery and extraction techniques, the valorization of the oil by-products is hindered by bureaucratic and authorization challenges, as well as difficulties in planning for the supply and seasonal availability of the raw material (Ncube et al., 2022).
Financial support from the public sector could help companies in the initial investment of by-product valorization technologies, enabling them to overcome some of the barriers to adopting circular strategies.
In terms of material flow restoration at farm level, our research results showed better performance for the circular scenario with an MCI value of 0.68 out of 1 vs. the linear scenario reaching a value of 0.53. This means that in the circular scenario there is both a lower use of virgin raw material and a lower production of unrecoverable waste. In the former case, the use of virgin resources is replaced by the reuse of the co-products obtained both in the agricultural phase, i.e., pruning residues that are shredded and buried in the soil, and in the extractive phase, where part of the nut-free pomace along with the leaves are used in the organic fertilization of farm soils, and the olive pits to produce the thermal energy needed by the olive mill. The circular system is also characterized by less waste that cannot be recovered (unrecoverable waste) or can be recovered for other uses. Specifically, pomace and pruning residues are not counted in the circular scenario waste. In addition, emissions from LCA results that are lower in the circular scenario were taken into account among the non-recoverable waste. The greater degree of circularity achieved through the application of closed-loop pathways on the olive farm under study represents a means of making environmental improvements and increasing resource productivity.
4.3. Trade-off between LC indicators and MCI
The marginal variations of each environmental and economic impact indicators were assessed by relating the percentage change of circular scenario to the linear scenario (baseline), as already mentioned in Section Material Circularity Indicator implementation to the case study. The results presented in Figure 5 show, therefore, the percentage deviation (positive or negative) of impacts per indicator as circularity increases by one percentage point. Any increase >1% indicates an improvement in environmental and/or economic impacts more than proportional to the increase in circularity, any increase <1% indicates an improvement less than proportional to the increase in circularity, any decrease indicates a worsening of the environmental and/or economic impacts relative to the increase in circularity.
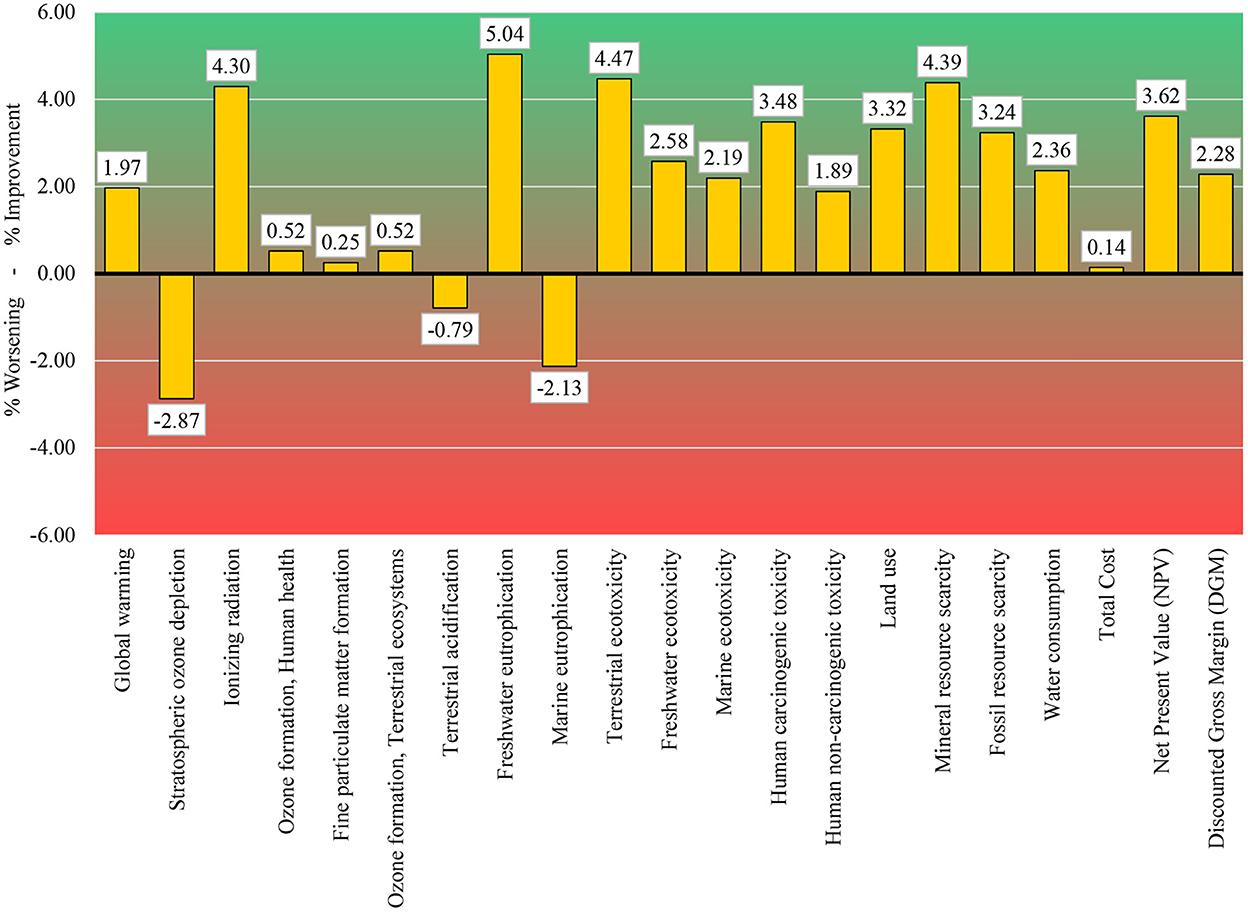
Figure 5. Marginal percentage variation, from the linear scenario (baseline), for each LCA and LCC indicator (Source: Authors' elaboration).
For almost all scenarios it is observed more than proportional increases, which demonstrates the effectiveness of the circularity strategy in terms of environmental and economic sustainability. For specific environmental indicators like “Ozone formation—Human health,” “Fine particulate matter formation,” and “Ozone formation—Terrestrial ecosystems” the improvement is less than proportional to the increase in circularity, as well as is the case for “Total Cost.” For the three environmental indicators, the causes are to be found in the by-product valorization process, while in the case of the economic indicator, the cause is the increase in investment costs for the circular scenario against a reduction in the costs associated with the purchase of production factors. As regards “Stratospheric ozone depletion,” “Terrestrial acidification,” and “Marine eutrophication,” as already discussed in the discussion of the results of the LCA analysis, the worsening is largely due to the increase in field emissions. In particular for “Stratospheric ozone depletion” and “Marine eutrophication,” this worsening is more than proportional to the increase in circularity, so it deserves special attention in terms of eco-design to limit this burdens shifting.
5. Conclusions
This study aims to assess the sustainability performance of circular strategies in the EVO oil production system, applying environmental, economic, and circular metrics at the micro-level. It is well-known that olive oil production causes significant environmental impacts and economic concerns due to the production of several by-products that are difficult to manage. The implementation of closed-loop pathways allow reusing, recycling, or enhancing such by-products, moving toward more sustainable and efficient production patterns. Indeed, using specific technologies, by-products can be managed as a possible resource that can be converted into a source of income for the farm (e.g., energy, organic matter, irrigation water). However, the transition to a circular and sustainable model remains a complex challenge needing an approach that includes not only supply chain actors but also public decision makers. In addition, there is a need to overcome the various obstacles, both technical related to the industrial phase and economic related to investments to initiate circular practices. Despite being particularly anthropized, the olive oil supply chain lends itself well to circular modeling, which is instead inherent in natural ecosystems.
The methodological proposal here shown, based on LC methodologies (LCA and ELCC) and circularity indicators (MCI), provides comprehensive results on environmental and economic impacts, and circularity performance of applying closed-loop strategies in olive oil systems. In scientific literature, the integrated applications of LC approaches and circular economy metrics refer to single process components (e.g., agricultural phase, mill wastewater, and olive pomace) rather than to the overall production process. Through the proposed LC model, it was possible to evaluate the sustainability performance of circular strategies along the entire olive oil supply chain.
In terms of environmental assessment, due to not counting energy and transport in the MCI implementation the use of LCA methodology becomes essential for the return of a reliable result and in particular to verify whether the adoption of circular techniques contributes effectively to the mitigation of environmental impact categories and does not instead to burden shifting. For example, the circular scenario was found to allow a double benefit related to the reduction of impacts and wastes, with the replacement of part of the synthetic fertilizers with crop residues and by-products from the olive-oil mill.
From an economic point of view, our study shows how the circular scenario requires greater business investment when closed-loop strategies are implemented. The purchase of machines for separating olive stones or spreading pomace are examples of this. This result highlights how investment outlay is a limitation to circular approaches, which can also be solved through the adoption of specific government-type investment support measures. In terms of profit, circular scenarios achieve better performance related to the reduction of virgin raw materials purchased and the sale of some by-products such as olive pits. From the perspective of external cost evaluation, the circular scenario also shows the best results compared to the linear scenario. The climate change category achieved the lowest environmental costs due to lower emissions for fertilizer production.
Through the integrated analysis of economic and environmental results along with the assessment of circularity, it was possible to define the trade-offs that potentially exist in the implementation of closed-loop strategies, by considering the interrelation between improved circularity and changes in environmental and economic sustainability performances. Future research will be aimed at extending the analysis here proposed to other olive production areas to validate the applicability and effectiveness of circular strategies on olive-oil farms. In addition, further research development will be concerned with extending the sustainability dimensions by integrating the social-LCA (SLCA) methodology.
Data availability statement
The raw data supporting the conclusions of this article will be made available by the authors, without undue reservation.
Author contributions
GF, TS, AD, and ES: conceptualization. GF, TS, ES, and NI: data curation. GF, TS, ES, NI, and BB: formal analysis. AD: funding acquisition, project administration, and supervision. GF, TS, NI, AD, ES, and BB: investigation. GF, TS, AD, ES, and NI: methodology and writing—original draft. GG, BB, and AD: writing—review and editing. All authors contributed to the article and approved the submitted version.
Funding
This research was part of DRASTIC PRIN 2017 research project, project code: 2017JYRZFF, funded by the Italian Ministry of Education, University, and Research (MIUR).
Conflict of interest
The authors declare that the research was conducted in the absence of any commercial or financial relationships that could be construed as a potential conflict of interest.
Publisher's note
All claims expressed in this article are solely those of the authors and do not necessarily represent those of their affiliated organizations, or those of the publisher, the editors and the reviewers. Any product that may be evaluated in this article, or claim that may be made by its manufacturer, is not guaranteed or endorsed by the publisher.
References
Albuquerque, T. L. M., Mattos, C. A., Scur, G., and Kissimoto, K. (2019). Life Cycle Costing and externalities to analyze circular economy strategy: comparison between aluminum packaging and tinplate. J. Clean. Prod. 234:477–486. doi: 10.1016/j.jclepro.2019.06.091
Ben Abdallah, S., Parra-López, C., Elfkih, S., Elisa, M., Suárez-Rey, E. M., and Romero-Gámez, M. (2022). Sustainability assessment of traditional, intensive and highly-intensive olive growing systems in Tunisia by integrating Life Cycle and multicriteria decision analyses. Sustain. Prod. Consum. 33:73–87. doi: 10.1016/j.spc.2022.06.022
Benalia, S., Falcone, G., Stillitano, T., De Luca, A., Strano, A., Gulisano, G., et al. (2021). Increasing the content of olive mill wastewater in biogas reactors for a sustainable recovery: methane productivity and Life Cycle analyses of the process. Foods 10:1029. doi: 10.3390/foods10051029
Bernardi, B., Falcone, G., Stillitano, T., Benalia, S., Bacenetti, J., and De Luca, A. I. (2021). Harvesting system sustainability in Mediterranean olive cultivation: other principal cultivar. Sci. Total Environ. 766:142508. doi: 10.1016/j.scitotenv.2020.142508
Bradley, R., Jawahir, I. S., Badurdeen, F., and Rouch, K. (2018). A total life cycle cost model (TLCCM) for the circular economy and its application to post-recovery resource allocation. Resour. Conserv. Recycl. 135:141–149. doi: 10.1016/j.resconrec.2018.01.017
Cembalo, L., Borrello, M., De Luca, A. I., Giannoccaro, G., and D'Amico, M. (2020). Transitioning agri-food systems into circular economy trajectories. Aestimum 199–218. doi: 10.13128/aestim-8860
Chiaraluce, G. (2022). Circular economy in the agri-food sector: a policy overview. Ital. Rev. Agric. Econ. 76:53–60. doi: 10.36253/rea-13375
de Bruyn, S., Bijleveld, M., de Graaff, L., Schep, E., Schroten, A., Vergeer, R., et al. (2018). Environmental Prices. Handbook EU28 Version. Delft: CE Delft.
De Luca, A. I., Falcone, G., Stillitano, T., Iofrida, N., Strano, A., and Gulisano, G. (2018). Evaluation of sustainable innovations in olive growing systems: a Life Cycle sustainability assessment case study in southern Italy. J. Clean. Prod. 171:1187–1202. doi: 10.1016/j.jclepro.2017.10.119
Durão, V., Silvestre, J. D., Mateus, R., and De Brito, J. (2019). Economic valuation of life cycle environmental impacts of construction products - A critical analysis. IOP Conf. Ser.: Earth Environ. Sci. 323, 012147. doi: 10.1088/1755-1315/323/1/012147
Ellen MacArthur Foundation (2015). Circularity Indicators. An Approach to Measuring Circularity. EMF: Cowes.
EPD (2017). Environmental Product Declaration (EPD) of Extra Virgin Olive Oil from the De Cecco Company. Registration number S-P-00410 (Revision date: 17 July, 2017).
EPD (2022). Environmental Product Declaration (EPD) of Extra Virgin Olive Oil “GranFruttato” Monini S.p.A. Registration number S-P-00383 (Revision date: 16 February, 2022).
Estévez, S., González-García, S., Feijoo, G., and Moreira, M. T. (2022). How decentralized treatment can contribute to the symbiosis between environmental protection and resource recovery. Sci. Total Environ. 812:151485. doi: 10.1016/j.scitotenv.2021.151485
Foti, P., Pino, A., Romeo, F. V., Vaccalluzzo, A., Caggia, C., and Randazzo, C. L. (2022). Olive pomace and pâté olive cake as suitable ingredients for food and feed. Microorganisms 10:237. doi: 10.3390/microorganisms10020237
Goddin, J., Marshall, K., Pereira, A., and Herrmann, S. (2019). Circularity Indicators—An Approach to Measuring Circularity. Methodology. Wilmington: The Ellen MacArthur Foundation.
Goedkoop, M., Oele, M., Leijting, J., Ponsioen, T., and Meijer, E. (2013). Introduction to LCA with SimaPro. Netherlands: PRè—Product Ecology Consultants.
Gómez-Muñoz, B., Valero-Valenzuela, J. D., Hinojosa, M. B., and García-Ruiz, R. (2016). Management of tree pruning residues to improve soil organic carbon in olive groves. Eur. J. Soil Biol. 74:104–113. doi: 10.1016/j.ejsobi.2016.03.010
Guarino, F., Falcone, G., Stillitano, T., De Luca, A. I., Gulisano, G., Mistretta, M., et al. (2019). Life cycle assessment of olive oil: a case study in southern Italy. J. Environ. Manage. 238:396–407. doi: 10.1016/j.jenvman.2019.03.006
Hamam, M., Di Vita, G., Zanchini, R., Spina, D., Raimondo, M., Pilato, M., et al. (2022). Consumers' attitudes and purchase intention for a vitamin-enriched extra virgin olive oil. Nutrients 14:1658. doi: 10.3390/nu14081658
Hauschild, M. Z., Rosenbaum, R. K., and Olsen, S. I. (Eds.). (2018). Life Cycle Assessment—Theory and Practice. Switzerland: Springer International Publishing AG. doi: 10.1007/978-3-319-56475-3
Heijungs, R., Settanni, E., and Guinée, J. (2013). Toward a computational structure for life cycle sustainability analysis: unifying LCA and LCC. Int. J. Life Cycle Assess. 18:1722–1733. doi: 10.1007/s11367-012-0461-4
Hermoso-Orzáez, M. J., Mota-Panizio, R., Carmo-Calado, L., and Brito, P. (2020). Thermochemical and economic analysis for energy recovery by the gasification of WEEE plastic waste from the disassembly of large-scale outdoor obsolete luminaires by LEDs in the alto alentejo region (Portugal). Appl. Sci. 10:4601. doi: 10.3390/app10134601
Huijbregts, M. A. J., Steinmann, Z. J. N., Elshout, P. M. F., Stam, G., Verones, F., Vieira, M., et al. (2017). ReCiPe2016: a harmonised life cycle impact assessment method at midpoint and endpoint level. Int. J. Life Cycle Assess. 22:138–147. doi: 10.1007/s11367-016-1246-y
Hussain, M., Mumma, G., and Saboor, A. (2005). Discount rate for investments: some basic considerations in selecting a discount rate. Pak. J. Life Soc. Sci. 3, 1–5.
IOC (2021). International Olive Council. EU Olive Oil Figures. Available online at: https://www.internationaloliveoil.org/wp-content/uploads/2021/12/HO-CE901-17-12-2021-P.pdf (accessed July 18, 2021).
ISO (2021a). ISO 14040:2021Environmental Management—Life Cycle Assessment—Principles and Framework. Geneva: International Organization for Standardization.
ISO (2021b). ISO 14044:2021Environmental Management—Life Cycle Assessment—Requirements and Guidelines. Geneva: International Organization for Standardization.
ISTAT (2021). Istituto Nazionale di Statistica. Italian Olive Oil. Available online at: http://dati.istat.it/Index.aspx?QueryId=37850 (accessed July 18, 2021).
Kerdlap, P., and Cornago, S. (2021). “Life cycle costing: methodology and applications in a circular economy,” in An Introduction to Circular Economy, eds L. Liu and S. Ramakrishna (Singapore: Springer Nature), 499–525. doi: 10.1007/978-981-15-8510-4_25
Klöpffer, W., and Renner, I. (2008). “Life-cycle based sustainability assessment of products,” in Environmental Management Accounting for Cleaner Production, eds S. Schaltegger, M. Bennett, R. L. Burritt, C. Jasch. (Heidelberg: Springer Science + Business Media B.V.), 91–102. doi: 10.1007/978-1-4020-8913-8_5
Mastoras, P., Vakalis, S., Fountoulakis, M. S., Gatidou, G., Katsianou, P., Koulis, G., et al. (2022). Evaluation of the performance of a pilot-scale solar still for olive mill wastewater treatment. J. Clean. Prod. 365:132695. doi: 10.1016/j.jclepro.2022.132695
Mayanti, B., and Helo, P. (2022). Closed-loop supply chain potential of agricultural plastic waste: economic and environmental assessment of bale wrap waste recycling in Finland. Int. J. Prod. Econ. 244:108347. doi: 10.1016/j.ijpe.2021.108347
Moreno, L., Gonz?lez, A., Cuadros-Salcedo, F., and Cuadros-Blázquez, F. (2017). Feasibility of a novel use for agroindustrial biogas. J. Clean. Prod. 144, 48–56. doi: 10.1016/j.jclepro.2016.12.060
Ncube, A., Fiorentino, G., Panfilo, C., Maria De Falco, M., and Ulgiati, S. (2022). Circular economy paths in the olive oil industry: a Life Cycle Assessment look into environmental performance and benefits. Int. J. Life Cycle Assess. doi: 10.1007/s11367-022-02031-2
Nemecek, T., and Kägi, T. (2007). Life Cycle Inventories of Swiss and European Agricultural Production Systems. Final Report Ecoinvent V2.0 No. 15a. Agroscope Reckenholz-Taenikon Research Station ART, Swiss Centre of Life Cycle Inventories: Zurich and Dübendorf.
Niero, M., and Kalbar, P. P. (2019). Coupling Material Circularity Indicators and life cycle based indicators: a proposal to advance the assessment of circular economy strategies at the product level. Resour. Conserv. Recycl. 140:305–312. doi: 10.1016/j.resconrec.2018.10.002
Prasuhn, V. (2006). Erfassung der PO4- Austräge für die Ökobilanzierung—SALCA-Phosphor. Zürich: Agroscope FAL Reckenholz.
Rocchi, L., Paolotti, L., Cortina, C., Fagioli, F. F., and Boggia, A. (2021). Measuring circularity: an application of modified Material Circularity Indicator to agricultural systems. Agric. Food Econ. 9:9. doi: 10.1186/s40100-021-00182-8
Rödger, J. M., Kjær, L. L., and Pagoropoulos, A. (2018). “Life cycle costing: an introduction,” in Life Cycle Assessment: Theory And Practice, eds M. Z. Hauschild, R. K. Rosenbaum, S. I. Olsen, Cham: Springer, 373–400. doi: 10.1007/978-3-319-56475-3_15
Roos Lindgreen, E., Opferkuch, K., Walker, A. M., Salomone, R., Reyes, T., Raggi, A., et al. (2022). Exploring assessment practices of companies actively engaged with circular economy. Bus. Strategy Environ 31:1414–1438. doi: 10.1002/bse.2962
Rufí-Salís, M., Petit-Boix, A., Villalba, G., Gabarrell, X., and Leipold, S. (2021). Combining LCA and circularity assessments in complex production systems: the case of urban agriculture. Resour. Conserv. Recycl. 166:105359. doi: 10.1016/j.resconrec.2020.105359
Silvestri, C., Silvestri, L., Piccarozzi, M., and Ruggieri, A. (2022). Toward a framework for selecting indicators of measuring sustainability and circular economy in the agri-food sector: a systematic literature review. Int. J. Life Cycle Assess. doi: 10.1007/s11367-022-02032-1
Stempfle, S., Carlucci, D., De Gennaro, B. C., Roselli, L., and Giannoccaro, G. (2021). Available pathways for operationalizing circular economy into the olive oil supply chain: mapping evidence from a scoping literature review. Sustainability 13:9789. doi: 10.3390/su13179789
Stillitano, T., Falcone, G., De Luca, A. I., Piga, A., Conte, P., Strano, A., et al. (2019). A life cycle perspective to assess the environmental and economic impacts of innovative technologies in extra virgin olive oil extraction. Foods 8:209. doi: 10.3390/foods8060209
Stillitano, T., Falcone, G., Iofrida, N., Spada, E., Gulisano, G., and De Luca, A. I. (2022). A customized multi-cycle model for measuring the sustainability of circular pathways in agri-food supply chains. Sci. Total Environ. 844:157229. doi: 10.1016/j.scitotenv.2022.157229
Stillitano, T., Spada, E., Iofrida, N., Falcone, G., and De Luca, A. I. (2021). Sustainable agri-food processes and circular economy pathways in a life cycle perspective: state of the art of applicative research. Sustainability 13:2472. doi: 10.3390/su13052472
Taguas, E. V., Marín-Moreno, V., Díez, C. M., Mateos, L., Barranco, D., Francisco-Javier Mesas-Carrascosa Pérez, R., et al. (2021). Opportunities of super high-density olive orchard to improve soil quality: management guidelines for application of pruning residues. J. Environ. Manage. 293:112785. doi: 10.1016/j.jenvman.2021.112785
Tse, K. K., Chow, T. T., and Su, Y. (2016). Performance evaluation and economic analysis of a full scale water-based photo-voltaic/thermal (PV/T) system in an office building. Energy Build. 122:42–52. doi: 10.1016/j.enbuild.2016.04.014
United Nations (2022). World Population Prospects 2022. Available online at: https://population.un.org/wpp/ (accessed 25 July, 2022). doi: 10.18356/9789210014380
Weidema, B. P., Bauer, C., Hischier, R., Mutel, C., Nemecek, T., Reinhard, J., et al. (2013). Overview and Methodology. Data Quality Guideline for the Ecoinvent Database Version 3. Ecoinvent Report 1(v3). St. Gallen: The ecoinvent Centre.
Zampori, L., and Pant, R. (2019). Suggestions for Updating the Organisation Environmental Footprint (OEF) Method, EUR 29681 EN. Luxembourg: Publications Office of the European Union. ISBN 978-92-76-00651-0, JRC115960.
Keywords: olive oil sector, circular economy, Life Cycle Assessment, Environmental Life Cycle Costing, investment analysis, Material Circularity Indicator
Citation: Falcone G, Stillitano T, Iofrida N, Spada E, Bernardi B, Gulisano G and De Luca AI (2022) Life cycle and circularity metrics to measure the sustainability of closed-loop agri-food pathways. Front. Sustain. Food Syst. 6:1014228. doi: 10.3389/fsufs.2022.1014228
Received: 08 August 2022; Accepted: 06 December 2022;
Published: 22 December 2022.
Edited by:
Maurizio Cellura, University of Palermo, ItalyReviewed by:
Sergiy Smetana, German Institute of Food Technologies, GermanyDaniela Spina, University of Catania, Italy
Copyright © 2022 Falcone, Stillitano, Iofrida, Spada, Bernardi, Gulisano and De Luca. This is an open-access article distributed under the terms of the Creative Commons Attribution License (CC BY). The use, distribution or reproduction in other forums is permitted, provided the original author(s) and the copyright owner(s) are credited and that the original publication in this journal is cited, in accordance with accepted academic practice. No use, distribution or reproduction is permitted which does not comply with these terms.
*Correspondence: Anna Irene De Luca,  anna.deluca@unirc.it