
Assessing the Impact of Climate Change on Water Usage in Typical Industrial Enterprises


1
School of Civil and Architectural Engineering, Guangxi University, Nanning 530004, China
2
State Key Laboratory of Simulation and Regulation of Water Cycle in River Basin, China Institute of Water Resources and Hydropower Research, Beijing 100038, China
*
Author to whom correspondence should be addressed.
Sustainability 2023, 15(13), 10141; https://doi.org/10.3390/su151310141
Submission received: 1 June 2023
/
Revised: 21 June 2023
/
Accepted: 21 June 2023
/
Published: 26 June 2023
(This article belongs to the Special Issue Climatic and Anthropogenic Impacts on Groundwater Resources and Adaptation Strategies)
Abstract
:Climate change and water scarcity are significant global issues both currently and in the future. Investigating the changes in industrial water usage under this backdrop holds crucial guidance for enabling adaptive changes within industries. It offers methods and case support for assessing the impact of climate on the water usage processes of industrial enterprises as well. This study employed a physical model to examine the impact of climate factors on the primary water consumption processes of a selected case of a coal-fired power plant. Additionally, by utilizing the ScenarioMIP experimental outcomes from CMIP6 models, the future water consumption processes were predicted under four different SSPs-RCPs scenarios. A relevant LSTM neural network was constructed based on the primary water consumption calculation to establish connections between the power generation process, meteorological process, water consumption process, and water intake process. Findings from the study reveal that the annual average primary water consumption showed a decreasing trend in different SSPs-RCPs scenarios. Specifically, there were reductions of 1600, 5300, 9000, and 11,400 t/year in each respective scenario from SSP1–2.6 to SSP5–8.5. Conversely, the water intake exhibited a gradual increase, with increments of 2000, 5600, 9200, and 10,000 t/year, respectively. Moreover, the impact of climate change on evaporation showed an annual decrease of less than 0.056%, while the increase in water intake was below 0.044%. Under the SSPs-RCPs scenarios, both water intake and consumption exhibited a gradually increasing trend with fluctuations ranging from 1–2.6 to 5–8.5. However, the annual trends remained relatively stable. It is crucial to acknowledge that climate change has amplified the uncertainty surrounding water intake and consumption. Industrial enterprises should proactively ensure the stability of their production processes in response to climate change.
1. Introduction
Water, as an indispensable resource for industrial operations, plays a vital role in various stages of production. However, its quality and quantity can greatly impact overall industrial processes. Due to the dynamic nature of water, it is highly susceptible to external environmental conditions. In an open environment, such factors as temperature, humidity, and atmospheric pressure directly impact the performance of water in industrial processes [1]. These factors have a significant influence on phenomena such as evaporation, solubility, and cleaning capabilities. Amid climate change, assessing water’s changes in industrial processes is crucial. Evaluations of water’s impact on industrial processes are crucial for determining future production strategies and allocations.
Scholarly research on the impact of climate change on the industry can be broadly classified into three areas: Firstly, there is a focus on the improvement of simulation techniques for industrial water usage processes. Secondly, studies are being conducted on the coupling relationship between water and energy. Finally, investigations are being carried out to examine the effects of climate change on water demand and supply in industrial settings.
Regarding the simulation of industrial water usage processes, existing research acknowledges the significant variation in quality standards across different industrial activities, making it challenging to develop a universal method or technique applicable to all cases [2]. In this context, researchers have directed their efforts toward enhancing simulation tools and techniques for industrial water usage processes. The objective is to enhance the applicability, accuracy, and precision of models. For instance, computational fluid dynamics (CFD) models have been used to simulate fluidized bed adsorption processes, aiming to optimize process efficiency while accounting for subtle impacts [3]. CFD has also been utilized to simulate ammonia removal processes [4] and the hydraulic characteristics of industrial boilers [5]. Additionally, in order to estimate water quantities, hybrid cooling tower models utilizing evaporation mechanisms have been developed [6]. In addition to physical modeling, artificial neural network (ANN) models have demonstrated remarkable modeling capabilities in simulating the performance of vacuum membrane distillation (VMD) desalination processes [7]. In addition, regression models have been employed to establish relationships between water consumption and internal factors (technology, processes, production elements, equipment profiles) and external factors (climate) in dairy processing plants [8]. The selection of modeling approaches, whether physical or statistical, depends on the transparency of the production process. Statistical methods, such as machine learning and artificial neural networks, are commonly employed for simulating water usage processes with uncertain intermediate steps.
Existing research on water–energy coupling relationships has predominantly centered on the national systems’ macro scale. However, there is a dearth of studies on micro-level systems such as enterprises, households, and individuals [8]. Although the water–energy coupling in the coal-fired power generation industry has been characterized using entropy weighting methods [9], there is a considerable lack of research on the industrial enterprise level, which significantly diminishes its research value.
Regarding the impacts of climate change, with the progress of the Sixth Coupled Model Intercomparison Project (CMIP6) conducted by the World Climate Research Programme, global climatologists have been able to share, analyze, and compare the latest global climate simulation results, providing direct support for current research on the impacts of climate change [10]. Based on the results of ScenarioMIP [11] experiments, a study on industrial water demand in Hubei Province, China, indicates varying impacts of climate change on different industries, ranging from −15.11% to 37.36% [12]. Furthermore, another study predicts the effects of climate change on industrial water demand in the Huai River Basin in China, suggesting a potential increase of 10% to 44.6% in water demand for industrial purposes [13]. These studies highlight the diverse and significant impacts of climate change on hydrological processes and industrial water demand in different regions.
Significant strides have been made in simulating industrial water usage processes and assessing regional climate change. However, there is still a dearth of comprehensive research evaluating the climate impacts on industrial enterprises. This study aims to fill that gap by developing an evaluation framework for assessing the climate impacts on industrial water usage processes. Specifically, the framework will focus on analyzing the effects of climate change on water consumption and intake processes in industrial enterprises, with coal-fired power plants serving as the case study. The study aims to investigate the following questions: (1) How will future climate change affect the industrial water usage process in the case of industrial enterprises, and what is the specific extent of these impacts? (2) Based on the generalizable findings from the case study, what challenges will industrial enterprises face in terms of water usage under future climate change scenarios? These studies will support industrial enterprises in estimating future water demands and provide analytical methods for assessing the climate impact on their water usage processes. To explore these questions, the research is based on the following hypotheses: (1) There will be no significant changes in the future water usage process of industrial enterprises. (2) Industrial enterprises will not respond to climate change. (3) The current estimates of climate change outcomes can reveal future climate trends.
2. Study Area and Methodology
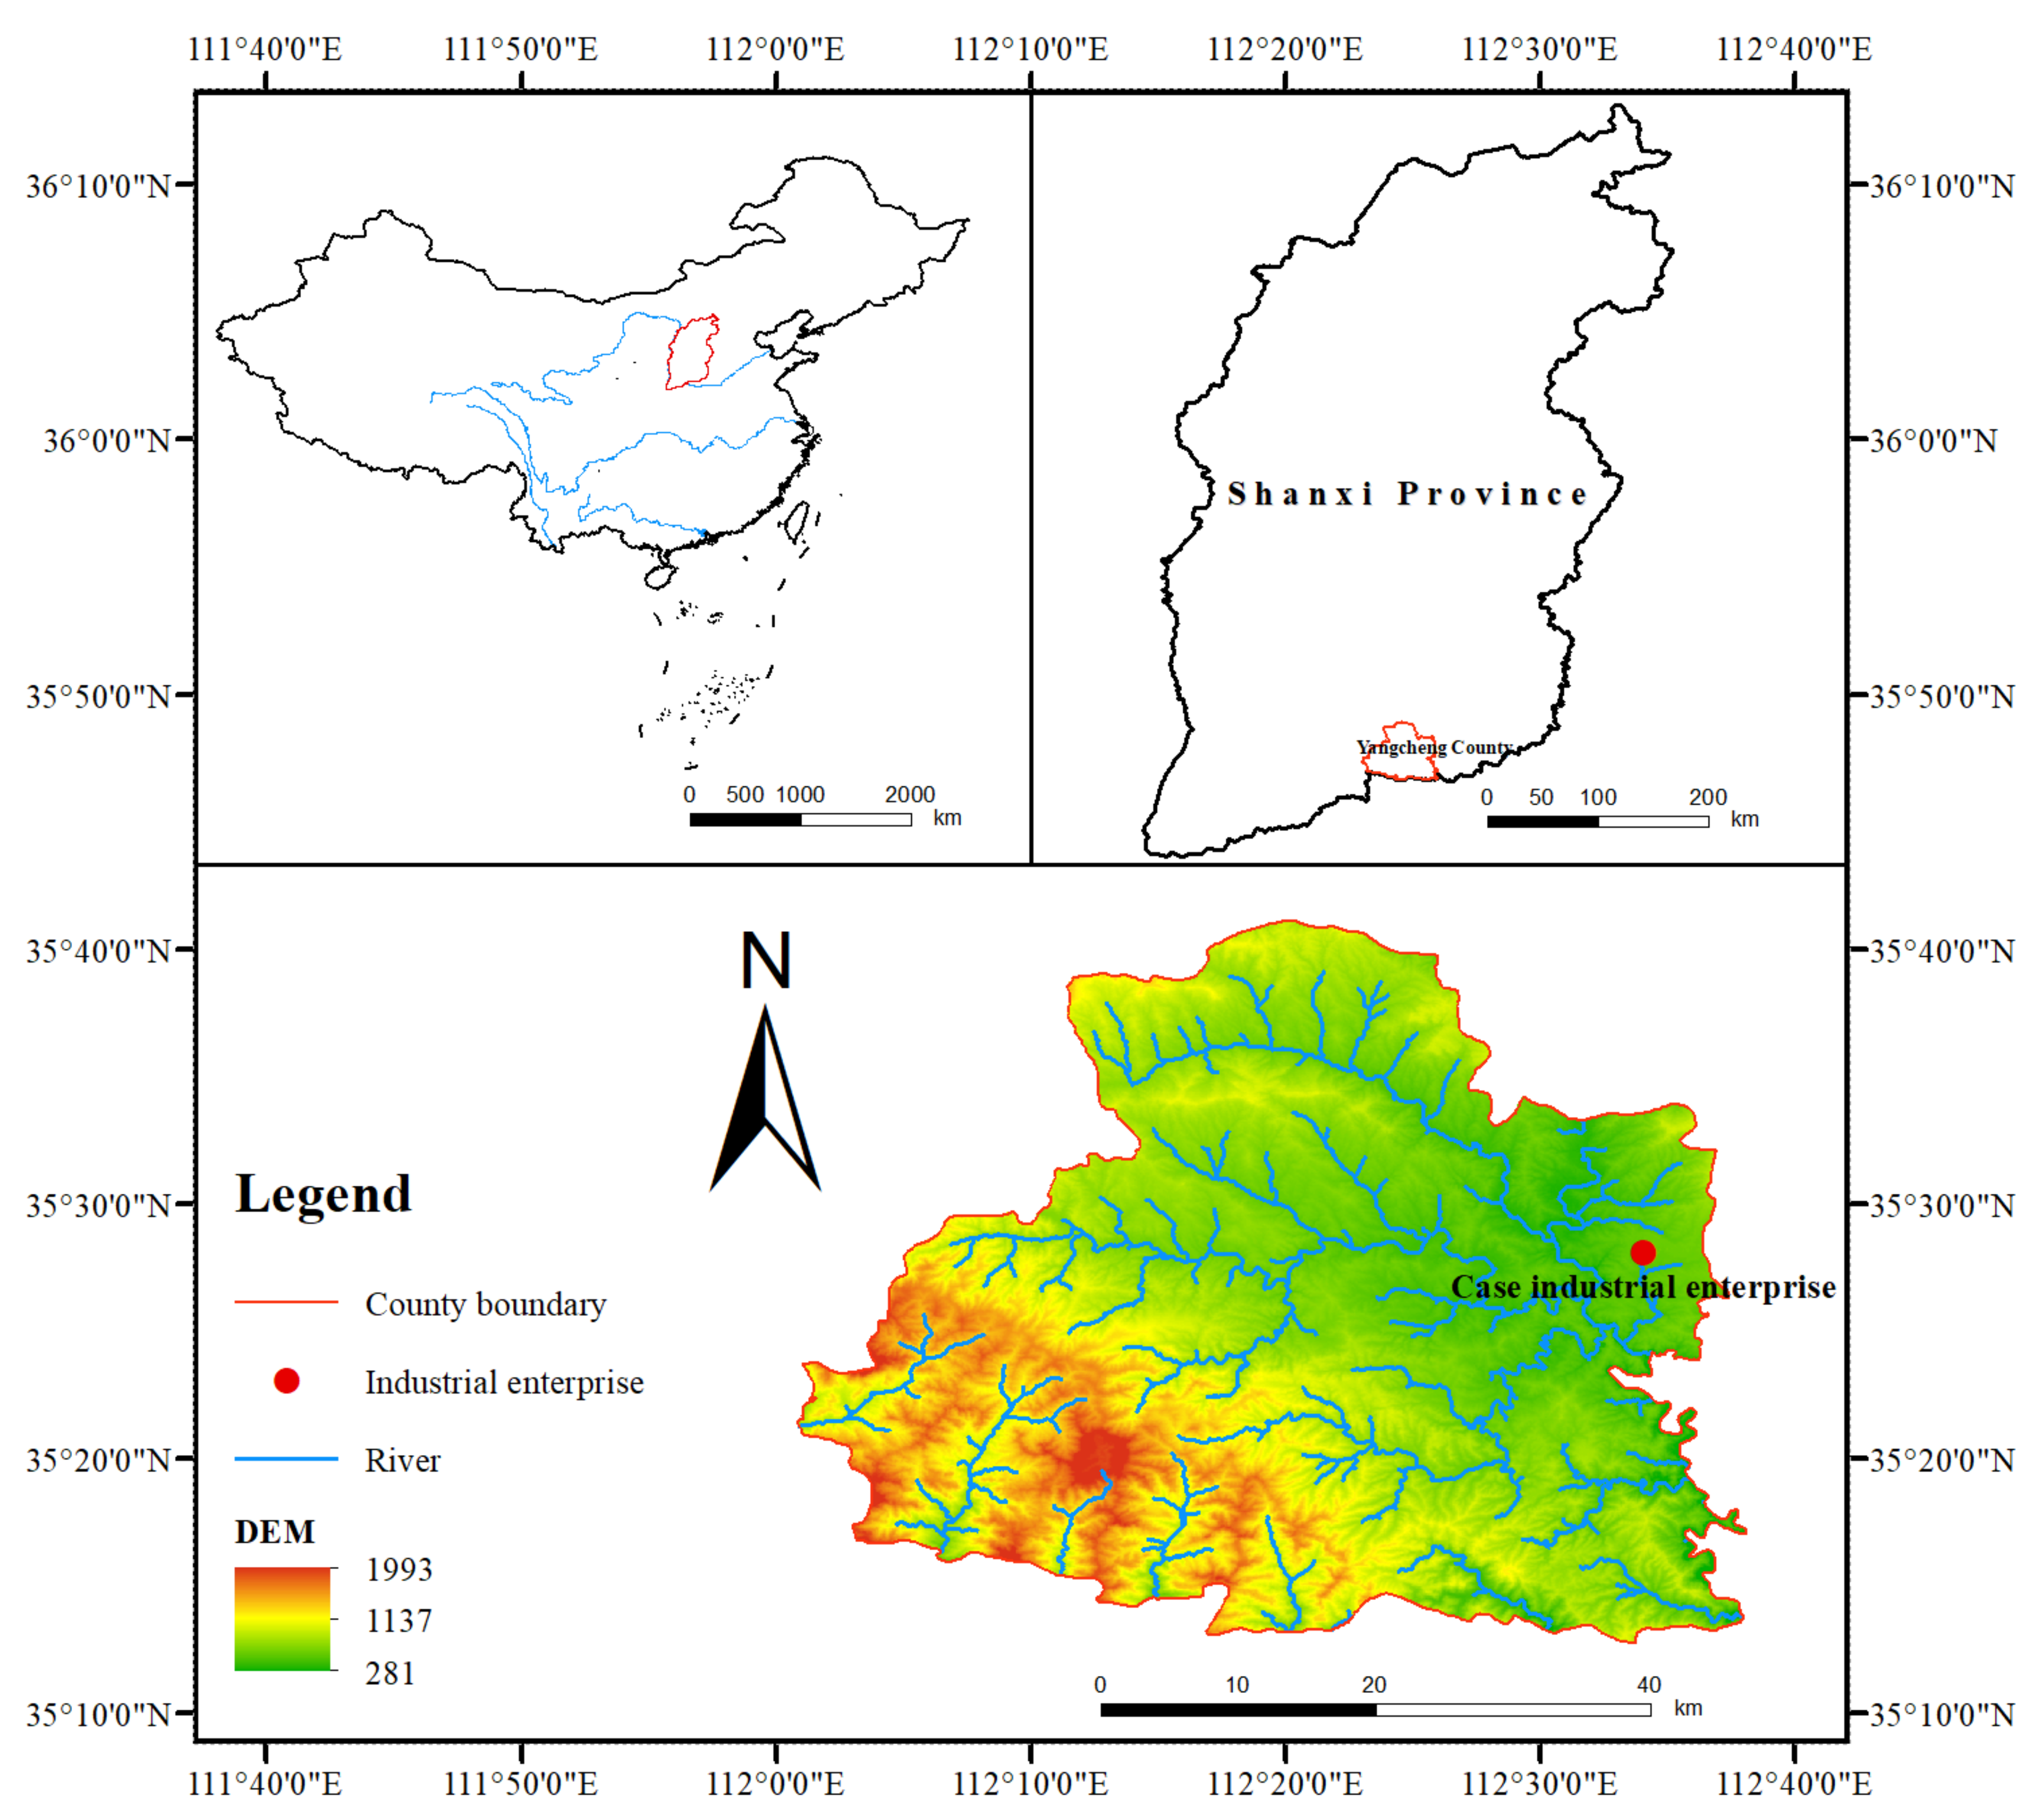
2.1. Study Area
2.2. Research Framework
The whole process of water usage in industrial enterprises includes water intake, water use, water consumption, water storage, water discharge, and water reuse [14]. The entire process involves various aspects ranging from minor pipeline leaks to large-scale circulating water systems. Different industrial enterprises have varying demands for water of different qualities [15]. For example, water of better quality can reduce the losses in treatment processes and be supplemented into industrial water. Therefore, the water simulation of the water intake process for different industrial enterprises should be based on their production processes. For instance, the water intake of washing plants is primarily determined by factors such as water quality and the specific washing task. However, the water intake of desalination plants is influenced not only by the desalination process but also by considerations such as water quality and desired output.
The water utilization process in industrial enterprises is a complex process that varies across different industries. However, the production processes tend to remain stable, with external climatic conditions affecting the processes of water intake, consumption, utilization, and wastewater discharge. Since human intervention heavily influences wastewater discharge and water utilization, the analysis of climate impacts is focused on water intake and consumption processes. Water intake is closely related to consumption [16], wastewater discharge, and production processes, making it essential to analyze water consumption processes. These processes are divided into production losses, the water reduced in the manufacturing or production process, and other losses, with this study categorizing production losses as the primary water consumption process influenced by production volume, processes, and external conditions. To assess climate impacts on industrial enterprises, we have designed a research framework illustrated in Figure 3 that takes into account these factors.
2.3. Simulation of Primary Water Usages
This case study focuses on an industrial enterprise that comprises various water consumption processes. The primary processes include the evaporation loss from multiple open-loop cooling towers and the water loss from the flue gas desulfurization (FGD) process. These processes are linked to power generation operations and are indirectly impacted by climate conditions. To accurately assess the impact of meteorological factors on these primary water consumption processes, separate computational models have been developed. By applying these models, we can quantitatively analyze the extent to which meteorological conditions affect water consumption in industrial enterprises. This analysis provides a basis for making further predictions regarding the water intake process. The constructed simulation model serves as the foundation for assessing the impact of climate change, and its outcomes driven by climatic factors play a crucial role in this study.
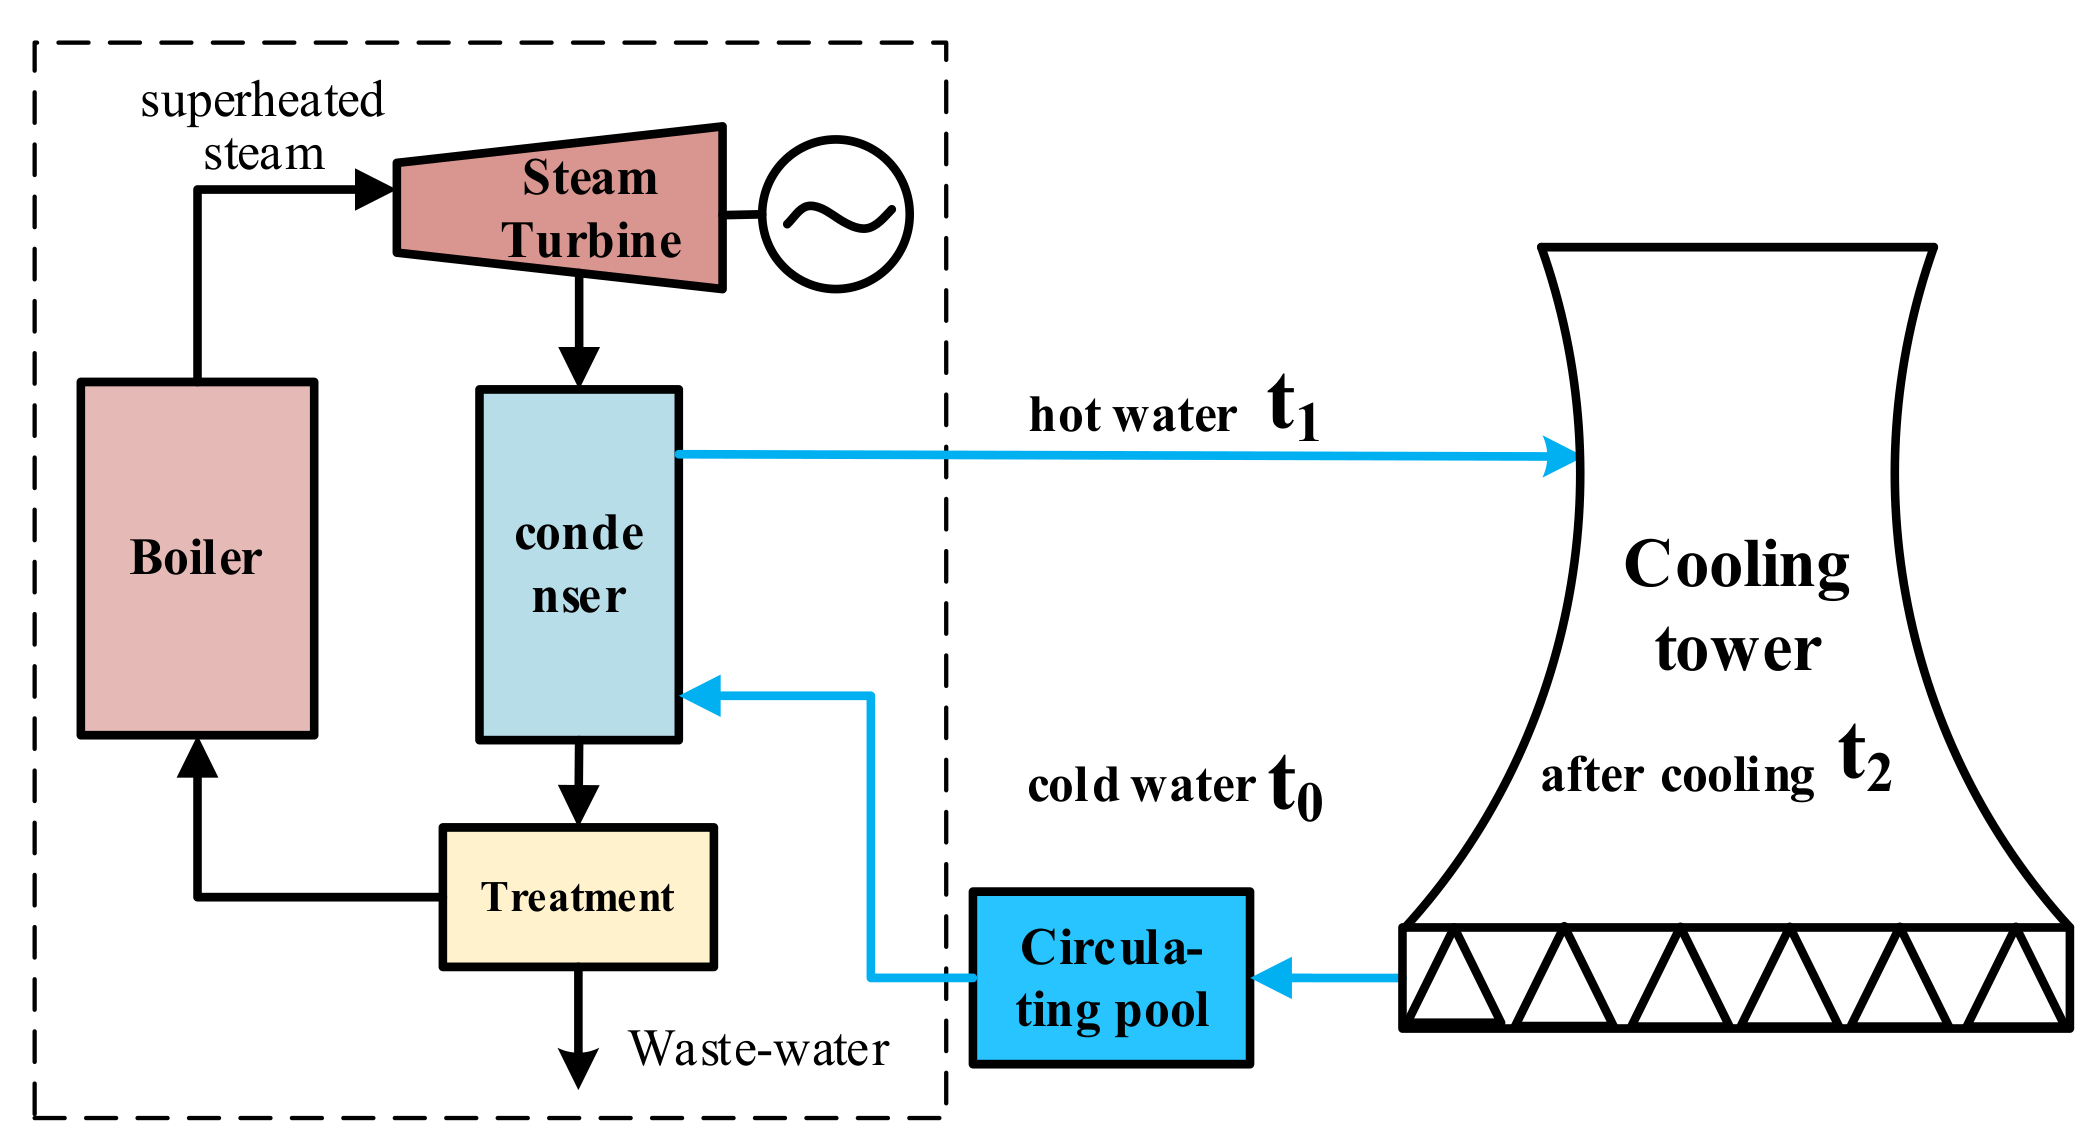
Cooling towers have become increasingly popular in various cooling processes, including air conditioning, thermal power generation, and heat pumps. Specifically, the industrial enterprise under study uses several open, naturally ventilated cooling towers [17] to cool its power generation units. These cooling towers heavily rely on draft evaporation cooling [18] and consume a significant amount of water, significantly affecting the case enterprise’s water usage process. Various methods are available for calculating the evaporation of open, naturally ventilated counterflow cooling towers, including empirical calculation models [19], improved enthalpy difference models [20], and three-dimensional simulation models [21]. In this study, we have opted for the improved enthalpy difference model, also known as the improved Merkel method [20], which effectively considers external weather conditions while maintaining a shorter computation time. To evaluate the influence of climatic factors on the evaporation of cooling towers, we have coupled it with the boiler water system during the evaporation calculation. The complete process of cooling tower evaporation is illustrated in Figure 4.
The heat transfer process [22] in a cooling tower can be divided into three distinct components: heat dissipation through water-air contact, heat dissipation through water surface evaporation, and radiation heat dissipation. When hot water comes into contact with cooler air, heat is transferred from the water to the air through this contact. At the same time, water molecules diffuse into the air, evaporate, and carry heat with them. To optimize cooling efficiency, open, naturally ventilated cooling towers are equipped with one or more layers of water distribution fillers. The area above the fillers is designated as the water distribution zone, while the region below is referred to as the rain zone.
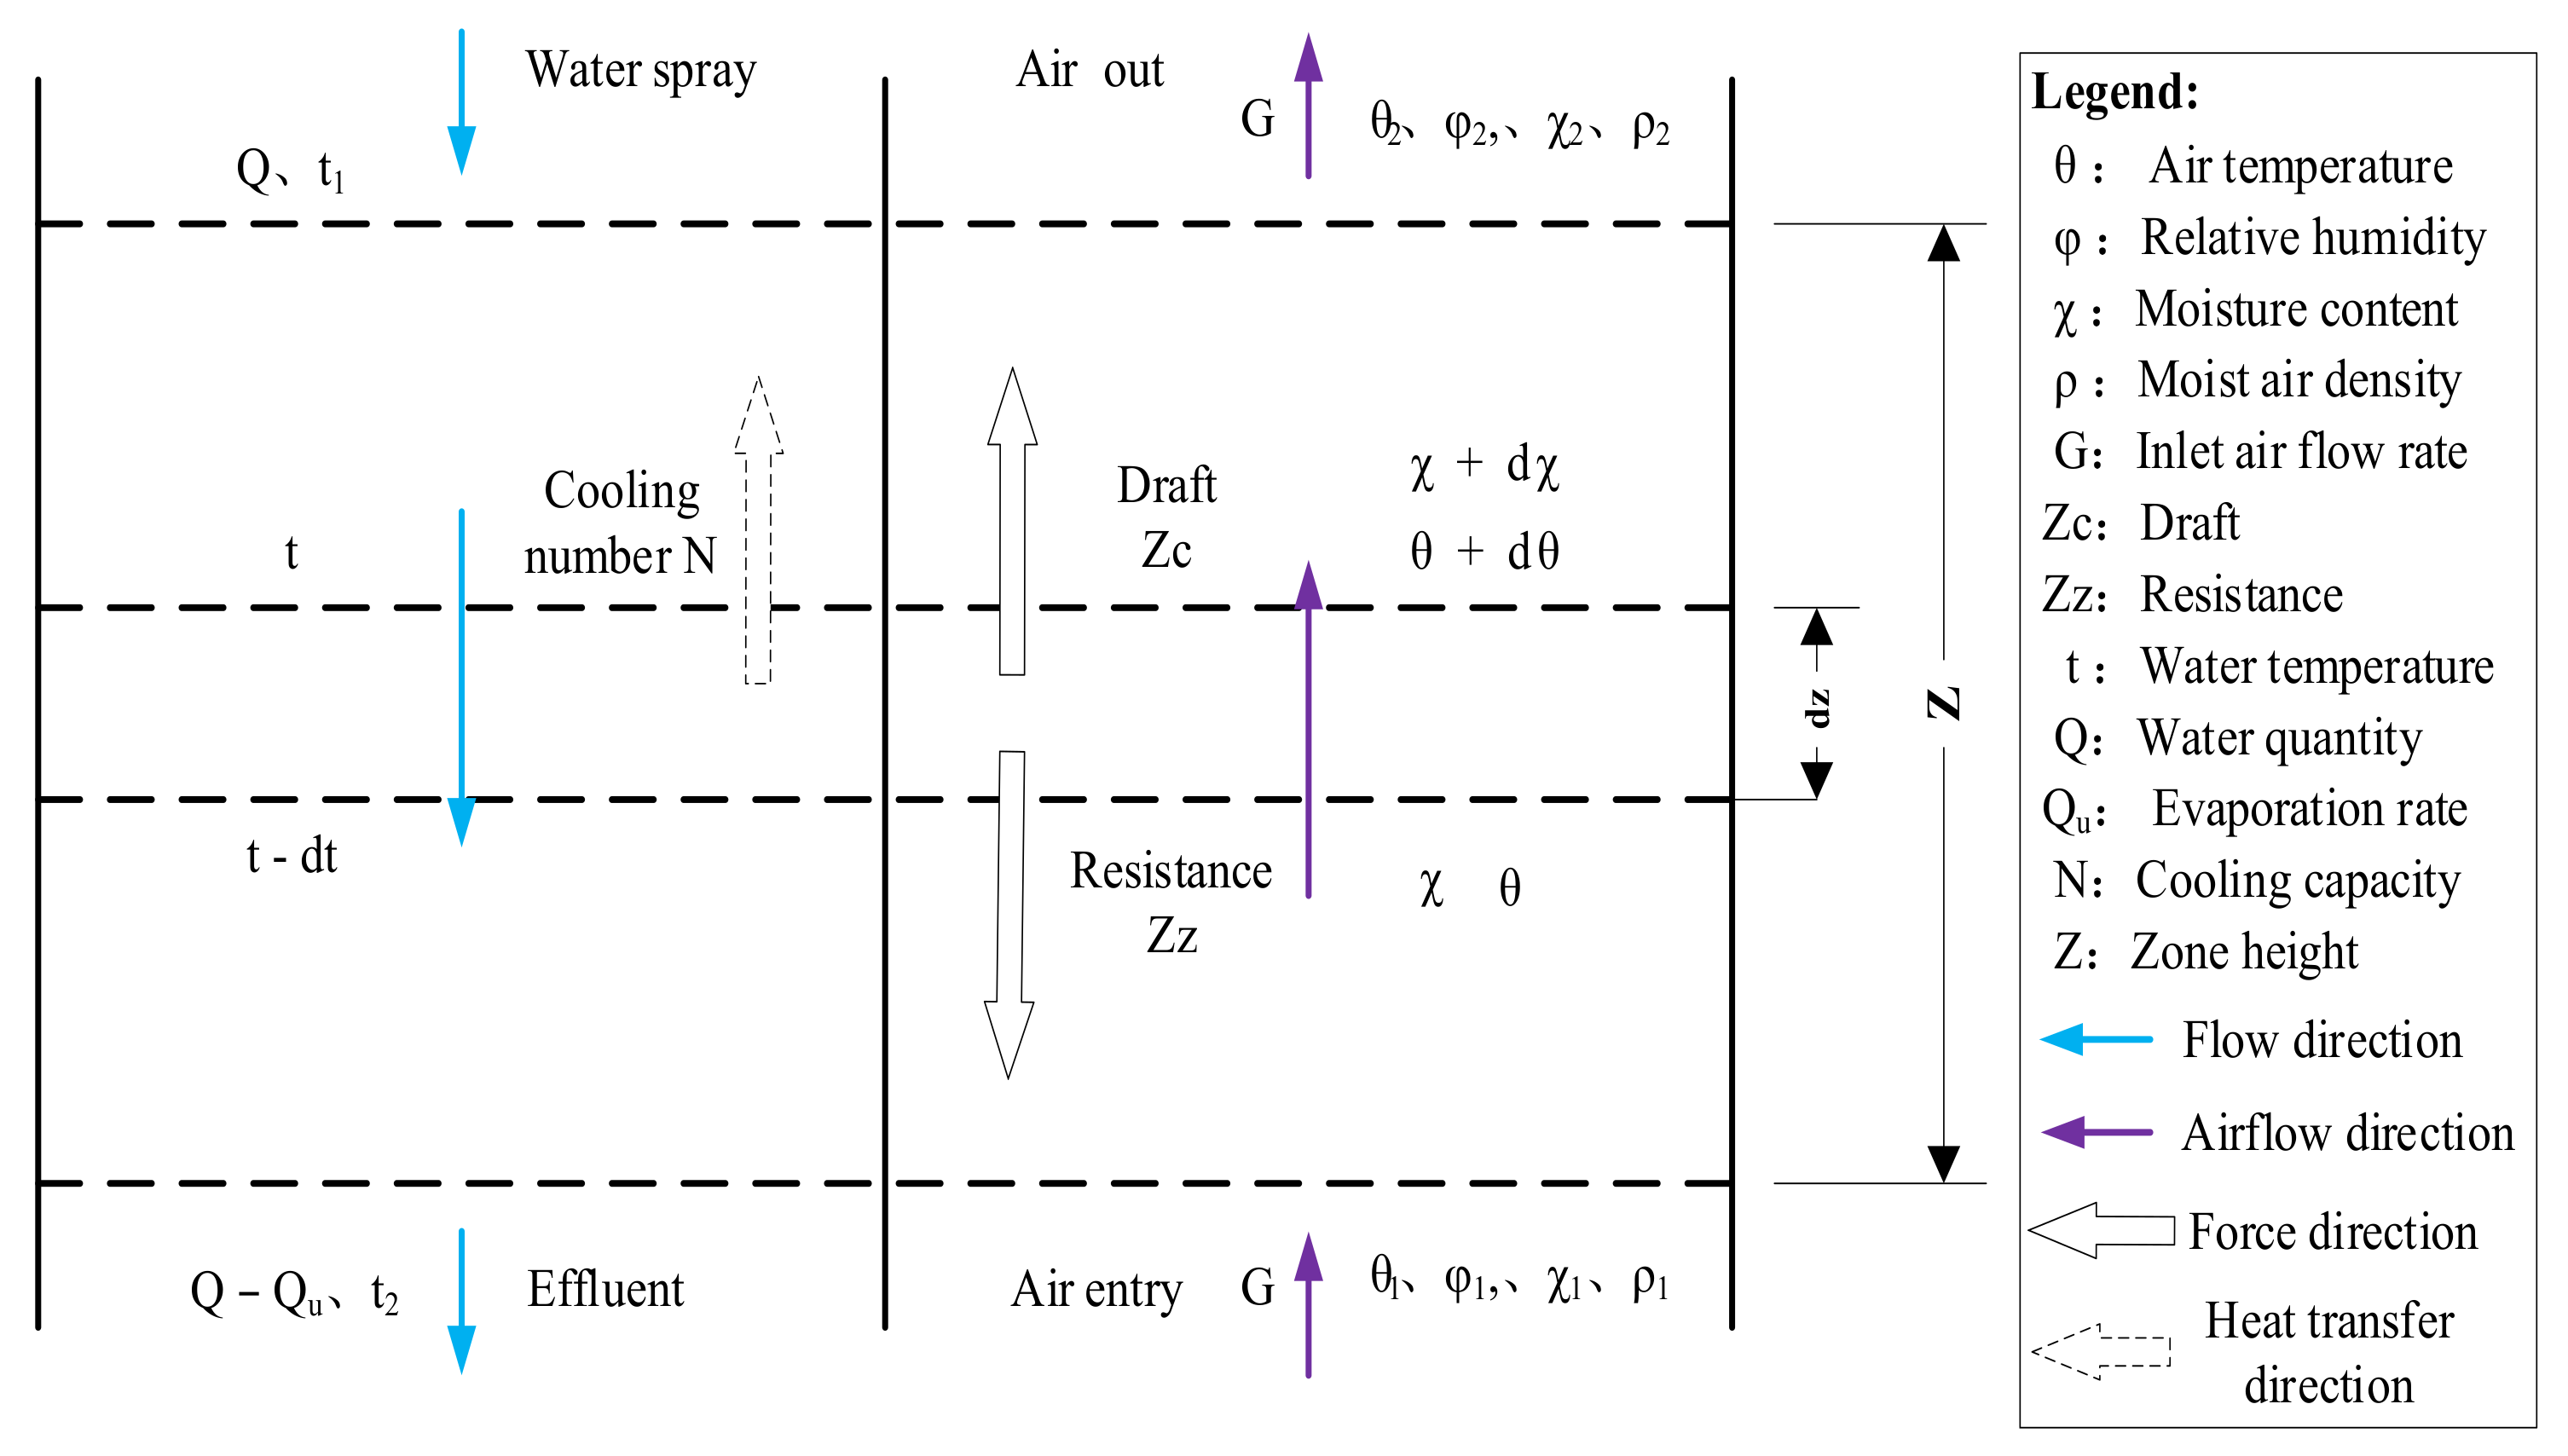
Due to the temperature difference between the top and bottom of the tower, air flows from the bottom to the top of the tower, opposite the direction of water distribution. The air passes through the rain zone, filler zone, and water distribution zone successively, carrying away heat and water vapor, thus achieving the cooling of the water [23]. In this study, a one-dimensional enthalpy difference calculation model is employed to analyze the evaporation process of the cooling tower, which divides the heat transfer region of the tower into n layers and calculates the enthalpy change process for each layer. As the heat transfer process continues, the moisture content and temperature of the incoming air increase until reaching the inherent cooling capacity [24] of the tower. The one-dimensional enthalpy difference calculation model [25] for the cooling tower is illustrated in Figure 5.
In the developed computational model, we optimize the wind speed and cooling temperature () to discover the equilibrium point between the draft force , resistance , actual cooling capacity , and design cooling capacity . We achieve this through the utilization of comprehensive optimization. The model proposed is as follows:
min:
subject to:
where represents the cooling tower calculation model, denotes the average wind speed inside the tower; and refer to the inlet and outlet water temperatures of the cooling water, respectively; represents the air wet-bulb temperature, while corresponds to the maximum average wind speed. In practice, the actual wind speed typically ranges around 1 m/s.
The formula for calculating the actual evaporation rate [26] of the tower is as follows:
where represents the evaporation rate of the tower, m3/h; G represents the air intake flow rate of the tower, m3/h; and represent the moisture content at the inlet and outlet of the tower, respectively.
The calculation process for the inlet cooling water temperature [27] is as follows:
where represents the specific enthalpy of the steam exhausted from the turbine; represents the specific enthalpy of the condensate; represents the generalized exhaust flow rate of the turbine; represents the flow rate of the cooling water; represents the specific heat capacity of the cooling water; represents the water temperature in the cooling water reservoir, which can be estimated based on climatic factors.
We collected performance data for the circulating cooling water towers [28] and the desulfurization evaporation process in the case power plant. The specific data can be found in Table 1.
To determine the values of certain parameters that are not fixed, we have chosen to use curve fitting. In the case power plant, each cycle cooling tower is equipped with a condenser, which helps facilitate heat exchange. To derive the correlation between power generation load and exhaust steam flow rate, we can use the condenser temperature rise formula, which is illustrated in Equation (6), and the argument Dc can be calculated using Equation (7).
where represents the exhaust steam flow rate of the power generation unit, and P denotes the power generation load, MW.
The condenser’s inlet water is directly sourced from the circulating water pool, which is located below the cooling tower. The water temperature in the circulating water pool is minimally affected by sunlight. It can be approximated based on the air temperature and humidity [29]. The relationship between the condenser’s cooling water inlet temperature (), the air temperature (t), and humidity (r) can be expressed as Equation (8).
where represents the temperature at the cooling water inlet; r denotes the relative humidity, and t corresponds to the air temperature.
The water consumption during the desulfurization process can be categorized into three components: water contained in the gypsum (including crystalline water and adhered water), evaporation of flue gas, and liquid water transported by the flue gas [30].
Let the proportion of in coal-fired flue gas be denoted as , and the volume of coal-fired flue gas be denoted as G (m3/h) [31]. The amount of crystalline water in gypsum can be calculated using Equation (8), and the amount of adhering water in gypsum can be calculated using Equations (9) and (10).
where and represent crystalline water, and adhered water of the gypsum, m3/h, represents the rate of water adhering to the surface of gypsum, , , and denote the molar masses of water, calcium sulfate, and sulfur dioxide molecules, respectively, and η represents the desulfurization efficiency.
The amount of water evaporated can be calculated based on the temperature difference between the inlet and outlet of the flue gas (), the relative humidity at the inlet and outlet (), the air density at the inlet and outlet (), and the corresponding specific humidity at the inlet and outlet (), The amount of water evaporated can be calculated using Equation (11), where the specific humidity (χ) and air density (ρ) can be determined using Equations (12) and (13), respectively [32].
where represents the flue gas evaporation, m3/h, , represent the water vapor pressure and saturation vapor pressure at temperature T, respectively, measured in kPa, denotes the atmospheric pressure in kPa; and represent the gas constants for dry air and water vapor, respectively, measured in J/(kg·K).
The amount of liquid water carried by the flue gas in the desulfurization process can be calculated based on the maximum carrying capacity of 75 mg/m3 of the outlet flue gas volume and can be determined using Equation (14).
where represents liquid water carried by the flue gas, m3/h; represents the density of the inlet air, and represents the density of the outlet moist air (excluding liquid droplets). The parameter values for the desulfurization water process calculation model can be found in Table 2.
Computing the water intake directly becomes challenging due to the intricate and interdependent relationship between the water intake process and the drainage process, which involves numerous complexities and factors. As a result, this study utilizes a statistical modeling approach to establish and correlate the water consumption process with the water intake process. By fitting the water consumption data with both the measured and calculated data, a computational model for the water intake process can be obtained.
2.4. Climate Change Impact Research Methods
Obtaining future climate information from the World Climate Research Programme’s (WCRP) Global Climate Models (GCMs) is currently the most common method for assessing climate change and its impacts. The latest Coupled Model Intercomparison Project Phase 6 (CMIP6) provides numerical simulation results from 46 global climate models, including the Scenario Model Intercomparison Project [33] (ScenarioMIP). The primary objective of ScenarioMIP is to provide data for comprehensive studies across multiple domains, aiming to better understand the societal impacts of climate change under different scenarios. However, these simulation results suffer from coarse spatial resolution and substantial simulation errors. Therefore, it is often necessary to employ downscaling or bias correction methods to obtain climate projections with higher resolution and reduced simulation errors.
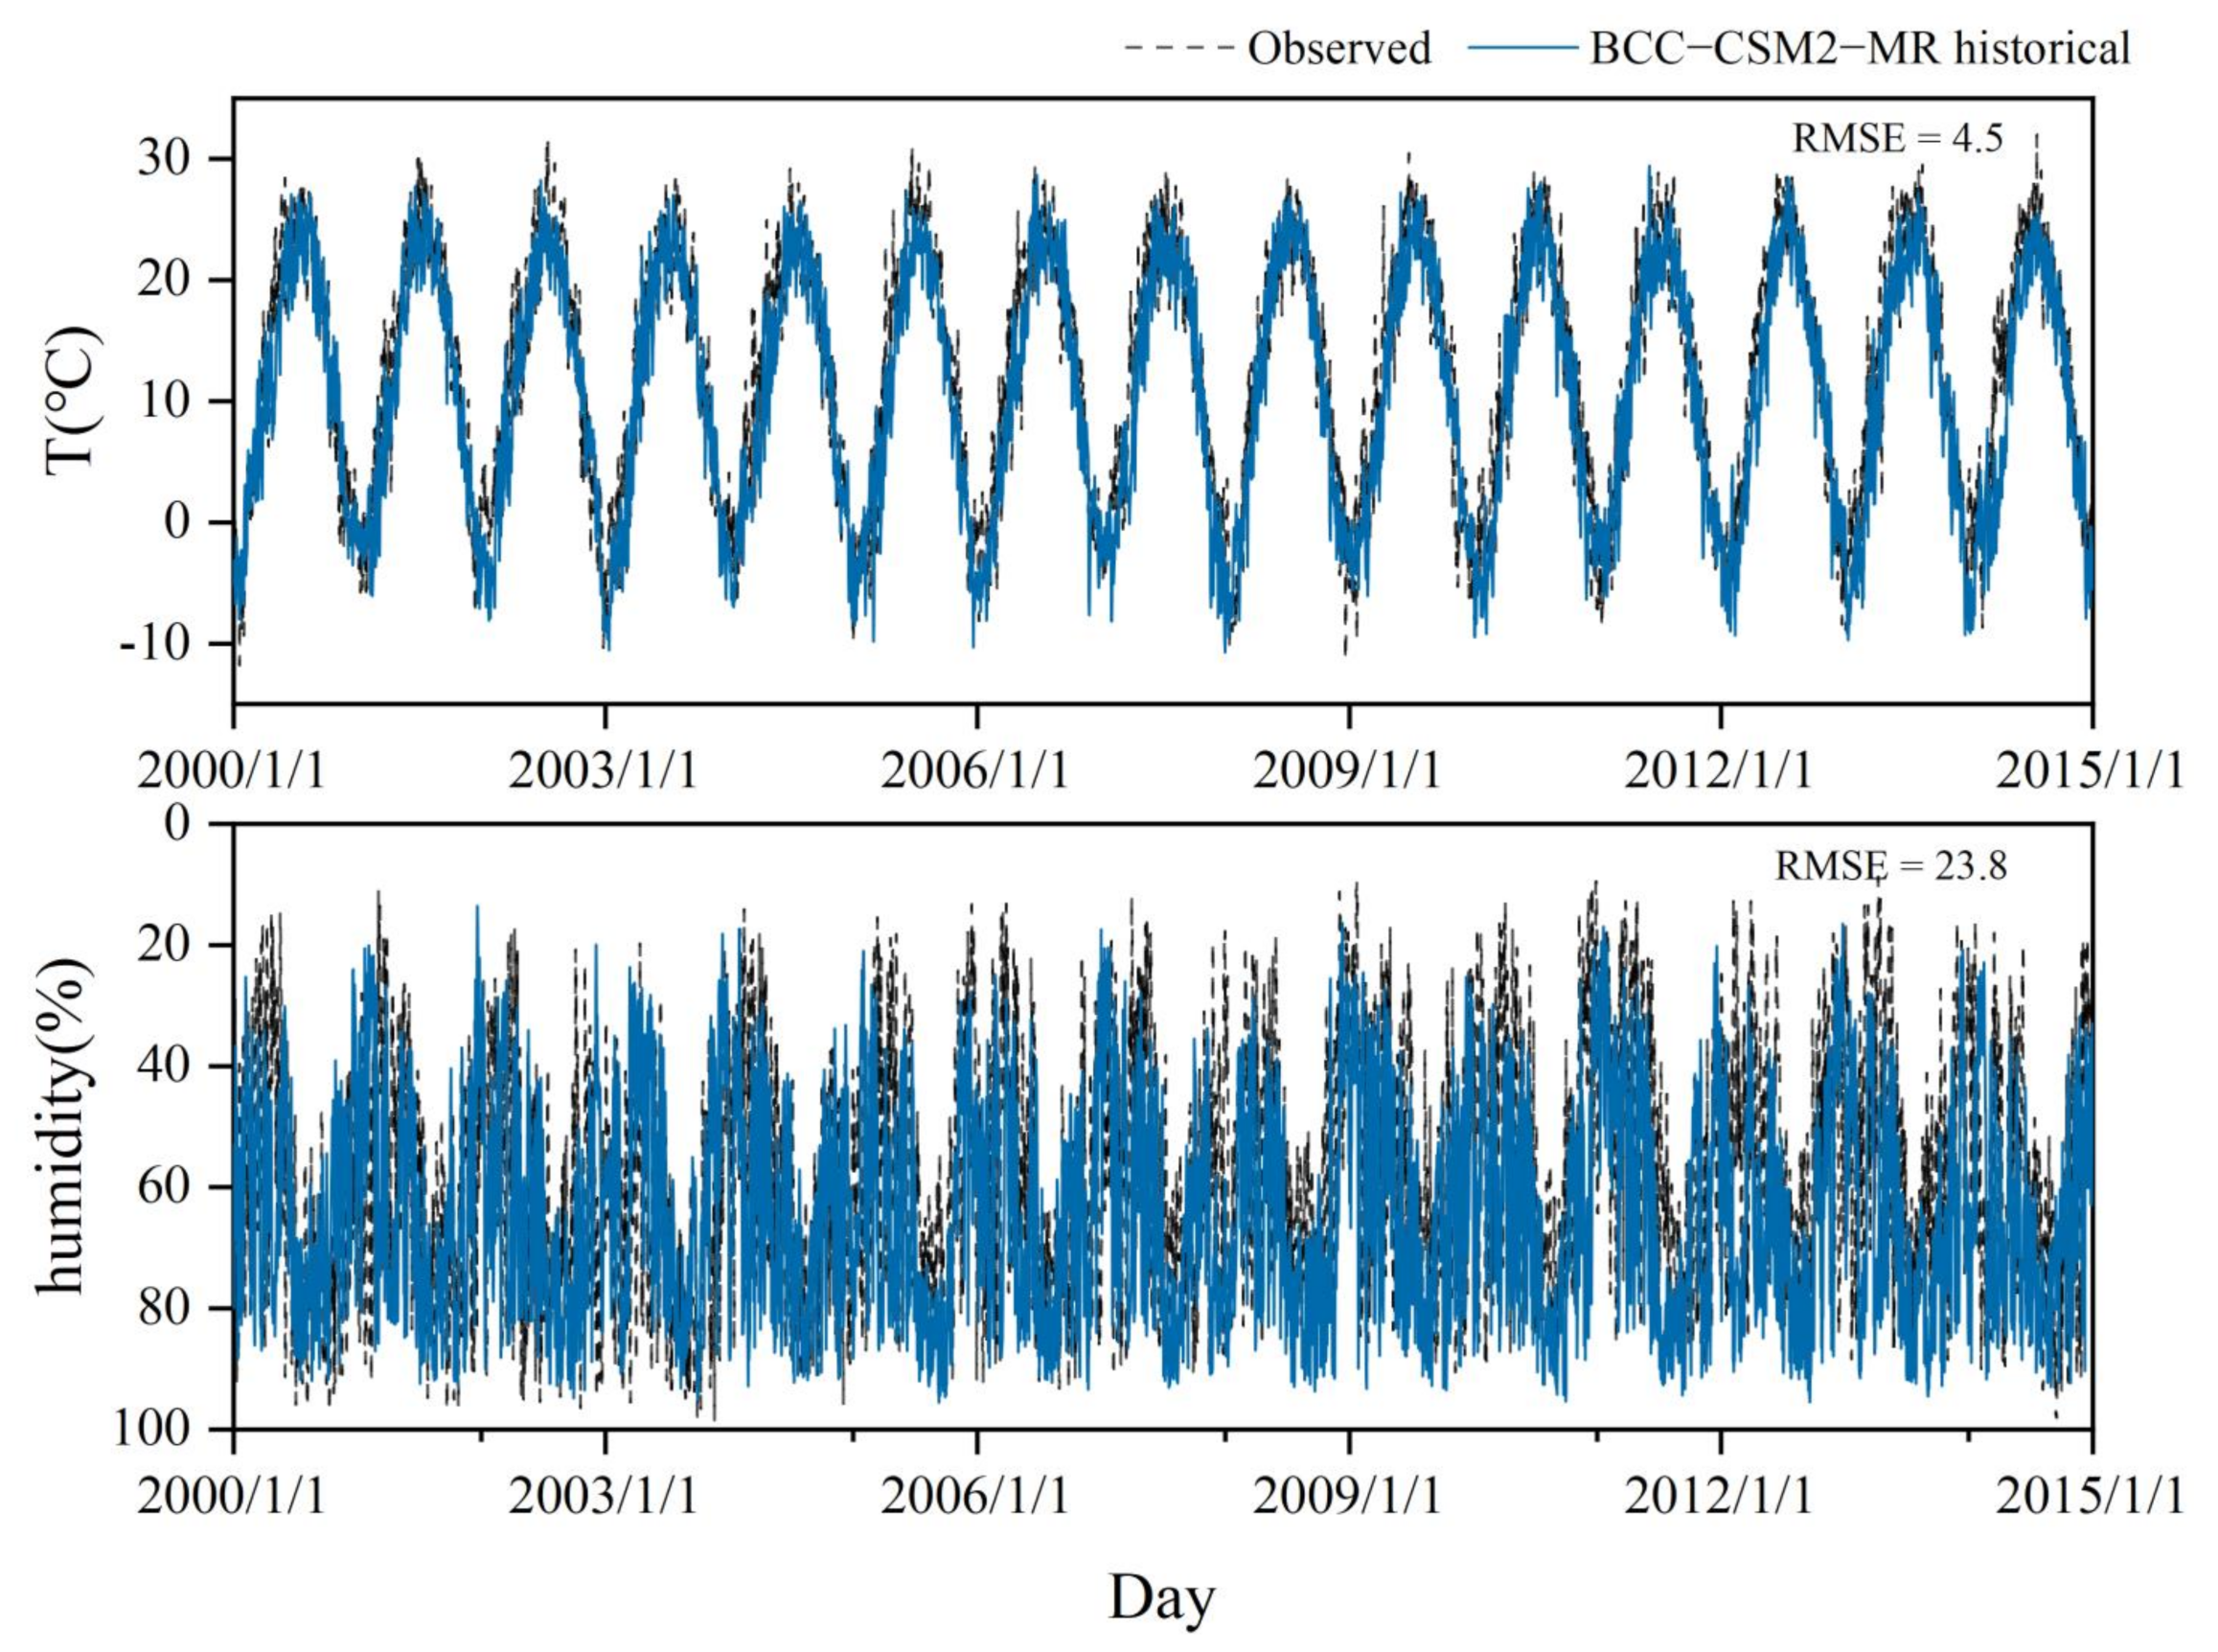
In this study, we have utilized simulated data from the BCC-CSM2-MR model [34,35] that was provided by the China National Climate Center, which underwent spatial downscaling and statistical bias correction [36]. The spatial resolution of this model is 0.25° × 0.25°. To validate its reliability, we compared the downscaled and bias-corrected simulation results with observed data, as depicted in Figure 6. By conducting these comparisons, we were able to evaluate the effectiveness of the downscaling and bias correction methods on the simulation data and verify the accuracy of the climate model data used in our study. The future predicted values of this climate model would be utilized to drive the primary water calculation model, allowing us to obtain future water usage patterns and facilitate quantitative research on the impact of climate change.
The assessment of climate change impacts relies on the utilization of existing climate model outcomes. Initially, a water consumption calculation model is employed to estimate the primary water consumption processes in the study area, specifically focusing on evaporation from the cycle cooling water tower and desulfurization. Subsequently, the calculated results are integrated with ScenarioMIP data and estimated power generation processes as relevant variables in a regression model, facilitating the evaluation of the water withdrawal process. The process of calculating climate impact involves examining the effects of water consumption processes and withdrawal processes, which are highly interrelated. To establish this relationship, a regression model has been utilized.
In view of the capricious nature of power generation [37] and our particular emphasis on examining the consequences of climate change, we strive to reduce the reliance on the power supply and demand forecasting and modeling. As a result, we have opted for a specific time frame, spanning from early June 2021 through the conclusion of May 2022, as the unvarying power generation process for each year. This designated duration serves as the fundamental foundation for subsequent modeling and analysis in our research.
3. Results
3.1. Impact of Climate Change on Water Consumption
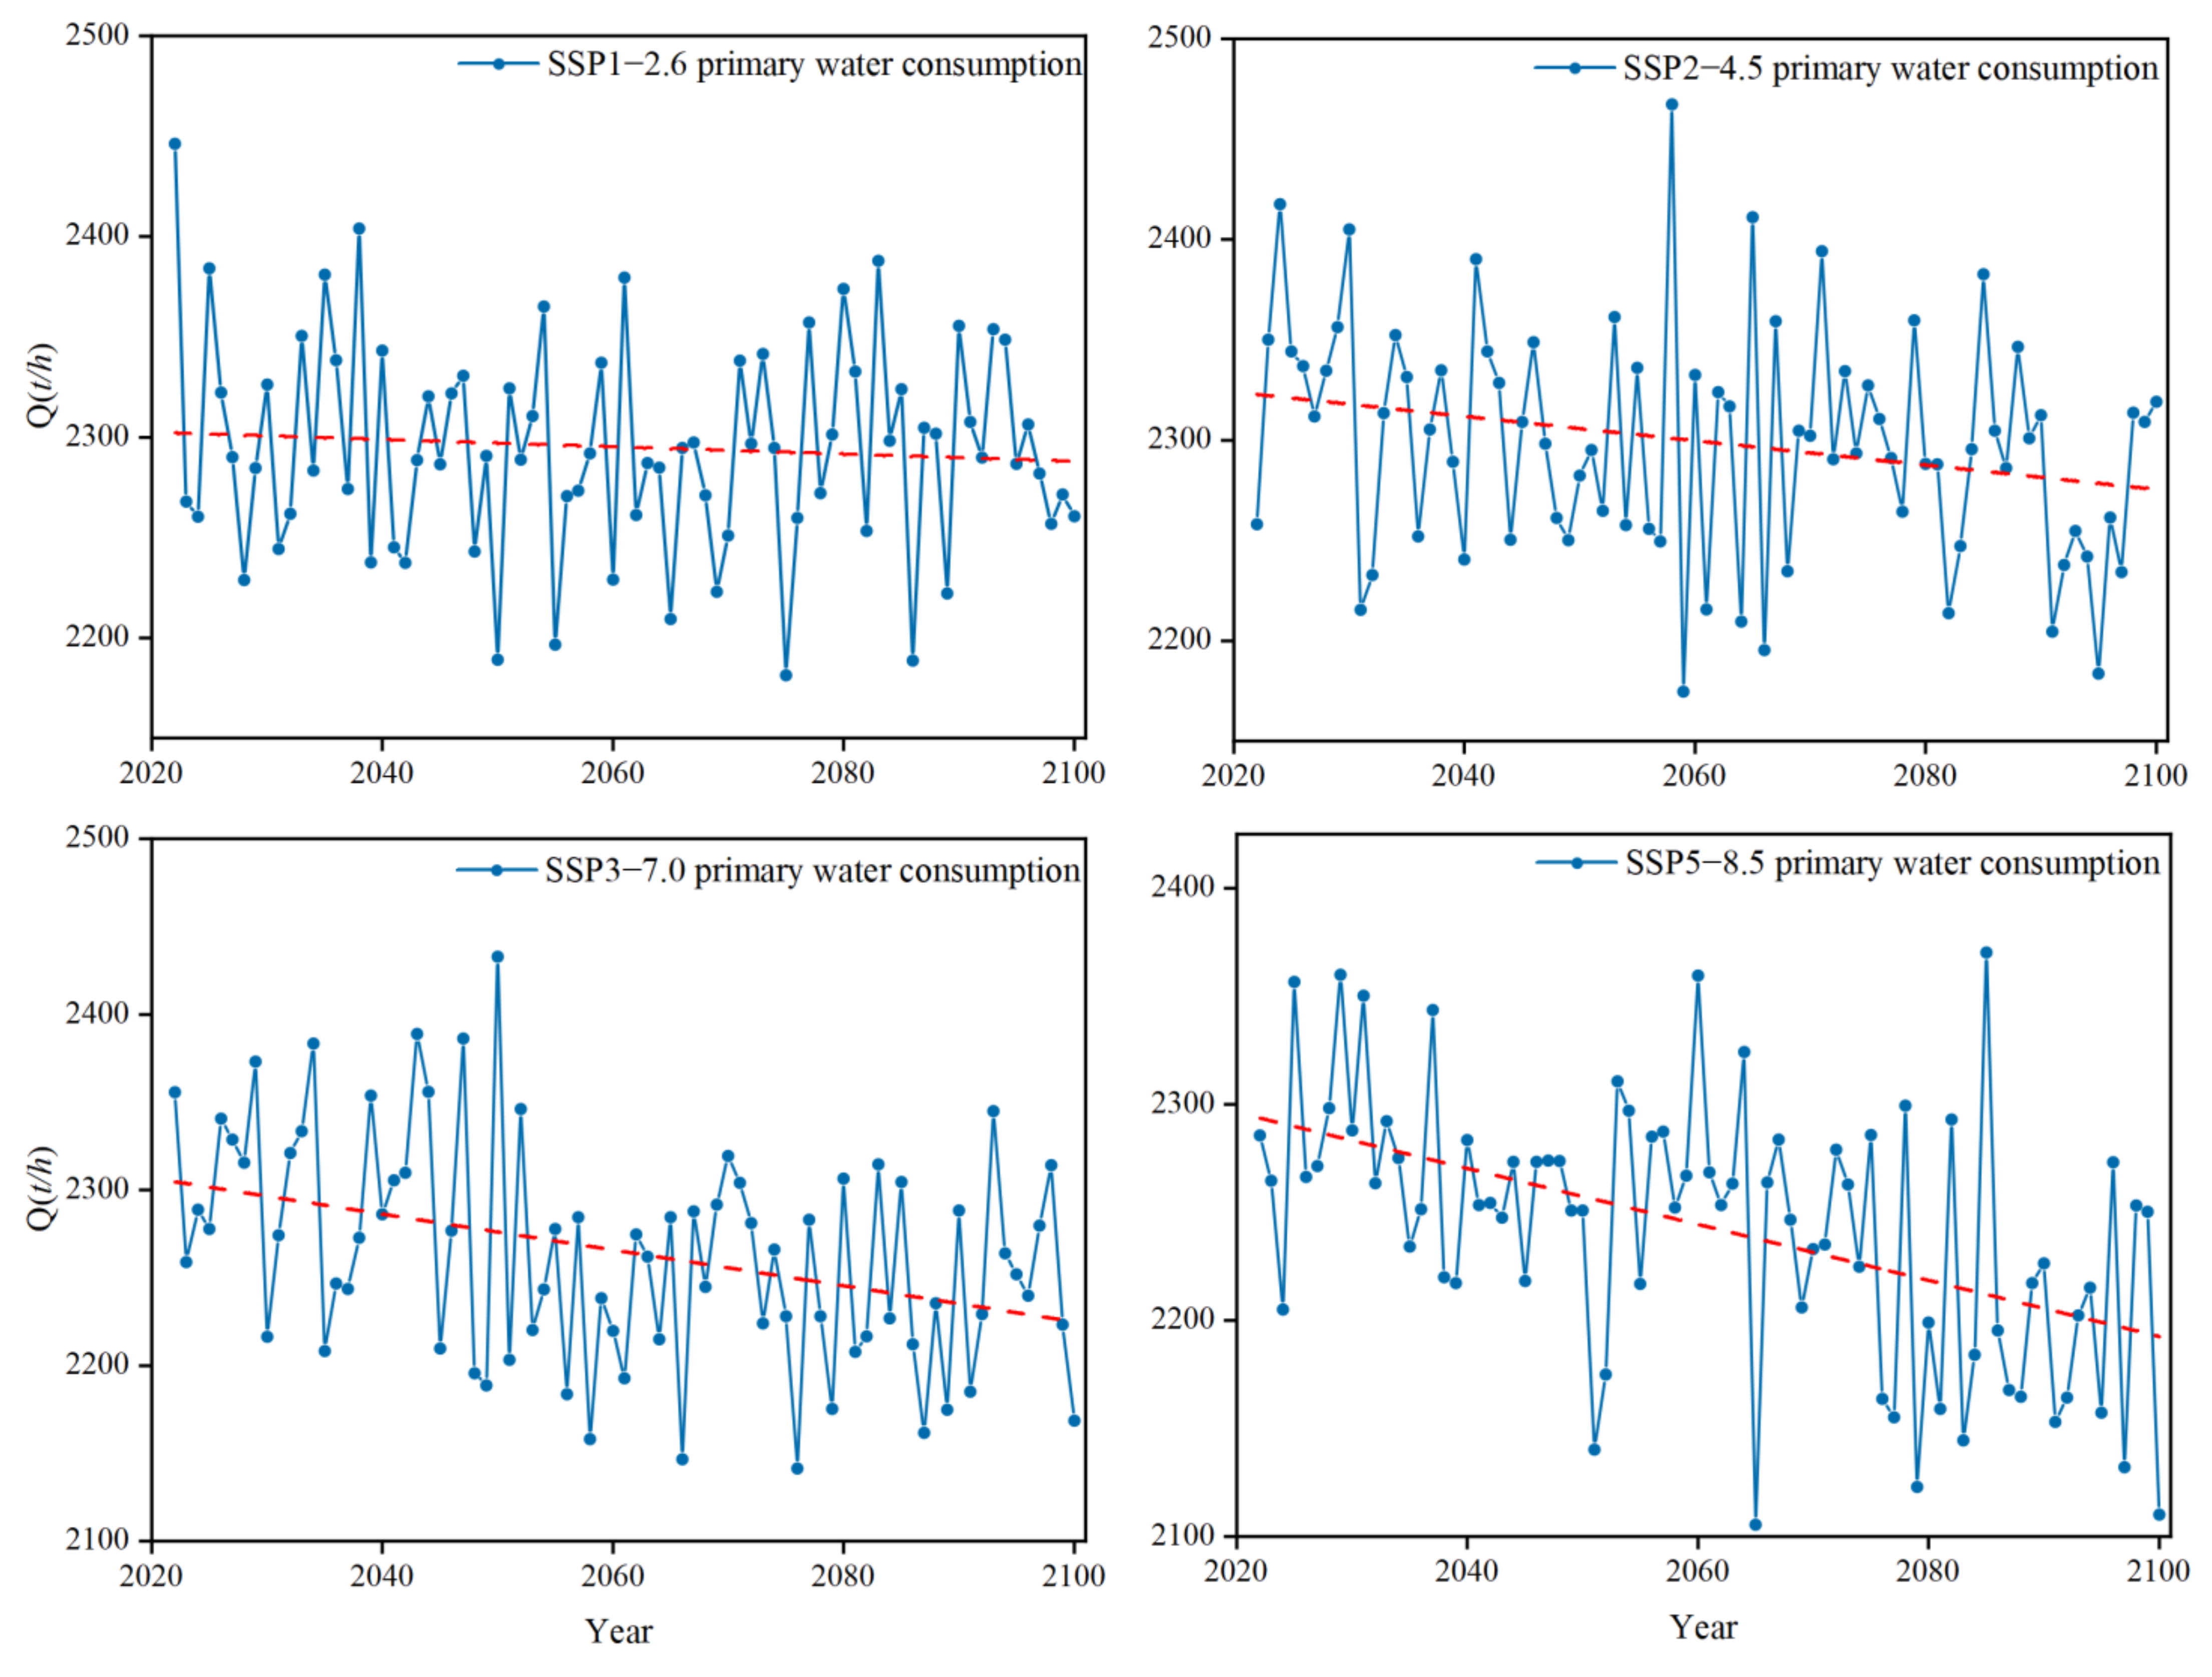
The water consumption calculations for the cooling tower and desulfurization processes were conducted individually and later merged to determine the primary water consumption process for the enterprise. These calculations were based on the four SSPs-RCPs scenarios from ScenaripMIP. The results are shown in Figure 7. In the SSP1–2.6 scenario, the annual trend of the primary water consumption for the case remains relatively stable, with an average annual water consumption fluctuating around 2300 t/h. In the SSP2–4.5, SSP3–7.0, and SSP5–8.5 scenarios, the primary water consumption shows a decreasing trend, and the magnitude of the decrease increases with each scenario. Specifically, the case experiences a decreasing trend of approximately 1600 t/year, 5300 t/year, 9000 t/year, and 11,400 t/year in the respective scenarios. Across all scenarios, the annual fluctuation range of the primary water consumption is between 2100 t/h and 2470 t/h, with an annual variation of less than 11%. Additionally, the magnitude of fluctuation increases in the order of SSP1–2.6 to SSP5–8.5 scenarios.
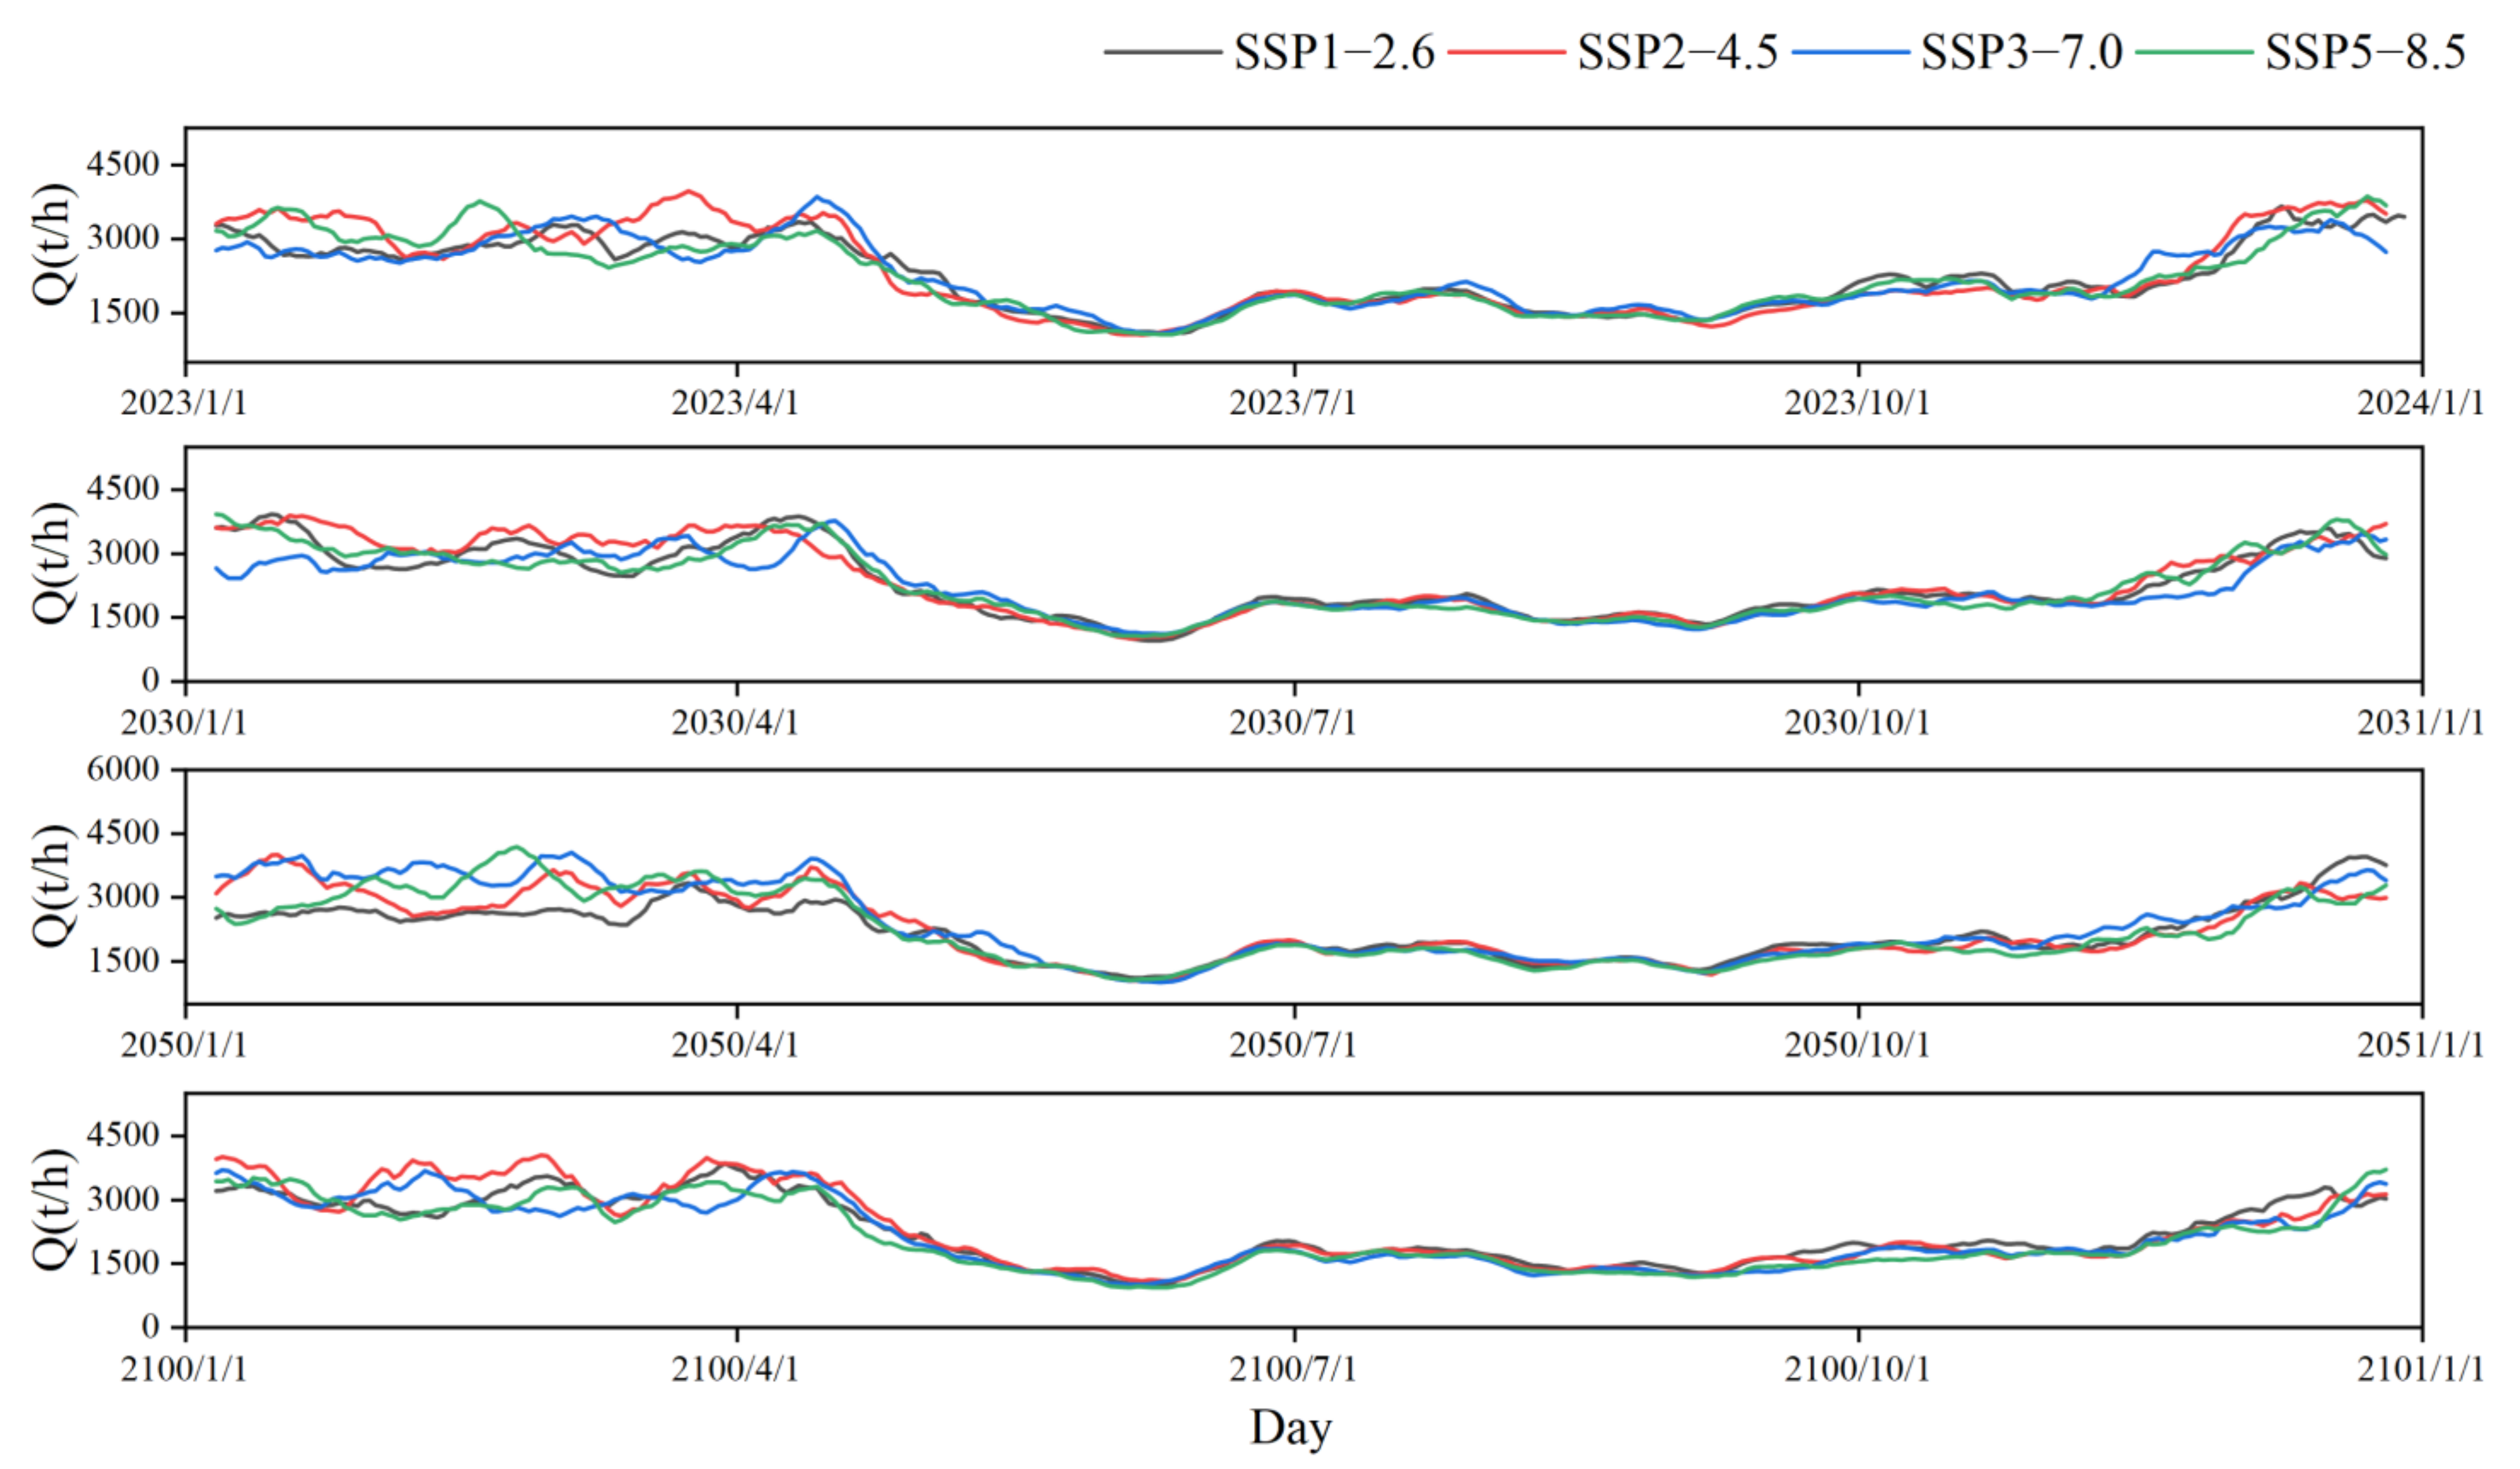
On a daily scale, due to the vast time span of the entire forecasting period (from early 2022 to the end of 2100), it is not feasible to present the complete data. Therefore, we selected several specific time periods of interest for analysis: the whole year of 2023, 2030, 2050, and 2100. The primary water consumption processes during these periods are shown in Figure 8. By comparing the annual processes under different SSPs-RCPs scenarios, it is apparent that the SSP5–8.5 scenario is more prone to extreme water consumption processes. Nevertheless, the SSP1–2.5 scenario demonstrates higher overall water consumption throughout the year, suggesting that while climate change may result in escalated extreme water withdrawals, it has an adverse effect on overall water consumption.
3.2. Impact of Climate Change on Water Intake
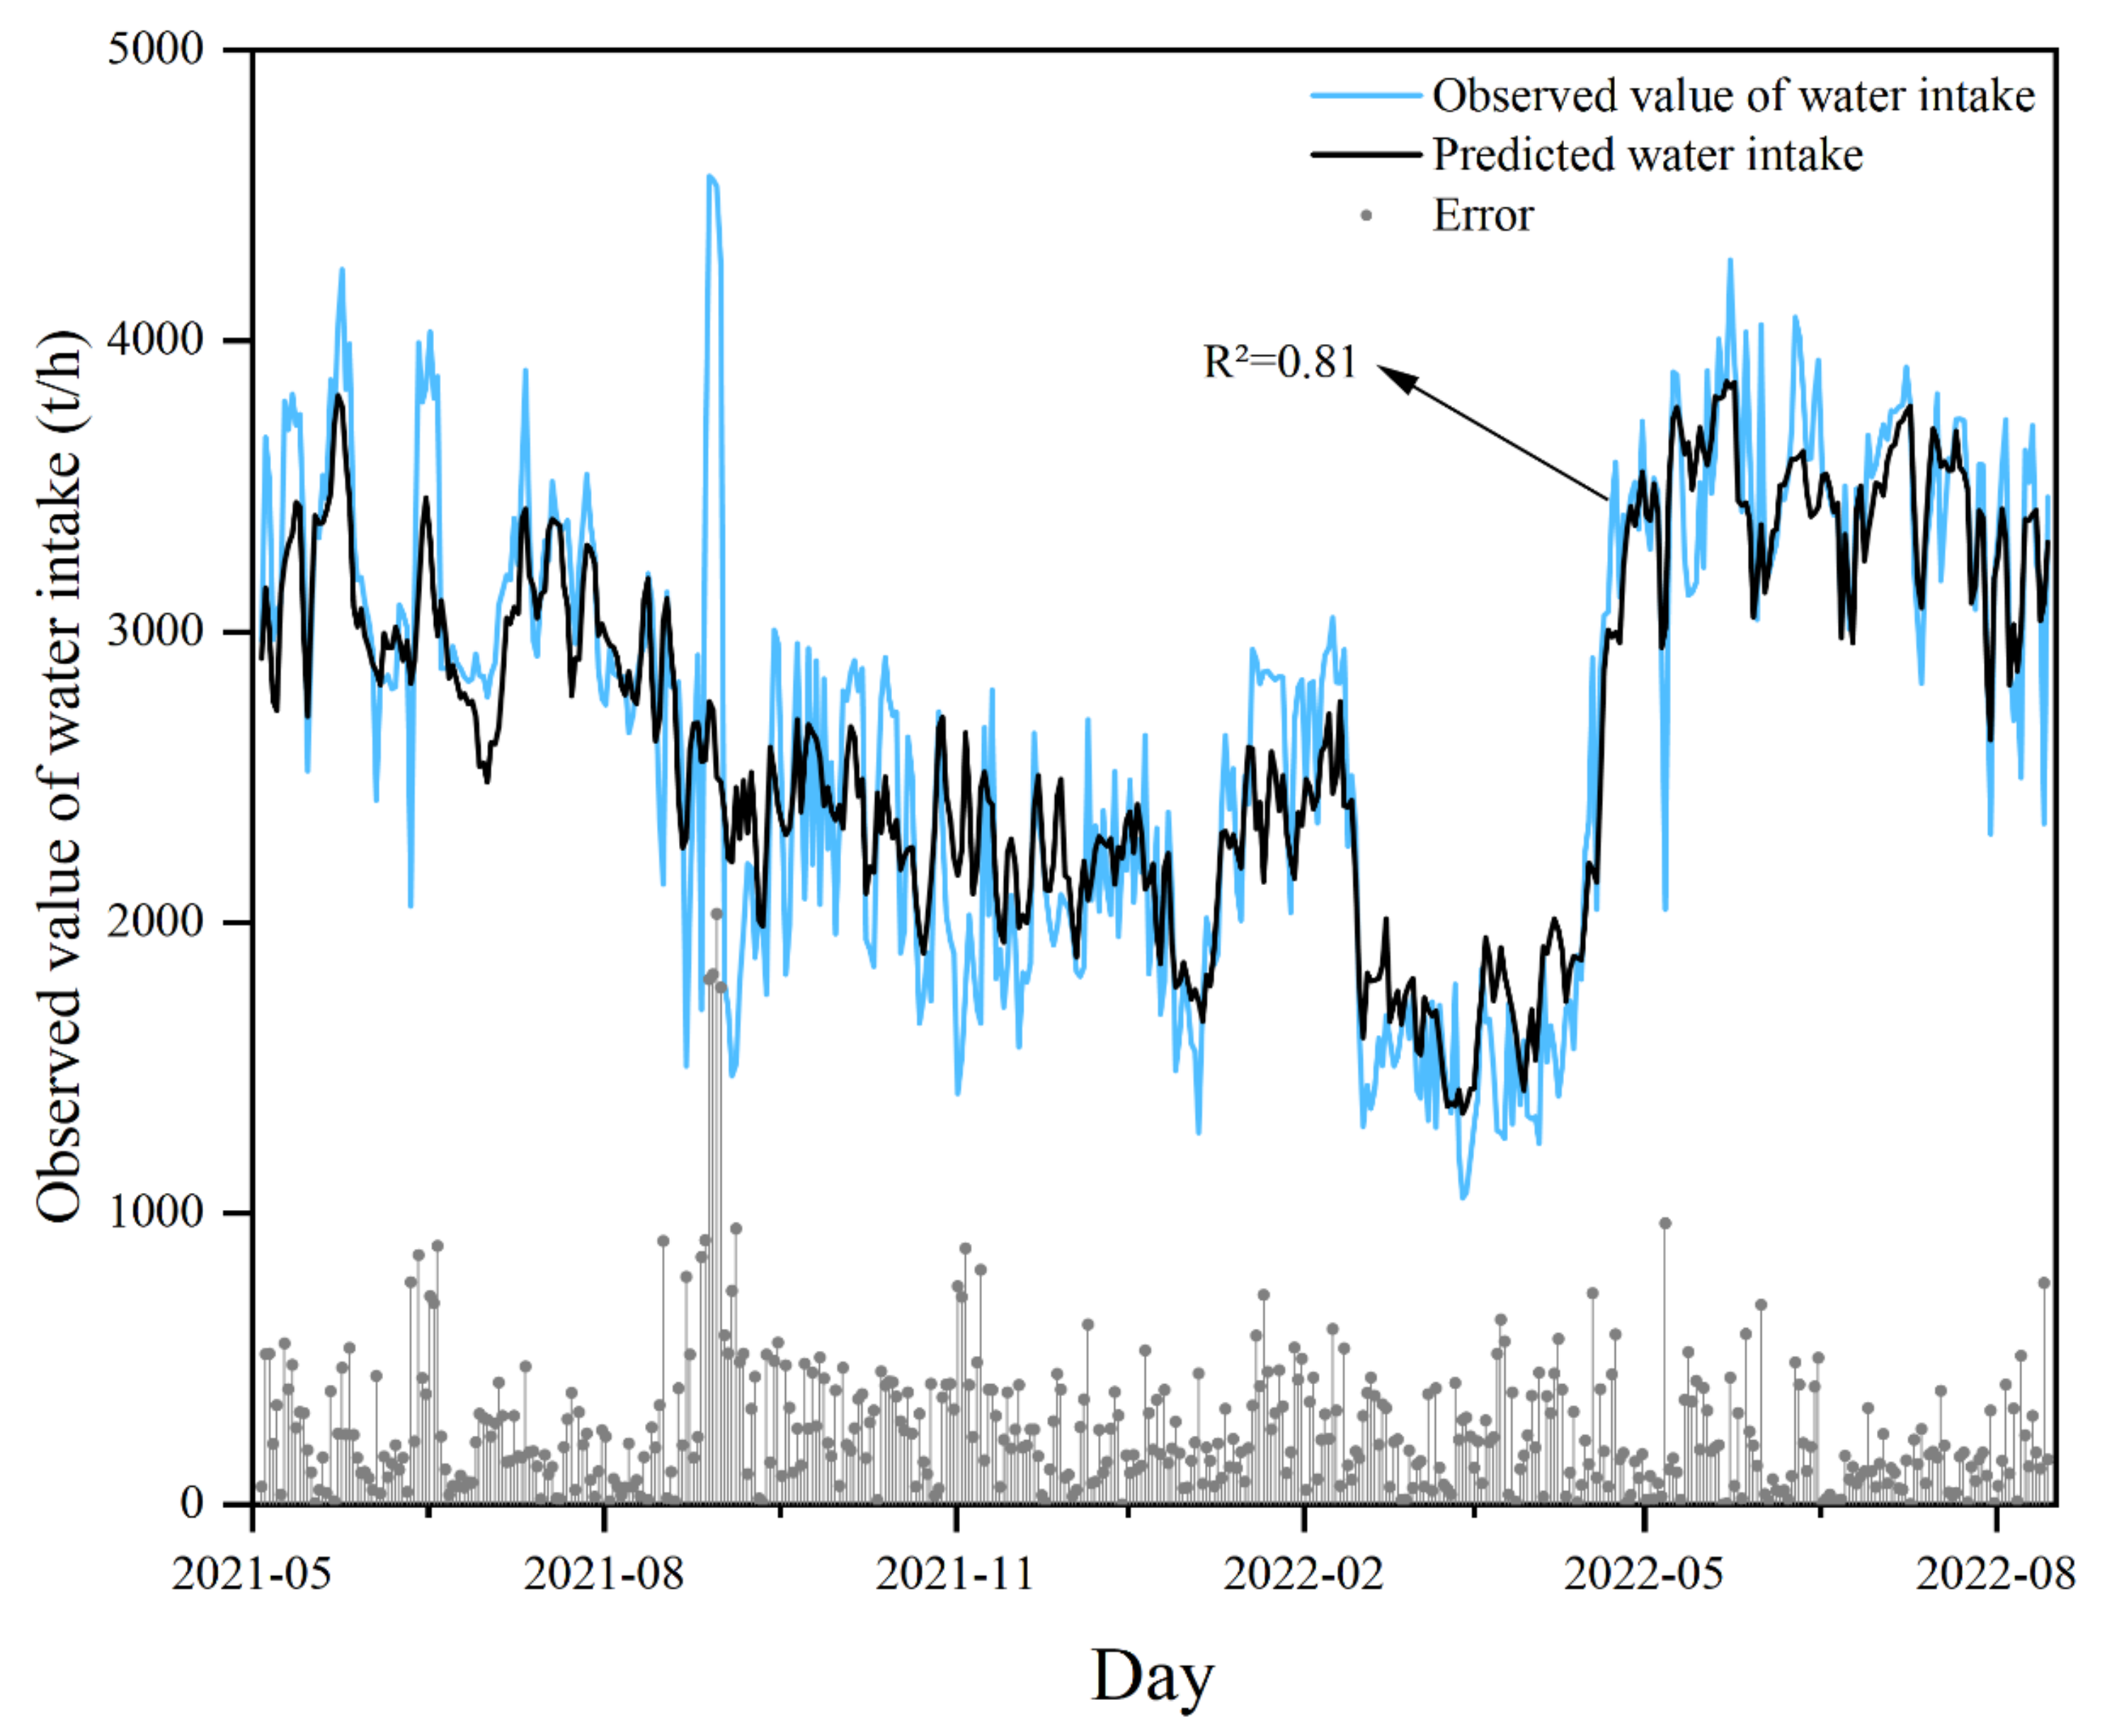
In order to capture the periodic nature of water intake, this study utilized an LSTM [38] neural network to establish the relationship between external factors and water consumption. Time series data, including temperature, humidity, and calculated water consumption, were analyzed and linked to the actual water intake process. To fine-tune the model parameters, 20% of the measured data was designated as a test set. The trained model demonstrated an impressive MAPE (Mean Absolute Percentage Error) of 10.4% and an R-squared value of 0.81 for the entire dataset, as depicted in Figure 9. However, the model’s performance was somewhat compromised when applied to extreme water intake processes. Specifically, the model exhibits synchronized fluctuations in daily water intake processes but is generally unable to accurately predict the peak value of daily water intake. As a result, it is necessary to convert the computed results into annual values by sliding them.
The results of further predicting future water intake trends using the obtained model can be seen in Figure 10.
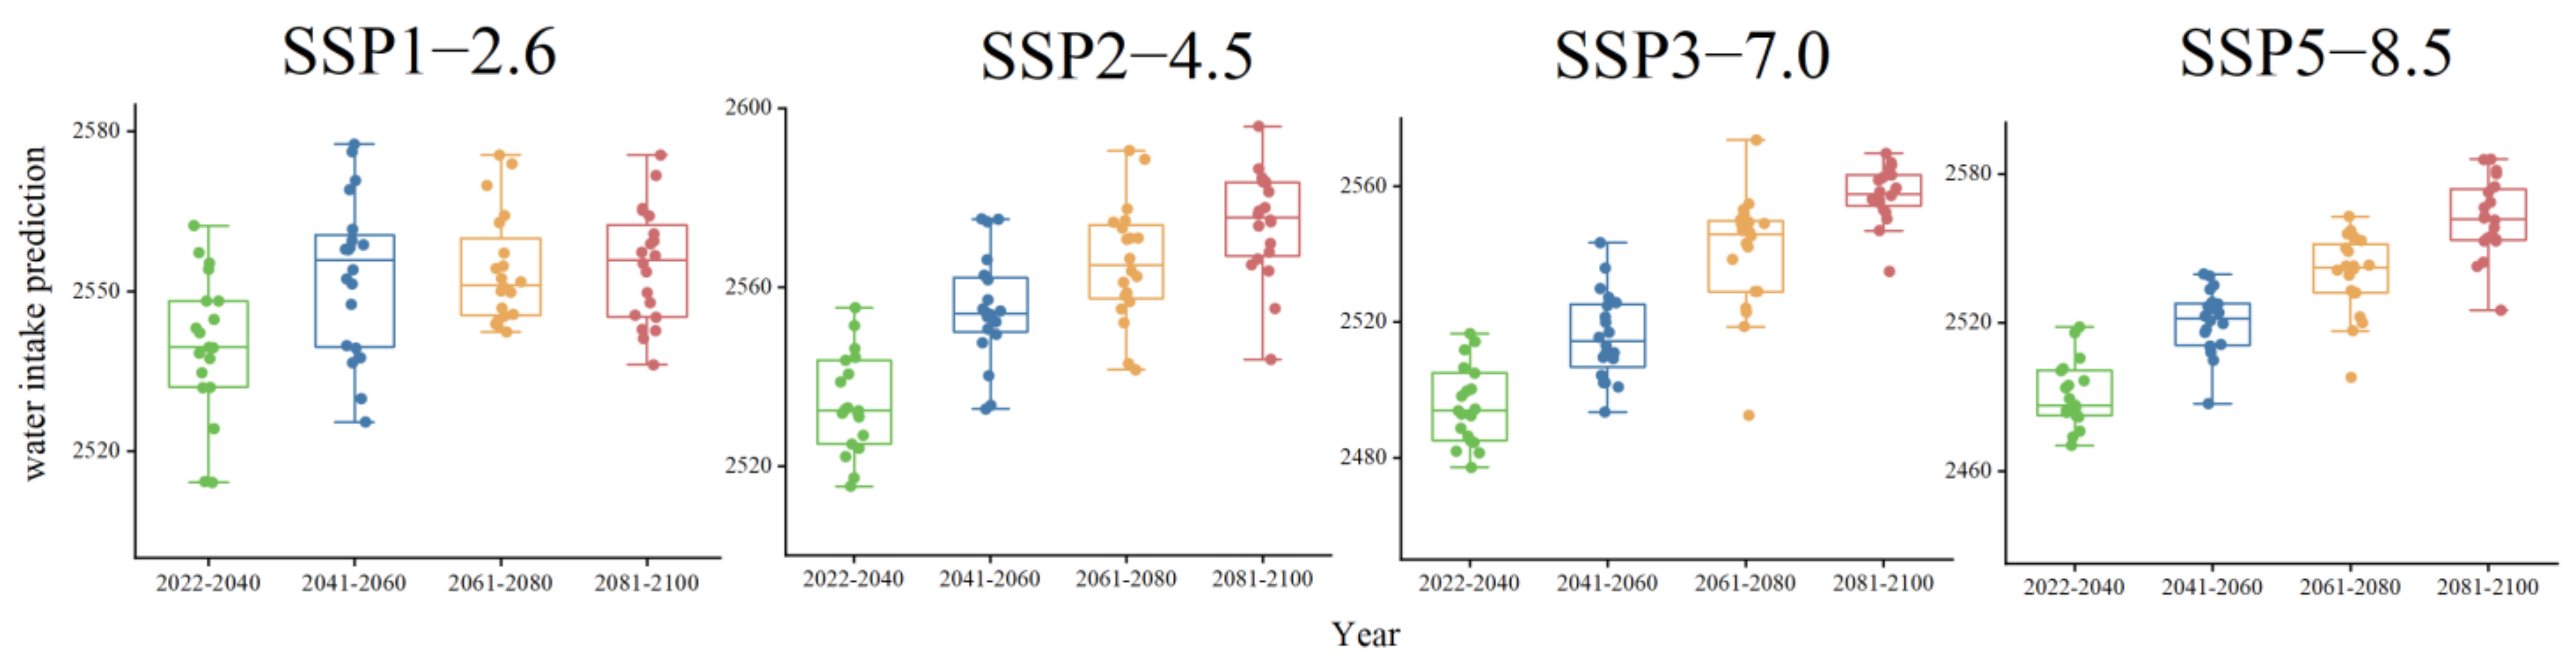
The water intake of the case power plant is displaying an upward trend due to the effects of climate change. The increasing trend varies across the different SSPs-RCPs scenarios, with SSP1–2.6, 2–4.5, 3–7.0, and 5–8.5 exhibiting progressively higher increasing trends. Although the primary water consumption calculations show a decreasing trend, the water intake trend shows an increasing pattern. This suggests that other processes, which are impacted by climate change, are offsetting the decrease in water consumption, ultimately leading to an overall increase in water intake.
In order to examine the influence of diverse factors, further calculations were conducted to ascertain the correlation coefficients between the anticipated values and the corresponding regression factors. Equation (15) furnishes the formula for determining the correlation coefficient, and the outcomes of the correlation coefficient analysis can be located in Table 3. By comparing the correlation coefficients of the predicted results with the relevant factors, such as power generation, primary water consumption, temperature, and relative humidity, the following conclusions can be drawn: (1) The power generation process exerts the most significant impact on water intake, as evidenced by an average correlation coefficient of 0.73 across all SSPs-RCPs scenarios. It can be considered as the determining factor for water intake; (2) Compared to power generation, the primary water consumption process has a relatively minor impact on water intake, as indicated by an average correlation coefficient of 0.33 across all SSPs-RCPs scenarios. It can be considered a major influencing factor for water intake; (3) Temperature and relative humidity, as climate factors, show different correlations with water intake. Except for the positive correlation coefficient between temperature and water intake in the SSP3–7.0 scenario, all other scenarios show negative correlation coefficients. This aligns with the impact of climate change on water consumption. The correlation coefficient between humidity and water intake is even smaller in the SSP3–7.0 scenario. Overall, the relationship between climate and water intake prediction is negative, indicating that climate factors can be considered to be secondary influencing factors.
where and are the mean and standard deviation of X, respectively, and and are the mean and standard deviation of Y; N is the number of samples.
Based on the analysis of the results, it can be determined that under the SSP1–2.5 to SSP5–8.5 scenarios, the case company’s water intake shows annual increasing trends of 2000, 5600, 9200, and 10,000 t/year, respectively. The impact of climate change on total water intake is less than 0.044%.
4. Discussion
This study primarily focuses on the open-cycle cooling tower and flue gas desulfurization (FGD) as the primary water consumption processes. However, it has been observed that the influence of climate change on these processes remains relatively stable or diminished. Under the SSP1–2.5 scenario, the annual water consumption trend tends to remain unchanged, whereas, under the SSP5–8.5 scenario, significant fluctuations in annual water consumption trends are observed. This is because the considered water consumption processes mainly involve evaporative water processes, which are not usual in nature. The open-cycle cooling tower is specifically designed to fulfill the cooling requirements of the power generation unit, and thus its evaporation process is influenced by external meteorological factors. However, the overall water consumption remains affected slightly. Furthermore, the FGD process is fully enclosed, and climate factors only exert minimal influence on it. The combination of these factors has resulted in research findings that are different from the result of Ahi et al. [39] and Kayhomayoon et al. [40]; both of their results indicate scenarios of increased evaporation.
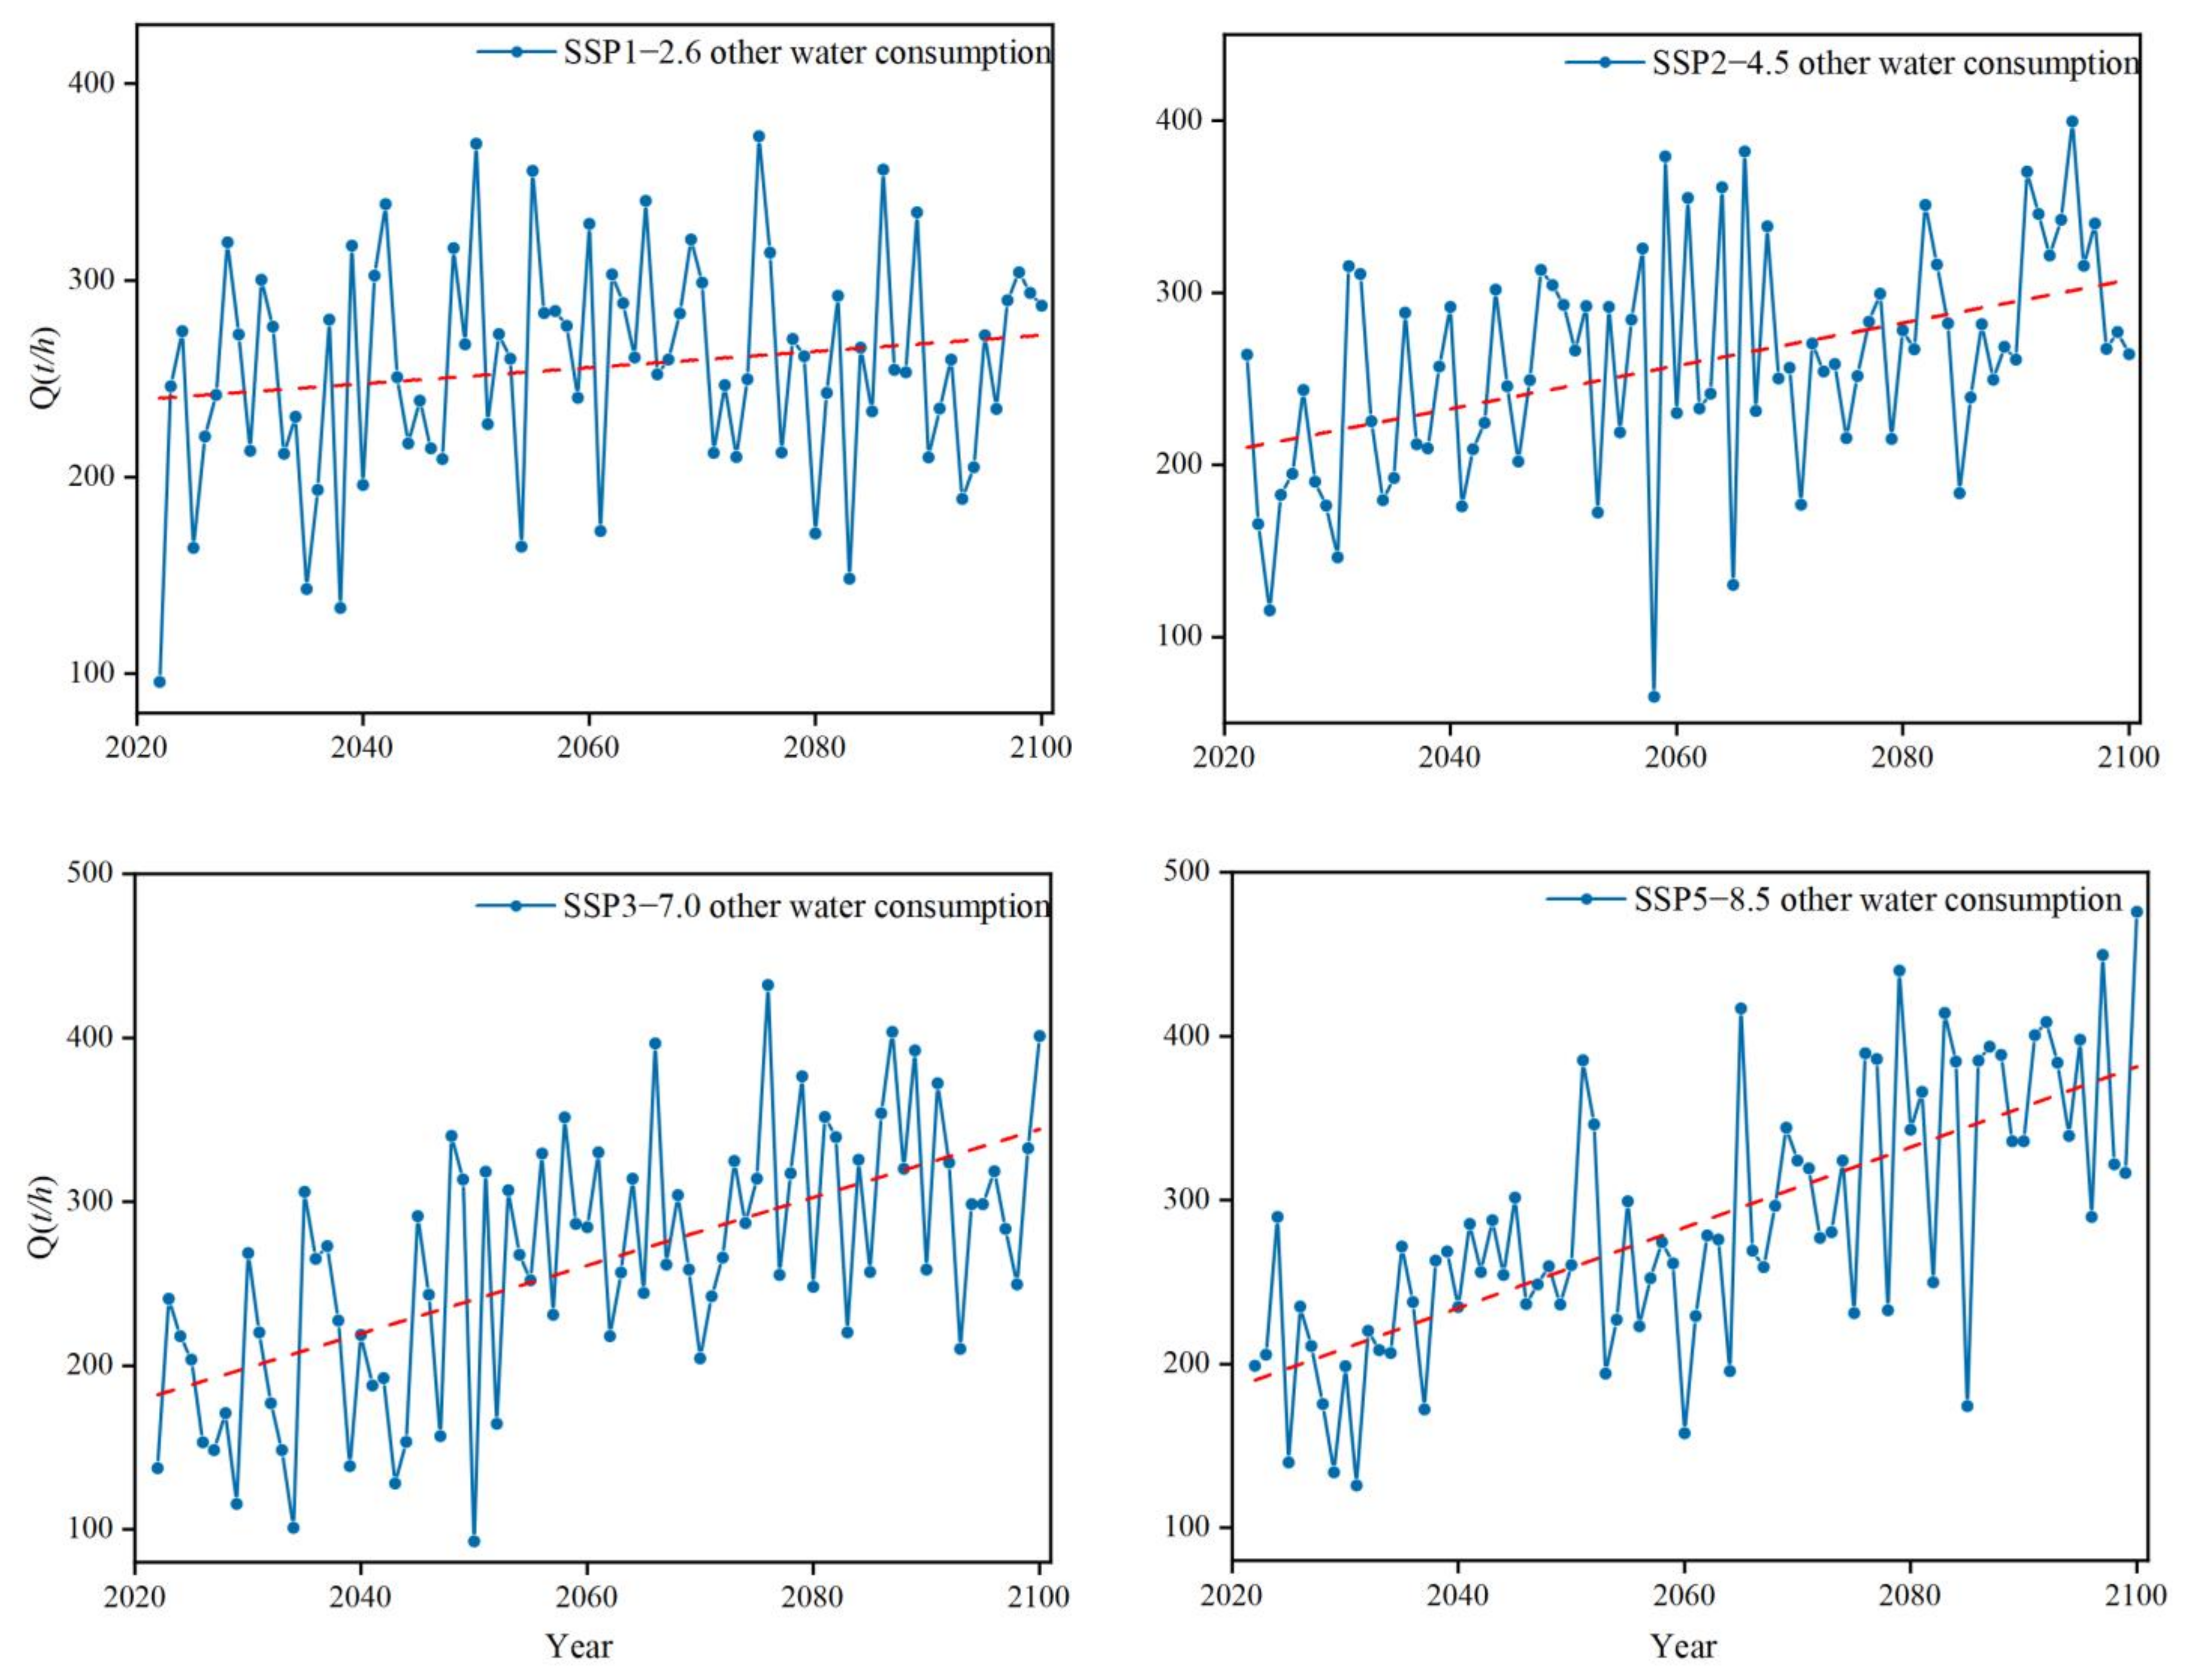
In this study, the influence of climate change on the power generation process was neglected. In reality, in the context of Chinese carbon peaking and carbon neutrality goals [41], the power generation process in a thermal power company is expected to undergo a reduction rather than an increase, as concluded in the study by Guo et al. [42] and Wang et al. [43]. This means that the variation in water consumption and intake in the actual process will be weaker than in this study. By the end of this century, water intake for the case enterprise is projected to increase by an average of 4.4%, while the primary evaporative water consumption process is expected to decrease by 5.6%. To elucidate this discrepancy, we have further plotted a graphical representation of the estimated annual other water consumption (assuming constant annual water storage for the company) in Figure 11. Based on our analysis, we have arrived at preliminary conclusions that the impact of climate change on water consumption in industrial enterprises is significant and diverse, particularly concerning evaporation water usage and other water usage examined in this study. The most probable reasons for the increase in water losses in other water usage are as follows: firstly, intensified climate change leads to increased water surface evaporation in the industrial area, resulting in higher natural losses within the facility; secondly, the reduced evaporation from the cooling towers leads to a decrease in makeup water and an increase in impurities concentration in the discharge, requiring more water losses for the reuse of this portion.
The impact of climate change on annual water intake and consumption is relatively weak. However, climate change is exacerbating the fluctuations in water intake and consumption processes. The maximum fluctuation in annual average water intake may reach up to 1.88%, while the largest fluctuation in annual average water consumption is 11%. These findings indicate that future industrial facilities will face greater challenges. Moreover, the declining trend in primary water consumption suggests that water conservation through artificial regulation of these water-consuming facilities is feasible.
The water consumption models for the cooling tower and desulfurization processes used in this study still require further refinement. Firstly, we have overlooked the influence of the cooling tower’s wall on the internal heat transfer process, which can be accounted for by calculating the outer surface area of the tower in the heat exchange section. Secondly, we have also neglected the loss due to wind blowing in the cooling tower, which can be calculated by considering the intensity of the wind. Lastly, the calculation of the desulfurization evaporation process is not yet complete, as different coal types have varying combustion parameters. Similar to the power generation process, the coal combustion parameters for different time periods can be fixed using a typical annual approach.
5. Conclusions
This study presents a methodology for analyzing the impact of climate change on water consumption and intake processes in industrial enterprises through the stepwise construction of water consumption process models and intake process models. The core process is the calculation of water consumption, which should accurately reflect the actual water consumption and be harmonious with the water intake process. By utilizing the related correlation models, the water intake process can be analyzed, thereby achieving the overall analysis. The research framework used in this study can better analyze the impact of climate change on the water usage process of industrial enterprises.
A coal-fired power plant was selected as a case study for computational analysis. Models for water consumption and water intake correlation were developed. Under the influence of climate change, the annual average trend of primary water consumption exhibited a decreasing trend in the case under the SSP1–2.9, 2–4.5, 3–7.0, and 5–8.5 scenarios with respective reductions of 1600, 5300, 9000, and 11,400 t/year. Conversely, the water intake showed an increasing trend with respective increments of 2000, 5600, 9200, and 10,000 t/year. Furthermore, the evaporation trend due to climate change had an annual decrease of less than 0.056%, and the water intake increment was less than 0.044%.
Climate change exacerbates the uncertainty surrounding water intake and consumption processes and has a continuous impact on actual water withdrawal and consumption. In order to adapt to climate change, enterprises should forecast future water consumption based on climate conditions and adjust their water supply strategies to achieve water efficiency. Furthermore, to cope with more pronounced fluctuations in water intake and consumption in the future, it is crucial for enterprises to promptly assess their water intake capacity and limitations and appropriately increase their internal water storage capacity for regulation and resilience.
To effectively adapt to climate change, industrial enterprises can implement the following measures: predicting future water demand; adjusting water supply strategies; improving water efficiency; assessing water intake capacity; enhancing internal water storage capacity; and establishing measures and emergency plans to respond to future fluctuations. These actions are crucial for ensuring sustainable water resource utilization, reducing water losses in production processes, and providing a stable water supply for future development.
Author Contributions
Conceptualization, J.L.; data curation, J.L.; formal analysis, L.C.; investigation, J.L.; methodology, J.L.; resources, J.L.; software, J.L.; supervision, Y.Z.; validation, L.C. and Y.Z.; visualization, J.L. and L.W.; writing—original draft, J.L.; writing—review and editing, L.C. and Y.Z. All authors have read and agreed to the published version of the manuscript.
Funding
This work was supported by the IWHR Research & Development Support Program (Grant No. WR110145B0042021, WR110145B0052021), the National Key R&D Program of China CERC-WET Project (Grant No. 2018YFE0196000), the Systematic Project of Guangxi Key Laboratory of Disaster Prevention and Engineering Safety (2022ZDK026) and the Open Research Fund of State Key Laboratory of Simulation and Regulation of Water Cycle in River Basin, China Institute of Water Resources and Hydropower Research (Grant No.IWHR-SKL-KF202204).
Institutional Review Board Statement
Not applicable.
Informed Consent Statement
Not applicable.
Data Availability Statement
Not applicable.
Conflicts of Interest
The authors declare no conflict of interest.
References
- Wang, B.X.; Wang, X.J.; Zhang, X. An Empirical Research on Influence Factors of Industrial Water Use. Water 2019, 11, 2267. [Google Scholar] [CrossRef] [Green Version]
- Bruggen, B.; Boussu, K.; De Vreese, I.; Van Baelen, G.; Willemse, F.; Goedeme, D.; Colen, W. Industrial Process Water Recycling: Principles and Examples. Environ. Prog. 2005, 24, 417–425. [Google Scholar] [CrossRef]
- Zheng, T.; Du, Z.; Cao, H.; Jiang, J.; Zheng, W.; Tang, S.; Wang, P. Development of a novel mobile industrial-scale fluidized adsorption process for emergency treatment of water polluted by aniline: CFD simulation and experiments. Adv. Powder Technol. 2016, 27, 1576–1587. [Google Scholar] [CrossRef] [Green Version]
- Ding, J.; Gao, Q.; Wang, Y.; Zhao, G.; Wang, K.; Jiang, J.; Zhao, Q. Simulation and prediction of electrooxidation removal of ammonia and its application in industrial wastewater effluent. Water Environ. Res. 2021, 93, 51–60. [Google Scholar] [CrossRef] [PubMed]
- Echi, S.; Bouabidi, A.; Driss, Z.; Abid, M.S. CFD simulation and optimization of industrial boiler. Energy 2019, 169, 105–114. [Google Scholar] [CrossRef]
- Rezaei, E.; Shafiei, S.; Abdollahnezhad, A. Reducing water consumption of an industrial plant cooling unit using hybrid cooling tower. Energy Convers. Manag. 2010, 51, 311–319. [Google Scholar] [CrossRef]
- Cao, W.S.; Liu, Q.; Wang, Y.; Mujtaba, I.M. Modeling and simulation of VMD desalination process by ANN. Comput. Chem. Eng. 2016, 84, 96–103. [Google Scholar] [CrossRef] [Green Version]
- Wojdalski, J.; Dróżdż, B.; Piechocki, J.; Gaworski, M.; Zander, Z.; Marjanowski, J. Determinants of water consumption in the dairy industry. Pol. J. Chem. Technol. 2013, 15, 61–72. [Google Scholar] [CrossRef] [Green Version]
- Ding, T.; Liang, L.; Zhou, K.L.; Yang, M.; Wei, Y.Q. Water-energy nexus: The origin, development and prospect. Ecol. Model. 2020, 419, 108943. [Google Scholar] [CrossRef]
- Eyring, V.; Bony, S.; Meehl, G.A.; Senior, C.A.; Stevens, B.; Stouffer, R.J.; Taylor, K.E. Overview of the Coupled Model Intercomparison Project Phase 6 (CMIP6) experimental design and organization. Geosci. Model Dev. 2016, 9, 1937–1958. [Google Scholar] [CrossRef] [Green Version]
- O’Neill, B.C.; Tebaldi, C.; van Vuuren, D.P.; Eyring, V.; Friedlingstein, P.; Hurtt, G.; Knutti, R.; Kriegler, E.; Lamarque, J.F.; Lowe, J.; et al. The Scenario Model Intercomparison Project (ScenarioMIP) for CMIP6. Geosci. Model Dev. 2016, 9, 3461–3482. [Google Scholar] [CrossRef] [Green Version]
- Zhang, X.; Zhang, J.Y.; Ao, T.Q.; Wang, X.J.; Chen, T.; Wang, B.X. Evaluating the impacts of climate change on industrial water demand by sector. Clim. Res. 2021, 84, 145–158. [Google Scholar] [CrossRef]
- Wang, X.J.; Zhang, J.Y.; Shahid, S.; Bi, S.H.; Elmahdi, A.; Liao, C.H.; Li, Y.D. Forecasting industrial water demand in Huaihe River Basin due to environmental changes. Mitig. Adapt. Strateg. Glob. Chang. 2018, 23, 469–483. [Google Scholar] [CrossRef]
- Klemeš, J.J. Industrial water recycle/reuse. Curr. Opin. Chem. Eng. 2012, 1, 238–245. [Google Scholar] [CrossRef]
- Boguniewicz-Zablocka, J.; Klosok-Bazan, I.; Naddeo, V. Water quality and resource management in the dairy industry. Environ. Sci. Pollut. Res. 2019, 26, 1208–1216. [Google Scholar] [CrossRef] [Green Version]
- Gao, J.J.; Zhao, P.; Zhang, H.W.; Mao, G.Z.; Wang, Y. Operational Water Withdrawal and Consumption Factors for Electricity Generation Technology in China-A Literature Review. Sustainability 2018, 10, 1181. [Google Scholar] [CrossRef] [Green Version]
- Chen, K.; Sun, F.Z.; Zhang, L.; Chen, X.H.; Zhang, X.Y. A sensitivity-coefficients method for predicting thermal performance of natural draft wet cooling towers under crosswinds. Appl. Therm. Eng. 2022, 206, 118105. [Google Scholar] [CrossRef]
- Gao, X.; Zhang, C.; Wei, J.; Yu, B. Numerical simulation of heat transfer performance of an air-cooled steam condenser in a thermal power plant. Heat Mass Transf. 2009, 45, 1423–1433. [Google Scholar] [CrossRef]
- Xia, L.; Li, J.S.; Ma, W.; Gurgenci, H.; Guan, Z.Q.; Wang, P. Water Consumption Comparison Between a Natural Draft Wet Cooling Tower and a Natural Draft Hybrid Cooling TowerAn Annual Simulation for Luoyang Conditions. Heat Transf. Eng. 2017, 38, 1034–1043. [Google Scholar] [CrossRef]
- Yuan, W.; Sun, F.Z.; Chen, X.H.; Liu, R.Q. Effect of Thermal Load on Evaporation Loss of Natural Draft Counter-Flow Wet Cooling Towers. J. Therm. Sci. Eng. Appl. 2020, 12, 051019. [Google Scholar] [CrossRef]
- Wan, D.; Gao, S.; Liu, M.; Li, S.; Zhao, Y. Effect of cooling water salinity on the cooling performance of natural draft wet cooling tower. Int. J. Heat Mass Transf. 2020, 161, 120257. [Google Scholar] [CrossRef]
- Guo, Q.J.; Qi, X.N.; Sun, P.; Guo, P.J. New explicit analytical solutions of equations for heat and mass transfer in a cooling tower energy system. Adv. Mech. Eng. 2019, 11, 1687814019896147. [Google Scholar] [CrossRef] [Green Version]
- Yuan, W.; Sun, F.Z.; Liu, R.Q.; Chen, X.H.; Li, Y. Effect of change factors on evaporation loss based on cold end system in natural draft counter-flow wet cooling towers. J. Therm. Sci. Technol. 2021, 16, JTST0015. [Google Scholar] [CrossRef]
- Wang, J.S.; Xue, K.; Zhang, G.L.; Chen, W.X.; Li, G.; Zhang, J.T.; Zhang, G.Z. Development and assessment of a novel air/water hybrid cooling system coupling two units for energy and water saving. Sustain. Energy Technol. Assess. 2022, 52, 102330. [Google Scholar]
- Milosavljevic, N.; Heikkilä, P. A comprehensive approach to cooling tower design. Appl. Therm. Eng. 2001, 21, 899–915. [Google Scholar] [CrossRef]
- Zhao, C.L.; Wang, M.W.; Gao, Q.; Cheng, S.; He, S.Y.; Zhao, J.F.; Zhan, J.W.; Liu, Z.L.; Geng, Z.; Zhang, S.Z.; et al. Investigation on the cooling performance of mechanical draft dry-wet hybrid cooling tower. Appl. Therm. Eng. 2023, 228, 120473. [Google Scholar] [CrossRef]
- Pospolita, J.; Kuczuk, A.; Widera, K.; Buryn, Z.; Cholewa, R.; Drajczyk, A.; Pietrucha, M.; Smejda, R. Water Losses in the Condenser Cooling System at the 905 MWe Power Unit. Energies 2022, 15, 5969. [Google Scholar] [CrossRef]
- Miao, J.; He, S.; Lu, Y.; Wu, Y.; Wu, X.; Zhang, G.; Gao, M.; Geng, Z.; Zhang, S. Comparison on cooling performance of pre-cooled natural draft dry cooling towers using nozzles spray and wet medium. Case Stud. Therm. Eng. 2021, 27, 101274. [Google Scholar] [CrossRef]
- Chen, G.; Fang, X. Accuracy of Hourly Water Temperatures in Rivers Calculated from Air Temperatures. Water 2015, 7, 1068–1087. [Google Scholar] [CrossRef] [Green Version]
- Cordoba, P. Status of Flue Gas Desulphurisation (FGD) systems from coal-fired power plants: Overview of the physic-chemical control processes of wet limestone FGDs. Fuel 2015, 144, 274–286. [Google Scholar] [CrossRef]
- Hou, H.; Xie, B.; Cheng, Y. Analysis of Carbon Emissions and Emission Reduction from Coal-Fired Power Plants Based on Dual Carbon Targets. Sustainability 2023, 15, 7369. [Google Scholar] [CrossRef]
- Miliauskas, G.; Puida, E.; Poškas, R.; Poškas, P. The Influence of Droplet Dispersity on Droplet Vaporization in the High-Temperature Wet Gas Flow in the Case of Combined Heating. Sustainability 2021, 13, 3833. [Google Scholar] [CrossRef]
- Tebaldi, C.; Debeire, K.; Eyring, V.; Fischer, E.; Fyfe, J.; Friedlingstein, P.; Knutti, R.; Lowe, J.; O’Neill, B.; Sanderson, B.; et al. Climate model projections from the Scenario Model Intercomparison Project (ScenarioMIP) of CMIP6. Earth Syst. Dyn. 2021, 12, 253–293. [Google Scholar] [CrossRef]
- Wu, T.; Yu, R.; Lu, Y.; Jie, W.; Fang, Y.; Zhang, J.; Zhang, L.; Xin, X.; Li, L.; Wang, Z.; et al. BCC-CSM2-HR: A high-resolution version of the Beijing Climate Center Climate System Model. Geosci. Model Dev. 2021, 14, 2977–3006. [Google Scholar] [CrossRef]
- Wu, T.W.; Lu, Y.X.; Fang, Y.J.; Xin, X.G.; Li, L.; Li, W.P.; Jie, W.H.; Zhang, J.; Liu, Y.M.; Zhang, L.; et al. The Beijing Climate Center Climate System Model (BCC-CSM): The main progress from CMIP5 to CMIP6. Geosci. Model Dev. 2019, 12, 1573–1600. [Google Scholar] [CrossRef] [Green Version]
- Teutschbein, C.; Seibert, J. Bias correction of regional climate model simulations for hydrological climate-change impact studies: Review and evaluation of different methods. J. Hydrol. 2012, 456, 12–29. [Google Scholar] [CrossRef]
- Zhang, K.; Wu, L.F. Using Fractional Order Grey Seasonal Model to Predict the Power Generation in China. Environ. Process. Int. J. 2021, 8, 413–427. [Google Scholar] [CrossRef]
- Yu, Y.; Si, X.; Hu, C.; Zhang, J. A Review of Recurrent Neural Networks: LSTM Cells and Network Architectures. Neural Comput. 2019, 31, 1235–1270. [Google Scholar] [CrossRef] [PubMed]
- Ahi, Y.; Dilcan, C.C.; Koksal, D.D.; Gultas, H.T. Reservoir Evaporation Forecasting Based on Climate Change Scenarios Using Artificial Neural Network Model. Water Resour. Manag. 2023, 37, 2607–2624. [Google Scholar] [CrossRef]
- Kayhomayoon, Z.; Naghizadeh, F.; Malekpoor, M.; Azar, N.A.; Ball, J.; Milan, S.G. Prediction of evaporation from dam reservoirs under climate change using soft computing techniques. Environ. Sci. Pollut. Res. 2022, 30, 27912–27935. [Google Scholar] [CrossRef]
- Zhao, X.; Ma, X.W.; Chen, B.Y.; Shang, Y.P.; Song, M.L. Challenges toward carbon neutrality in China: Strategies and countermeasures. Resour. Conserv. Recycl. 2022, 176, 105959. [Google Scholar] [CrossRef]
- Wang, B. Low-carbon transformation planning of China’s power energy system under the goal of carbon neutrality. Environ. Sci. Pollut. Res. 2023, 30, 44367–44377. [Google Scholar] [CrossRef] [PubMed]
- Guo, X.P.; Fu, Y.H.; Ren, D.F.; Zhang, X.Y. Dynamic changes in provincial exhaust emissions in China in the carbon peak and neutrality setting: Based on the effects of energy consumption and economic growth. Environ. Sci. Pollut. Res. 2023, 30, 5161–5177. [Google Scholar] [CrossRef] [PubMed]
Figure 1.
Geographical location map of the study area.

Figure 2.
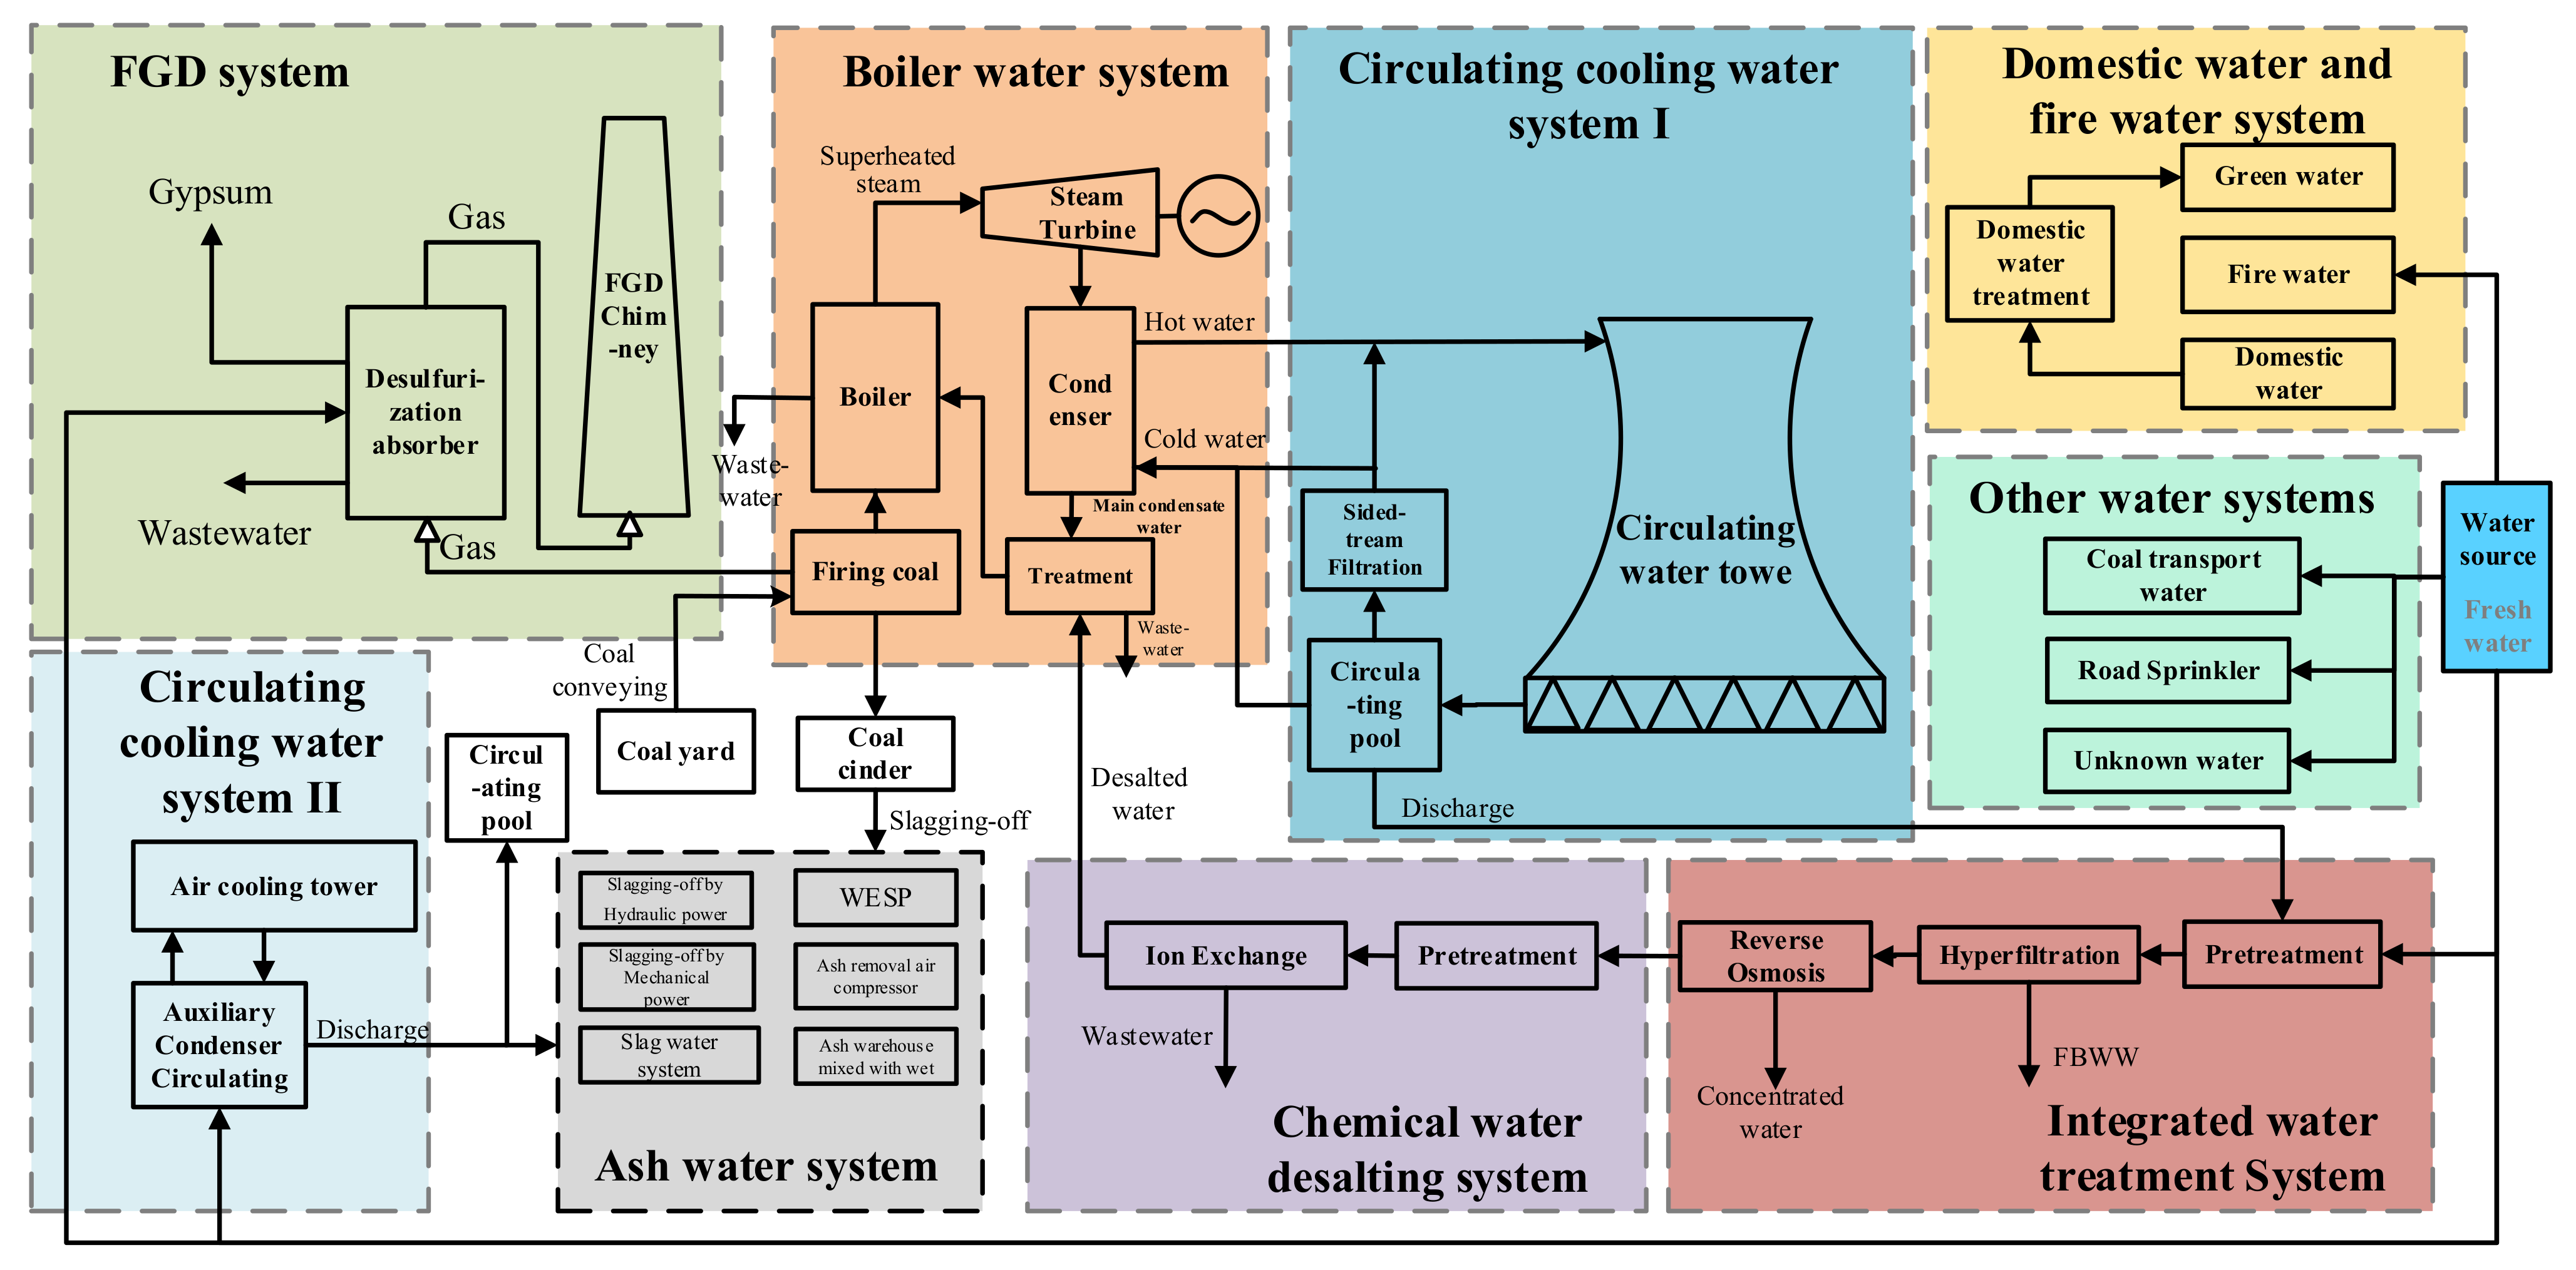
Water usage process in the study area. Freshwater is first treated through a comprehensive water treatment system consisting of physical ultrafiltration and reverse osmosis, followed by process of chemical treatment involving pretreatment and ion exchange beds. The treated water is then supplied to the boiler water system. After undergoing further treatment, it becomes the circulating water that participates in the steam cycle of the power generation process. Cooling water systems 1 and 2 are responsible for cooling the exhausted steam from the respective units to enhance the efficiency of the Rankine cycle. The flue gas from the boiler combustion and the ash residue are handled by the FGD system and ash water system, respectively. Furthermore, domestic and fire water, as well as other water uses, are sourced from fresh water and are relatively independent.
Figure 2.
Water usage process in the study area. Freshwater is first treated through a comprehensive water treatment system consisting of physical ultrafiltration and reverse osmosis, followed by process of chemical treatment involving pretreatment and ion exchange beds. The treated water is then supplied to the boiler water system. After undergoing further treatment, it becomes the circulating water that participates in the steam cycle of the power generation process. Cooling water systems 1 and 2 are responsible for cooling the exhausted steam from the respective units to enhance the efficiency of the Rankine cycle. The flue gas from the boiler combustion and the ash residue are handled by the FGD system and ash water system, respectively. Furthermore, domestic and fire water, as well as other water uses, are sourced from fresh water and are relatively independent.

Figure 3.
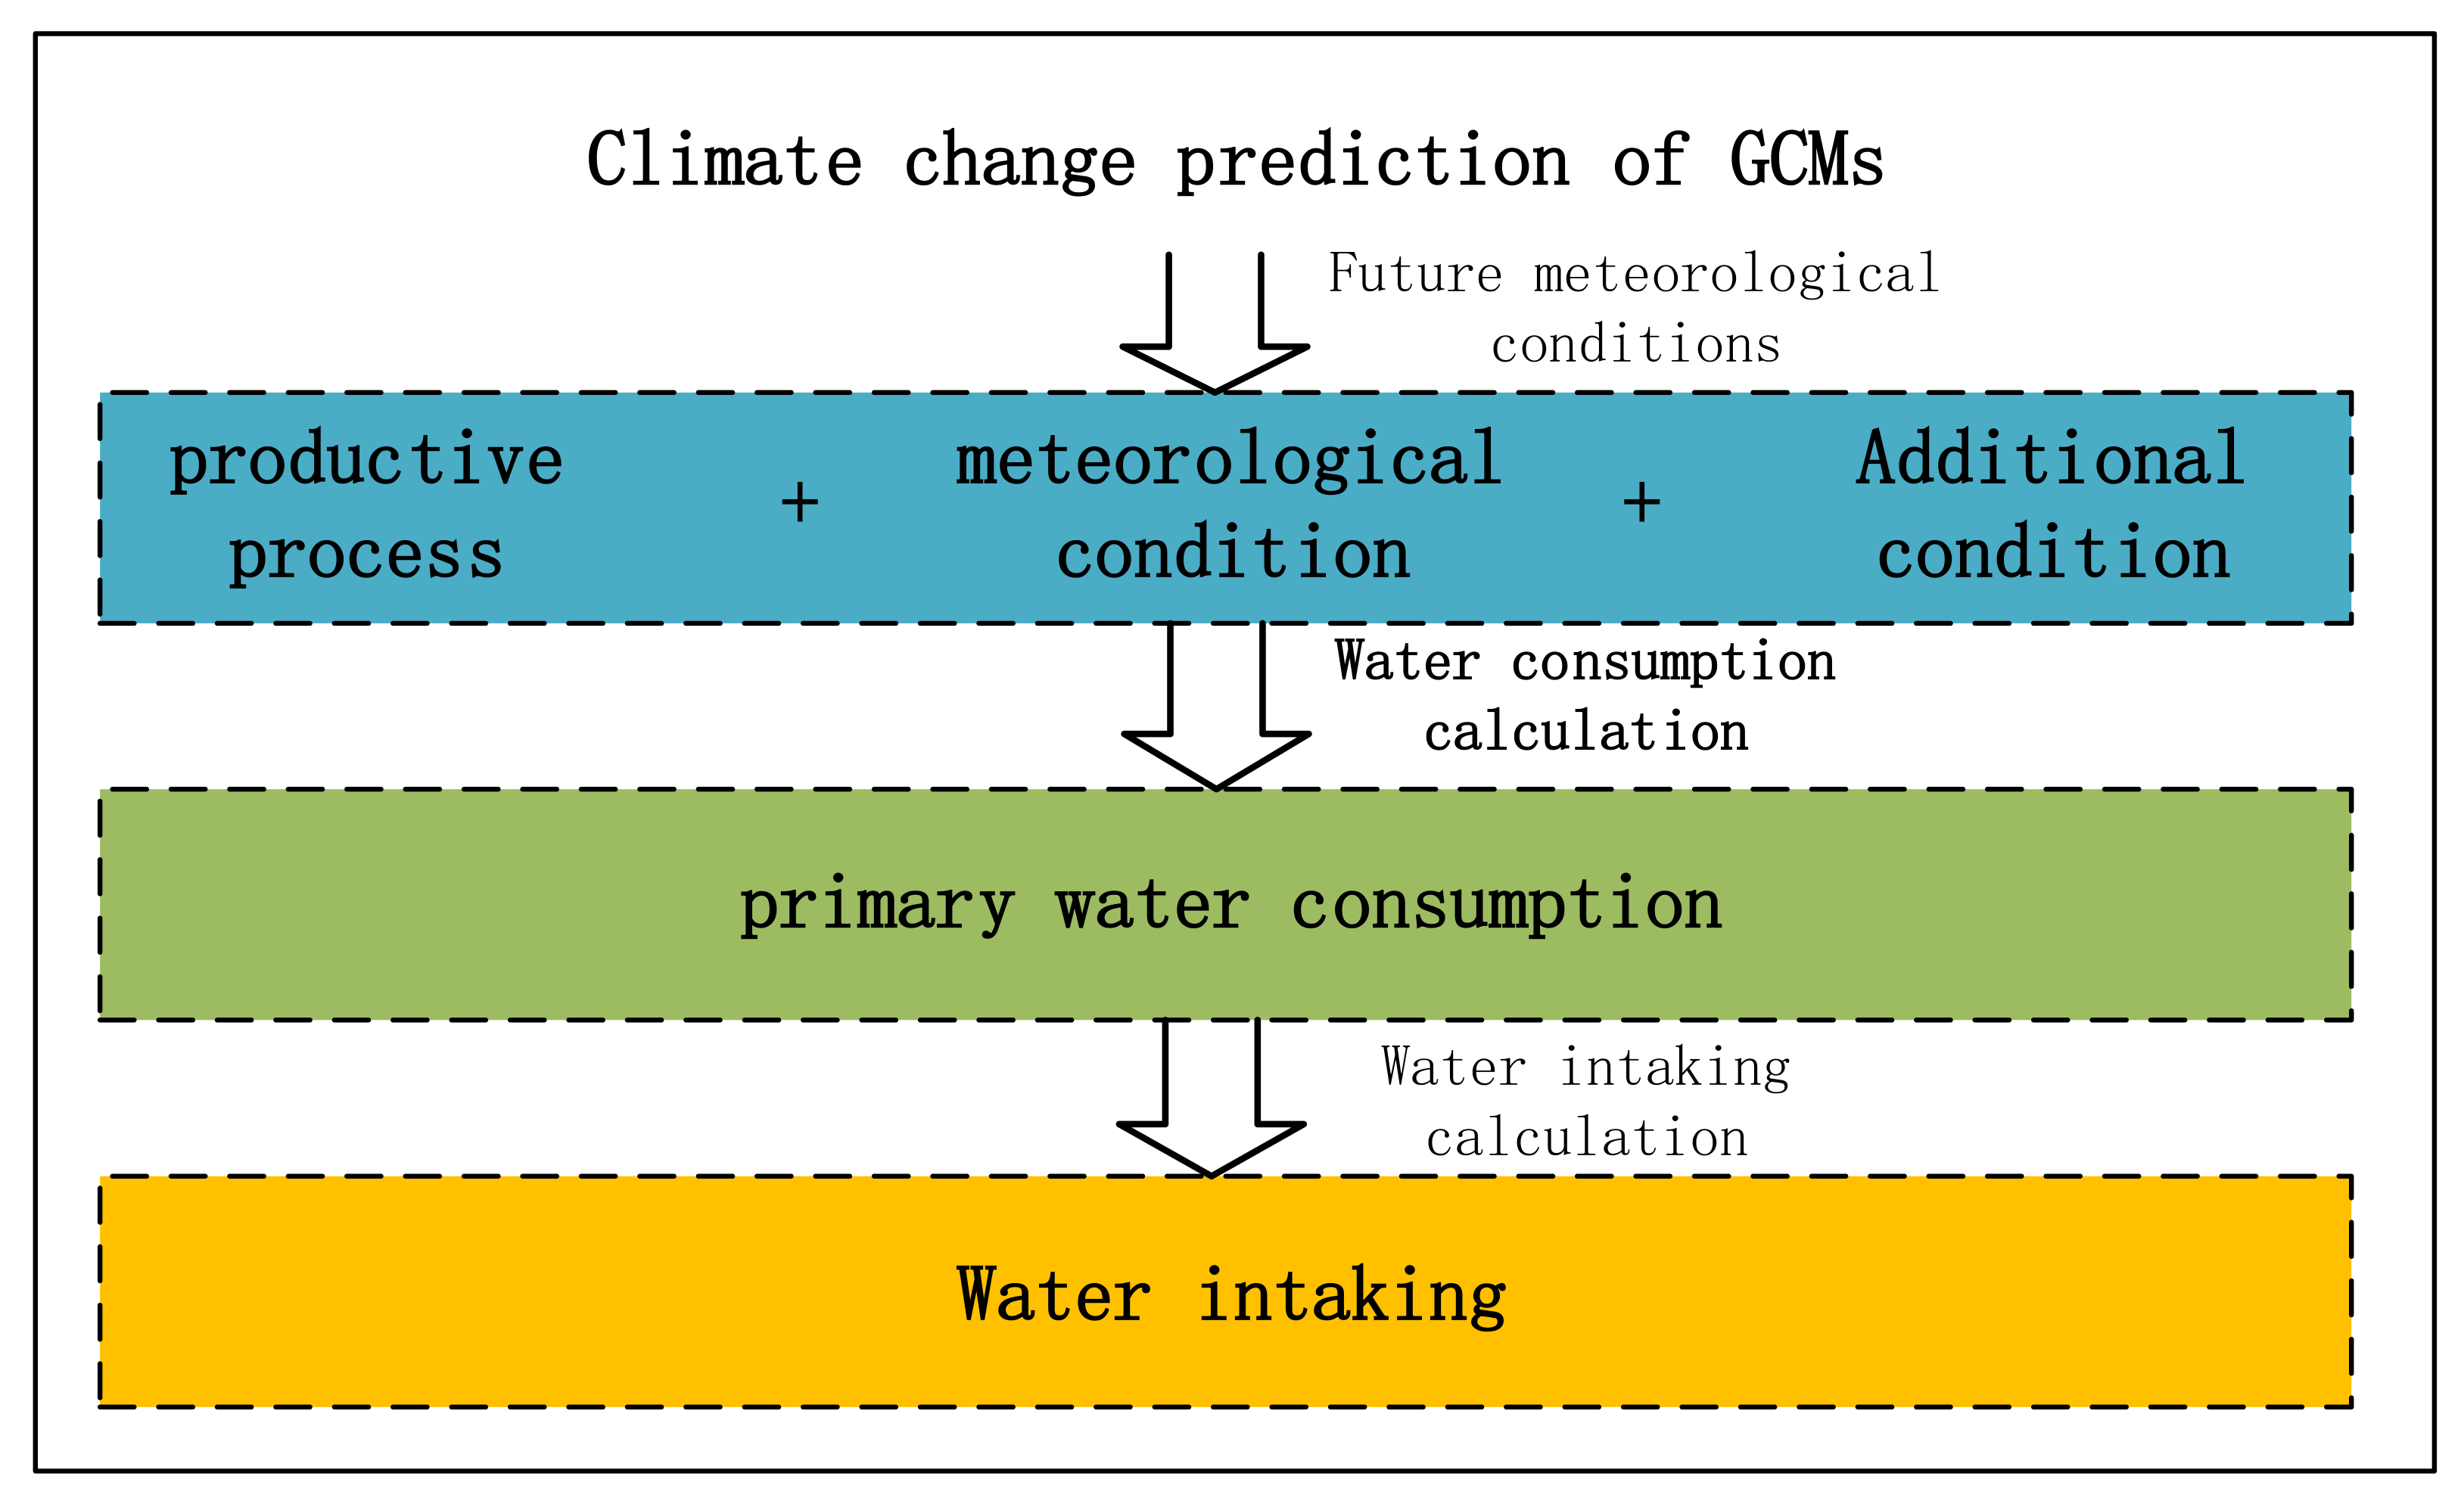
Climate change impact assessment framework for industrial enterprises. The future climate predictions obtained from Global Climate Models (GCMs) are used in conjunction with current production processes and other external conditions to calculate the primary water consumption. The calculation model can be a physical model or a correlation-based model. Subsequently, the calculated results of primary water consumption are utilized to estimate the actual water intake, which is typically performed using a correlation-based model.
Figure 3.
Climate change impact assessment framework for industrial enterprises. The future climate predictions obtained from Global Climate Models (GCMs) are used in conjunction with current production processes and other external conditions to calculate the primary water consumption. The calculation model can be a physical model or a correlation-based model. Subsequently, the calculated results of primary water consumption are utilized to estimate the actual water intake, which is typically performed using a correlation-based model.

Figure 4.
Cooling and evaporation process of cooling tower. The cooling water flow from the cooling water pool pump into the condenser, where it cools down the low-pressure steam from the steam turbine and becomes heated water. The heated water then enters the cooling tower, where it is further cooled before returning to the cooling water pool.

Figure 5.
Evaporation calculation model for the open-loop cooling tower. Hot water is sprayed from the top into the cooling tower, where it comes into contact with the upward-moving air influenced by the draft created by the tower. Heat is transferred from the water to the air via this contact. As the air flows and interacts with the water, the temperature, humidity, and density of the air gradually change from the inlet to the outlet of the tower. It reaches a state of equilibrium where the draft force and resistance at the outlet are balanced, and the cooling process achieves the designed cooling efficiency of the tower.

Figure 6.
Comparison of temperature and humidity trends with historical data.

Figure 7.
Annual primary evaporation trend results. The annual variation trends of primary water consumption for SSP1–2.6 to 5–8.5 scenarios are −0.0005, −0.00166, −0.0028, and −0.00355 t/(h × day), respectively.
Figure 7.
Annual primary evaporation trend results. The annual variation trends of primary water consumption for SSP1–2.6 to 5–8.5 scenarios are −0.0005, −0.00166, −0.0028, and −0.00355 t/(h × day), respectively.

Figure 8.
Primary water consumption processes during the several years. Under the SSP1–2.6 to 5–8.5 scenarios, the daily average water consumption follows a trend of higher consumption in spring and winter and lower consumption in summer and autumn. The SSP1–2.6 scenario has the highest annual average water consumption, while the 5–8.5 scenario has the lowest. However, the intensity of water consumption process variation is opposite in these scenarios.

Figure 9.
Observation vs. model comparison plot. The model fits the trend of water intake well, but it exhibits significant deviations in extreme values, particularly in predicting the extreme water intake during the period from June to September 2021.
Figure 9.
Observation vs. model comparison plot. The model fits the trend of water intake well, but it exhibits significant deviations in extreme values, particularly in predicting the extreme water intake during the period from June to September 2021.

Figure 10.
Annual water intake results. Supplementary statement: the annual variation trends of water intake for SSP1–2.6 to 5–8.5 scenarios are 0.0006, 0.00176, 0.00289, and 0.00317 t/(h·day), respectively.
Figure 10.
Annual water intake results. Supplementary statement: the annual variation trends of water intake for SSP1–2.6 to 5–8.5 scenarios are 0.0006, 0.00176, 0.00289, and 0.00317 t/(h·day), respectively.

Figure 11.
Annual other water consumption trend results.


Table 1.
Parameters of 350 MW open-loop cooling tower.
| Parameter | Value | |
| Property parameter | Tower height (m) | 105 |
| Air intake height (m) | 7.8 | |
| Distance from bottom of packing to top of sprinkler (m) | 10.9 | |
| Distance from sprinkler to tower top outlet (m) | 103.75 | |
| Average diameter of tower air inlet (m) | 79.69 | |
| Average diameter of tower outlet (m) | 47.024 | |
| water distribution media surface area (m2) | 4500 | |
| Resistance parameter | ||
| Thermal parameter | ||
| Variable parameter | circulation water flow rate (m3/h) | Tower #1: 42,500, Tower #2: 42,500, Tower #3: 40,000, Tower #4: 41,000, Tower #5: 41,500, Tower #6: 40,500 |
Note: q is the water distribution density.
Table 2.
Calculation parameters of desulfurization water consumption.
| Parameter | Value |
| thermal efficiency | 0.4 |
| unit quantity of coal flue gas | 6 m3/kg |
| sulfur content percentage in coal | 1.7% |
| inlet flue gas humidity | 20% |
| desulfurization efficiency | 99% |
Table 3.
Regression coefficient table of result and each factor. The table presents a series of factors in the columns and a series of predicted results for four SSPs-RCPs scenarios in the rows. The values in the table represent the correlation coefficient between the row and column series.
Table 3.
Regression coefficient table of result and each factor. The table presents a series of factors in the columns and a series of predicted results for four SSPs-RCPs scenarios in the rows. The values in the table represent the correlation coefficient between the row and column series.
| Coeff | Generating Load | Water Consumption | Air Temperature | Relative Humidity |
| SSP1–2.6 | 0.7271 | 0.3885 | −0.0094 | −0.0088 |
| SSP2–4.5 | 0.7418 | 0.3042 | −0.0074 | −0.0043 |
| SSP3–7.0 | 0.7293 | 0.3075 | 0.0031 | −0.0073 |
| SSP5–8.5 | 0.7158 | 0.3133 | −0.0015 | −0.0035 |
Note: All values are daily mean values.
Disclaimer/Publisher’s Note: The statements, opinions and data contained in all publications are solely those of the individual author(s) and contributor(s) and not of MDPI and/or the editor(s). MDPI and/or the editor(s) disclaim responsibility for any injury to people or property resulting from any ideas, methods, instructions or products referred to in the content. |
© 2023 by the authors. Licensee MDPI, Basel, Switzerland. This article is an open access article distributed under the terms and conditions of the Creative Commons Attribution (CC BY) license (https://creativecommons.org/licenses/by/4.0/).
Share and Cite
MDPI and ACS Style
Liu, J.; Zhou, Y.; Chen, L.; Wang, L. Assessing the Impact of Climate Change on Water Usage in Typical Industrial Enterprises. Sustainability 2023, 15, 10141. https://doi.org/10.3390/su151310141
AMA Style
Liu J, Zhou Y, Chen L, Wang L. Assessing the Impact of Climate Change on Water Usage in Typical Industrial Enterprises. Sustainability. 2023; 15(13):10141. https://doi.org/10.3390/su151310141
Chicago/Turabian StyleLiu, Jun, Yuyan Zhou, Lihua Chen, and Lichuan Wang. 2023. "Assessing the Impact of Climate Change on Water Usage in Typical Industrial Enterprises" Sustainability 15, no. 13: 10141. https://doi.org/10.3390/su151310141
Note that from the first issue of 2016, this journal uses article numbers instead of page numbers. See further details here.