
Analysis of Carbon Emissions and Emission Reduction from Coal-Fired Power Plants Based on Dual Carbon Targets
MBA Education Center, School of Business, Henan University of Science and Technology, Luoyang 471000, China
*
Author to whom correspondence should be addressed.
Sustainability 2023, 15(9), 7369; https://doi.org/10.3390/su15097369
Submission received: 13 March 2023
/
Revised: 13 April 2023
/
Accepted: 23 April 2023
/
Published: 28 April 2023
(This article belongs to the Special Issue Green Technology and Related Macro-Policy Regulation for Soil Remediation, Water Treatment, and CO2 Abatement)
Abstract
:The emission of greenhouse gases poses enormous pressure on current carbon emissions and carbon reduction. Accurate quantification of carbon emissions from coal-fired power plants is of great significance for achieving the dual carbon goal. To enable enterprises to better understand their carbon emissions, this study constructs a carbon emission model and carbon emission data accounting model for coal-fired power plants. Case data calculations and a carbon emission reduction analysis were conducted. The experiment showcases that the carbon sensitivity of the inner side of the boiler under control conditions is higher than that of the operating parameters controlled on the inner side of the steam turbine, with a maximum total value of 16.67 g/MJ; the annual average low calorific value of coal remains between 16,000 kJ/kg; the activity level of coal remains between 30,000 TJ; and the oxidation probability of coal char during combustion fluctuates, with a maximum of 99.8%. In the calculation of coal-fired carbon emissions, the fitting difference between the emissions of generator unit 1 and generator unit 2 is maintained within 2%. Overall, the CO2 emissions of power plants involved in the study are generally high. The model built through this study has well analyzed the carbon emissions of power plants. It is of great significance for the actual carbon emission reduction of coal-fired power plants.
1. Introduction
“Double carbon” is the abbreviation of carbon peak and carbon neutral synthesis. In 2020, China explicitly proposed to achieve the dual carbon goal, that is, by 2025, the proportion of non-mineral energy consumption will be increased to 20%; the energy consumption per unit of gross domestic product (GDP) will be reduced by 13.5%; and the CO2 emission per unit of GDP will be reduced by 18%. By 2030, the proportion of non-mineral energy consumption will be 25% and the CO2 emission per unit of GDP will be reduced by 65% [1]. The “dual carbon” strategy advocates a green and low-carbon lifestyle, and accelerating emission reduction is an important measure to promote green technology innovation and enhance the international competitiveness of industry and economy [2,3]. Therefore, implementing reasonable carbon reduction methods under the dual carbon goals has become particularly important. An Y et al. [4] built a carbon emission reduction calculation model on the basis of data envelopment analysis for carbon emission potential and other related issues. Xue X et al. proposed technologies related to biomass hybrid combustion and CO2 capture and collection to achieve zero carbon emissions [5]. Cabernard L et al. [6] analyzed plastic production in countries around the world in recent years to reduce the burning of plastics in coal combustion [6]. In this context, this study constructs a calculation model and data accounting model for carbon emissions from a power plant. This is to enhance the knowledge base on carbon emissions and thus implement effective carbon reduction methods.
2. Literature Review
China is promoting the restructuring of industry and energy under the double carbon target, developing renewable energy. This is to achieve the harmonization of economic development and green transformation [7,8,9]. As the global climate is becoming persistently warmer, carbon emission reduction is becoming a significant measure to alleviate the human climate crisis [10,11,12]. Based on this, many scholars have studied this in detail. Cui et al. [13] compared carbon reduction measures in the US and China to provide an effective database for the implementation of carbon reduction. After analyzing policy interventions in the economic development of Hubei Province, Wu et al. [14] used a regression intermittency design for causal inference. This is to develop an effective carbon reduction strategy. Jiang et al. [15], through input–output analysis and energy consumption, construct a decomposition model to reduce China’s carbon emissions. Jia [16] analyzes the innovation mechanism of the dual carbon target based on relevant issues. That research provides assistance for the construction of response mechanisms in the overall development of the dual carbon target. Gao et al. [17] studied the energy equipment of a national industrial zone in a northern province. Aiming at the energy pollution problem in industrial parks, the study effectively cut down the carbon dioxide emissions from the energy infrastructure.
In addition, Yang et al. [18] analyzed the haze data of 31 provinces in China for the past 7 years. Their research proposes an effective strategy for decreasing pollution emissions in response to the current haze pollution problem. Ryabov [19] analyzed the biomass data in the face of social sustainability goals to propose a pre-treatment technology for the co-burning of coal carbon and biomass. The research provides assistance for carbon reduction. Booth M S [20] has proposed measures related to energy transfer to address the issue of countries around the world being overly reliant on Russian oil, providing recommendations for upper-level policies to implement carbon reduction. Designed to reduce energy loss, Yang et al. [21] analyzed carbon emissions in six regions of China by using data statistics methods. Their research provides constructive suggestions for implementing differentiated carbon emission reductions. Li et al. [22] developed a basic structure for a step-down model using first principles to help capture post-emission CO2.
This study fully draws on previous studies and considers the principles of operational parameter controllability and the actual conditions of carbon accounting. It also analyzes the carbon emissions of a coal-fired power plant and constructs a data calculation model based on this. Through analysis of parameter sensitivity of carbon emissions, it provides support for proposing carbon-emission-related policies.
3. Carbon Emission Calculation Model Construction for Coal-Fired Power Plants
3.1. Calculation of Sensitivity Analysis of Carbon Emission Parameters
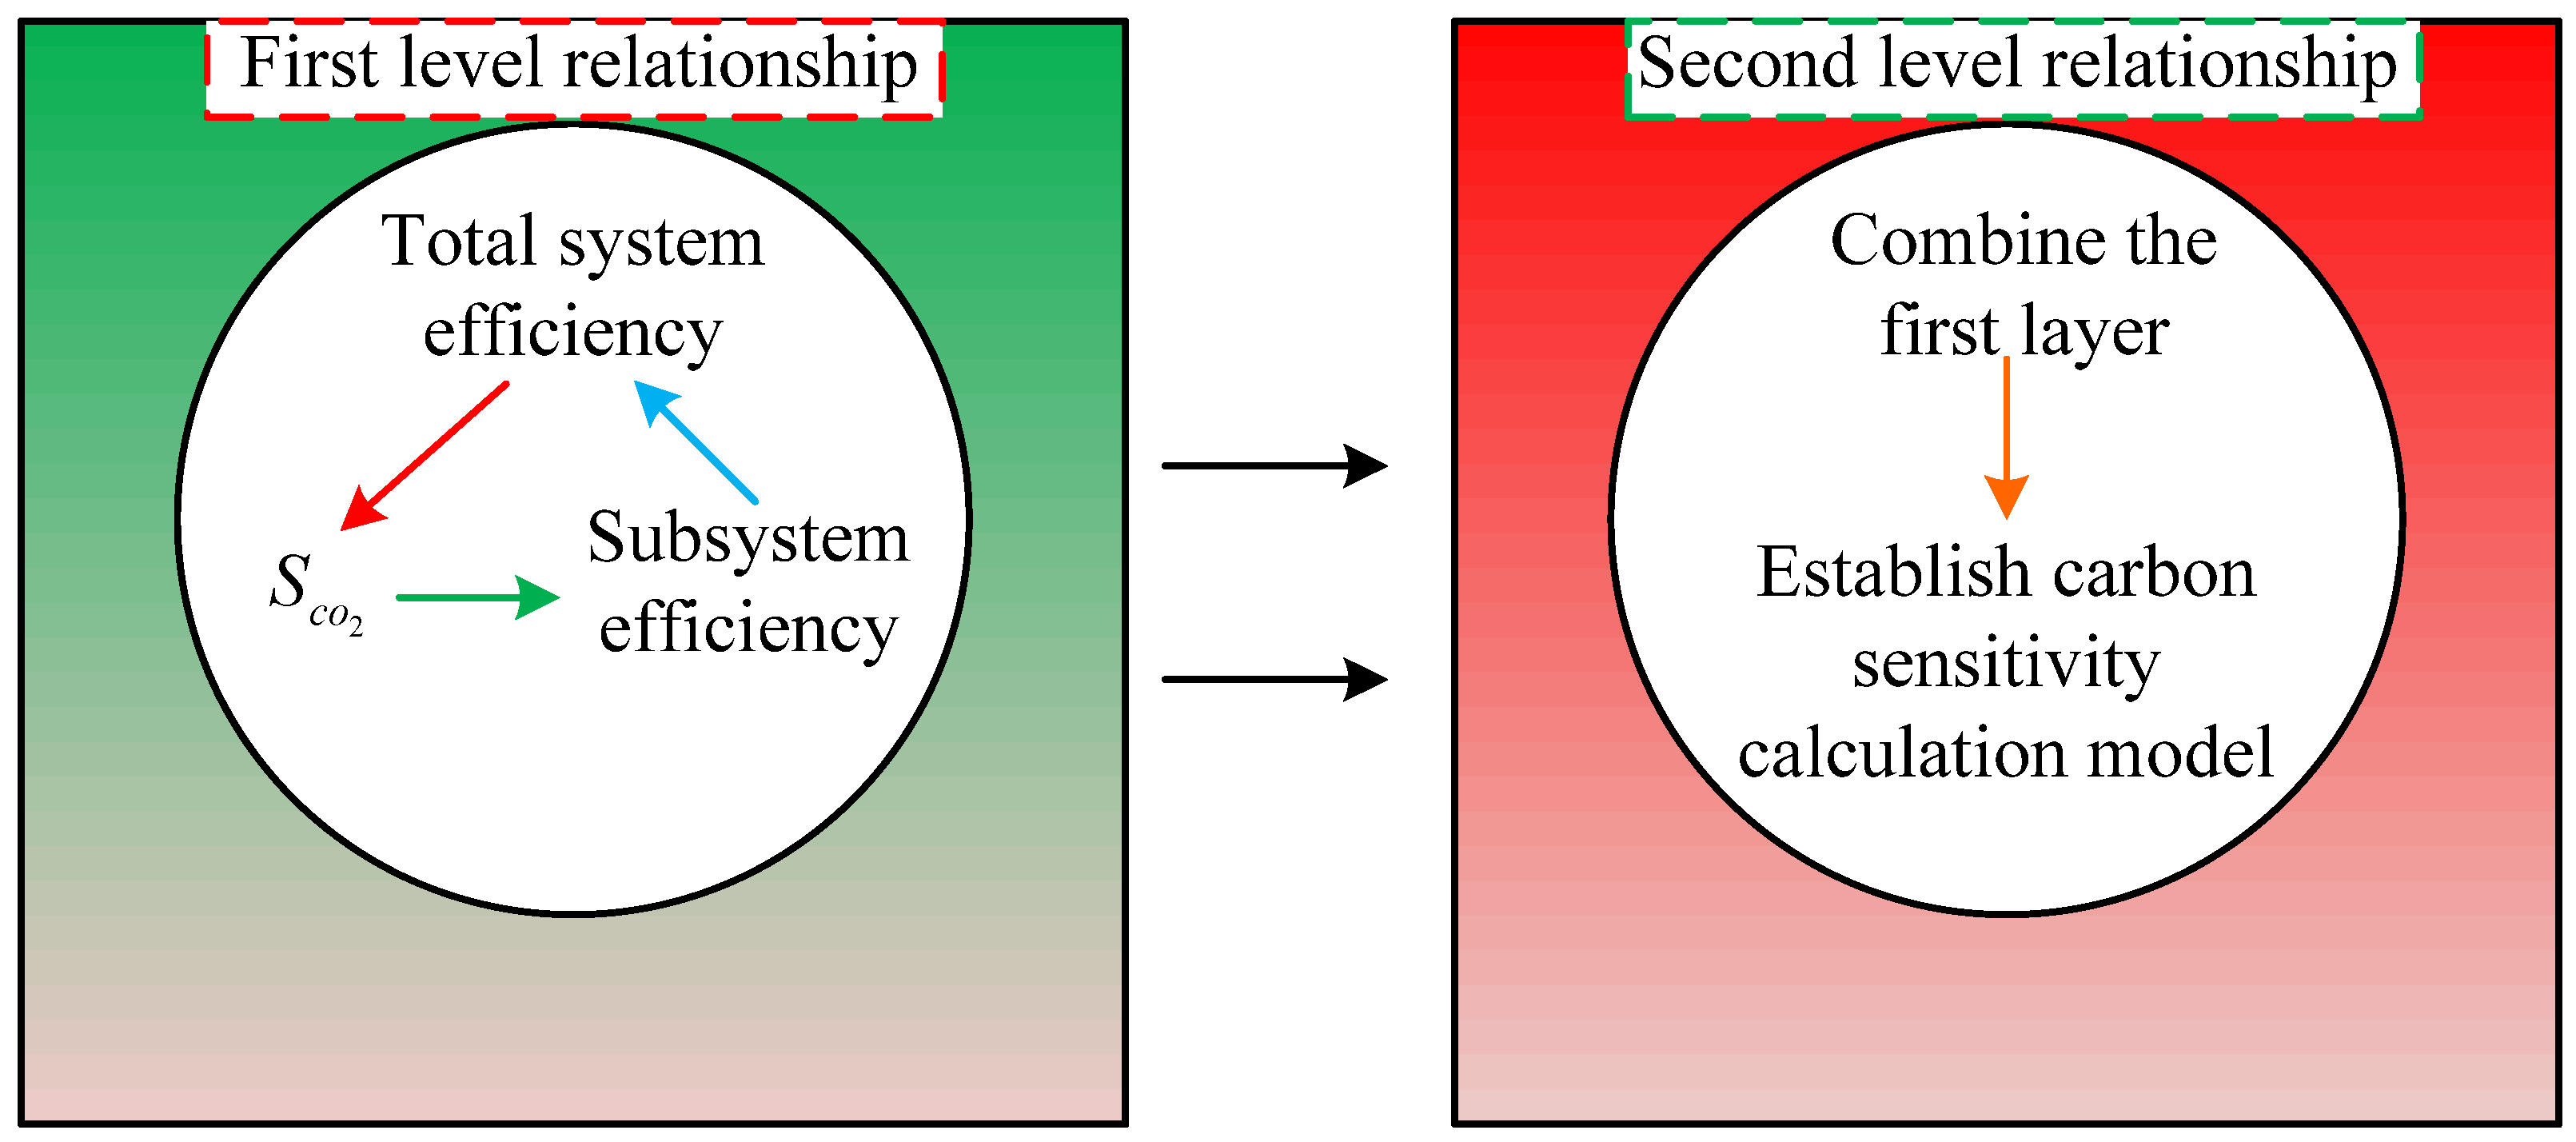
The carbon emission caused by coal power generation is the focus of carbon emission reduction [23,24,25]. Meanwhile, taking coal-fired power plants as an example, carbon and sulfur pollutants are inevitably generated during coal combustion, while the gas is mainly CO2. The main processes include coal–water conversion reaction, Fischer–Tropsch reaction, methanation reaction, and disproportionation reaction. In carbon emissions, parameters such as pressure and temperature can more or less affect the intensity of carbon emissions. Therefore, it is essential to ensure that the unit’s carbon dioxide emission rate reaches a low carbon level. Hence it is necessary to reduce the total amount of carbon emissions from coal-fired power plants and analyze the sensitivity of carbon emission intensity to changes in various parameters [26,27,28]. Carbon sensitivity refers to the sensitivity of a company’s business, assets, and strategies to carbon emissions and climate change risks. In addition, a coal-fired power generation system is formed by multiple subsystems such as boiler, pipeline, steam turbine, etc. Every subsystem has its own system effectiveness. Under different operating conditions, the effectiveness of every subsystem will convert. This results in changes in energy expenditure and carbon emission intensity of the whole system [29,30,31]. Therefore, the analysis of the sensitivity of carbon emission intensity to the changes of various parameters needs to be based on a two-layer relationship. Based on this, carbon sensitivity refers to the degree to which carbon emission intensity reacts to actual changes in various parameters. This is shown in Figure 1.
From Figure 1, when studying the sensitivity of carbon emission intensity to changes in various parameters, a two-stage relationship can be studied step-by-step. Firstly, analyze the carbon emission intensity when the overall efficiency of the system changes, and start from the efficiency changes of each subsystem to obtain the relationship between the carbon emission intensity changes of each subsystem and the relationships between each subsystem. Secondly, based on the analysis of consumption differences, the impact of working parameters and efficiency of each subsystem is studied. The difference between the two is that the former calculates the variation relationship based on efficiency, while the latter calculates the variation relationship based on specific parameters. By combining these two steps, the calculation formula between the changes in various parameters and the changes in carbon emission intensity can be obtained. The quantitative relationship between carbon emission intensity, overall efficiency of the power generation system, and efficiency of each subsystem is based on a certain quantitative relationship. Therefore, the relevant calculation of the yield of CO2 consumed per unit of standard coal is shown in Equation (1).
In Equation (1), represents the CO2 generation factor; represents the mass fraction of coal losses unit standard; and represents the carbon oxidation rate, %. Equation (1) reflects the linear relationship between carbon emission intensity and power supply coal loss, which is calculated as shown in Equation (2) [32].
In Equation (2), represents coal loss in power supply; g/(kJ); represents whole system efficiency, %; represents boiler efficiency, %; represents the piping efficiency, %; represents the outright efficiency within turbine, %; represents the mechanical related efficiency, %; represents the generator efficiency, %; and represents the plant electricity consumption, %. The calculation equation of carbon emission intensity is shown in Equation (3).
In Equation (3), represents the carbon emission intensity, Kg. When is changed and other indicators remain unchanged, the equation for calculating the amount of change in is shown in Equation (4).
In Equation (4), represents the variation of carbon emission intensity; and represents the change in efficiency compared to the overall system. The inverse relationship between and is demonstrated in Equation (4). In addition, the subsystems of the power generation system are analyzed and treated as a set of independent, linearly unrelated independent variables.
The efficiency of each subsystem increases over time and without any change in the efficiency of the other subsystems. Consequently, a mathematical correlation was applied to obtain a relationship amid the variation of efficiency of every subsystem and [33,34,35]. Furthermore, from this, a generic model between the relevant variables in each subsystem and is derived. The equation is shown in Equation (5) [36].
In Equation (5), represents the relative degree of change in the efficiency of any one subsystem. Equation (5) indicates that the variation of efficiency of the corresponding subsystem under different operating conditions is proportional to and that the absolute magnitude of reflects the carbon sensitivity of the operating parameters. Meanwhile, a positive or negative value of indicates whether a change in the operating parameters will result in a decrease or an increase in . The operating parameters of the generator set are classified as controllable or uncontrollable. Based on the correlation analysis of carbon sensitivity, a carbon sensitivity computational method will be built based on the variation of [37,38,39]. The carbon sensitivity calculation model includes boiler-side parameters, turbine-side parameters, plant power, and multiple parameters simultaneously. The carbon-sensitive model for boiler-side parameters includes flue gas temperature, flue gas content, and carbon content of fly ash, while turbine-side parameters include superheated steam pressure, temperature, and reheated steam parameters. In the smoke exhaust temperature model, if other parameters are set unchanged, the smoke exhaust temperature changes. At this time, the calculation equation of is shown in Equation (6).
In Equation (6), represents the relative change in boiler efficiency for a change in , %; represents the boiler’s own exhaust temperature; represents the volume of dry flue gas practically generated when fuel is burning, m3/kg; represents constant pressure heat capacity of the average ratio of dry flue gas, kJ/(kg·K); represents the bulk of water vapour actually produced during fuel combustion, m3/kg; represents constant pressure heat capacity of the average ratio of vapour, kJ/(kg·K); represents the boiler’s own heat input, kJ/kg; represents the total change in exhaust temperature, K; and indicates the heat loss from the exhaust smoke. When the oxygen content of exhaust gas changes and other parameters are not changed, the equation for calculating at this point is shown in Equation (7).
In Equation (7), represents the relative change in boiler efficiency for a change in , %; represents the exhaust oxygen content; represents the exhaust carbon monoxide content, %; and represents the coefficient. The equation for is shown in Equation (8).
In Equation (8), ,· and also represent coefficients; represents the theoretical air volume, m3/kg; represents the absolute humidity in the ambient air, kg/kg; and represents the supply air temperature, °C. In the fly ash carbon content model, when the carbon content of the fly ash is varied and other parameters are determined to be constant, the equation for is shown in Equation (9).
In Equation (9), represents the total carbon content of the fly ash; and represents the mass fraction of the basic ash received by the fuel, %. In a model with high vapour pressure, the other parameters remain constant as the superheated vapour pressure is changed. At this time, point is calculated as illustrated in Equation (10).
In Equation (10), represents the superheated steam pressure, %; represents the ideal value of thermal efficiency, %; represents the relative efficiency within the turbine; represents the optimum SED (specific enthalpy drop, SED) of the high-pressure cylinder itself after the variation of , kJ/kg; and represents the optimum SED of the high-pressure cylinder itself before change, kJ/kg. In the plant power model, when the internal quantity of electricity consumption in the plant is changed and other parameters are kept constant, is calculated as shown in Equation (11).
In Equation (11), represents the generating load of the generating unit itself, MW; and represents the plant power of the generating unit, MW. Finally, in the multi-parameter simultaneous change model, the equation for is shown in Equation (12).
In Equation (12), represents the amount of change associated with the intensity of coal-fired electricity supply emissions when all parameters are changed.
3.2. Carbon Emissions Data Accounting Model
Moreover, in addition to the need for a carbon-sensitive analysis, the corresponding accounting model needs to be constructed based on the appropriate accounting methods. The total emissions from the power plant are equivalent to the sum of mineral fuel burning, desulfurization process emissions, and electricity emissions after net procurement within the company boundary [40,41,42]. Therefore, the data accounting model incorporates emissions from fossil fuels, the desulphurisation process, and the use of electricity after net procurement. In the field of fossil fuel combustion emissions, research is conducted to determine the CO2 emissions of fossil fuels based on some relevant values. It is mainly according to the combustion amount of the fuel type, the actual calorific value of the lower fuel level, the carbon content in the unit calorific value, and the oxidation rate. The consumption of corporate minerals mainly includes coal combustion, auxiliary fuel, diesel for mobile equipment, and gasoline for mobile equipment. The relevant equation for their calculation is shown in Equation (13).
In Equation (13), indicates CO2 emissions from mineral fuel burning within the company boundary, m3; indicates CO2 emissions from the burning of coal fuels within the company boundary, m3; indicates CO2 emissions from the burning of auxiliary fuels within the company boundary, m3; indicates CO2 emissions from the burning of diesel fuels by mobile equipment, m3; indicates CO2 emissions from the burning of gasoline fuels by mobile equipment, m3; indicates the CO2 emitted by burning the th kind of mineral fuel within the company boundary, m3; indicates the activity of the type mineral fuel, TJ; indicates the emission factor associated with the type mineral fuel, t·TJ−1; indicates the loss of the th mineral fuel, t; indicates the average low heat content of the th mineral fuel, kJ·kg−1; indicates the carbon content of the th mineral fuel at a standard unit calorific value, t·TJ−1; and indicates the probability of carbon oxidation of the th mineral fuel, %. In coal-fired power plants, CO2 emissions need to be included by multiplying the carbon dioxide consumption method by the emission coefficient. The relevant calculation equation is shown in Equation (14).
In Equation (14), refers to the CO2 emitted during the combustion of desulfurizer within the company boundary; represents carbonate related loss in desulfurizer, t; represents the emission factor related to carbonate in the th desulfurizer, t·t−1; represents the loss of desulfurizer in a certain month of the year, t; indicates the specific content of carbonate in desulfurizer; represents the emission factor of complete conversion in the desulfurization, t·t−1; and indicates the probability of conversion, %. The CO2 emissions from the use of electricity after net procurement are obtained by multiplying the CO2 emissions from electricity by the average emission factor for electricity supply in the region’s grid. The relevant calculation equation is shown in Equation (15).
In Equation (15), represents the carbon dioxide emissions from the use of electricity after net procurement by companies; represents the total amount of electricity net procured by companies, MW·h; and represents the average emission factor of electricity supply in the region, t·MJ−1.
4. Example Data Calculation and Carbon Reduction Analysis
4.1. Sensitivity Analysis of Controllable Operating Parameters for Coal-Fired Power Supply Carbon Emissions
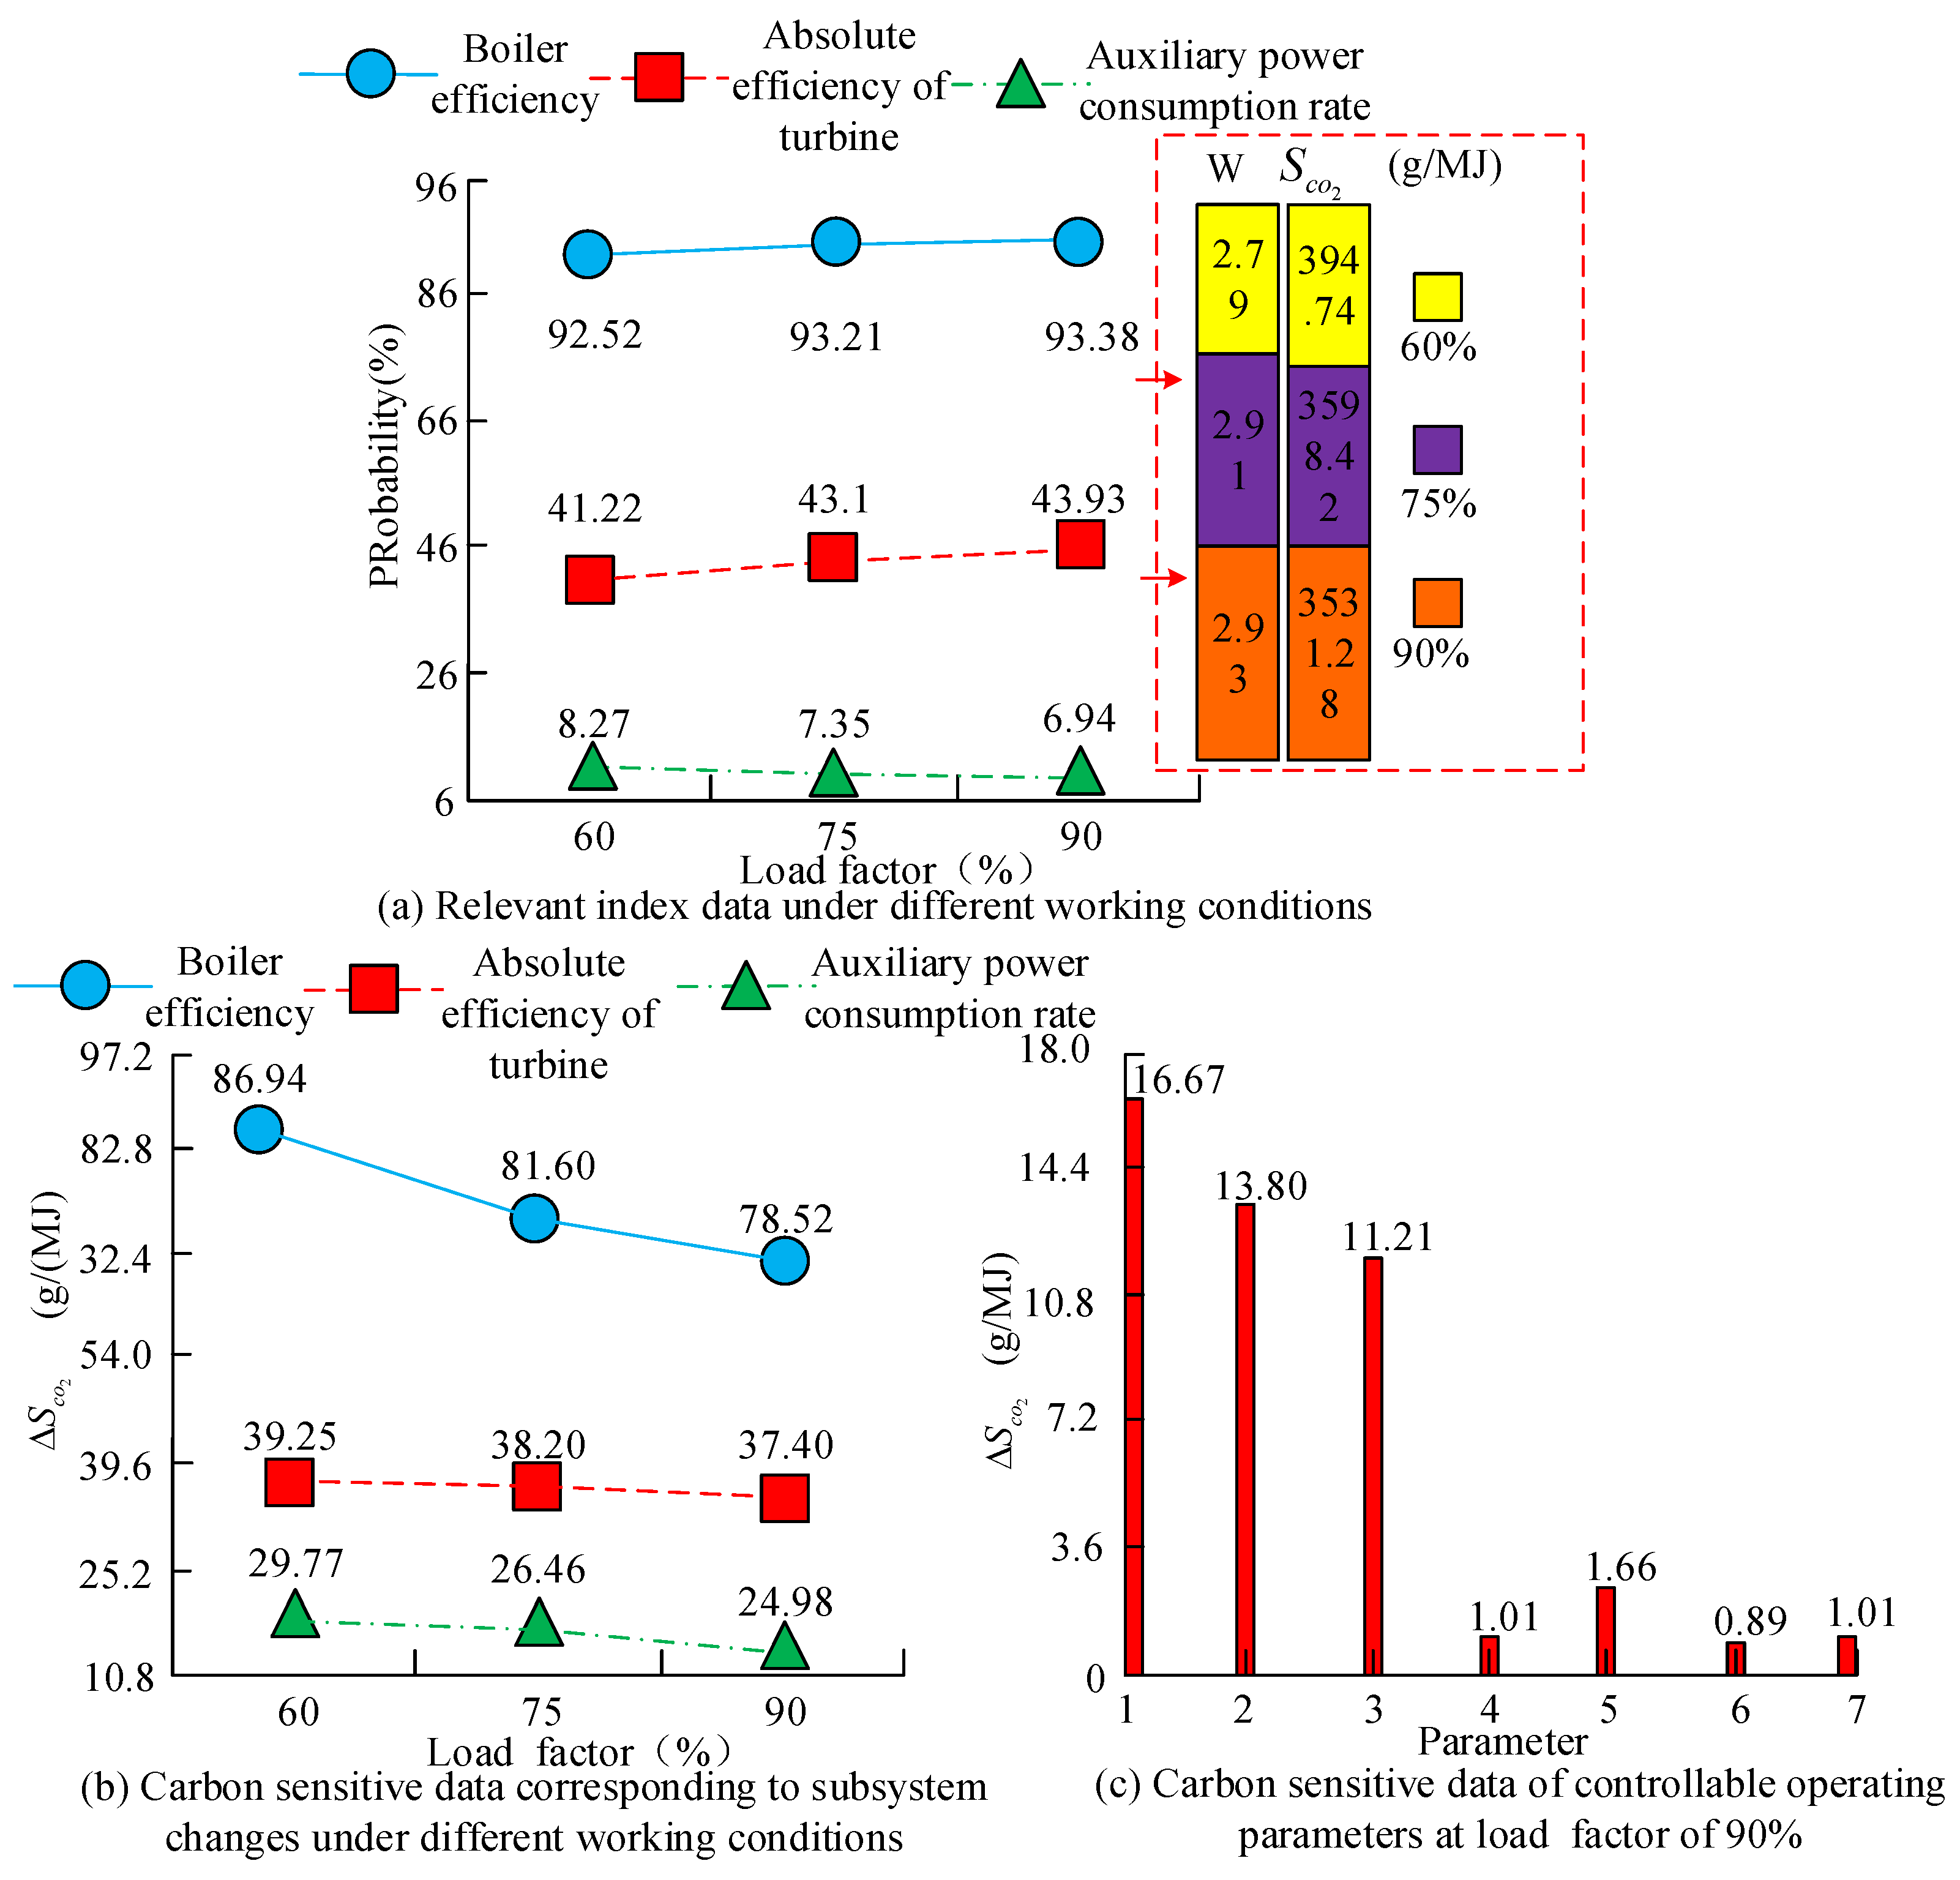
To verify the practical effect of the calculation and accounting model, this study first analyzed the parameter sensitivity of coal-fired power generation. In the experiment, the researchers took a coal-fired power plant in the Inner Mongolia Autonomous Region of China as the analysis object. The research content mainly included the CO2 emitted during the coal combustion process, the CO2 emitted during the desulfurization project, and the CO2 emitted during the power procurement and use of the plant. Meanwhile, its boiler type is a natural circulation single furnace with a capacity of 1025 t/h; the total power is 600 MW; and the emission limits for smoke, SO2, and NOx shall not exceed 5, 35, and 50 mg/m3, respectively. In addition, the research criteria mainly follow the laws and regulations related to carbon emission reduction issued by the National Development and Reform Commission. In the sensitivity analysis under controllable parameters, the carbon sensitivity calculation model constructed was applied to different load factors for analysis. Due to the consideration of practical stability and the need for realistic conditions, the study only considered three stable operating conditions: 60%, 75%, and 90% load factors. At the same time, to more clearly see the common range of changes in various controllable operating parameters in actual operation, a separate analysis was conducted on the 90% load factor. The results are demonstrated in Figure 2.
Figure 2a shows the carbon sensitivity data corresponding to the changes in subsystem indicators under various operating conditions; Figure 2b shows the carbon sensitivity data of controllable operating parameters on the boiler side under various operating conditions, while Figure 2c shows the carbon sensitivity data of controllable operating parameters at 90% load factor. In Figure 2c, the horizontal axis numbers 1 to 7, respectively, represent the degree of decline in exhaust gas temperature—10 K; the degree of decrease in exhaust smoke oxygen content—1%; the degree of decrease in carbon content in fly ash—1%; the degree of increase in temperature during steam superheat—1 K; the degree of increase in pressure during steam superheat—0.1 MPa; the degree of increase in temperature during steam reheat—1 K; and the degree of increase in pressure during steam reheat—0.1 MPa, respectively. Figure 2a indicates that as the load on the generating unit raises the function efficiency of the unit, the absolute efficiency within the unit increases. The power consumption of the power plant reduces. In addition, for every 1% increase in load factor, the value of will decrease by 4.644 g/MJ evenly. Figure 2b illustrates that the sensitivity of to boiler efficiency, outright turbine efficiency, and power consumption reduces as the load factor increases. For every 1 MW reduction in plant power consumption at 60% load factor, decreases by 29.77 g/MJ. Figure 2a,b comprehensively demonstrate that factory electricity has higher carbon sensitivity under low operating conditions.
From Figure 2c, the carbon sensitivity of the parameters increases as the value of increases. In the practical operation, the carbon sensitivity of the controllable operating parameters at the boiler side is higher than that of the turbine-side control operating parameters within the variation range of each control operating parameter. Among the boiler-side parameters, changes in flue gas temperature have the greatest effect on ; among the turbine-side parameters, the carbon sensitivity of the superheated steam parameters is higher than that of the reheated steam parameters.
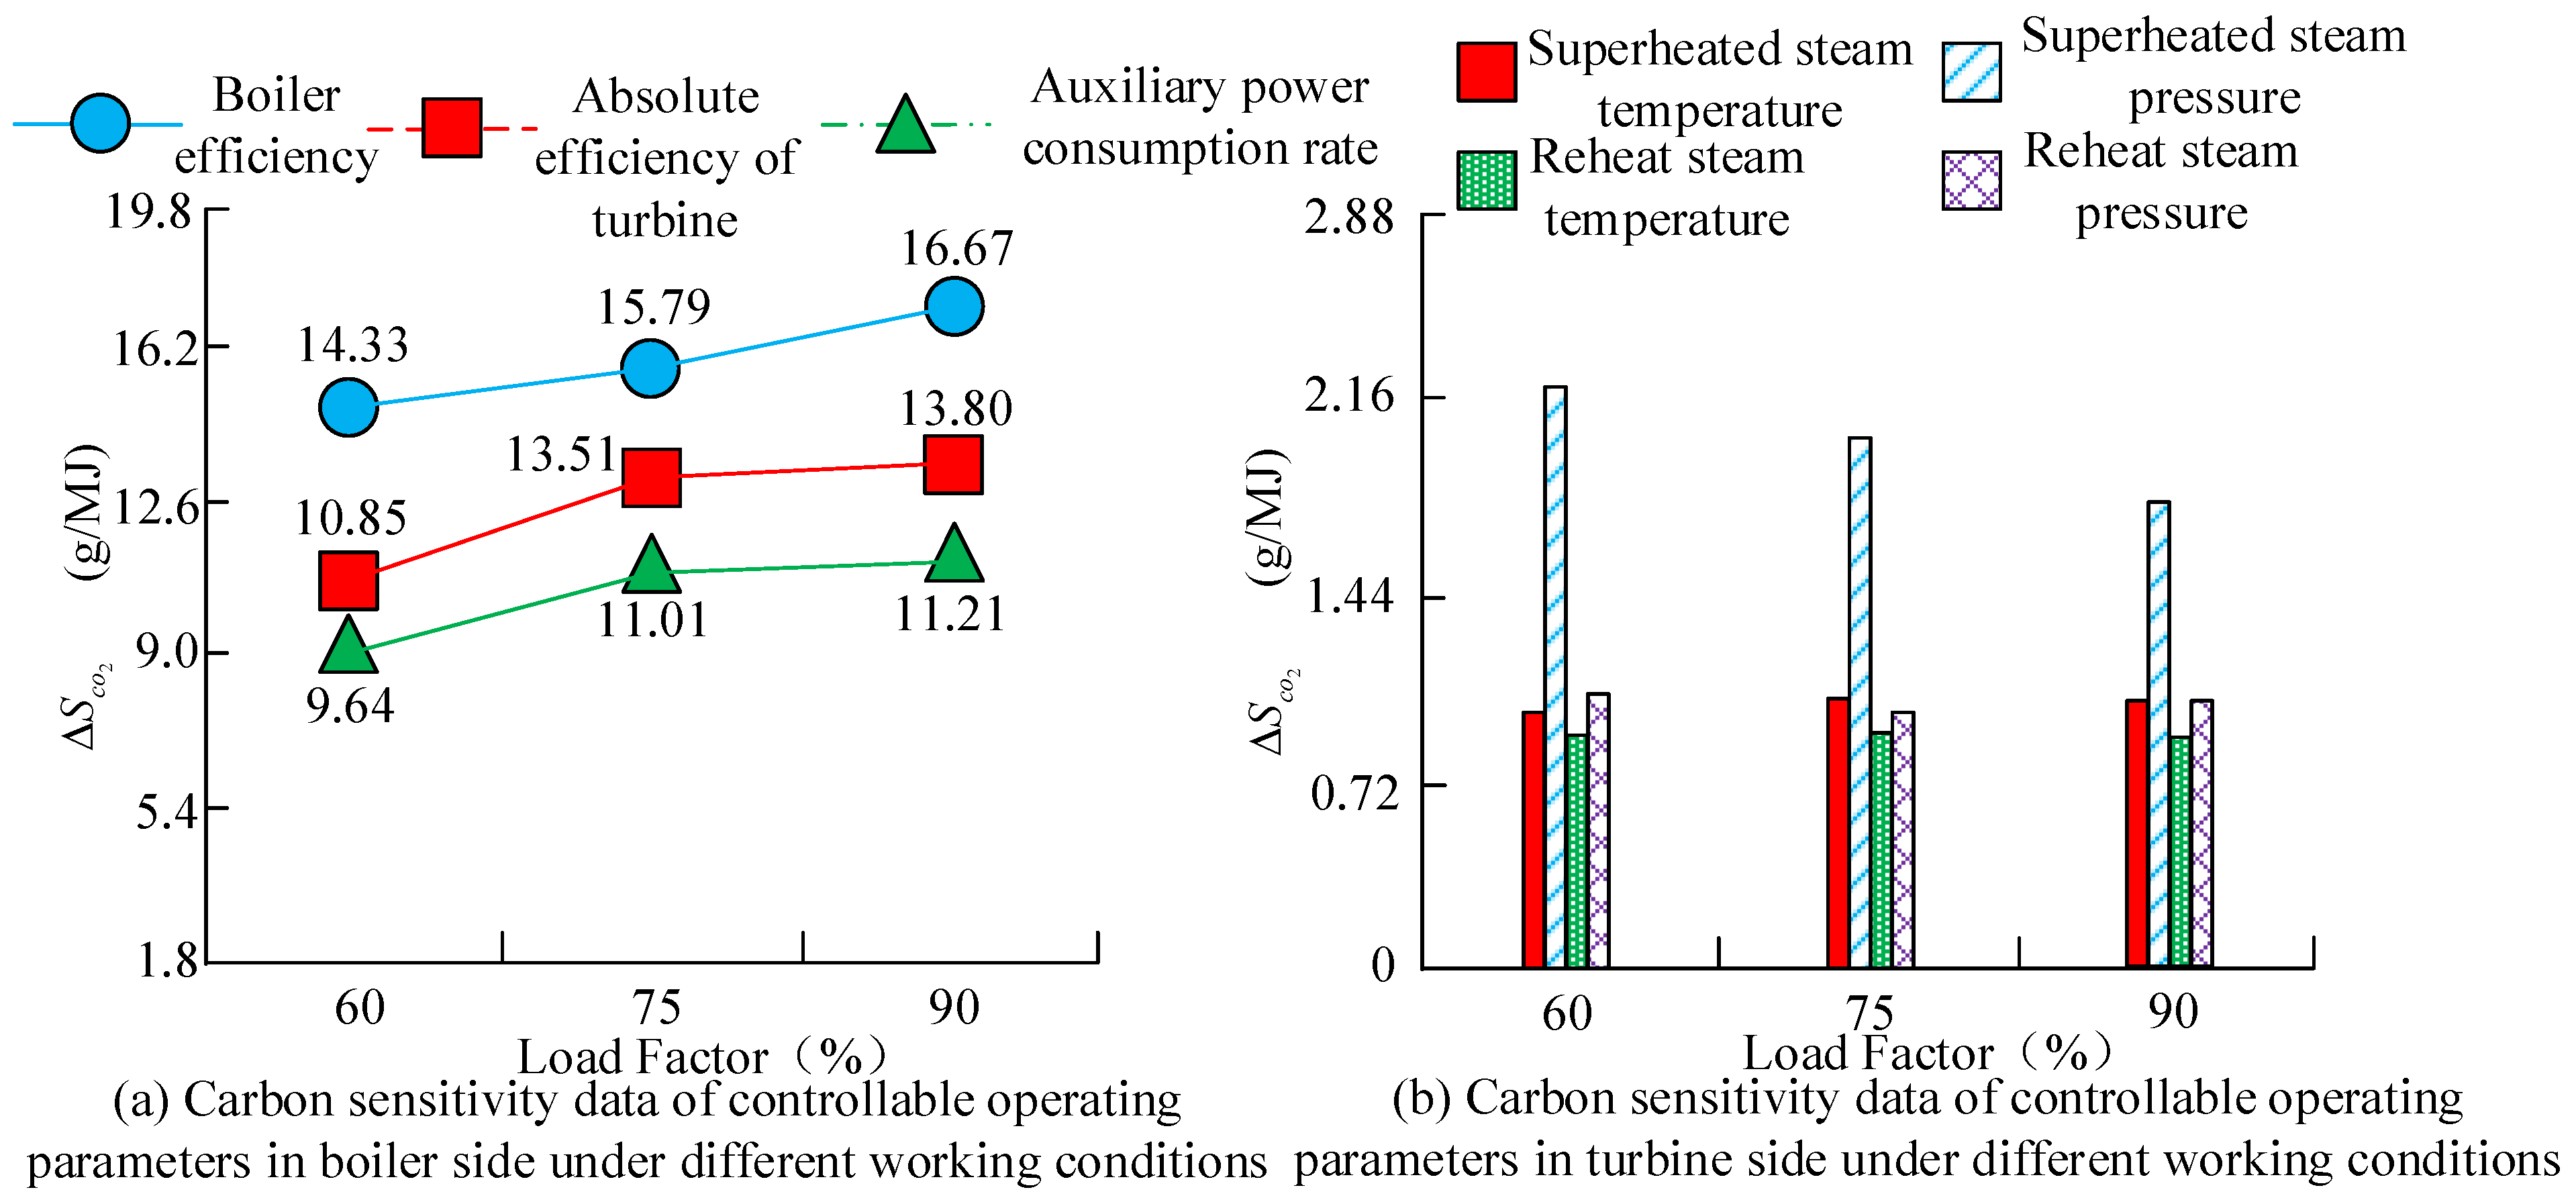
On this basis, the research analyzed the data of the steam turbine side and the boiler side under the operating conditions of 60%, 75%, and 90% load factors. The results are shown in Figure 3. From Figure 3a, the carbon sensitivity of the controlled operating parameters at the boiler end increases with increasing load factor. The value of is the largest for all operating conditions due to changes in flue gas temperature, while the change in is the largest for different load factors due to changes in oxygen content in the flue gas. From Figure 3b, the change in superheated steam pressure due to an increase in load factor causes to decrease. Furthermore, it is always at its maximum. Changes in superheated steam pressure, reheated steam pressure, and reheated steam temperature have little effect on . This indicates that the carbon sensitivity of plant electricity consumption is relatively high under low operating conditions.
4.2. Calculation of Coal Combustion Emission Factors
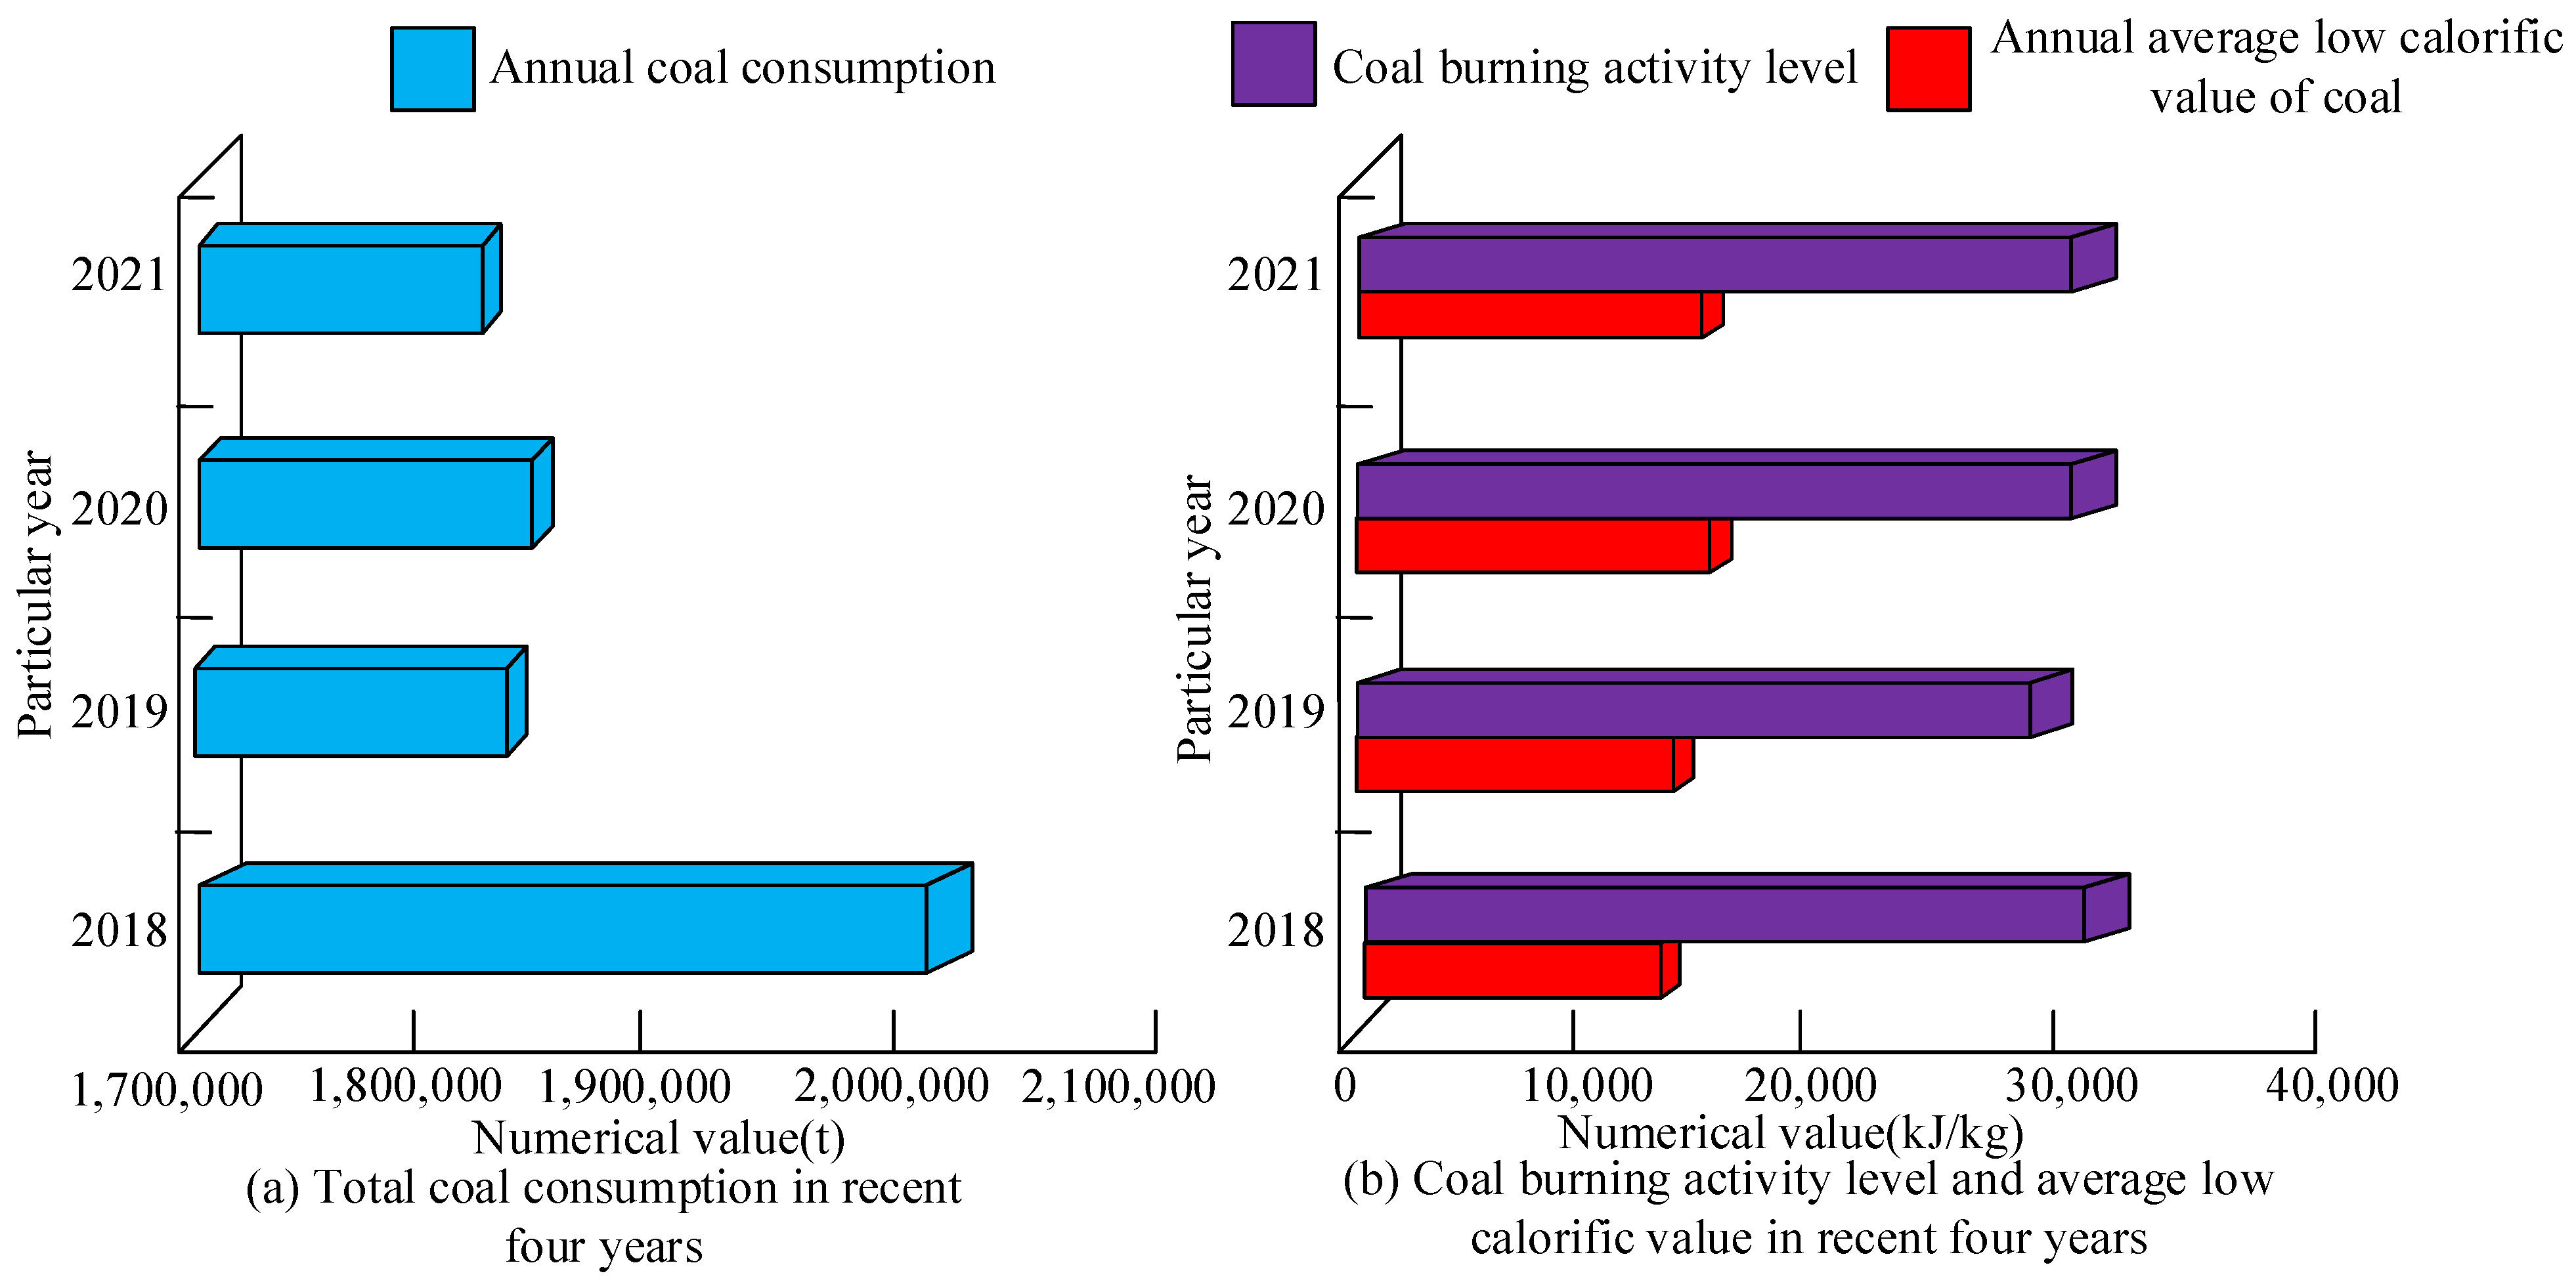
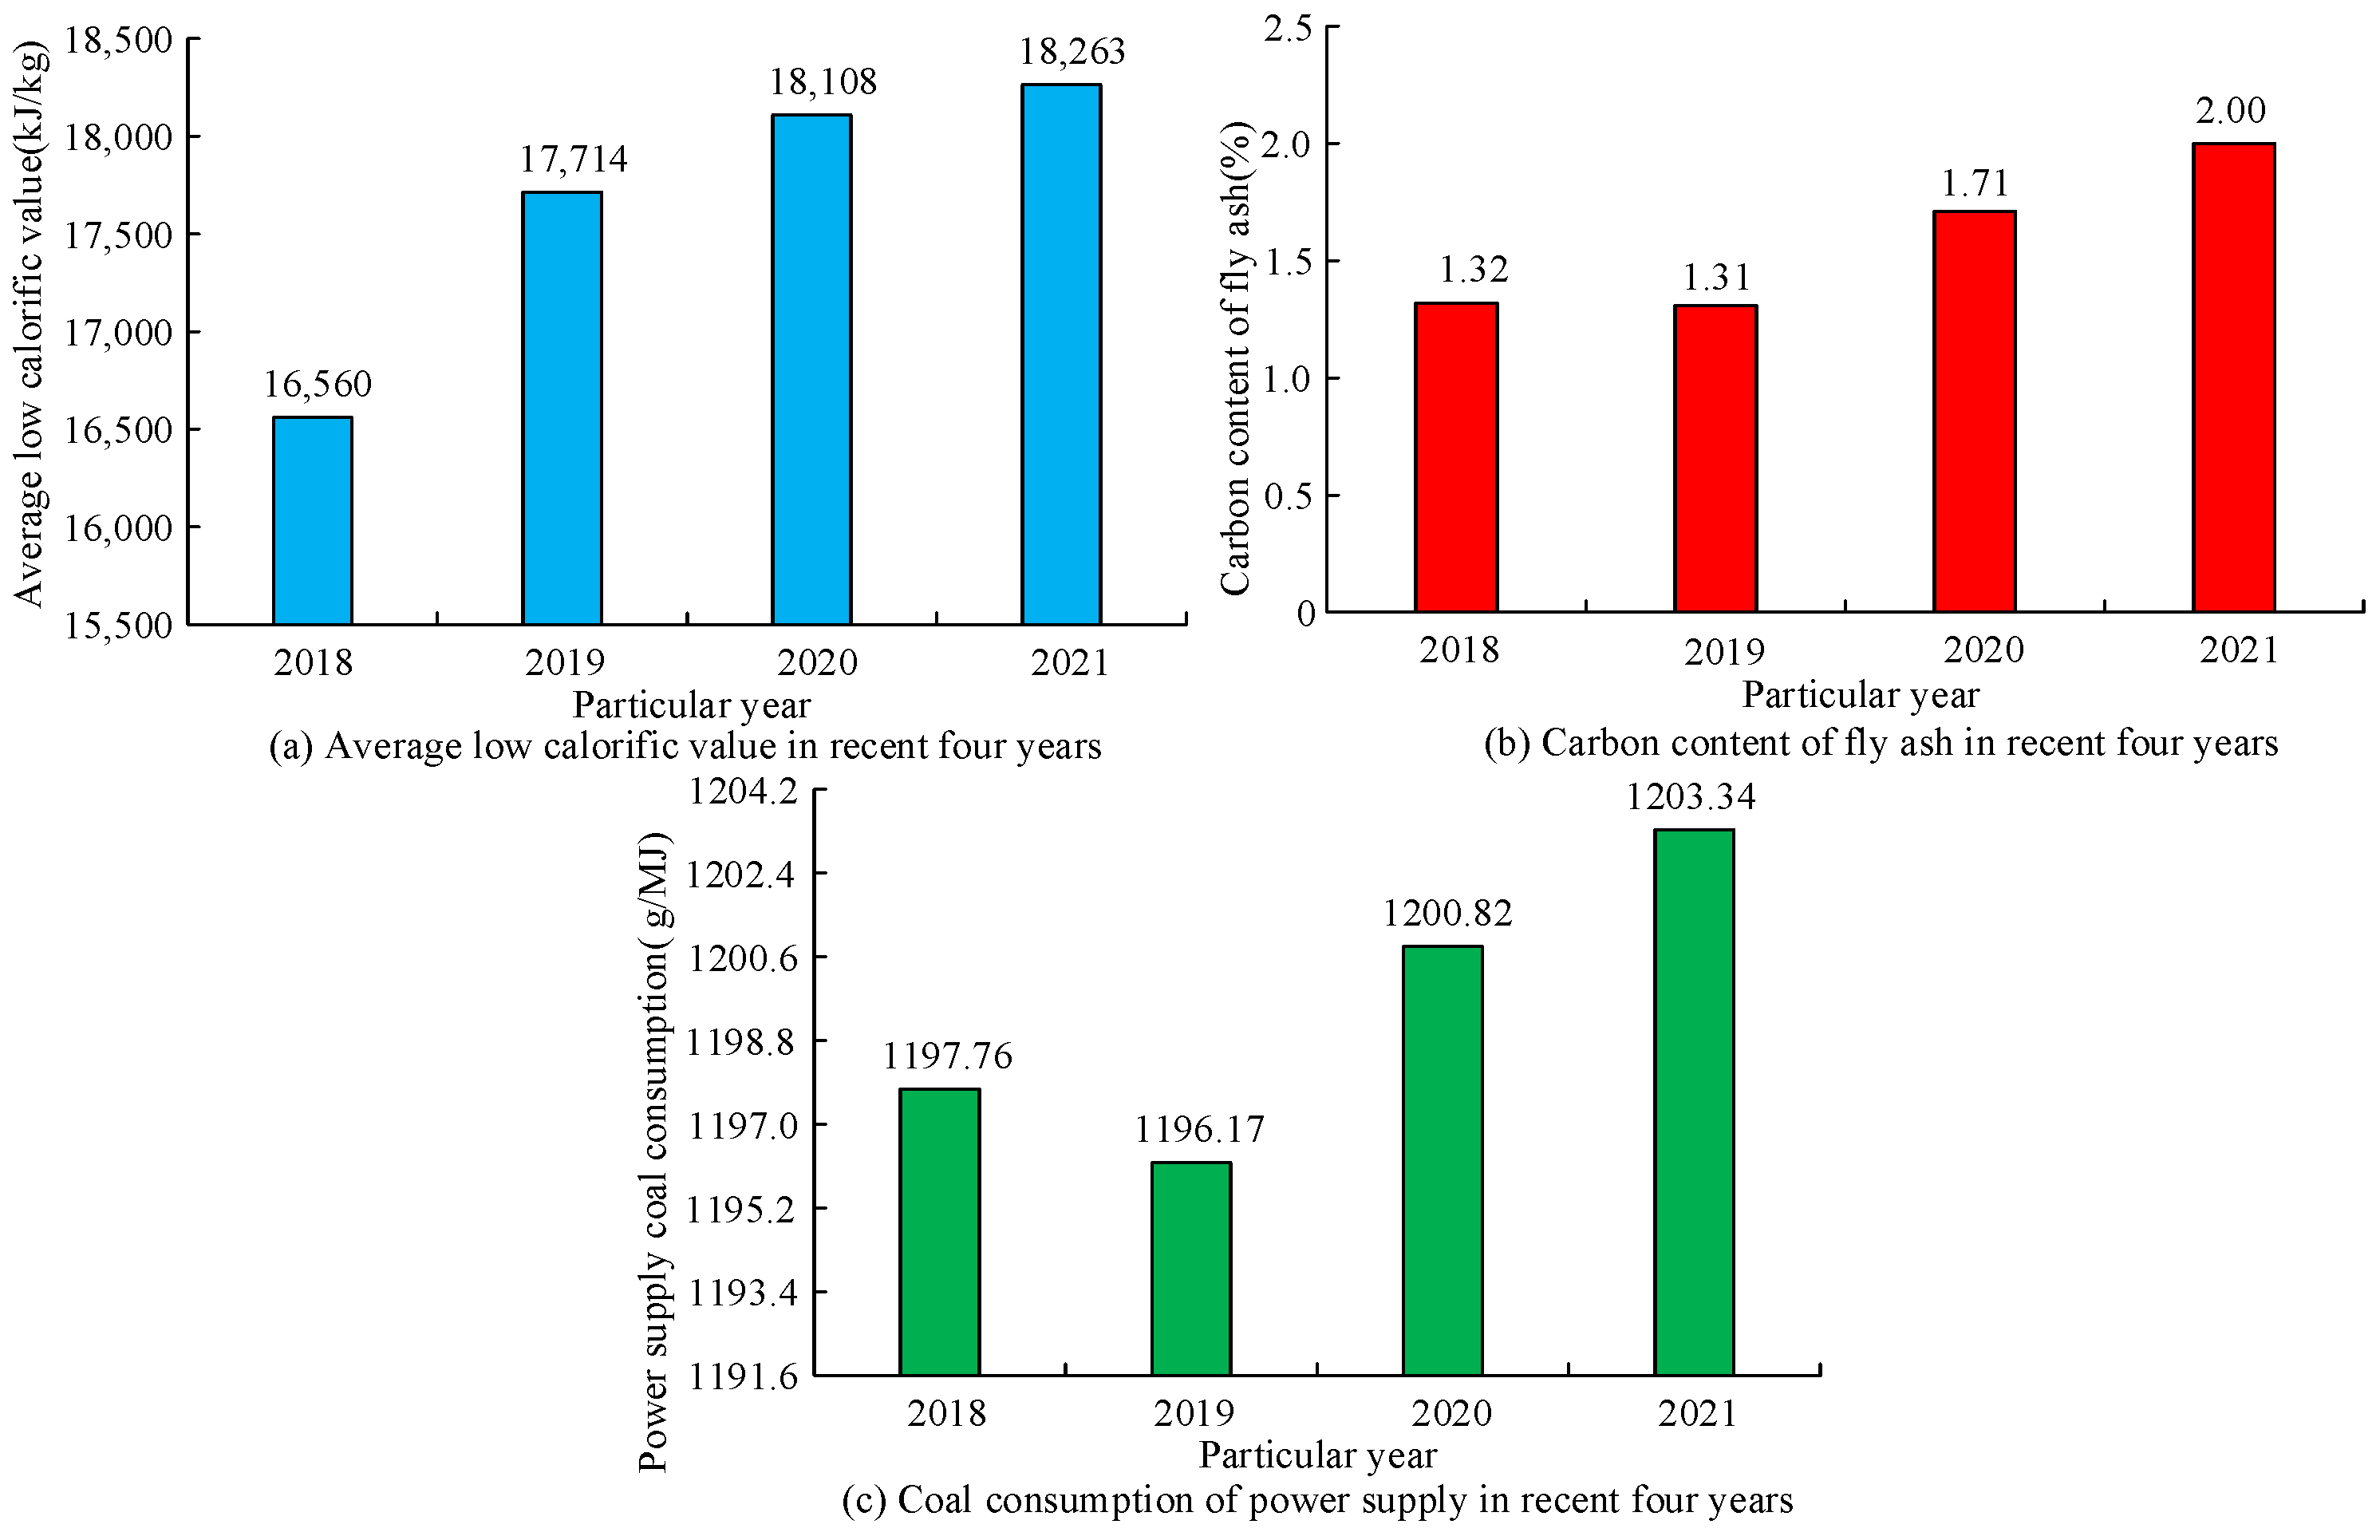
An emission factor is an indicator of the amount of greenhouse gas emissions per unit level of activity, which reflects typical emissions for a given operating condition. A single coal-fired power plant consists mainly of the carbon content per unit calorific value of fossil fuels, oxidation rates, desulphuriser emission factors, and annual average emission factors for the regional grid. This study began by collecting the last four years of coal combustion activity levels for this coal-fired power plant. It is indicated in Figure 4. From Figure 4a, due to the proposal to achieve the dual carbon goals and implement carbon reduction strategies, the total coal consumption in the past four years has remained roughly between 1.8 million tons and 2 million tons, with a decreasing trend. Figure 4b indicates that the annual average low heat value of coal combustion has remained between 16,000 kJ/kg and the activity level of coal combustion has remained between 30,000 TJ. Taken together, the overall activity level of coal combustion tends to decrease as time moves forward, indicating decreasing coal consumption.
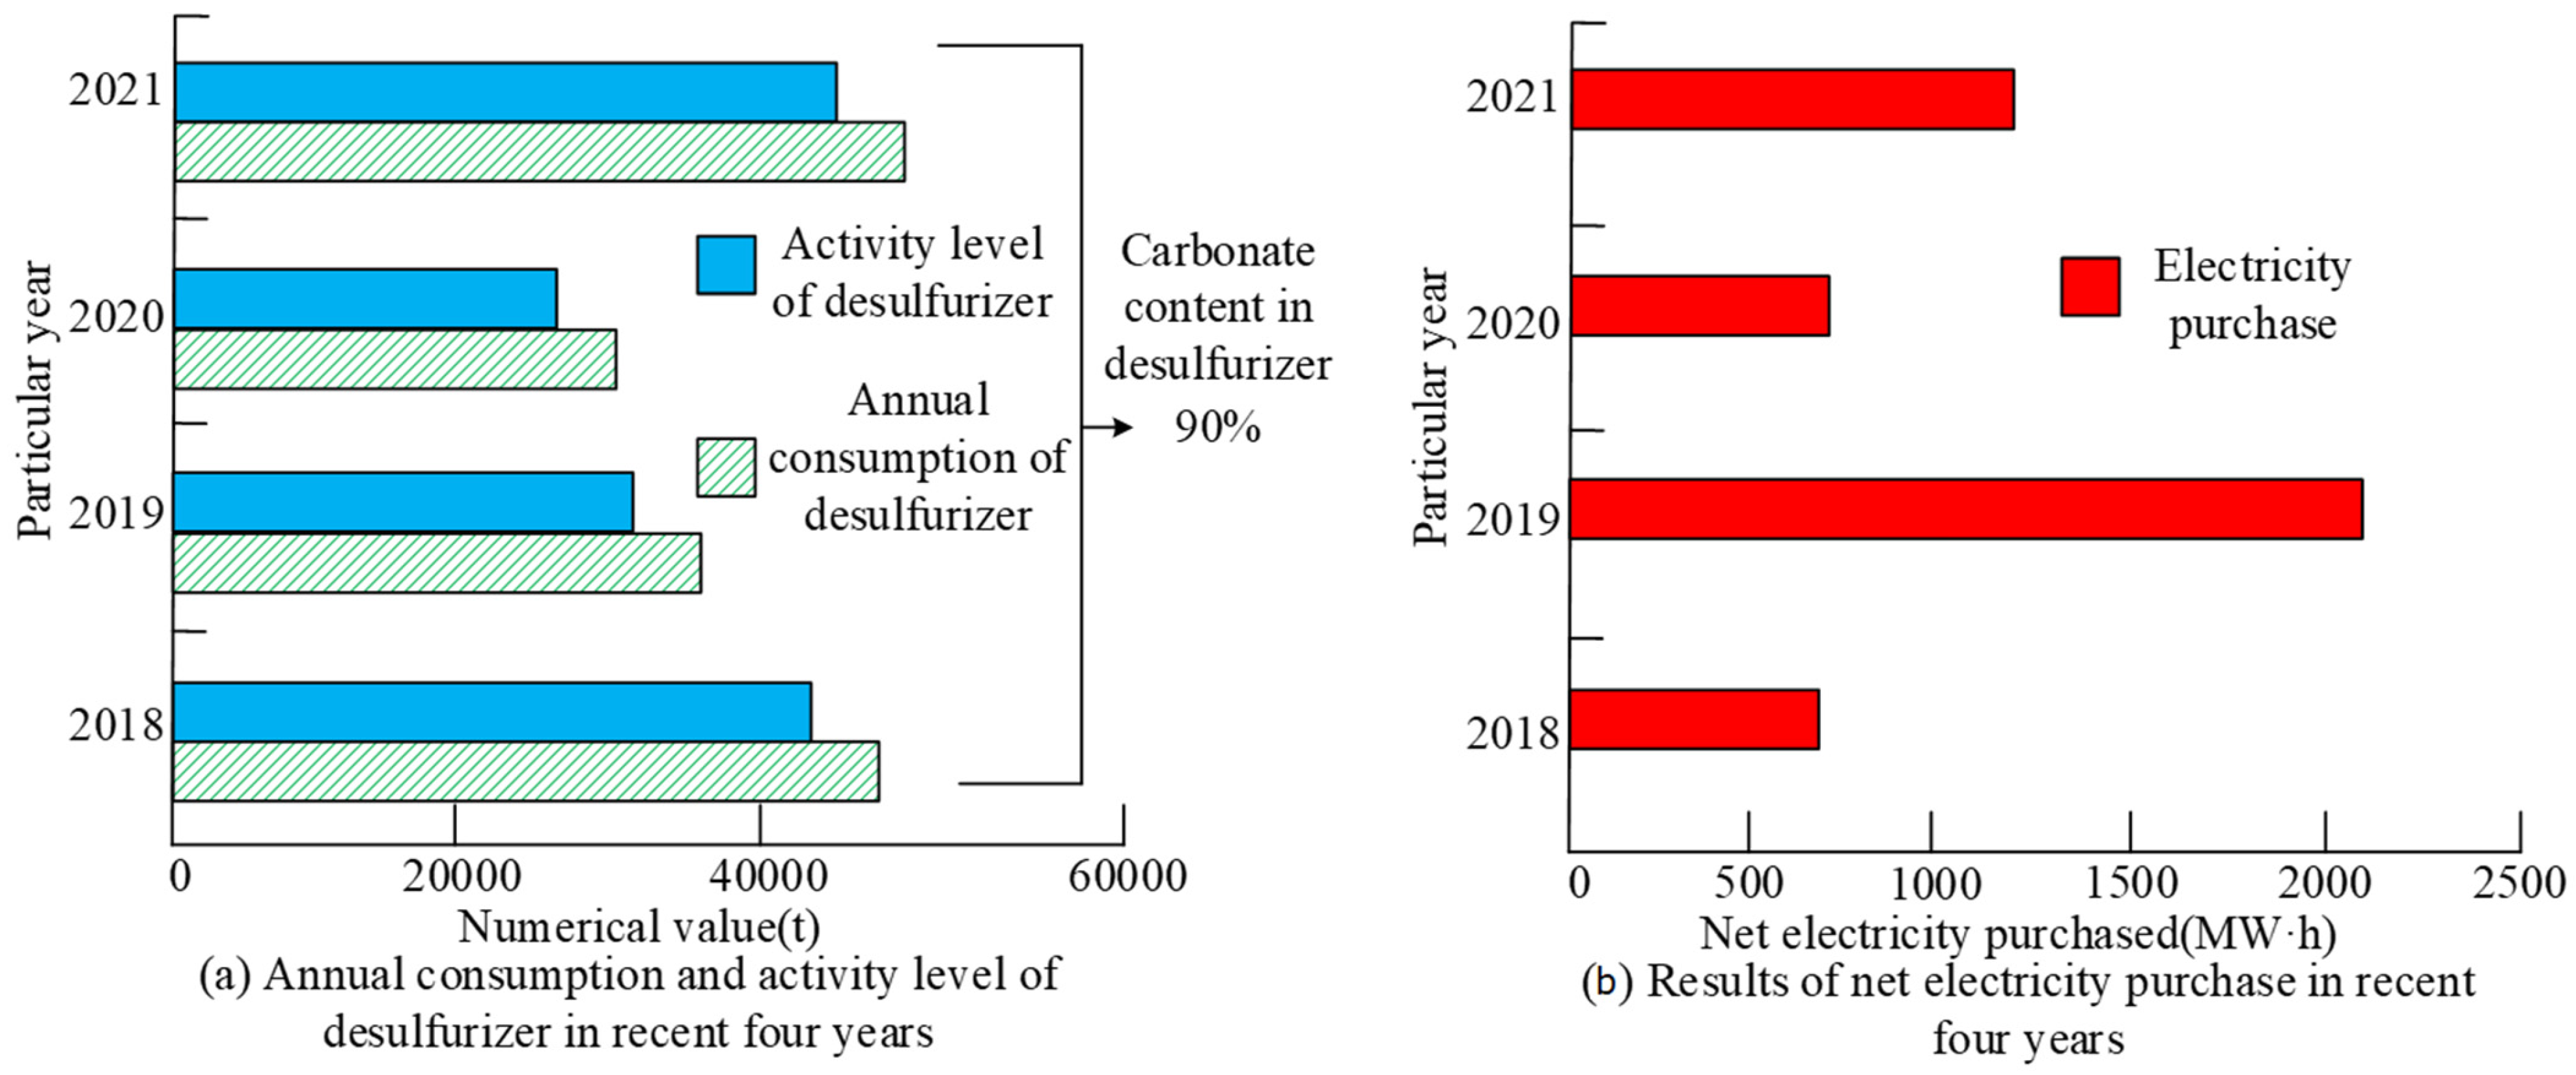
On this basis, the study analyzed the level of electricity activities used in the desulfurization of coal-fired power plants and after net procurement in coal-fired emissions. The results are illustrated in Figure 5. From Figure 5a, the annual consumption of FGD during the last four years has remained between 30,000 and 40,000 tonnes. It has a decreasing trend in the first three years and a surge in 2021 to 49,303.26 t. The overall FGD activity level, however, has trended roughly in line with the annual consumption, and its internal carbonate content has remained at 90%. Figure 5b demonstrates that the net purchase of electricity over the last four years was highest in 2020 at 7,690,932 MJ.
Meanwhile, the carbon content per unit calorific value of fossil fuels and the probability of carbon oxidation in the coal combustion emission factors are showcased in Table 1.
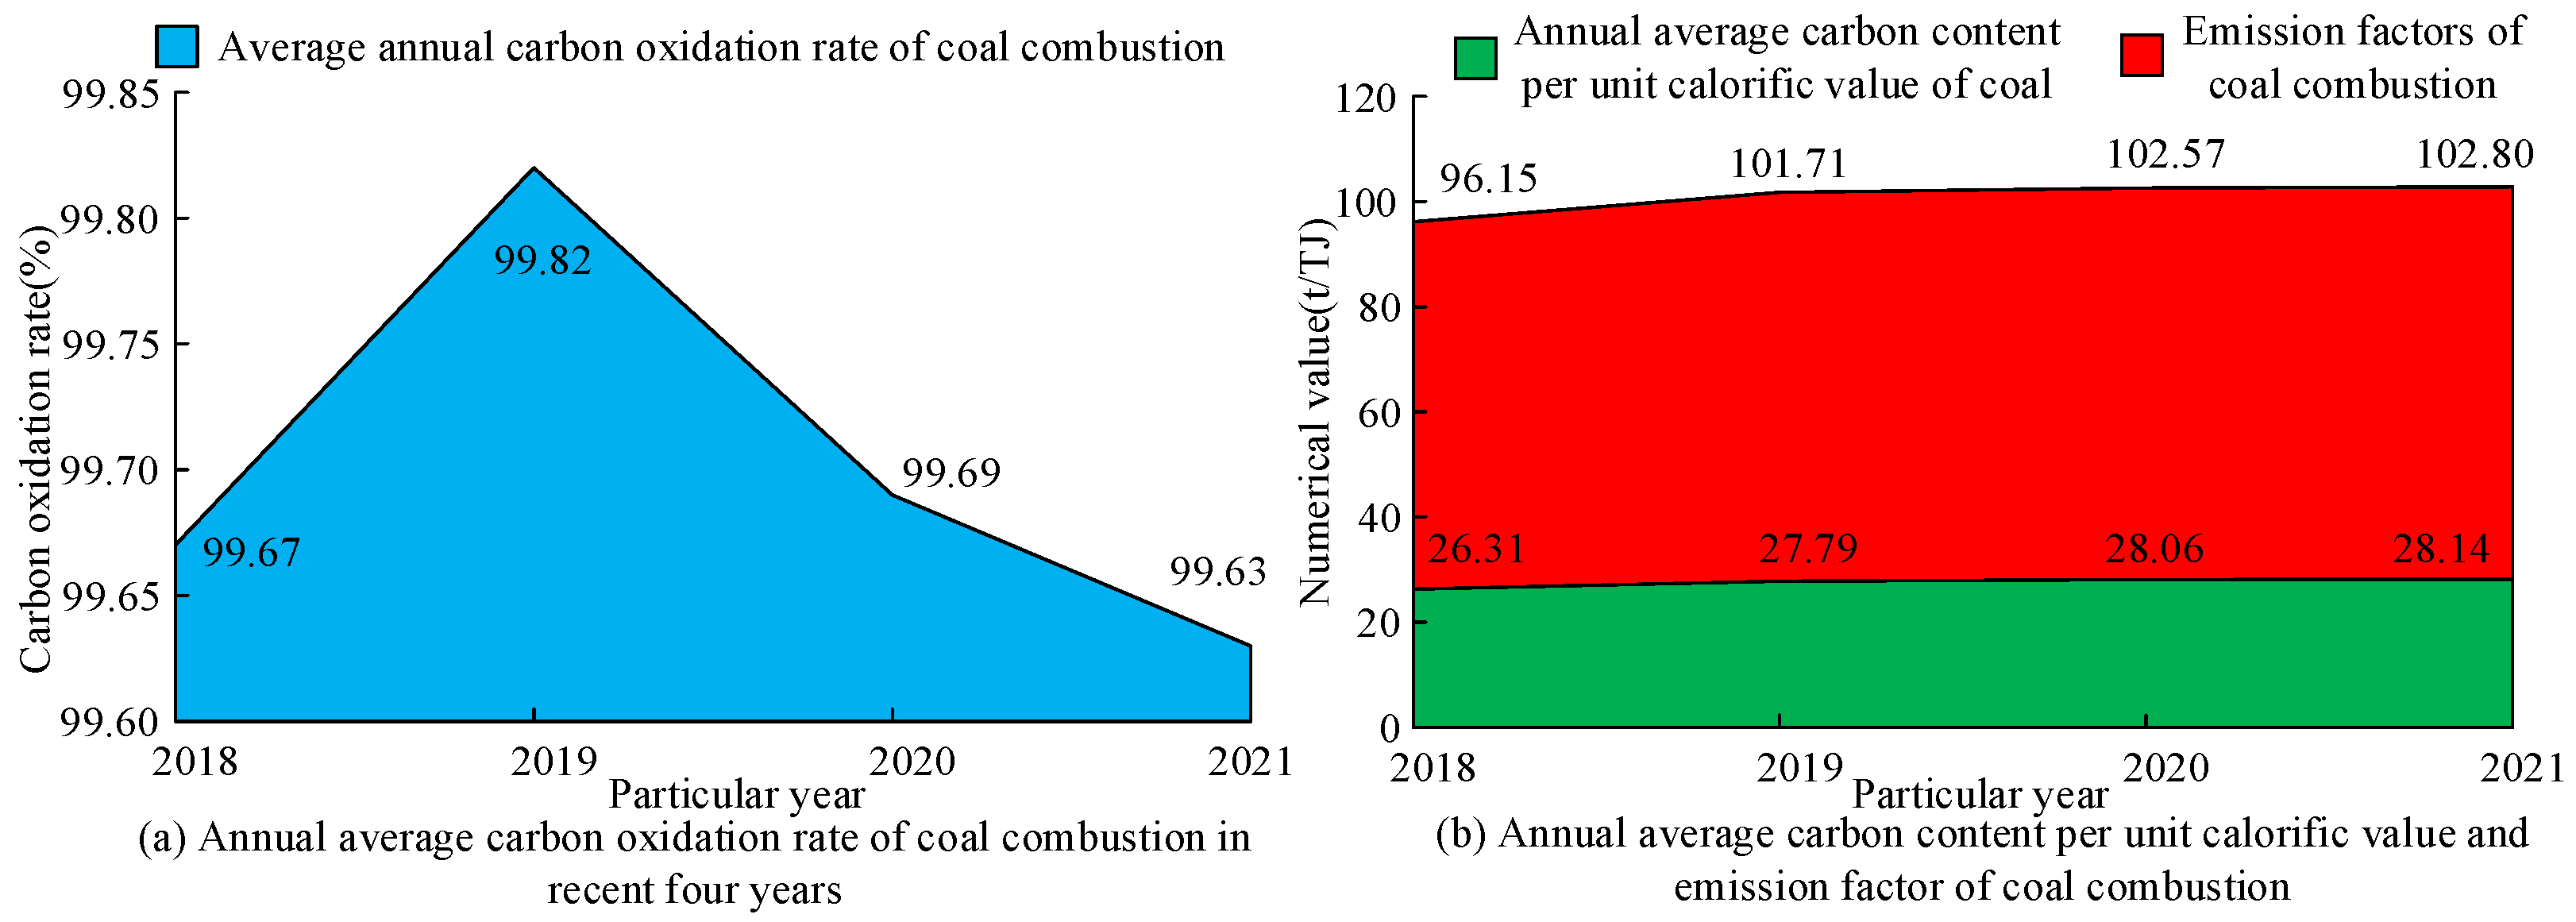
In the table, the carbon content per unit calorific value of fossil fuels shows a gradual increase, reaching a maximum value of 28.2 t/TJ in 2021. In addition, the oxidation probability of burning coal carbon fluctuates, with the highest occurring in 2019 at 99.8% and overall above 99%, showing a high oxidation level. Combining Figure 5 and Table 1, the emission factor data for coal combustion can be derived and the results are shown in Figure 6. Figure 6a illustrates that the average carbon oxidation rate for the last four years of coal combustion was similarly above 99%, with a maximum of 99.82%; and from Figure 6b, the annual average carbon content per unit calorific value averaged around 26.5 t/TJ. The combined emission factors obtained show an increasing trend, with a maximum of 102.80 t/TJ.
4.3. Calculation of Carbon Emissions from Coal Combustion
For coal-fired carbon emissions, a combination of Figure 4 and Figure 6 allows for the calculation of their CO2. Based on the empirical fitting method, various factors of CO2 emissions for the two coal-fired power units were analyzed for the period 2018–2021. The results for one of these units, generator unit 1, are indicated in Table 2.
The carbon oxidation rate in Table 2 refers to the rate at which carbon in the fuel is oxidized to carbon dioxide during the combustion process. Table 2 shows that the annual consumption of raw coal fluctuates, reaching a maximum of 2,062,479 tonnes in 2021. Meanwhile, the carbon emissions from coal combustion show a year-on-year increase, maintaining a total of over 2.8 million tonnes, with a maximum of 3.64 million tonnes. In addition, the results for generator unit 2 are seen in Table 3.
From Table 3, the annual average oxidation probability of burning carbon from raw coal fluctuates, with an average of 98.951%; the carbon emissions from coal combustion fluctuate, reaching a minimum of 2,867,789 tonnes in 2021. By combining Table 2 and Table 3, according to the empirical fit approach the difference between the two emission fits remains within 2%. This indicates that the experimental results are highly accurate. The plant’s carbon emissions are increasing, which puts a huge strain on the atmosphere and therefore requires the necessary carbon reduction.
4.4. Carbon Reduction Analysis
Based on the data in Table 1, Table 2 and Table 3 and Figure 6, the probability of carbon oxidation is the only uncertainty, given the source of coal combustion and the total amount of electricity generated by the coal-fired plant throughout the year. Based on the equation related to the carbon oxidation rate, the relationship between the carbon content of the fly ash and the coal consumption of the electricity supply can be obtained. This can implement an effective carbon emission method. The results are shown in Figure 7. From Figure 7, in 2018, the energy supply power was over 12.24 million MJ, and the coal consumption for power supply was 332.71 g/MJ. When the coal consumption for power supply is reduced by 1.584 g/MJ, it can effectively save 2500 tons of raw coal and reduce 4300 tons of carbon dioxide, resulting in an overall carbon reduction of over 8000 tons. Therefore, reducing the carbon content in fly ash to reduce electricity consumption is an important direction for carbon reduction.
5. Conclusions
To better understand the company’s carbon emissions, a carbon emission calculation model and carbon emission data accounting model for coal-fired power plants were studied and constructed, and case data calculations and a carbon emission reduction analysis were conducted. The experimental results show that in the carbon emission parameter sensitivity experiment, the efficiency of the inner side of the boiler is higher than the absolute internal efficiency of the steam turbine at different load rates. At a load rate of 60%, for every 1 MW reduction in factory power consumption, will decrease by 29.77 g/MJ. In addition, the emission factor of coal-fired power has averaged 100.806 t/TJ in the past four years and is gradually increasing, reaching a maximum of 102.80 t/TJ. In the coal-fired carbon emission experiment, the fitting degree between the carbon emissions of unit 1 and unit 2 was less than 2%, indicating the accuracy of the experimental data. Finally, in the carbon emission reduction analysis experiment, taking 2018 as an example, for every 1.58 g/MJ reduction in coal consumption while maintaining the same power supply, 4300 tons of carbon dioxide can be reduced. Overall, under low load conditions, power plants exhibit a high level of carbon sensitivity, indicating significant potential for carbon dioxide reduction. At the same time, reducing the carbon content in fly ash can reduce electricity consumption and achieve carbon emissions reduction. However, the data collected in the study are measured in years, which can affect the accuracy of the results, so data could be collected in months in the future.
Author Contributions
H.H. and B.X. collected the samples. B.X. and Y.C. analyzed the data. H.H. and B.X. conducted the experiments and analyzed the results. All authors have read and agreed to the published version of the manuscript.
Funding
The research work was funded by Key R&D and Promotion Projects (Soft Science) of Henan Province in 2023: Research on the financing of small and medium-sized enterprises empowered by digital technology (No. 232400410225); Henan New Liberal Arts Research and Reform Practice Project: Reform and Practice of Liberal Arts Major Transformation and Upgrading in Local Ordinary Undergraduate Colleges—Taking E-commerce as an example; Henan University of Science and Technology 2022 Undergraduate Research and Training Program (SRTP): “Research on the impact of supply chain integration on enterprise quality performance” (No. 2022357).
Institutional Review Board Statement
Not applicable.
Informed Consent Statement
Not applicable.
Data Availability Statement
Not applicable.
Conflicts of Interest
The authors declare no conflict of interest.
Glossary
| Name | International Units |
| Carbon emission intensity | kgCO2/IntGK $ |
| Temperature | K |
| Volume | m3 |
| Specific heat capacity | J/(kg·K) |
| Quantity of heat | J |
| Absolute humidity | g/m3 |
| Calorific value | MJ |
References
- Yu, G.; Hao, T.; Zhu, J. Discussion on action strategies of China’s carbon peak and carbon neutrality. Bull. Chin. Acad. Sci. Chin. Version 2022, 37, 423–434. [Google Scholar] [CrossRef]
- Jiang, T.; Yu, Y.; Yang, B. Understanding the carbon emissions status and emissions reduction effect of China’s transportation industry: Dual perspectives of the early and late stages of the economic “new normal”. Environ. Sci. Pollut. Res. 2022, 29, 28661–28674. [Google Scholar] [CrossRef]
- Mao, X.; Wang, Y. Cooperative carbon emission reduction through the belt and road initiative. Environ. Sci. Pollut. Res. 2022, 29, 10005–10026. [Google Scholar] [CrossRef] [PubMed]
- An, Y.; Zhou, D.; Wang, Q. Carbon emission reduction potential and its influencing factors in China’s coal-fired power industry: A cost optimization and decomposition analysis. Environ. Dev. Sustain. 2022, 24, 3619–3639. [Google Scholar] [CrossRef]
- Xue, X.; Wang, Y.; Chen, H.; Xu, G. A coal-fired power plant integrated with biomass co-firing and CO2 capture for zero carbon emission. Front. Energy 2022, 16, 307–320. [Google Scholar] [CrossRef]
- Cabernard, L.; Pfister, S.; Oberschelp, C.; Hellweg, S. Growing environmental footprint of plastics driven by coal combustion. Nat. Sustain. 2022, 5, 139–148. [Google Scholar] [CrossRef]
- Guo, Q.; Xi, X.; Yang, S.; Cai, M. Technology strategies to achieve carbon peak and carbon neutrality for China’s metal mines. Int. J. Miner. Metall. Mater. 2022, 29, 626–634. [Google Scholar] [CrossRef]
- Khan, H.; Weili, L.; Khan, I. The role of institutional quality in FDI inflows and carbon emission reduction: Evidence from the global developing and belt road initiative countries. Environ. Sci. Pollut. Res. 2022, 29, 30594–30621. [Google Scholar] [CrossRef]
- Kou, P.; Han, Y.; Qi, X.; Li, Y. Does China’s policy of carbon emission trading deliver sulfur dioxide reduction co-benefits? Environ. Dev. Sustain. 2022, 24, 6224–6245. [Google Scholar] [CrossRef]
- Ansari, M.A.; Akram, V.; Haider, S. A link between productivity, globalisation and carbon emissions: Evidence from emissions by coal, oil and gas. Environ. Sci. Pollut. Res. 2022, 29, 33826–33843. [Google Scholar] [CrossRef]
- Dong, F.; Zhu, J.; Li, Y.; Chen, Y.; Gao, Y.; Hu, M.; Sun, J. How green technology innovation affects carbon emission efficiency: Evidence from developed countries proposing carbon neutrality targets. Environ. Sci. Pollut. Res. 2022, 29, 35780–35799. [Google Scholar] [CrossRef] [PubMed]
- Mo, J.Y. Technological innovation and its impact on carbon emissions: Evidence from Korea manufacturing firms participating emission trading scheme. Technol. Anal. Strat. Manag. 2022, 34, 47–57. [Google Scholar] [CrossRef]
- Cui, R.Y.; Hultman, N.; Cui, D.Y.; Mcjeon, H.; Clarke, L.; Yuan, J.H.; Cai, W.J. A US–China coal power transition and the global 1.5 °C pathway. Adv. Clim. Chang. Res. 2022, 13, 179–186. [Google Scholar] [CrossRef]
- Wu, J.; Cui, C.; Guo, X. Impacts of the West–East Gas Pipeline Project on energy conservation and emission reduction: Empirical evidence from Hubei province in central China. Environ. Sci. Pollut. Res. 2022, 29, 28149–28165. [Google Scholar] [CrossRef]
- Jiang, T.; Li, S.; Yu, Y.; Peng, Y. Energy-related carbon emissions and structural emissions reduction of China’s construction industry: The perspective of input–output analysis. Environ. Sci. Pollut. Res. 2022, 29, 39515–39527. [Google Scholar] [CrossRef]
- Jia, K. Goals on the road: Institutional innovations in carbon peak and carbon neutrality. J. Chin. Econ. Bus. Stud. 2022, 20, 95–107. [Google Scholar] [CrossRef]
- Gao, G.; Zhang, M.; Wang, S.; Wang, C.; Zhang, R. Assessment of pollutant emissions reduction potential of energy infrastructure in industrial parks of Henan Province.Environ. Develop. Sustainability 2022, 24, 8071–8091. [Google Scholar] [CrossRef]
- Yang, H.; Gan, T.; Liang, W.; Liao, X. Can policies aimed at reducing carbon dioxide emissions help mitigate haze pollution? An empirical analysis of the emissions trading system. Environ. Dev. Sustain. 2022, 24, 1959–1980. [Google Scholar] [CrossRef]
- Ryabov, G.A. Cofiring of coal and fossil fuels is a way to decarbonization of heat and electricity generation. Therm. Eng. 2022, 69, 405–417. [Google Scholar] [CrossRef]
- Booth, M.S. “Sustainable” biomass: A paper tiger when it comes to reducing carbon emissions. Bull. At. Sci. 2022, 78, 139–147. [Google Scholar] [CrossRef]
- Yang, B.; Bai, Z.; Wang, J. Spatiotemporal dynamic differences of energy-related CO 2 emissions and the related driven factors in six regions of China during two decades. Environ. Sci. Pollut. Res. 2022, 29, 24737–24756. [Google Scholar] [CrossRef]
- Li, J.; Wang, T.; Liu, P.; Li, Z. Dynamic modelling and simulation of a post-combustion CO 2 capture process for coal-fired power plants. Front. Chem. Sci. Eng. 2022, 16, 198–209. [Google Scholar] [CrossRef]
- Raza, M.A.; Khatri, K.L.; Memon, M.A.; Rafique, K.; Haque MI, U.; Mirjat, N.H. Exploitation of Thar coal field for power generation in Pakistan: A way forward to sustainable energy future. Energy Explor. Exploit. 2022, 40, 1173–1196. [Google Scholar] [CrossRef]
- Zhang, Y.; Yu, Z.; Zhang, J. Research on carbon emission differences decomposition and spatial heterogeneity pattern of China’s eight economic regions. Environ. Sci. Pollut. Res. 2022, 29, 29976–29992. [Google Scholar] [CrossRef]
- Zhang, Y.; Xu, X. Carbon emission efficiency measurement and influencing factor analysis of nine provinces in the Yellow River basin: Based on SBM-DDF model and Tobit-CCD model. Environ. Sci. Pollut. Res. 2022, 29, 33263–33280. [Google Scholar] [CrossRef]
- Jiang, L.; Sakhare, S.R.; Kaur, M. Impact of industrial 40 on environment along with correlation between economic growth carbon emissions. Int. J. Syst. Assur. Eng. Manag. 2022, 13, 415–423. [Google Scholar] [CrossRef]
- Wang, Q.; Dong, Z. Technological innovation and renewable energy consumption: A middle path for trading off financial risk and carbon emissions. Environ. Sci. Pollut. Res. 2022, 29, 33046–33062. [Google Scholar] [CrossRef]
- Kirikkaleli, D.; Güngör, H.; Adebayo, T.S. Consumption-based carbon emissions, renewable energy consumption, financial development and economic growth in Chile. Bus. Strat. Environ. 2022, 31, 1123–1137. [Google Scholar] [CrossRef]
- He, S.; Gao, L.; Dong, R.; Li, S. A novel hydrogen production system based on the three-step coal gasification technology thermally coupled with the chemical looping combustion process. Int. J. Hydrogen Energy 2022, 47, 7100–7112. [Google Scholar] [CrossRef]
- Zhan, X.; Xu, H.; Zhang, Y.; Zhu, X.; Yin, H.; Zheng, Y. Deepthermal: Combustion optimization for thermal power generating units using offline reinforcement learning. Proc. Conf. AAAI Artif. Intell. 2022, 36, 4680–4688. [Google Scholar] [CrossRef]
- Previti, S.; Di Chio, C.; Ettari, R.; Zappalà, M. Dual inhibition of parasitic targets: A valuable strategy to treat malaria and neglected tropical diseases. Curr. Med. Chem. 2022, 29, 2952–2978. [Google Scholar] [CrossRef] [PubMed]
- Zhang, X.; Dou, Y.; Zhang, C.; Ding, L.; Lv, H. Carbon emission management of coal power plant from the perspective of production planning in China. J. Ind. Prod. Eng. 2023, 40, 22–34. [Google Scholar] [CrossRef]
- Lee, C.C.; Hussain, J. Optimal behavior of environmental regulations to reduce carbon emissions: A simulation-based dual green gaming model. Environ. Sci. Pollut. Res. 2022, 29, 56037–56054. [Google Scholar] [CrossRef]
- Müller, L.; Ramires, P.F.; dos Santos, M.; Coronas, M.V.; Lima, J.V.; Dias, D.; da Silva Júnior, F.M.R. Human health risk assessment of arsenic in a region influenced by a large coal-fired power plant. Int. J. Environ. Sci. Technol. 2021, 19, 281–288. [Google Scholar] [CrossRef]
- Debnath, R.; Mittal, V.; Jindal, A. A review of challenges from increasing renewable generation in the Indian Power Sector: Way forward for Electricity (Amendment) Bill 2020. Energy Environ. 2021, 33, 3–40. [Google Scholar] [CrossRef]
- Panchal, D.; Chatterjee, P.; Pamucar, D.; Yazdani, M. A novel fuzzy-based structured framework for sustainable operation and environmental friendly production in coal-fired power industry. Int. J. Intell. Syst. 2022, 37, 2706–2738. [Google Scholar] [CrossRef]
- Raheem, A.T.; Aziz, A.R.A.; Zulkifli, S.A.; Baharom, M.B.; Rahem, A.T.; Ayandotun, W.B. Optimisation of operating parameters on the performance characteristics of a free piston engine linear generator fuelled by CNG–H2 blends using the response surface methodology (RSM). Int. J. Hydrogen Energy 2021, 47, 1996–2016. [Google Scholar] [CrossRef]
- Baidya, D.; de Brito, M.A.R.; Sasmito, A.P.; Ghoreishi-Madiseh, S.A. Diesel generator exhaust heat recovery fully-coupled with intake air heating for off-grid mining operations: An experimental, numerical and analytical evaluation. Int. J. Min. Sci. Technol. 2022, 32, 155–169. [Google Scholar] [CrossRef]
- Wirtz, M.; Stutz, B.; Phan, H.T.; Boudehenn, F. Numerical modeling of falling-film plate generator and rectifier designed for NH3—H2O absorption machines. Heat Mass Transf. 2021, 58, 431–446. [Google Scholar] [CrossRef]
- Yang, F.; Jia, L.; Zhou, Y.; Guan, D.; Feng, K.; Choi, Y.; Li, J. Life cycle assessment shows that retrofitting coal-fired power plants with fuel cells will substantially reduce greenhouse gas emissions. One Earth 2022, 5, 392–402. [Google Scholar] [CrossRef]
- Han, L.; Zhao, Y.; Hao, R. Arsenic emission and distribution characteristics in the ultra-low emission coal-fired power plant. Environ. Sci. Pollut. Res. 2022, 29, 36814–36823. [Google Scholar] [CrossRef] [PubMed]
- He, F.; Liu, X.; Wang, M.; Zhou, S.; Heydarian, D. Energy, exergy, exergoeconomic, and environmental analyses and multi-objective optimization of a biomass-to-energy integrated thermal power plant. Alex. Eng. J. 2022, 61, 5629–5648. [Google Scholar] [CrossRef]
Figure 1.
Specific contents of the two-level relationship.

Figure 2.
Carbon sensitivity analysis results under different load factors.

Figure 3.
Data results of steam turbine side and boiler side under different working conditions.

Figure 4.
The level of coal-fired activity of the coal-fired power plant in recent four years.

Figure 5.
Activity level of electricity used in the desulfurization process and after net procurement of coal-fired power plants.
Figure 5.
Activity level of electricity used in the desulfurization process and after net procurement of coal-fired power plants.

Figure 6.
Emission factor results of coal combustion.

Figure 7.
Result of relationship between carbon content in fly ash and coal consumption for power supply.
Figure 7.
Result of relationship between carbon content in fly ash and coal consumption for power supply.


Table 1.
Carbon content per unit calorific value and carbon oxidation probability of fossil fuels.
| Particular Year | 2018 | 2019 | 2020 | 2021 |
|---|---|---|---|---|
| Annual average carbon content per unit calorific value of coal (t/TJ) | 26.3 | 27.8 | 28.1 | 28.2 |
| Annual production of boiler residue/t | 3548.5 | 2686.7 | 2248.2 | 2548.1 |
| The average carbon content level of residue in the boiler/% | 0.8 | 0.5 | 1.1 | 1.2 |
| Annual fly ash production/t | 31,936.3 | 24,181.1 | 20,234.0 | 22,931.4 |
| Average carbon content of fly ash/% | 0.4 | 0.5 | 0.9 | 1.0 |
| Efficiency of dust collectors/% | 99.9 | 99.9 | 99.9 | 99.9 |
| Probability of oxidation of coal carbon during combustion/% | 99.6 | 99.8 | 99.7 | 99.5 |
Table 2.
CO2 emission results of generator unit 1.
| Particular Year | 2018 | 2019 | 2020 | 2021 |
|---|---|---|---|---|
| Annual average low calorific value of raw coal (kJ/kg−1) | 16,500 | 17,501 | 18,059 | 17,972 |
| Average annual carbon oxidation rate of coal combustion (%) | 99.108 | 99.115 | 98.916 | 98.514 |
| Annual consumption of raw coal (t) | 1,757,100 | 1,713,170 | 1,756,620 | 2,062,479 |
| Annual average carbon content per unit calorific value of coal (tC/GJ−1) | 0.026 | 0.025 | 0.027 | 0.028 |
| Carbon dioxide emissions from coal-fired combustion (t) | 2,830,149 | 2,920,996 | 3,102,600 | 3,641,598 |
Table 3.
CO2 emission results of generator unit 2.
| Particular Year | 2018 | 2019 | 2020 | 2021 |
|---|---|---|---|---|
| Low calorific value of raw coal Grandma General (kJ/kg) | 16,560 | 17,710 | 18,100 | 18,260 |
| Average annual carbon oxidation rate of coal combustion (%) | 99.000 | 98.870 | 99.065 | 98.869 |
| Annual consumption of raw coal (t) | 2,097,960 | 1,850,813 | 1,986,599 | 1,595,100 |
| Annual average carbon content per unit calorific value of coal (tC/GJ) | 0.026 | 0.025 | 0.027 | 0.028 |
| CO2 emissions from coal combustion (t) | 3,387,300 | 3,181,330 | 3,525,659 | 2,867,789 |
Disclaimer/Publisher’s Note: The statements, opinions and data contained in all publications are solely those of the individual author(s) and contributor(s) and not of MDPI and/or the editor(s). MDPI and/or the editor(s) disclaim responsibility for any injury to people or property resulting from any ideas, methods, instructions or products referred to in the content. |
© 2023 by the authors. Licensee MDPI, Basel, Switzerland. This article is an open access article distributed under the terms and conditions of the Creative Commons Attribution (CC BY) license (https://creativecommons.org/licenses/by/4.0/).
Share and Cite
MDPI and ACS Style
Hou, H.; Xie, B.; Cheng, Y. Analysis of Carbon Emissions and Emission Reduction from Coal-Fired Power Plants Based on Dual Carbon Targets. Sustainability 2023, 15, 7369. https://doi.org/10.3390/su15097369
AMA Style
Hou H, Xie B, Cheng Y. Analysis of Carbon Emissions and Emission Reduction from Coal-Fired Power Plants Based on Dual Carbon Targets. Sustainability. 2023; 15(9):7369. https://doi.org/10.3390/su15097369
Chicago/Turabian StyleHou, Haitao, Bo Xie, and Yingying Cheng. 2023. "Analysis of Carbon Emissions and Emission Reduction from Coal-Fired Power Plants Based on Dual Carbon Targets" Sustainability 15, no. 9: 7369. https://doi.org/10.3390/su15097369
Note that from the first issue of 2016, this journal uses article numbers instead of page numbers. See further details here.