
The Future Snow Potential and Snowmelt Runoff of Mesopotamian Water Tower

Department of Civil Engineering, Faculty of Engineering, Eskisehir Technical University, Eskişehir 26555, Türkiye
*
Author to whom correspondence should be addressed.
Sustainability 2023, 15(8), 6646; https://doi.org/10.3390/su15086646
Submission received: 19 March 2023
/
Revised: 10 April 2023
/
Accepted: 11 April 2023
/
Published: 14 April 2023
(This article belongs to the Special Issue The Impact of Climate Change on Future Water Storage)
Abstract
:Mountainous basins are frequently called “natural water towers” because they supply essential water to downstream regions for irrigation, industrial–municipal use, and hydropower generation. The possible implications of climate change on water supplies have gained prominence in recent years, particularly in snow-dominated mountainous basins. The Euphrates River, a snow-fed transboundary river that originates from the Eastern part of Türkiye with several large dam reservoirs downstream, was chosen within this scope. The study reveals the impact of climate change on two snow-dominated headwaters, namely Karasu and Murat, which have a basin area of 41,109 km2. The impact of climate change is assessed across runoff regimes and snow dynamics for future periods (2024–2099). Global Climate Model (GCM) data sets (CNRM-CM5, IPSL-CM5A, EC-EARTH, MPI-ESM-LR, NorESM1-M, HadGEM2-ES) were downscaled by Regional Circulation Models (RCMs), provided from CMIP5 EURO-CORDEX domain for climate projections under RCP4.5 and RCP8.5 scenarios. Future projections of runoff and snow variables are predicted by two conceptual hydrological models, HBV and HEC-HMS. The results indicate a dramatic shrink in snow cover extents (>65%) and snow duration (25%), a decrease in snow water equivalent (>50%), and a timely shift (up to a month) in peak runoff through early spring in the runoff hydrograph for the last future period (2075–2099). The overall assessment shows that operations of downstream water systems should be reconsidered for future changes.
1. Introduction
Streamflow projections for a changing climate are crucial for improved strategic planning and management of water resources, including floods, droughts, sustainable irrigation, and hydropower, especially in highly vulnerable snow-fed regions [1,2,3,4]. Since snow accumulation and ablation are extremely sensitive to air temperature, the impact of atmospheric warming is anticipated to be significant in watersheds dominated by snow [5,6,7,8]. The fundamental effect of warming is a change in hydrological regimes from a regime dominated by snow to a regime dominated by rain [9,10]. Most regions of the Northern Hemisphere that depend on snow are expected to endure growing stress from low snow years [11], and experience changes toward earlier streamflow peaks [12,13].
Mesopotamia has long been a hotspot of agricultural activity and is frequently called the “cradle of civilizations”. This is partly because of the region’s mild climate and the fresh water provided by the Tigris and Euphrates, two significant rivers fed by snowfall. In this water-stressed region, severe droughts and a lack of water security have historically been important reasons for conflict [14,15]. The water resources of the Euphrates–Tigris basin are crucial for hydroelectric power generation, agriculture, and domestic consumption in Türkiye, Syria, Iraq, and Iran. On the other hand, the Middle East, located east of the Mediterranean basin, is one of the geographical areas most sensitive to climate change effects, according to the Intergovernmental Panel on Climate Change’s Fourth Assessment Report [16]. Moreover, research points out that the climate of the Euphrates-Tigris region has changed during recent decades (e.g., [7,17,18,19]). According to numerous global and regional climate modeling studies, the region will experience an absolute temperature increase by the end of the twenty-first century. Depending on the season and the sub-region, the expected variations in precipitation vary in direction and magnitude. Most of the adverse effects of climate change, such as water scarcity and more frequent extreme weather events, such as droughts and excessive rainfall that causes floods, are felt most acutely in the Middle East region [20]. Ref. [21] revealed that changes in precipitation could reduce runoff in Türkiye’s Eastern Anatolian Mountains by up to 25–55% under various scenario models. The snowpack in the southern Turkish highlands will shift because of rising temperatures and altered rainfall patterns. Peak meltwater flows are anticipated to move to earlier months as snowfall and snow water storage decline. Despite conflicting predictions for future droughts, it is agreed upon by numerous researchers that the Mediterranean and the Middle East will experience more extreme droughts in the future [22,23,24]. The likelihood of a rise in the frequency and severity of floods in the Euphrates–Tigris basin is another significant effect of climate change. A more intense runoff will result from changes in rainfall variability, and when combined with rising snowmelt, more frequent and more extreme floods are to be anticipated. This might increase flood-related fatalities and significantly harm critical infrastructure and ecosystems [25].
In particular, for large-scale climate change impact studies, global circulation models (GCMs) can be crucial to understanding future global climatic changes. However, due to their low spatial resolution, GCMs only offer limited information at sub-regional scales. A common strategy for obtaining fine-scale regional information is to use a regional climate model (RCM) to dynamically downscale GCM results. The RCMs have been employed more frequently in recent years to assess the effects of climate change under various emissions scenarios. However, because of the high processing costs associated with their use, obtaining an ensemble preferred in climate change studies is frequently challenging since it enables a more thorough investigation of uncertainties.
The most widely used approach is based on the daily simulation of hydrological processes driving a validated hydrological model by Global Climate Model-based climate projections. Choosing an adequate hydrological model for high-altitude places where runoff is influenced by rainfall and melting can be challenging. Due to limited data and constraints with algorithms, hydrological models performed less effectively in high-altitude regions. Therefore, applying them in these areas with adequate accuracy and incorporating climate projection components is difficult. The accuracy of climate models directly affects the hydrological model results, but the uncertainty in GCM is massive, especially due to the low accuracy of precipitation. On the other hand, in snow-dominated mountainous areas, several issues, such as an insufficient observational network and the difficulty of maintaining the current hydro-meteorological stations, have an impact on the quality and quantity of data that may be used in modeling. Many of these shortcomings make it difficult to conduct studies on the hydro-climatology of the large Euphrates and Tigris basin.
According to the literature survey, early studies for the region include the climate change outputs of CMIP3 with a relatively coarse climate data set (GCM) (e.g., [2]); RCM downscaled climate data with limited data sets (e.g., [21,26,27,28]). In addition, only a few studies include hydrological model applications on the basin scale (e.g., [26,28]).
Previous studies on hydrological response to climate change in different regions of the world with high snow potential have been conducted with rather limited climate data sets (one or two dynamically downscaled GCP models) integrated into a model (e.g., [29,30,31,32,33]). Only over the last few years studies on the hydrological impacts of climate change for various regions captured a broad ensemble of climate projections for several RCM downscaled GCM data sets (e.g., [34]) with a single hydrological model application (e.g., [34,35,36,37]) or multi hydrological model applications [38] or statistical analysis without any hydrological model application [39]. These studies utilized SWAT and its versions (GE-SWAT, ArcSWAT) as a hydrological model. Moreover, research on climate change has been conducted for specific topics such as low flow assessment [40], eco-hydrological impact assessment [41], sediment and nutrient loss assessment [42] or improvement of GCM with a new RCM for hydrological impact assessment (e.g., [43,44]).
Even though climate change analyses work with alternative and sufficient climate data sets, enabling an ensemble of climate projections with adequate resolution and representative hydrological models for various snow-fed regions of the world, as stated above, these are mainly focused on basins with complete data. To the best of our knowledge, no research has been conducted in the Euphrates basin headwaters to date to quantify the details of the water balance elements under different climate change scenarios and hydrological models on a basin scale. Therefore, this study is conducted to fill these gaps and provide detailed insights into the impact of climate change on the magnitude and timing of runoff and snowmelt signatures for the region. This work uses bias correction techniques and hydrological models to investigate the effects of several GCMs downscaled by RCMs on high-altitude, snow-fed, sparsely gauged headwater basins. This study aims to quantify the change that climate variables (precipitation and temperature) and major hydrological elements (snow cover area, snow water equivalent, snow duration, and streamflow) might experience under different climate change scenarios in the Upper Euphrates basin. We implemented two different and widely used hydrological models, HEC-HMS and HBV, for projecting runoff and snow simulations. Because snowmelt is essential to downstream water supplies, extensive evaluations of temporal changes are needed for sound ascription relating hydrological changes to climatic changes to build rapid and efficient climate adaptation strategies.
2. Materials and Methods
2.1. Study Area and Observed Data Set
Tigris–Euphrates River system in southwest Asia, consisting of the Euphrates and Tigris rivers, is one of the birthplaces of civilization in Mesopotamia, “the land between two rivers”, and it is arguably the most significant natural resource in the Middle East. The Euphrates and Tigris are the two biggest transboundary rivers in Asia. The Euphrates River rises in eastern Türkiye and feeds the southeast of Türkiye, much of northern and eastern Syria, and the Mesopotamian lowlands of Iraq. Türkiye’s largest drainage area (127,304 km2) is the Euphrates basin, which includes most of Türkiye’s dam reservoirs and accounts for 17% of the total water potential. Therefore, it is crucial to estimate the impact of climate change on the amount and timing of the runoff in the upstream Euphrates.
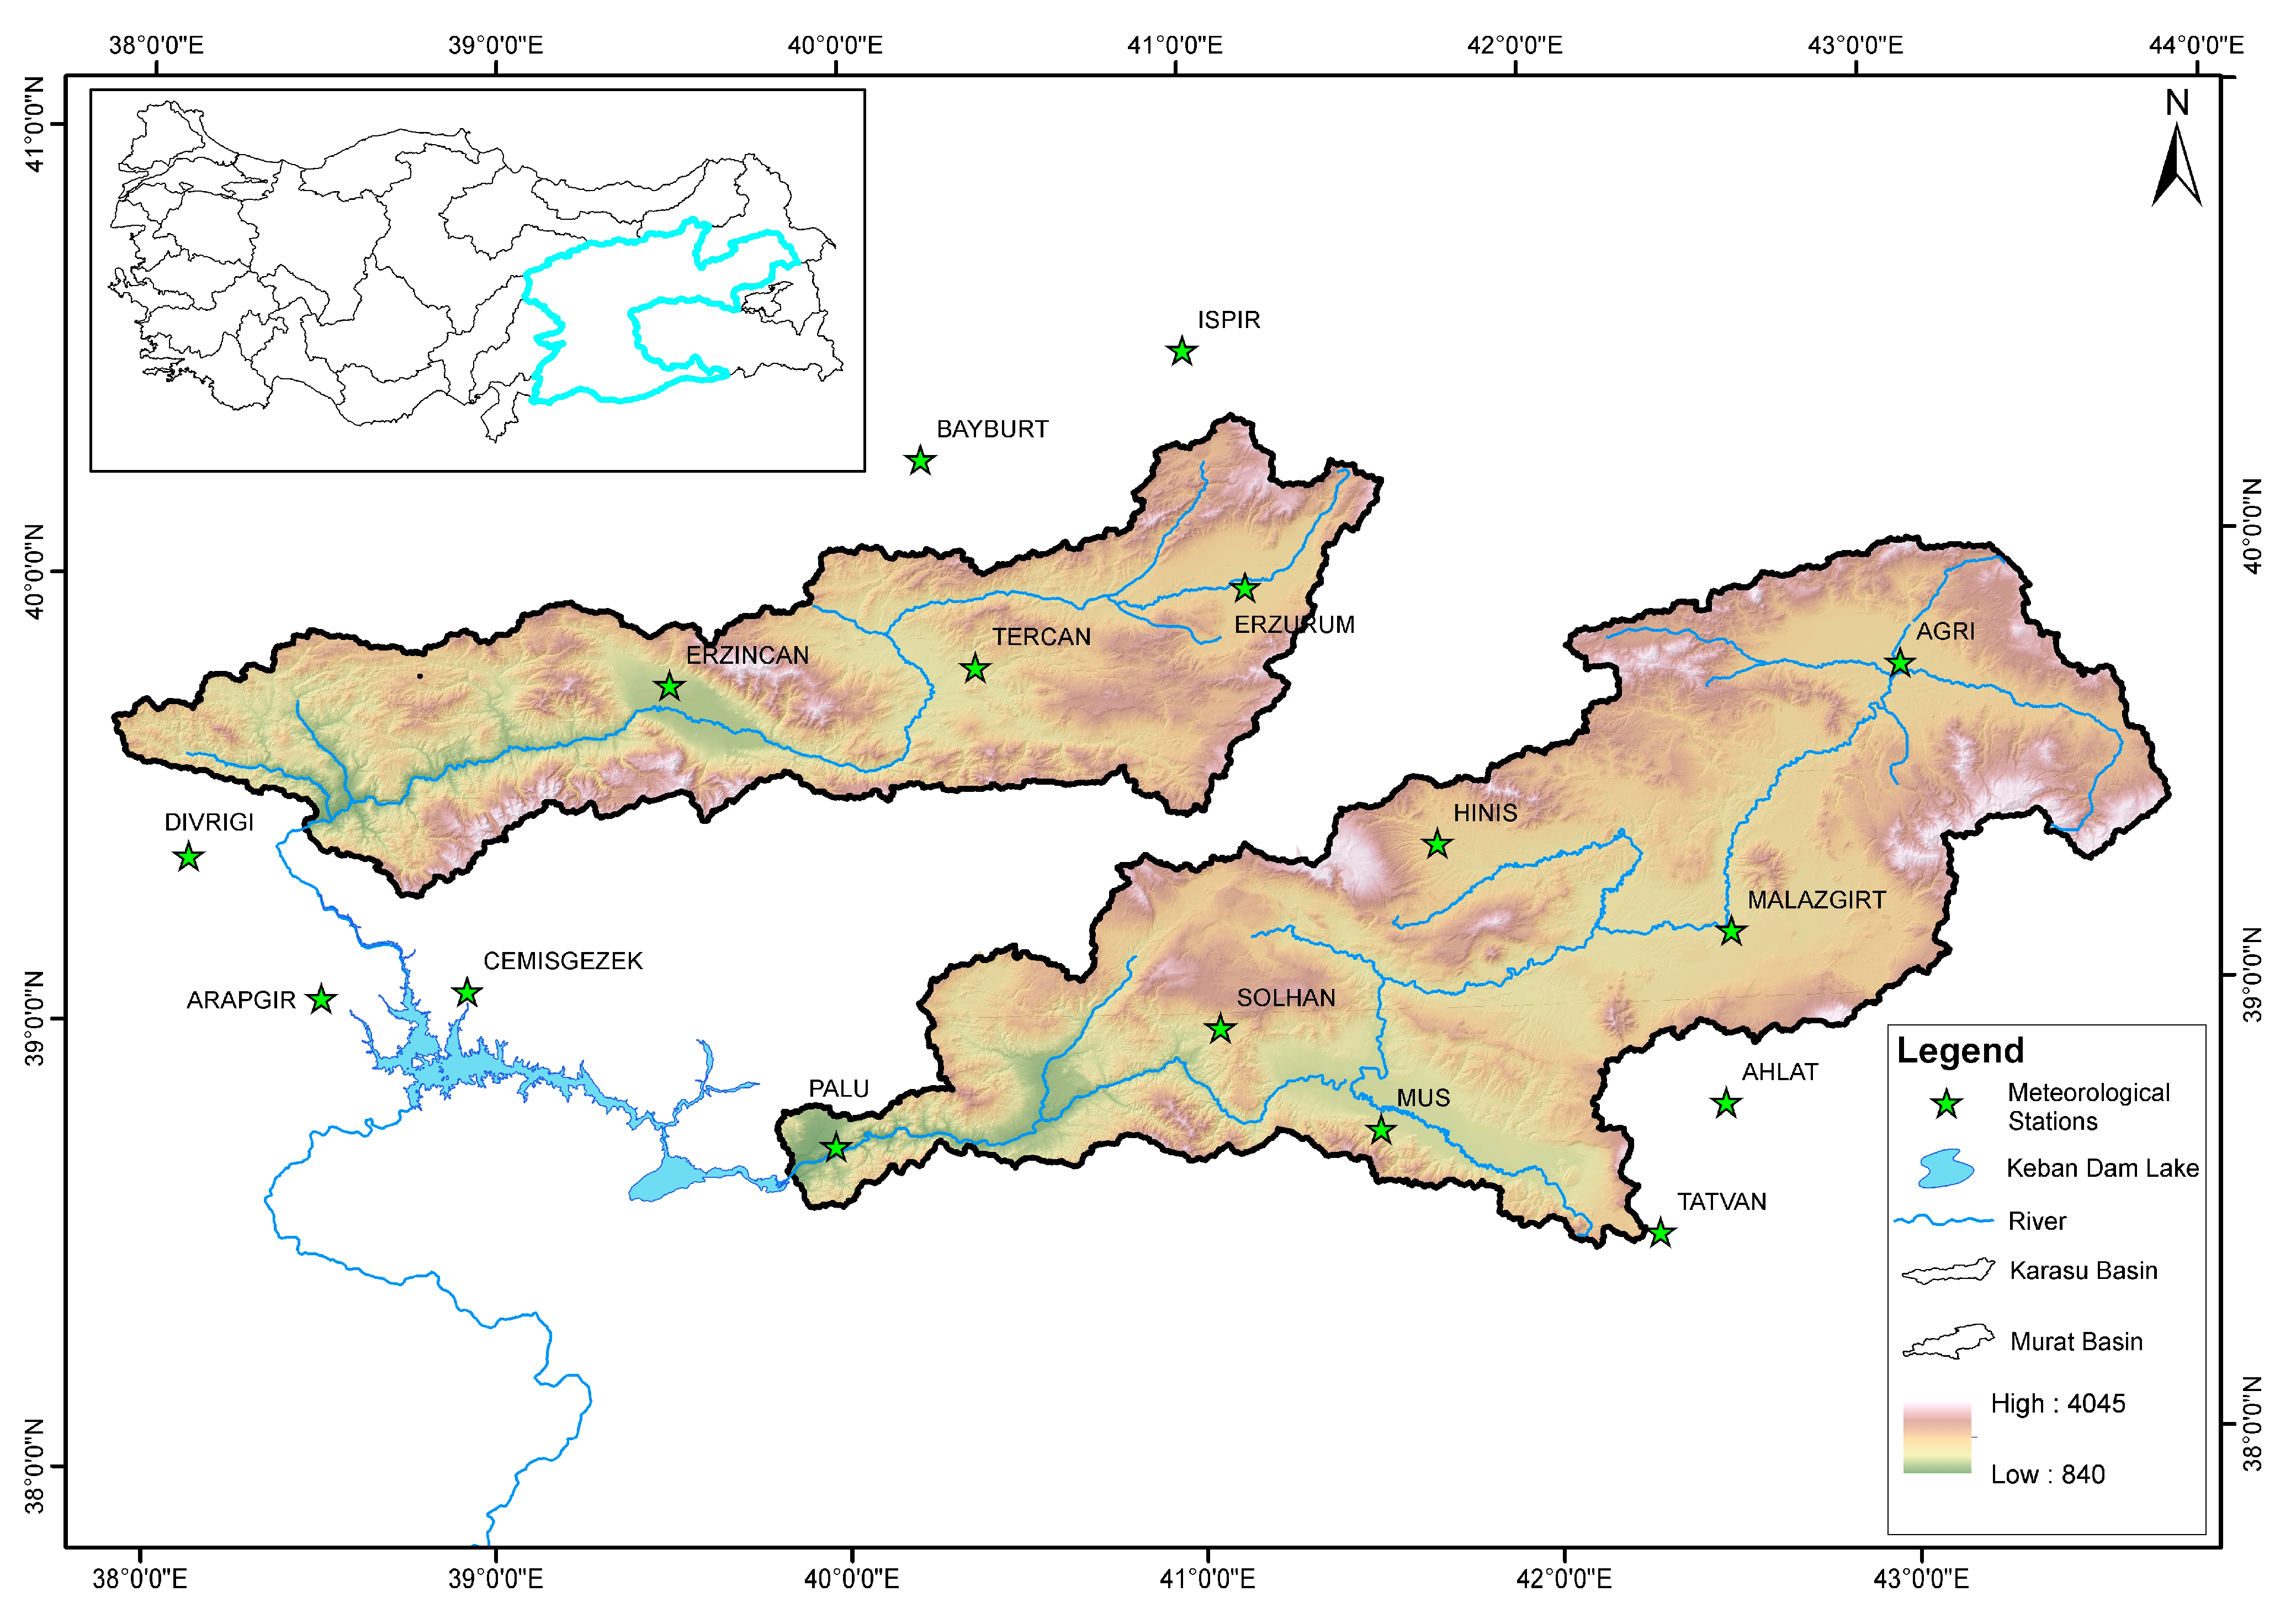
Two upstream snow-dominated upper catchments are selected as the pilot basins (Figure 1), Karasu Basin (15,330 km2) and Murat Basin (25,779 km2), with elevation ranges between 860 and 3565 m and 840 and 4045 m, respectively. The primary land cover types are pasture, agriculture, and bare ground. The study region is divided into several elevation zones to assess snow data and for hydrological modeling. According to monthly fractions from streamflow gauging stations in eastern Anatolia’s headwaters of the Euphrates, 60–80% of its total yearly flow occurs between March and June, with an early and late peak in April and May, respectively.
The test basins have been designated as the pilot basins for a number of national and international programs, and numerous studies on snow monitoring (in situ, satellite data), snow hydrology, and streamflow forecasting applications have been carried out and are still being conducted [45,46,47]. Even though the area is particularly significant due to its heterogeneous, complex topography and severe weather, it still needs to be a more-studied area of the world, making it challenging to determine the characteristics of snow in this mountainous area.
Meteorological data recorded at 16 stations in and around the basins (Figure 1) are used for bias correction of climate projection data and hydrological model application. Daily total precipitation and daily average temperature values are implemented as the main model forcings during the calibration and validation processes. Moreover, observed monthly total evaporation values are used for potential evaporation calculations for future projections. Temperature values are assigned to the hypsometric mean elevation, and the lapse rate is used to calculate the temperature values corresponding to elevation zones.
2.2. Global Climate Models (GCMs) Data Set
The EURO-CORDEX platform offers historical simulations and predictions of upcoming changes in temperature and precipitation [48]. This study uses the following GCM data sets (Table 1): CNRM-CM5, EC-EARTH, HadGEM2-ES, IPSL-CM5A-MR, MPI-ESM-LR, and NorESM1-M under Representative Concentration Pathway (RCP4.5 and RCP8.5) scenarios. A set of high-resolution inputs are downloaded using data generated from the Regional Climate Model (RCM) RCA4, RACMO22E, and HIRHAM5 with 11.5 km spatial resolution. The linear scaling approach is used for bias correction for the projected daily average temperature and total precipitation data sets. Stationary climate simulations are used for the reference (1970–2005) and future (2024–2099) periods. Three time periods are utilized to analyze the future projection period: (1st period: 2024–2049, 2nd period: 2050–2074, and 3rd period: 2075–2099). Climate data sets employed within the study are provided in Table 1 with available data time intervals and institution providing data sets.
Bias Correction (BC) is applied to temperature and precipitation projections of RCM downscaled GCM data sets. Despite the debatable assumptions on which the different bias correction approaches rely, bias correction methods influence the magnitude of projected river streamflow. On the other hand, concerning the study of the relative contributions of various sources of uncertainty, the relative effect of the BC approaches compared with the overall GCM-RCM modeling chain is generally minor [49]. Since the best results are achieved with the linear scaling method for bias correction, the results of this method are used in further analysis.
2.3. Evaporation Projections
Changes in rainfall patterns caused by climate and temperature changes might increase evaporation losses. On the other hand, measuring daily pan evaporation precisely and consistently over extended periods is difficult. In addition, projected evaporation values are essential together with projected precipitation and temperature data for climate change research. Therefore, evaporation projections used in hydrological modeling are calculated with explicit modeling concerning the fundamental relation between evaporation and temperature. A multi-layer perceptron (MLP) model was employed in this study to estimate projected monthly evaporation values. Observed data sets were used to configure and test the model, then projected climate data were used to predict future evaporation projections.
2.4. Hydrological Models
Two conceptual models are employed for the hydrological implementation of the rainfall/snowmelt runoff relationship. The structure and parametrization of models are explained below. At the end of the model calibration and validation step, the projected runoff, snow water equivalent, and corresponding snow cover are assessed for future climate scenarios compared to the reference period. The calibration and validation periods are selected as 1980–1999 and 2000–2011 water years, respectively. The reference period used is 1970–2005, and projected values are calculated for 2024–2099 water years.
2.4.1. HBV-Light Model
The Swedish Meteorological and Hydrological Institute (SMHI) developed HBV in 1972 as a conceptual and continuous hydrological model for forecasting reservoir input and flood warnings [50]. There are various HBV versions applied around the world. The HBV-Light version created by Seibert and Vis (2012) [51] was utilized in this study since it offers a user-friendly graphical interface and an automatic calibration opportunity. The HBV model distributes precipitation, temperature, and potential evapotranspiration inputs based on elevation and vegetation zones. The model calculates snow and soil moisture layers based on zones and runoff and routing processes for the entire basin to mimic daily flow. This version of the model provides basin daily average snow water equivalent and snow-covered area values based on zones as snow states.
2.4.2. HEC-HMS Model
HEC-HMS (Hydrologic Modeling System) model was developed by the US Army Corps of Engineers Hydrologic Engineering Center (USACE) and is designed to simulate the rainfall-runoff process of dendritic watershed systems as continuous or event-based and to be applicable in a wide range of geographic areas [52]. Appropriate methods should be carefully chosen to transform precipitation into runoff within the model. In this study, soil moisture accounting (SMA), linear reservoir, and Clark unit hydrograph methods are chosen, respectively, as loss, baseflow, and transform methods. The SMA module considers continuous situation-based soil moisture variation, which is carried out by calculating the amount of water stored in and moving through vegetation, soil surface profile, and groundwater layers. Like in HBV, model inputs are precipitation, temperature, and potential evapotranspiration. An automated model calibration procedure was adapted to the model via MATLAB and used in the calibration step of model parameters. The model computes surface runoff, groundwater flow, losses, soil moisture, and snow water equivalent over the entire basin. A transfer function calcifies snow-covered areas based on SWE values simulated for each elevation zone.
2.5. Performance Assessment
Nash–Sutcliffe Efficiency (NSE, Equation (1)), Killing–Gupta Efficiency (KGE, Equation (2)), Percent Bias (PBIAS, Equation (3)), Pearson correlation coefficient (r, Equation (4)) and deviation of runoff volumes (DRV, Equation (5)) are used to test hydrological model performances:
where is observation, is modeled value, is average observation, is average modeled value, is the standard deviation of the observed data, is the standard deviation of the modeled data, is the number of data sets.
Contingency tables evaluate the consistency of the projected precipitation data in the reference period by using two main indicators, i.e., Probability of Detection (POD) (Equation (6)) and False Alarm Rate (FAR) (Equation (7)). Four different possibilities are categorized: “a” (detected by both ground and GCM), “b” (detected by GCM only), “c” (detected by ground only) and “d” (no detection in both).
3. Results
The study is conducted under three main topics: analyses of GCM data sets in reference and future periods, hydrological model configurations, and future projections and assessments.
3.1. Evaluation of Global Climate Models (GCMs) Data with Gauge Data in Reference Period
The gauge readings for the reference period are used to compare the performances of the raw and bias-corrected climate data sets. Temperature is one of the crucial variables and the most sensitive one in climate science. For temperature, the consistency of raw projected values and observed values is high in the reference period. For all data sets (except for HadGEM2-ES), Pearson-R values provided on monthly average analysis in both basins are 0.93–0.96 for raw data sets and increased to 0.96–0.97 with the bias correction application (Table 2). For precipitation, the consistency of projected and observed values is rather low in the reference period for all data sets. Pearson-R values provided by monthly average analysis in both basins are 0.13–0.39 and increased to 0.31–0.49 with bias correction (except for HadGEM2-ES) (Table 2).
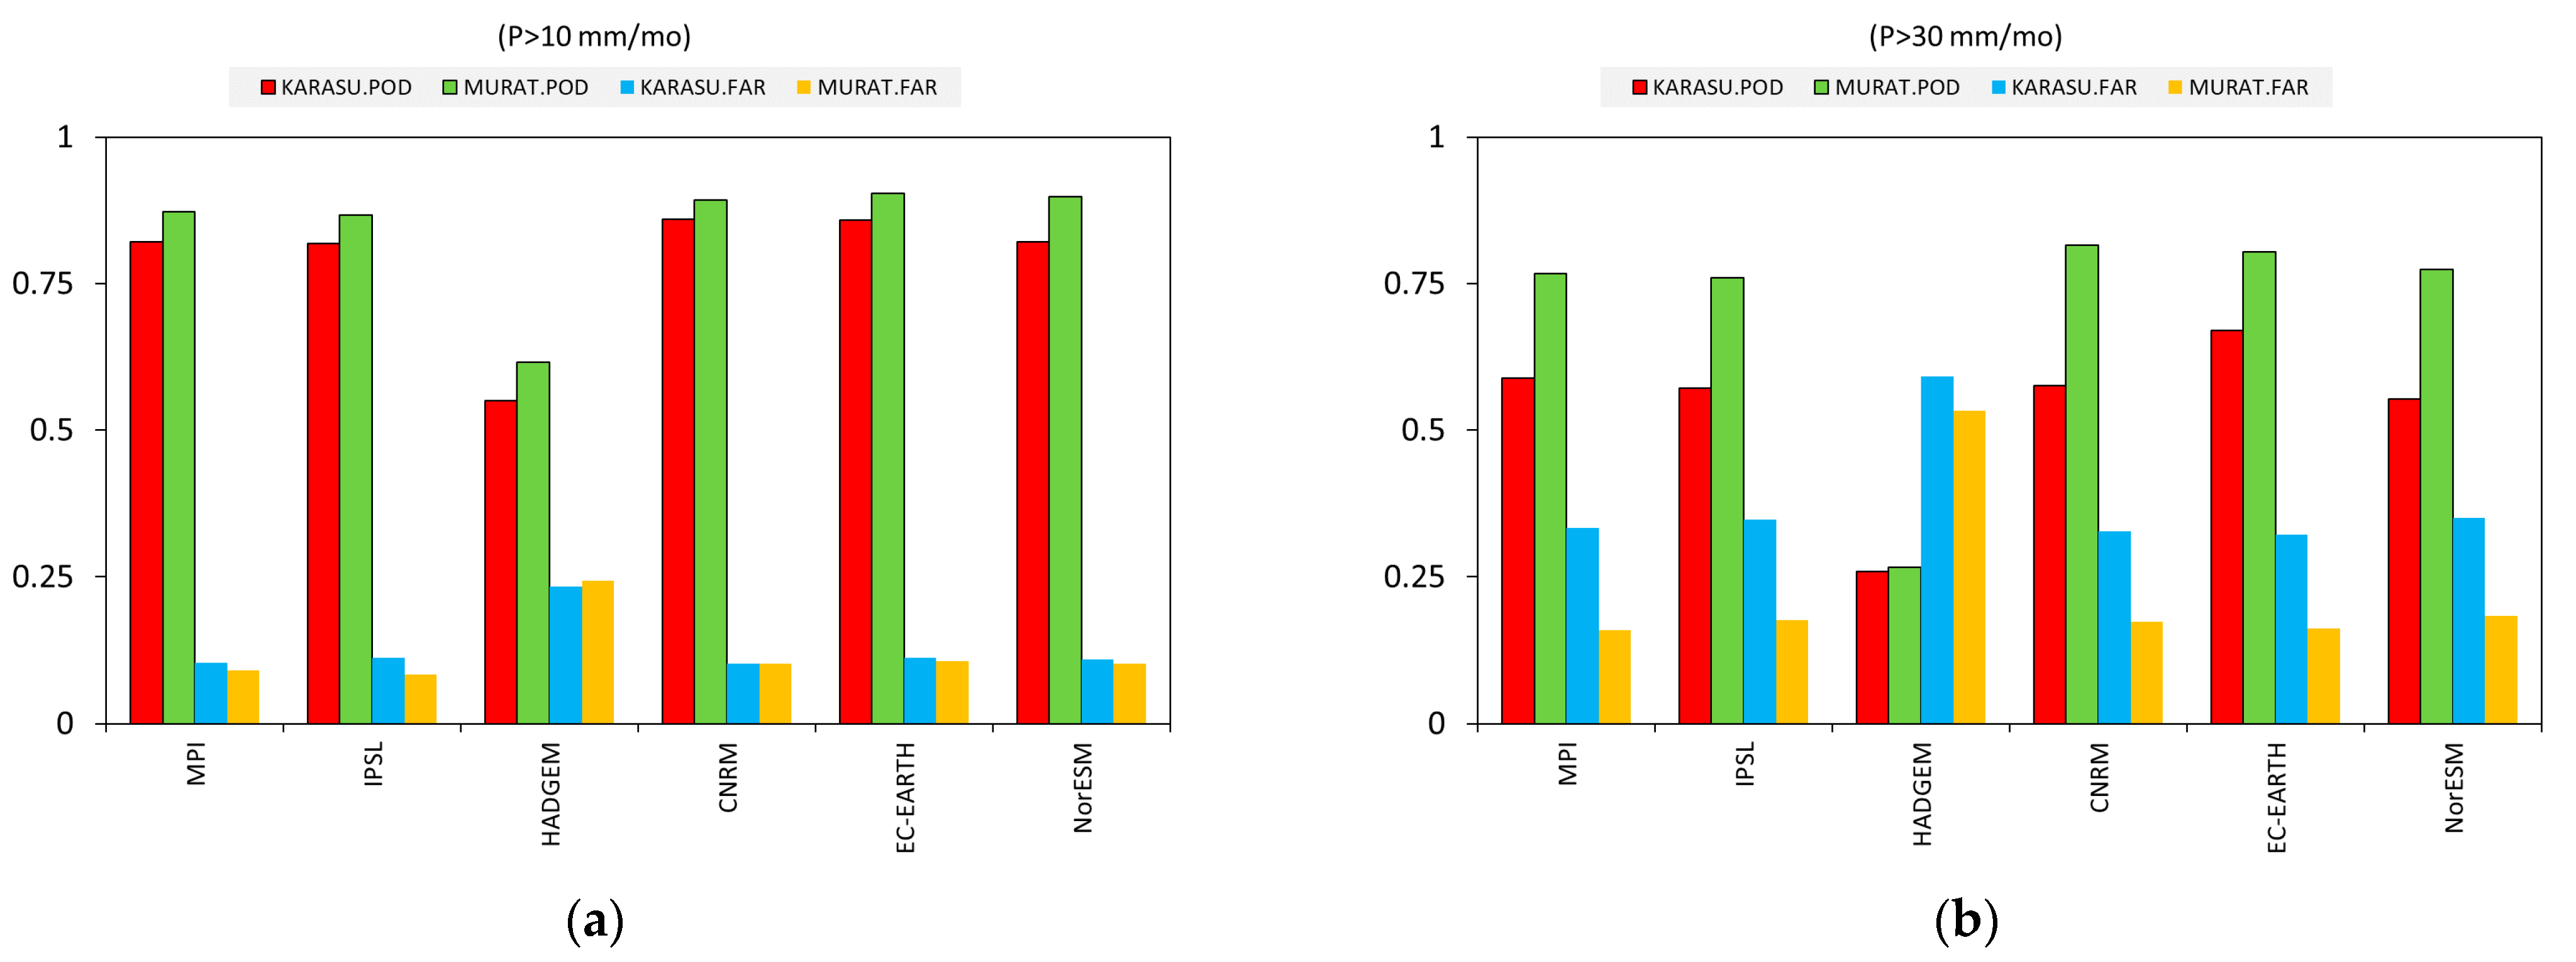
Figure 2 shows each basin’s POD and FAR values along with the monthly (mo) threshold precipitation amounts. Following the bias adjustment, POD values increased for both products. For the precipitation amounts higher than the 10 mm threshold, POD values are as high as 0.86 and 0.90 for Karasu and Murat basins, respectively. As expected, POD values are relatively lower for a higher precipitation threshold of 30 mm; values are 0.67 and 0.81 for the same basins, respectively. Precipitation projections provide slightly better results for Murat basin. FAR values significantly increase with extreme precipitation amounts in Karasu, which differs from those of Murat.
Except for HadGEM2-ES, all GCM findings show comparable performance. This GCM exhibited an outlier result in both Pearson analysis and accuracy assessment, and it even produced negative relationships in precipitation data sets. In addition, HadGEM2-ES temperature data sets have much lower consistency. Therefore, HadGEM2-ES is not included in further analysis.
The relatively high consistency in temperature during the reference period is satisfactory for further hydrological evaluations in these mountainous basins. The relatively lower consistency of precipitation was expected due to the rather complex behavior of precipitation.
3.2. Analysis of Future Climate Data
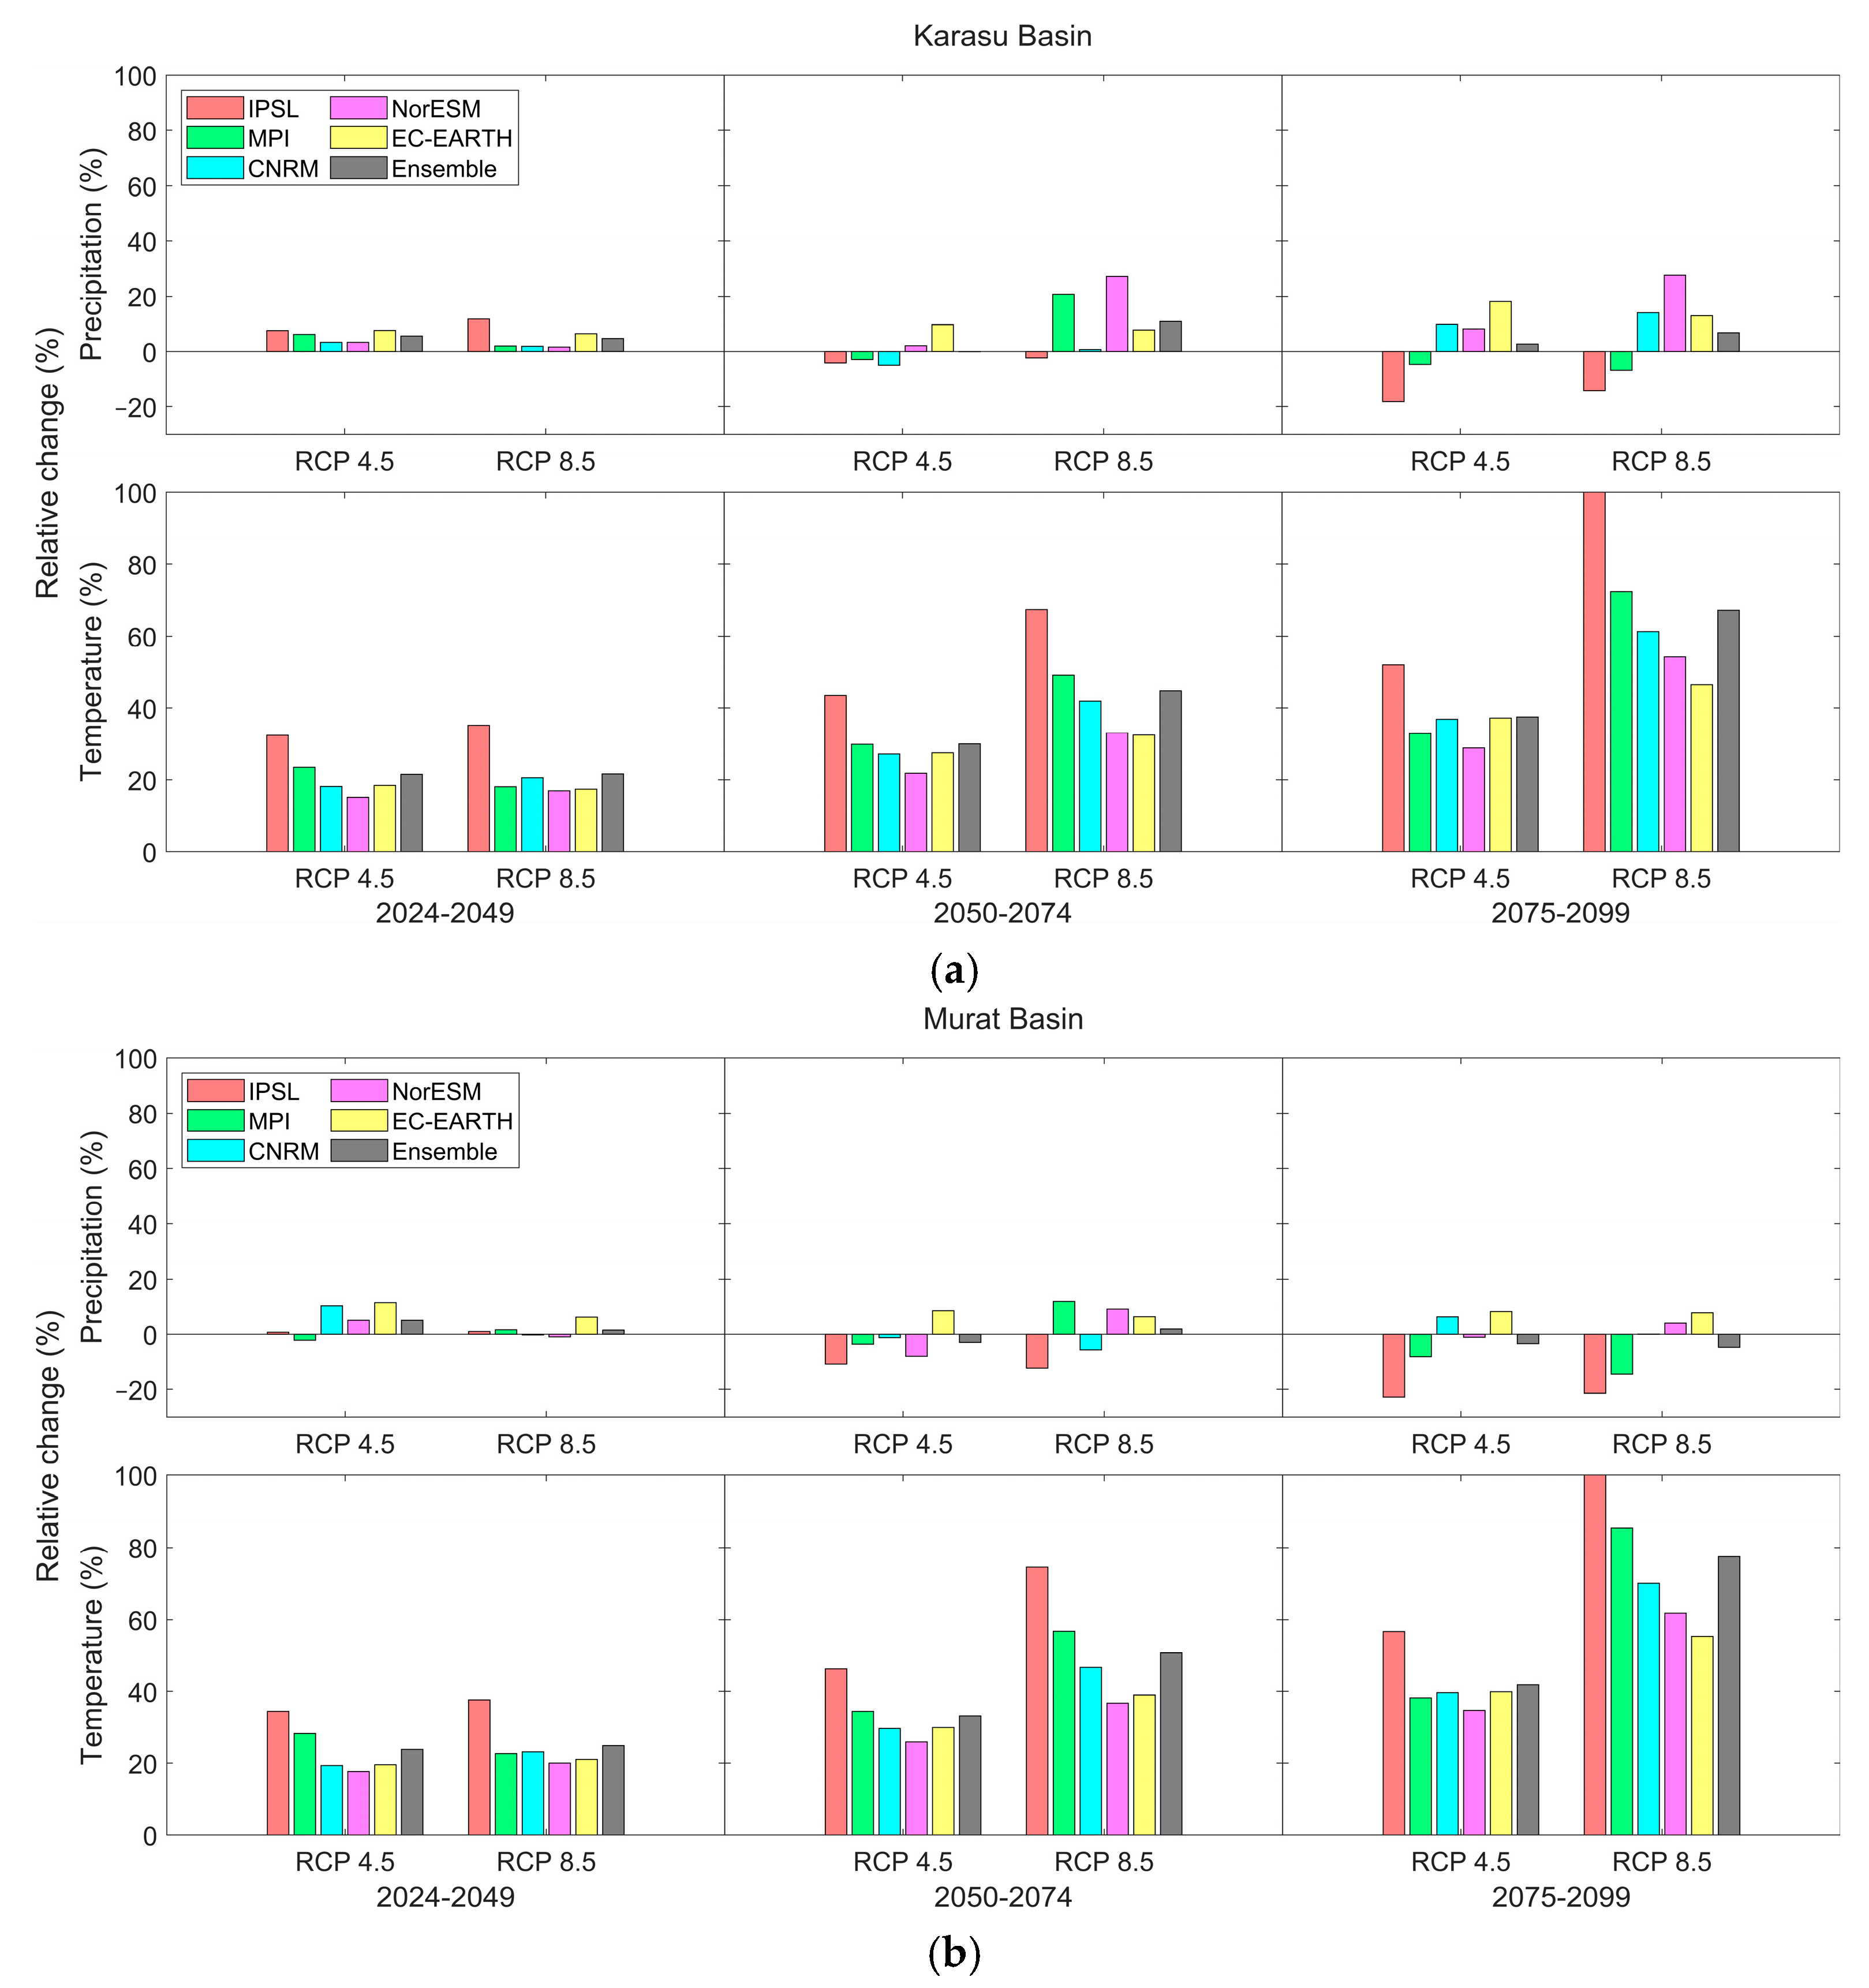
GCM data under RCP4.5 and RCP8.5 scenarios are used to analyze projected precipitation and temperature for the Karasu and Murat basins. The future timeline is divided into three sections, and each timeline period has 25 years of data to compare to the reference period. Figure 3 displays basin-wide relative changes in projected precipitation and temperature for five GCMs and an ensemble of them.
The basin-wide ensemble mean projected precipitation is increasing by 5–10% compared to the reference for all future periods under RCP8.5- simulations in Karasu basin. Compared to RCP8.5 models, RCP4.5 simulations resulted in a small (<5%) or no change in precipitation, according to the ensemble projection. In Murat basin, the results are more consistent in terms of RCP4.5 and 8.5 scenarios, indicating a slight increase (<5%) in 2025s and a decrease (<5%) in 2075s. For the last two periods, NorESM1-M (increase) and IPSL-CM5A-MR (decrease) show a significant change with respect to the reference period for Karasu and Murat, respectively.
In this study, all RCM downscaled GCMs scenarios show increased temperatures. The temperature rise is progressive for all GCMs scenarios over time (Figure 3). On most occasions, the most considerable basin-wide temperature rise was detected for IPSL in contrast to others in both basins; nonetheless, a significant rise was observed during the third future period. Although both RCPs demonstrate an increase in temperature in the future, RCP8.5 reaches a more tremendous increase (around 72%) than RCP4.5 (around 40%) for both basins in the third future period. The temperature anomaly is expected to be 2–3.4 °C (highest for the third future period) for RCP4.5 and 2–6.5 °C (highest for the third future period) for RCP8.5 for both basins. Concerning this region’s hydrological system, an increase in temperature will have significant implications for snow accumulation and melting. A significant increase in temperature could eventually diminish the occurrence of solid rainfall during winter and, as a result, reduce the snow cover area in the basin, causing a decrease in discharge during peak demand. Furthermore, rising temperatures cause early or rapid snowmelt runoff generation, particularly in high-altitude zones of the basin, resulting in the contraction of snow area and early peak discharge.
Since the projected evaporation values are calculated based on the projected temperature data set using MLP model (R = 0.87 for training and testing), the relative change in evaporation is also increasing through the third future period with increasing temperatures. The relative change in evaporation with respect to the reference period is between 15 and 40% (2024–2099) under RCP4.5 scenario for both basins; however, the change further rises to 20–100% (2024–2099) under RCP8.5 scenario with significant increase in the temperatures in the third future period. The highest increase in evaporation occurs in June and July when temperatures are highest. Relatively lower values are observed in the Murat basin compared to the Karasu basin.
3.3. Analysis of Future Runoff
HBV and HEC-HMS, the conceptual daily hydrological models, are calibrated and validated in Karasu and Murat basins for 1980–2011. While both model configurations perform correctly, the HEC-HMS model has slightly better results in Karasu basin in terms of KGE, PBAIS, and DRV. On the other hand, the HBV model has a better model efficiency for the Murat basin, as shown in Table 3. Hydrological model performances are classified as very good according to the performance criteria provided by [53] (Very Good for 0.75 < NSE < 1.00) for both models and basins (Table 3). Nevertheless, both models show acceptable and reliable performances and are used for impact assessment; therefore, climate projections are incorporated into both models to project runoff and snow states for future realizations.
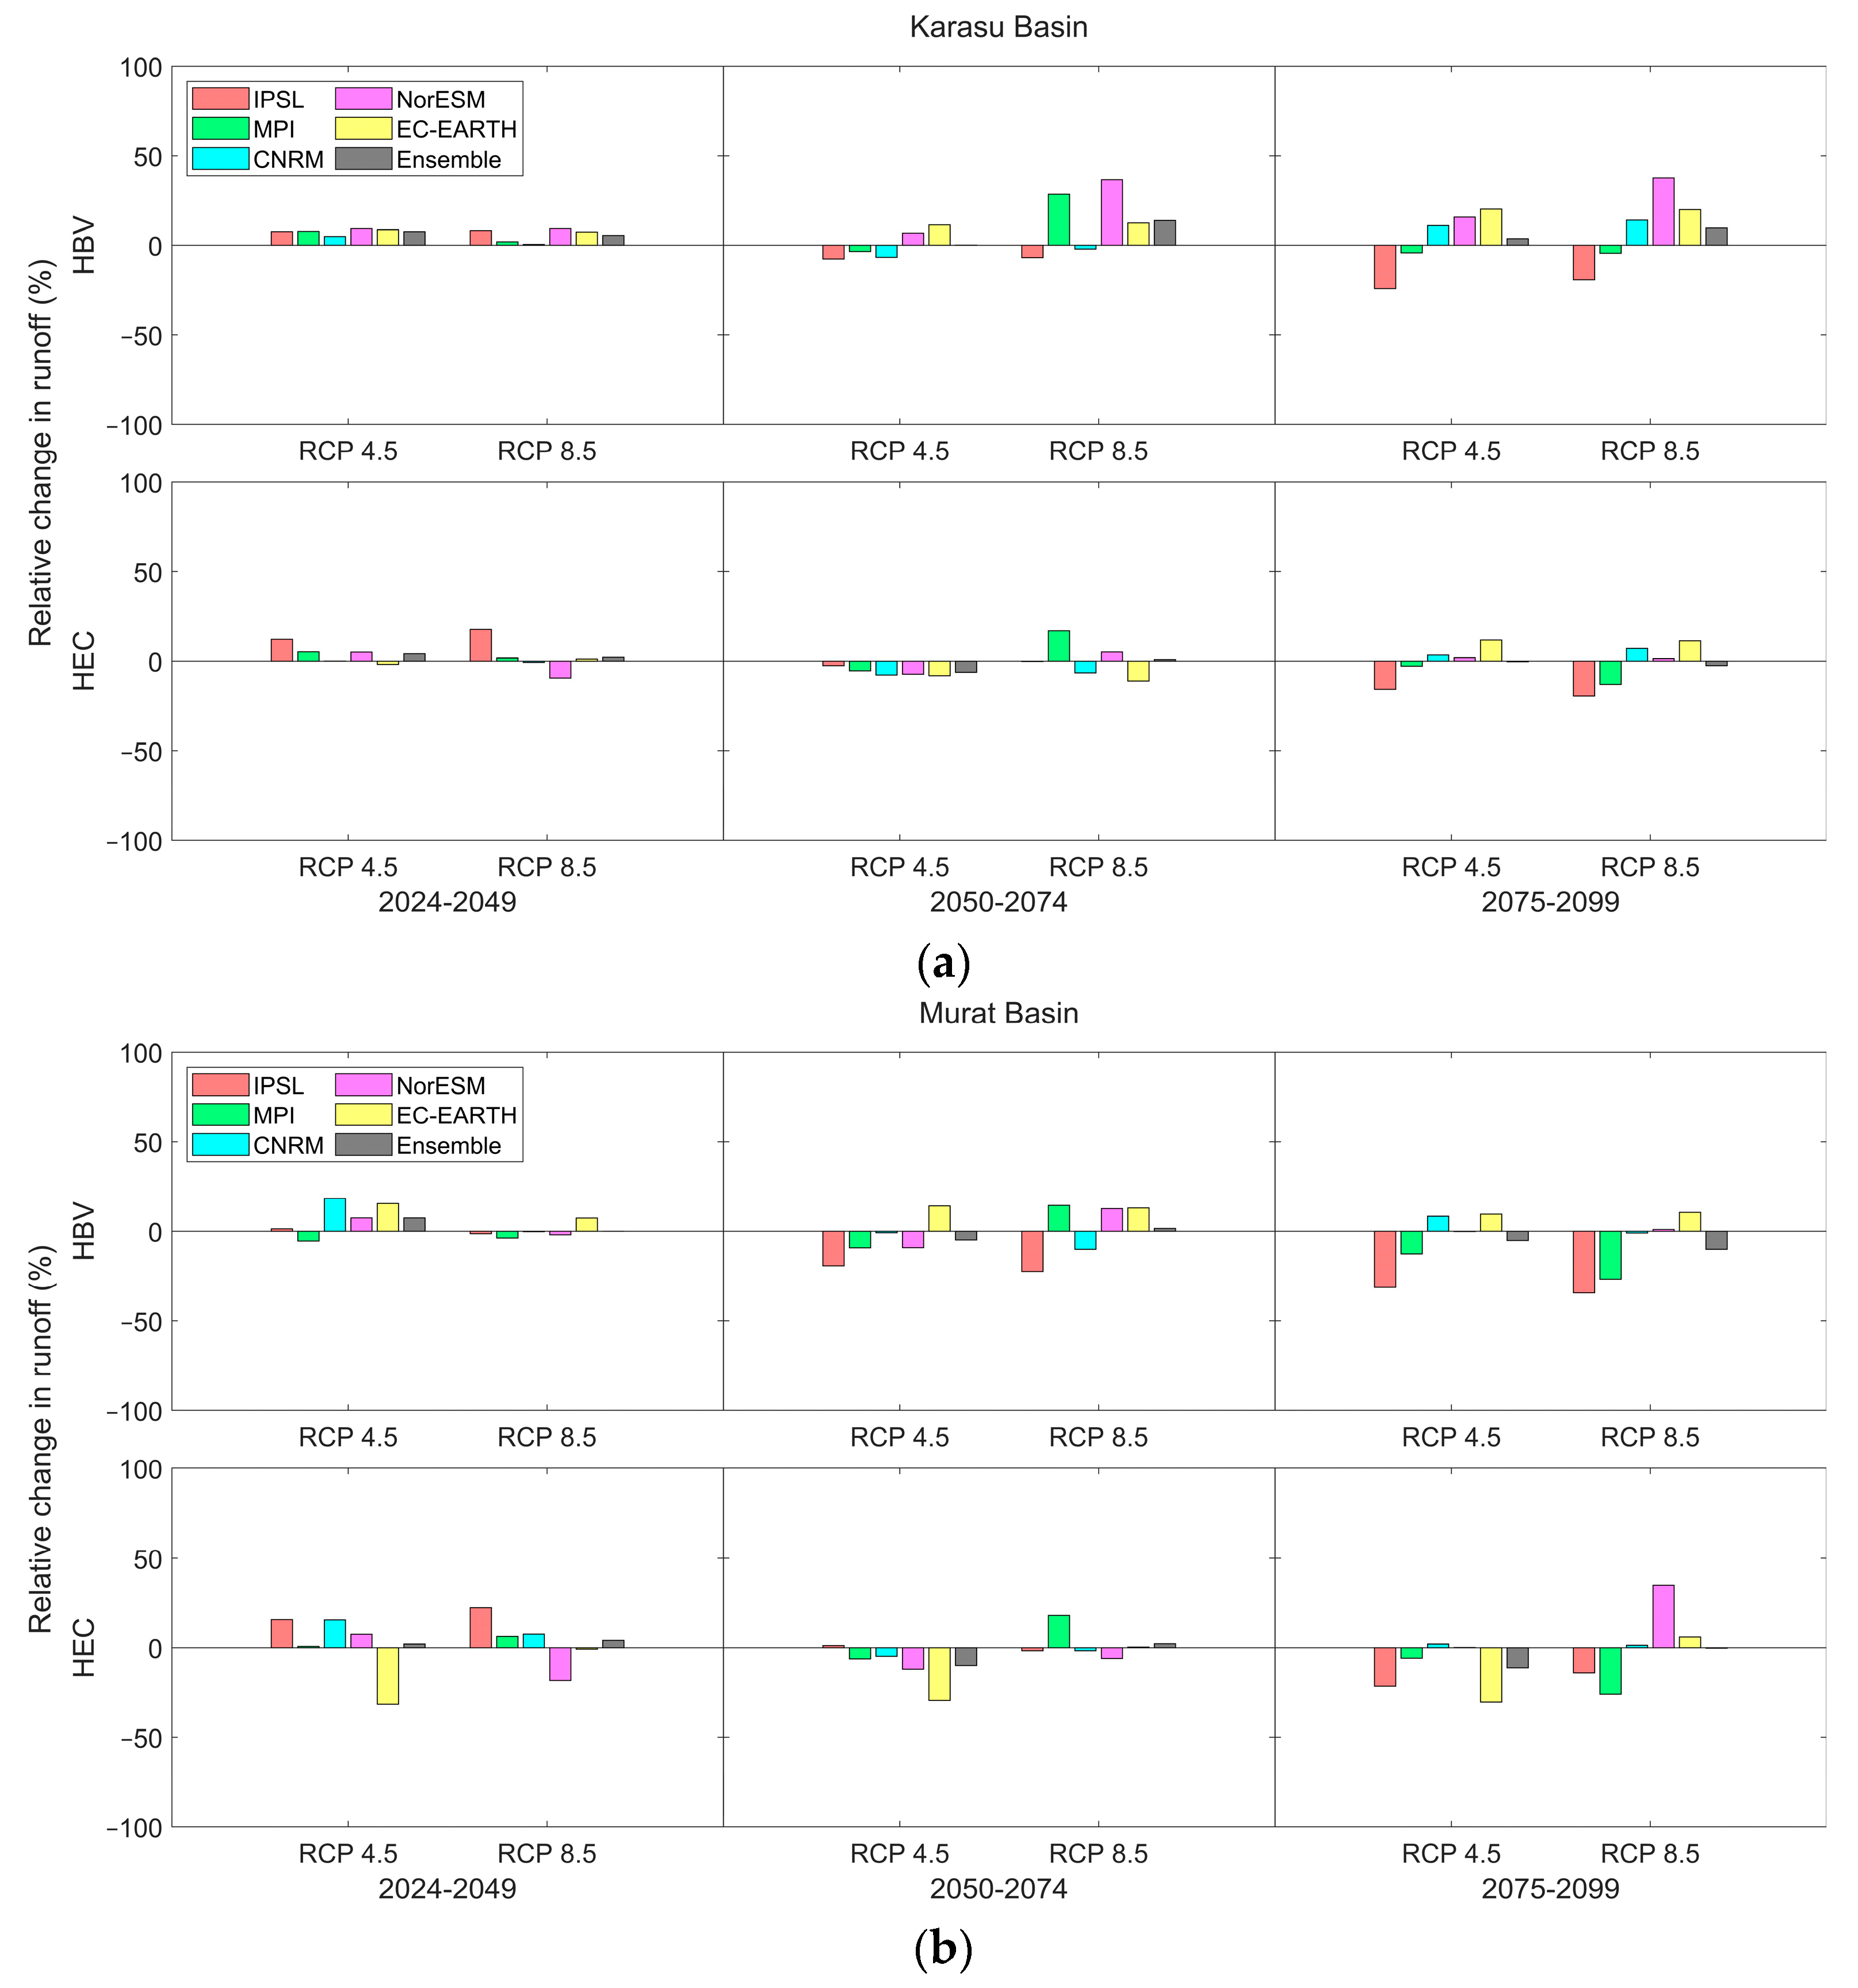
Several water balance components can influence the discharge of a river. Two conceptual hydrological models with different model structures are used to represent these components with reduced uncertainty. Whenever projected climate data is provided to the HBV model to produce runoff projections, the mean runoff at the Karasu basin’s outlet is predicted to rise in the future under both RCP scenarios (Figure 4a). The increase in discharge is expected to be mild and moderate under RCP4.5 and 8.5, respectively, for the third future period. Under RCP4.5 and RCP8.5, the maximum rise would be 3.7% and 9.6%, respectively, in the third future period for the projected ensemble mean runoff (Figure 4a). On the other hand, the ensemble runoff projection produced by HEC-HMS shows almost no change for RCP4.5 and a slight decrease (2.5%) under RCP8.5 for the same basin for the third future period. The overall ensemble for all GCPs and models insists on an increase for the mean runoff in the third future period, on average, of 2.6% for Karasu basin.
For Murat basin, both models indicate a decrease in ensemble runoff for the third future period under both scenarios (Figure 4b). Rather significant change is indicated by HEC-HMS (−11.2%) for RCP4.5 and by HBV (−10.1%) for RCP8.5. The overall ensemble for all GCPs and models insists on a reduction in the third future period, on average, of 6.7%.
Generally, IPSL-CM5A-MR depicts a significant decrease, and NorESM1-M demonstrates a significant increase in the projected mean runoff for the third future period, which is expected concerning the projected precipitation data in Figure 3.
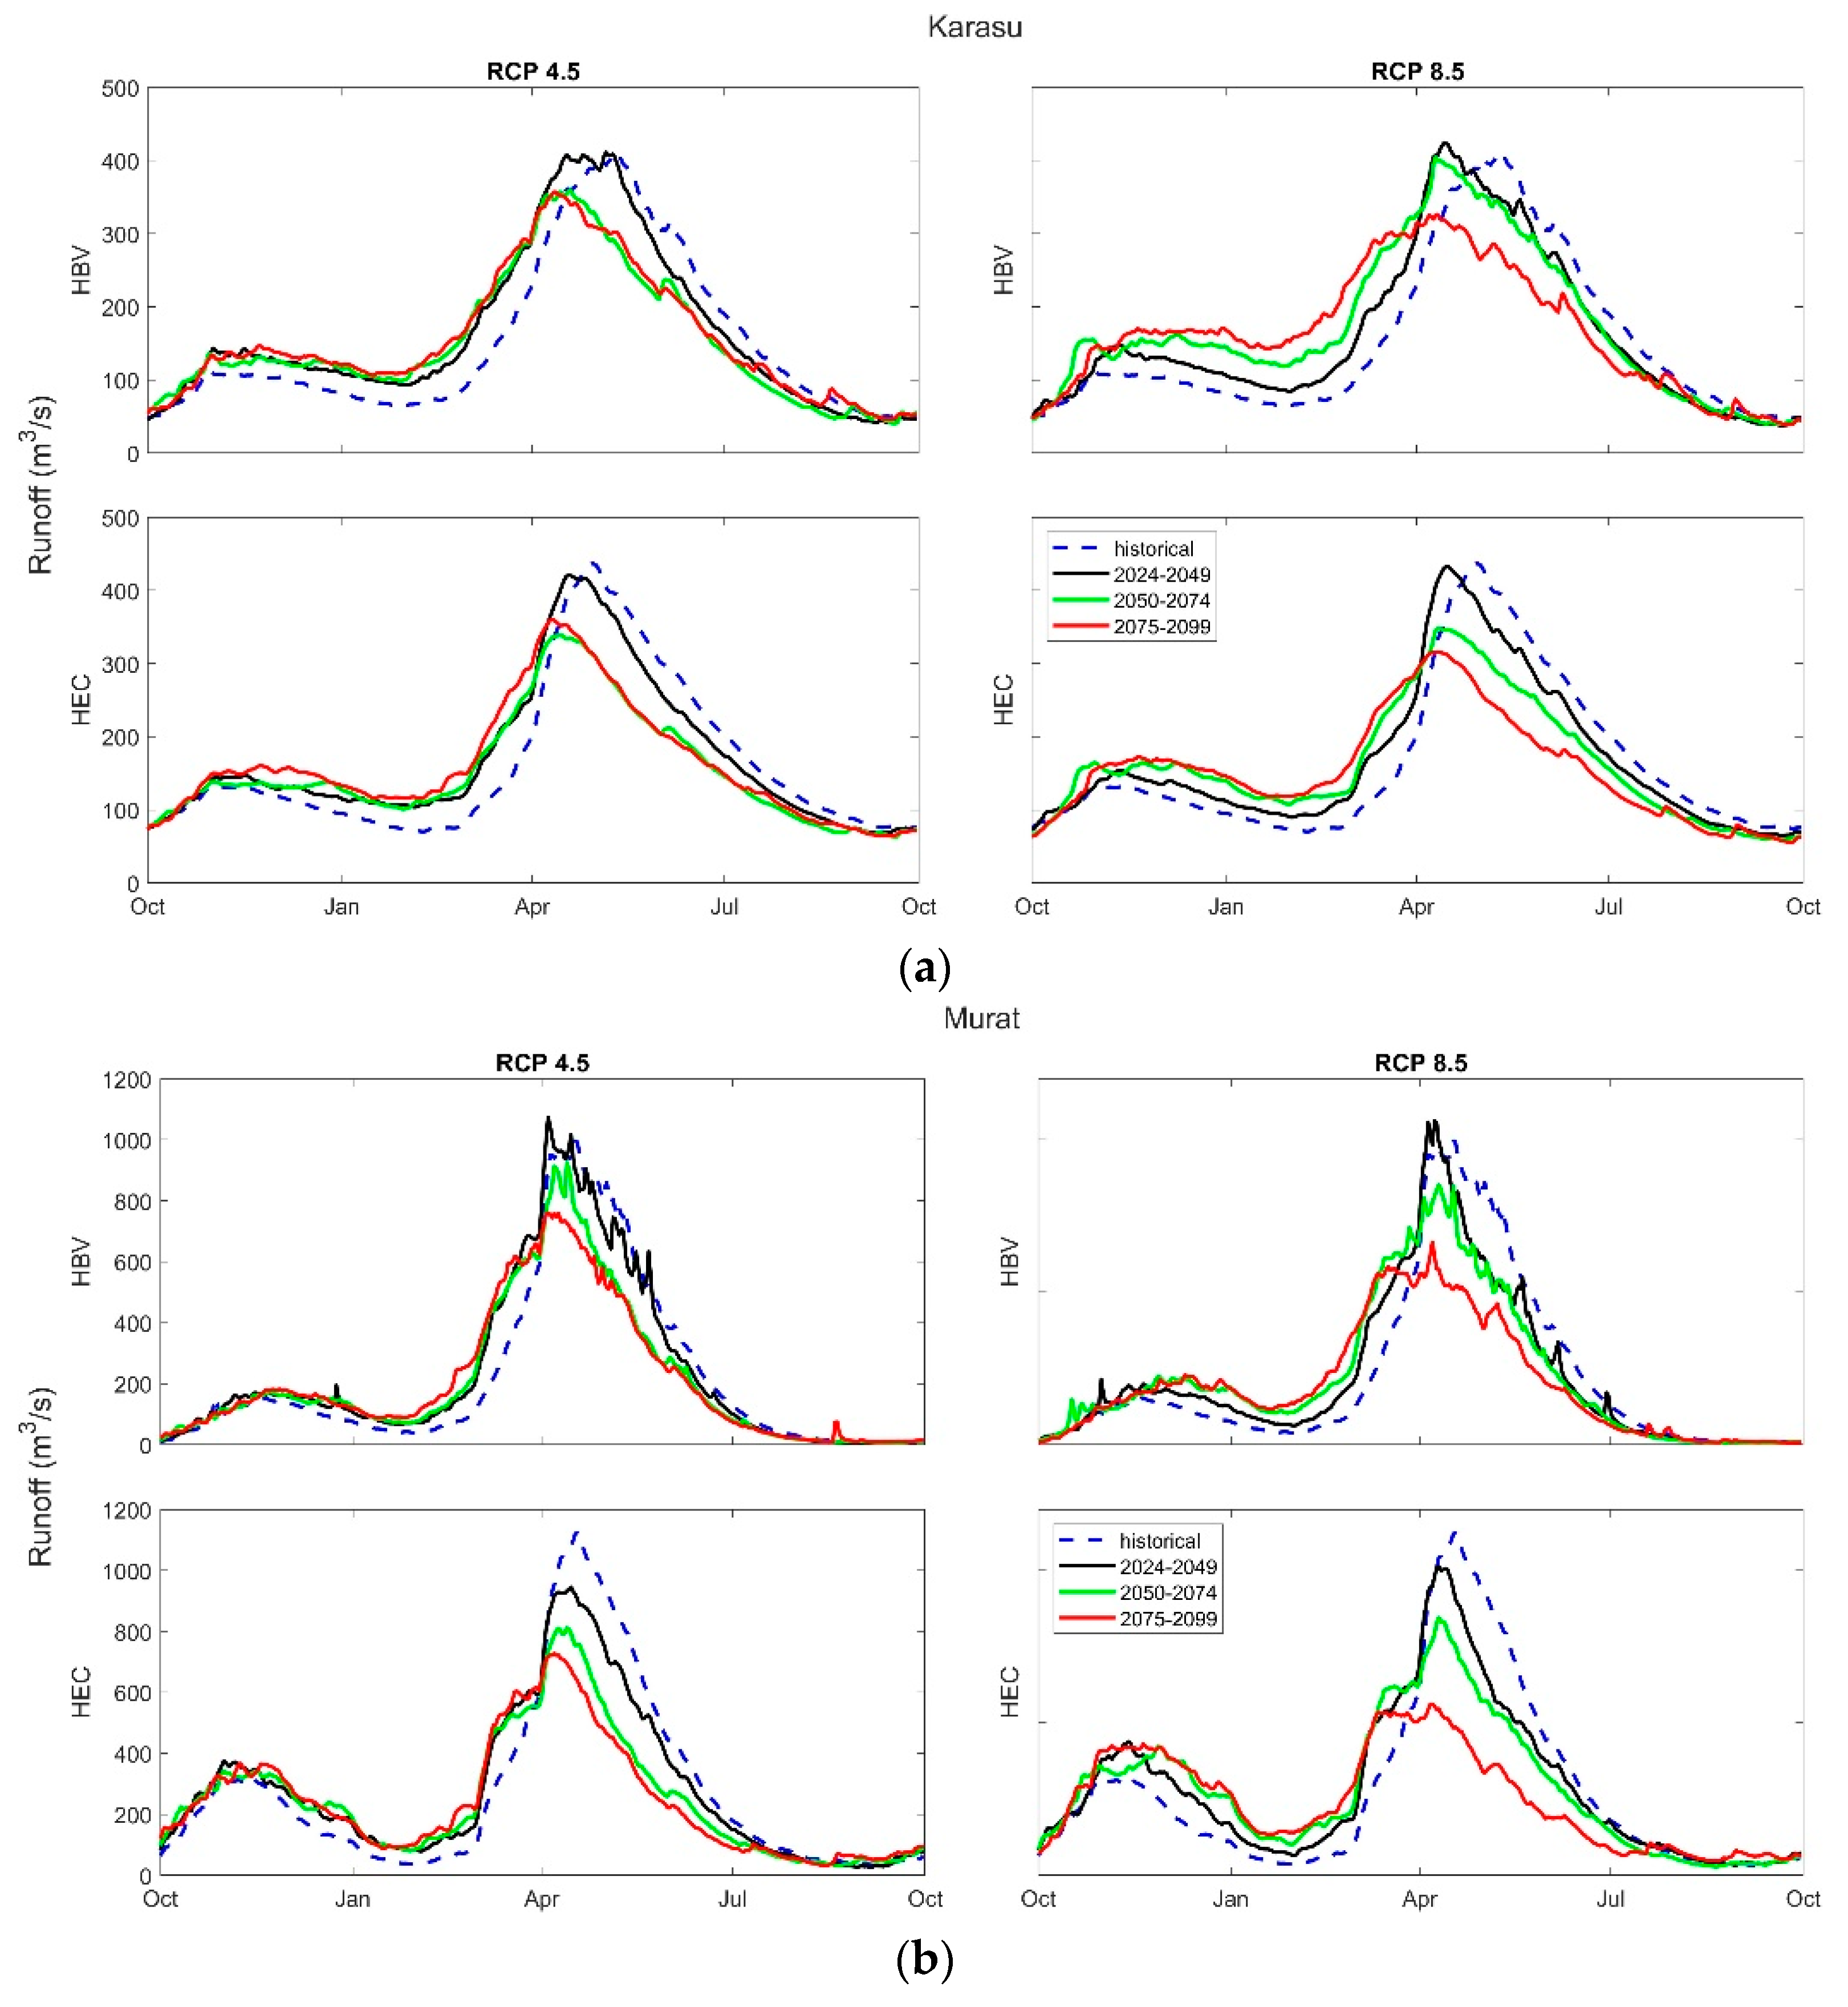
The projected mean ensemble hydrographs are shown together for all future periods compared to the reference period under RCP4.5 and 8.5 in Figure 5. Although the percent change in the mean runoff, especially for the near (2024–2049) future projection, is not substantial, the form of the hydrographs is transforming dramatically with reductions and time shifts in runoff peaks for the mid (2050–2074) and the long (2075–2099) future periods (Figure 5). The runoff peaks seem to decrease by 24% for Karasu and 42% for Murat under RCP8.5 for the third future period. Peak runoff shifts around 20–30 days for Karasu and 10 days for Murat under RCP8.5 for the third future period (Figure 5). In the third period, the decreased runoff will be more noticeable in the Murat basin. HEC-HMS slightly overestimates autumn runoff values in the Murat basin (Figure 5b). This gives the impression that a two-peak flow hydrograph is building in the future, which it is not, even though future estimates show a slight rise in autumn mean flows.
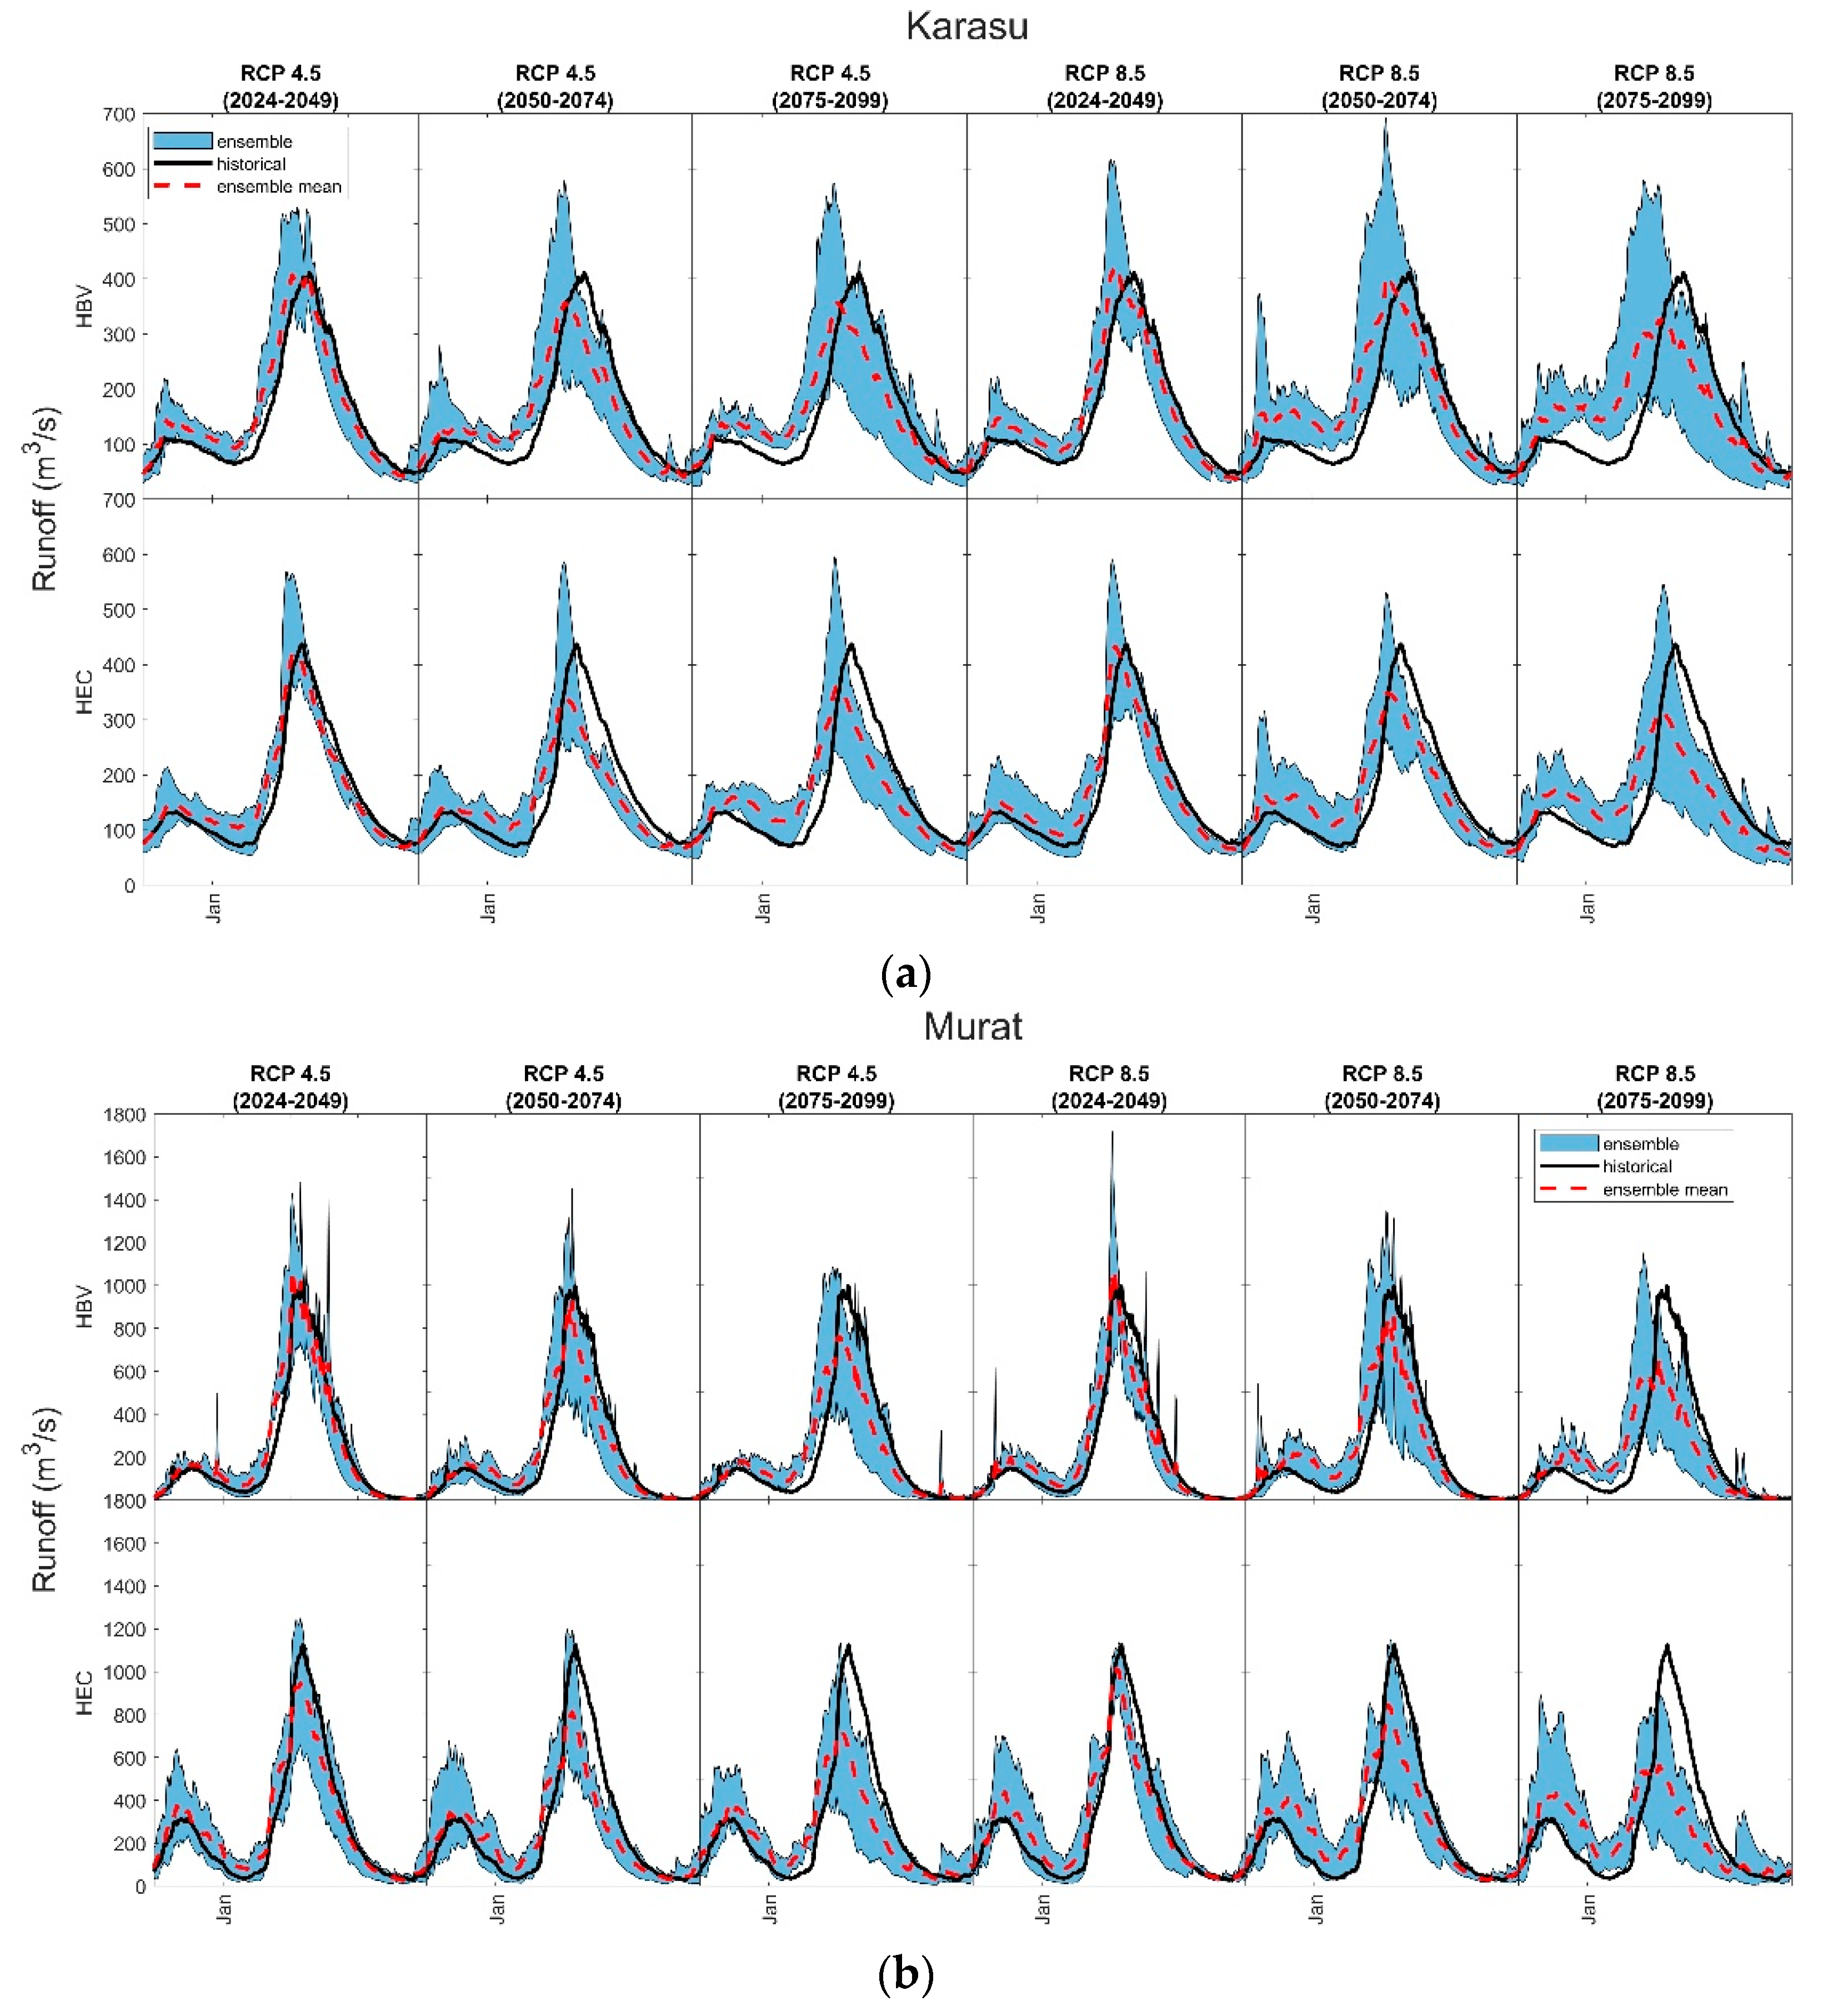
Figure 6 illustrates the increasing uncertainty in the projected ensembles with 25-year time intervals. The spectrum of ensembles expands in each future era until it reaches its maximum in the third future period. Moreover, the projections under the RCP8.5 scenario provide larger spread than those under the RCP4.5 scenario. Figure 6 also depicts an increase in late autumn and early winter runoff values as a result of precipitation that would replace snowfall as temperatures rise.
According to these analyses, there is no clear indication of flood risk in the headwater basins. However, the maximum envelope of ensembles in Figure 6 might be a sign of possible high flows in the future for Karasu basin. On the other hand, the accuracy of projected precipitation for relatively large amounts was slightly lower in this basin for the reference period (Figure 2). No notable trend in mean runoff values is identified as the century progresses. Nevertheless, a shifting runoff hydrograph and lower peaks may be a warning of drought, particularly during the third future period over the basins, with noticeable outcomes (Figure 5 and Figure 6).
3.4. Analysis of Future Snow Dynamics
Future snow dynamics are investigated for three main variables: future snow extent, snow water equivalent, and snow duration. The results of model simulations for snow states under climate change projections are thoroughly examined to detect the relative change in all these variables. Temperatures in the headwater catchments are predicted to rise dramatically under current climate change projections, independent of the scenario, leading to rapid melting and a decrease in snow cover. Because RCP8.5 predicts a more significant temperature increase than RCP4.5, even though all models predict a substantial loss in snow cover across all time periods for both scenarios, this loss is even more noticeable for RCP8.5. When all climatic circumstances are considered, another result of rising temperatures is a considerable rise in snowmelt intensity during spring by the end of the twenty-first century.
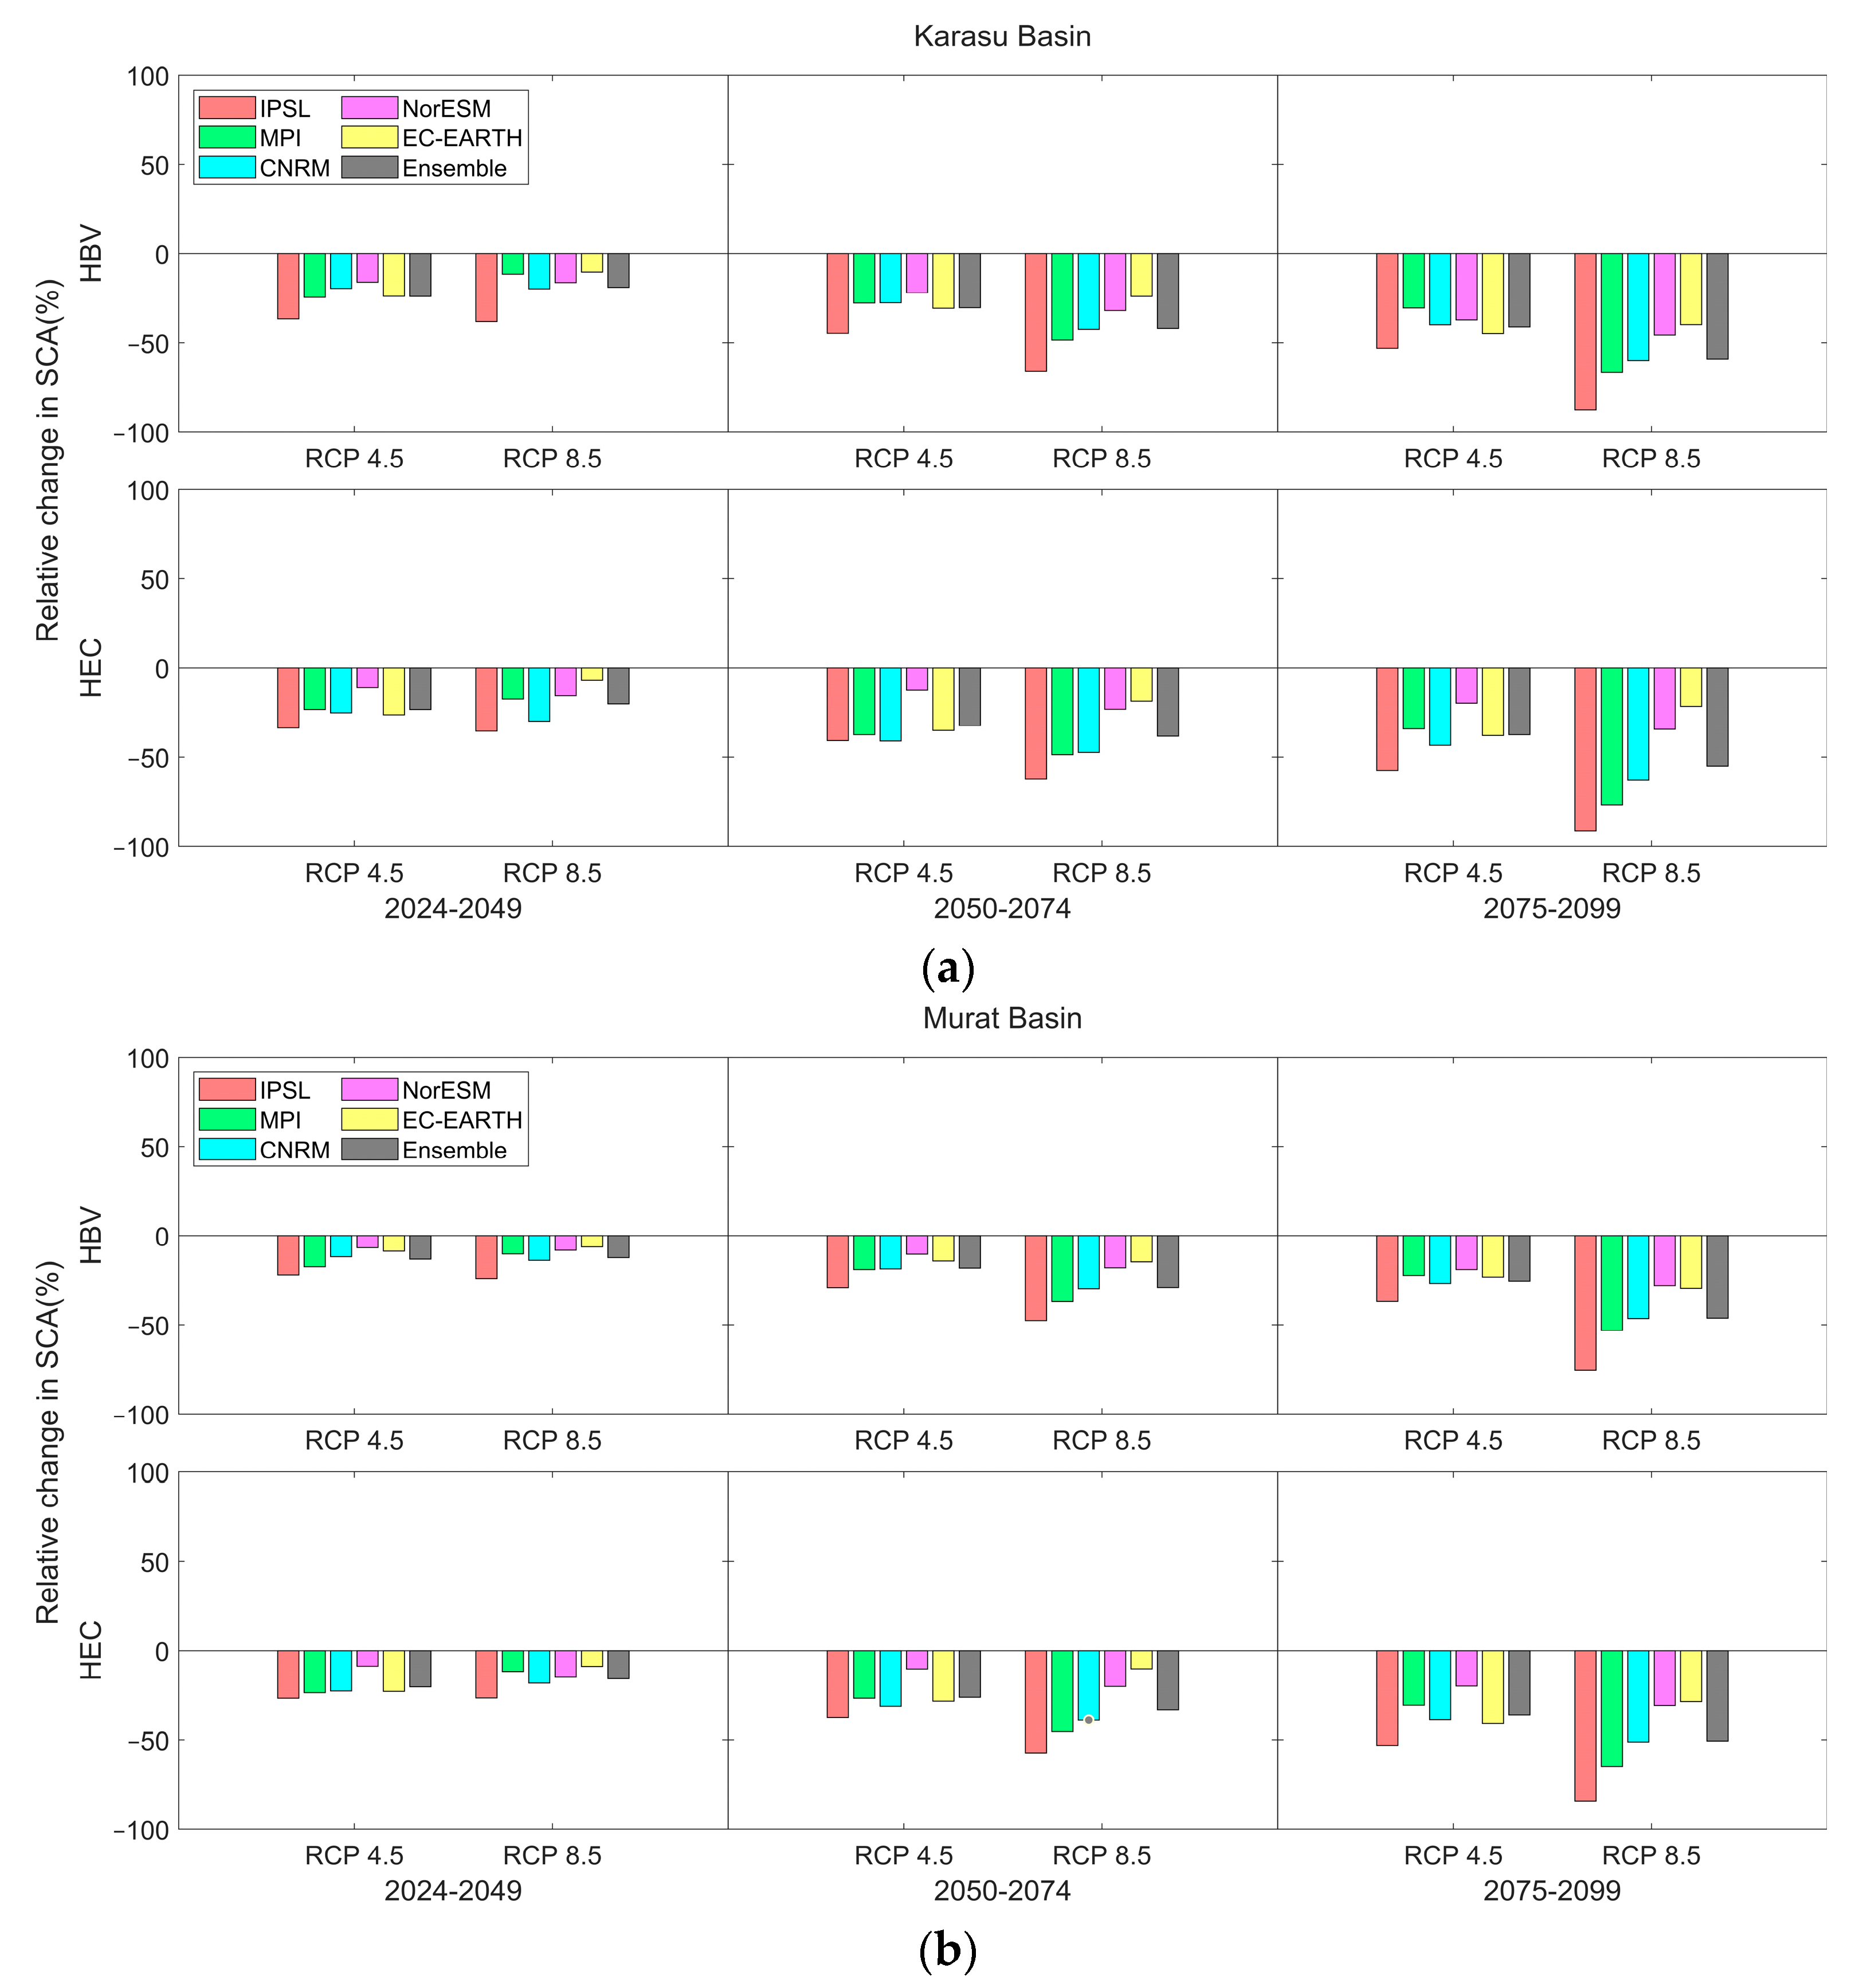
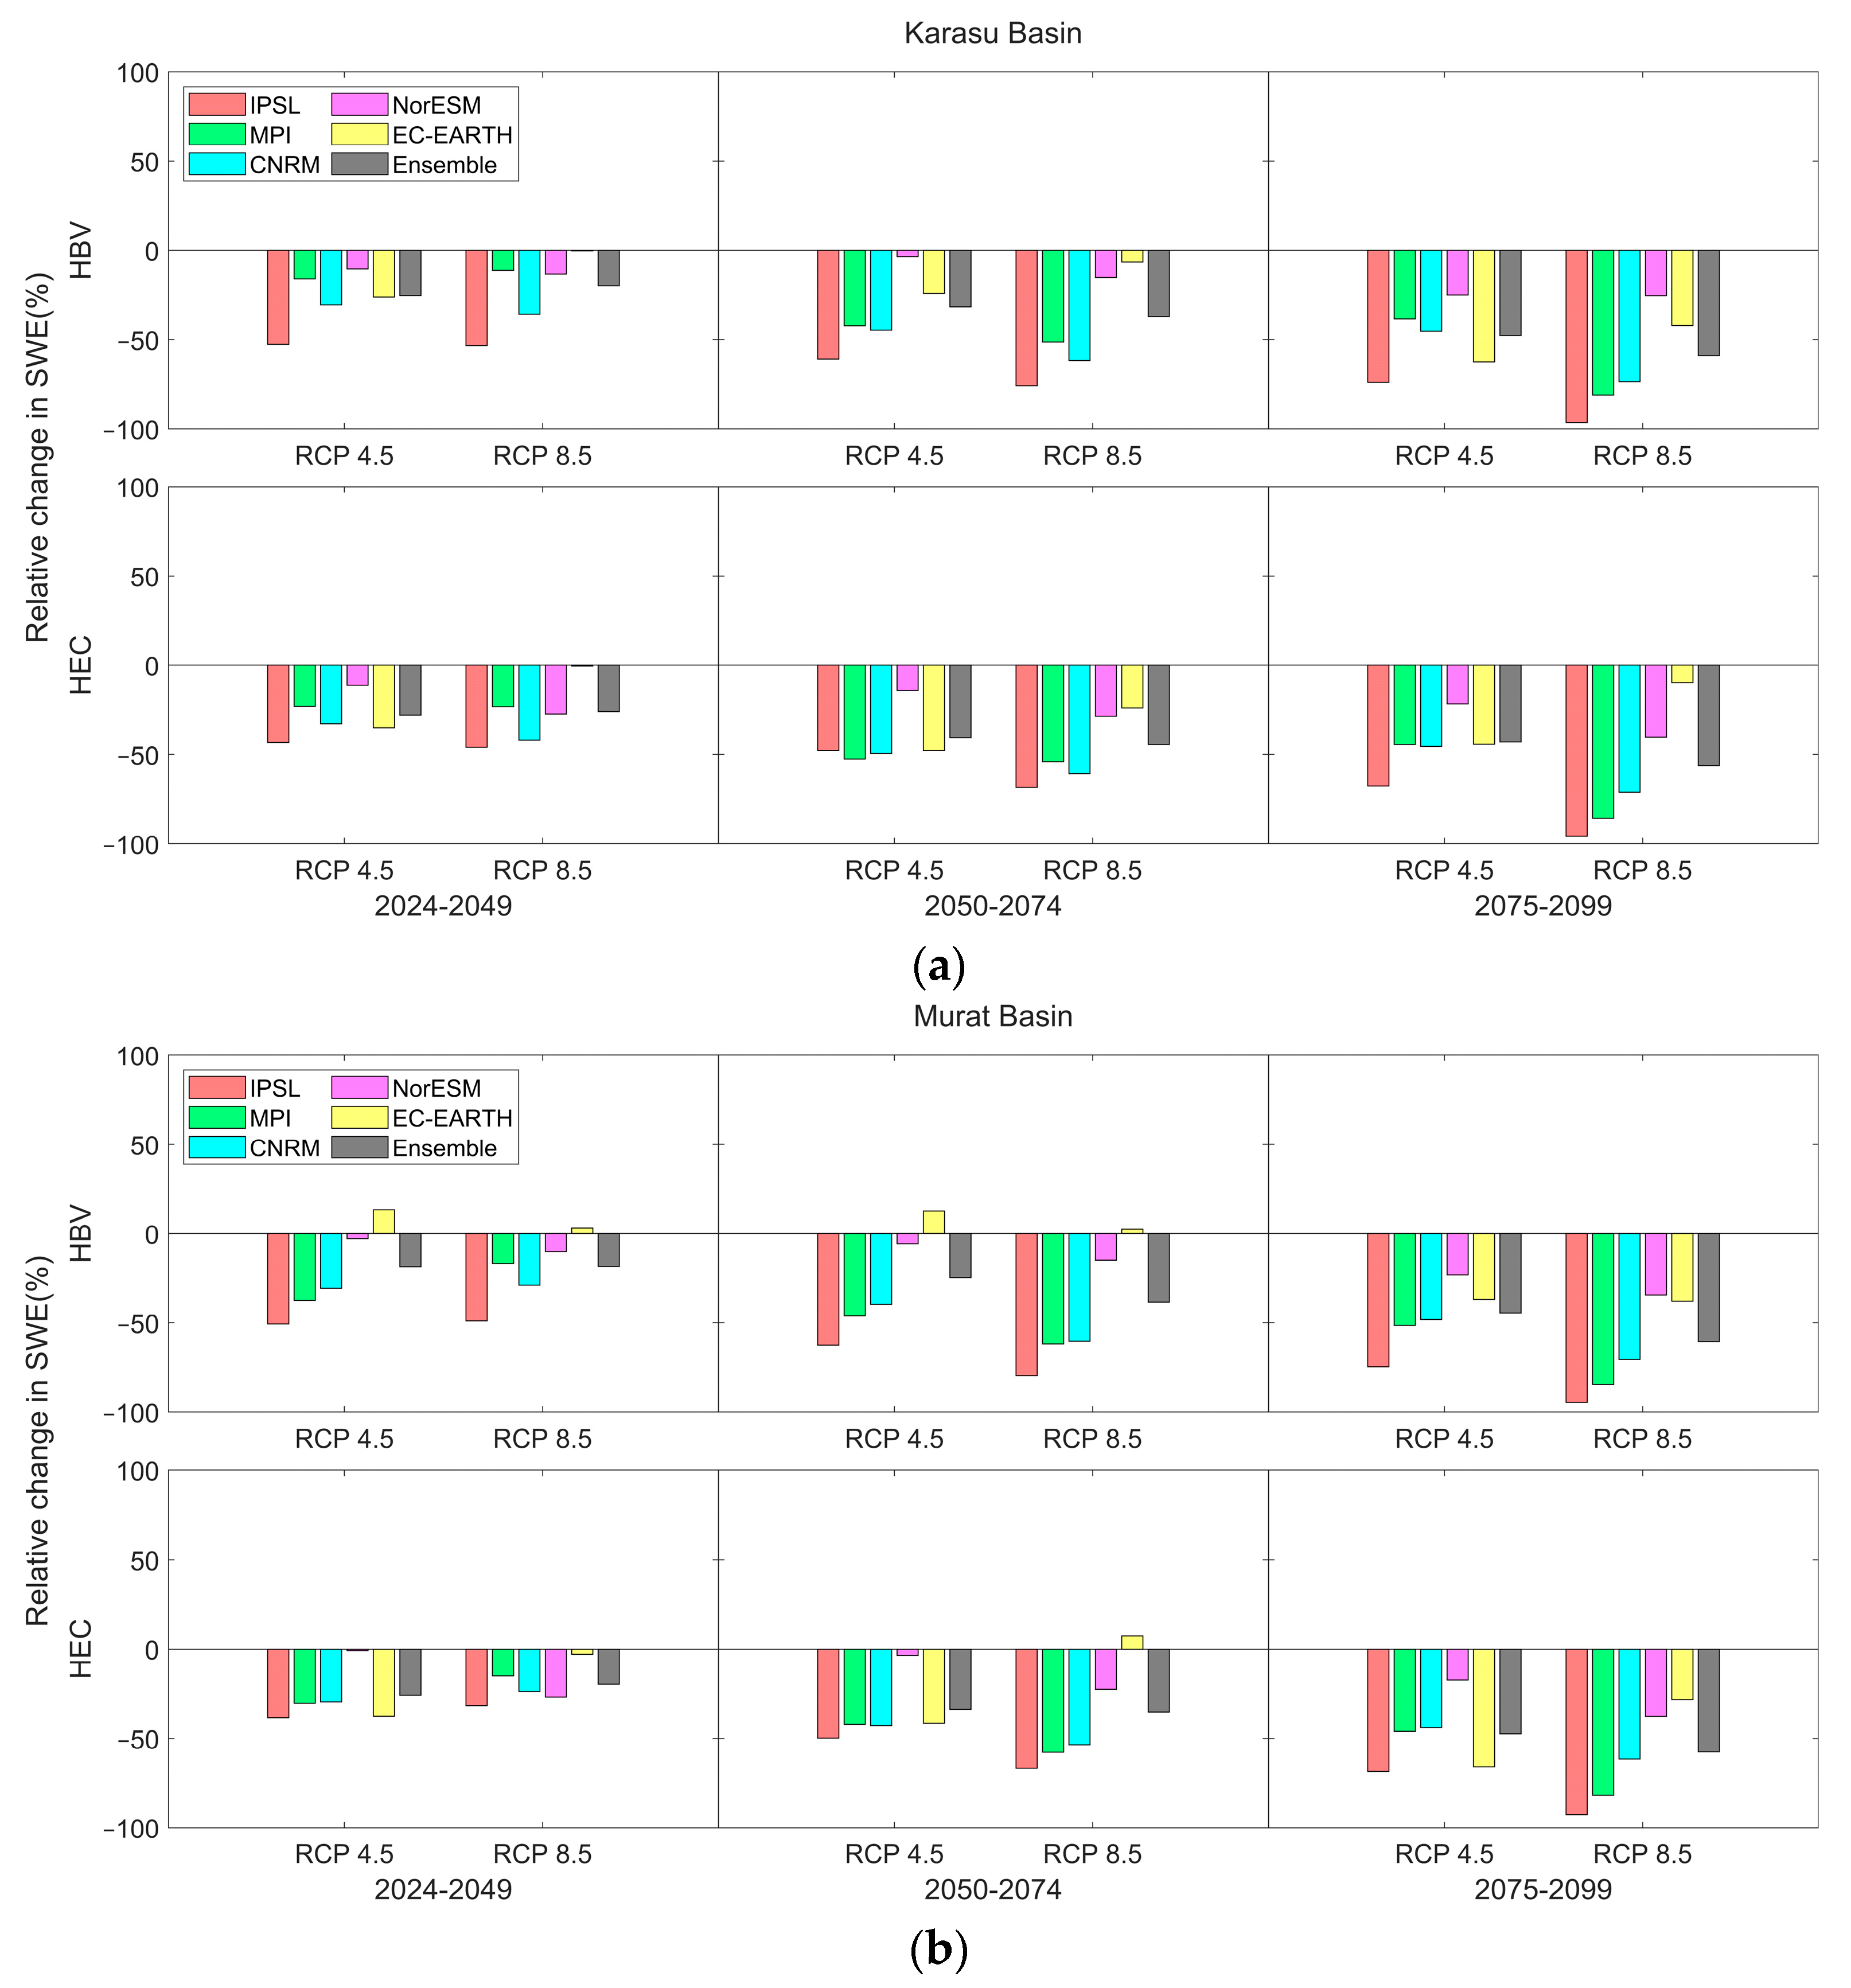
In all instances, without any exception, the projected snow cover shrinks in all future periods with an increasing pattern, and the worst case occurs under RCP8.5 (Figure 7, Figure 8 and Figure 9). The model results are all consistent for different GCPs. The relative change in Snow Cover Area (SCA) and Snow Water Equivalent (SWE) as an ensemble mean projection in percentage is above 50% for the third future period for both basins (Figure 7 and Figure 8). Projected scenarios exhibit remarkable warming and rapid melting in these regions, accelerating the transition from snow-dominated to rain-dominated watersheds and reducing seasonal SWE and its persistence (Figure 8 and Figure 9).
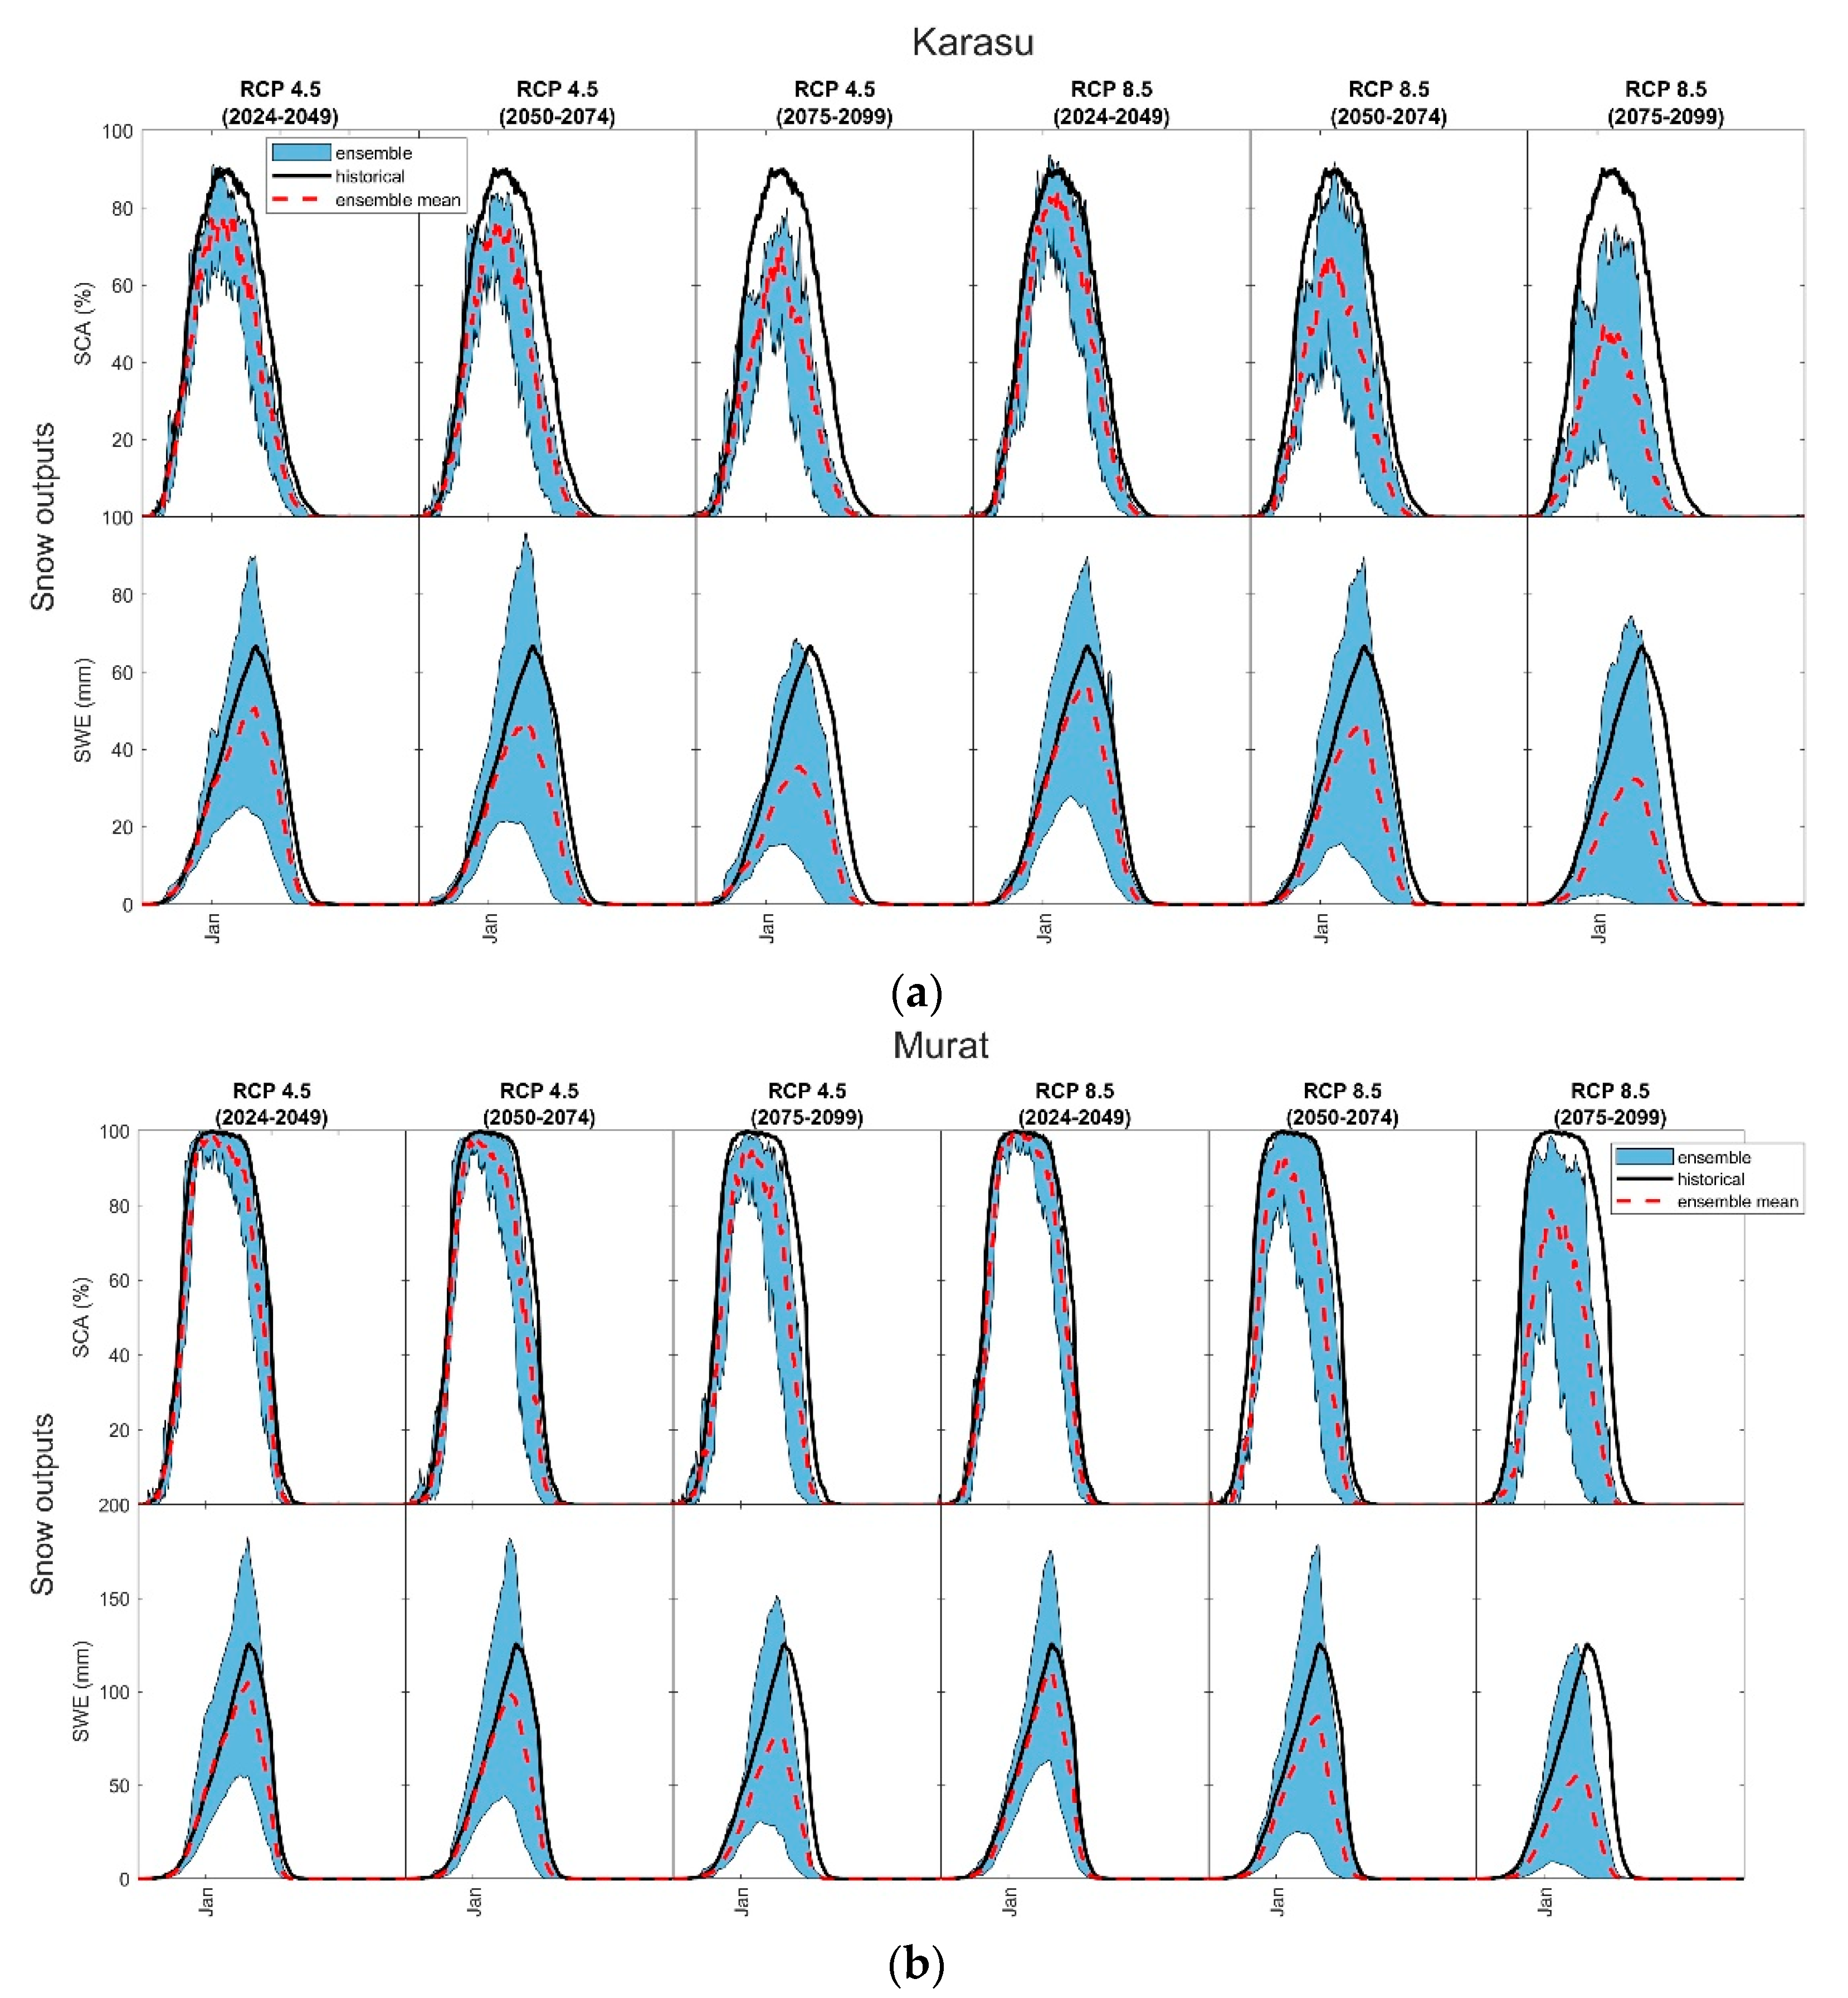
While ensemble spreads indicate a higher uncertainty for SWE compared to SCA, the reduction in mean SCA/SWE and early melting is obvious for the future period for both scenarios and basins (Figure 9). Although the relative percentage reductions in SCA and SWE are similar in both basins (Figure 7 and Figure 8), the decline in projected SCA and its faster depletion are more pronounced in the Karasu basin (Figure 9). This could imply that the decline in SWE values in the Karasu basin occurs both spatially and temporally (Figure 9a).
IPSL-CM5A-MR provides the most significant reduction in both SCA and SWE, which yields the highest temperature rises; conversely, the least reduction is provided by EC-EARTH, which yields the lowest temperature rises (Figure 3). According to IPSL-CM5A-MR, snow is almost disappearing at the end of the century.
Furthermore, analysis for the total duration of snow concerning the persistence of SWE on the ground demonstrates about a 25% decrease in the snow duration period (Table 4). In both basins, snow is seen on the ground half of the year in the reference period, while this rate decreases to approximately one-third of the year in the last 25 years of the future period.
4. Discussion
This study examines the effects of future climate change in the headwaters of the Euphrates River basin using dynamically downscaled results from various GCMs for two emission scenarios. Merging several GCMs which produce more robust findings than individual models is one technique to reduce uncertainty in climate projections [54]. Therefore, six GCMs (CNRM-CM5, IPSL-CM5A, EC-EARTH, MPI-ESM-LR, NorESM1-M, HadGEM2-ES), dynamically downscaled by RCM, based on the RCP4.5 and RCP8.5 scenarios, were used in the study. The projections are divided into three 25-year sub-periods: 2024–2049 (first period), 2050–2074 (second period), and 2075–2099 (third period), and the reference period is taken as 1970–2005.
Except for HadGEM2-ES, all GCMs yielded reasonable precipitation projections and highly accurate temperature projections over the study area for the reference period. A bias correction is applied to improve the consistency of projected climatic variables with respect to observations and in order to reduce uncertainty. In comparison to precipitation, all GCMs performed better in historical temperature simulations in the headwater basins of the Euphrates River. Our findings are consistent with those from other studies [55,56,57].
In summary, the analysis revealed that the temperature in the study area is likely to rise under both RCP4.5 and RCP8.5 scenarios. The changes in temperature in the two basins under consideration all occur in the positive direction (+2.0–+6.4C), increasing with the more pessimistic scenario and period. When precipitation variation is considered, more fluctuations occur within periods and basins. This outcome could be attributed to the great spatial variability and magnitude of precipitation processes that the models could not reflect [58]. Part of the positive changes may also be ascribed to the Black Sea effect [28], as several climate change projections indicate an increase or no change in precipitation, particularly in the eastern Black Sea region, and Karasu basin is in close vicinity to Black Sea region as shown in Figure 1. Geographically, the Murat basin is further away from the Black Sea than the Karasu basin. In addition, the hypsometric mean elevation of Murat basin is lower than that of Karasu basin, and the corresponding basin area lower than the hypsometric mean elevation is larger compared to Karasu basin. Precipitation in the Murat basin shows a slight decline that is virtually unrelated to the type of scenario. Because of higher air temperatures, the precipitation phase at lower elevation zones is more prone to a transition from snow to rain. Moreover, with the increasing temperatures, projected evaporation values will increase in future periods.
Hydrological modeling is critical for managing and planning water resources in the context of climate change. Each hydrological model has its own set of limitations in terms of input data and calibration parameters. The parameters of the hydrological model should be modified through a calibration process for the model to produce the most accurate, feasible results. Climate change implications in terms of snow and discharge were analyzed using climate projections (five GCMs) as input to the calibrated HBV and HEC-HMS models with high modeling performance (Table 3) over the two basins.
The temperature increase is greater in RCP8.5 scenarios than in RCP4.5 scenarios, resulting in a more severe decline in snow storage for all climates evaluated. Warming relates to snowpack losses and temporal alterations in snowmelt peaks. Our findings show that even under the low-emission scenario, snow cover extent is expected to decline by 65% through the end of the century. Figure 7, Figure 8 and Figure 9 depict model simulated SCA and SWE outputs for reference and future periods of the two emission scenarios (RCP4.5 and RCP8.5) in the Karasu and Murat basins for snow comparison. For ensemble means, the change in SCA and SWE values is obviously negative, implying that less snow will accumulate on the ground in amount and area than is now occurring. The graph also shows that by the third future period, the snow season will be shorter as snow will melt faster and vanish in the middle of May rather than June. Snow duration days are expected to drop by 15 to 48 days in both basins during the entire projection period. During the last future period, average SWE values are expected to decline by more than 50%.
It is obvious that climate change has a significant impact on the shape of the hydrograph and peak streamflow values. The runoff volume appears to be less affected by snow, with a maximum 10% decrease (Figure 6). This could be most likely attributed to the difference in precipitation between the periods and scenarios (Figure 3), which exhibit different patterns in each basin. The river discharge pattern will be determined by the melt runoff patterns. Moreover, peak runoff and snow melt are closely related in snow-dominated basins; thus, a temporal shift in the time to peak reflects the impact of climate change (Figure 5). At the end of the century, future melt runoff is expected to peak one month earlier in April rather than May (with 20–25-day shift), as it did in the reference period (Figure 5 and Figure 6) for the Karasu basin. The projected time of change for Murat basin is over 10 days, which moves the runoff peak from late April to early April. Earlier shifts in peak flow timing are noticed under all configurations. The rate of decrease in runoff peaks and shift in peak flow timing is more considerable under RCP 8.5 than RCP 4.5, increasing towards the end of the century.
Several studies have documented similar trends in various mountainous regions around the world, which have been attributed to a change in precipitation from snow to rain under warmer conditions in mid-elevation watersheds and reducing seasonal snow and its persistence [59,60,61]. Moreover, this massive influence on SCA might directly impact hydrological droughts, with an overall rise in droughts’ extent, severity, and length [62]. Several researches has shown that climate change substantially impacts SCA in different mountain ranges [63,64,65]. Our findings also support prior regional and local climate change impact assessment studies. Özdoğan (2011) [2] also discovered substantial declines (between 10% and 60%) in available snow water. Sen et al. (2011) [7] reported statistically significant shifts to earlier times (over five days) in streamflow timing in recent decades. According to Bozkurt and Sen (2013) [21], the striking impact of warming could be seen in the snow water equivalent of the basin highlands. Moreover, they indicate that one of the most notable consequences of the temperature increase in the basin is the 18–39-day shift to earlier days in the surface runoff timing for the main headwaters of the basin. Since they worked on the impact of climate change on the Euphrates–Tigris basin as a whole, the change in runoff conditions is different in downstream parts of the region. In [28], the authors also state that although runoff volume seems to be affected less, the shift in streamflow timing to earlier dates (1–2 weeks) is a notable indication of changing climate for the headwater basins in the Euphrates River.
5. Conclusions
Climate change is altering flow regime characteristics and, as a result, the functioning of water systems in river basins. This study aims to examine climate change impact on the headwaters of the Euphrates River basin in Türkiye using hydrological modeling incorporating projected climatic variables. The Euphrates and Tigris River basins are under exceptional pressure due to deteriorating water supply conditions caused by climate change. The system becomes significantly vulnerable due to lower snowmelt and earlier peak timing.
Since the study involves high-elevation regions, snow is essential to the hydrological cycle. Nevertheless, it is well recognized that hydrological modeling in snow-dominated basins is complex due to a shortage of observed data, especially when complex terrain and harsh meteorological conditions are considered. HBV and HEC-HMS conceptual hydrological models are customized to offer representations of upstream watersheds and calibrated using historical observations in this study. Then, the outputs of five climate models under two RCPs are incorporated into hydrological models to evaluate the behavior of the water system for reference and future periods. The uncertainty in river discharge projections due to the choice of climate models is considered by various GCMs. The results reveal that during the historical period, all considered model configurations can accurately reproduce the statistical characteristics of flow. The methodology can be applied to other snow-dominated mountainous locations with globally and publicly available datasets and the robustness of using multi-hydrologic models with multi-climate projections examined in our work.
It is concluded that temperature increases will raise the rain-to-snow ratio, expedite snowmelt processes, and alter the flow regime in these snow-dominated headwater basins. Over the end of the century, the temperature is expected to rise by 2–6 degrees Celsius, with a more than 50% reduction in SCA and SWE.
A constant decline in snow cover area indicates that the basin’s snow storage capacity will be diminished in the future compared to the reference era. Rather than a dramatic change in runoff volume, a more dramatic fluctuation in snow variables such as SCA and SWE (>50%) and a shortening of snow duration days is projected. Although mean runoff volume appears less affected, the magnitude reduction and streamflow peak timing shift to earlier dates (2 weeks–1 month) are significant indicators of climate change for the headwater basins. Overall, peak flow timing is likely to be significantly influenced by changing climate conditions throughout the century, shifting from mid-May to mid-April for the Karasu and early April for the Murat basins. Such shifts are a rapid response to changes in upstream hydrological processes, resulting in faster snowmelt and an increase in the rain-to-snow ratio. This finding is consistent with prior research demonstrating a change from a snowmelt runoff regime to a rainfall–runoff regime in the Upper Euphrates.
The Euphrates basin is receiving attention as a transboundary river; managing several water resource infrastructures is also critical for riparian countries. As a result, any study assessing the influence of hydro-meteorological conditions and snow dynamics under climate change is now much more essential for decision-makers. The findings concur with our hypothesis that global warming and changes in rain–snow patterns will significantly impact snow evolution and melt runoff patterns for the two headwater basins by the end of the century. The significant decrease in snowmelt-driven runoff predicted for the spring may diminish water availability. Less snowfall will limit the snowpack’s significance as a natural reservoir, conserving water until the warmer periods when demand is high for irrigation and other purposes, with significant consequences for water availability during the summer [59,66,67]. Such changes in upstream flow conditions may have further consequences for evapotranspiration, groundwater recharge, and runoff and an impact on the functioning of the water system downstream, which is more vulnerable to climate change.
The results provided here depict possible scenarios under two opposing climate change spectrums. Forecasting future climates is challenging, particularly in rarely documented and observed locations. This is due to the numerous elements that produce uncertainty in GCMs and climate projections, and the need to understand current socioeconomic routes and their ongoing evolution. One approach to cope with such future uncertainty is to create a set of feasible scenarios based on current knowledge about environmental conditions. This study was based on selecting two severe future scenarios, RCP4.5 and 8.5. Different climate conditions, new GCMs, and a range of potential scenarios affecting snow dynamics may prevail in the future.
The increase in temperature and varied precipitation will substantially impact the whole environment in the upper Euphrates basin; however, this study is mainly concerned with the effects of climate change on river discharge and snow conditions. Therefore, the projected simulations presented in this study are based solely on climate change and do not consider potential changes in ecology, land use, guidelines, or population, the effects of which on climate may alter the outcomes of the scenarios examined here.
On the other hand, the results may be representative of only some of the regions; studies should also be conducted in downstream areas to draw more reliable conclusions about the outcomes. Thus, more studies in other reference basins in the region are needed to gain a complete picture of climate change impact on water resources in the area.
Changes in the runoff regime can also have an impact on the timing and efficiency of water allocation strategies, which may affect the sustainability of downstream storage reservoirs by the end of the century. The reservoir operation guidelines must be revisited to produce more robust water distribution plans in the context of climate change. On the other hand, an adaptation method must be determined for the region to deal with the aforementioned climatic variations.
Author Contributions
A.Ş. conceived and designed the research, conceptualization, and writing; G.U. performed the data, and graphical compilation, visualization, review, and editing; Y.O.D. and H.S.C. performed the model simulations for HBV and HEC-HMS, respectively. All authors have read and agreed to the published version of the manuscript.
Funding
This research was funded by Eskisehir Technical University Scientific Research Projects 22DRP190 “Climate Change Impact on Water Resources and Management in Çoruh and Seyhan Basins” and 22ADP051 “Development of multi-parameter model optimization for hydrological model application”.
Institutional Review Board Statement
Not applicable.
Informed Consent Statement
Not applicable.
Data Availability Statement
The datasets generated during and/or analyzed during the current study are not publicly available but are available from the corresponding author on reasonable request. The hydro-meteorological data set is provided by interested governmental offices but are not public or open to third parties.
Acknowledgments
The authors would like to thank the coordination and the participating institutes of the EURO-CORDEX initiative for making this study possible. The research has been conducted in the framework of ESTU BAP. The authors would like to acknowledge the Turkish State Meteorological Service and State Hydraulic Works for providing hydro-meteorological datasets used in this study.
Conflicts of Interest
The authors declare no conflict of interest. The funders had no role in the design of the study, in the collection, analyses, or interpretation of data, in the writing of the manuscript, or in the decision to publish the results.
References
- Bates, B.; Kundzewicz, Z.; Wu, S. Climate Change and Water; Intergovernmental Panel on Climate Change Secretariat: Geneva, Switzerland, 2008. [Google Scholar]
- Özdoğan, M. Climate change impacts on snow water availability in the Euphrates-Tigris basin. Hydrol. Earth Syst. Sci. 2011, 15, 2789–2803. [Google Scholar] [CrossRef] [Green Version]
- Mankin, J.S.; Viviroli, D.; Singh, D.; Hoekstra, A.Y.; Diffenbaugh, N.S. The potential for snow to supply human water demand in the present and future. Environ. Res. Lett. 2015, 10, 114016. [Google Scholar] [CrossRef]
- Bajracharya, A.R.; Bajracharya, S.R.; Shrestha, A.B.; Maharjan, S.B. Climate change impact assessment on the hydrological regime of the Kaligandaki Basin, Nepal. Sci. Total Environ. 2018, 625, 837–848. [Google Scholar] [CrossRef]
- Barnett, T.P.; Adam, J.C.; Lettenmaier, D.P. Potential impacts of a warming climate on water availability in snow-dominated regions. Nature 2005, 438, 303–309. [Google Scholar] [CrossRef] [PubMed]
- Brown, R.D.; Mote, P.W. The response of Northern Hemisphere snow cover to a changing climate. J. Clim. 2009, 22, 2124–2145. [Google Scholar] [CrossRef]
- Sen, O.L.; Unal, A.; Bozkurt, D.; Kindap, T. Temporal changes in the Euphrates and Tigris discharges and teleconnections. Environ. Res. Lett. 2011, 6, 024012. [Google Scholar] [CrossRef]
- Cooper, M.G.; Nolin, A.W.; Safeeq, M. Testing the recent snow drought as an analog for climate warming sensitivity of Cascades snowpacks. Environ. Res. Lett. 2016, 11, 084009. [Google Scholar] [CrossRef]
- Berghuijs, W.R.; Woods, R.A.; Hrachowitz, M. A precipitation shift from snow towards rain leads to a decrease in streamflow. Nat. Clim. Chang. 2014, 4, 583–586. [Google Scholar] [CrossRef] [Green Version]
- Goulden, M.L.; Bales, R.C. Mountain runoff vulnerability to increased evapotranspiration with vegetation expansion. Proc. Natl. Acad. Sci. USA 2014, 111, 14071–14075. [Google Scholar] [CrossRef] [Green Version]
- Diffenbaugh, N.S.; Scherer, M.; Ashfaq, M. Response of snow-dependent hydrologic extremes to continued global warming. Nat. Clim. Chang. 2013, 3, 379–384. [Google Scholar] [CrossRef] [Green Version]
- Maurer, E.P.; Stewart, I.T.; Bonfils, C.; Duffy, P.B.; Cayan, D. Detection, attribution, and sensitivity of trends toward earlier streamflow in the Sierra Nevada. J. Geophys. Res. Atmos. 2007, 112. [Google Scholar] [CrossRef] [Green Version]
- Zampieri, M.; Scoccimarro, E.; Gualdi, S.; Navarra, A. Observed shift towards earlier spring discharge in the main Alpine rivers. Sci. Total Environ. 2015, 503, 222–232. [Google Scholar] [CrossRef] [PubMed] [Green Version]
- Kibaroglu, A.; Maden, T.E. An analysis of the causes of water crisis in the Euphrates-Tigris river basin. J. Environ. Stud. Sci. 2014, 4, 347–353. [Google Scholar] [CrossRef]
- Munia, H.; Guillaume, J.H.A.; Mirumachi, N.; Porkka, M.; Wada, Y.; Kummu, M. Water stress in global transboundary river basins: Significance of upstream water use on downstream stress. Environ. Res. Lett. 2016, 11, 014002. [Google Scholar] [CrossRef]
- IPCC. The Physical Science Basis. Contribution of Working Group I to the Fourth Assessment Report of the Intergovernmental Panel on Climate Change; Cambridge University Press: Cambridge, UK; New York, NY, USA, 2007; Volume 996, pp. 113–119. [Google Scholar]
- Yucel, I.; Güventürk, A.; Sen, O.L. Climate change impacts on snowmelt runoff for mountainous transboundary basins in eastern Türkiye. Int. J. Climatol. 2015, 35, 215–228. [Google Scholar] [CrossRef]
- Türkeş, M.; Yozgatlıgil, C.; Batmaz, İ.; İyigün, C.; Koç, E.K.; Fahmi, F.M.; Aslan, S. Has the climate been changing in Türkiye? Regional climate change signals based on a comparative statistical analysis of two consecutive time periods, 1950–1980 and 1981–2010. Clim. Res. 2016, 70, 77–93. [Google Scholar] [CrossRef] [Green Version]
- Gokmen, M. Spatio-temporal trends in the hydroclimate of Türkiye for the last decades based on two reanalysis datasets. Hydrol. Earth Syst. Sci. 2016, 20, 3777–3788. [Google Scholar] [CrossRef] [Green Version]
- Şen, Z. Climate change expectations in the upper Tigris River basin, Türkiye. Theor. Appl. Climatol. 2019, 137, 1569–1585. [Google Scholar] [CrossRef]
- Bozkurt, D.; Sen, O.L. Climate change impacts in the Euphrates–Tigris Basin based on different model and scenario simulations. J. Hydrol. 2013, 480, 149–161. [Google Scholar] [CrossRef]
- Mueller, A.; Detges, A.; Pohl, B.; Reuter, M.H.; Rochowski, L.; Volkholz, J.; Woertz, E. Climate Change, Water and Future Cooperation and Development in the Euphrates-Tigris Basin. 2021. Available online: https://www.cascades.eu/wp-content/uploads/2021/11/Euphrates-Tigris-Report_Final.pdf (accessed on 1 March 2023).
- Food and Agriculture Organization (FAO); International Bank for Reconstruction and Development (IBRD); The World Bank. Water Management in Fragile Systems. Building Resilience to Shocks and Protracted Crises in the Middle East and North Africa; Discussion Paper; Food and Agriculture Organization: Cairo, Egypt, 2018. [Google Scholar]
- Bachmann, A.; Tice, V.; Al-Obeidi, L.A.; Kilıç, D.T. Tigris-Euphrates River Ecosystem: A Status Report. In Mesopotamian Water Forum; University of Sulaimani: Sulaymaniyah, Iraq, 2019; Volume 24. [Google Scholar]
- Waha, K.; Krummenauer, L.; Adams, S.; Aich, V.; Baarsch, F.; Coumou, D.; Fader, M.; Hoff, H.; Jobbins, G.; Marcus, R.; et al. Climate change impacts in the Middle East and Northern Africa (MENA) region and their implications for vulnerable population groups. Reg. Environ. Chang. 2017, 17, 1623–1638. [Google Scholar] [CrossRef]
- Yilmaz, A.G.; Imteaz, M.A.; Jenkins, G. Catchment flow estimation using Artificial Neural Networks in the mountainous Euphrates Basin. J. Hydrol. 2011, 410, 134–140. [Google Scholar] [CrossRef]
- Bozkurt, D.; Sen, O.L.; Hagemann, S. Projected river discharge in the Euphrates-Tigris Basin from a hydrological discharge model forced with RCM and GCM outputs. Clim. Res. 2015, 62, 131–147. [Google Scholar] [CrossRef] [Green Version]
- Peker, I.B.; Sorman, A.A. Application of SWAT using snow data and detecting climate change impacts in the mountainous eastern regions of Türkiye. Water 2021, 13, 1982. [Google Scholar] [CrossRef]
- Shah, M.I.; Khan, A.; Akbar, T.A.; Hassan, Q.K.; Khan, A.J.; Dewan, A. Predicting hydrologic responses to climate changes in highly glacierized and mountainous region Upper Indus Basin. R. Soc. Open Sci. 2020, 7, 191957. [Google Scholar] [CrossRef] [PubMed]
- Huang, Y.; Xiao, W.; Hou, B.; Zhou, Y.; Hou, G.; Yi, L.; Cui, H. Hydrological projections in the upper reaches of the Yangtze River Basin from 2020 to 2050. Sci. Rep. 2021, 11, 9720. [Google Scholar] [CrossRef]
- Dobler, C.; Hagemann, S.; Wilby, R.L.; Stötter, J. Quantifying different sources of uncertainty in hydrological projections in an Alpine watershed. Hydrol. Earth Syst. Sci. 2012, 16, 4343–4360. [Google Scholar] [CrossRef] [Green Version]
- Prasch, M.; Mauser, W.; Weber, M. Quantifying present and future glacier melt-water contribution to runoff in a central Himalayan river basin. Cryosphere 2013, 7, 889–904. [Google Scholar] [CrossRef] [Green Version]
- Dankers, R.; Feyen, L. Climate change impact on flood hazard in Europe: An assessment based on high-resolution climate simulations. J. Geophys. Res. Atmos. 2008, 113. [Google Scholar] [CrossRef]
- Liu, J.; Long, A.; Deng, X.; Yin, Z.; Deng, M.; An, Q.; Gu, X.; Li, S.; Liu, G. The Impact of Climate Change on Hydrological Processes of the Glacierized Watershed and Projections. Remote Sens. 2022, 14, 1314. [Google Scholar] [CrossRef]
- Jiang, Q.; Qi, Z.; Tang, F.; Xue, L.; Bukovsky, M. Modeling climate change impact on streamflow as affected by snowmelt in Nicolet River Watershed, Quebec. Comput. Electron. Agric. 2020, 178, 105756. [Google Scholar] [CrossRef]
- Vormoor, K.; Lawrence, D.; Heistermann, M.; Bronstert, A. Climate change impacts on the seasonality and generation processes of floods–projections and uncertainties for catchments with mixed snowmelt/rainfall regimes. Hydrol. Earth Syst. Sci. 2015, 19, 913–931. [Google Scholar] [CrossRef] [Green Version]
- Bozkurt, D.; Rojas, M.; Boisier, J.P.; Valdivieso, J. Projected hydroclimate changes over Andean basins in central Chile from downscaled CMIP5 models under the low and high emission scenarios. Clim. Chang. 2018, 150, 131–147. [Google Scholar] [CrossRef]
- Azmat, M.; Wahab, A.; Huggel, C.; Qamar, M.U.; Hussain, E.; Ahmad, S.; Waheed, A. Climatic and hydrological projections to changing climate under CORDEX-South Asia experiments over the Karakoram-Hindukush-Himalayan water towers. Sci. Total Environ. 2020, 703, 135010. [Google Scholar] [CrossRef] [PubMed]
- Lawrence, D. Uncertainty introduced by flood frequency analysis in projections for changes in flood magnitudes under a future climate in Norway. J. Hydrol. Reg. Stud. 2020, 28, 100675. [Google Scholar] [CrossRef]
- Foulon, É.; Rousseau, A.N.; Gagnon, P. Development of a methodology to assess future trends in low flows at the watershed scale using solely climate data. J. Hydrol. 2018, 557, 774–790. [Google Scholar] [CrossRef] [Green Version]
- Didovets, I.; Lobanova, A.; Bronstert, A.; Snizhko, S.; Maule, C.F.; Krysanova, V. Assessment of climate change impacts on water resources in three representative Ukrainian catchments using eco-hydrological modelling. Water 2017, 9, 204. [Google Scholar] [CrossRef] [Green Version]
- Marcinkowski, P.; Piniewski, M.; Kardel, I.; Szcześniak, M.; Benestad, R.; Srinivasan, R.; Ignar, S.; Okruszko, T. Effect of climate change on hydrology, sediment and nutrient losses in two lowland catchments in Poland. Water 2017, 9, 156. [Google Scholar] [CrossRef] [Green Version]
- Troin, M.; Caya, D.; Velázquez, J.A.; Brissette, F. Hydrological response to dynamical downscaling of climate model outputs: A case study for western and eastern snowmelt-dominated Canada catchments. J. Hydrol. Reg. Stud. 2015, 4, 595–610. [Google Scholar] [CrossRef] [Green Version]
- Troin, M.; Velázquez, J.A.; Caya, D.; Brissette, F. Comparing statistical post-processing of regional and global climate scenarios for hydrological impacts assessment: A case study of two Canadian catchments. J. Hydrol. 2015, 520, 268–288. [Google Scholar] [CrossRef]
- URL-1. Available online: http://hsaf.meteoam.it/ (accessed on 1 March 2023).
- URL-2. Available online: https://harmosnow.eu/ (accessed on 1 March 2023).
- URL-3. Available online: https://blogs.egu.eu/divisions/hs/2020/10/28/water-towers-of-mesopotamia/ (accessed on 1 March 2023).
- URL-4. Available online: https://www.euro-cordex.net/ (accessed on 1 March 2023).
- Senatore, A.; Fuoco, D.; Maiolo, M.; Mendicino, G.; Smiatek, G.; Kunstmann, H. Evaluating the uncertainty of climate model structure and bias correction on the hydrological impact of projected climate change in a Mediterranean catchment. J. Hydrol. Reg. Stud. 2022, 42, 101120. [Google Scholar] [CrossRef]
- Bergström, S. The HBV model. In Computer Models of Watershed Hydrology; Water Resources Publications: Highlands Ranch, CO, USA, 1995; pp. 443–476. [Google Scholar]
- Seibert, J.; Vis, M.J. Teaching hydrological modeling with a user-friendly catchment-runoff-model software package. Hydrol. Earth Syst. Sci. 2012, 16, 3315–3325. [Google Scholar] [CrossRef] [Green Version]
- Feldman, A.D. Hydrologic Modeling System HEC-HMS: Technical Reference Manual; US Army Corps of Engineers, Hydrologic Engineering Center: Davis, CA, USA, 2000. [Google Scholar]
- Moriasi, D.N.; Arnold, J.G.; Van Liew, M.W.; Bingner, R.L.; Harmel, R.D.; Veith, T.L. Model evaluation guidelines for systematic quantification of accuracy in watershed simulations. Trans. ASABE 2007, 50, 885–900. [Google Scholar] [CrossRef]
- Hashmi, M.Z.; Shamseldin, A.Y.; Melville, B.W. Statistically downscaled probabilistic multi-model ensemble projections of precipitation change in a watershed. Hydrol. Process. 2013, 27, 1021–1032. [Google Scholar] [CrossRef]
- IPCC. Climate Change 2013: The Physical Science Basis. Contribution of Working Group I to the Fifth Assessment Report of the Intergovernmental Panel on Climate Change; Stocker, T.F., Qin, D., Plattner, G.-K., Tignor, M., Allen, S.K., Boschung, J., Nauels, A., Xia, Y., Bex, V., Midgley, P.M., et al., Eds.; Cambridge University Press: Cambridge, UK; New York, NY, USA, 2013; 1535p. [Google Scholar]
- Aziz, R.; Yucel, I. Assessing nonstationarity impacts for historical and projected extreme precipitation in Türkiye. Theory Appl. Climatol. 2021, 143, 1213–1226. [Google Scholar] [CrossRef]
- Aziz, R.; Yucel, I.; Yozgatligil, C. Nonstationarity impacts on frequency analysis of yearly and seasonal extreme temperature in Türkiye. Atmos Res 2020, 238, 104875. [Google Scholar] [CrossRef]
- Aloysius, N.R.; Sheffield, J.; Saiers, J.E.; Li, H.; Wood, E.F. Evaluation of historical and future simulations of precipitation and temperature in central Africa from CMIP5 climate models. J. Geophys. Res. Atmos. 2016, 121, 130–152. [Google Scholar] [CrossRef] [Green Version]
- Thackeray, C.W.; Derksen, C.; Fletcher, C.G.; Hall, A. Snow and climate: Feedbacks, drivers, and indices of change. Curr. Clim. Chang. Rep. 2019, 5, 322–333. [Google Scholar] [CrossRef]
- Hock, R.; Rasul, G.; Adler, C.; Cáceres, B.; Gruber, S.; Hirabayashi, Y.; Jackson, M.; Kääb, A.; Kang, S.; Kutuzov, S.; et al. High mountain areas. In IPCC Special Report on the Ocean and Cryosphere in a Changing Climate; Pörtner, H.-O., Roberts, D.C., Masson-Delmotte, V., Zhai, P., Tignor, M., Poloczanska, E., Mintenbeck, K., Alegría, A., Nicolai, M., Okem, A., et al., Eds.; IPCC: Geneva, Switzerland, 2019; pp. 131–202. [Google Scholar]
- Nepal, S.; Khatiwada, K.R.; Pradhananga, S.; Kralisch, S.; Samyn, D.; Bromand, M.T.; Jamal, N.; Dildar, M.; Durrani, F.; Rassouly, F.; et al. Future snow projections in a small basin of the Western Himalaya. Sci. Total Environ. 2021, 795, 148587. [Google Scholar] [CrossRef]
- Hidalgo-Hidalgo, J.D.; Collados-Lara, A.J.; Pulido-Velazquez, D.; Rueda, F.J.; Pardo-Igúzquiza, E. Analysis of the Potential Impact of Climate Change on Climatic Droughts, Snow Dynamics, and the Correlation between Them. Water 2022, 14, 1081. [Google Scholar] [CrossRef]
- Trivedi, M.R.; Browne, M.K.; Berry, P.M.; Dawson, T.P.; Morecroft, M.D. Projecting Climate Change Impacts on Mountain Snow Cover in Central Scotland from Historical Patterns. Arct. Antarct. Alp. Res. 2007, 39, 488–499. [Google Scholar] [CrossRef]
- Marty, C.; Schlögl, S.; Bavay, M.; Lehning, M. How much can we sabe? Impact of different emission scenarios on future snow cover in the Alps. Cryosphere 2017, 11, 517–529. [Google Scholar] [CrossRef] [Green Version]
- Wobus, C.; Small, E.; Hosterman, H.; Mills, D.; Stein, J.; Rissing, M.; Jones, R.; Duckworth, M.; Hall, R.; Kolian, M.; et al. Projected climate change impacts on skiing and snowmobiling: A case study of the United States. Glob. Environ. Chang. 2017, 45, 1–14. [Google Scholar] [CrossRef]
- Sturm, M.; Goldstein, M.A.; Parr, C. Water and life from snow: A trillion-dollar science question. Water Resour. Res. 2017, 53, 3534–3544. [Google Scholar] [CrossRef]
- Jenicek, M.; Seibert, J.; Staudinger, M. Modeling of future changes in seasonal snowpack and impacts on summer low flows in alpine catchments. Water Resour. Res. 2018, 54, 538–556. [Google Scholar] [CrossRef]
Figure 1.
Location of the study area.

Figure 2.
Assessment of the RCM precipitation (a) P > 10 mm, (b) P > 30 mm.

Figure 3.
Relative change in basin-wide precipitation and temperature. (a) Karasu basin, (b) Murat basin.
Figure 3.
Relative change in basin-wide precipitation and temperature. (a) Karasu basin, (b) Murat basin.

Figure 4.
Relative change in mean runoff. (a) Karasu basin, (b) Murat basin.

Figure 5.
Projected ensemble mean annual runoff hydrographs using HBV and HEC-HMS versus historical annual hydrograph (dashed line) in all future periods. (a) Karasu basin, (b) Murat basin.
Figure 5.
Projected ensemble mean annual runoff hydrographs using HBV and HEC-HMS versus historical annual hydrograph (dashed line) in all future periods. (a) Karasu basin, (b) Murat basin.

Figure 6.
Projected ensemble (shaded area) and expected (dashed line) annual runoff hydrographs using HBV and HEC-HMS versus historical annual hydrograph (solid line). (a) Karasu Basin, (b) Murat Basin.
Figure 6.
Projected ensemble (shaded area) and expected (dashed line) annual runoff hydrographs using HBV and HEC-HMS versus historical annual hydrograph (solid line). (a) Karasu Basin, (b) Murat Basin.

Figure 7.
Relative change in snow cover area. (a) Karasu basin, (b) Murat basin.

Figure 8.
Relative change in snow water equivalent. (a) Karasu basin, (b) Murat basin.

Figure 9.
Projected ensemble (shaded area) and expected (dashed line) annual SCA and SWE using HBV versus historical SCA and SWE (solid line). (a) Karasu basin, (b) Murat basin.
Figure 9.
Projected ensemble (shaded area) and expected (dashed line) annual SCA and SWE using HBV versus historical SCA and SWE (solid line). (a) Karasu basin, (b) Murat basin.


Table 1.
Data sets used for climate projections.
| Domain | GCM_run | RCM | Reference | RCP4.5 | RCP8.5 | Institution |
|---|---|---|---|---|---|---|
| EUR-11 | CNRM-CM5_r1i1p1 | RCA4_v1 | 1970–2005 | 2006–2100 | 2006–2100 | SMHI |
| EUR-11 | EC-EARTH_r1i1p1 | RACMO22E_v1 | 1950–2005 | 2006–2100 | 2006–2100 | KNMI |
| EUR-11 | HadGEM2-ES_r1i1p1 | RCA4_v1 | 1970–2005 | 2006–2099 | 2006–2099 | SMHI |
| EUR-11 | IPSL-CM5A-MR_r1i1p1 | RCA4_v1 | 1970–2005 | 2006–2100 | 2006–2100 | SMHI |
| EUR-11 | MPI-ESM-LR_r1i1p1 | RCA4_v1a | 1970–2005 | 2006–2100 | 2006–2100 | SMHI |
| EUR-11 | NorESM1-M_r1i1p1 | HIRHAM5_v3 | 1951–2005 | 2006–2100 | 2006–2100 | DMI |
Table 2.
Correlation analysis of bias-corrected data sets compared to ground truth.
| Pearson-R after BC | Precipitation | Temperature | ||
|---|---|---|---|---|
| Karasu | Murat | Karasu | Murat | |
| MPI-ESM-LR | 0.35 | 0.42 | 0.96 | 0.97 |
| CNRM-CM5 | 0.38 | 0.41 | 0.96 | 0.97 |
| IPSL-CM5A-MR | 0.31 | 0.38 | 0.96 | 0.97 |
| EC-EARTH | 0.40 | 0.43 | 0.96 | 0.97 |
| NorESM1-M | 0.33 | 0.49 | 0.97 | 0.97 |
| HadGEM2-ES | −0.27 | −0.24 | 0.75 | 0.78 |
Table 3.
Model performances for Karasu and Murat basin.
| KARASU | MURAT | |||||||
|---|---|---|---|---|---|---|---|---|
| HBV | HEC-HMS | HBV | HEC-HMS | |||||
| Metric | CAL * | VAL * | CAL * | VAL * | CAL * | VAL * | CAL * | VAL * |
| NSE | 0.84 | 0.86 | 0.83 | 0.84 | 0.94 | 0.89 | 0.88 | 0.82 |
| KGE | 0.87 | 0.87 | 0.91 | 0.89 | 0.91 | 0.93 | 0.92 | 0.87 |
| PBIAS | −10.80 | −11.30 | 3.30 | 3.20 | −8.00 | −4.40 | 0.40 | 3.30 |
| R | 0.93 | 0.95 | 0.92 | 0.92 | 0.97 | 0.94 | 0.94 | 0.91 |
| DRV | 0.89 | 0.89 | 0.97 | 0.97 | 0.92 | 0.96 | 1.00 | 1.03 |
* Cal: 1980–1999; Val: 1991–2011.
Table 4.
Decrease in snow duration days for Karasu and Murat basins.
| KARASU | MPI-ESM-LR | IPSL-CM5A-MR | CNRM-CM5 | EC-EARTH | NorESM1-M | ENSEMBLE | |
|---|---|---|---|---|---|---|---|
| Decrease in Snow Duration (Days) | 2024–2049 | 19 | 29 | 24 | 19 | 12 | 17 |
| 2050–2074 | 34 | 60 | 36 | 36 | 22 | 28 | |
| 2075–2099 | 76 | 146 | 57 | 45 | 35 | 48 | |
| Murat | MURAT | MPI-ESM-LR | IPSL-CM5A-MR | CNRM-CM5 | EC-EARTH | NorESM1-M | ENSEMBLE |
| Change in Snow Duration | 2024–2049 | 31 | 14 | 23 | 13 | 14 | 15 |
| 2050–2074 | 46 | 47 | 32 | 12 | 21 | 25 | |
| 2075–2099 | 77 | 101 | 47 | 31 | 37 | 43 |
Disclaimer/Publisher’s Note: The statements, opinions and data contained in all publications are solely those of the individual author(s) and contributor(s) and not of MDPI and/or the editor(s). MDPI and/or the editor(s) disclaim responsibility for any injury to people or property resulting from any ideas, methods, instructions or products referred to in the content. |
© 2023 by the authors. Licensee MDPI, Basel, Switzerland. This article is an open access article distributed under the terms and conditions of the Creative Commons Attribution (CC BY) license (https://creativecommons.org/licenses/by/4.0/).
Share and Cite
MDPI and ACS Style
Şensoy, A.; Uysal, G.; Doğan, Y.O.; Civelek, H.S. The Future Snow Potential and Snowmelt Runoff of Mesopotamian Water Tower. Sustainability 2023, 15, 6646. https://doi.org/10.3390/su15086646
AMA Style
Şensoy A, Uysal G, Doğan YO, Civelek HS. The Future Snow Potential and Snowmelt Runoff of Mesopotamian Water Tower. Sustainability. 2023; 15(8):6646. https://doi.org/10.3390/su15086646
Chicago/Turabian StyleŞensoy, Aynur, Gökçen Uysal, Y. Oğulcan Doğan, and H. Soykan Civelek. 2023. "The Future Snow Potential and Snowmelt Runoff of Mesopotamian Water Tower" Sustainability 15, no. 8: 6646. https://doi.org/10.3390/su15086646
Note that from the first issue of 2016, this journal uses article numbers instead of page numbers. See further details here.