
The Race to Zero Emissions in MINT Economies: Can Economic Growth, Renewable Energy and Disintegrated Trade Be the Path to Carbon Neutrality?
1
Department of Business Administration, Faculty of Economics and Administrative Science, Cyprus International University, Nicosia 99040, Turkey
2
Accounting and Finance Department, Faculty of Economics and Administrative Science, Cyprus International University, Nicosia 99040, Turkey
*
Author to whom correspondence should be addressed.
Sustainability 2022, 14(21), 14178; https://doi.org/10.3390/su142114178
Submission received: 3 October 2022
/
Revised: 24 October 2022
/
Accepted: 27 October 2022
/
Published: 30 October 2022
(This article belongs to the Special Issue Renewable Energy Consumption and Economic Growth)
Abstract
:The current paper evaluates the role of disintegrated trade, financial development, and renewable energy on consumption-based carbon emissions (CCO2) in MINT nations between 1990Q1 and 2019Q4. This paper utilizes the novel Bootstrap Fourier Granger causality in quantiles (BFGC-Q) to evaluate this connection. This approach produces tail-causal and asymmetric causal connections between the indicators within the Fourier approximation, contrary to the Toda–Yamamoto causality and other conventional Granger tests. The outcomes uncover a unidirectional causality from economic growth and renewable energy to CCO2 emissions in each MINT nation. Moreover, unidirectional causality emerged from financial development to CCO2 for Indonesia, Nigeria, and Turkey. Moreover, exports have predictive power over CCO2 in Indonesia, Turkey, and Mexico, while imports only have predictive power over CCO2 emissions in Turkey. Lastly, financial development causes CCO2 in Indonesia, Nigeria, and Mexico. In summary, green energy and exports are essential factors that decrease CCO2 emissions and therefore decrease ecological deterioration in Mexico, Indonesia, and Turkey. On the flip side, imports only trigger CCO2 emissions in Turkey and Mexico. Lastly, the financial development effect on CCO2 emissions is positive in Mexico, Indonesia, and Nigeria, while an insignificant impact is found in Turkey. Based on these findings, policy ramifications are initiated.
1. Introduction
The difficulties of environmental degradation and climate change have rapidly surfaced in recent years, posing serious concerns for the international community’s and policymakers’ pursuit of sustainable development. The global economy has entered a phase of fast growth following the industrial revolution, and the wealth disparity has been growing [1,2]. Ecological contamination is a problem that arises concurrently with economic growth and poses a danger to human life. Huge industrial waste, intensive use of natural resources, and the usage of energy based on fossil fuels are the main causes of these problems [3,4]. Various nations have established the targets for carbon emission peaks and reductions at the recent summits (COP21, COP26) on ecological regulation and climate change in order to attain net zero emissions and achieve harmonized sustainable environment and growth. In order to accomplish zero emissions in the next decades, global leaders are working to put regulations/policies in place that will result in net-zero emissions.
Trade economists are the first to evaluate the issue of ecological deterioration [5]. These scholars offer a fundamental basis for comprehending how trade and the environment are correlated. One of the CO2 emissions drivers is international trade [6,7]. On the one hand, international trade has augmented the flow of services and goods, thus boosting economic operations. Nevertheless, it has unfavorable effects on the ecosystem. According to [1], international trade allows nations to transfer their polluting sectors to other nations, contributing to environmental deterioration. However, trade raises nations’ economic levels, which may be utilized to slow down ecological damage in its latter phases [5]. Nations worldwide are reallocating their resources to effective initiatives and implementing eco-friendly technologies to harmonize the relationship between CO2 emissions and trade.
Overusing energy puts a lot of strain on the ecosystem [8]. Nevertheless, green energy (such as solar, biomass, wind, hydro, and geothermal) results in less CO2 than using fossil fuels, which are thought to be the primary cause of global warming and CO2 emissions [9]. Therefore, renewable energy sources are one of the most vital strategies to curb CO2 [10,11]. After the well-known COP 21 and Kyoto Protocol in 2005, most advanced nations embraced renewable energy sources as a propelling tactic to attain a target of low GHG emissions. Various studies have incorporated renewable energy (REC) as a significant variable in the CO2 emissions framework due to its significance in reducing CO2 emissions [12,13].
Financial development (FD) also contributes significantly to a nation’s growth. A robust and enhanced financial sector boosts the financial system’s effectiveness while promoting economic development and growth [14]. Although energy is the main driver of economic expansion, it also has an unavoidable impact on the environment. As a result, the flow of financial resources is correlated with the need for energy. More funds are required for manufacturing to increase energy efficiency and deploy superior technologies to promote economic growth. Due to this, financial development has increasingly been a significant factor in economic growth [15,16,17]. Financial development boosts the economy, but it also has disadvantages since it may have an adverse effect on the environment and deplete natural resources in many ways. Particularly, the growth of finance pushes people to purchase more homes, machines, cars, and gadgets, intensifying the increasing need for energy [18,19].
In light of the preceding debate, this paper aims to inspect the impact of disintegrated trade, renewable energy, and financial development on consumption-based carbon emissions (CCO2) in MINT nations. Brazil, Russia, India, China, and South Africa, together known as the BRICS nations, are powerful emerging blocs that have drawn significant attention recently. Moreover, Ref. [20] also acknowledged additional emerging markets in 2013, such as Mexico, Indonesia, Nigeria, and Turkey (MINT). The MINT nations account for between 1 and 2 percent of the global economy and have a good chance of surpassing other nations’ economies in terms of economic size and technological advancement in the next decades. Although the USA likewise anticipates a 5% growth rate for each MINT country globally, Gold Sachs predicts consistent, steady growth for MINT nations [21]. Now the question arises, does developing nations like MINT economies uphold sustainable development with financial development and disintegrated trade without damaging the environment? The present investigation is carried out to provide an answer to this question.
This paper adds to the ongoing literature in three distinct ways: Firstly, the present investigation considered the impact of disintegrated trade by evaluating the role of imports and exports on CCO2 emissions. Secondly, unlike prior studies such as [8,22,23,24,25] that used CO2 emissions to gauge environmental degradation, the current investigation used CCO2 emissions to measure ecological deterioration. As stated by [26], the CCO2 is a comprehensive measure of ecological damage because it helps differentiate emissions produced in one country and consumed in another. Thus, emissions from imports and exports are taken into consideration when using this metric. Thirdly, the research employed BFGC-Q, initiated by [27], for the MINT nations between 1990Q1 and 2019Q4. This approach produces tail-causal and asymmetric causal connections between the indicators within the Fourier approximation, contrary to the Toda–Yamamoto causality and other conventional Granger tests.
2. Literature Review
2.1. Synopsis of Studies between Environmental Quality and Financial Development, and Renewable Energy
Studies on the nexus between ecological quality (EQ) and financial development and green energy have been conducted in the empirical literature. For instance, Ref. [28] inspect the role of green energy (GRN)and export diversification on Indonesia’s ecological quality (EQ) using the novel Fourier quantile causality method from 1965Q to 2014Q4. The findings indicate that there is one-way causation from fossil fuel to EQ at all quantiles. Still, the causes of EQ at the intermediate and higher quantiles include income, green energy, and export diversification. The EQ is most significantly raised by green energy and export diversification. In contrast, a rise in real growth and the use of fossil fuels lower EQ. Moreover, Ref. [29] revisits the nexus between green energy, financial development, and EQ towards attaining sustainable development in China. The research assesses updated time series data for China between 1988 and 2018 and employs cutting-edge econometric methods, including the Maki cointegration and frequency domain causality test. The empirical finding demonstrates that EQ is enhanced by increased financial development and using REC. Income, on the other hand, lowers EQ. Additionally, the 2008 structural break year and financial development raise EQ. The strong correlation between financial development and EQ confirms the school of belief that relates financial development with sustainability.
Using data from 1980 to 2018, Ref. [30] inspected the nexus between renewable energy, financial development, and EQ in selected Asian nations using panel methods between 1990 and 2014. The empirical study indicates that while economic expansion and financial development lower EQ, renewable energy helps raise it, while agriculture has less influence. The findings propose that all regressors can forecast EQ in the chosen countries, and the causality between the variables is tested using the variance decomposition and impulse response function approaches. Likewise, Ref. [31] inspected the environmental effects of financial development and REC using Driscoll–Kraay Panel Corrected Estimators for 16 developing nations between 2000 and 2018. The findings show that REC and financial development strengthen EQ. The developing nations have already passed the EKC tipping threshold for internet usage, wherein EQ rises as internet penetration increases. Furthermore, robustness testing using bootstrapped panel-quantile regression also supports the notion that financial development and REC promote EQ in each quantile.
Likewise, Ref. [32] evaluates how renewable energy and financial development promote EQ using global data between 1990 and 2018. The research used the estimators’ DOLS, CCR, and FMOLS to assess the nexus. The long-term interrelationship between the indicators is supported by empirical research. Their findings also discover that worldwide economic expansion lowers EQ globally, whereas financial development and green energy consumption have a long-term significantly favorable impact on EQ. Ecological issues in the era of industrialization were evaluated by [33] by incorporating financial development and REC as control variables. The study used panel data from NICs for the years 1990 to 2019. The study used panel data from NICs for the years 1990 to 2019. The augmented mean group (AMG) results indicate that EQ in these nations is significantly impacted by financial development. On the other hand, using renewable energy greatly raises EQ over time. Additionally, these findings are in line with long-term and disaggregated level estimates. The panel causality test findings also found a unidirectional causation relationship from REC to EQ. Additionally, it was shown that EQ and financial development had a reciprocal causal interrelationship.
Using data from 1960Q1 to 2019Q4, Ref. [34] evaluated the environmental cost of economic progress, financial development, and renewable energy in Pakistan using nonparametric causality-in-quantiles techniques. The research indicated that EQ strongly correlates with financial development and REC, showing asymmetric prediction over ecological dispersion. Additionally, there is a connection between financial development and EQ at higher quantiles.
2.2. Synopsis of Studies between Environmental Quality and Exports and Imports
Mahmood [35] used spatial regression analysis to assess the effect of trade (imports and exports) on EQ in GCC nations, utilizing data from a period between 1990 and 2019. Exports have positive spillovers, direct and total impacts on EQ, and negative direct effects on EQ. The fact that exports negatively impact EQ indicates that exports are lowering EQ in domestic economies. On the other hand, the positive direct impact of exports on EQ demonstrates how exports enhance EQ in domestic economies.
Hasano et al. [36] assessed the impact of international trade on EQ in oil-exporting nations using both consumption and territory emissions accounting. The error correction and cointegration models indicate that imports and exports have significant statistical effects of opposing signs on EQ in both the short and long-term, and that the consequences of alterations in the trade-CCO2 connection will be entirely assimilated in three years. Nevertheless, regarding territory-based CO2 emissions, imports and exports are statistically insignificant. Moreover, Ref. [26] inspected the role of international trade in G7 countries on consumption-based carbon emissions using second-generation approaches. The findings support a consistent long-term connection between CO2 emissions and trade. In the long term, exports reduce CCO2, whereas imports increase it. The outcomes are also supported by the CCEMG and AMG methodologies. Based on the findings of the Granger causality test conducted by [37], it is said that any policy that targets imports and exports has a considerable impact on CCO2 emissions.
Similarly, Ref. [38] evaluated the theoretical framework for the effect of trade (exports and imports) on CCO2. The data from the BRICS nations for 1990 to 2017 are then used to evaluate this connection. The research also considers the panel data’s integration, cointegration, heterogeneity aspects, and cross-country interdependence, resulting in reliable findings and well-founded policy recommendations. According to their findings, export size contributes to EQ growth, whereas import size dampens EQ. Furthermore, Ref. [39] using the BRICS nations evaluates the nexus between trade and CCO2 using data from 1990 to 2018. The study evaluates these interactions using the AMD and CCEMG causality methodologies. The study results show that in the BRICS economies, exports reduce CCO2, however, imports increase CCO2. Furthermore, all the parameters can predict CCO2 emissions according to the panel causality results. To achieve carbon neutrality for the G7 nations, Ref. [7] evaluated the disintegrated trade effect on EQ using data from 1990 to 2018. The results suggested that exports and imports are factors of CCO2 in the G7 nations. In addition, exports curb CCO2 while imports upsurge CCO2 emissions.
In a variety of ways, this research contributes to the expanding body of scholarship on ecological deterioration. Firstly, the analysis is new because it uses the newly formed CCO2 emissions, which determine emissions based on domestic fossil fuel usage plus incorporated emissions from net exports (export minus import). For the purpose of developing an effective climate strategy to address ecological issues, a precise assessment of CO2 emissions is crucial. Following the Paris climate summit (COP, 21), it is possible to propose a pertinent climate policy response based on trade-adjusted data on CO2 emissions. Secondly, the research employed BFGC-Q initiated by [27], for the MINT nations between 1990Q1 and 2019Q4. This approach produces tail-causal and asymmetric causal connections between the indicators within the Fourier approximation, in contrast to the Toda–Yamamoto causality and other conventional Granger tests.
3. Data and Methodology
3.1. Data
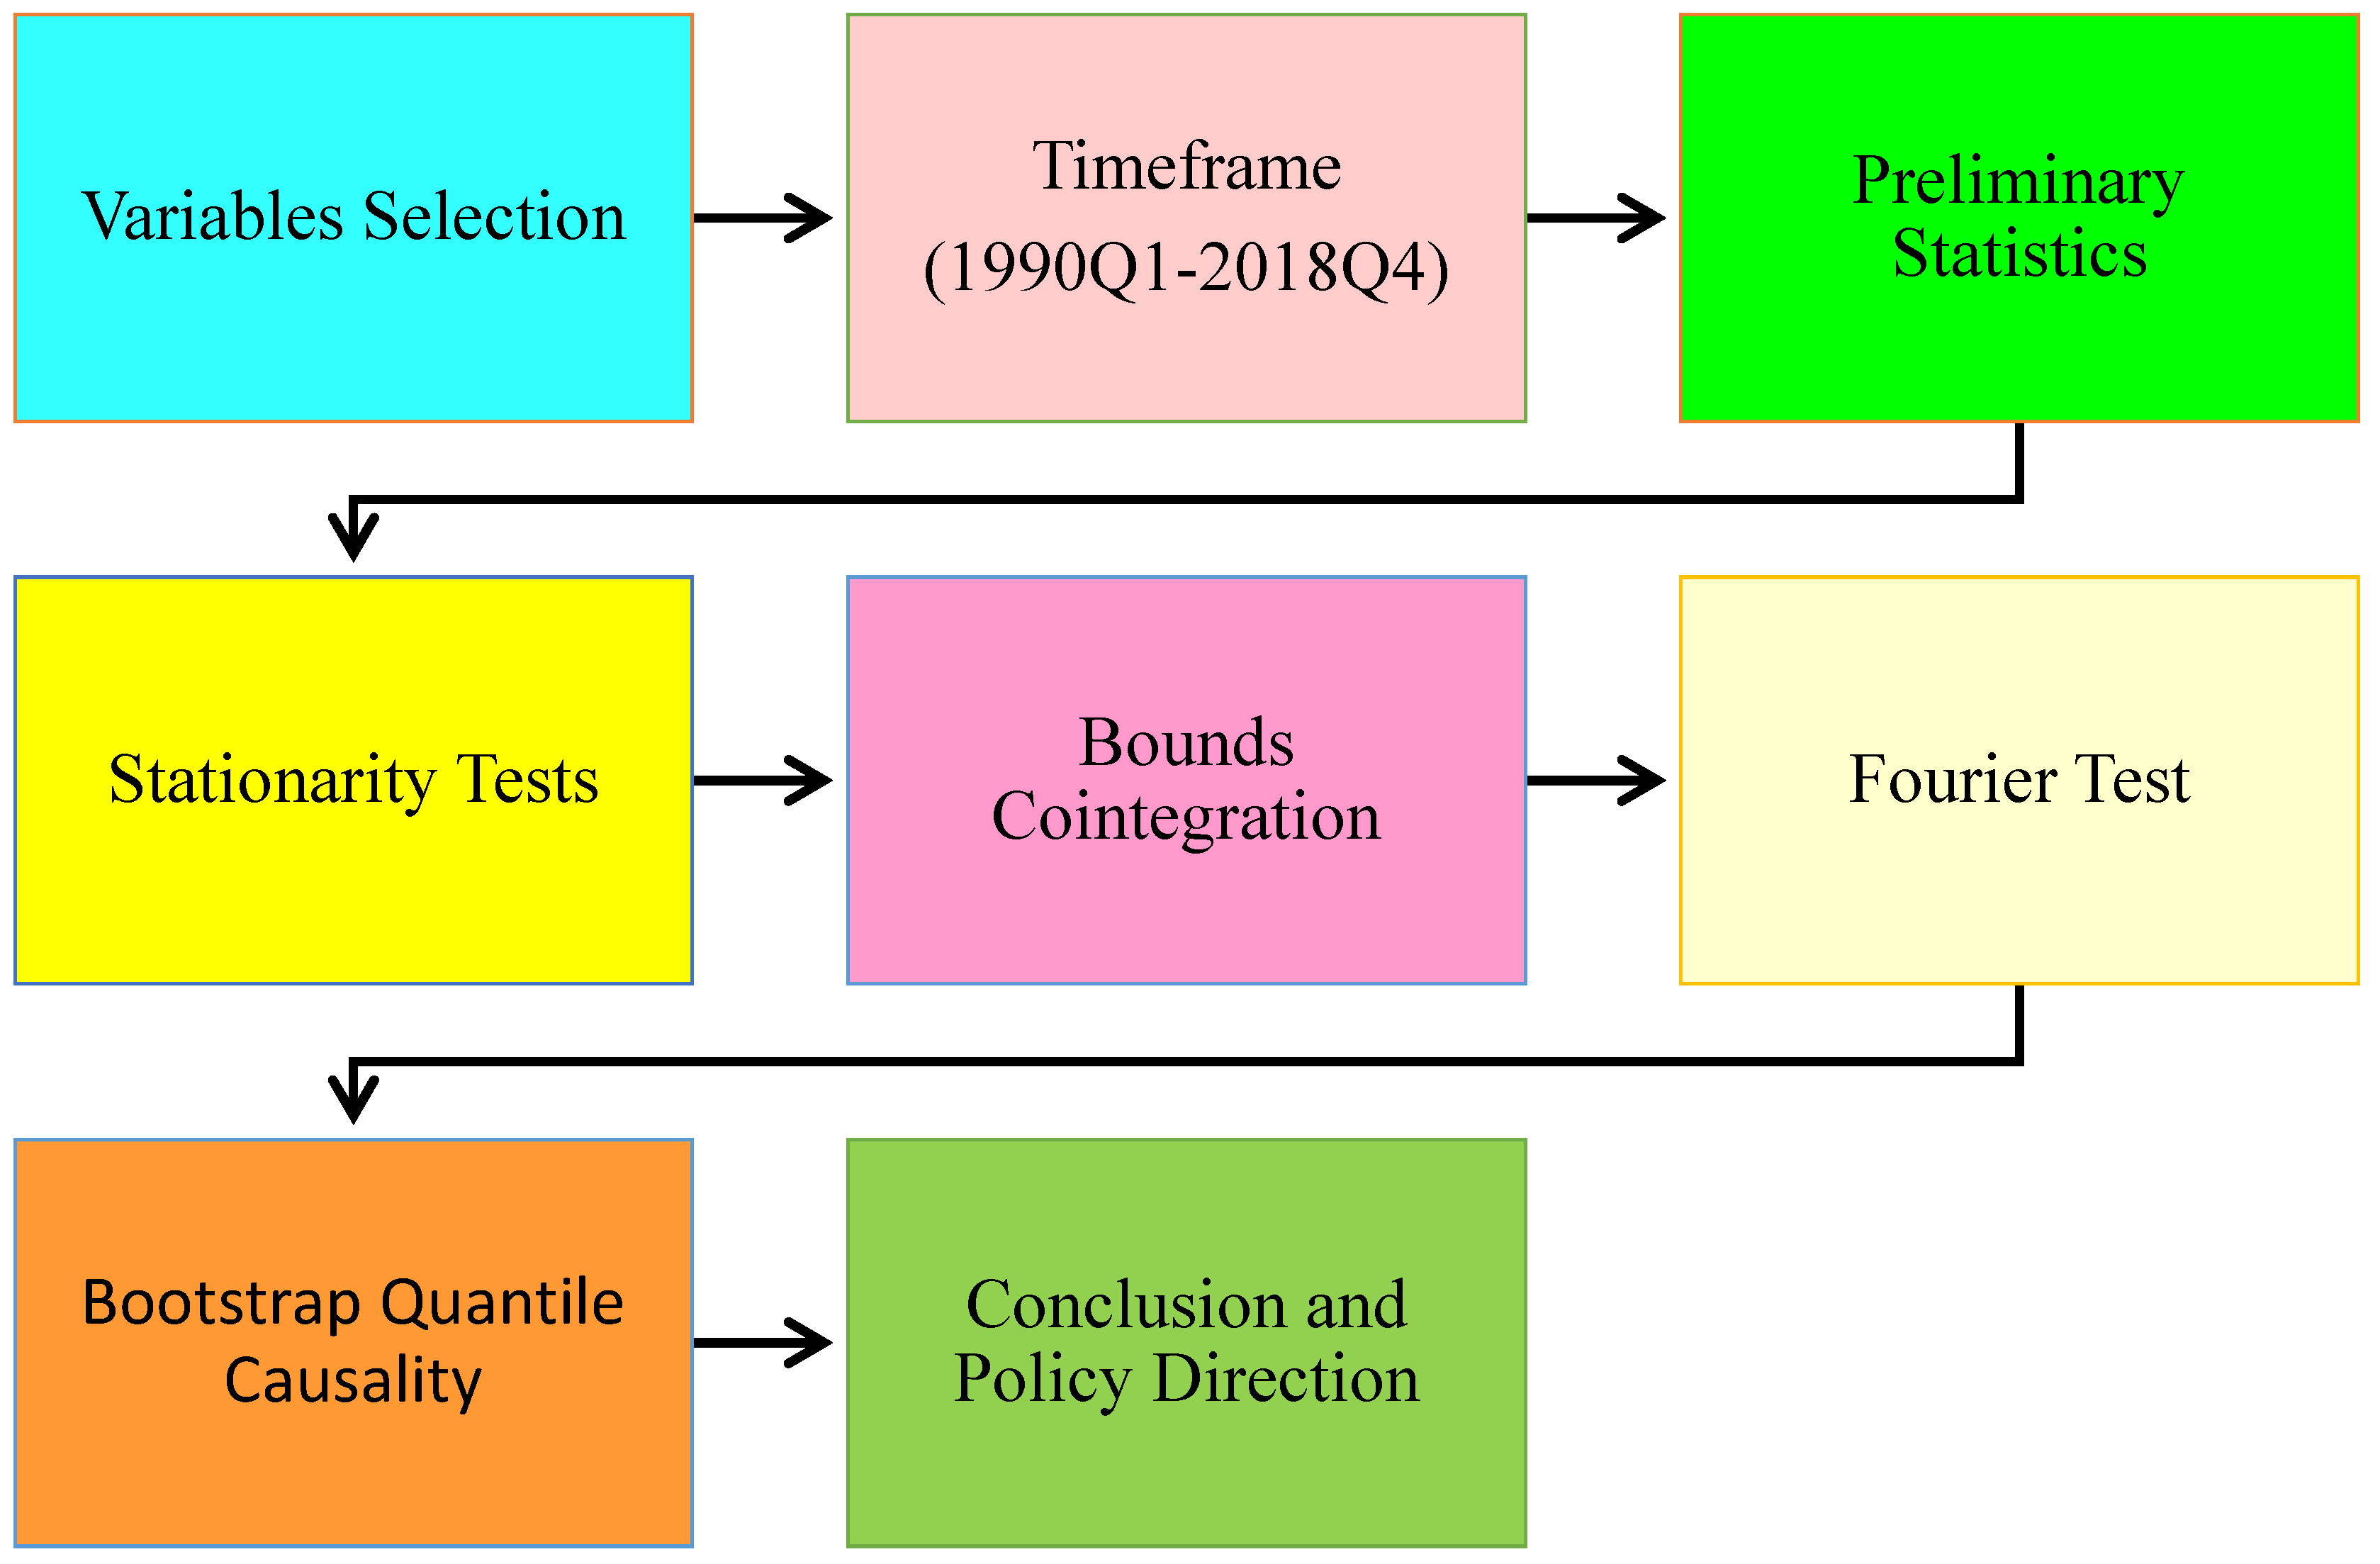
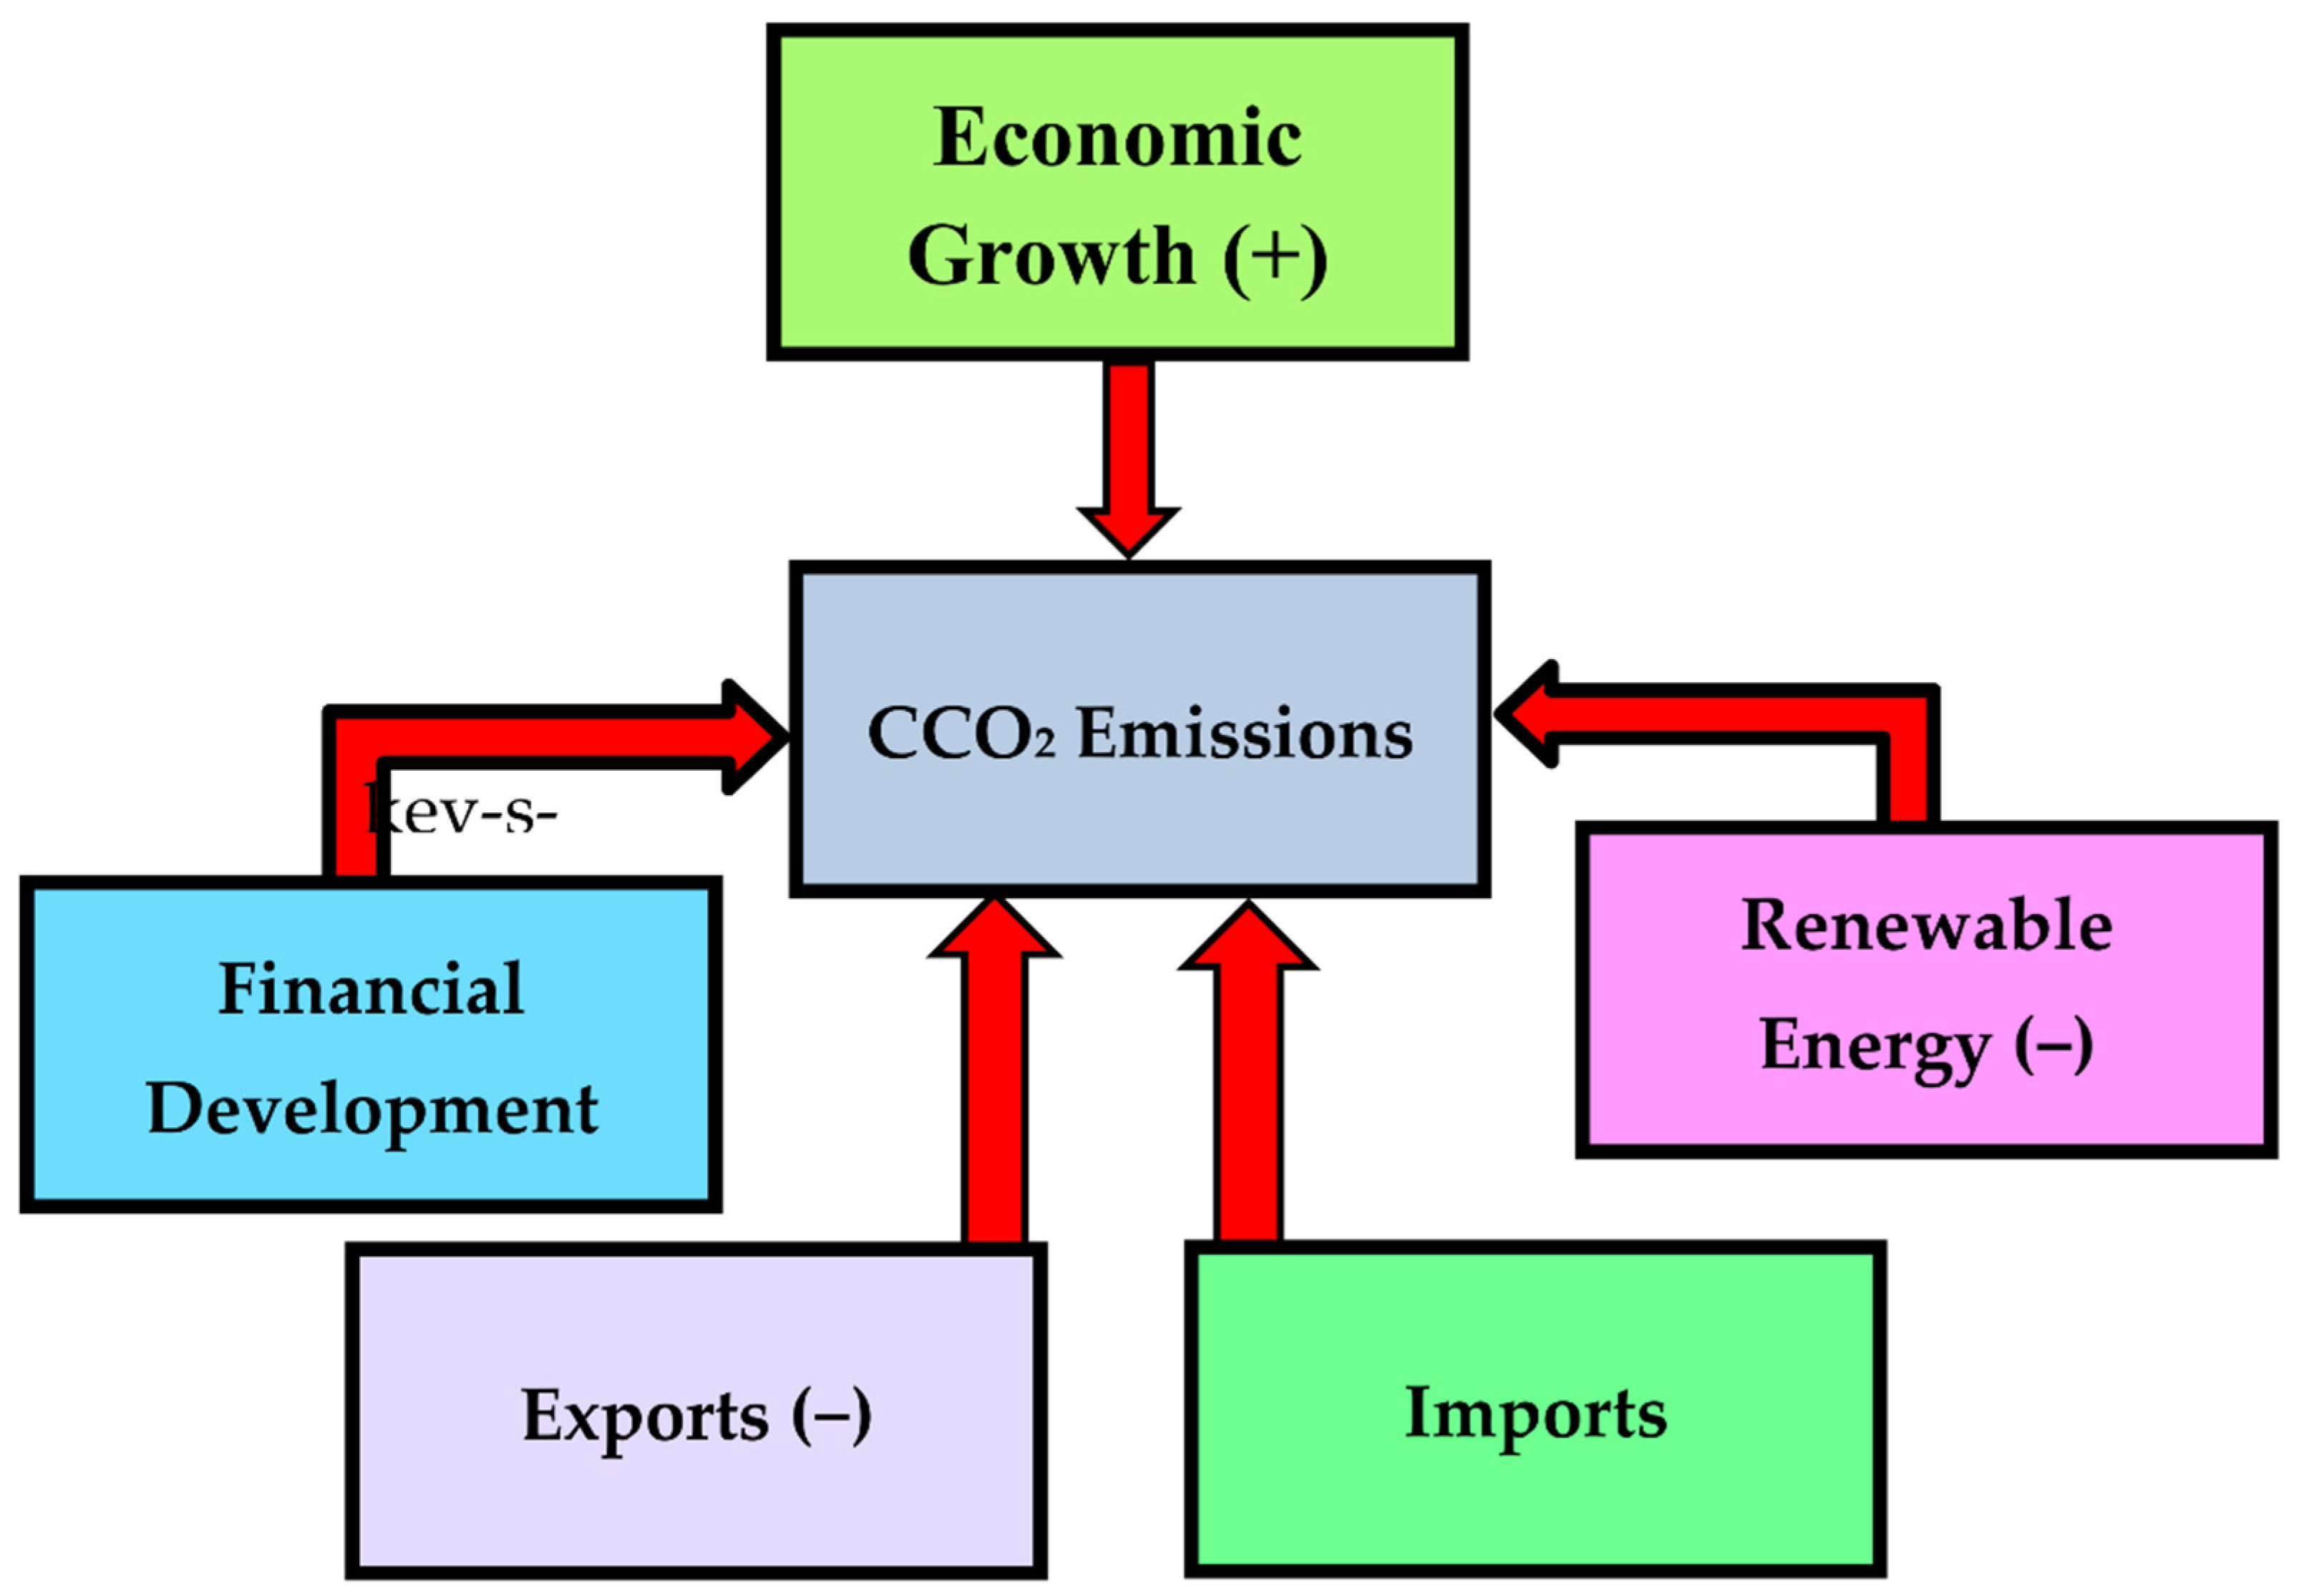
The current research evaluates the causal/interrelationship between CCO2 emissions and imports, green energy, exports, financial development, and economic growth in the MINT nations. The study used data from 1990 to 2019 to assess the interrelationship. The dependent variable is CCO2 while imports, renewable energy, financial development, exports, and GDP are the regressors. To minimize issues with small observations, all the yearly frequency data are adjusted to logarithmic values utilizing the quadratic match-sum approach and then normalized to quarterly frequencies. It is favored over other interpolation approaches because it takes seasonality into account by minimizing data changes when it switches from low to high frequency [4,25,40]. Statistical descriptions for quarterly data are provided in Table 1 and Table 2. The six variables in each MINT country are not distributed normally, as shown by the Jarque–Bera test probability values. It is preferable to utilize median-based quantile causality tests for non-normally distributed series rather than mean-based conventional Granger causality tests [25,41]. Premised on this, we use the Fourier causality test to assess the factors affecting CCO2 emissions. Figure 1 presents the flow of the study.
3.2. Theoretical Framework
This section explains the theoretical procedure through which imports and exports, economic growth, financial development, and renewable energy impact CCO2 emissions. CCO2 emissions encompass both household and government final domestic consumption demand, gross fixed capital formation, inventory changes, and purchases made overseas by residents [9,42]. This indicator is trade-adjusted, covers the entire carbon chain, and aids in identifying the production of carbon emissions in one nation and their absorption in another [7,43,44]. As a result, the impact of international trade in this research is calculated by separating imports and exports. According to the theory, increased exports give more products and services to recipient nations to consume while leaving less for local consumption. Exports include services and goods produced in one nation and used in another. As a result, the receiving nation’s CO2 from exports must be emitted. Thus, EXP is anticipated to decrease CCO2 emissions, i.e., .
On the other hand, imports encompass services and goods manufactured by a foreign nation and used locally, and must release CO2 domestically. It is projected that boosting exports will cut CCO2 emissions in the host nation, whereas expanding imports will boost CCO2 emissions in the recipient state. Aside from imports and exports, carbon emissions from the process of production are retained in the host nation [36,38,45,46]. Theoretically, an increase in imports is associated with increased consumption because it is regarded as one of the essential parts of any nation’s overall consumption level, which is particularly true in the case of MINT nations. The MINT economies are emerging economies, and their imports include a significant share of intermediate and final services and goods consumed by the host economies. Several studies, such as [35,38,47], have already noticed this behavior. Thus, REC is anticipated to decrease CCO2 emissions, i.e., .
Likewise, GDP is a gauge of the economy’s health and includes several parts, such as consumption, investment, government spending, and net exports. Since consumption accounts for the majority of GDP, increased consumption is positively related to CCO2 emissions [48,49]. Thus, GDP is anticipated to increase CCO2 emissions, i.e., . The theoretical foundation for the renewable energy consumption and CCO2 emissions negative connection is that renewable energy technologies use sustainable and greener energy sources that meet future and current demands [50,51]. Based on the above principles, renewable energy usage is predicted to reduce CO2 emissions. Thus, REC is anticipated to decrease CCO2 emissions, i.e., .
A stable financial market has the potential to support sustainable energy, which would be advantageous for the ecosystem. Likewise, some investigations contend that the stock market will help to preserve the ecosystem by increasing financial access, expanding financial networks, mobilizing the capital needed to invest in eco-friendly infrastructure and lowering manufacturing costs. According to some analyses, financial development may attract FDI and spur innovative research to enhance the ecosystem. As per [52], financial development may facilitate investment in energy conservation technologies to increase ecological integrity. On the other hand, some studies have cautioned that higher financial development may lead to more CO2 [25,53]. According to [54], a stable financial system can encourage investment but also damage the environment by increasing energy use. Thus, financial development is anticipated to decrease CCO2 emissions, i.e., or increase CCO2 if not eco-friendly, i.e., .
3.3. Methodology
Nonlinearities and structural break (s) are not considered by the traditional [55] causality test. Moreover, Ref. [56] improved the vector autoregression (VAR) model by including Fourier approximations to avoid causality analysis by ignoring structural breaks. This allowed for the inclusion of smooth structural break(s) in the causality analysis. Nevertheless, the method in [56] does not guard against information loss over the long term. As a result, the [57] causality test was updated by [58] to include the Fourier approximation to safeguard against long-term information loss and consider smooth structural modifications. In this approach, termed Fourier-TY, the technique of [59] is utilized as shown in Equation (1).
where sin and cos represent sine and cosine, optimal frequency is shown by k; the trend is depicted by t, the observation number is shown by T, and is roughly equal to 3.145. The TY causality test in Equation (2) is replaced by α(t) in this Fourier approximation.
where the time intercept is denoted by time-dependent intercept, the optimal lag is denoted by j, the maximum integration order of variables is denoted by pmax, and the error term is shown by . The presumption that the constant term does not shift with time is relaxed by [58] by replacing the Fourier approximation in Equation (1) for α(t). As a result, the TY causality test considers smooth structural transitions with an undetermined structure, date, and number, as depicted in Equation (3).
In Equation (3), the cos and sin significance are evaluated with an F-test to help ascertain whether their coefficients are equal to 0 ( = = 0). It is suitable to employ the Fourier approximation if the coefficients differ from 0. Therefore, the causality interrelationships between indicators can be evaluated as .
While the FTY causality test initiated by [58] has several benefits, the conventional least squares approach is ineffective when the series is distributed normally and has a non-linear form. Hence, based on quantile regression, [27] recommended using the Fourier TY causality test. This novel method, termed “Bootstrap Fourier Granger causality in quantiles” (BFGC-Q), is shown below in Equation (4).
where and are the optimal frequency and lag length, respectively, τ and Z represent a specific quantile and covariate matrix. The following can be used to test the null of non-causality in various quantiles by estimating Equations (5) and (6):
Following that, the BFGC-Q causality test’s Wald statistics are computed. The critical values acquired from the bootstrap simulations are then contrasted with the Wald statistics gathered using Equation (6). The occurrence of causation can be determined if the Wald statistic for the relevant quantile is higher than the threshold value.
4. Empirical Results
4.1. Stationarity Test Results
In this paper, we employ the BFGC-Q method to test the causality between CCO2 emissions and IMP, EXP, FD, GDP, and REC in the MINT nations, utilizing data between 1990Q1 and 2019Q4. The maximum integration order of the series is verified in the first phase of the investigation using conventional unit root tests, and the findings are presented in Table 3. The ERS and ADF unit root test findings uncover that all the indicators are stationary at the first difference (I(1)).
4.2. Cointegration
The current study proceeded by testing the cointegration between CCO2 emissions and the regressors. In doing so, we used the bounds test with the results presented in Table 4. The outcomes disclose evidence of cointegration among the variables in each country.
4.3. Fourier Test Results
In the second phase of the research, we analyze the Fourier terms’ significance by utilizing the F-test (see Table 5), after the indicators’ order of integration is affirmed. The results uncover that the Ho hypothesis of the absence of Fourier parts, i.e., γ1 = γ2 = 0, is dismissed at a significance level of 5% in the MINT nations.
4.4. Fourier Quantile Causality Results
In the final phase of the investigation, we apply the BFGC-Q test to examine the causal effects of imports, economic growth, exports, financial development, and renewable energy on consumption-based carbon emissions (CCO2). The outcomes of the BFGC-Q causality test for the MINT nations are shown in Table 6, Table 7, Table 8 and Table 9.
The outcomes of the BFGC-Q causality test for Mexico are depicted in Table 5. The outcomes reveal unidirectional causality from economic growth to CCO2 emissions in the higher quantiles (0.90). Likewise, in the lower (0.30) and middle (0.50) quantiles, unidirectional causality from renewable energy to CCO2 emissions surfaced. Furthermore, a unidirectional causality emerged in the middle (0.50) and higher (0.70) quantiles from exports to CCO2 emissions. Moreover, in the lower (0.30) and middle (0.50) quantiles, unidirectional causality from imports to CCO2 emissions emerged. In the middle quantile (0.30), financial development Granger cause CCO2 emissions. These results disclose that the interrelationship between financial development, imports, economic growth, exports, and renewable energy is sensitive to quantiles.
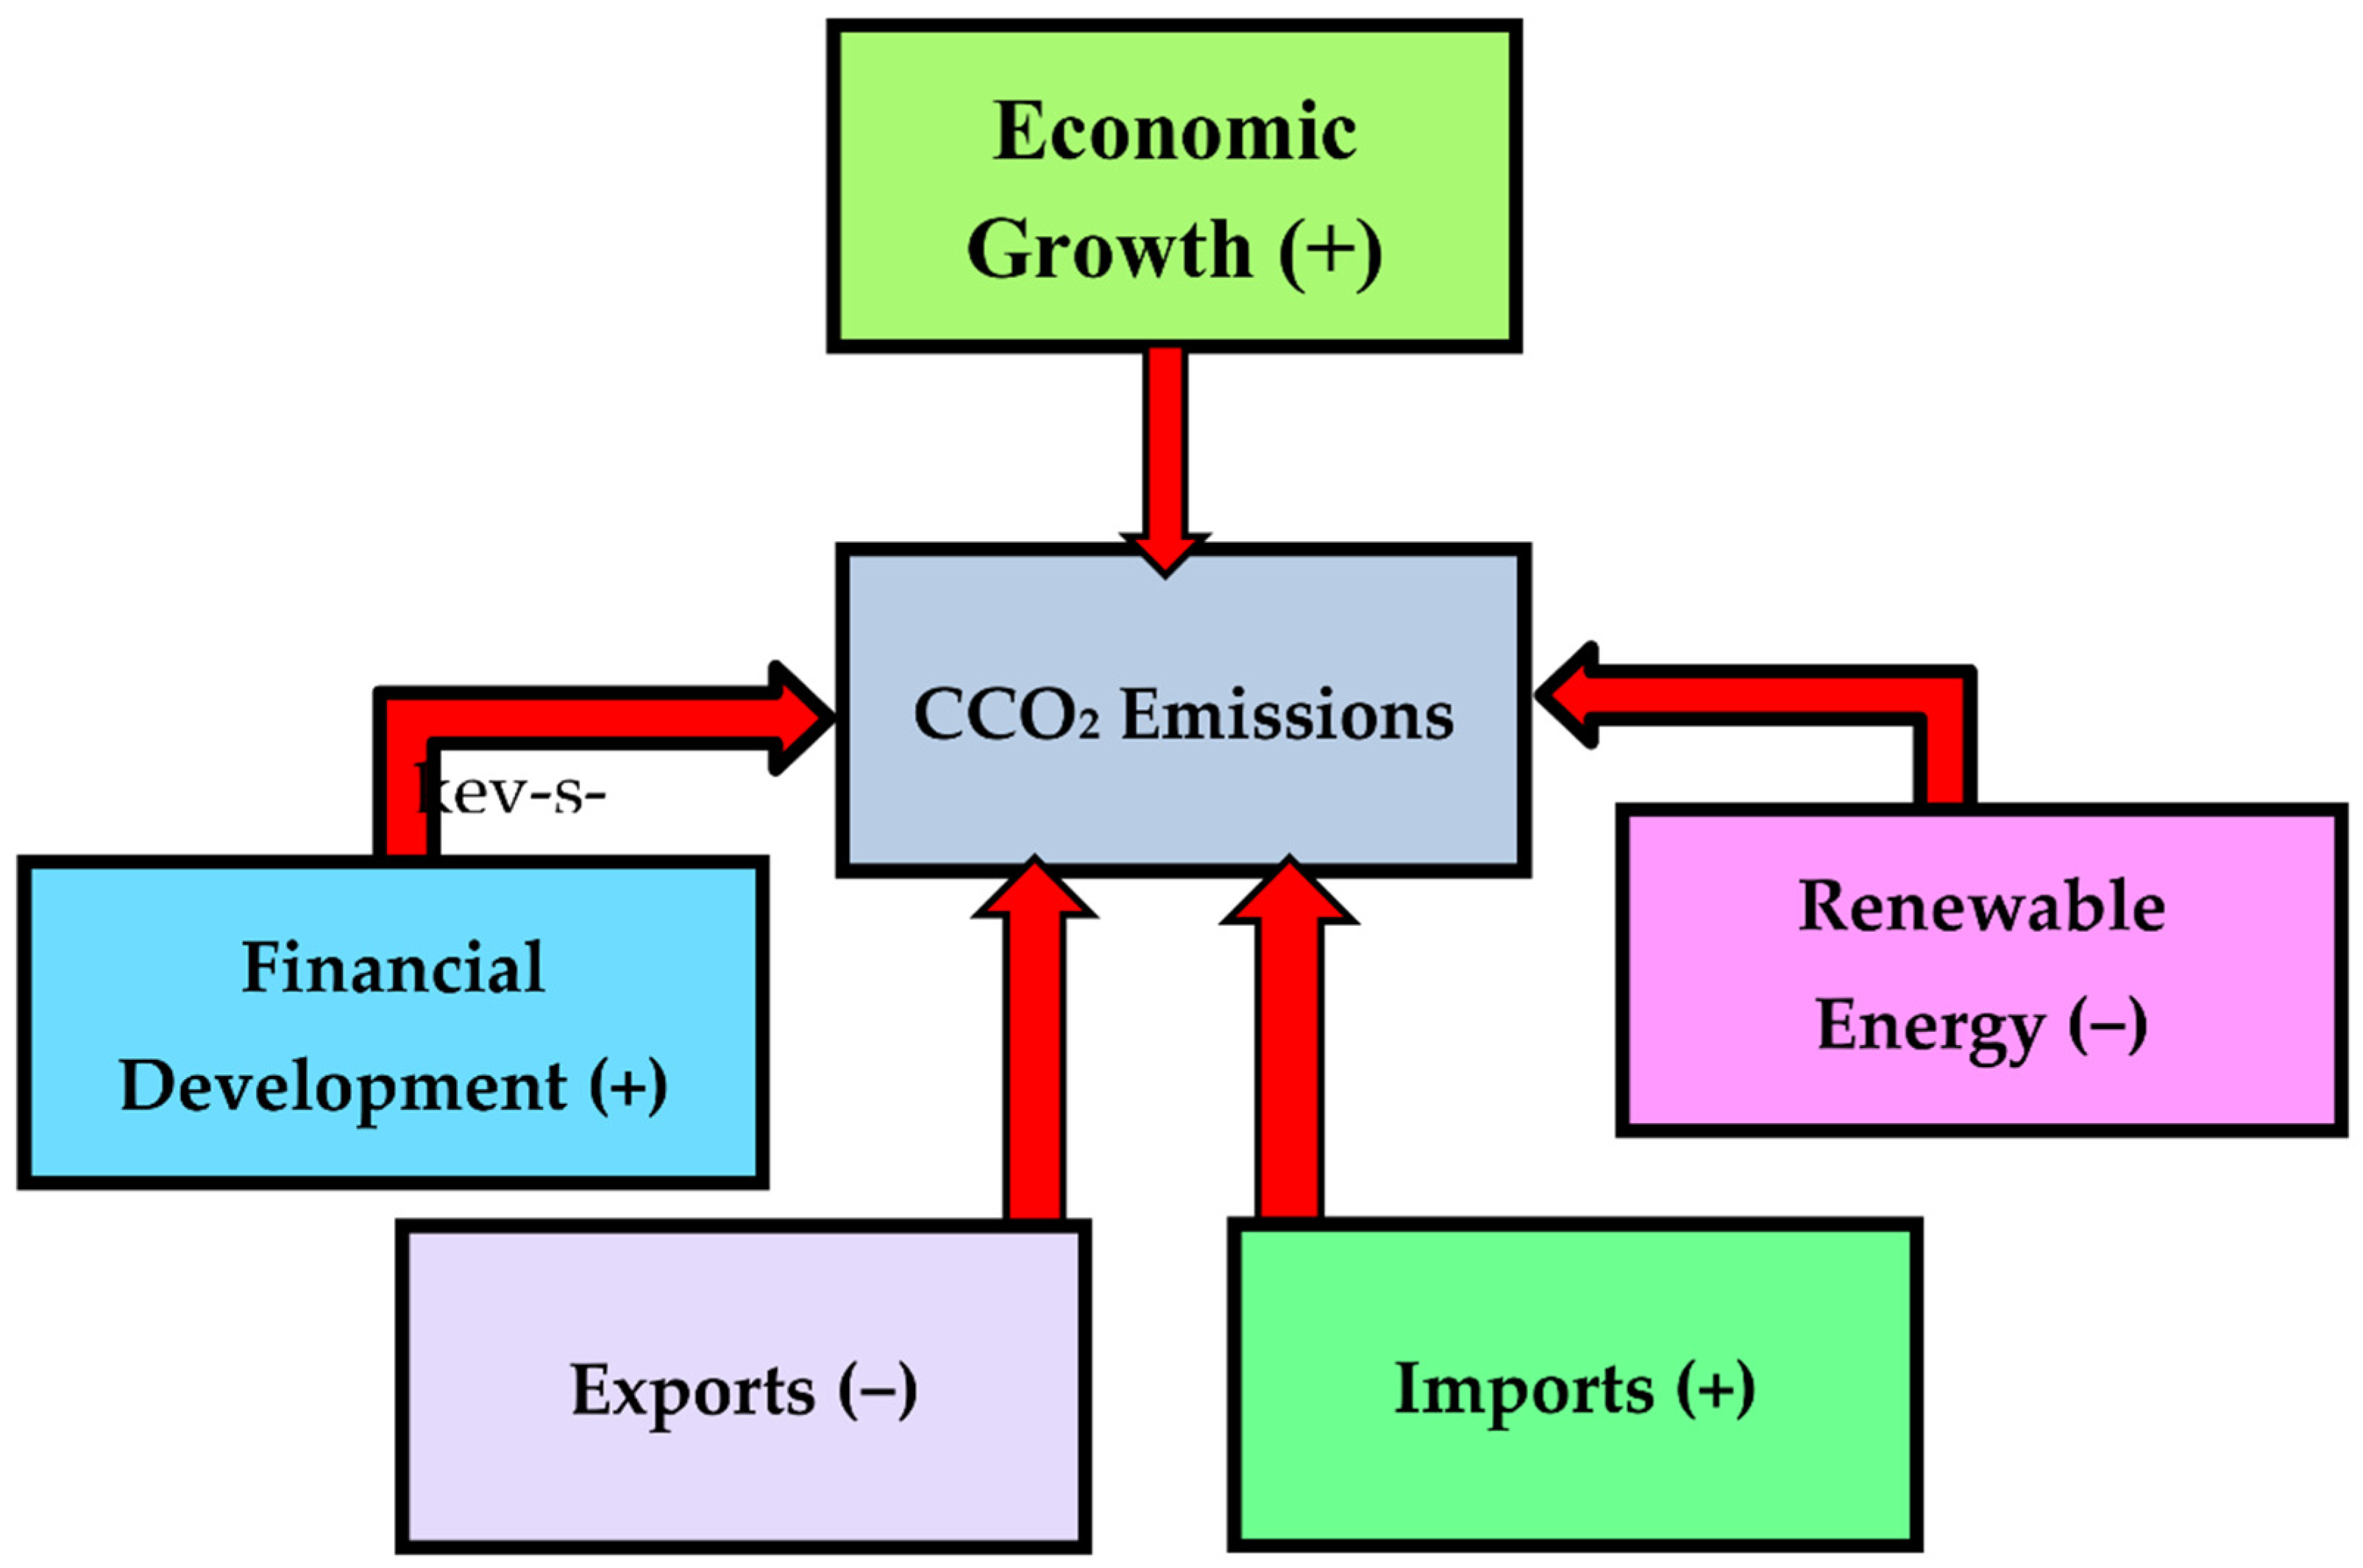
Regarding the sign of the effect, economic growth impacts CCO2 positively in Mexico. This result is anticipated, given that Mexico is a developing nation, and initiatives towards economic expansion are often favored at the expense of the ecosystem. A similar result in the case of Mexico is documented by [60,61]. Furthermore, we observe the negative effect of clean energy on CCO2, which is as expected. This shows that renewable energy use in Mexico contributes to a significant reduction in CCO2 emissions. This outcome is as anticipated given the recent development in Mexico’s renewable energy. According to the Mexican government’s energy growth plan, 328,597.98 GWh of electricity were produced in Mexico in 2021, with 29.5% of that energy coming from renewable sources, including efficient cogeneration, solar photovoltaic, wind, biofuel, geothermal, nuclear power, and hydroelectric. Wu et al. [8,62,63] reported similar results. Moreover, the effect of imports on CCO2 is positive while the effect of exports on CCO2 is negative, which corroborates the theoretical framework. The results also disclosed that financial development impacts CCO2 positively, suggesting that an upsurge in financial development triggers the intensification of CCO2. The studies [64,65] documented similar findings. Figure 2 portrays the summary of findings for Indonesia.
Table 7 presents the causal/interrelationship between CCO2 and the regressors in Indonesia. We fail to accept the Ho hypothesis of no causality from GDP to CCO2 emissions in each quantile. This finding shows that GDP has predictive power over CCO2 in each quantile. Furthermore, in the lower quantile (0.1–0.30), renewable energy has predictive power over CCO2 emissions, which is in line with the studies of [2,22,66]. Surprisingly, exports and imports do not have predictive power over CCO2 in each quantile. These outcomes contradict the studies [31,67]. At the lower tails (0.10–0.30), we find causality from financial development to CCO2, suggesting that financial development has predictive power over CCO2.
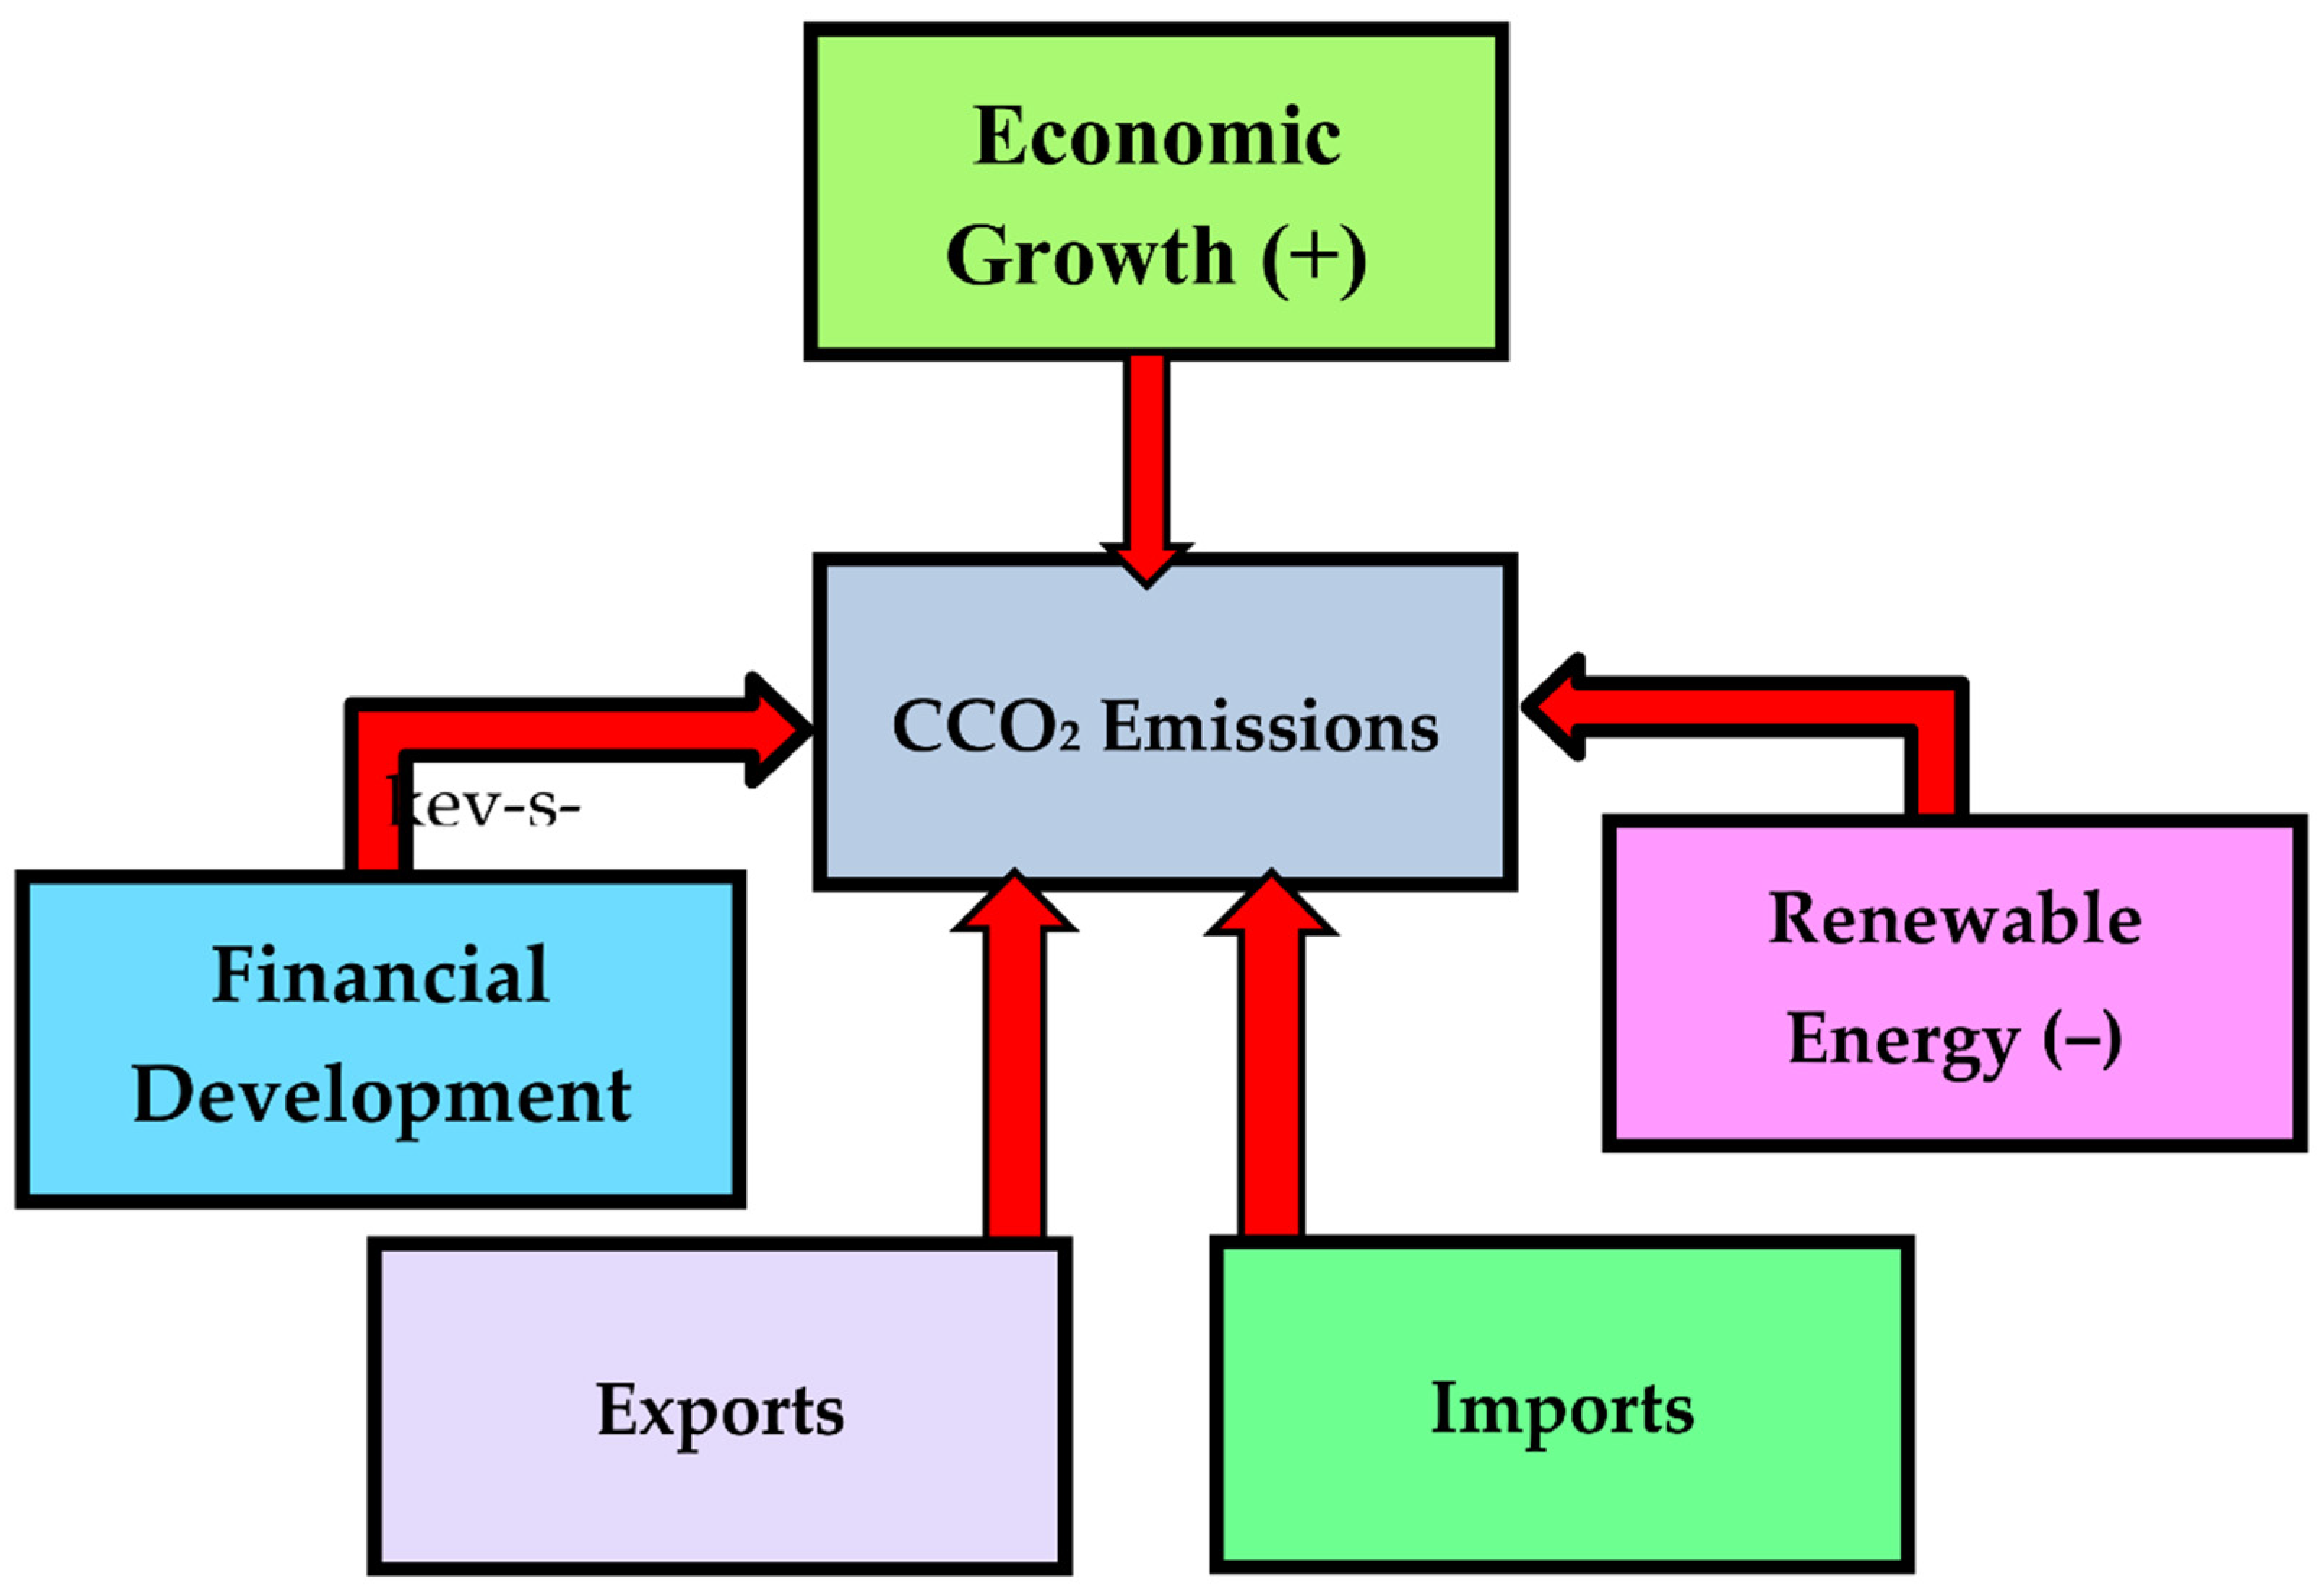
Regarding the sign of the interrelationship, we found a positive effect of economic growth on CCO2. Similar to Mexico, Indonesia is a developing nation where priority is given to constant economic expansion while neglecting ecological sustainability. For instance, between 1999 and 2019, Indonesia witnessed a 115% increase in GDP (World Bank, 2022). This growth is accompanied by a 76% increase in CO2 emissions per capita (World Bank, 2022, https://data.worldbank.org/country/indonesia, assessed on 5 January 2022). Furthermore, the decreasing effect of renewable energy on CCO2 suggests that the intensification of green energy upsurges ecological quality in Indonesia. The investment in renewable energy in Indonesia is responsible for this favorable impact of renewable energy on ecological quality. For instance, as of April 2021, Indonesia’s energy mix had 13.83% renewable energy, with hydropower accounting for 7.9%, geothermal for 5.6%, and other renewable energy providing 0.33% (https://www.ashurst.com/en/news-and-insights/legal-updates/indonesia-renewable-energy-laws-and-regulations-2022/, assessed on 4 October 2022). Indonesia contributes approximately 12% of the country’s renewable energy. Indonesia can only achieve this goal by shifting energy investment toward renewable resources. Shahbaz et al. [9,68,69] documented similar findings. Similar to Mexico, imports and exports do not significantly influence CCO2 emissions, which is in line with the studies of [64], who found an insignificant connection between CO2 and financial development in Malaysia. Figure 3 portrays the summary of findings for Nigeria.
Table 8 presents the causal/interrelationship between CCO2 and the regressors in Nigeria. In the lower (0.3), middle (0.50), and higher (0.70) quantiles, a unidirectional causality emerged from GDP to CCO2 emissions, which is similar to the results obtained for Mexico and Indonesia. Furthermore, in the lower (0.1–0.30) tails, renewable energy Granger cause CCO2 in Nigeria, demonstrating the predictive power of renewable energy over CCO2. Similar to Mexico, exports have predictive power over CCO2 emissions in the extreme higher (0.90) quantile.
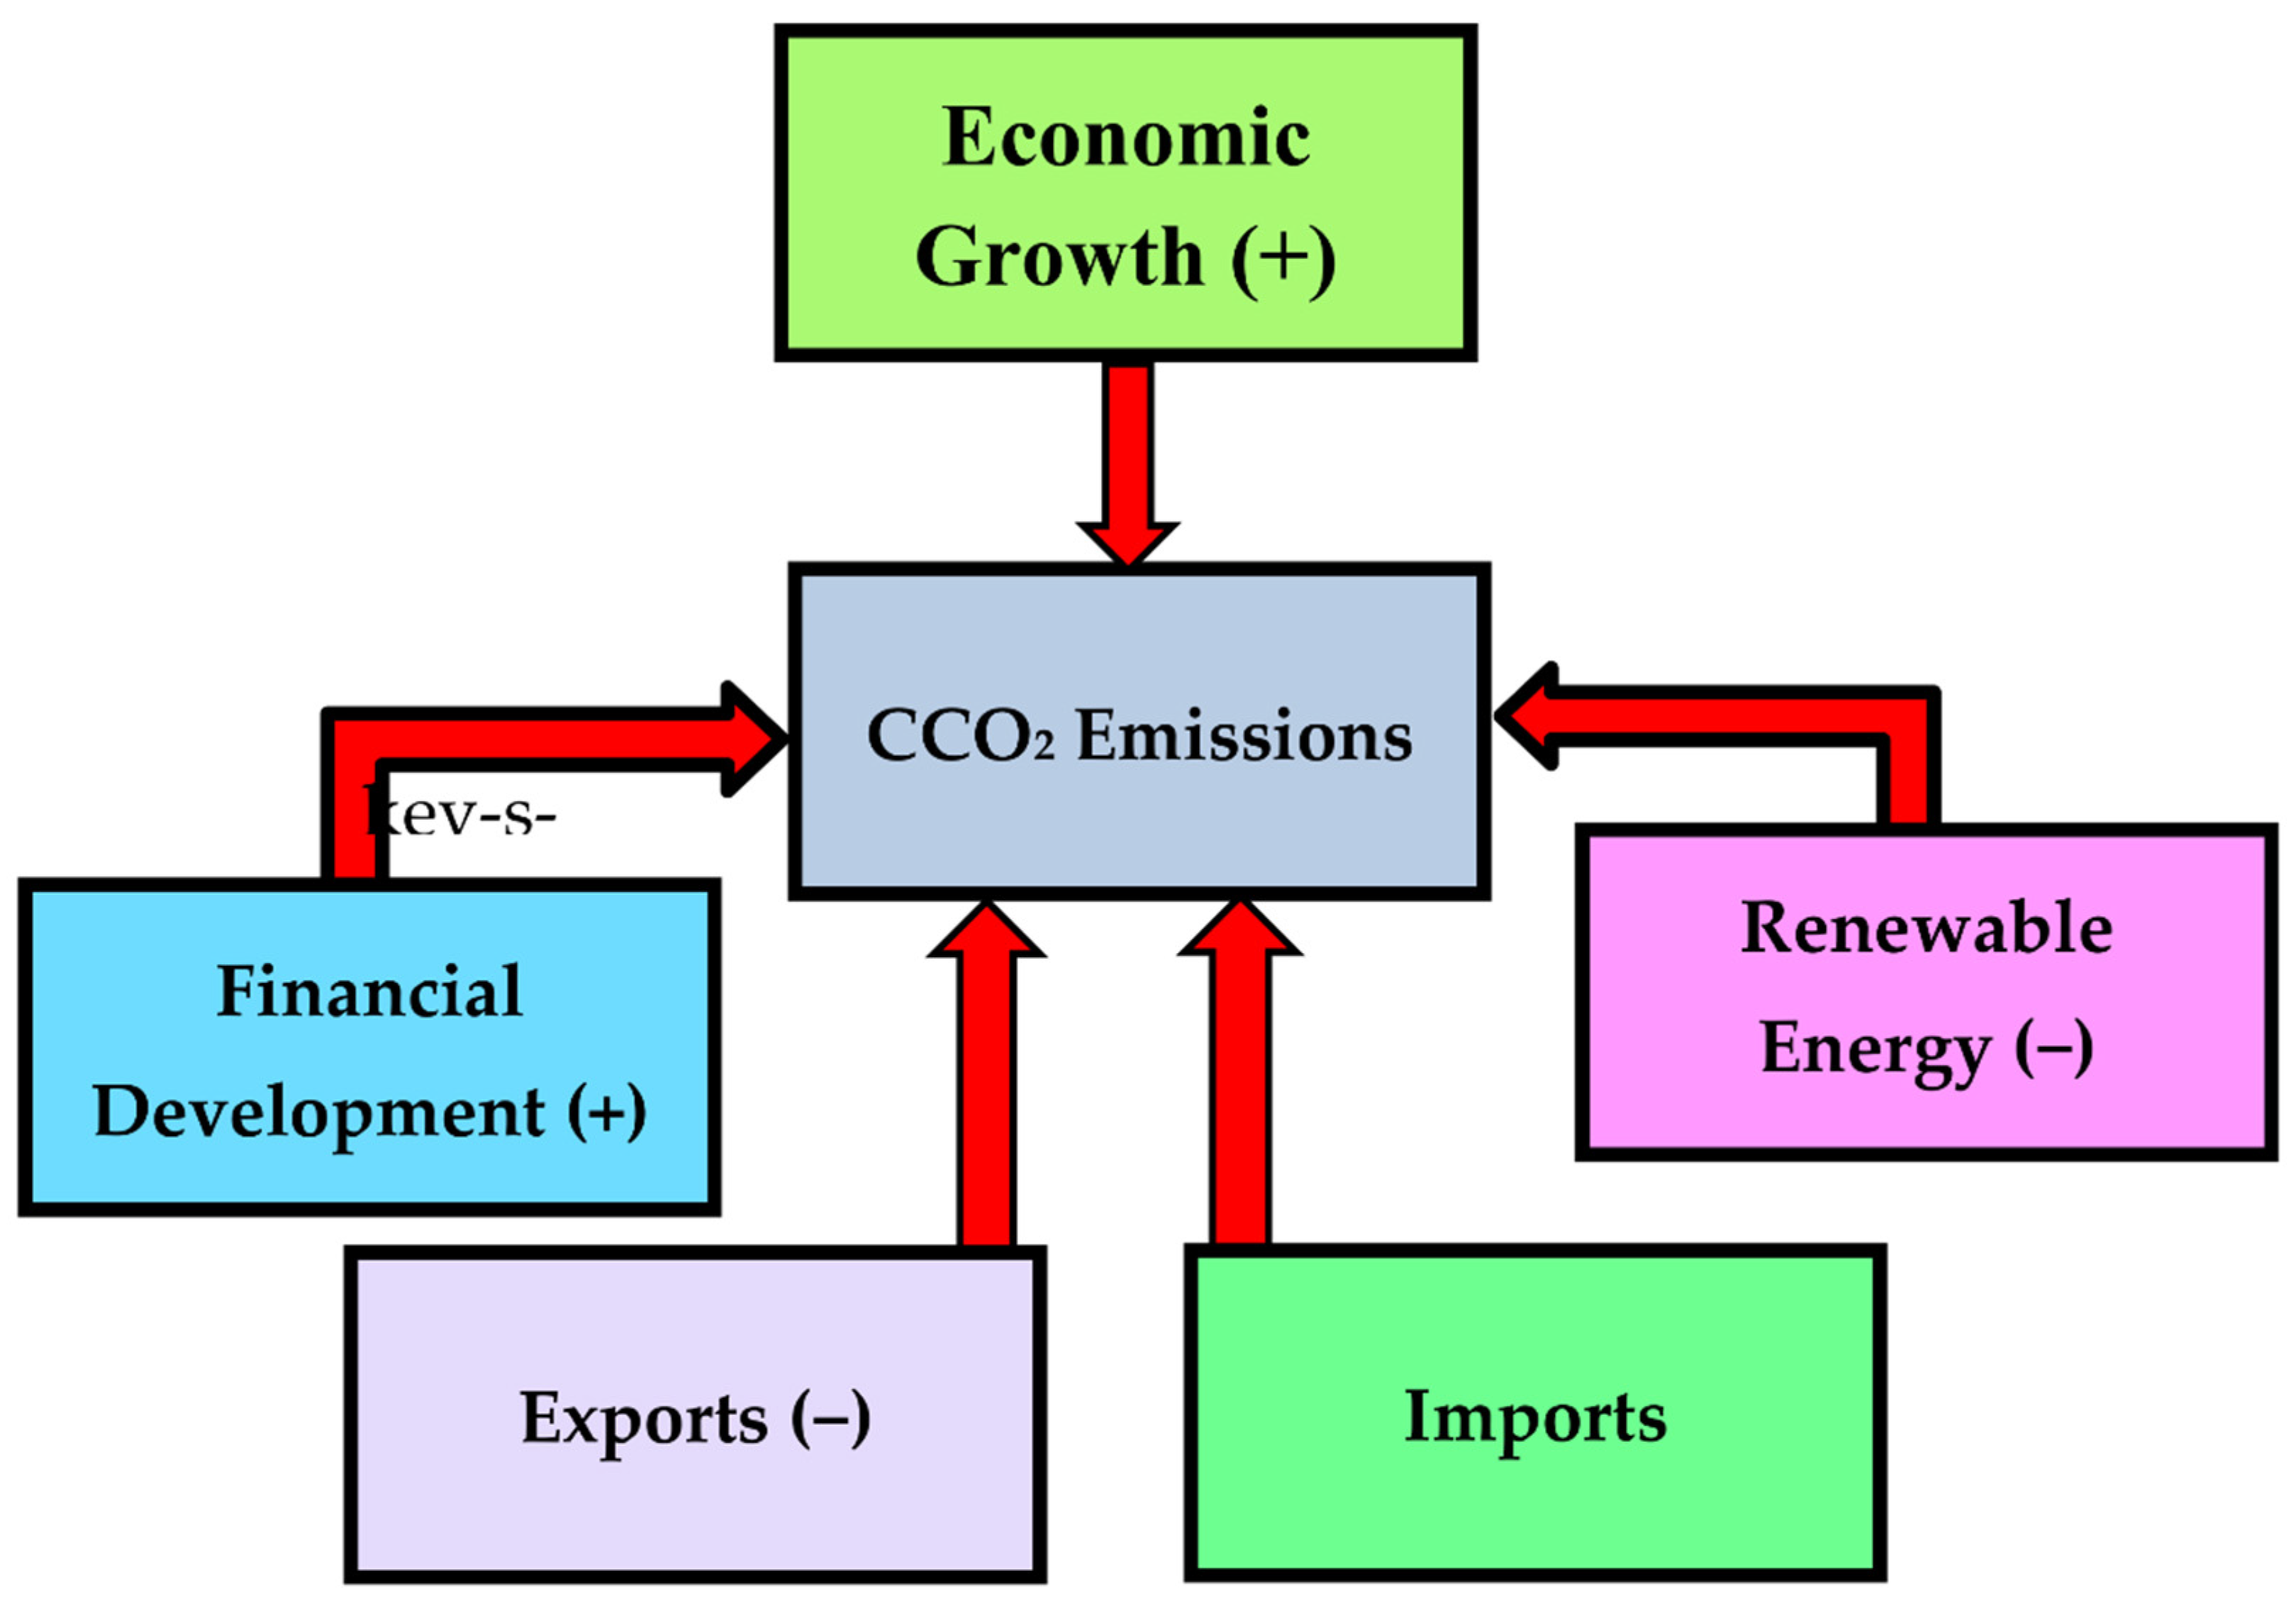
The sign of the relationship shows that economic growth upsurges CCO2 which is expected given that Nigeria is an emerging nation. Emerging nations such as Nigeria are pro-growth, which implies that they are pro-growth in their policies. Little or no attention is given to their ecosystem. The studies [1,61] documented similar results. Likewise, the negative effect of green energy is observed, demonstrating that clean energy boosts ecological integrity in Nigeria. The findings of [29,33] comply with this finding. Similarly, exports boost ecological quality as shown by the negative effect of exports on CCO2 which is in line with the study of [26]. Lastly, financial development contributes to the devastation of the ecosystem, as shown by the positive effect of financial development on CCO2. The studies [29,34] documented similar findings. Figure 4 portrays the summary of results for Turkey.
Table 9 presents the causal/interrelationship between CCO2 and the regressors in Turkey. In the higher (0.70) quantile, a unidirectional causality surfaced from GDP to CCO2 emissions, similar to the results obtained for Mexico, Nigeria, and Indonesia. In the middle (0.5) and higher (0.70) tails, renewable energy has predictive power over CCO2. Moreover, we observe a unidirectional causality from exports to CCO2 in the middle (0.50) and higher (0.70) quantiles. Likewise, in the middle (0.50) quantile of imports, Granger causes CCO2 emissions.
Regarding the effect, economic growth impacts CCO2 positively, which is anticipated given that Turkey is an emerging nation. Emerging nations such as Turkey need to improve the standard of living of their citizens. As a result, they always prefer increasing their GDP while paying less attention to environmental sustainability. For instance, Turkey witnessed 92% economic growth between 1999 and 2019. This growth is accompanied by a 54% increase in CO2 emissions per capita [70]. Prior studies [25,63,71] reported similar results. Moreover, the effect of clean energy on CCO2 is negative, as expected, demonstrating that renewable energy boosts the integrity of the environment in Turkey. Over the previous five years, Turkey’s renewable energy capacity increased by 50%. The year 2019 saw Turkey add the 5th highest amount of new renewable capacity in Europe and the 15th highest globally. Given its abundant resource endowment, Turkey, according to the IEA research, may attain even higher growth in renewables, particularly wind, solar, and geothermal energy. Its robust prospect for expanding renewable energy sources applies to the heating industry and power generation. Importantly, Turkey employs barely 15% of its onshore wind capacity and an estimated 3% of its solar potential. With expenditures reaching about USD 7 billion, Turkey built the highest renewable capacity in a single year in 2020, at around 4800 megawatts (MW) (https://www.iea.org/news/turkey-s-success-in-renewables-is-helping-diversify-its-energy-mix-and-increase-its-energy-security, assessed on 10 September 2022). This outcome aligns with the studies of [72,73] for Turkey; however, the study of [74] contradicts this finding.
As expected, the effect of exports on CCO2 is negative, demonstrating that intensification in Turkey’s exports boosts ecological quality. A similar result is documented by the studies [1,75]. Furthermore, Turkey’s imports contribute to ecological quality decrease, as shown by the negative sign. The studies [4,71] also reported similar results. Lastly, an insignificant nexus exists between financial development and CCO2 emissions, which is anticipated given that Turkey’s financial system is in the initial phase. At this phase, financial development is expected not to boost EQ. The research of [64] also documented similar results. Figure 5 presents the summary of results.
5. Conclusions and Policy Ramifications
5.1. Conclusions
The MINT (Mexico, Indonesia, Nigeria, and Turkey) nations are among the top energy consumers and emitters of CO2 emissions. Notwithstanding the well-known Kyoto Protocol and Paris Accord, the globe’s temperature is rising, and CO2 emissions are at an all-time high. This has prompted scholars to look into the undiscovered factors that influence CCO2 emissions. In the literature, energy trade and consumption are well-known major contributors to CO2 emissions. Nonetheless, renewable energy is among the most effective strategies to reduce CO2 emissions. Therefore, to promote sustainable development, nations all over the globe are choosing eco-friendly strategies. The study utilizes BFGC-Q for the MINT nations between 1990Q1 and 2019Q4. This approach produces tail-causal and asymmetric causal connections between the indicators within the Fourier approximation, in contrast to the Toda–Yamamoto causality and other conventional Granger tests. The outcomes uncover a unidirectional causality from economic growth and renewable energy to CCO2 emissions in each MINT nation.
5.2. Policy Ramifications
This paper’s conclusions suggest that domestic consumption levels should be prioritized, particularly in those more energy-intensive sectors contributing to rising carbon emissions, to lessen the impact of imports and economic expansion on CCO2. Initiatives that do not impede trade and simply focus on reducing carbon emissions should be used to curb emissions-oriented imports. Since transportation and production machinery make up most of these nations’ imports, these nations should prioritize acquiring eco-friendly manufacturing equipment, which would lessen the impact of import emissions and the externality effect brought on by exports via trade. The role of the governmental initiative to completely assimilate it will be realized via international trade and CCO2 emissions initiatives. Moreover, taxing imported products that produce a lot of emissions would raise funds, tighten ecological rules and reduce import emissions. However, such a policy ramification might not be ideal.
Secondly, using renewable energy drastically reduces CCO2 emissions in the MINT nation. So, in terms of energy consumption, non-renewable energy or fossil fuel should be reduced, and green energy should be given priority to lower CCO2 emissions. In this context, additional funding is required to expand the sources of clean energy through supporting wind, hydro, and solar energy, as well as by encouraging and providing incentives for the general public to use energy-efficient appliances and technologies. For this, developing and implementing an appropriate energy policy is necessary. Thirdly, CO2 emissions rise as the economy expands. Thus, a major factor in reducing CO2 emissions is the execution of inclusive economic development, growth, and initiatives that do not affect the environment. Moreover, sustainable development will be ensured through green technology implementation, green growth, green urbanization, and green industrialization. Fourth, export quality reduces CCO2 emissions. Therefore, emphasizing cleaner, more effective, and eco-friendly industrial practices for producing goods promises to reduce CO2 emissions. In light of this, extensive and broad-based policy initiatives focused on improving export quality will be useful for enhancing ecological integrity in these nations without compromising the intended economic expansion.
Author Contributions
Data curation, T.S.A.; Formal analysis, T.S.A.; Methodology, M.A.; Resources, M.A.; Writing—original draft, T.S.A. All authors have read and agreed to the published version of the manuscript.
Funding
This research received no external funding.
Institutional Review Board Statement
Not applicable.
Informed Consent Statement
Not applicable.
Data Availability Statement
Data is readily available at a request from the corresponding author.
Conflicts of Interest
The authors declare no conflict of interest.
References
- Ozturk, I.; Acaravci, A. Energy consumption, CO2 emissions, economic growth, and foreign trade relationship in Cyprus and Malta. Energy Sources Part B Econ. Plan. Policy 2016, 11, 321–327. [Google Scholar] [CrossRef]
- Shahbaz, M.; Loganathan, N.; Muzaffar, A.T.; Ahmed, K.; Ali Jabran, M. How urbanization affects CO2 emissions in Malaysia? The application of STIRPAT model. Renew. Sustain. Energy Rev. 2016, 57, 83–93. [Google Scholar] [CrossRef] [Green Version]
- Samour, A.; Moyo, D.; Tursoy, T. Renewable energy, banking sector development, and carbon dioxide emissions nexus: A path toward sustainable development in South Africa. Renew. Energy 2022, 193, 1032–1040. [Google Scholar] [CrossRef]
- Balcilar, M.; Ozdemir, Z.A.; Tunçsiper, B.; Ozdemir, H.; Shahbaz, M. On the nexus among carbon dioxide emissions, energy consumption and economic growth in G-7 countries: New insights from the historical decomposition approach. Environ. Dev. Sustain. 2020, 22, 8097–8134. [Google Scholar] [CrossRef]
- Grossman, G.M.; Krueger, A.B. Economic Growth and the Environment. Q. J. Econ. 1995, 110, 353–377. [Google Scholar] [CrossRef] [Green Version]
- Ahmed, Z.; Udemba, E.N.; Adebayo, T.S.; Kirikkaleli, D. Determinants of consumption-based carbon emissions in Chile: An application of non-linear ARDL. Environ. Sci. Pollut. Res. 2021, 28, 43908–43922. [Google Scholar] [CrossRef]
- Ding, Q.; Khattak, S.I.; Ahmad, M. Towards sustainable production and consumption: Assessing the impact of energy productivity and eco-innovation on consumption-based carbon dioxide emissions (CCO2) in G-7 nations. Sustain. Prod. Consum. 2021, 27, 254–268. [Google Scholar] [CrossRef]
- Ibrahim, R.L.; Adebayo, T.S.; Awosusi, A.A.; Ajide, K.B.; Adewuyi, A.O.; Bolarinwa, F.O. Investigating the asymmetric effects of renewable energy-carbon neutrality nexus: Can technological innovation, trade openness, and transport services deliver the target for Germany? Energy Environ. 2022; preprint. [Google Scholar] [CrossRef]
- Kartal, M.T. Production-based disaggregated analysis of energy consumption and CO2 emission nexus: Evidence from the USA by novel dynamic ARDL simulation approach. Environ. Sci. Pollut. Res. 2022; preprint. [Google Scholar] [CrossRef]
- Kartal, M.T.; Kılıç Depren, S.; Ayhan, F.; Depren, Ö. Impact of renewable and fossil fuel energy consumption on environmental degradation: Evidence from USA by nonlinear approaches. Int. J. Sustain. Dev. World Ecol. 2022, 29, 738–755. [Google Scholar] [CrossRef]
- Awosusi, A.A.; Adebayo, T.S.; Altuntaş, M.; Agyekum, E.B.; Zawbaa, H.M.; Kamel, S. The dynamic impact of biomass and natural resources on ecological footprint in BRICS economies: A quantile regression evidence. Energy Rep. 2022, 8, 1979–1994. [Google Scholar] [CrossRef]
- Destek, M.A.; Sarkodie, S.A. Investigation of environmental Kuznets curve for ecological footprint: The role of energy and financial development. Sci. Total Environ. 2019, 650, 2483–2489. [Google Scholar] [CrossRef]
- Gyamfi, B.A.; Bekun, F.V.; Adebayo, T.S.; Rjoub, H.; Agboola, M.O.; Agyekum, E.B. Another look at the nexus between economic growth trajectory and emission within the context of developing country: Fresh insights from a nonparametric causality-in-quantiles test. Environ. Dev. Sustain. 2022; preprint. [Google Scholar] [CrossRef]
- Alola, A.A.; Adebayo, T.S. Are green resource productivity and environmental technologies the face of environmental sustainability in the Nordic region? Sustain. Dev. 2022, 2, 1–13. [Google Scholar] [CrossRef]
- Abbasi, K.R.; Hussain, K.; Haddad, A.M.; Salman, A.; Ozturk, I. The role of Financial Development and Technological Innovation towards Sustainable Development in Pakistan: Fresh insights from consumption and territory-based emissions. Technol. Forecast. Soc. Chang. 2022, 176, 121444. [Google Scholar] [CrossRef]
- Wu, L.; Adebayo, T.S.; Yue, X.-G.; Umut, A. The role of renewable energy consumption and financial development in environmental sustainability: Implications for the Nordic Countries. Int. J. Sustain. Dev. World Ecol. 2022; in press. [Google Scholar] [CrossRef]
- Al-mulali, U.; Tang, C.F.; Ozturk, I. Does financial development reduce environmental degradation? Evidence from a panel study of 129 countries. Environ. Sci. Pollut. Res. 2015, 22, 14891–14900. [Google Scholar] [CrossRef]
- Charfeddine, L.; Kahia, M. Impact of renewable energy consumption and financial development on CO2 emissions and economic growth in the MENA region: A panel vector autoregressive (PVAR) analysis. Renew. Energy 2019, 139, 198–213. [Google Scholar] [CrossRef]
- Ibrahiem, D.M. Do technological innovations and financial development improve environmental quality in Egypt? Environ. Sci. Pollut. Res. 2020, 27, 10869–10881. [Google Scholar] [CrossRef]
- O’Neill, J. Who you calling a BRIC. Bloomberg View 2013, 12, 63–79. [Google Scholar]
- Morgan, J.A.; Luca, J.; Wright, G.B.; Dispert, H. Mint Goes International: Innovation to Become Major Focus. In Proceedings of the International Conference on Engineering and Computer Education, Online, 27 July 2014; Volume 6. [Google Scholar]
- Samour, A.; Baskaya, M.M.; Tursoy, T. The Impact of Financial Development and FDI on Renewable Energy in the UAE: A Path towards Sustainable Development. Sustainability 2022, 14, 1208. [Google Scholar] [CrossRef]
- Altuntaş, M.; Awosusi, A.A.; Adebayo, T.S.; Kirikkaleli, D. Role of technological innovation and globalization in BRICS economies: Policy towards environmental sustainability. Int. J. Sustain. Dev. World Ecol. 2022, 29, 593–610. [Google Scholar] [CrossRef]
- Caglar, A.E.; Zafar, M.W.; Bekun, F.V.; Mert, M. Determinants of CO2 emissions in the BRICS economies: The role of partnerships investment in energy and economic complexity. Sustain. Energy Technol. Assess. 2022, 51, 101907. [Google Scholar] [CrossRef]
- Shahbaz, M.; Hye, Q.M.A.; Tiwari, A.K.; Leitão, N.C. Economic growth, energy consumption, financial development, international trade and CO2 emissions in Indonesia. Renew. Sustain. Energy Rev. 2013, 25, 109–121. [Google Scholar] [CrossRef] [Green Version]
- Khan, Z.; Ali, S.; Umar, M.; Kirikkaleli, D.; Jiao, Z. Consumption-based carbon emissions and International trade in G7 countries: The role of Environmental innovation and Renewable energy. Sci. Total Environ. 2020, 730, 138945. [Google Scholar] [CrossRef]
- Cheng, K.; Hsueh, H.-P.; Ranjbar, O.; Wang, M.-C.; Chang, T. Urbanization, coal consumption and CO2 emissions nexus in China using bootstrap Fourier Granger causality test in quantiles. Lett. Spat. Resour. Sci. 2021, 14, 31–49. [Google Scholar] [CrossRef]
- Fareed, Z.; Pata, U.K. Renewable, non-renewable energy consumption and income in top ten renewable energy-consuming countries: Advanced Fourier based panel data approaches. Renew. Energy 2022, 194, 805–821. [Google Scholar] [CrossRef]
- Qin, L.; Hou, Y.; Miao, X.; Zhang, X.; Rahim, S.; Kirikkaleli, D. Revisiting financial development and renewable energy electricity role in attaining China’s carbon neutrality target. J. Environ. Manag. 2021, 297, 113335. [Google Scholar] [CrossRef]
- Anwar, A.; Sinha, A.; Sharif, A.; Siddique, M.; Irshad, S.; Anwar, W.; Malik, S. The nexus between urbanization, renewable energy consumption, financial development, and CO2 emissions: Evidence from selected Asian countries. Environ. Dev. Sustain. 2022, 24, 6556–6576. [Google Scholar] [CrossRef]
- Khan, A.; Chenggang, Y.; Hussain, J.; Kui, Z. Impact of technological innovation, financial development and foreign direct investment on renewable energy, non-renewable energy and the environment in belt & Road Initiative countries. Renew. Energy 2021, 171, 479–491. [Google Scholar] [CrossRef]
- Kirikkaleli, D.; Adebayo, T.S. Do renewable energy consumption and financial development matter for environmental sustainability? New global evidence. Sustain. Dev. 2021, 29, 583–594. [Google Scholar] [CrossRef]
- Usman, M.; Balsalobre-Lorente, D. Environmental concern in the era of industrialization: Can financial development, renewable energy and natural resources alleviate some load? Energy Policy 2022, 162, 112780. [Google Scholar] [CrossRef]
- Ramzan, M.; Raza, S.A.; Usman, M.; Sharma, G.D.; Iqbal, H.A. Environmental cost of non-renewable energy and economic progress: Do ICT and financial development mitigate some burden? J. Clean. Prod. 2022, 333, 130066. [Google Scholar] [CrossRef]
- Mahmood, H. The spatial analyses of consumption-based CO2 emissions, exports, imports, and FDI nexus in GCC countries. Environ. Sci. Pollut. Res. 2022, 29, 48301–48311. [Google Scholar] [CrossRef]
- Hasanov, F.J.; Liddle, B.; Mikayilov, J.I. The impact of international trade on CO2 emissions in oil exporting countries: Territory vs consumption emissions accounting. Energy Econ. 2018, 74, 343–350. [Google Scholar] [CrossRef]
- Dumitrescu, E.-I.; Hurlin, C. Testing for Granger non-causality in heterogeneous panels. Econ. Model. 2012, 29, 1450–1460. [Google Scholar] [CrossRef] [Green Version]
- Hasanov, F.J.; Khan, Z.; Hussain, M.; Tufail, M. Theoretical Framework for the Carbon Emissions Effects of Technological Progress and Renewable Energy Consumption. Sustain. Dev. 2021, 29, 810–822. [Google Scholar] [CrossRef]
- Ojekemi, O.S.; Rjoub, H.; Awosusi, A.A.; Agyekum, E.B. Toward a sustainable environment and economic growth in BRICS economies: Do innovation and globalization matter? Environ. Sci. Pollut. Res. 2022, 29, 57740–57757. [Google Scholar] [CrossRef]
- Fareed, Z.; Rehman, M.A.; Adebayo, T.S.; Wang, Y.; Ahmad, M.; Shahzad, F. Financial inclusion and the environmental deterioration in Eurozone: The moderating role of innovation activity. Technol. Soc. 2022, 69, 101961. [Google Scholar] [CrossRef]
- Sharif, A.; Saqib, N.; Dong, K.; Khan, S.A.R. Nexus between green technology innovation, green financing, and CO2 emissions in the G7 countries: The moderating role of social globalisation. Sustain. Dev. 2022, 4, 12–24. [Google Scholar] [CrossRef]
- Hassan, T.; Song, H.; Kirikkaleli, D. International trade and consumption-based carbon emissions: Evaluating the role of composite risk for RCEP economies. Environ. Sci. Pollut. Res. 2022, 29, 3417–3437. [Google Scholar] [CrossRef] [PubMed]
- Fernández-Amador, O.; Francois, J.F.; Oberdabernig, D.A.; Tomberger, P. Carbon Dioxide Emissions and Economic Growth: An Assessment Based on Production and Consumption Emission Inventories. Ecol. Econ. 2017, 135, 269–279. [Google Scholar] [CrossRef]
- Khan, Z.; Ali, M.; Jinyu, L.; Shahbaz, M.; Siqun, Y. Consumption-based carbon emissions and trade nexus: Evidence from nine oil exporting countries. Energy Econ. 2020, 89, 104806. [Google Scholar] [CrossRef]
- Knight, K.W.; Schor, J.B. Economic Growth and Climate Change: A Cross-National Analysis of Territorial and Consumption-Based Carbon Emissions in High-Income Countries. Sustainability 2014, 6, 3722. [Google Scholar] [CrossRef] [Green Version]
- Antonelli, C.; Gehringer, A. Technological change, rent and income inequalities: A Schumpeterian approach. Technol. Forecast. Soc. Change 2017, 115, 85–98. [Google Scholar] [CrossRef] [Green Version]
- Chikezie Ekwueme, D.; Lasisi, T.T.; Eluwole, K.K. Environmental sustainability in Asian countries: Understanding the criticality of economic growth, industrialization, tourism import, and energy use. Energy Environ. 2022. preprint. [Google Scholar] [CrossRef]
- Alam, M.M.; Murad, M.W. The impacts of economic growth, trade openness and technological progress on renewable energy use in organization for economic co-operation and development countries. Renew. Energy 2020, 145, 382–390. [Google Scholar] [CrossRef]
- Ali, Q.; Yaseen, M.R.; Anwar, S.; Makhdum, M.S.A.; Khan, M.T.I. The impact of tourism, renewable energy, and economic growth on ecological footprint and natural resources: A panel data analysis. Resour. Policy 2021, 74, 102365. [Google Scholar] [CrossRef]
- Acheampong, A.O.; Adams, S.; Boateng, E. Do globalization and renewable energy contribute to carbon emissions mitigation in Sub-Saharan Africa? Sci. Total Environ. 2019, 677, 436–446. [Google Scholar] [CrossRef]
- Alola, A.A.; Bekun, F.V.; Sarkodie, S.A. Dynamic impact of trade policy, economic growth, fertility rate, renewable and non-renewable energy consumption on ecological footprint in Europe. Sci. Total Environ. 2019, 685, 702–709. [Google Scholar] [CrossRef]
- Abbasi, F.; Riaz, K. CO2 emissions and financial development in an emerging economy: An augmented VAR approach. Energy Policy 2016, 90, 102–114. [Google Scholar] [CrossRef]
- You, W.-H.; Zhu, H.-M.; Yu, K.; Peng, C. Democracy, Financial Openness, and Global Carbon Dioxide Emissions: Heterogeneity Across Existing Emission Levels. World Dev. 2015, 66, 189–207. [Google Scholar] [CrossRef] [Green Version]
- Sadorsky, P. The impact of financial development on energy consumption in emerging economies. Energy Policy 2010, 38, 2528–2535. [Google Scholar] [CrossRef]
- Granger, C.W.J. Investigating Causal Relations by Econometric Models and Cross-spectral Methods. Econometrica 1969, 37, 424–438. [Google Scholar] [CrossRef]
- Enders, W.; Jones, P. Grain prices, oil prices, and multiple smooth breaks in a VAR. Stud. Nonlinear Dyn. Econ. 2016, 20, 399–419. [Google Scholar] [CrossRef]
- Toda, H.Y.; Yamamoto, T. Statistical inference in vector autoregressions with possibly integrated processes. J. Econ. 1995, 66, 225–250. [Google Scholar] [CrossRef]
- Nazlioglu, S.; Gormus, N.A.; Soytas, U. Oil prices and real estate investment trusts (REITs): Gradual-shift causality and volatility transmission analysis. Energy Econ. 2016, 60, 168–175. [Google Scholar] [CrossRef]
- Gallant, A.R. On the bias in flexible functional forms and an essentially unbiased form: The fourier flexible form. J. Econ. 1981, 15, 211–245. [Google Scholar] [CrossRef]
- He, X.; Adebayo, T.S.; Kirikkaleli, D.; Umar, M. Consumption-based carbon emissions in Mexico: An analysis using the dual adjustment approach. Sustain. Prod. Consum. 2021, 27, 947–957. [Google Scholar] [CrossRef]
- Salazar-Núñez, H.F.; Venegas-Martínez, F.; Lozano-Díez, J.A. Assessing the interdependence among renewable and non-renewable energies, economic growth, and CO2 emissions in Mexico. Environ. Dev. Sustain. 2021, 24, 12850–12866. [Google Scholar] [CrossRef]
- Pan, B.; Adebayo, T.S.; Ibrahim, R.L.; Al-Faryan, M.A.S. Does nuclear energy consumption mitigate carbon emissions in leading countries by nuclear power consumption? Evidence from quantile causality approach. Energy Environ. 2022, in press. [Google Scholar] [CrossRef]
- Acheampong, A.O. Economic growth, CO2 emissions and energy consumption: What causes what and where? Energy Econ. 2018, 74, 677–692. [Google Scholar] [CrossRef]
- Zhang, L.; Li, Z.; Kirikkaleli, D.; Adebayo, T.S.; Adeshola, I.; Akinsola, G.D. Modeling CO2 emissions in Malaysia: An application of Maki cointegration and wavelet coherence tests. Environ. Sci. Pollut. Res. 2021, 28, 26030–26044. [Google Scholar] [CrossRef] [PubMed]
- Adebayo, T.S. Environmental consequences of fossil fuel in Spain amidst renewable energy consumption: A new insights from the wavelet-based Granger causality approach. Int. J. Sustain. Dev. World Ecol. 2022, 29, 579–592. [Google Scholar] [CrossRef]
- Magazzino, C.; Mutascu, M.; Mele, M.; Sarkodie, S.A. Energy consumption and economic growth in Italy: A wavelet analysis. Energy Rep. 2021, 7, 1520–1528. [Google Scholar] [CrossRef]
- Bekun, F.V.; Emir, F.; Sarkodie, S.A. Another look at the relationship between energy consumption, carbon dioxide emissions, and economic growth in South Africa. Sci. Total Environ. 2019, 655, 759–765. [Google Scholar] [CrossRef]
- Shahbaz, M.; Nasir, M.A.; Roubaud, D. Environmental degradation in France: The effects of FDI, financial development, and energy innovations. Energy Econ. 2018, 74, 843–857. [Google Scholar] [CrossRef] [Green Version]
- Adewale Alola, A.; Ozturk, I.; Bekun, F.V. Is clean energy prosperity and technological innovation rapidly mitigating sustainable energy-development deficit in selected sub-Saharan Africa? A myth or reality. Energy Policy 2021, 158, 112520. [Google Scholar] [CrossRef]
- World Bank. World Developmental Indicator. 2022. Available online: https://data.worldbank.org/country/china (accessed on 7 August 2022).
- Abbasi, K.R.; Shahbaz, M.; Jiao, Z.; Tufail, M. How energy consumption, industrial growth, urbanization, and CO2 emissions affect economic growth in Pakistan? A novel dynamic ARDL simulations approach. Energy 2021, 221, 119793. [Google Scholar] [CrossRef]
- Cetin, M.; Demir, H.; Saygin, S. Financial Development, Technological Innovation and Income Inequality: Time Series Evidence from Turkey. Soc. Indic. Res. 2021, 156, 47–69. [Google Scholar] [CrossRef]
- Kirikkaleli, D.; Adebayo, T.S.; Khan, Z.; Ali, S. Does globalization matter for ecological footprint in Turkey? Evidence from dual adjustment approach. Environ. Sci. Pollut. Res. 2021, 28, 14009–14017. [Google Scholar] [CrossRef]
- Pata, U.K. Renewable energy consumption, urbanization, financial development, income and CO2 emissions in Turkey: Testing EKC hypothesis with structural breaks. J. Clean. Prod. 2018, 187, 770–779. [Google Scholar] [CrossRef]
- Ahmad, M.; Jiang, P.; Murshed, M.; Shehzad, K.; Akram, R.; Cui, L.; Khan, Z. Modelling the dynamic linkages between eco-innovation, urbanization, economic growth and ecological footprints for G7 countries: Does financial globalization matter? Sustain. Cities Soc. 2021, 70, 102881. [Google Scholar] [CrossRef]
Figure 1.
Flow of the study.

Figure 2.
BFGC-Q results for Mexico.

Figure 3.
BFGC-Q results for Indonesia.

Figure 4.
BFGC-Q results for Nigeria.

Figure 5.
BFGC-Q results for Turkey.


Table 1.
Descriptive Statistics.
| Mexico | ||||||
| CCO2 | FD | REC | GDP | IMP | EXP | |
| Mean | 448.20 | 0.3344 | 10.949 | 8747.9 | 28.249 | 26.666 |
| Median | 469.80 | 0.3282 | 10.228 | 8820.9 | 27.674 | 26.142 |
| Maximum | 547.74 | 0.4008 | 15.187 | 9954.3 | 41.454 | 39.410 |
| Minimum | 312.54 | 0.2521 | 8.9487 | 7343.5 | 15.156 | 11.459 |
| Std. Dev. | 71.262 | 0.0468 | 1.6589 | 735.07 | 6.6390 | 7.0045 |
| Skewness | −0.4887 | −0.1151 | 0.5316 | −0.2295 | 0.1749 | −0.1450 |
| Kurtosis | 1.8650 | 1.5927 | 1.8958 | 2.0920 | 2.4342 | 2.6829 |
| Jarque–Bera | 11.218 | 10.167 | 11.748 | 5.1754 | 2.2127 | 0.9236 |
| Probability | 0.0036 | 0.0061 | 0.0028 | 0.0751 | 0.3307 | 0.6301 |
| Indonesia | ||||||
| Mean | 357.44 | 0.3122 | 2423.7 | 25.676 | 40.485 | 28.481 |
| Median | 317.97 | 0.3075 | 2159.1 | 25.309 | 41.515 | 26.742 |
| Maximum | 693.81 | 0.4001 | 3931.9 | 44.226 | 58.833 | 54.776 |
| Minimum | 132.54 | 0.2383 | 1462.1 | 16.601 | 18.943 | 16.979 |
| Std. Dev. | 159.57 | 0.0415 | 691.89 | 4.6656 | 10.914 | 7.1238 |
| Skewness | 0.4235 | −0.0019 | 0.6322 | 1.5145 | −0.1826 | 1.4132 |
| Kurtosis | 1.8527 | 2.0246 | 2.1623 | 7.7038 | 2.1152 | 5.8497 |
| Jarque–Bera | 10.169 | 4.7569 | 11.501 | 156.50 | 4.5811 | 80.553 |
| Probability | 0.0061 | 0.0926 | 0.0031 | 0.0000 | 0.1012 | 0.0000 |
Table 2.
Descriptive Statistics.
| Nigeria | ||||||
| CCO2 | FD | GDP | IMP | REC | EXP | |
| Mean | 76.929 | 0.1898 | 1969.8 | 15.379 | 85.064 | 21.893 |
| Median | 80.407 | 0.1893 | 1916.9 | 14.378 | 85.168 | 22.052 |
| Maximum | 131.12 | 0.2739 | 2705.1 | 23.428 | 88.842 | 37.157 |
| Minimum | 33.529 | 0.1167 | 1411.3 | 8.595 | 80.541 | 8.8927 |
| Std. Dev. | 33.004 | 0.0352 | 470.43 | 3.9310 | 2.2691 | 6.4406 |
| Skewness | 0.1886 | −0.0619 | 0.1982 | 0.4743 | −0.2275 | 0.0526 |
| Kurtosis | 1.6725 | 2.6520 | 1.4011 | 2.1677 | 1.9715 | 2.6046 |
| Jarque–Bera | 9.5224 | 0.6819 | 13.568 | 7.9636 | 6.3246 | 0.8368 |
| Probability | 0.0085 | 0.7110 | 0.0011 | 0.0186 | 0.0423 | 0.6580 |
| Turkey | ||||||
| Mean | 306.00 | 0.4006 | 7941.7 | 24.680 | 17.005 | 22.299 |
| Median | 288.51 | 0.4053 | 7475.6 | 25.105 | 16.010 | 22.840 |
| Maximum | 445.09 | 0.5311 | 12022. | 31.515 | 24.712 | 32.760 |
| Minimum | 206.13 | 0.1920 | 5286.7 | 16.568 | 11.208 | 12.629 |
| Std. Dev. | 82.533 | 0.1010 | 2179.5 | 4.2417 | 4.4882 | 4.4437 |
| Skewness | 0.2293 | −0.4415 | 0.5619 | −0.2954 | 0.4453 | −0.1846 |
| Kurtosis | 1.4464 | 2.0872 | 1.9781 | 2.1182 | 1.7070 | 3.5362 |
| Jarque–Bera | 13.120 | 8.0644 | 11.536 | 5.6326 | 12.325 | 2.1200 |
| Probability | 0.0014 | 0.0177 | 0.0031 | 0.0598 | 0.0021 | 0.3464 |
Table 3.
Results of unit root tests.
| Mexico | Indonesia | Nigeria | Turkiye | |||||
|---|---|---|---|---|---|---|---|---|
| ADF | ||||||||
| Variables | T-stat. | Lag | T-stat. | Lag | T-stat. | Lag | T-stat. | Lag |
| LnCCO2 | −5.583 * | 8 | −3.748 *** | 8 | −3.249 *** | 8 | −3.995 ** | 5 |
| LnGDP | −3.454 *** | 7 | −3.497 ** | 5 | −3.350 ** | 7 | −3.683 *** | 8 |
| LnREC | −3.692 ** | 11 | −3.401 *** | 8 | −4.385 * | 9 | −3.275 *** | 8 |
| LnFD | −6.855 * | 4 | −3.612 *** | 8 | −3.224 *** | 8 | −4.639 * | 5 |
| LnEXP | −4.714 * | 7 | −6.840 * | 7 | −3.669 ** | 12 | −3.683 ** | 8 |
| LnIMP | −10.783 * | 9 | −4.396 * | 8 | −3.616 ** | 12 | −3.976 ** | 8 |
| ERS | ||||||||
| LnCCO2 | −5.747 * | 6 | −3.154 ** | 12 | −3.273 *** | 8 | −3.153 *** | 4 |
| LnGDP | −4.452 * | 10 | −3.396 *** | 5 | −3.284 ** | 6 | −3.691 * | 8 |
| LnREC | −2.858 *** | 8 | −2.770 *** | 12 | −3.190 ** | 8 | −2.858 ** | 7 |
| LnFD | −4.139 * | 4 | −2.832 *** | 8 | −2.877 *** | 8 | −2.919 *** | 4 |
| LnEXP | −2.975 *** | 5 | −6.846 * | 7 | −3.089 *** | 12 | −3.691 ** | 8 |
| LnIMP | −2.926 *** | 12 | −4.124 * | 8 | −2.935 ** | 12 | −3.330 ** | 8 |
Note: *, ** and *** show the rejection of the null of unit root at 1%, 5% and 10% significance levels, respectively.
Table 4.
Bounds Test Results.
| Countries | Models | F-Statistics | Lag Selection | Cointegration |
|---|---|---|---|---|
| Mexico | LnCCO2 = f(LnGDP, LnIMP, LnEXP, LnREC, LnFD) | 8.937 * | 1, 2, 1, 1, 0, 0 | Yes |
| Indonesia | LnCCO2 = f(LnGDP, LnIMP, LnEXP, LnREC, LnFD) | 5.971 * | 1, 1, 1, 0, 2, 1 | Yes |
| Nigeria | LnCCO2 = f(LnGDP, LnIMP, LnEXP, LnREC, LnFD) | 5.836 * | 1, 0, 0, 2, 2, 1 | Yes |
| Turkey | LnCCO2 = f(LnGDP, LnIMP, LnEXP, LnREC, LnFD) | 7.530 * | 1, 2, 1, 1, 0, 0 | Yes |
Note: * depicts a significance level of 1%.
Table 5.
Results of F-test.
| Models | Mexico | Indonesia | Nigeria | Turkey |
|---|---|---|---|---|
| Optimum Frequency | 0.8 | 2.2 | 0.8 | 2.0 |
| Optimum Lag | 6 | 6 | 6 | 6 |
| F-statistics for Fourier expansion | 12.968 * | 14.858 * | 8.474 * | 10.968 * |
| 10% CV | 10.211 | 12.032 | 6.184 | 7.211 |
| 5% CV | 10.882 | 12.772 | 6.846 | 8.204 |
| 1% CV | 11.317 | 13.460 | 7.503 | 8.995 |
Notes: * signify 1% levels of significance respectively. The optimal Frequency (k*) and optimal lag lengths (p*) were selected based on AIC.
Table 6.
Bootstrap Quantile Causality test (Mexico).
| H0: LnGDP↛LnCCO2 | ||||
| quantile | Wald stat. | 10% CV | 5% CV | 1% CV |
| 0.1 | 31.978 | 63.388 | 67.092 | 81.577 |
| 0.3 | 26.653 | 51.287 | 52.845 | 61.023 |
| 0.5 | 25.818 | 51.568 | 56.829 | 67.076 |
| 0.7 | 17.751 | 64.849 | 73.141 | 101.56 |
| 0.9 | 87.062*** (+) | 82.583 | 87.108 | 117.63 |
| H0: LnREC↛LnCCO2 | ||||
| 0.1 | 9.0119 | 16.482 | 18.31736 | 23.171 |
| 0.3 | 29.125* (−) | 13.597 | 15.20117 | 21.076 |
| 0.5 | 15.323** (−) | 11.576 | 14.42830 | 15.608 |
| 0.7 | 4.7447 | 14.835 | 16.14676 | 21.377 |
| 0.9 | 1.9978 | 27.162 | 28.40824 | 34.811 |
| H0: LnEXP↛LnCCO2 | ||||
| 0.1 | 8.3898 | 28.373 | 32.80566 | 55.1 |
| 0.3 | 7.6605 | 25.010 | 32.53499 | 36.648 |
| 0.5 | 19.1422*** (−) | 18.639 | 22.62982 | 24.484 |
| 0.7 | 28.5644*** (−) | 27.881 | 33.61882 | 41.403 |
| 0.9 | 11.895 | 32.187 | 34.80926 | 46.525 |
| H0: LnIMP↛LnCCO2 | ||||
| 0.1 | 13.146 | 20.018 | 21.44194 | 26.673 |
| 0.3 | 9.0842 *** (+) | 8.7170 | 10.36571 | 15.382 |
| 0.5 | 9.8575*** (+) | 7.5424 | 9.569465 | 10.425 |
| 0.7 | 4.0832 | 8.2339 | 9.546957 | 14.768 |
| 0.9 | 13.324 | 15.074 | 17.28618 | 26.622 |
| H0: LnFD↛LnCCO2 | ||||
| 0.1 | 12.64739 | 24.178 | 29.077 | 38.807 |
| 0.3 | 13.80425*** (+) | 12.672 | 13.942 | 19.690 |
| 0.5 | 6.280467 | 9.9456 | 13.971 | 16.627 |
| 0.7 | 2.005601 | 12.055 | 13.820 | 17.593 |
| 0.9 | 2.778037 | 17.914 | 18.573 | 23.587 |
Note: ***, ** and * denote the dismissal of the null of no-causality at and 10%, 5% and 1% significance levels, respectively. CV represent critical values. (+) and (−) illustrate positive and negative effects.
Table 7.
Bootstrap Quantile Causality test (Indonesia).
| H0: LnGDP↛LnCCO2 | ||||
| quantile | Wald stat. | 10% CV | 5% CV | 1% CV |
| 0.1 | 155.016*** (+) | 152.07 | 169.6371 | 182.03 |
| 0.3 | 54.3869 | 115.58 | 150.2648 | 163.12 |
| 0.5 | 53.3321 | 104.68 | 112.4484 | 136.03 |
| 0.7 | 64.3851 | 142.37 | 159.7852 | 170.04 |
| 0.9 | 76.1747 | 222.61 | 241.0449 | 316.92 |
| H0: LnREC↛LnCCO2 | ||||
| 0.1 | 46.606** (−) | 41.780 | 46.295 | 113.77 |
| 0.3 | 29.447*** (−) | 28.860 | 31.215 | 43.643 |
| 0.5 | 9.5617 | 22.751 | 25.283 | 50.833 |
| 0.7 | 4.6260 | 26.136 | 29.177 | 64.730 |
| 0.9 | 12.265 | 39.507 | 51.031 | 75.474 |
| H0: LnEXP↛LnCCO2 | ||||
| 0.1 | 8.7534 | 173.89 | 182.84 | 218.72 |
| 0.3 | 4.7759 | 149.94 | 163.65 | 183.70 |
| 0.5 | 4.8257 | 136.53 | 157.20 | 167.85 |
| 0.7 | 2.0517 | 146.86 | 166.26 | 205.21 |
| 0.9 | 6.7543 | 175.68 | 206.35 | 253.02 |
| H0: LnIMP↛LnCCO2 | ||||
| 0.1 | 8.5628 | 177.87 | 187.94 | 211.6 |
| 0.3 | 1.9128 | 74.241 | 100.72 | 148.80 |
| 0.5 | 5.5059 | 37.284 | 38.902 | 72.992 |
| 0.7 | 1.9302 | 32.128 | 46.606 | 51.729 |
| 0.9 | 5.085 | 47.377 | 58.787 | 72.820 |
| H0: LnFD↛LnCCO2 | ||||
| 0.1 | 102.967* (+) | 56.141 | 67.663 | 97.104 |
| 0.3 | 40.66** (+) | 25.050 | 27.437 | 42.239 |
| 0.5 | 9.0807 | 14.700 | 19.357 | 35.294 |
| 0.7 | 7.4778 | 19.663 | 25.182 | 30.660 |
| 0.9 | 36.756 | 45.243 | 50.380 | 73.003 |
Note: ***, ** and * denote the dismissal of the null of no-causality at and 10%, 5%, and 1% significance levels, respectively. CV represents critical values. (+) and (−) illustrate positive and negative effects.
Table 8.
Bootstrap Quantile Causality test (Nigeria).
| H0: LnGDP↛LnCCO2 | ||||
| quantile | Wald stat. | 10% CV | 5% CV | 1% CV |
| 0.1 | 27.220 | 43.719 | 49.391 | 57.726 |
| 0.3 | 45.567** (+) | 32.852 | 37.150 | 47.866 |
| 0.5 | 32.972*** (+) | 31.719 | 33.170 | 46.260 |
| 0.7 | 48.859*** (+) | 35.334 | 41.658 | 51.812 |
| 0.9 | 15.253 | 42.8749 | 43.440 | 50.842 |
| H0: LnREC↛LnCCO2 | ||||
| 0.1 | 19.316*** (−) | 18.620 | 20.738 | 26.566 |
| 0.3 | 17.158*** (−) | 15.859 | 22.644 | 24.593 |
| 0.5 | 8.8579 | 17.022 | 20.349 | 33.701 |
| 0.7 | 10.757 | 25.134 | 30.30 | 61.526 |
| 0.9 | 14.192 | 38.486 | 45.18 | 59.555 |
| H0: LnEXP↛LnCCO2 | ||||
| 0.1 | 24.551 | 31.168 | 33.907 | 56.850 |
| 0.3 | 12.032 | 17.394 | 21.465 | 29.676 |
| 0.5 | 5.7322 | 12.492 | 13.865 | 16.700 |
| 0.7 | 4.7990 | 11.424 | 14.101 | 17.905 |
| 0.9 | 29.685*** (−) | 24.913 | 29.192 | 33.831 |
| H0: LnIMP↛LnCCO2 | ||||
| 0.1 | 2.4349 | 11.527 | 13.534 | 23.828 |
| 0.3 | 3.5846 | 7.1759 | 8.6019 | 9.5594 |
| 0.5 | 3.5608 | 6.0437 | 8.5011 | 11.572 |
| 0.7 | 5.5401 | 7.2298 | 9.7265 | 10.753 |
| 0.9 | 4.3756 | 18.724 | 19.768 | 28.575 |
| H0: LnFD↛LnCCO2 | ||||
| 0.1 | 10.564 | 24.939 | 30.925 | 32.743 |
| 0.3 | 5.6160 | 15.779 | 22.195 | 35.045 |
| 0.5 | 19.540** (+) | 11.978 | 15.302 | 21.349 |
| 0.7 | 13.008 | 16.530 | 20.794 | 22.502 |
| 0.9 | 19.834 | 27.332 | 29.549 | 45.254 |
Note: ***, and ** denote the dismissal of the null of no-causality at and 10%, and 5% significance levels, respectively. CV represent critical values. (+) and (−) illustrate positive and negative effects.
Table 9.
Bootstrap Quantile Causality test (Turkey).
| H0: LnGDP↛LnCCO2 | ||||
| quantile | Wald stat. | 10% CV | 5% CV | 1% CV |
| 0.1 | 36.428 | 66.243 | 80.359 | 86.919 |
| 0.3 | 28.057 | 49.487 | 60.666 | 63.138 |
| 0.5 | 18.002 | 40.485 | 46.294 | 56.863 |
| 0.7 | 44.586*** (+) | 44.487 | 49.658 | 53.456 |
| 0.9 | 18.721 | 47.58500 | 57.543 | 73.676 |
| H0: LnREC↛LnCCO2 | ||||
| 0.1 | 10.197 | 39.429 | 53.859 | 67.185 |
| 0.3 | 5.2158 | 25.054 | 27.767 | 33.596 |
| 0.5 | 31.358* (−) | 19.444 | 20.862 | 30.186 |
| 0.7 | 25.154** (−) | 20.586 | 24.542 | 36.920 |
| 0.9 | 5.9246 | 38.479 | 42.183 | 54.410 |
| H0: LnEXP↛LnCCO2 | ||||
| 0.1 | 5.2356 | 41.212 | 46.597 | 60.857 |
| 0.3 | 72.227** (−) | 34.444 | 36.143 | 47.222 |
| 0.5 | 30.658*** (−) | 30.024 | 31.161 | 50.435 |
| 0.7 | 43.076** (−) | 32.715 | 36.800 | 43.846 |
| 0.9 | 125.51 | 43.520 | 46.856 | 73.936 |
| H0: LnIMP↛LnCCO2 | ||||
| 0.1 | 6.6256 | 26.208 | 45.458 | 93.274 |
| 0.3 | 12.670 | 17.397 | 17.999 | 40.338 |
| 0.5 | 24.698* (+) | 16.254 | 20.574 | 21.229 |
| 0.7 | 14.644 | 19.519 | 25.487 | 31.232 |
| 0.9 | 22.369 | 36.157 | 44.813 | 80.656 |
| H0: LnFD↛LnCCO2 | ||||
| 0.1 | 19.485 | 23.438 | 25.57 | 34.017 |
| 0.3 | 4.3859 | 14.253 | 18.2903 | 22.908 |
| 0.5 | 10.468 | 13.323 | 15.213 | 18.944 |
| 0.7 | 10.041 | 16.003 | 16.681 | 19.989 |
| 0.9 | 8.4628 | 27.354 | 34.427 | 47.014 |
Note: ***, ** and * denote the dismissal of the null of no-causality at and 10%, 5% and 1% significance levels, respectively. CV represent critical values. (+) and (−) illustrate positive and negative effects.
Publisher’s Note: MDPI stays neutral with regard to jurisdictional claims in published maps and institutional affiliations. |
© 2022 by the authors. Licensee MDPI, Basel, Switzerland. This article is an open access article distributed under the terms and conditions of the Creative Commons Attribution (CC BY) license (https://creativecommons.org/licenses/by/4.0/).
Share and Cite
MDPI and ACS Style
Adebayo, T.S.; Ağa, M. The Race to Zero Emissions in MINT Economies: Can Economic Growth, Renewable Energy and Disintegrated Trade Be the Path to Carbon Neutrality? Sustainability 2022, 14, 14178. https://doi.org/10.3390/su142114178
AMA Style
Adebayo TS, Ağa M. The Race to Zero Emissions in MINT Economies: Can Economic Growth, Renewable Energy and Disintegrated Trade Be the Path to Carbon Neutrality? Sustainability. 2022; 14(21):14178. https://doi.org/10.3390/su142114178
Chicago/Turabian StyleAdebayo, Tomiwa Sunday, and Mehmet Ağa. 2022. "The Race to Zero Emissions in MINT Economies: Can Economic Growth, Renewable Energy and Disintegrated Trade Be the Path to Carbon Neutrality?" Sustainability 14, no. 21: 14178. https://doi.org/10.3390/su142114178
Note that from the first issue of 2016, this journal uses article numbers instead of page numbers. See further details here.