Article

Would You Accept Virtual Tourism? The Impact of COVID-19 Risk Perception on Technology Acceptance from a Comparative Perspective

1
School of Architecture and Civil Engineering, Xiamen University, Xiamen 361005, China
2
Fujian Key Laboratory of Sensing and Computing for Smart City, Xiamen 361005, China
3
School of Architecture, Tsinghua University, Beijing 100084, China
*
Author to whom correspondence should be addressed.
Sustainability 2022, 14(19), 12693; https://doi.org/10.3390/su141912693
Submission received: 8 September 2022 / Revised: 30 September 2022 / Accepted: 4 October 2022 / Published: 6 October 2022
(This article belongs to the Section Tourism, Culture, and Heritage)

Abstract

:
Due to the COVID-19 pandemic, the tourism industry and its stakeholders have tried to develop a new virtual tourism market, but its effectiveness remains to be tested. We proposed and tested a new measurement scale composed of ease of use, usefulness, autonomy, enjoyment, perceived risk of COVID-19, and attitude. In total, 274 questionnaires were collected by the purposive sampling method and 239 of them were valid, with 57 potential virtual tourists (who knew of but had not used VR in tourism) and 182 actual virtual tourists (who had experienced virtual tourism). Then, we used path analysis to test the hypothetical model and compared the results of two groups. The results show that (1) the popularity of virtual tourism is limited, (2) ease of use significantly affects usefulness and enjoyment for the two groups, (3) usefulness significantly affects autonomy and enjoyment for the two groups, (4) perceived risk of COVID-19 has a direct impact on the attitude towards virtual tourism for the two groups rather than a moderating role, and (5) expected ease of use has a significant effect on autonomy, and autonomy further influences enjoyment for potential tourists. This paper is an explorative attempt to explore virtual technology applied in tourism during the COVID-19 pandemic. The results provide theoretical contributions and practical implications for technology improvement, tourism marketing, and virtual tourism development.

1. Introduction

Information technology (IT) changed the traditional tourism industry and contributed to the revolution of how tourists experience tourism destinations [1]. The development of IT has given rise to a new tourist experience by constructing a virtual environment. However, as a new form of tourism, virtual tourism was only accepted and tried by a small number of tourists before the outbreak of the COVID-19 pandemic. The COVID-19 pandemic posed a massive obstacle to tourists’ on-site travel and substantially affected destination development [2,3], which brought the global tourism industry to a standstill. In China, the Ministry of Culture and Tourism closed major scenic destinations starting 20 January 2020 [4]. Even in the post-epidemic era, the travel of tourists is still greatly restricted, and on-site travel has been difficult. In response, more and more scenic destinations and stakeholders adopted innovative approaches such as virtual technology to develop a new tourism market [5], in order to maintain the economic benefits and maintain the attractiveness of tourism. However, virtual tourism is neither a unilateral matter of attractional objects (such as tourist destinations or scenic spots), nor developed with the unilateral wishes of the tourism industry. Although virtual tourism has been around for more than a decade, most tourists are still relatively unfamiliar with it [6]. The tourism industry is desperate to explore effective ways to attract potential tourists for economic recovery and sustainable development, but tourists may be unwilling to pay for it. It is questioned whether tourists would accept virtual technology and if they are willing to adapt virtual tourism. Therefore, before vigorously developing virtual tourism technology and the virtual tourism market, tourists’ technology acceptance of virtual tourism and their attitude towards VR use should be crucially considered.
Existing studies posit that virtual tourism offers convenience and alternatives in restoring destinations’ appearance, presents more information on local culture, protects heritage and historical relics, and offers access for tourists with constraints [7,8]. Virtual tourism is considered as an alternative when it is impossible to access the real environment, and can replace on-site tourism during crises [9,10]. At the same time, some researchers argued that the quality of virtual tourism is in doubt as all senses must be engaged with the physical environment to be fully awakened [11]. Limited studies noticed the importance of interaction between tourists and VR technology and indicated that the travel experience and satisfaction of tourists mainly rely on the design of VR applications and the quality of technology [12,13]. However, most academic opinions concern the effect or experience quality of virtual tourism. The discussions about virtual technology itself and the impact of its characteristics on tourists’ acceptance and usage attitudes are insufficient. It is urgent to clarify tourists’ technology acceptance of virtual tourism.
The Technology Acceptance Model (TAM) is the most frequently used model of user acceptance today. The model sets ease of use and usefulness as two beliefs to evaluate technology acceptance and predict user attitude. Most researchers who employed this model followed the measurements composed of these two beliefs, and the model was tested to be effective. Over decades of development, researchers also have been attempting to extend this model to more research contexts. However, most research is conducted in the information technology field and lack a focus on tourism. Virtual tourism is the cross product of information technology and tourism experience. For example, users of immersive VR can embody an experience and create a sensation by receiving perceptual cues [14,15]. A high-quality experience using VR may reduce the perception of psychological distance [16]. It is necessary to explore more applicable indicators in the field of virtual tourism from both technology and user perspectives. Therefore, it is necessary to develop the TAM model by exploring a new measurement scale that is suitable for virtual tourism.
Global tourism changed from open to restricted unlike ever before. The impact of the pandemic crisis caused more tourists to engage in virtual tourism [2]. However, there are gaps in the attitude of tourists towards virtual tourism during crisis situations. Some researchers indicated that the COVID-19 pandemic would influence tourist psychology and behavior, such as stress, behavioral intention, and sentiment. Thus, the danger posed by the virus that tourists perceive should be considered as an influencing factor. However, in the previous literature, the controversies related to virtual tourism are mostly centered within non-crisis and conventional situations [6]. Importantly, the elucidation of tourists’ adoption of virtual tourism considering the impact of COVID-19 risk perception will not only provide theoretical insights but also establish practical guidance for the sustainable development of scenic destinations in crisis situations.
In addition, each tourism product should meet both the needs of potential customers and satisfy actual customers. Current research mainly focuses on the tourists who have used VR technology or had a VR tourism experience, so the studies are conducted through their post-evaluation. Few studies have looked at potential tourists and their needs. In fact, through the pre-evaluation of potential tourists who had no experience with VR tourism, the internal expectation of tourists could be determined, while the evaluation after VR experience represents tourists’ perception results. As scholars have pointed out, future research should integrate real end-users and users with little or no familiarity with the target domain [17]. This paper attempts a comparative perspective (internal expectation and perceived results) with both potential and actual tourists. The potential tourists in this study are tourists who know of (seen, heard, or learned about) VR technology but have not used it in tourism before, and the actual tourists are tourists who have virtual tourism experience. Based on the comparison, it would be better to reveal why tourists accept or do not accept the use of virtual technology in tourism.
In response to such research gaps and practical needs, this paper focuses on the technology acceptance and considers the impact of COVID-19 risk perception from a comparative perspective. Our objectives were to (1) find the reasoned factors of virtual technology that affect tourists’ adoption, (2) test the effect of technology acceptance on tourists’ attitude towards using it, (3) clarify the impact of COVID-19 risk perception, and (4) reveal tourists’ reasoned action behavior in health crises from a comparative perspective of potential and actual tourists. The exploration of this study contributes to the extension of technology acceptance research and complements the perspective of potential tourists in virtual tourism research. It can provide reference for general virtual tourism applications and technology improvement. At the same time, this research helps to clarify the impact of COVID-19 risk perception, which enriches the research content of virtual tourism and provides practical reference for the marketing of virtual tourism. The study also has implications for the tourism industry’s response to the health crisis.

2. Literature Review

2.1. Virtual Reality in Tourism

The commonly accepted definition of virtual reality (VR) is the use of a computer-generated 3D environment, which the user can navigate and interact with, resulting in real-time simulation of the user’s senses. This definition excludes augmented reality (AR) applications, in which a real image of reality is enhanced via a computer-generated tool [8,18]. VR applications such as a 360° virtual map or online panoramic tour do not require additional devices [19], through which the users can see and interact with a simulated environment simply using a monitor, a mouse or a keyboard.. In conclusion, the three key elements that characterize VR are visualization, immersion, and interactivity.
The inevitable effect of VR technology on the tourism industry was first pointed out in the 1990s, when stakeholders claimed that the virtual tourism era is coming [9]. Since then, virtual technology has penetrated many fields, such as tourism planning, heritage protection, entertainment, accessibility, marketing, education, policy making, and so forth [8,20,21]. Scholars have found that VR can provide a similar effect to the tourism experience and exposure to nature due to the stimulation of a variety of human senses (images and/or sounds) to deceive the brain in responding to virtual experience [22]. For tourism destinations, VR can provide an effective value in the co-creation process and affect tourists’ continued use intention, including their word of mouth [10,23,24]. For marketing, the rapid development of VR provides market opportunities for virtual vacations [25].
Overall, research has argued the positive effect of virtual reality applied in the tourism industry considering the characteristics and advantages of technology, showing optimistic prospects. However, the application effect of a technology should not only appraise the technology itself, but also assess the feelings and attitudes of the users. Recently, some scholars realized the need to critically reflect on this issue. Limited research has argued that the quality of virtual tourism and its sensory awakening is in doubt [11] and questioned if tourists would enjoy virtual tourism [6]. However, there are still gaps in the scrutiny of the effectiveness and prospects of virtual tourism from a tourist perspective. The relationship between technology and tourist attitudes needs more exploration.
The outbreak of COVID-19 accelerated the adoption of virtual reality in the tourism industry, and virtual tourism during crisis situations has become an interesting concept. It is found that COVID-19 would cause psychological stress or influence tourists’ sentiment. In virtual tourism, the affective motivational states (enjoyment and involvement) provide audiences with a sense of being away and allow them to escape from the pressures [4]. For a long period afterwards, the tourists’ sentiment is unstable and subject to change as the effect of the crisis diminishes [6]. In addition to emotional demands, COVID-19 also affects tourists’ motivation for virtual tourism. Compared with tourists’ requirements for time and distance in non-crisis situations, virtual tourists are more concerned about how to avoid the risks of cross-spatial geographic distance and social distance [26]. There are two crucial considerations that should be appreciated that may influence virtual tourism: the danger posed by the virus that tourists perceive, and the impact of COVID-19 risk perception. However, most researchers merely take COVID-19 as a context or the cause of risk, and there is a lack of in-depth research on the causal mechanisms of COVID-19 as a variable.

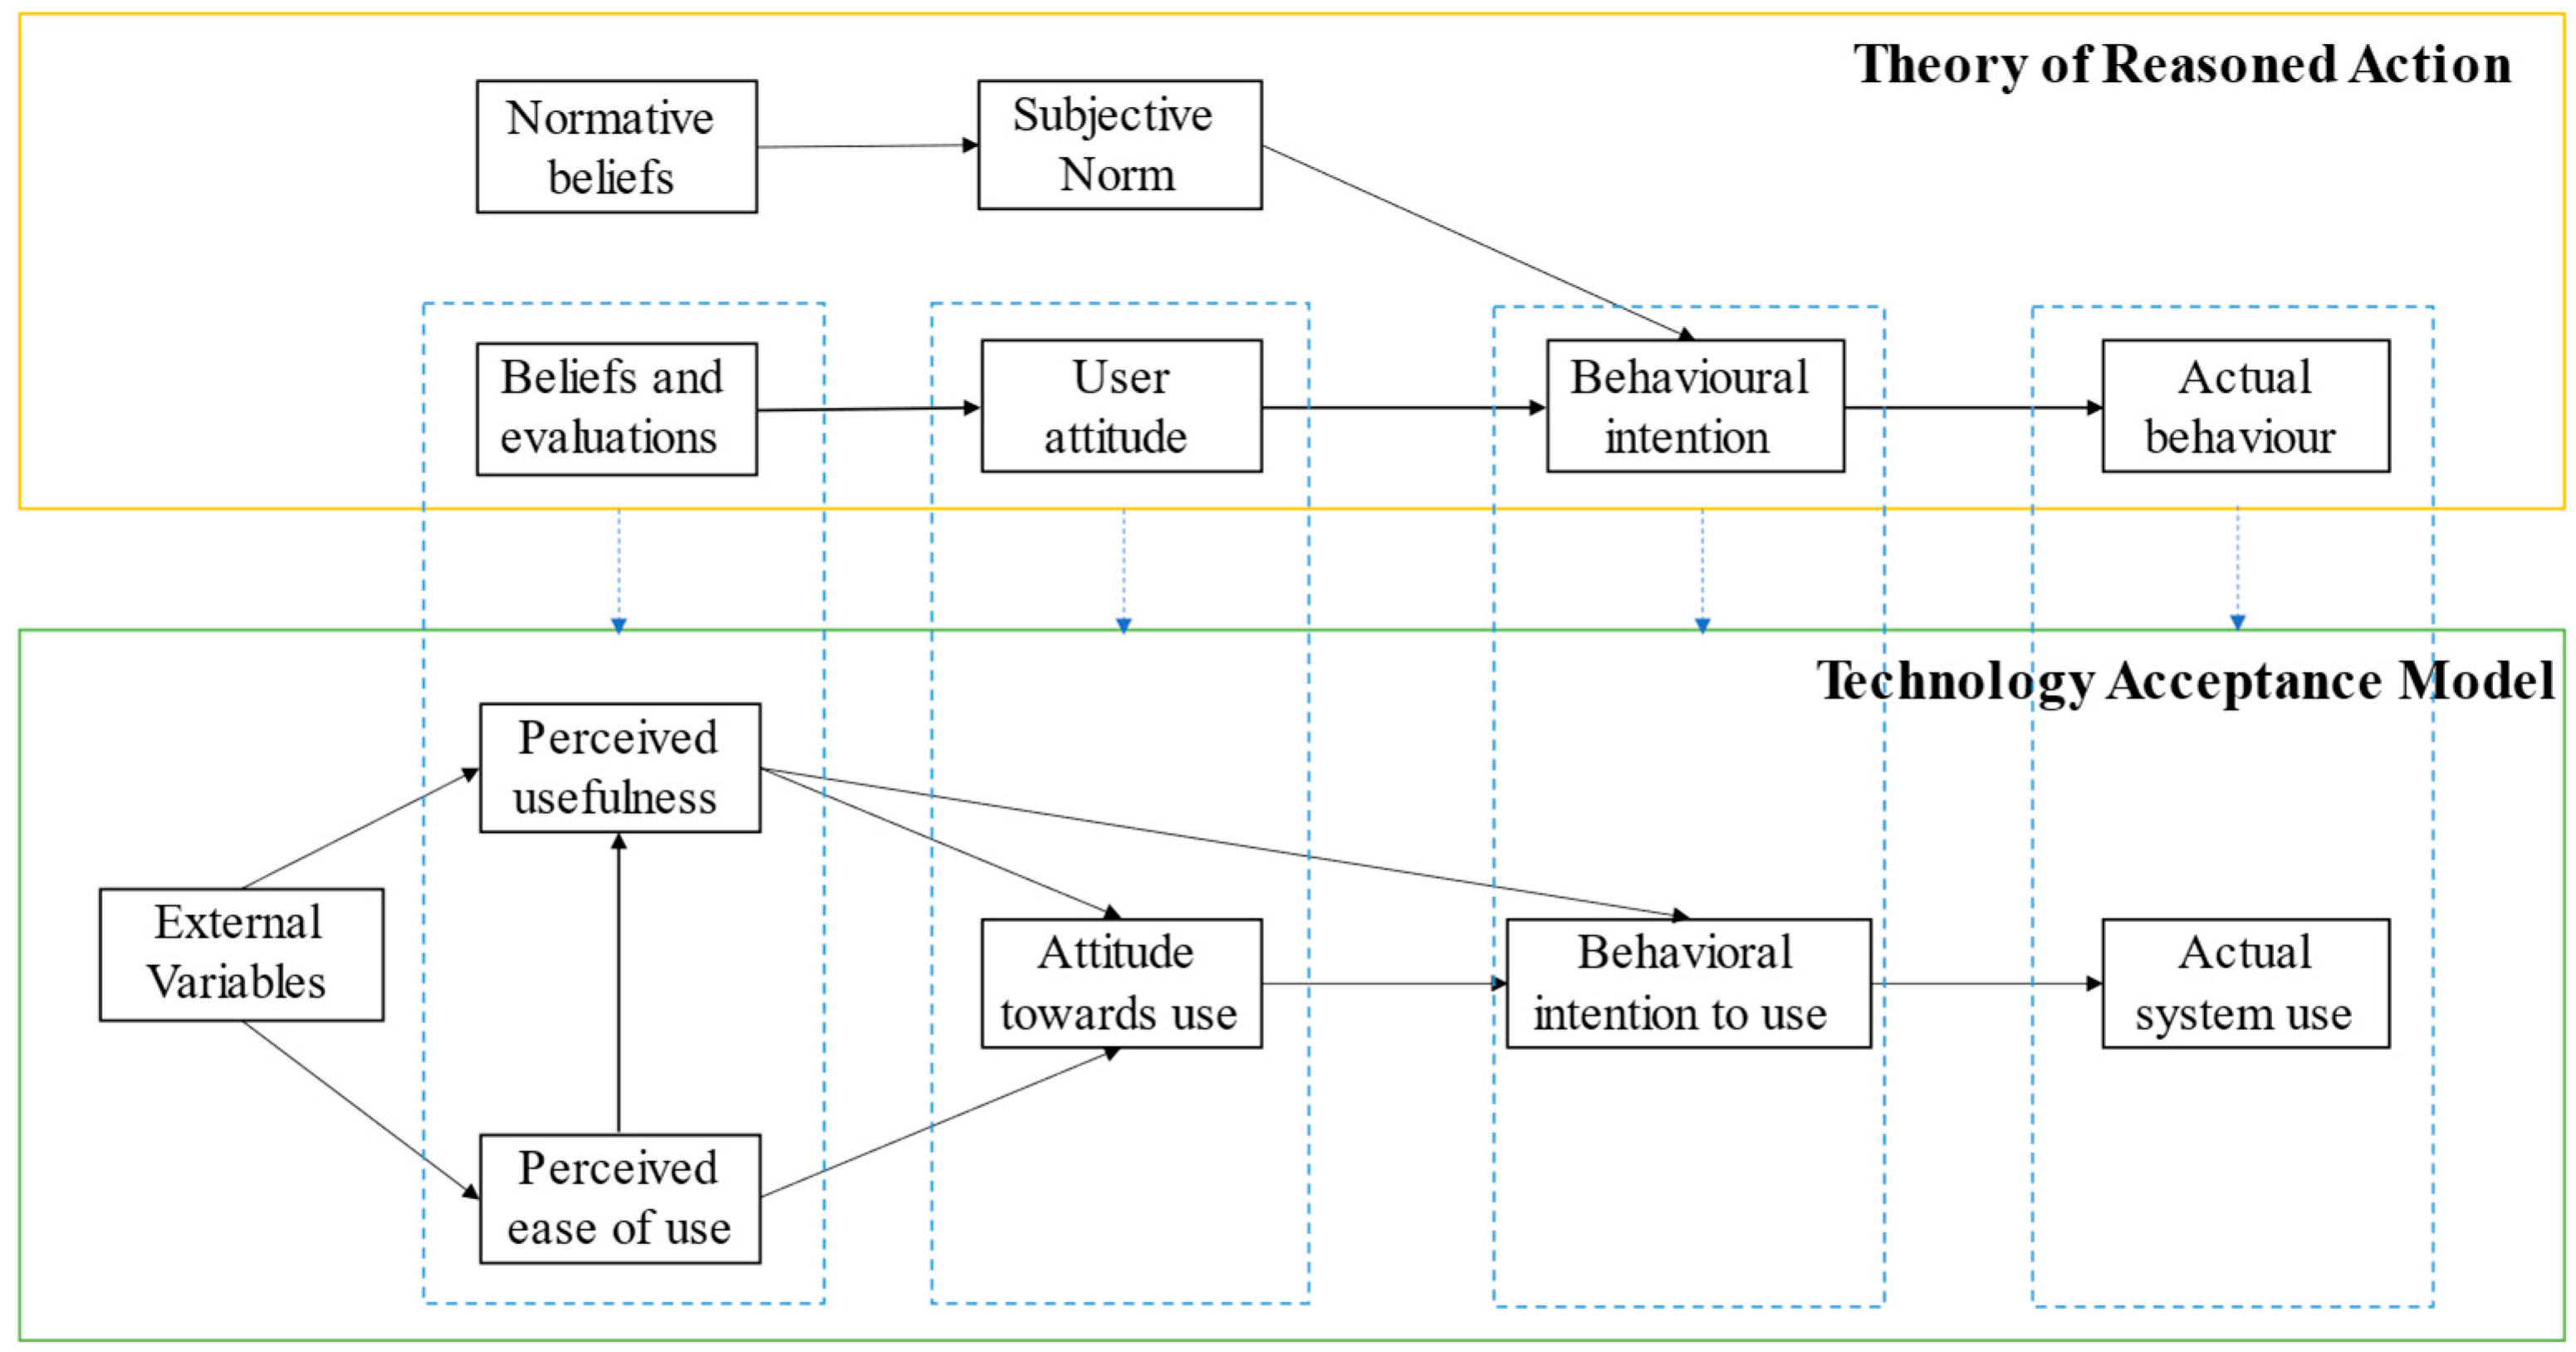
2.2. Theory Basis and Technology Acceptance

For a long time, many studies in virtual tourism have focused on applied research and prototypes, with little consideration for underpinning theories, concepts, or frameworks [7]. Before the experience occurs, the decision making of virtual tourism behavior would be influenced by several technical factors of use. Users adopt technologies in different ways and scholars have proposed several theories and models aiming to explore their acceptance which are limited but important (Table 1).
Discussions related to technology acceptance are mostly based on two psychosocial theories that seek to explain and predict a specified behavior: the Theory of Reasoned Action (TRA) [27] and the Theory of Planned Behavior (TPB) [28,29]. The TRA hypothesizes that “person’s performance of a specific behavior is determined by his or her behavioral intention which is influenced by the person’s attitude and subjective norm concerning the behavior in question” [30]. Attitude is defined as an individual’s positive or negative feelings (evaluative affect) about performing the target behavior [27]. One’s attitude towards a behavior is determined by his or her salient beliefs about the consequences of performing the behavior, multiplied by the evaluation of those consequences [30]. TPB extends TRA by adding the construct of perceived behavioral control, which refers to the perception of internal and external constraints on behavior [31].
TAM is developed from TRA with the aim to explain technology usage behavior [32]. It posits that two beliefs, perceived usefulness (PU) and perceived ease of use (PEOU), are the main influencing factors to predict users’ attitude towards (ATT) technology [30,33,34]. In detail, PU is defined as “the degree to which a person believes that using a particular system would enhance his or her job performance”. PEOU refers to “the degree to which a person believes that using a particular system would be free of effort” [33]. ATT is the user’s evaluation of the desirability of employing a specific technology [27,28]. Later, the TAM model was further improved with the consideration of various external various that can affect PU and PEOU. The intention to use and actual use are included following the TRA, and so the revised TAM is constructed. This revised TAM is the most frequently used model of user acceptance today, and it has received extensive empirical support and has been implemented in many studies [17,34]. Related research was conducted in different situations and contexts, such as tourism education, VR technologies [7,17,35], online tour guiding [36], hotel tablet apps [37], and heritage tourism [38], suggesting that TAM is a solid theoretical model.
To explore users’ acceptance of technology in different contexts, and to fit the complex research context, some other theories are assimilated, such as Innovation Diffusion Theory (IDT) [39] and Motivational Model (MM) [40]. The TAM has also been extended, such as TAM 2, with images, job relevance, results’ demonstrability, experience, and voluntariness included [30,41]; the Uniform Theory of Adoption and Use of Technology (UTAUT), that predicts behavioral intention by performance expectancy, effort expectancy, social influence, facilitating conditions, gender, age, experience, and voluntariness of use [42]; the UTAUT 2, which adds price saving, habits, hedonic motivation, trustworthiness, and homophily and excludes gender, age, experience, and voluntariness of use [43]; and the VR Hardware Acceptance Model (VR-HAM), which creatively considers past use, price willing to pay, curiosity, perceived usefulness, perceived ease of use, and perceived enjoyment [35]. These models tend to explain the usage intentions by adding more factors, which cause the model to become more complex. In fact, many factors such as age, social influence, etc., can be summarized as external variables, which have been posited in revised TAM. However, the factors related to experience and internal motivation still need to be tested as they are closely connected to tourists’ intuitive feelings about VR technology applications. In addition, the expectancy presented in UTAUT and UTAUT 2 is important for a pre-evaluation of technology acceptance but has not been emphasized, which provides a new perspective for future research of technology acceptance.
In virtual tourism, some of these models are implemented, but the main users of technical travel products, tourists, lack attention. With growing investment in travel-related applications, user adoption and acceptance have become imperative to ensure successful implementation [44]. Despite the effectiveness and competencies of travel applications, the adoption of these among consumers is still in the nascent stage [45]. What determines tourist adoption of a novel technology? What are the reasons that tourists are unwilling to adapt a technical application? Current studies are mainly focused on the projections and theoretical implications of the technology within the tourism sector, while the empirical data of tourists remain unexplored [20]. In summary, tourists’ technology acceptance in various tourism contexts is not yet understood systematically.

2.3. Risk Perception of COVID-19

Risk perception refers to the predictions people have of how seriously a crisis can harm them and their houses, cities, and families or disrupt their daily activities [46]. It is also succinctly defined as an individual’s fear of the consequences of engaging in a certain activity [47]. Risk perception is composed of two components, uncertainty and negative consequences, where (1) uncertainty means the fear generated by the lack of information regarding the consequences of performing a certain action, and (2) negative consequences refer to the potential consequences when performing an action [48], such as uncertainty of the COVID-19 epidemic at tourism destinations and the consequences of being infected during travel.
Risk perception has high correlation with individuals’ motivation to prevent threats and adopt precautionary actions. For example, risk perception attitude had a significant positive impact on the adoption of safety behaviors in adventure tourism [49]. An individual’s decision to travel is heavily influenced by their assessment and perception of health risks. Higher levels of health risk perception are associated with self-protective behavior such as seeking travel advice [50]. However, research on major public health crises is still insufficient [51]. The nature and degree of health crisis-led transformations depend on whether and how these stakeholders are affected by, respond to, recover from, and reflect on crises [2]. To better understand and predict potential changes, tourism research should provide a deeper examination and understanding of the reactions to COVID-19 impacts, such as perceived risk, which can influence their attitudes and willingness to act.
Tourists are some of the most important stakeholders in tourism, and provide a driving force for the industry. Since the COVID-19 pandemic is still an ongoing event and the impact is a fluid situation, many tourists are anticipating and worrying about traveling, which cause complex travel attitudes. The industry should not only recover but also reimagine and reform the normal and economic order [52]. Meanwhile, researchers should not solely use COVID-19 as another context to replicate existing knowledge for measuring and predicting tourism impacts [53,54]. Although such studies are important for managing the pandemic, they do not advance knowledge and/or guide the industry to a step beyond [2]. Understanding the role of virtual tourism after the COVID-19 pandemic should not exclude tourists’ perception of environmental hazards and disasters.
In summary, relevant studies on virtual tourism and COVID-19 tourism have established some theoretical frameworks and empirical evidence. However, the current state of research is insufficient for a comprehensive response to the reasons of tourists’ acceptance and unacceptance of virtual technology in tourism. Moreover, the internal motivation and experience perspective needs more attention for technology acceptance research. The role of risk perception of COVID-19 in virtual tourism needs to be defined rather than simply taken as a crisis context, especially its impacts on tourists’ attitude towards usage. The design of VR products or activities needs more knowledge of the relationship between technology and tourist perception/expectation, and tourism marketing should correctly understand the impact of COVID-19. To address these needs and gaps, this paper is composed of six distinct parts. Following the introduction and literature review, Section 3 illustrates the theory framework and hypothetical model of this paper constructed with the TAM model and extended content. Section 4 introduces the methodology, including the questionnaire design, measurement scale, sampling, and data collection. Section 5 explores an empirical analysis and shows the results of hypothesis model testing. Finally, Section 6 discusses the findings, summarizes contributions and limitations, and gives conclusions of this study.

3. Theoretical Framework and Hypothetical Model

3.1. Theoretical Framework

According to the literature review, TRA is the basic theory for explaining users’ attitude and predicting behavioral intention. Compared with TPB, which is better at predicting behavioral intention, TRA focuses more on the reasons for attitude towards use and is more suitable for this study. TAM in this study refers to the revised TAM of Davis et al. (1989), which generalizes the influencing factors outside of technology perception into external variables and makes the model more concise [30]. At the same time, it clearly points out the relationship between PU and PEOU and the role of both in attitudes and behavioral intentions towards use. Therefore, it can be used as a basic framework for achieving research objectives and is inclusive for extending new variables of technology perception.
As it is concluded, TAM is a useful model but must be integrated into a broader one that includes variables related to both human and social change processes, and to the adoption of the Innovation Model [55]. Therefore, while TRA is used as the main theory and TAM as the main framework in this paper (Figure 1), other perceived construct of beliefs from previous related studies are considered to extend the TAM model and formulate a more integrated model. Moreover, for the unusual crisis, the subjective perception of COVID-19 risk is added to explore the impact on virtual technology acceptance.

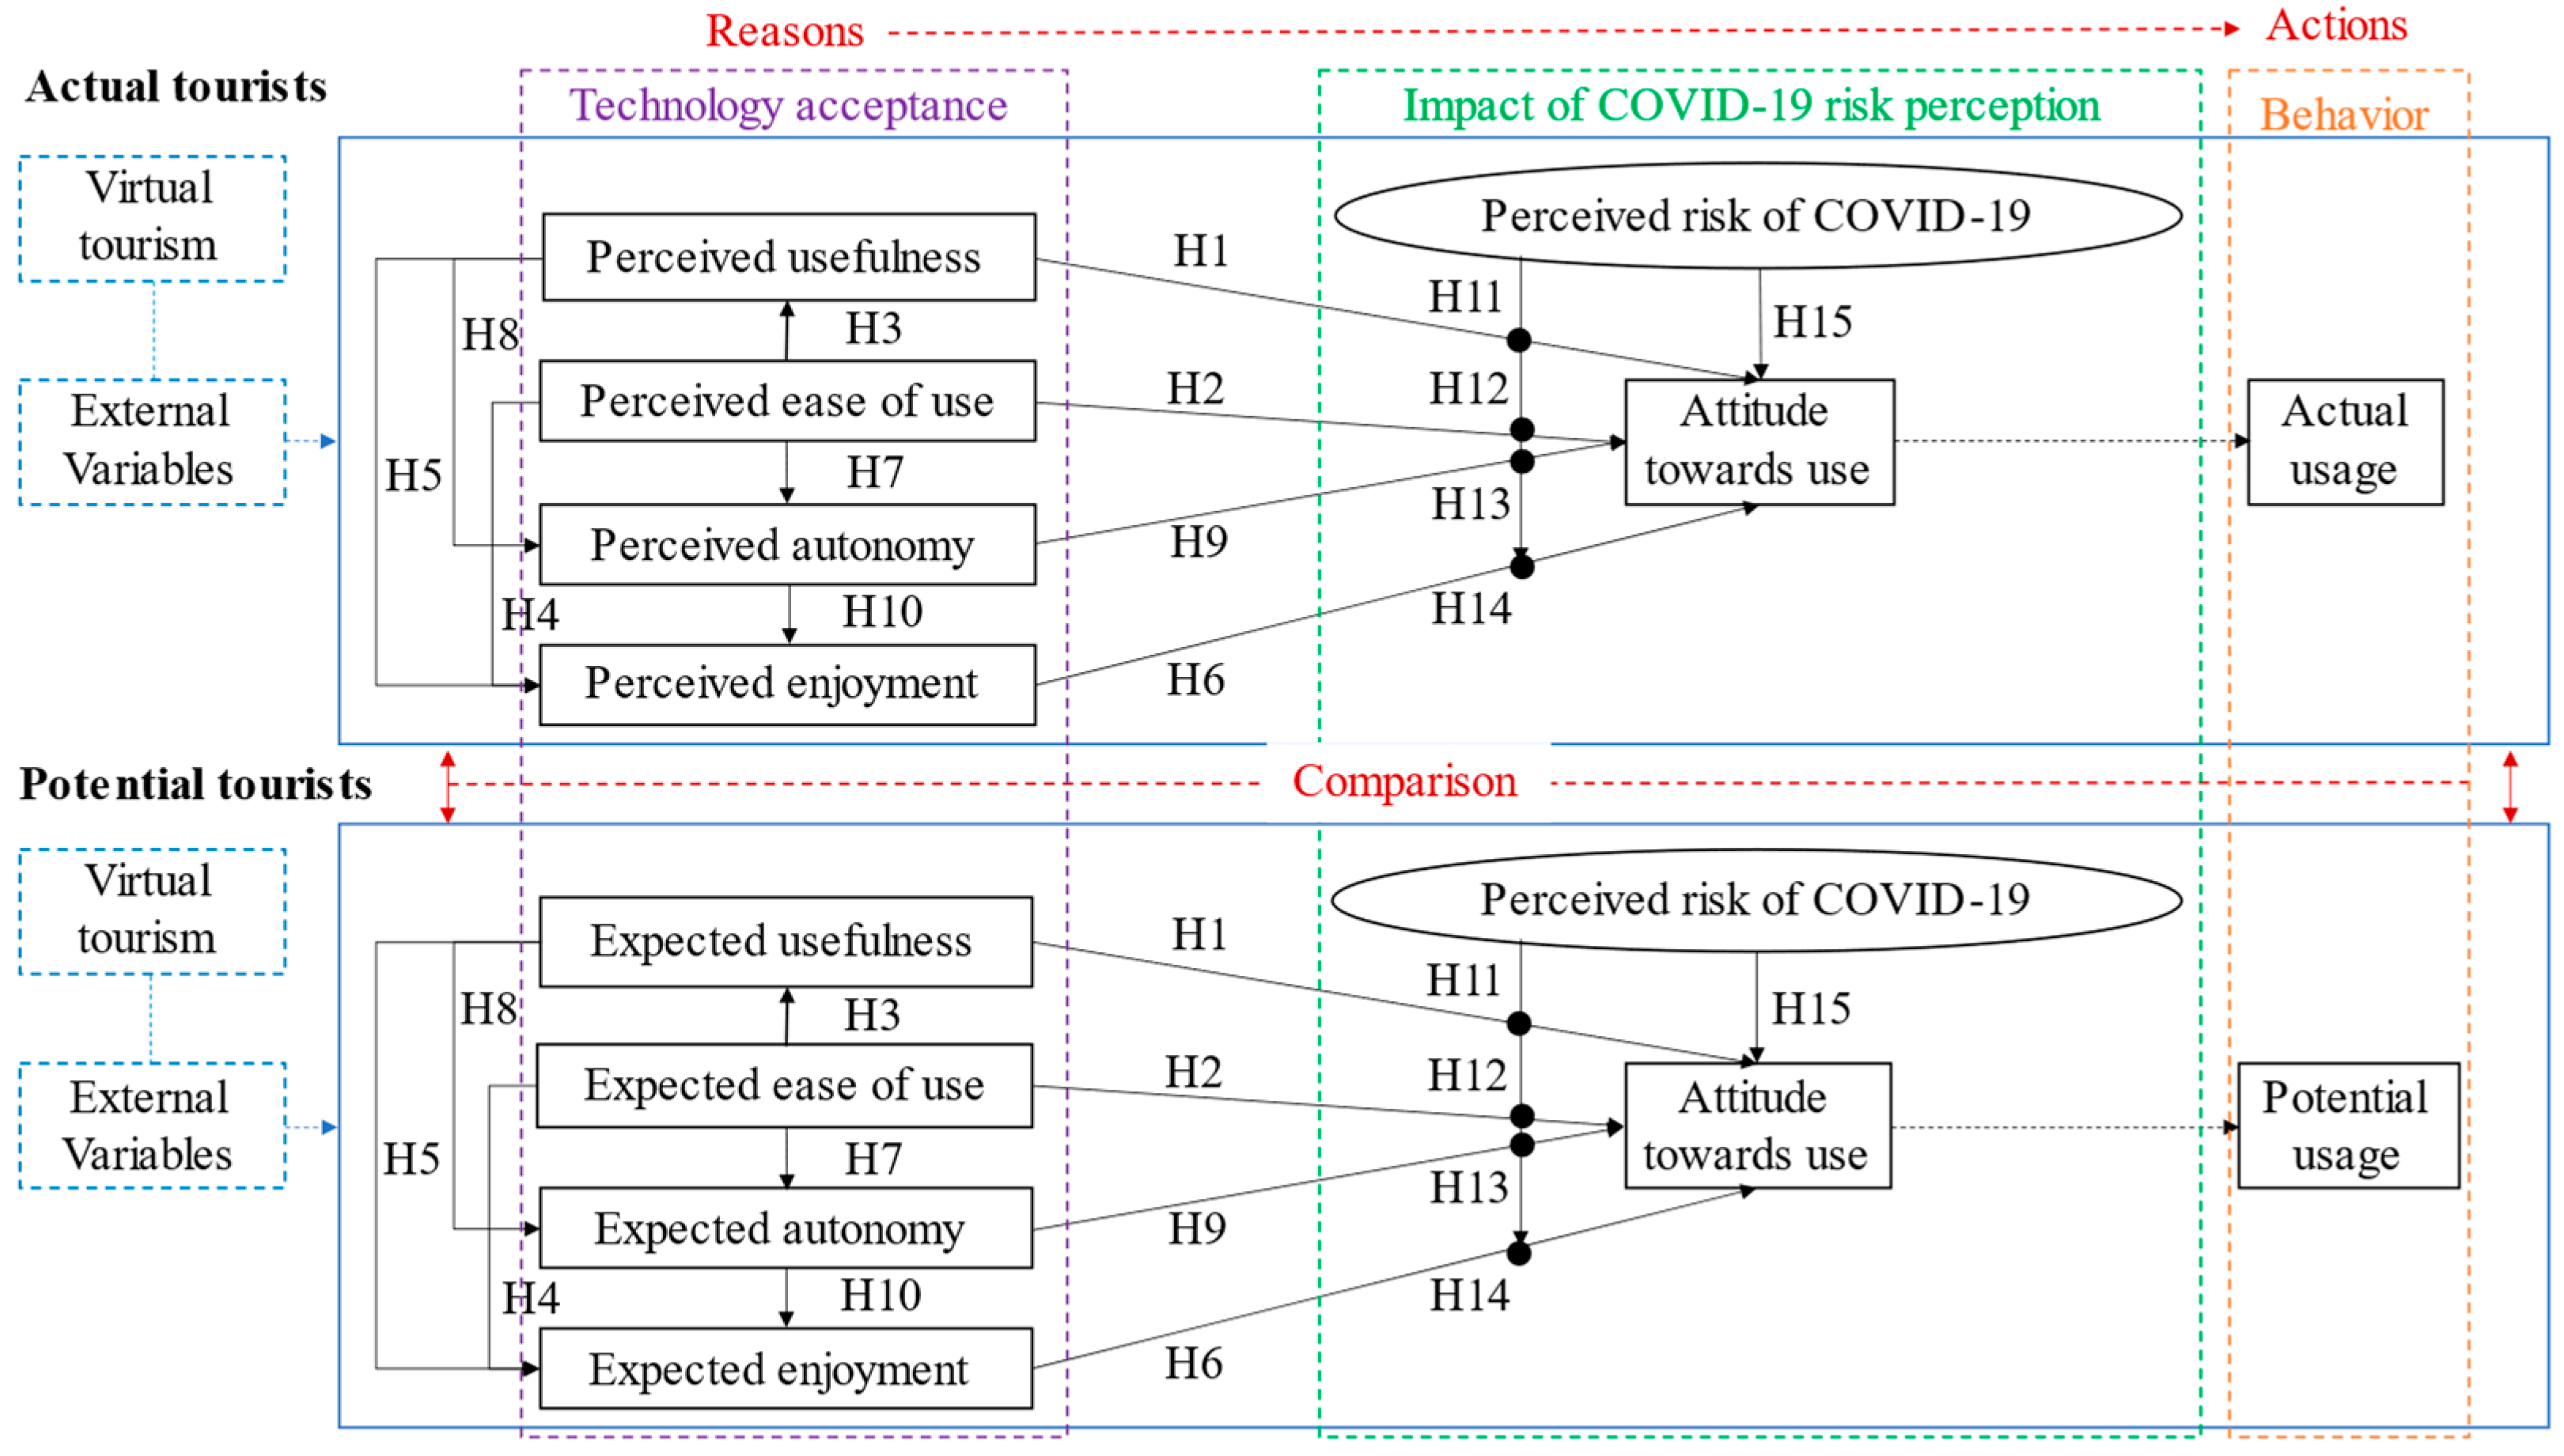
3.2. Hypothetical Model

The hypothetical model is constructed for VR technology acceptance in the unusual situation caused by COVID-19. The context is set to be virtual tourism in a health crisis. Therefore, PU, PEOU, and ATT are basic constructs of TAM and form three hypotheses in this paper:
H1:
Perceived usefulness has a positive effect on tourists’ attitudes towards use (PU→ATT).
H2:
Perceived ease of use has a positive effect on tourists’ attitudes towards use (PEOU→ATT).
H3:
Perceived ease of use has a positive effect on perceived usefulness (PEOU→PU).
Scholars have indicated that TAM is too general and does not have the ability to provide insights on users’ perceptions within a specific context [56], and should incorporate additional factors to improve its predicting utility [57]. In various research contexts, scholars have implemented an extended TAM by adding other essential factors to achieve higher explanatory or predictive capacity, such as hedonic and technical factors [7,57]. To acknowledge the distinct perspective from consumer behavior, some researchers consider the motivation theory and add two intrinsic factors [58], particularly perceived enjoyment (PE) and perceived autonomy (PA), to address people’s incentives for participation [59]. Hence, PU and PEOU have been classified as principal representatives of extrinsic motivators of technology acceptance [60], and PE and PA are related to intrinsic motivation that leads to continuance intention [58]. It shows that the combination of utilitarian and hedonic reasons leads to technology acceptance.
Hedonic motivation is a significant factor in the context of digital learning or education [61] and virtual tourism [62]. It relates to individuals’ enjoyment of the efficiency and effectiveness of digital experiences. In particular, enjoyment specifies the extent to which a person derives fun from using a technology [63] and plays a highly significant role in better understanding users’ behavior [60]. In a study that predicts use of web-based system, TAM is applied by integrating the variable of enjoyment, and the results present a link between PEOU and PE [64]. Similarly, PEOU and PU are found to be related to enjoyment in the usage of hedonic information systems [63]. Grounded in the previous studies, PE is taken as a hedonic input variable in the VR tourism context [65], and shows an effect on attitude change [13]. Hence, this paper adds PE as a predicting factor of TAM and suggests the following hypotheses:
H4:
Perceived ease of use has a positive effect on perceived enjoyment (PEOU→PE).
H5:
Perceived usefulness has a positive effect on perceived enjoyment (PU→PE).
H6:
Perceived enjoyment has a positive effect on attitude towards use (PE→ATT).
Moreover, a good user experience with a technical product is the consequence of fulfilling users’ goals and needs, such as the needs of autonomy [66]. Autonomy is described as “the extent to which a person perceives his or her actions as a result of his or her own free will, without external intervention in a particular situation” [67]. Virtual technology gives tourists’ autonomy in exploring a destination or attractions, experience more control over themselves and environments during the activities and giving them freedom to make decisions. When autonomy is perceived, tourists’ attitude towards the travel content in a virtual context could be higher or more positive, because the perception of autonomy can reduce resistance and enhance satisfaction [68], and can significantly influence their technical usage in the context of virtual worlds [67]. Therefore, the following hypotheses are developed:
H7:
Perceived ease of use has a positive effect on perceived autonomy (PEOU→PA).
H8:
Perceived usefulness has a positive effect on perceived autonomy (PU→PA).
H9:
Perceived autonomy has a positive effect on attitude towards use (PA→ATT).
However, although PE and PA are both considered as intrinsic reasons that influence technology acceptance, the relationship between them is still unclear. As enjoyment is derived from using the technology, and autonomy is closely connected to the specific operation, PE may indicate a staged motivational outcome of PA. Hence, as an exploratory expansion, the following hypothesis is added:
H10:
Perceived autonomy has a positive effect on perceived enjoyment (PA→PE).
Furthermore, as reviewed in the literature, risk perception has a positive impact on an individual’s attitude and behavior. Moreover, it may moderate the relationship between characteristics of technology and attitude towards use [5,47,54]. In order to test both the direct impact that perceived risk of COVID-19 (PROC) has on ATT and the moderating impact that PROC has on relationships, the following hypotheses are developed:
H11:
Perceived risk of COVID-19 significantly moderates the relationship between perceived usefulness and attitude towards use (PROC→PU × ATT).
H12:
Perceived risk of COVID-19 significantly moderates the relationship between perceived ease of use and attitude towards use (PROC→PEOU × ATT).
H13:
Perceived risk of COVID-19 significantly moderates the relationship between perceived autonomy and attitude towards use (PROC→PA × ATT).
H14:
Perceived risk of COVID-19 significantly moderates the relationship between perceived enjoyment and attitude towards use (PROC→PE × ATT).
H15:
Perceived risk of COVID-19 has a positive effect on attitude towards use (PROC→ATT).
It should be noted, in order to compare the differences in technology acceptance in virtual tourism between actual tourists and potential tourists, that the relationships and hypotheses among TAM factors are based on the real perceptions of actual tourists and the expected feelings of potential tourists. Consequently, the hypothetical model is constructed in Figure 2.

4. Methodology

4.1. Questionnaire Design

According to the hypothetical model, the questionnaire encompassed four sections on (1) virtual tourism experience (have or never), (2) demographics (age, gender, profession, education), (3) technology acceptance (PU, PEOU, PA, PE), (4) COVID-19 risk perception (PROC), and (5) attitude towards use (ATT). The research constructs and items are depicted according to the literature. For (3), (4), and (5), a total of 24 items are measured on a five-point Likert scale, ranging from 1 (strongly disagree) to 5 (strongly agree).
Because the measurements were developed based on literature in English, the questionnaire was translated into Chinese. To make sure each question and item description can be well understood, we conducted a pretest of 10 questionnaires in the beginning of March, and adjusted the questionnaire design based on the suggestions of participants. These data are not included in the main study.

4.2. Measurement Scale

The measurement scale and items are derived from TAM and existing research [30,41,57,69], including recent studies adapted to the specific context of this paper and extensions of TAM [13,17,35,59,62,65,70]. The measurement scale of ATT is also based on original [32], improved [33], and extended [30] models of TAM in previous studies, as well as benefits from the hazard-related attitudes proposed by El-Said and Aziz [5]. The measurement scale of PROC is mainly developed from El-Said and Aziz [5] and Wang, Yeh, Chen, and Huan [47].
To avoid understanding bias, the items in the literature were integrated, adjusted, and translated by authors independently. Then, we held focus discussions several times to identify the item descriptions based on the consistency method. Before the questionnaires were distributed, we conducted a pilot test with people who had or did not have virtual tourism experience to give advice for improvement. The final measurement scale is shown in Table 2. It is necessary to emphasize again that the items of TAM factors are differently described as the real perception of actual tourists and the expected perception of potential tourists, while the measurement items of PROC and ATT are the same.

4.3. Sampling and Data Collection

This study applied a non-probability and purposive sampling. The purposive sampling method is used to select respondents who are most likely to give appropriate and useful information [71]. It can be used for the consideration of representative and comparable reasons when the measurements are homogeneous or similar [72]. Given the aims and objectives of this study, we excluded those who had never been exposed to VR, because only participants who knew of VR but did not experience it before can reveal the reasons why they accept it or not and what they expect from it. Otherwise, it is more likely that they do not accept it because of information barriers, which point to marketing problems rather than the technology itself or the technological experience. Those who have used VR technology in the tourism context are also included in the sample.
Due to the COVID-19 pandemic, many attractions are closed or have limited entry. Therefore, it is difficult to perform fieldwork surveys. To collect the data, we implemented an online questionnaire on a website and WeChat for Chinese tourists. The data collection was maintained over a two-week period from 21 March to 3 April 2022, including weekdays and weekends. Before answering the questionnaire, the participant was asked “Have you ever seen, heard of, or learned about virtual technology in tourism?” Only if the answer was yes, the second question would appear, “Have you ever experienced virtual tourism?”, and then the online survey would continue. In total, 274 questionnaires were collected, and 239 of them are utilizable and sufficient for further analysis. The sample is generalizable because the participants volunteered, and it is representative for each group through automatic selection according to two questions.
Table 3 shows the sample characteristics. Generally, 57 participants had VR tourism experience, and 182 participants had never experienced it before. This shows the divergence in peoples’ acceptance behavior and the reality is not so optimistic. Most actual tourists and potential tourists are females, aged 18–25, and are students, and their education background mainly entails an undergraduate or master’s degree. This respondent composition proves that Generations Y and Z, who grew up in the era of communication technology, are the adapters of technological innovation such as virtual tourism [73]. Moreover, similar to relevant research in virtual tourism [4,73], there are more female respondents than males; a possible cause may be that female tourists are more sensitive to the negative emotion induced by crisis situations and are more willing to learn about or try virtual tourism.

5. Results

IBM SPSS Statistics 20 was used to analyze the data and test the model, being a popular software for statistical solutions of questionnaires. Before testing the hypotheses, both exploratory factor analysis (EFA) and confirmatory factor analysis (CFA) were conducted to test scale items. Then, three steps were employed to test the construct model: (1) path analysis for the effect of TAM and PROC on ATT, (2) moderate effect examination of PROC, and (3) comparison of construct model between actual and potential tourist groups.

5.1. Reliability and Validity of Construct Model

In EFA, we measured Cronbach’s α and composite reliability (CR) to verify the consistency of the internal constructs. At the first level of latent variables, Bartlett’s test of sphericity is 4410 (p < 0.000), the Kaiser–Meyer–Olkin (KMO) value is 0.910 (KMO > 0.7), and Cronbach’s α is 0.800 (α > 0.7). At the second level of observation variables, setting the minimum eigenvalue of 1, a principal component analysis with the varimax rotation method is applied. Considering a higher variance explanation rate (>60%) and better construct validity, some factors with correlatedly lower factor extraction (λ) for each variable are deleted (PU1, PU2, PEOU2, PE1, PE3, PROC4). Table 4 shows the revised constructed model with Cronbach’s α value of 0.927, which shows better reliability.
Confirmatory factor analysis (CFA) was conducted by applying the highest probability estimator to examine the items’ structure and the composition of the revised model. Two types of validity were assessed: convergent validity and discriminant validity. According to Table 5, all items were loaded significantly under prescribed determinants, and most of them met the standardized factor (SFL > 0.6, p < 0.001). Table 4 also reports the average variance extracted (AVE) and CR, which are higher than 0.5 (AVE) and 0.7 (CR), proving the convergent validity of the research measures.
According to Table 6, the diagonal coefficient is greater than the off-diagonal elements in the corresponding rows and columns, and the measurement construction and items have adequate discriminant validity. Overall, the six theoretical constructs applied in the conceptual model have adequate reliability and validity.

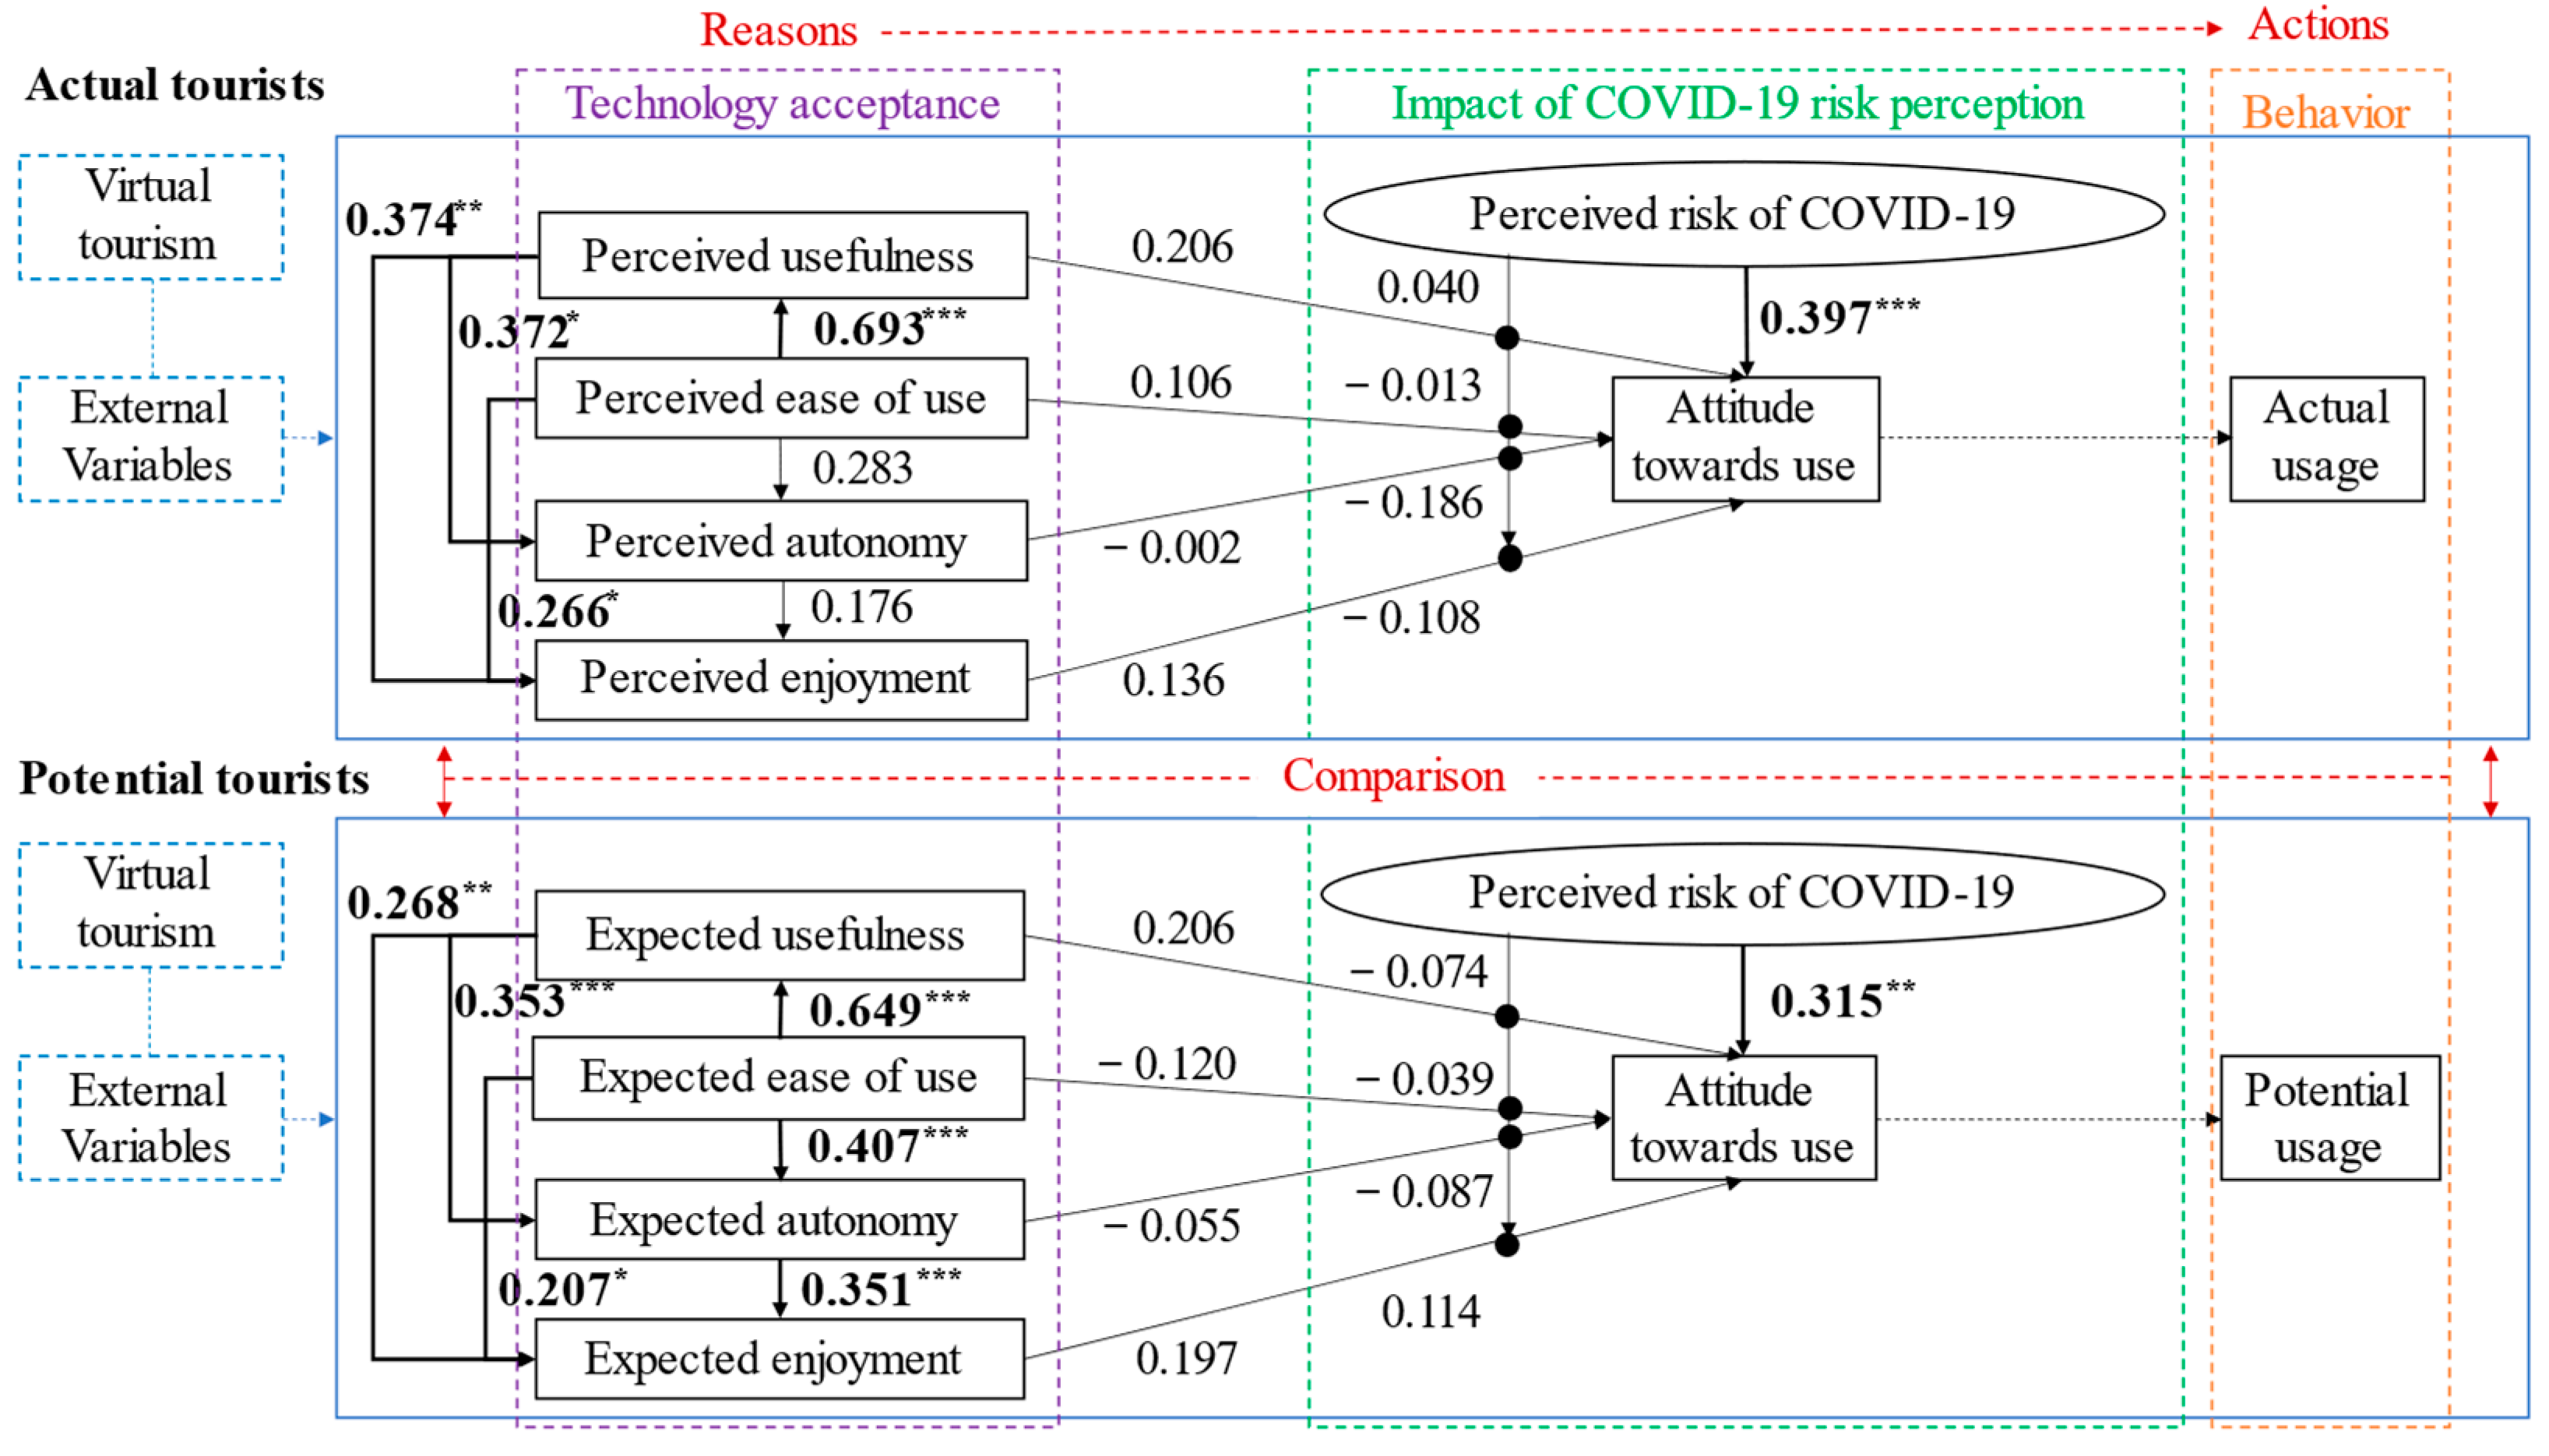
5.2. Path Analysis Results

The path analysis was conducted to examine the effect among variables, and we used SPSS with all major variables mean-centered (Table 7). The model of the actual tourist group fits well (x^2⁄df = 0.393; GFI = 0.993, RMSEA = 0.000, RMR = 0.016, CFI = 1.015, NFI = 0.991, NNFI = 1.077). The results show that PEOU has positive and significant effects on both PU (β = 0.693, p < 0.001) and PE (β = 0.266, p < 0.05), PU has positive and significant effects on PE (β = 0.374, p < 0.01) and PA (β = 0.372, p < 0.05), and PROC has positive and significant effects on ATT (β = 0.397, p < 0.001). Therefore, H3, H4, H5, H8, and H15 were validated.
The model of the potential tourist group also fits well (x2⁄df = 1.505; GFI = 0.984, RMSEA = 0.071, RMR = 0.018, CFI = 0.993, NFI = 0.981, NNFI = 0.966). The results show that PEOU has positive and significant effects on PU (β = 0.649, p < 0.001), PE (β = 0.207, p < 0.05), and PA (β = 0.407, p < 0.001). PU has positive and significant effects on both PE (β = 0.268, p < 0.01) and PA (β = 0.353, p < 0.001). PA has positive and significant effects on PE (β = 0.351, p < 0.001), and PROC has positive and significant effects on ATT (β = 0.315, p < 0.01). Therefore, H3, H4, H5, H7, H8, H10, and H15 were validated.
According to the results, there is no direct effect of TAM (PU, PEOU, PA, PE) on ATT in either group. This means that the technology acceptance of virtual tourism does not significantly influence tourists’ attitude towards use from both actual and potential perspectives. However, tourists’ PROC is proved to have a significant effect on their ATT. Furthermore, whether the PROC can moderate the effect of TAM on ATT should be tested.

5.3. Moderating Effect of Perceived Risk of COVID-19

The moderate analysis was employed to examine the effect of PROC as a moderator. SPSS was used with independent and dependent variables mean-centered (Table 8). According to the results, there is no significant moderating effect of PROC for either group. Therefore, PROC should be regarded as an impact factor rather than a moderator, together with factors of TAM.

5.4. Comparison of Actual and Potential Groups

The results of path analysis and moderate effect analysis show some similarity in variable relationships between actual and potential tourist groups. The main differences are the effect paths from PEOU to PA and from PA to PE (Figure 3). These two paths indicate that the expected ease of use is important to potential tourists and will positively affect their expected autonomy, which in turn will further affect their expected enjoyment of the virtual experience.

6. Discussion and Conclusions

6.1. Discussion

Based on the integrated framework of the Reasoned Action Theory and the Technology Acceptance Model, we focused on the impact of tourists’ perceived/expected technology acceptance on their attitude towards the use of virtual tourism from the comparison perspective of tourists’ experience. At the same time, the effect of perceived risk of COVID-19 was tested by path analysis and moderate analysis in the post-pandemic stage. The results validate some previous conclusions and present some new developments.
First, there is a significant difference between the sample size of the potential and actual tourist groups. As a new exploration that simultaneously considers the technology acceptance of two different groups who have not experienced virtual tourism and those who have, the results of the difference between group numbers are surprising but explainable. As indicated, virtual tourism not only stimulated positive sentiments such as the expectations and curiosity of tourists, but also motivated negative attitudes such as strangeness of a new form of tourism [6]. These sentimental causes may be reasoned for this sample difference.
Second, previous studies found effect paths from TAM to ATT in virtual contexts, such as student acceptance of virtual laboratories [74] and e-learning [70], users’ attitude towards using VR hardware [35], and tourists’ behavioral intention of using virtual technology for travel planning [75]. Usefulness is found to be the primary determinant of technology usage, while ease of use and enjoyment are secondary determinants [30,32,33,76]. Meanwhile, there are also some studies that observed a stronger effect of enjoyment on attitude than ease of use and/or usefulness [77,78]. In contrast, we did not find that factors of the Technology Acceptance Model have a significant effect on attitude towards the use of virtual tourism.
However, this result is not contradictory to all studies. For example, ease of use was found to not have an influence on attitude towards education in 3D virtual environments [79], or applications in tourism within the context of the COVID-19 pandemic [61]. The adoption attitude and use intentions for virtual tourism would be affected by hazard-related attributes and risk perception of COVID-19 [5]. These studies provide an explanation for the lack of significance in this paper, which is the special background of the post-COVID-19 period. Furthermore, it might be explained by the instability of the effect raised in two meta-analyses of TAM [80,81] or different sample sizes that each factor of TAM needs [17,80]. Thus, the findings may not be the same in different studies because of various sample sizes.
Third, the complex interaction among factors of TAM is proved. Similar to most research, we found a significant effect path from ease of use to usefulness from both perceived and expected perspectives. Moreover, we extended the TAM by adding PA and PE as critical compositions referred to recently by researchers [59,65,75] and provided new findings on the effect paths from usefulness to autonomy and enjoyment, and from ease of use to enjoyment. These findings, to some extent, compensate for the lack of experience and internal motivation in technology acceptance research on virtual tourism.
Fourth, there are two interesting findings in comparative differences between the actual and potential tourist groups. Particularly, the effect paths from ease of use to autonomy and from autonomy to enjoyment was only found in potential tourists. These findings indicate that ease of use is important for tourists to immerse themselves in virtual tourism and feel autonomy, which would further influence the enjoyment of the travel experience. However, the application of virtual technology in tourism is not able to satisfy this expectation. As some recent scholars have pointed out, the VR literature has ignored a call for further study of negative responses of tourist experiences [18,82]. The inability of tourists to satisfy their perceived autonomy and perceived enjoyment due to the ease of use of technology is a complement to this response.
In addition, the significant influence of perceived risk of COVID-19 on attitude towards the use of virtual technology in tourism was found. This suggests that the perceived risk of COVID-19 is one of the causes that directly influences tourists’ attitude towards using VR, rather than playing the role of a moderator. This finding confirms that people’s perception of danger in tourism during the spread of COVID-19 drives them to avoid crowded destinations [3] and adopt safer alternatives such as virtual tourism [5], for both potential and actual tourists. At the same time, it provides evidence for our points that COVID-19 should not only be regarded as a background for research or social phenomena—its key role as an influencing factor should also be properly recognized.

6.2. Theoretical Contributions

The first contribution of our study is the construction of a model that applies TAM and TRA, which re-examines their applicability in virtual tourism from the new perspective of crisis situations. The factors of technology acceptance are regard as reasons that can explain and predict tourists’ attitude towards technology use, which leads to usage actions. This study provides specific empirical evidence to prove that TRA and TAM can be used to assess the acceptance of new technologies in crisis situations.
Second, one of the original contributions of this study is a measurement scale composed of the extended TAM with PE, PA, attitude towards use, and perceived risk of COVID-19 through a two-step test (EFA and CFA) for virtual tourism research. Except for PE and PEOU, the intrinsic factors such as hedonic motivation and experience quality expectation are also important but ignored. This study finds that intrinsic (enjoyment, autonomy) and extrinsic (usefulness, ease of use) are significant predictors in virtual tourism, and this is also compatible with earlier studies [13,59]. Moreover, a measurable scale for risk perception of COVID-19 suitable for virtual tourism research is also included, and to some extent provides theoretical and methodological references for future research on virtual tourism in crisis situations.
Third, we clarified that the effect paths between factors inside the TAM are important discoveries for related research. The results of this study highlight that using the indicators of technological experience (including PU, PEOU, PA, PE) to predict user attitudes is not always effective. Our study focusing on tourists in the post-pandemic situation is an empirical example. Meanwhile, the direct effect path from perceived risk of COVID-19 to user attitude, rather than a moderator role between TAM and attitude, is a new finding that can complement existing conclusions in previous studies. These findings enhance the framework for the formation of virtual tourist acceptance in crisis situations. Some scholars believe that after the COVID-19 pandemic ends, virtual tourism and face-to-face on-site visits will continue to coexist [6]. It is recommended that tourism researchers consider their respective scenic spot strategy portfolio design under both normal market conditions and crisis conditions [83,84]. In crisis conditions, the risk perception of COVID-19 is useful to predict tourists’ attitude towards using VR. When the crisis ends, the indicators in the TAM are still useful in improving the technological experience and helping to enhance quality.
Furthermore, the comparative perspective in this paper provides the technical expectations of potential tourists and the real experience of technology applied in virtual tourism. The comparison results can reveal how the factors of technology acceptance differ in actual and expected performance, and how they affect the final attitude of tourists towards use. To the best of our knowledge, no empirical study exists approaching this comparative perspective—this current study is an exploration that attempts to reveal the differences between expectation and reality in order to understand group characteristics of virtual experiences. Differences in results can reveal specific aspects that tourists expect but are not satisfied in actual virtual tours, thus guiding the technical improvement of virtual tourism.

6.3. Practical Implications

This paper provides some evidence for virtual technology improvement and virtual tourism development. On the one hand, the differences between expectation and reality suggest improvement guidance from a human-oriented perspective. The usefulness and ease of use should be considered as foundational technology standards of technology acceptance. At the same time, autonomy and enjoyment should be valued as the means of improvement because of tourists’ inherent expectations. On the other hand, the direct effect of perceived risk of COVID-19 for both potential and actual tourists provides a useful avenue for tourism practitioners to conduct marketing. In the case of repeated epidemics of COVID-19, the tourism industry is capricious, susceptible to vigorous recovery and depression. The marketing publicity of virtual tourism as a temporary alternative should appease tourists’ fear and anxiety, and guide their intention for secure travel. The findings of this study can provide a reference for product designers and industry practitioners of virtual tourism. The results suggest not only the potential development opportunities for virtual tourism, but also the lack of attention on the expectations and inherent psychological characteristics of tourists.
First, the difference in sample counts between potential tourists and actual tourists intuitively reflects the limited popularity of virtual tourism at the current stage of development. The result urges the tourism industry to realize the development status of virtual tourism rather than be overly optimistic. Many tourists are still looking at this new way of traveling rather than trying it, so tourism marketing needs to consider how to attract tourists to experience it in person, such as providing free experience on-site or online, strengthening advertisements, or facilitating education to reduce the strangeness of the concept.
Second, the future development of VR tourism should pay attention to the expectations and inherent psychological characteristics of potential tourists. The virtual tourism product designer should pay more attention to easy operation and high efficiency and try not to complicate the tourism activities in the virtual world. The ease of use of virtual tourism benefits tourists’ perceived autonomy. Tourists expect that they can have a lot of control and choose freely what they want to do, and create their experience by their own actions, so that they will feel more enjoyment with virtual tourism. Therefore, virtual tourism product designs should provide more possibilities for tourists to create the activities by themselves, or allow more decisive steps and options to shorten the psychological distance between the virtual world and the tourist experience.
In addition, given the direct effect of COVID-19 risk perception, managers of tourism destinations can adapt two strategies: a crisis response and a non-crisis development perspective. Under crisis circumstances, managers can focus on the safety of virtual tourism to attract tourists and relieve destination pressure. Furthermore, a sufficiently clear and acceptable technical presentation needs to be provided for tourists, especially those who are still hesitating to try virtual tourism. Importantly, managers must clarify the development trends and roles of virtual tourism when the crisis ends. It is necessary to consider how virtual tourism can assist the brand sustainability of tourist destinations after the availability of on-site tourism [85]. For example, an interactive design of a destination’s real scene and the virtual world of the destination, including time and space, can avoid the reduced availability of virtual tourism after the crisis, and at the same time build motivation for subsequent on-site tourism during the crisis.

6.4. Limitations and Future Research

Our study is exploratory research for revealing reasons of technology acceptance and causes of attitude towards the use of virtual tourism, providing theoretical contributions and practical implications. However, there are still some limitations. (1) Although it strictly followed the systematic literature review to enhance the theoretical framework and construct the measurement scale, it may be subjective due to theoretical accumulation and knowledge reserves. In the future, the theoretical framework and constructed measurements presented here need more support from other empirical tests. (2) The sample sizes for factors of TAM were not homogenous, and more tests are needed. We tried to ensure that the data can reflect the real market situation of virtual tourism development, and that the samples are appropriate and representative, but it is difficult to completely avoid the possible impact of the small sample size. More samples may help enhance the robustness of the results. (3) This study focused on the outcomes of tourists’ acceptance of technology applied in virtual tourism, but did not consider the technology itself in more detail. Considering the importance of tourists’ inner psychological experience found in this study, future research could explore more micro causes from technology applications, e.g., technical elements such as color, voice, sensitivity, and interactivity and embodied experiences such as vision, auditory, and touch. (4) In order to obtain the data on the real market status, this paper does not control the individual characteristics of tourists (e.g., age, gender) or external environmental factors (e.g., social influence). Future research can further control and explore these variables.

6.5. Conclusions

Academia and the tourism industry have shown great enthusiasm for the development of virtual tourism, especially given the current restrictions on real tourism. In the urgent search for alternative solutions or sustainable development paths, both academia and the industry need to understand the application effects of virtual technology in tourism and consider the future development of virtual tourism from the perspective of tourists. Therefore, both the experience brought by the technology itself and the experience demand driven by the intrinsic motivation of tourists should be taken seriously. In addition, to better understand the response of tourists to crisis situations, researchers should consider tourists’ perception of risk rather than just taking the COVID-19 pandemic as a special context. In conclusion, we constructed a theoretical model based on the Theory of Reasoned Behavior, extending the Technology Acceptance Model from hedonic motivation and tourism experience perspectives. We also considered and examined the impact of COVID-19 risk perception. Methodologically, tourists are divided into actual and potential tourist groups according to their virtual travel experience, and the standardized path examination was used to assess the hypothesized relationships.
Based on our results, the usefulness of virtual tourism technology has significant effects on autonomy and enjoyment. Tourists’ perception of technology usefulness can basically meet their expectations, so that the autonomy and enjoyment are perceived as well as tourists expected. Ease of use is another basic factor that leads to enjoyment for both potential and actual tourists. According to tourists’ expectations, the ease of use of technology would also significantly affect autonomy and thus lead to enjoyment. However, the perceived results do not satisfy this tendency. This means that there is still a theoretical path of the enjoyment of tourists in virtual tourism that has not been achieved in the industry, that is, designing simple and clear operations to make tourists feel free and in control, and thus enjoy the virtual tourism experience. Our conclusions are acceptable regardless of crisis conditions and have a general meaning. The conclusions of this paper regarding the impact of COVID-19 also apply to specific risk situations. Therefore, this study could give references for the sustainable development of virtual tourism for different situations.

Author Contributions

Conceptualization, Y.L. and J.L.; methodology, Y.L. and J.L.; formal analysis, J.L.; investigation, R.L. and H.B.; data curation, R.L.; writing—original draft preparation, J.L. and J.H.; writing—review and editing, J.H., J.L. and M.Y.; funding acquisition, Y.L. All authors have read and agreed to the published version of the manuscript.

Funding

This research was funded by the Natural Science Foundation of China (grant numbers 42171219) and the Natural Science Foundation of Fujian Province (grant number 2020J01011).

Institutional Review Board Statement

Not applicable.

Informed Consent Statement

Not applicable.

Data Availability Statement

The data that support the findings of this study are available from the corresponding author upon reasonable request.

Conflicts of Interest

The authors declare no conflict of interest.

References

  1. Pedrana, M. Location-based services and tourism: Possible implications for destination. Curr. Issues Tour. 2014, 17, 753–762. [Google Scholar] [CrossRef]
  2. Sigala, M. Tourism and COVID-19: Impacts and implications for advancing and resetting industry and research. J. Bus Res. 2020, 117, 312–321. [Google Scholar] [CrossRef]
  3. Wen, J.; Kozak, M.; Yang, S.; Liu, F. COVID-19: Potential effects on Chinese citizens’ lifestyle and travel. Tour. Rev. 2020, 76, 74–87. [Google Scholar] [CrossRef]
  4. Yang, T.-T.; Ruan, W.-Q.; Zhang, S.-N.; Li, Y.-Q. The influence of the COVID-19 pandemic on tourism demand for destinations: An analysis of spatial heterogeneity from a multi-scale perspective. Asia Pac. J. Tour. Res. 2021, 26, 793–810. [Google Scholar] [CrossRef]
  5. El-Said, O.; Aziz, H. Virtual Tours a Means to an End: An Analysis of Virtual Tours’ Role in Tourism Recovery Post COVID-19. J. Travel Res. 2021, 61, 528–548. [Google Scholar] [CrossRef]
  6. Zhang, S.-N.; Li, Y.-Q.; Ruan, W.-Q.; Liu, C.-H. Would you enjoy virtual travel? The characteristics and causes of virtual tourists’ sentiment under the influence of the COVID-19 pandemic. Tour. Manag. 2022, 88, 104429. [Google Scholar] [CrossRef]
  7. Yung, R.; Khoo-Lattimore, C. New realities: A systematic literature review on virtual reality and augmented reality in tourism research. Curr. Issues Tour. 2019, 22, 2056–2081. [Google Scholar] [CrossRef] [Green Version]
  8. Guttentag, D.A. Virtual reality: Applications and implications for tourism. Tour. Manag. 2010, 31, 637–651. [Google Scholar] [CrossRef]
  9. Hobson, J.P.; Williams, A.P. Virtual reality: A new horizon for the tourism industry. J. Vacat. Mark. 1995, 1, 124–135. [Google Scholar] [CrossRef]
  10. Jung, T.H.; tom Dieck, M.C. Augmented reality, virtual reality and 3D printing for the co-creation of value for the visitor experience at cultural heritage places. J. Place Manag. Dev. 2017, 10, 140–151. [Google Scholar] [CrossRef]
  11. Kim, M.J.; Lee, C.-K.; Jung, T. Exploring Consumer Behavior in Virtual Reality Tourism Using an Extended Stimulus-Organism-Response Model. J. Travel Res. 2018, 59, 69–89. [Google Scholar] [CrossRef] [Green Version]
  12. Jung, T.; tom Dieck, M.C.; Lee, H.; Chung, N. Effects of Virtual Reality and Augmented Reality on Visitor Experiences in Museum. In Information and Communication Technologies in Tourism 2016; Springer: Berlin/Heidelberg, Germany, 2016; pp. 621–635. [Google Scholar]
  13. Tussyadiah, I.P.; Wang, D.; Jung, T.H.; tom Dieck, M.C. Virtual reality, presence, and attitude change: Empirical evidence from tourism. Tour. Manag. 2018, 66, 140–154. [Google Scholar] [CrossRef]
  14. Shin, D.; Biocca, F. Exploring immersive experience in journalism. New Media Soc. 2018, 20, 2800–2823. [Google Scholar] [CrossRef]
  15. Shin, D. The perception of humanness in conversational journalism: An algorithmic information-processing perspective. New Media Soc. 2021, 0, 3801. [Google Scholar] [CrossRef]
  16. Talukdar, N.; Yu, S. Breaking the psychological distance: The effect of immersive virtual reality on perceived novelty and user satisfaction. J. Strateg. Mark. 2021, 1–25. [Google Scholar] [CrossRef]
  17. Sagnier, C.; Loup-Escande, E.; Lourdeaux, D.; Thouvenin, I.; Valléry, G. User Acceptance of Virtual Reality: An Extended Technology Acceptance Model. Int. J. Hum. Comput. Interact. 2020, 36, 993–1007. [Google Scholar] [CrossRef]
  18. Merkx, C.; Nawijn, J. Virtual reality tourism experiences: Addiction and isolation. Tour. Manag. 2021, 87, 104394. [Google Scholar] [CrossRef]
  19. Yang, T.; Lai, I.K.W.; Fan, Z.B.; Mo, Q.M. The impact of a 360 degrees virtual tour on the reduction of psychological stress caused by COVID-19. Technol Soc 2021, 64, 101514. [Google Scholar] [CrossRef] [PubMed]
  20. Tavakoli, R.; Mura, P. ‘Journeys in Second Life’—Iranian Muslim women’s behaviour in virtual tourist destinations. Tour. Manag. 2015, 46, 398–407. [Google Scholar] [CrossRef]
  21. Lin, L.-P.; Huang, S.-C.; Ho, Y.-C. Could virtual reality effectively market slow travel in a heritage destination? Tour. Manag. 2020, 78, 104027. [Google Scholar] [CrossRef]
  22. Hsu, W.-Y. Brain–computer interface connected to telemedicine and telecommunication in virtual reality applications. Telemat. Inform. 2017, 34, 224–238. [Google Scholar] [CrossRef]
  23. Wagler, A.; Hanus, M.D. Comparing Virtual Reality Tourism to Real-Life Experience: Effects of Presence and Engagement on Attitude and Enjoyment. Commun. Res. Rep. 2018, 35, 456–464. [Google Scholar] [CrossRef]
  24. Wei, W.; Qi, R.; Zhang, L. Effects of virtual reality on theme park visitors’ experience and behaviors: A presence perspective. Tour. Manag. 2019, 71, 282–293. [Google Scholar] [CrossRef]
  25. Sarkady, D.; Neuburger, L.; Egger, R. Virtual reality as a travel substitution tool during COVID-19. In Information and Communication Technologies in Tourism 2021; Springer: Berlin/Heidelberg, Germany, 2021; pp. 452–463. [Google Scholar]
  26. Renaud, L. Reconsidering global mobility—Distancing from mass cruise tourism in the aftermath of COVID-19. Tour. Geogr. 2020, 22, 679–689. [Google Scholar] [CrossRef]
  27. Fishbein, M.; Ajzen, I. Belief, Attitude, Intention and Behavior: An Introduction to Theory and Research; Addison-Wesley: Reading, MA, USA, 1975. [Google Scholar]
  28. Ajzen, I. The theory of planned behavior. Organ. Behav. Hum. Decis. Processes 1991, 50, 179–211. [Google Scholar] [CrossRef]
  29. Ajzen, I. From Intentions to Actions: A Theory of Planned Behavior. In Action Control: From Cognition to Behavior; Kuhl, J., Beckmann, J., Eds.; Springer: Berlin/Heidelberg, Germany, 1985; pp. 11–39. [Google Scholar]
  30. Davis, F.D.; Bagozzi, R.P.; Warshaw, P.R. User acceptance of computer technology: A comparison of two theoretical models. Manag. Sci. 1989, 35, 982–1003. [Google Scholar] [CrossRef] [Green Version]
  31. Taylor, S.; Todd, P.A. Understanding Information Technology Usage: A Test of Competing Models. Inf. Syst. Res. 1995, 6, 144–176. [Google Scholar] [CrossRef]
  32. Davis, F.D. A Technology Acceptance Model for Empirically Testing New End-User Information Systems: Theory and Results; Massachusetts Institute of Technology: Cambridge, MA, USA, 1986. [Google Scholar]
  33. Davis, F.D. Perceived usefulness, perceived ease of use, and user acceptance of information technology. MIS Q. 1989, 13, 319–340. [Google Scholar] [CrossRef] [Green Version]
  34. Venkatesh, V.; Davis, F.D. A Theoretical Extension of the Technology Acceptance Model: Four Longitudinal Field Studies. Manag. Sci. 2000, 46, 186–204. [Google Scholar] [CrossRef] [Green Version]
  35. Manis, K.T.; Choi, D. The virtual reality hardware acceptance model (VR-HAM): Extending and individuating the technology acceptance model (TAM) for virtual reality hardware. J. Bus. Res. 2019, 100, 503–513. [Google Scholar] [CrossRef]
  36. Chiao, H.-M.; Chen, Y.-L.; Huang, W.-H. Examining the usability of an online virtual tour-guiding platform for cultural tourism education. J. Hosp. Leis. Sport Tour. Educ. 2018, 23, 29–38. [Google Scholar] [CrossRef]
  37. Kim, J. An extended technology acceptance model in behavioral intention toward hotel tablet apps with moderating effects of gender and age. Int. J. Contemp. Hosp. Manag. 2016, 28, 1535–1553. [Google Scholar] [CrossRef]
  38. tom Dieck, M.C.; Jung, T. A theoretical model of mobile augmented reality acceptance in urban heritage tourism. Curr. Issues Tour. 2015, 21, 154–174. [Google Scholar] [CrossRef] [Green Version]
  39. Moore, G.C.; Benbasat, I. Development of an Instrument to Measure the Perceptions of Adopting an Information Technology Innovation. Inf. Syst. Res. 1991, 2, 192–222. [Google Scholar] [CrossRef] [Green Version]
  40. Davis, F.D.; Bagozzi, R.P.; Warshaw, P.R. Extrinsic and Intrinsic Motivation to Use Computers in the Workplace1. J. Appl. Soc. Psychol. 1992, 22, 1111–1132. [Google Scholar] [CrossRef]
  41. Szajna, B. Empirical evaluation of the revised technology acceptance model. Manag. Sci. 1996, 42, 85–92. [Google Scholar] [CrossRef]
  42. Venkatesh, V.; Morris, M.G.; Davis, G.B.; Davis, F.D. User acceptance of information technology: Toward a unified view. MIS Q. 2003, 27, 425–478. [Google Scholar] [CrossRef] [Green Version]
  43. Assaker, G.; Hallak, R.; El-Haddad, R. Consumer usage of online travel reviews: Expanding the unified theory of acceptance and use of technology 2 model. J. Vacat. Mark. 2019, 26, 149–165. [Google Scholar] [CrossRef]
  44. Gupta, A.; Dogra, N.; George, B. What determines tourist adoption of smartphone apps? J. Hosp. Tour. Technol. 2018, 9, 50–64. [Google Scholar] [CrossRef]
  45. Lu, J.; Mao, Z.; Wang, M.; Hu, L. Goodbye maps, hello apps? Exploring the influential determinants of travel app adoption. Curr. Issues Tour. 2015, 18, 1059–1079. [Google Scholar] [CrossRef]
  46. Lindell, M.K.; Perry, R.W. Household Adjustment to Earthquake Hazard. Env. Behav. 2016, 32, 461–501. [Google Scholar] [CrossRef]
  47. Wang, L.-H.; Yeh, S.-S.; Chen, K.-Y.; Huan, T.-C. Tourists’ travel intention: Revisiting the TPB model with age and perceived risk as moderator and attitude as mediator. Tour. Rev. 2022; ahead of print. [Google Scholar]
  48. Curras-Perez, R.; Ruiz, C.; Sanchez-Garcia, I.; Sanz, S. Determinants of customer retention in virtual environments. The role of perceived risk in a tourism services context. Span. J. Mark. ESIC 2017, 21, 131–145. [Google Scholar] [CrossRef]
  49. Wang, J.; Liu-Lastres, B.; Ritchie, B.W.; Pan, D.-Z. Risk reduction and adventure tourism safety: An extension of the risk perception attitude framework (RPAF). Tour. Manag. 2019, 74, 247–257. [Google Scholar] [CrossRef]
  50. Chien, P.M.; Sharifpour, M.; Ritchie, B.W.; Watson, B. Travelers’ Health Risk Perceptions and Protective Behavior: A Psychological Approach. J. Travel Res. 2017, 56, 744–759. [Google Scholar] [CrossRef]
  51. Novelli, M.; Gussing Burgess, L.; Jones, A.; Ritchie, B.W. ‘No Ebola...still doomed’—The Ebola-induced tourism crisis. Ann Tour Res 2018, 70, 76–87. [Google Scholar] [CrossRef] [PubMed]
  52. Sneader, K.; Singhal, S. Beyond coronavirus: The path to the next normal. McKinsey Co. 2020, 5. [Google Scholar]
  53. Gössling, S.; Scott, D.; Hall, C.M. Pandemics, tourism and global change: A rapid assessment of COVID-19. J. Sustain. Tour. 2020, 29, 1–20. [Google Scholar] [CrossRef]
  54. Hall, C.M.; Scott, D.; Gössling, S. Pandemics, transformations and tourism: Be careful what you wish for. Tour. Geogr. 2020, 22, 577–598. [Google Scholar] [CrossRef]
  55. Legris, P.; Ingham, J.; Collerette, P. Why do people use information technology? A critical review of the technology acceptance model. Inf. Manag. 2003, 40, 191–204. [Google Scholar] [CrossRef]
  56. Ukpabi, D.C.; Karjaluoto, H. Consumers’ acceptance of information and communications technology in tourism: A review. Telemat. Inform. 2017, 34, 618–644. [Google Scholar] [CrossRef] [Green Version]
  57. Mehta, A.; Morris, N.P.; Swinnerton, B.; Homer, M. The Influence of Values on E-learning Adoption. Comput. Educ. 2019, 141, 103617. [Google Scholar] [CrossRef]
  58. Deci, E.L.; Ryan, R.M. The general causality orientations scale: Self-determination in personality. J. Res. Personal. 1985, 19, 109–134. [Google Scholar] [CrossRef]
  59. Rahimizhian, S.; Ozturen, A.; Ilkan, M. Emerging realm of 360-degree technology to promote tourism destination. Technol. Soc. 2020, 63, 101411. [Google Scholar] [CrossRef]
  60. Kim, M.J.; Lee, C.-K.; Bonn, M. Obtaining a better understanding about travel-related purchase intentions among senior users of mobile social network sites. Int. J. Inf. Manag. 2017, 37, 484–496. [Google Scholar] [CrossRef]
  61. Shen, S.; Xu, K.; Sotiriadis, M.; Wang, Y. Exploring the factors influencing the adoption and usage of Augmented Reality and Virtual Reality applications in tourism education within the context of COVID-19 pandemic. J. Hosp. Leis Sport Tour Educ. 2022, 30, 100373. [Google Scholar] [CrossRef] [PubMed]
  62. Iswahyudi, I.; Azlan, I.; Azlan, H. Virtual Tourism In New Normal: Are People Going To Change Their Style Of Travel Temporarily Or Permanently? In Proceedings of the 1st International Conference on Sustainable Management and Innovation, ICoSMI 2020, Bogor, Indonesia, 14–16 September 2020. [Google Scholar]
  63. Van der Heijden, H. User acceptance of hedonic information systems. MIS Q. 2004, 28, 695–704. [Google Scholar] [CrossRef]
  64. Yi, M.Y.; Hwang, Y. Predicting the use of web-based information systems: Self-efficacy, enjoyment, learning goal orientation, and the technology acceptance model. Int. J. Hum. Comput. Stud. 2003, 59, 431–449. [Google Scholar] [CrossRef]
  65. Kim, M.J.; Hall, C.M. A hedonic motivation model in virtual reality tourism: Comparing visitors and non-visitors. Int. J. Inf. Manag. 2019, 46, 236–249. [Google Scholar] [CrossRef]
  66. Hassenzahl, M. User experience (UX): Towards an experiential perspective on product quality. In Proceedings of the 20th International Conference of the Association Francophone d’Interaction Homme-Machine on—IHM ‘08, Metz, France, 2–5 September 2008; ACM Press: New York, NY, USA, 2008; p. 11. [Google Scholar]
  67. Jung, Y. Understanding the Role of Sense of Presence and Perceived Autonomy in Users’ Continued Use of Social Virtual Worlds. J. Comput. Mediat. Commun. 2011, 16, 492–510. [Google Scholar] [CrossRef] [Green Version]
  68. Sun, H. Understanding user revisions when using information system features: Adaptive system use and triggers. MIS Q. 2012, 36, 453–478. [Google Scholar] [CrossRef] [Green Version]
  69. Huang, C.-Y.; Kao, Y.-S. UTAUT2 based predictions of factors influencing the technology acceptance of phablets by DNP. Math. Probl. Eng. 2015, 2015, 603747. [Google Scholar] [CrossRef]
  70. Buabeng-Andoh, C. Predicting students’ intention to adopt mobile learning. J. Res. Innov. Teach. Learn. 2018, 11, 178–191. [Google Scholar] [CrossRef] [Green Version]
  71. Kelly, S.E. Qualitative Interviewing Techniques and Styles. In The SAGE Handbook of Qualitative Methods in Health Research; Bourgeault, I., Dingwall, R., Vries, R.D., Eds.; SAGE Publications Ltd.: London, UK, 2010; p. 317. [Google Scholar]
  72. Cash, P.; Isaksson, O.; Maier, A.; Summers, J. Sampling in design research: Eight key considerations. Des. Stud. 2022, 78, 101077. [Google Scholar] [CrossRef]
  73. Murwani, E.; Juliadi, R.; Berto, A.; Marta, R. Audience Motives and Satisfaction on Accessing Online Tours at 360° Virtual Destinasi Indonesia. J. Penyul. 2021, 17, 289–299. [Google Scholar] [CrossRef]
  74. Estriegana, R.; Medina-Merodio, J.-A.; Barchino, R. Student acceptance of virtual laboratory and practical work: An extension of the technology acceptance model. Comput. Educ. 2019, 135, 1–14. [Google Scholar] [CrossRef]
  75. Disztinger, P.; Schlögl, S.; Groth, A. Technology Acceptance of Virtual Reality for Travel Planning. In Information and Communication Technologies in Tourism; Springer: Berlin/Heidelberg, Germany, 2017; pp. 255–268. [Google Scholar]
  76. Childers, T.L.; Carr, C.L.; Peck, J.; Carson, S. Hedonic and utilitarian motivations for online retail shopping behavior. J. Retail. 2001, 77, 511–535. [Google Scholar] [CrossRef]
  77. Bruner, G.C.; Kumar, A. Explaining consumer acceptance of handheld Internet devices. J. Bus. Res. 2005, 58, 553–558. [Google Scholar] [CrossRef]
  78. Lee, M.K.O.; Cheung, C.M.K.; Chen, Z. Acceptance of Internet-based learning medium: The role of extrinsic and intrinsic motivation. Inf. Manag. 2005, 42, 1095–1104. [Google Scholar] [CrossRef]
  79. Singh, N.; Lee, M.J. Exploring Perceptions Toward Education in 3-D Virtual Environments: An Introduction to “Second Life”. J. Teach. Travel Tour. 2009, 8, 315–327. [Google Scholar] [CrossRef]
  80. King, W.R.; He, J. A meta-analysis of the technology acceptance model. Inf. Manag. 2006, 43, 740–755. [Google Scholar] [CrossRef]
  81. Lee, Y.; Kozar, K.A.; Larsen, K.R.T. The Technology Acceptance Model: Past, Present, and Future. Commun. Assoc. Inf. Syst. 2003, 12, 50. [Google Scholar] [CrossRef]
  82. Oren, G.; Shani, A.; Poria, Y. Dialectical emotions in a dark heritage site: A study at the Auschwitz Death Camp. Tour. Manag. 2021, 82, 104194. [Google Scholar] [CrossRef]
  83. Hollebeek, L.D.; Clark, M.K.; Andreassen, T.W.; Sigurdsson, V.; Smith, D. Virtual reality through the customer journey: Framework and propositions. J. Retail. Consum. Serv. 2020, 55, 102056. [Google Scholar] [CrossRef]
  84. Itani, O.S.; Hollebeek, L.D. Light at the end of the tunnel: Visitors’ virtual reality (versus in-person) attraction site tour-related behavioral intentions during and post-COVID-19. Tour. Manag. 2021, 84, 104290. [Google Scholar] [CrossRef]
  85. Rácz, A.; Zilizi, G. Virtual Reality Aided Tourism. In Proceedings of the 2019 Smart City Symposium Prague (SCSP), Prague, Czech Republic, 23–24 May 2019; pp. 1–5. [Google Scholar]
Figure 1. Theory of Reasoned Action and Technology Acceptance Model. Adapted with permission from Ref Davis et al, 1989 [30].
Sustainability 14 12693 g001
Figure 2. Hypothetical model.
Sustainability 14 12693 g002
Figure 3. Comparison model of actual and potential tourists. * p < 0.1, ** p < 0.05, *** p < 0.01.
Sustainability 14 12693 g003
Table 1. Summary of theories and models of technology acceptance.
Authors and YearsTheory or ModelCore Constructs
Fishbein and Ajzen, 1975Theory of Reasoned ActionNormative beliefs; attitude; intention; behavior
Ajzen, 1985; Ajzen, 1991Theory of Planned BehaviorSubjective norms; attitude towards behavior; perceived behavioral control; intention; behavior
Davis, 1986; Davis, 1989Technology Acceptance ModelPerceived usefulness; perceived ease of use; attitude towards use
Davis et al., 1989Revised Technology Acceptance ModelExternal variables; perceived usefulness; perceived ease of use; attitude towards use; intentions to use; actual system use
Moore and Benbasat, 1991Innovation Diffusion TheoryRelative advantage; ease of use; image; visibility; compatibility; results demonstrability; voluntariness of use
Davis, 1992Motivational ModelExtrinsic motivation; intrinsic motivation
Taylor and Todd, 1995Combined TAM and TPBAttitude; subjective norm; perceived behavioral control; perceived usefulness
Venkatesh and Davis, 2000Extension of Technology Acceptance Model (TAM 2)Subjective norms; image; job relevance; result demonstrability; experience; voluntariness; perceived usefulness; perceived ease of use; intention to use; usage behavior
Venkatesh et al., 2003Unified Theory of Acceptance and Use of TechnologyPerformance expectancy; effort expectancy; social influence; facilitating conditions; gender; age; experience; voluntariness of use; behavioral intention; use behavior
Venkatesh et al., 2012Unified Theory of Acceptance and Use of Technology 2Performance expectancy; effort expectancy; facilitating conditions; social influence; price saving; habit; hedonic motivation trustworthiness; homophily; usage intention; actual usage
Manis and Choi, 2019VR Hardware Acceptance ModelAge; past use; price willing to pay; curiosity; perceived usefulness; perceived ease of use; perceived enjoyment; attitude towards purchasing VR hardware; attitude towards using VR hardware; purchase intention; use intention
Table 2. Measurement scale and items.
FactorsItem Description
Actual TouristsPotential Tourists
Perceived Usefulness (PU)
PU1VR application for virtual tourism is useful for collecting informationI hope that a VR application for virtual tourism can be useful for collecting information
PU2VR tourism can improve my information gathering performance and effectivenessI hope that VR tourism can improve my information gathering performance and effectiveness
PU3Using VR technology makes travel planning more convenientI hope that using VR technology can make travel planning more convenient
PU4VR technology supports me in planning for future travelsI hope that VR technology can support me in planning for future travels
PU5Experiencing VR tourism increases my knowledge about the visited siteI hope that VR tourism can increase my knowledge about the visited site
PU6VR tourism is a useful way of learning history and culture of sitesI hope that VR tourism can be useful for learning the history and culture of sites
PU7VR tourism enables me to visit places that I could not but would like to visitI hope that VR tourism can enable me to visit places that I could not but would like to visit
Perceived Ease of use (PEOU)
PEOU1The interaction with the VR application is clear and understandableI hope that the interaction with the VR application will be clear and understandable
PEOU2Experiencing the virtual tour does not require a lot of mental effortI hope that experiencing the virtual tour will not require a lot of mental effort
PEOU3I find it easy to operate the VR application and experience the virtual tour I hope it will be easy to operate the VR application and experience the virtual tour
PEOU4I find it easy to access the desired information through VR tourismI hope that the desired information will be easy to access through VR tourism
PEOU5I find that the virtual tour experience is flexible to interact withI hope that the virtual tour experience will be flexible to interact with
PEOU6It is easy for me to become skillful at using the VR applicationI hope that it will be easy for me to become skillful at using the VR application
Perceived Autonomy (PA)
PA1When I am experiencing VR tourism, I can freely choose what I want to doI hope that I can freely choose what I want to do when experiencing VR tourism
PA2When I am experiencing VR tourism, I feel that I have a lot of controlI hope that I can have a lot of control when experiencing VR tourism
PA3My travel experience is decided by my actions in the virtual world I hope that my travel experience can be decided by my actions in the virtual world
Perceived Enjoyment (PE)
PE1I have fun accessing information through interacting with the VR applicationI hope that accessing information through interacting with the VR application will be fun
PE2VR tourism brings me lots of enjoymentI hope that VR tourism will bring me lots of enjoyment
PE3I enjoy and have fun in VR tourismI will enjoy and have fun in VR tourism
PE4VR tourism does not bore meI hope that VR tourism will not bore me
PE5I think VR tourism is very attractiveI hope that VR tourism will be very attractive
PE6The actual process of using the VR application is pleasantI hope the actual process of using the VR application will be pleasant
PE7The virtual world is interesting and I don’t feel bored in it I hope the virtual world will be interesting and I will not feel bored in it
Perceived Risk of COVID-19 (PROC)
PROC1I worry about my personal safety because of the spread of COVID-19
PROC2I feel heightened tension when I am in crowded places
PROC3I am afraid of COVID-19 harming my family and companions
PROC4Even if allowed to visit physical attractions, I will not do it to avoid catching COVID-19
Attitude towards Use (ATT)
ATT1VR tourism is a safe alternative that protects me from risks in the physical world
ATT2Compared to physical tours, VR tourism can limit the spread of COVID-19 in a city
ATT3It is acceptable to replace physical tourism with VR tourism in some special situations
Table 3. Sample characteristics (n = 239).
Actual TouristsN%Potential TouristsN%
Gender
Male2238.6Male6837.4
Female3561.4Female11462.6
Age
18–253663.218–2513674.7
26–351322.826–352915.9
36–4547.036–4573.8
46–5535.346–5594.9
56 and above11.856 and above10.5
Occupation
Managers11.8Managers31.6
Professionals1322.8Professionals2212.1
Administrators23.5Administrators63.3
Servicers23.5Servicers116.0
Manufacturers23.5Manufacturers21.1
Students3357.9Students12568.7
Freelancers47.0Freelancers137.1
Education
Senior and below35.3Senior and below84.4
High vocation23.5High vocation147.7
Bachelor2442.1Bachelor7842.9
Master2645.6Master7641.8
PhD and above23.5PhD and above63.3
All5723.8 18276.2
Table 4. EFA test and reliability analysis results (n = 239).
VariablesFactorsMSDλα
Perceived Usefulness (PU)PU14.120.747-0.846
PU24.100.800-
PU34.330.6950.631
PU44.300.7440.590
PU54.380.6940.574
PU64.360.7470.626
PU74.490.7270.580
Perceived Ease of Use (PEOU)PEOU14.290.7910.5850.872
PEOU23.921.021-
PEOU34.270.7480.693
PEOU44.310.7590.678
PEOU54.310.8270.673
PEOU64.260.7900.690
Perceived Autonomy (PA)PA14.280.8540.7750.874
PA24.190.8990.810
PA34.250.8310.813
Perceived Enjoyment (PE)PE14.200.766-0.903
PE24.190.8210.689
PE33.790.922-
PE44.130.8280.667
PE54.150.8560.819
PE64.230.8140.753
PE74.020.9190.684
Perceived Risk of COVID-19 (PROC)PROC14.140.7840.7270.750
PROC23.850.9580.621
PROC34.440.7130.688
PROC43.501.122-
Attitude towards Use (ATT)ATT14.070.8520.7550.779
ATT24.120.8570.721
ATT33.741.0490.634
Overall 0.927
Table 5. CFA test and convergent validity analysis results (n = 239).
VariablesFactorsMSDSFLAVECR
PUPU34.330.6950.7850.5210.844
PU44.300.7440.633
PU54.380.6940.673
PU64.360.7470.728
PU74.490.7270.778
PEOUPEOU14.290.7910.6980.5260.847
PEOU34.270.7480.710
PEOU44.310.7590.809
PEOU54.310.8270.690
PEOU64.260.7900.711
PAPA14.280.8540.8000.7050.877
PA24.190.8990.896
PA34.250.8310.819
PEPE24.190.8210.8100.7170.927
PE44.130.8280.849
PE54.150.8560.901
PE64.230.8140.918
PE74.020.9190.747
PROCPROC14.140.7840.8580.5010.797
PROC23.850.9580.563
PROC34.440.7130.715
ATTATT14.070.8520.8590.5570.787
ATT24.120.8570.594
ATT33.741.0490.763
Table 6. Correlation and discriminant validity (n = 239).
PUPEOUPAPEPROCATT
PU0.722
PEOU0.6800.725
PA0.6120.6060.840
PE0.6690.6650.6130.847
PROC0.2110.1980.1440.2240.708
ATT0.3830.2830.2340.3510.4970.746
Table 7. Path analysis results (n = 239).
X→YSEzpβHT
Actual tourists (n = 57)
H1: PU→ATT0.2121.2520.2110.206×
H2: PEOU→ATT0.1940.6700.5030.106×
H3: PEOU→PU0.0927.2590.000 ***0.693
H4: PEOU→PE0.1801.9920.046 *0.266
H5: PU→PE0.1922.7380.006 **0.374
H6: PE→ATT0.1370.9080.3640.136×
H7: PEOU→PA0.2311.9300.0540.283×
H8: PU→PA0.2412.5430.011 *0.372
H9: PA→ATT0.106−0.0120.991−0.002×
H10: PA→PE0.1001.5020.1330.176×
H15: PROC→ATT0.1173.6870.000 ***0.397
Potential tourists (n = 182)
H1: PU→ATT0.1741.5780.1150.206×
H2: PEOU→ATT0.174−0.8830.377−0.120×
H3: PEOU→PU0.0738.5280.000 ***0.649
H4: PEOU→PE0.1072.0890.037 *0.207
H5: PU→PE0.1092.7580.006 **0.268
H6: PE→ATT0.1541.5150.1300.197×
H7: PEOU→PA0.0984.2720.000 ***0.407
H8: PU→PA0.1023.7080.000 ***0.353
H9: PA→ATT0.164−0.4190.675−0.055×
H10: PA→PE0.1003.6590.000 ***0.351
H15: PROC→ATT0.1053.2610.001 **0.315
Note: * p < 0.05, ** p < 0.01, *** p < 0.001.
Table 8. Path analysis results (n = 239).
DV: ATTSEtpβR2FHT
Actual tourists (n = 57)
H11PU0.1583.0990.003 **0.3770.3579.825×
PROC0.1253.5820.001 **0.405
PU × PROC0.1780.3320.7410.040
H12PEOU0.1472.7030.009 **0.3200.3328.796×
PROC0.1273.6400.001 **0.420
PEOU × PROC0.186−0.1080.915−0.013
H13PA0.0952.4230.019 *0.2900.3178.188×
PROC0.1274.1040.000 **0.472
PA × PROC0.164−1.5470.128−0.186
H14PE0.1052.9780.004 **0.3390.3469.355×
PROC0.1263.5710.001 **0.406
PE × PROC0.154−0.9600.341−0.108
Potential tourists (n = 182)
H11PU0.1371.8720.0640.1910.1957.736×
PROC0.1083.2160.002 **0.315
PU × PROC0.163−0.7710.443−0.074
H12PEOU0.1350.6530.5150.0680.1575.961×
PROC0.1113.5880.001 **0.361
PEOU × PROC0.182−0.4050.686−0.039
H13PA0.1300.7970.4270.0820.1676.429×
PROC0.1113.6570.000 **0.369
PA × PROC0.175−0.8880.377−0.087
H14PE0.1172.2710.025 *0.2210.2038.129×
PROC0.1073.2980.001 **0.320
PE × PROC0.1611.2440.2170.114
Note: * p < 0.05, ** p < 0.01.
Publisher’s Note: MDPI stays neutral with regard to jurisdictional claims in published maps and institutional affiliations.

