Article

Towards a Circular Economy Development for Household Used Cooking Oil in Guayaquil: Quantification, Characterization, Modeling, and Geographical Mapping

by
José Hidalgo-Crespo
1,2,*,
César I. Alvarez-Mendoza
3,
Manuel Soto
2 and
Jorge Luis Amaya-Rivas
4
1
Facultad de Ingeniería Industrial, Universidad de Guayaquil, Av. Dr. Jiménez Lince y Av. Juan Tanca Marengo, Guayaquil 090501, Ecuador
2
Facultade de Ciencias, Universidade da Coruña, Rúa da Fraga 10, Galiza, 15008 A Coruña, Spain
3
Grupo de Investigación Ambiental en el Desarrollo Sustentable GIADES, Carrera de Ingeniería Ambiental, Universidad Politécnica Salesiana, Quito 170702, Ecuador
4
Facultad de Ingeniería Mecánica y Ciencias de la Producción (FIMCP), Escuela Superior Politécnica del Litoral (ESPOL), Campus Gustavo Galindo Km. 30.5 Vía Perimetral, P.O. Box 09-01-5863, Guayaquil 090211, Ecuador
*
Author to whom correspondence should be addressed.
Sustainability 2022, 14(15), 9565; https://doi.org/10.3390/su14159565
Submission received: 7 June 2022 / Revised: 26 June 2022 / Accepted: 28 July 2022 / Published: 4 August 2022
(This article belongs to the Special Issue Applications of GIS and Remote Sensing for Sustainable Development)

Abstract

:
The objective of the present study was to quantify, geo-locate, model, and characterize domestic used cooking oil (dUCO) generation for the city of Guayaquil. For this reason, and as a prerequisite for the proper planning of municipal cooking oil waste management in the city, we carried out 14-day fieldwork involving 532 households from different parishes of Guayaquil, combined with a survey to acquire data on their demographic and socioeconomic statistics. The artisanal characterization was further executed to 40 subsamples of dUCO to determine the density, moisture, solids content, and the volatile-matter characteristics present. Additionally, the Geographic Information System (GIS) was used to map the used cooking oil generation hotspots for the city, adding the Geographical Position System (GPS) of each participating household during the data acquisition. Finally, a multiple-regression model was proposed to establish correlations between the dUCO generated and five independent variables, such as household size, socioeconomic group, tenure status, education level, and income. Results showed that the per capita daily dUCO-generation rate was found to be 4.30 g/day/c or 4.99 mL/day/c, with a density of 0.86 g/mL. Filterable solids represented 0.37% for the entire dUCO collected sample, while separable water and grease represented 1.58% and 0.014%, respectively. In addition, the percentage of the volatile matter was found to be 7.7% ± 2.1% of the filtered dUCO. Using GIS mapping, we found that the areas near tourism sites have a higher dUCO generation value, considering the household survey. Following the developed multiple-regression model developed, it was found that household size and the socioeconomic group have the maximum effect on generating used cooking oil.

1. Introduction

The circular economy concept has recently gained ground in European policymaking as a positive, solution-based perspective for achieving economic development within a growing environmental framework. One of the central pillars of a circular economy is to return materials to the economy and prevent waste from being sent to landfills or incinerated, thus capturing the value of materials as much as possible and reducing losses [1]. Waste must be treated effectively to start, with a stable circular economy, and this means that it must suffer an alteration in its physical, chemical, or biological properties, allowing to improve the efficiency of operations and waste management systems, recover reusable and recyclable materials, and produce energy in the form of heat and fuel biogas [2].
In this context, waste-composition studies, whether liquid or solid, are an essential step for the development of circular business models for several reasons, such as estimating material recovery potential, identifying component-generation sources, facilitating processing-equipment design, and maintaining compliance with national laws. The increment of 17.53% in the population, going from 15 million in 2010 to close to 18 million in 2020 [3] (Population Growth, Ecuador, The World Bank), together with the rise in the living level of the Ecuadorian population, has led to a higher demand for food and food-related products, which are essential for providing nutrients and energy for everyone’s everyday activities. In the European Union, households account for 53% of the generated food waste (almost 90 million tons) [4].
Used cooking oil (UCO) represents a feedstock to produce different kinds of bio-based products, having the advantage of being low-budget and, at the same time, renewable. UCO is considered an edible oil, meaning available for human consumption, coming from vegetables or animals. This edible oil becomes UCO after being fried to a point where it cannot be reused for human consumption. Its principal component is triglycerides (representing more than 95% of its weight), which at the same time produces different fatty acids [5]. The worldwide demand and consumption of edible oils have increased rapidly [6]. More than 16 million tons of UCO are produced yearly, with China, Malaysia, and the United States being among the largest-producing countries of this waste [7,8]. UCO in any city is generated by two principal sources, domestic (dUCO) and commercial (cUCO). For Ecuador, UCO remains an open market due to the difficulty in the logistics needed for collecting low amounts of UCO from individual households. Used cooking oil is considered hazardous waste because its improper disposal can cause significant environmental problems such as water, and soil pollution, marine ecosystem distraction, and clogging of drains, which, consequently, generate adverse effects on the environment and result in an increase in water-treatment costs [9]. Most households (52%) throw their UCO in the garbage, and 21% dump their discarded oils in the sewage [10].
Nowadays, it is recognized that information on both quantity and characterization of residential waste is essential for the effective planning of municipal waste management for any given city [11]. The cornerstone of successful planning for a waste management program is the availability of reliable information about the quantity and the type of residue being generated as well as an understanding of how much that residue-collection program managers could expect to prevent or capture. However, there is little to no previous research dedicated to the quantification of this type of waste, as most studies focus on energy-related conversion techniques and available technologies [12,13,14,15]. There is currently no updated record at the national level of the amount of vegetable oil used and disposed of in Ecuador. It is known that between 30% and 40% of this input that the commercial sector consumes is mainly disposed of by the sewers, an action with high environmental impacts [16]. One study made by the Secretary of the Environment at the Municipality of Quito in 2014 found that only 50% of restaurants and businesses had a record of the amount of cooking oil that they purchase. With this information, consumption of about 10 million liters per year was inferred. Of this quantity, approximately 3 million liters are thrown away as waste, and only 50% is collected either by an environmental manager or by informal people who use this waste for animal feed [16].
The collection of UCO depends on several key factors: economic profit to cover the financial costs of the waste management system, environmental awareness by local authorities, the interest in promoting ecological measures, and social benefits, such as job creation [17]. However, the first necessary step is the quantification, sampling, and characterization of a relatively fairly stratified quantity of households, which can represent the total population according to the rules of statistics. The objective of the present study was to quantify, geo-locate, data model, and artisanally characterize the domestic used cooking oil for the city of Guayaquil. The paper is organized in the following order: materials and methods, including research framework and methodology, results, discussion, and conclusions and directions for future research.

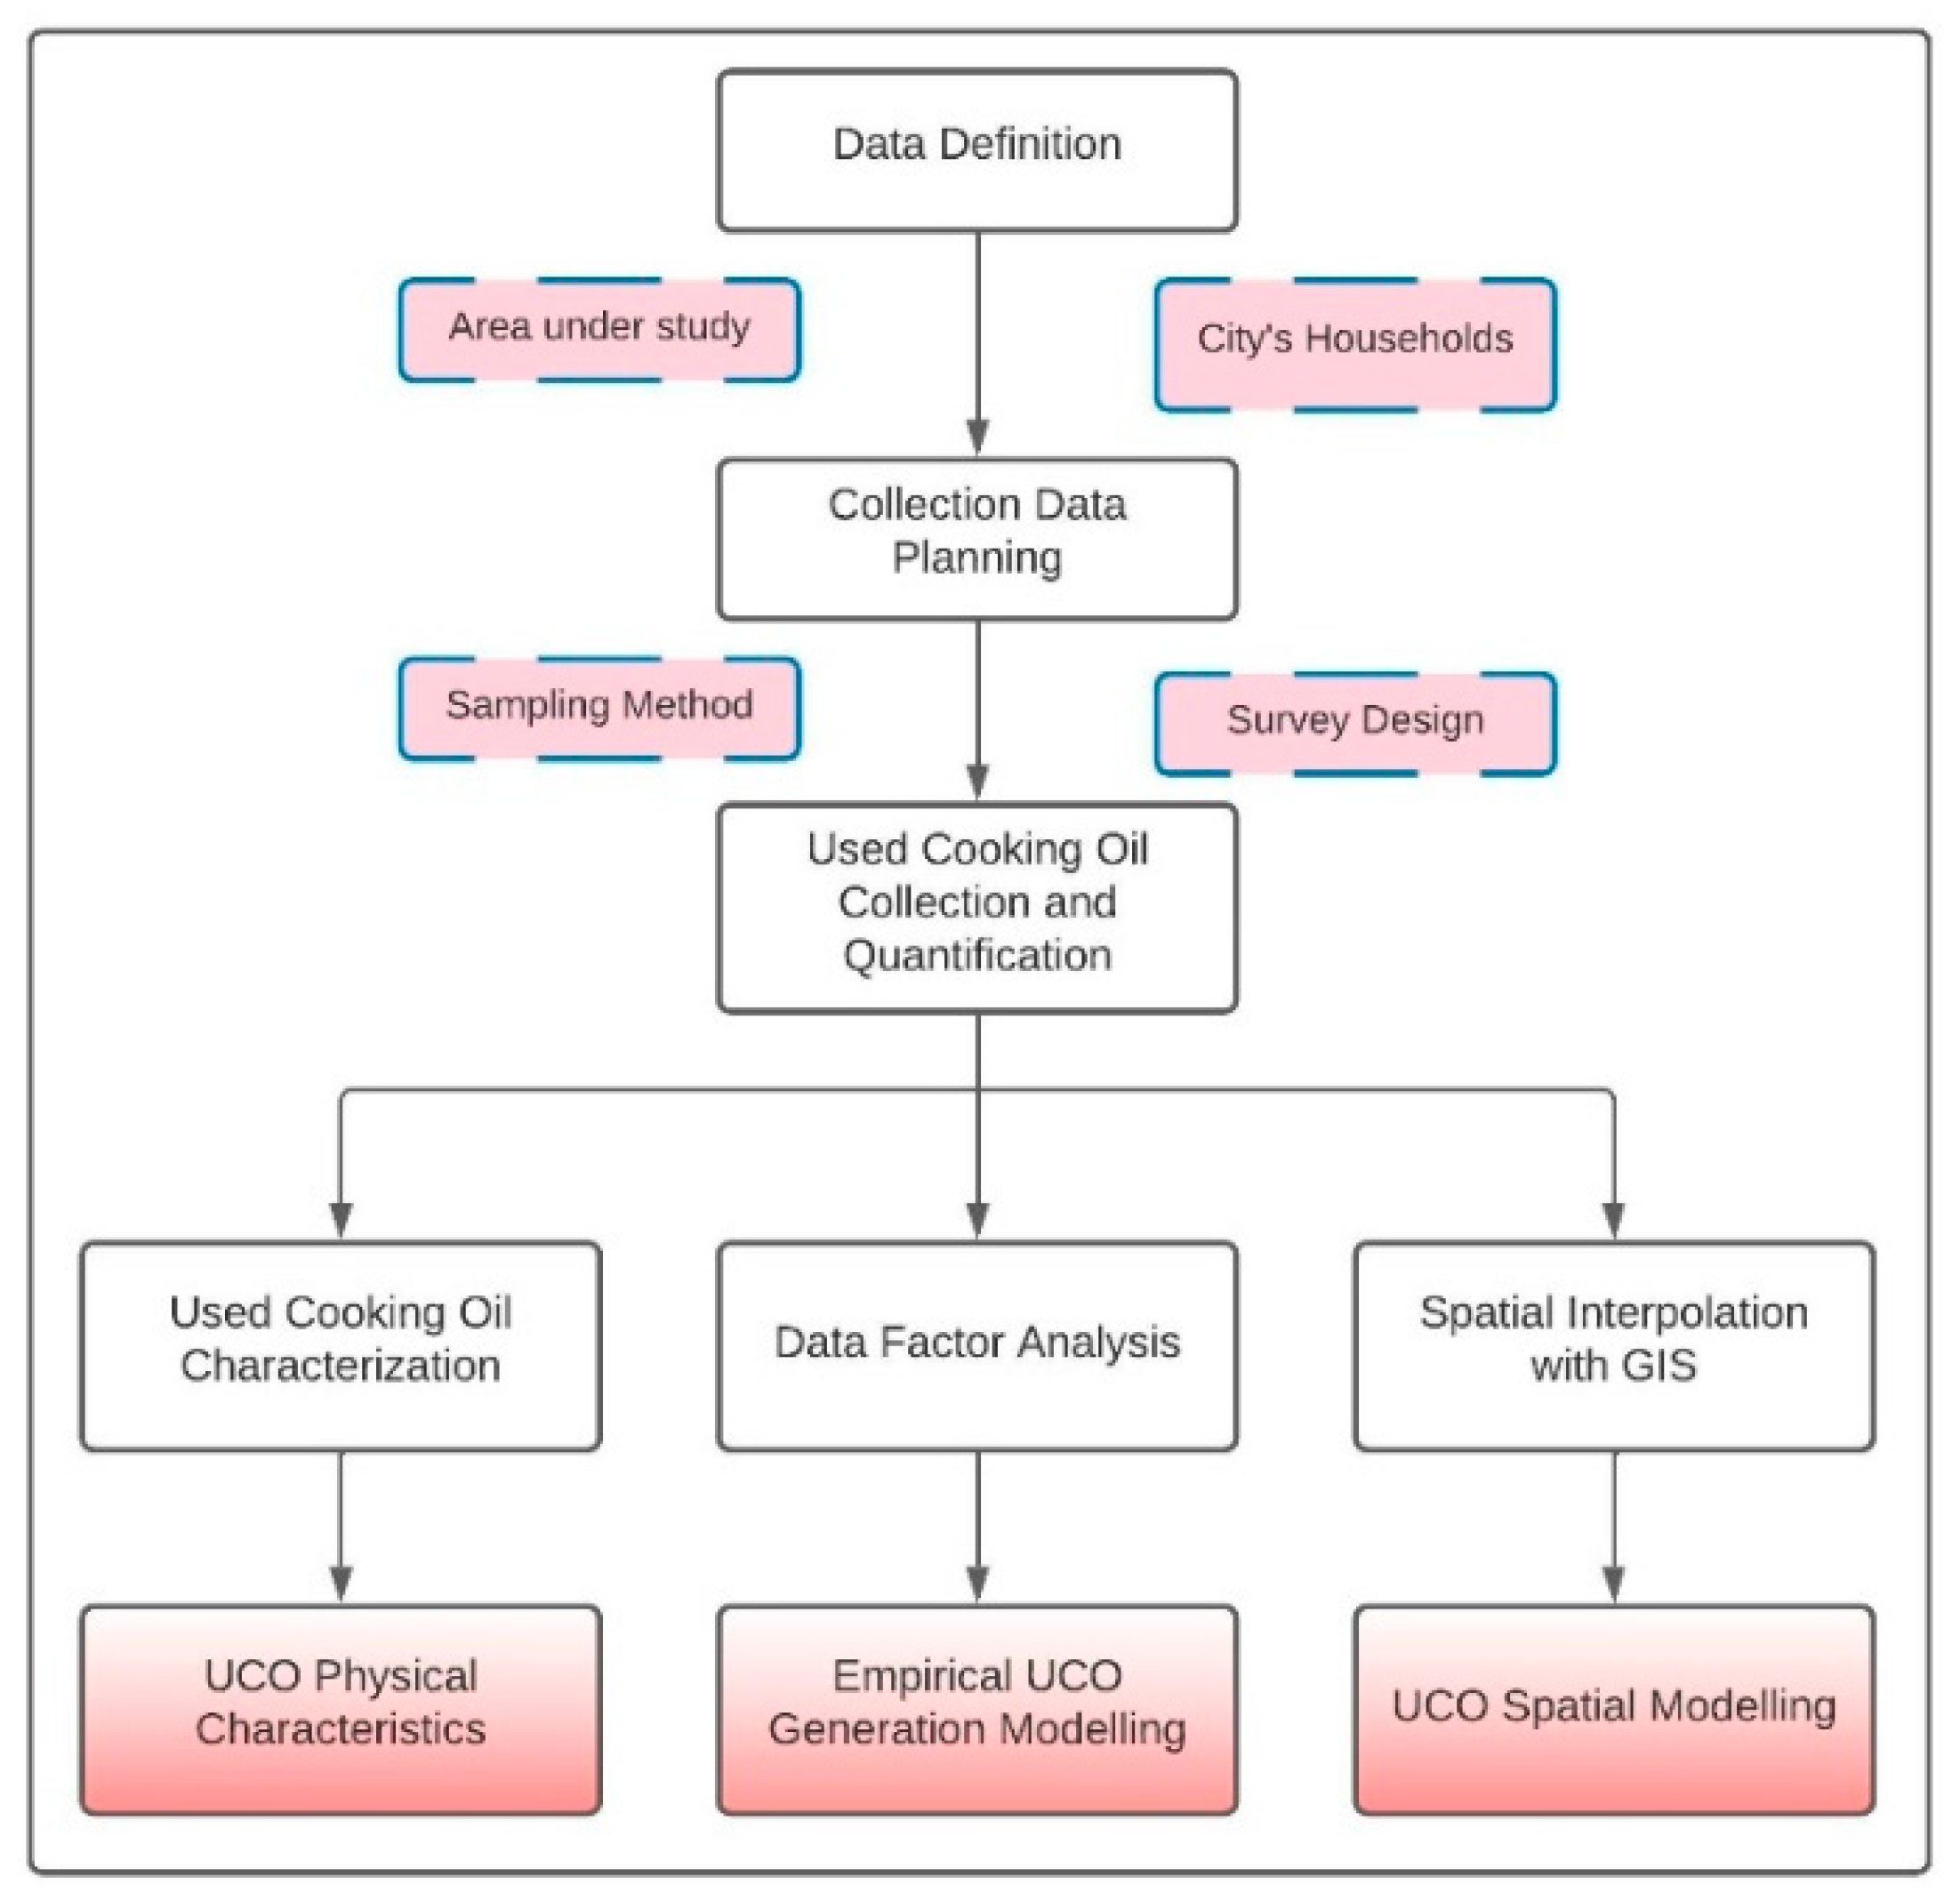
2. Materials and Methods

One integrated approach for this waste problem is the quantification of UCO with the help of trusted and verified methods, always trying to avoid underestimation of the real waste generation. Waste in general can be measured by collection, sorting, and quantification by an external party or by sorting and counting directly by the waste generator [18]. The authors used direct analysis as the principal methodology to quantify dUCO, by collecting and weighing glass jars with the generated UCO over two weeks. Figure 1 describes the entire methodology for this section, and the complete process is described in the following subsections.

2.1. Data Definition

Guayaquil is a city in Ecuador, which is situated close to the west side of the Guayas River. It is the capital of Guayas province and has a total of 16 urban parishes, as shown in Figure 2. As of 2022, Guayaquil has 2,698,807 inhabitants, which makes it the most-populated canton in the country, followed by Quito, a canton that ranks second with 746 fewer inhabitants, according to population projections done by the National Institute of Statistics and Census [19]. Guayaquil has a total area of 345 km2. According to [20], the total number of households for the urban area of the city is close to 570,000, considering a total household size of four inhabitants. Guayaquil is divided into parishes, having a total of 16, stratified as shown in Figure 3. Figure 2 and Figure 3 show that the three most-populated parishes of the city are Tarqui (46%), Ximena (24%), and Febres Cordero (15%), summing a total of 83%, and the three least-populated parishes are Pedro Carbo (0.18%), Roca (0.24%), and 9 de Octubre (0.25%), adding up to 0.67%.

2.2. Collection Data Planning

The survey sample size was determined according to the principles of statistics, following the central limit theorem, also applied by [2] Gomez et al. (2007), which analyzes the total minimum of samples necessary for an infinite population. In probability theory, the central limit theorem states that the distribution of a sample variable approximates a normal distribution (i.e., a “bell curve”) as the sample size becomes larger, assuming that all samples are identical in size, and regardless of the population’s actual distribution shape [22]. Logically, the sampling accuracy would increase with the number of samples; nevertheless, this number had to be restricted due to the availability of physical resources. The central limit theorem is established because the sample size is sufficiently large [23]. To ensure the representativeness of samples, the selected households were geographically scattered. Equation (1) was used to calculate the sample size needed for the study:
n = k 2 p q N e 2 ( N 1 ) + k 2 p q
where n is the total minimum necessary sample, k is a constant value depending on the level of confidence of the study (for 95% confidence, k is 1.96), e is the sampling error, and p and q are the proportions of inhabitants that possess the characteristic or not, respectively (typically, 0.5 for each one, since there was no previous idea of the desired ratio). The value of 0.5 is often used because it maximizes the sample size. According to the [24] formula, the usual optimal number of respondents is 384; however, having an available sample size of 400 is the most used at a 95% confidence level with 5% margin error.

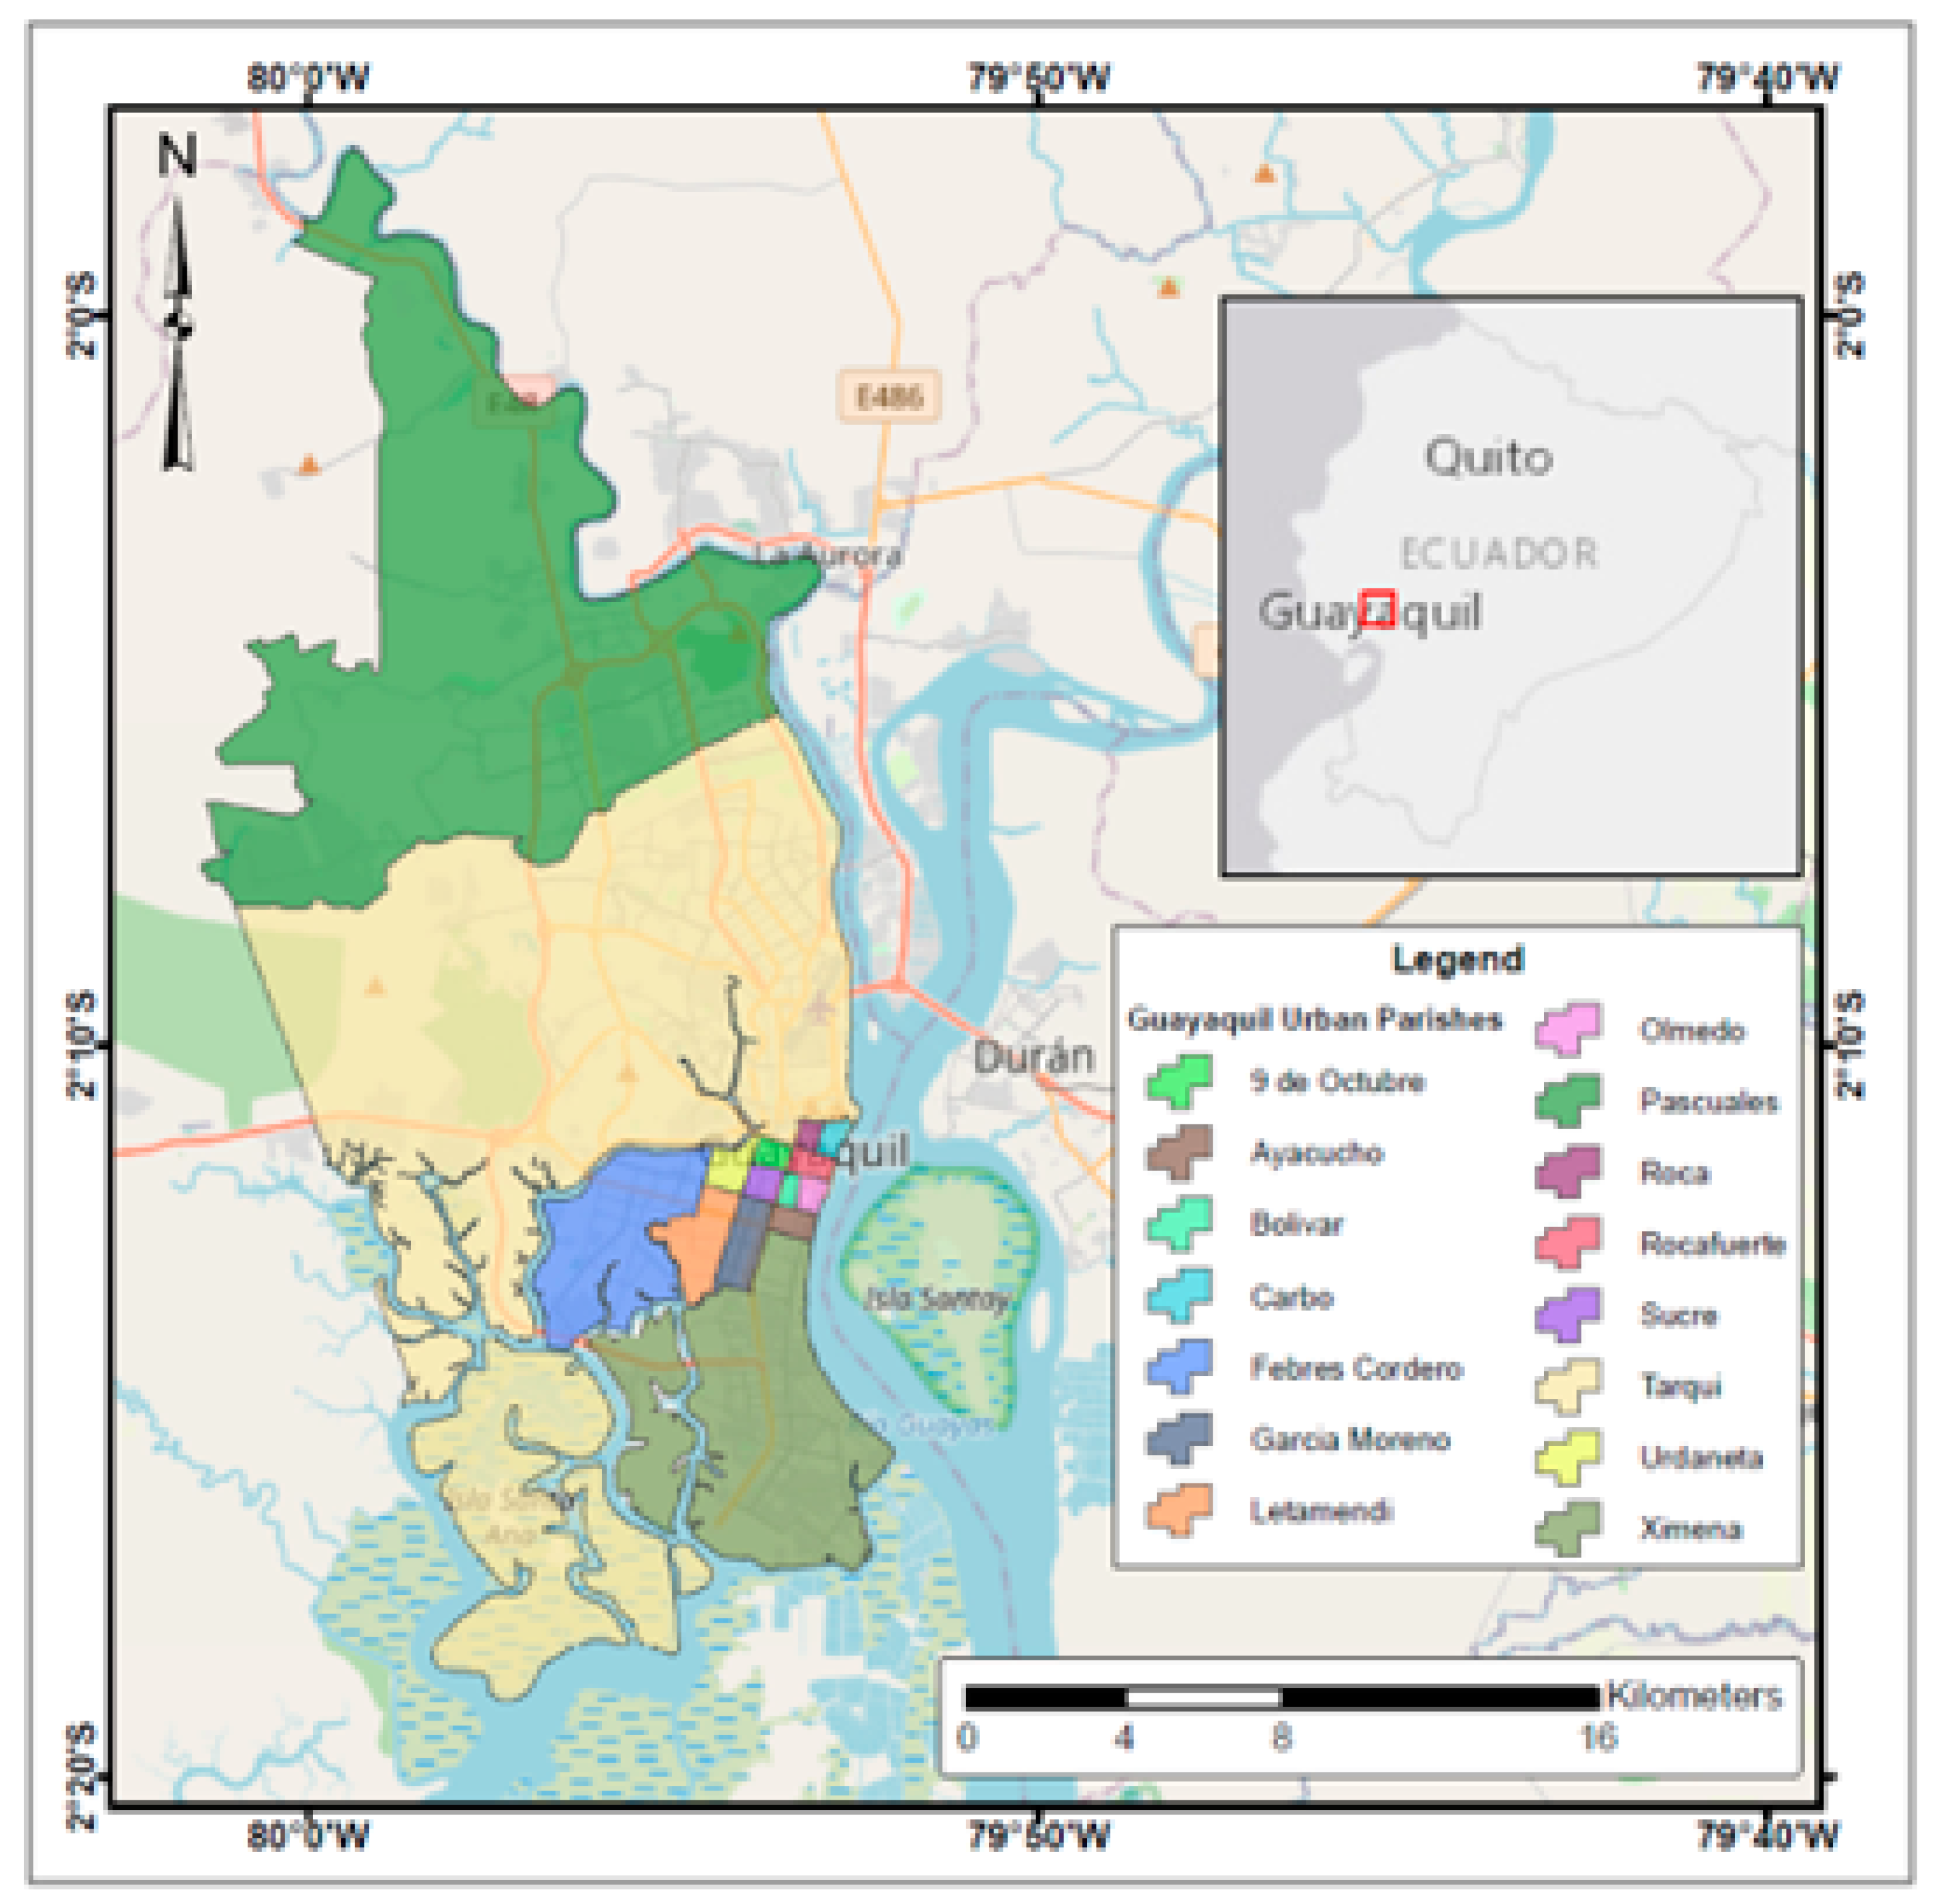
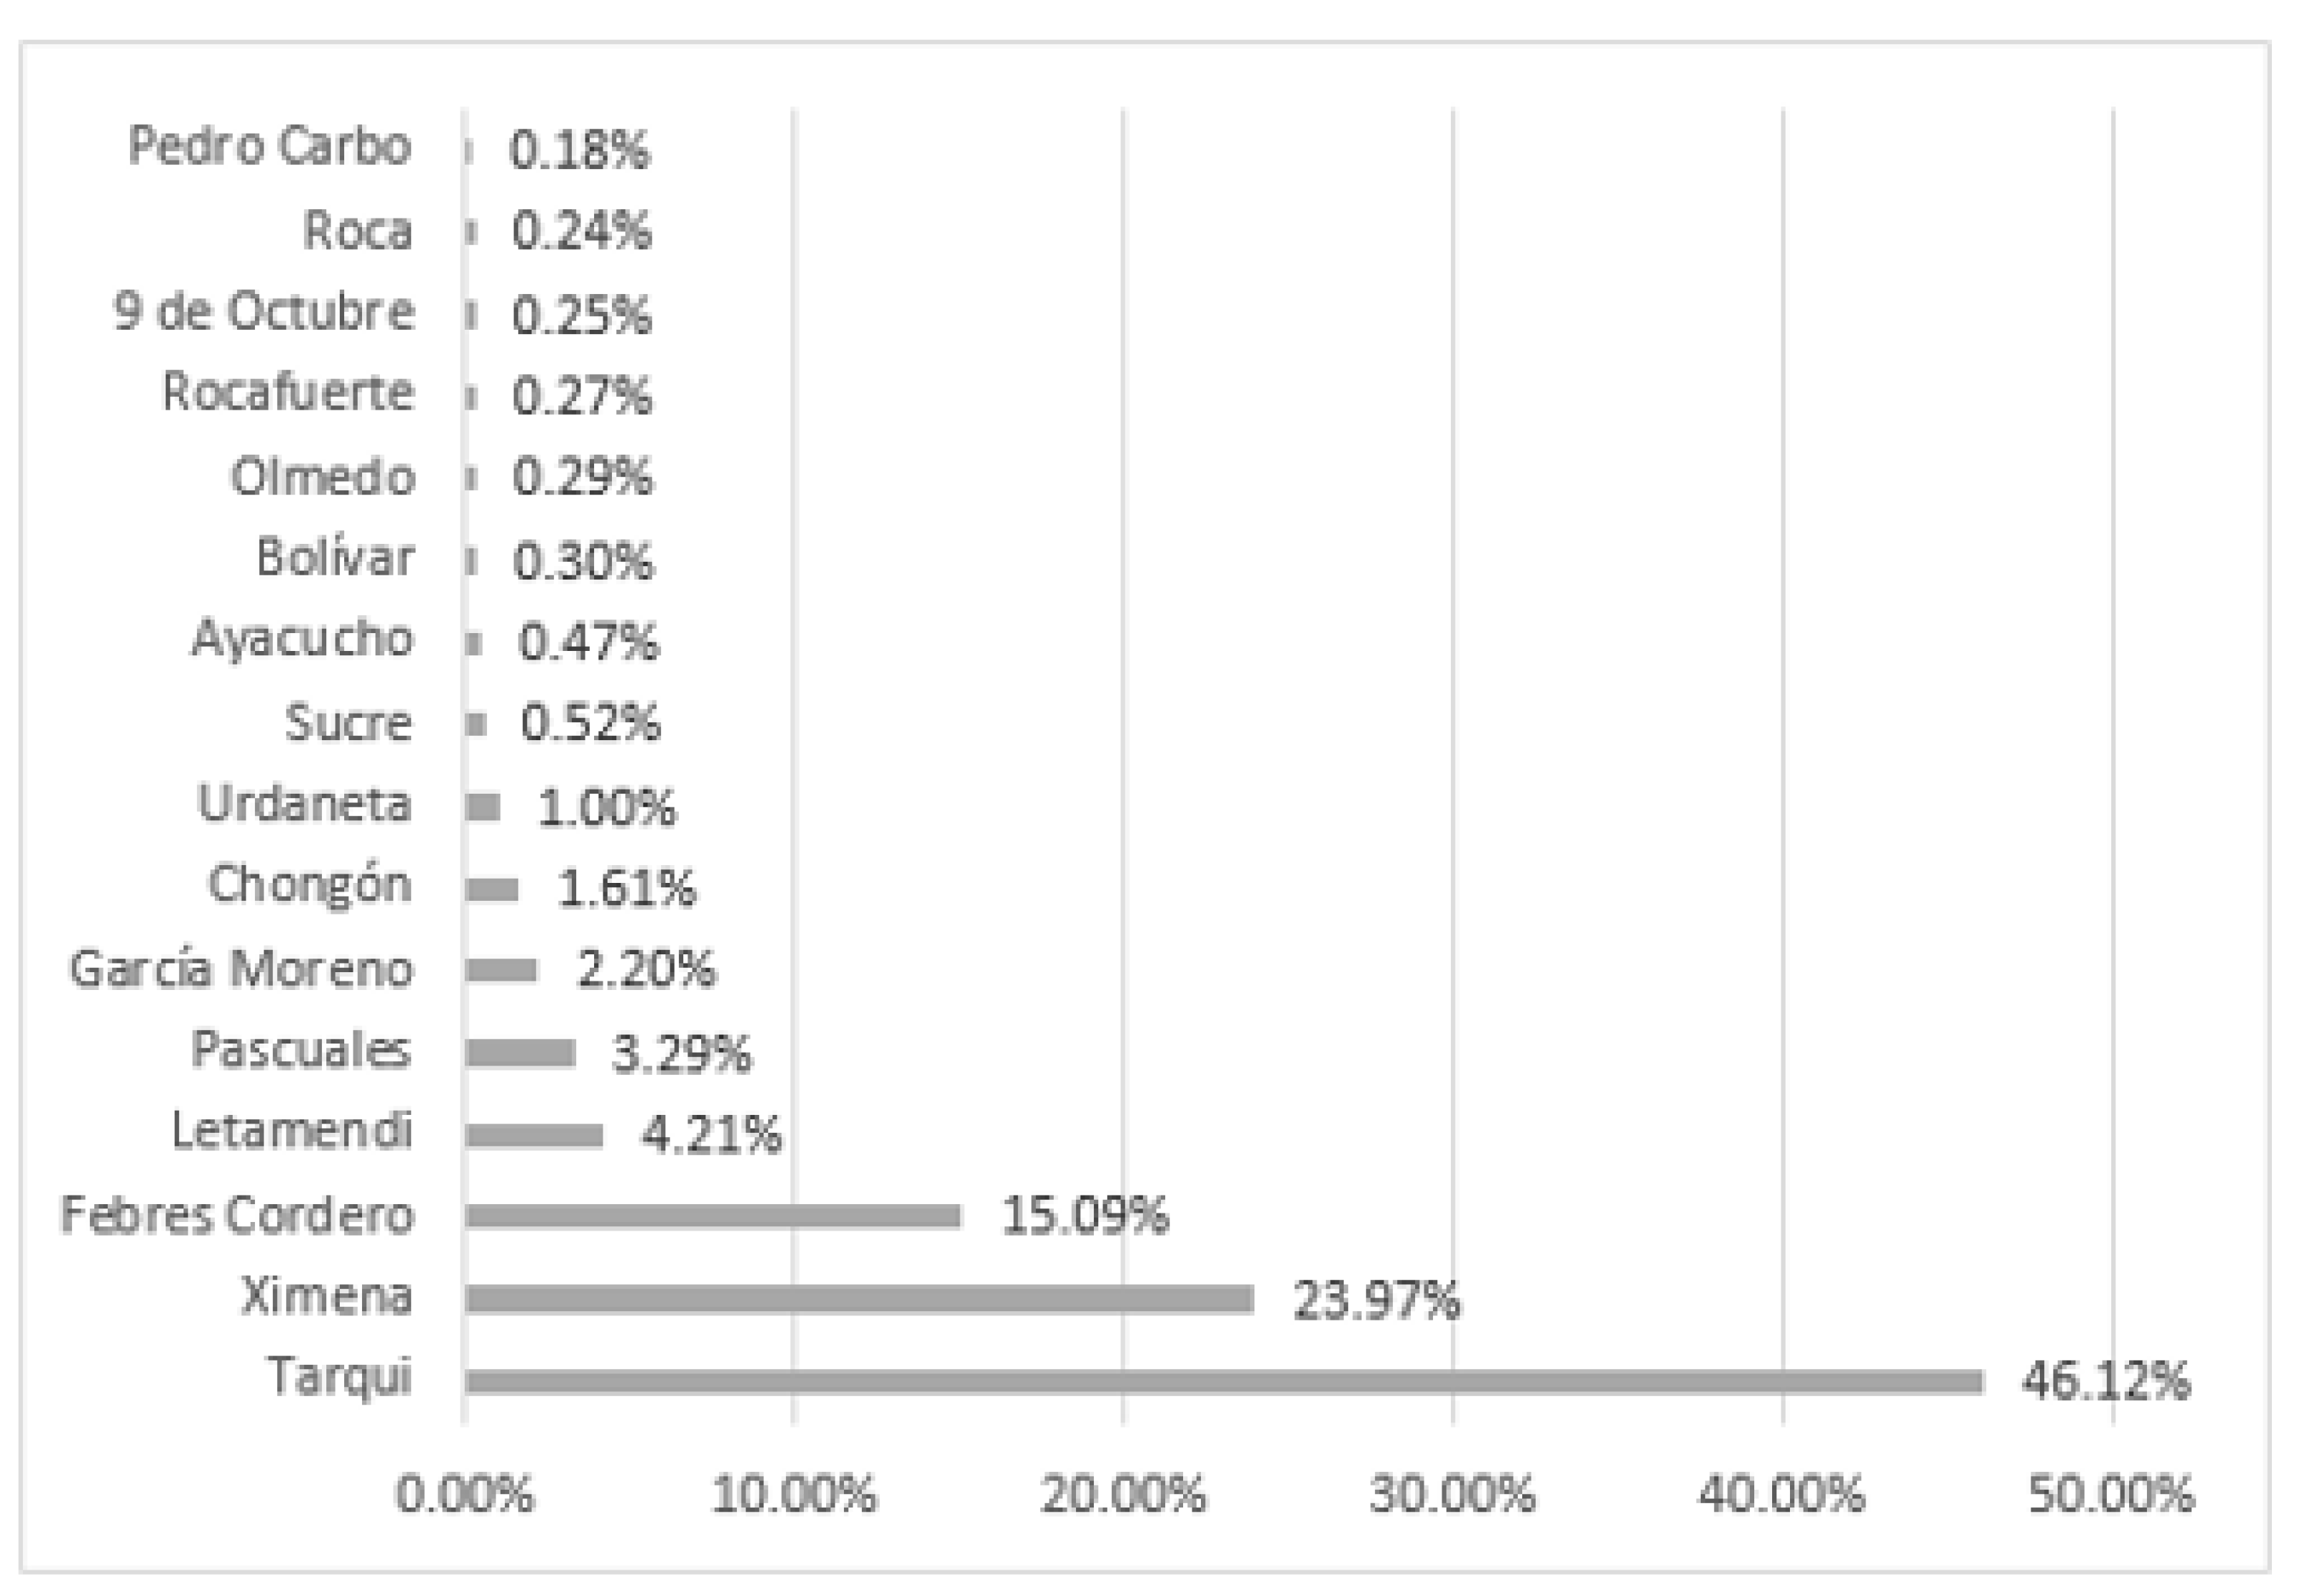
2.2.1. Guayaquil Households’ Sampling

A sample of 532 households was involved, computing a 95% of confidence level together with an error of almost 4.3% and a population of almost 570,000families, which was randomly chosen between 15 July and 20 August 2021. The primary household stratification corresponded to the selected households, which depended on the address of each participating student due to practical reasons. We obtained an excellent enough stratification for the sample. Of all 16 parishes, we acquired samples from 12 (Table 1), representing 97.69% of the total households. Thus, the four missing parishes have a small population, accounting for 2.31% of households. The expected number of samples was calculated using the percentages of the population located in each parish, as shown in Figure 1 (right side).

2.2.2. Survey Design and Implementation

The questionnaire was submitted between 15 August and 14 September, 2021. The household population consisted of two principal parts, as shown in Table 2. The first part of the questionnaire contained the personal attributes of the interviewed person, such as age, sex, and level of education. The second part had general household information, such as household size, income, socioeconomic group, and tenure status.

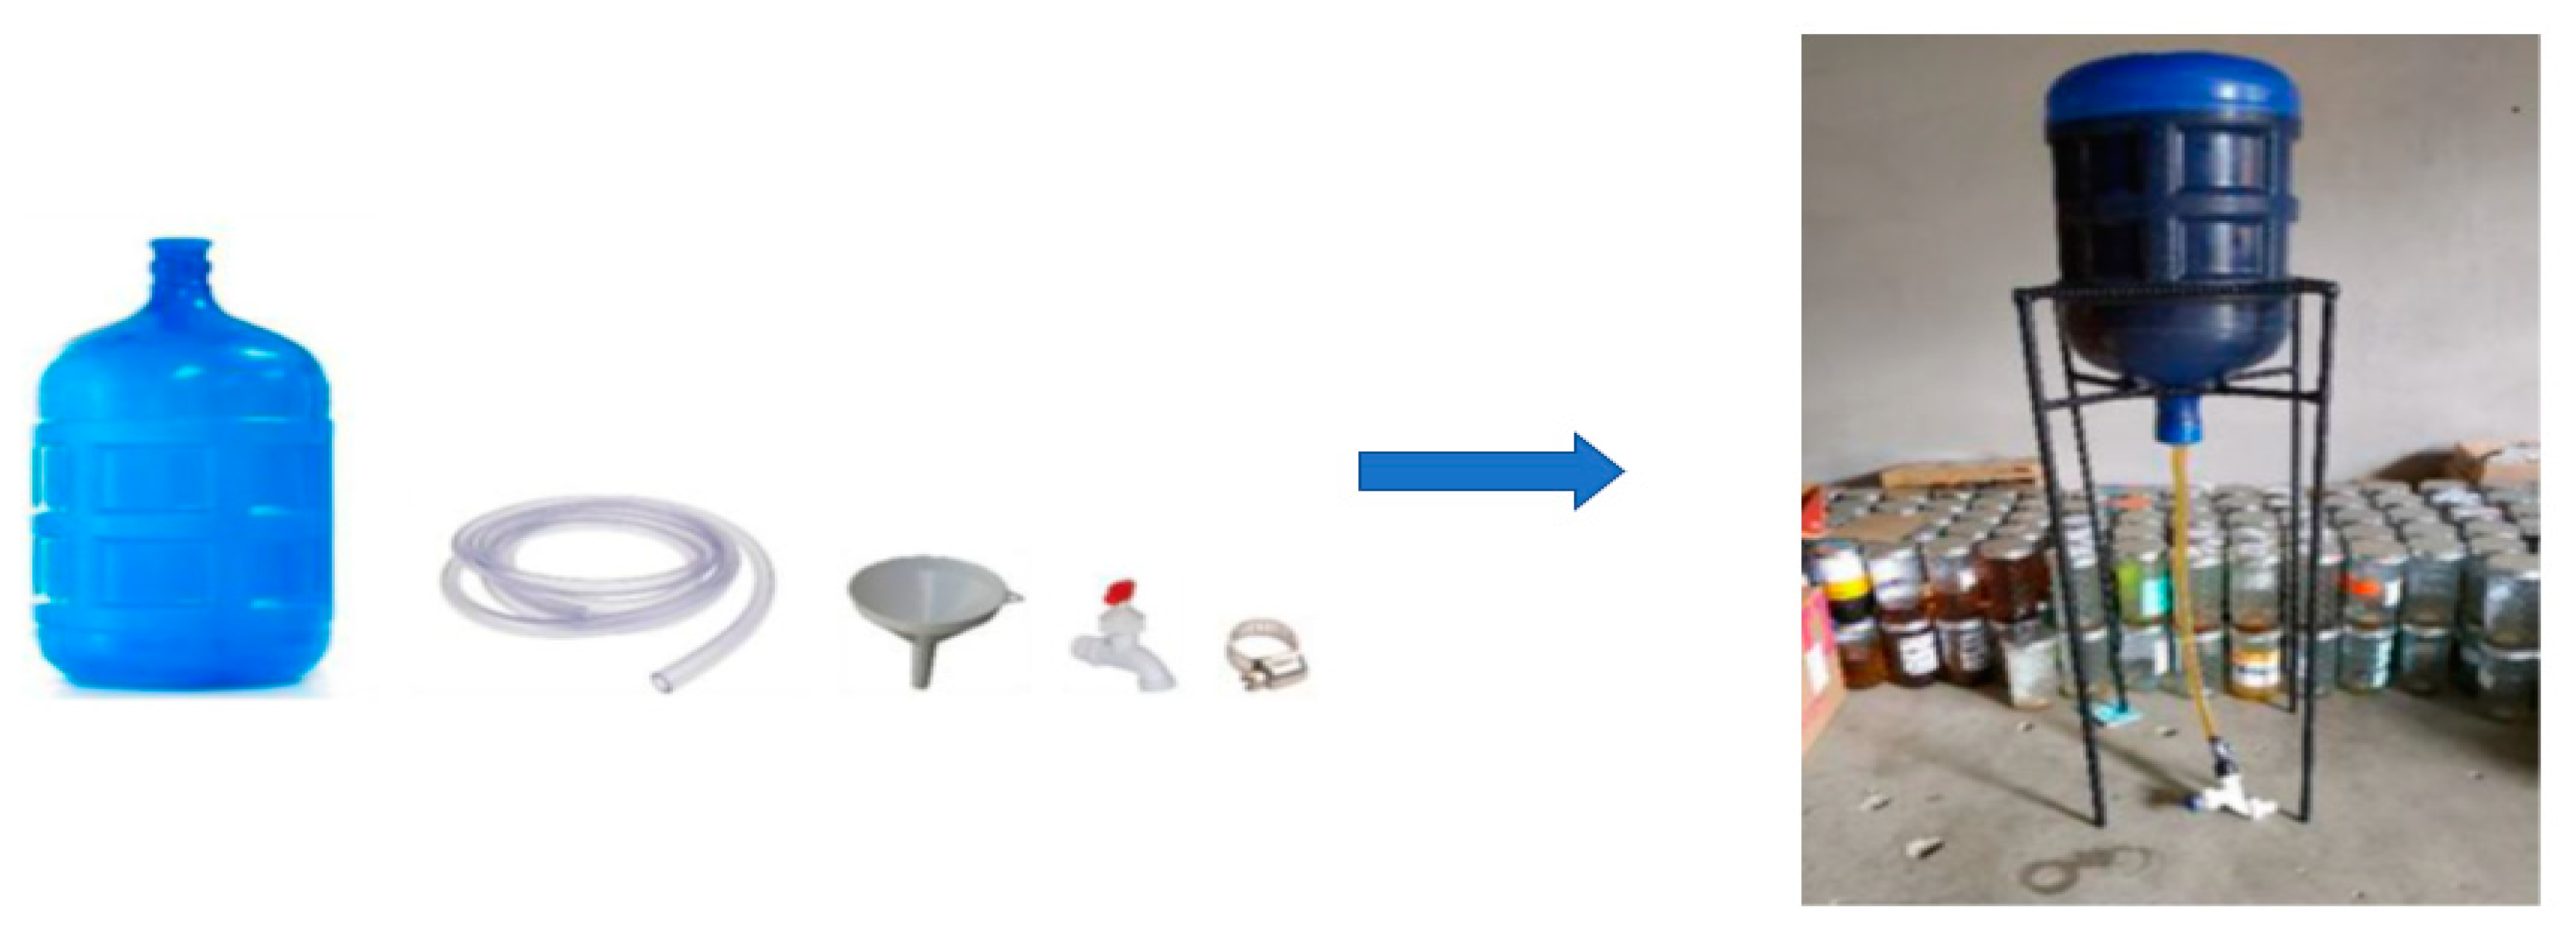
2.3. Used Cooking Oil Collection and Quantification

Different studies have evaluated the generation of household waste using other methods such as creating a waste journal to register daily production, using tables for self-reporting, collection from the proper homeowners, waste characterization, or observation through photos [25]. Each of the before-mentioned methods for quantifying waste has its pros and cons, and all of them may be the subject of problems, such as the contamination of the waste or errors in the readings that make the comparison between methods more challenging [26]. Many studies indicate that the best-suited method for information gathering on household food waste is self-reporting, since it does not require a big budget, and the necessary effort from the participants is minimal [27].
For this project, 120 students of energy and environment courses from two local universities were approached. The objectives of the project and the requirements to participate were given, and students who willingly desired to participate registered online. Capacitation was given to the registered students on the process developed by the authors to quantify dUCO. Participant students were demanded to obtain the participation of five households from the city of Guayaquil. The five households could include their own if they lived in Guayaquil or from neighbors or family that did not live with them. Once they found the households to participate in, students had to register each household willing to participate in an online format with information, such as the geographical location, the family names, and the number of members. One glass jar of 650 mL with a screw cap was given to each household head who agreed to participate in the project. To have homogeneous jars, the same brand from a local retailer were bought.
Afterward, participant households were instructed to pour all their UCO into the jars for two weeks (14 days). Glass was chosen to support the high temperatures of UCO and avoid any deformation. Each jar had a label attached that contained a code, the names of the family, the name of the student, and the date of delivery and collection. All this information was necessary to identify and maintain the traceability of each glass jar with the information from the surveys. Then, the students collected each jar and transported it to the processing station. Finally, the household heads were interviewed on the survey developed previously, and the data were entered in an Excel format by each student.
The following procedure was undertaken after dUCO jar containers arrived at the processing station:
  • all the 532 household sample jars were weighted first, obtaining the total mass, including the jar container’s mass (Mi);
  • the content of each jar was poured into a 900 mL beaker (B1), where their volume was measured (V1);
  • the weight of the empty jars was obtained (Mj);
  • the total amount of dUCO per household (MUCO) was calculated as the difference between Mi and Mj.

2.4. Used Cooking Oil Characterization

A subsample of 40 households’ jars was chosen randomly to further proceed with the artisanal characterization. For the selected households’ subsamples, the content of the B1 beakers was poured into a second beaker of the same volume (B2), passing through a metallic sieve, to obtain the total solids from the dUCO. After, the solids were also weighed using a high-precision balance (Msolids). All the sieved UCO from the subsamples was then poured into a constructed artisanal decanter, previously fabricated (Figure 4). The total mass and volume were accounted for before pouring the content of each B2 beaker from all 40 processed subsamples into the decanter. A total of 16.035 L or 13.918 kg of dUCO were poured in full into the artisanal decanter.
After, we let the dUCO rest for a total of three days. When the three days were over, we opened the bottom hose valve to let the decanted water out. This process was done through observation: the valve was opened until the color of the liquid changed to a light orange. After, the total mass (Mw) and water volume (Vw) were measured with the digital balance. Floating grease located at the top of the decanter was removed using a stainless-steel spatula palette knife, and the mass of this grease was also weighed using the high-precision balance (Mg).
%   M o i s t u r e = M w M t s s
%   S o l i d s = M s o l i d s M t s s
After removing grease and water, five subsamples of 30, 35, 40, 45, and 50 g were collected from the decanted dUCO and were poured into small samplers of stainless steel, summing a total value of Pi. They were left inside a preheated 105 °C oven for three hours. After, the samples were retrieved and weighed again (Pf) to obtain the total volatiles of the sample (% Volatiles), as shown in Equation (5).
%   V o l a t i l e s = | P f P i | × 100 % P i

2.5. Spatial Interpolation with GIS

The technique of spatial assessment of resource availability across a study area is one of the most comprehensive and thorough approaches toward the potential identification posed by different resources, and it has, thus, been widely used in the scientific community to study the potential posed by additional help in other study areas [28,29,30,31,32].
A Geographical Information System (GIS) allows the creation of a potential spatial map for the statistically assessed resource potential. This result shows the UCO potential in the different parishes around the city in coloring maps. We collected the coordinates and the different numerical variables inside a point-shape file using the households’ surveys. This shapefile was created on ArcGIS 10.4. Moreover, we used the Guayaquil parishes in a vector format. Both shapefiles were in an EPSG:4326 coordinate system.
Having the geospatial data ready (data cleaned and processed), we used the ordinary kriging interpolation method to spatialize the UCO fixed points around the city [33]. Kriging is the most successful interpolation method for phenomena with a robust random component [34,35,36]. Considering the very complex UCO variable by household, we established some interpolation maps using the UCO variable. Then, the spatial analysis compared the UCO high-density places with some socioeconomic variables from each parish.

2.6. Data Analysis

The problem of inappropriate domestic waste discarding can be fixed, firstly, by educating consumers to change the traditional habits that drive them to generate waste and, secondly, by developing a proper waste-disposal system. Researchers have tried to establish the major determinants and drivers of household waste generation at consumer level, however, the authors could not find any other study that intended to correlate dUCO generation with exogenous independent variables during this research. For this reason, we have decided to use previous research that related solid domestic waste with different exogenous determinants and apply them to our study. Determinants such as household size (HS), household income (HI), household education level (HE), and household labor (HL) are the most correlated with DWG [19,37,38,39,40,41,42,43,44]. The correlation between domestic-waste generation (DWG) and socioeconomic factors was studied for the city of Guayaquil in the years 2019 and 2021, finding in 2019 that social status (SS) and household education, along with household income, oppositely affect DWG, negatively for SS and positively for HE and HI, respectively [20]. However, in 2021, HS, HI, SS, and HE were studied for waste production, with HS being statistically relevant with a p-value under 0.01 [45]. Other variables not so used but essential to consider are environmental concern [43], household type (HT) [39], household expenditure [19], and age of inhabitants [41].
For the analysis of both nominal and ordinal information from the questionnaire, and waste characteristics obtained from the data, Microsoft Excel and Minitab 18.1 software were used. Inferential analysis, meaning correlation and regression models, and other statistical parametric tests, such as analysis of variance (ANOVA), are the best options to analyze data [45,46]. In this context, to analyze if there was a linear relationship, the Pearson correlation coefficient was calculated, and regression was performed after to identify the significant factors that affect UCO generation. The dependent variable in the developed regression model was per capita daily used cooking oil generation (dUCOC). Socioeconomic factors of households, such as household size (HS), socioeconomic group (SEG), household income (HI), education level of household head (EL), and tenure status (TS), were considered independent variables. In order to test the significance of the model outcomes, standard tests, such as R2, F-value, and t-value, were calculated and analyzed. The R2 value represents the variance correlation between two variables, establishing the importance of one over the other; on the other hand, the t value and F value help analyze the significance of the correlation coefficients (β) and how they affect the independent variable. The model can be expressed as:
y i = β 0 + x i β i + ε i
where
  • y i = domestic used cooking oil generation;
  • x i = independent variables;
  • β 0 = constant term;
  • β i = coefficient of independent variables;
  • ε = the error or disturbance term.
Empirical specification for the model can be explained by:
dUCOC = β 0 + β 1 ( h o u s e h o l d   s i z e ) + β 2 ( s o c i o e c o n o m i c   g r o u p ) + β 3 ( h o u s e h o l d   i n c o m e ) + β 4 ( e d u c a t i o n   l e v e l ) + β 4 ( t e n u r e   s t a t u s ) + ε

3. Results

3.1. Households’ Characteristics

Knowledge of the characteristics of the participants is shown in Table 3. Of the 532 respondents, 60% were female, and almost 37% were the household head. Approximately 30% of the respondents were aged between 21 and 30 years old. Most households have between three and four family members (51%), followed by households with five to six family members (27%). On average, the household size for the entire sample was 4.18, with a standard deviation of ± 1.62. Of the sampled households (Figure 5), 45% belonged to the middle socioeconomic group (MSEG), while 31% belonged to the middle-high socioeconomic group (MHSEG); the high socioeconomic group (HSEG) was third with almost 14%, and the middle-low socioeconomic group was fourth with 10%. No low socioeconomic group (LSEG) was found for the sampled population. The average income of each household varies between USD 391.00 and USD 1200.00, with approximately 62% of the population located in this salary range. One particularly interesting piece of data is the fact that 77% of the sample owns their households, followed by those who rent theirs at almost 17%. Finally, the majority of household heads have at least finished high school, representing approximately 61%, and only 26% have achieved the third degree level, whether by a technical or bachelor’s degree.

3.2. Household UCO Quantification

The per capita daily dUCO-generation rate was found to be 4.30 g/day/c or 4.99 mL/day/c, as shown in Table 4. Moreover, the density of the dUCO was found to be 0.86 g/mL. Additionally, Table 4 shows each study parish’s average mass, volume, and density. The values of density remain within 0.86 and 0.87 g/mL. Tarqui parish produces more used cooking oil (4.51 g/day/c) than the other two most-populated ones, Ximena (3.79 g/day/c) and Febres Cordero (3.98 g/day/c). Considering the city’s total population of 2,698,807, we can estimate an entire daily generation of 11.60 tons of used cooking oil. This information can help decision-makers develop an integrated management system for this kind of waste.

3.3. Household UCO Characterization

The process of filtering the 40 subsamples’ jars through a metallic sieve gave a total of 1.2375 g of solids, representing a total of 0.37% for the entire sample. This value was less than the one found in the previous study, which was done in a local laboratory and obtained a value of 0.58% for the total solids [47].
After the 3-day process of decantation, a total of 220 g of water was removed. Additionally, 2 g of grease was obtained with a stainless-steel spatula palette knife from the top of the decanter. Following Equations 3 and 4, the moisture and grease content for dUCO was 1.58% and 0.014%, respectively. These values differ from 2019 for the moisture and grease content with 0.38% and 0.08%, respectively [47].
For the case of volatile matter content, after 3 h in a 105 °C oven, the percentage of volatile matter using Equation 5 was 7.7% ± 2.1%, superior to the one found in 2019 of 2.98% (+151.68%) [47]. This value can be related to the total amount of fatty acid methyl, which can help predict the total amount of biodiesel acquired after transesterification. However, further research is required.

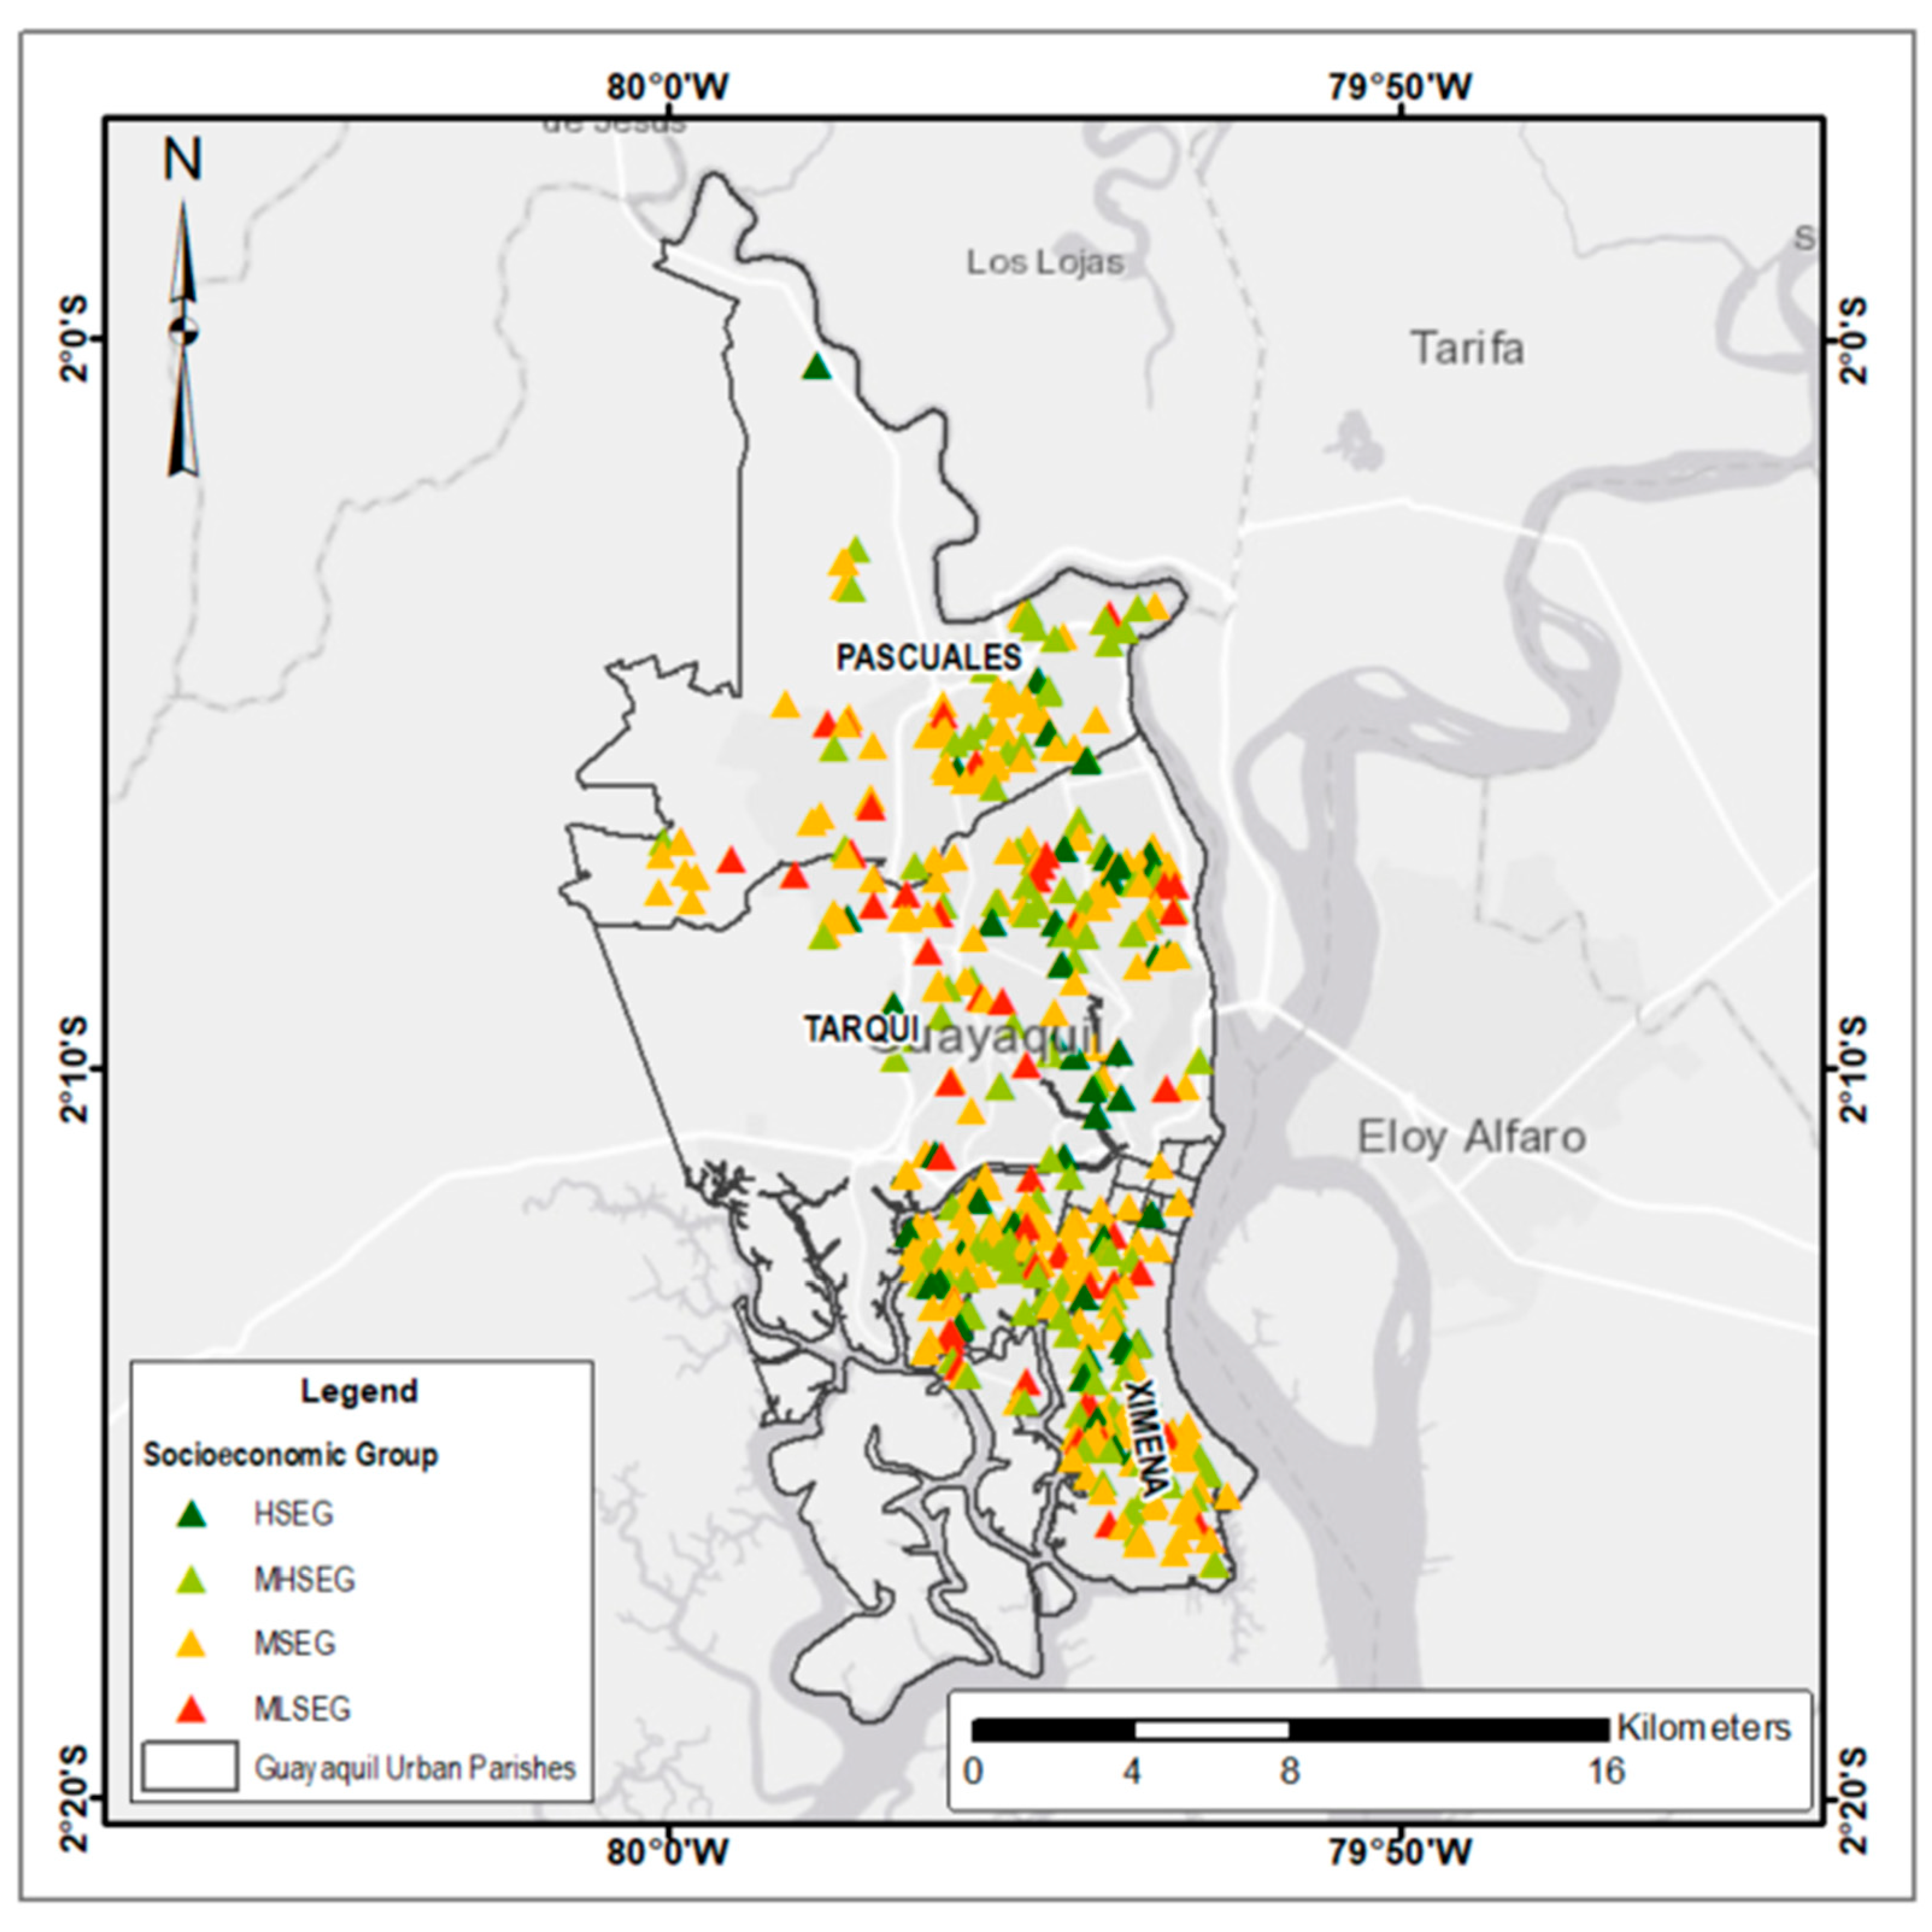
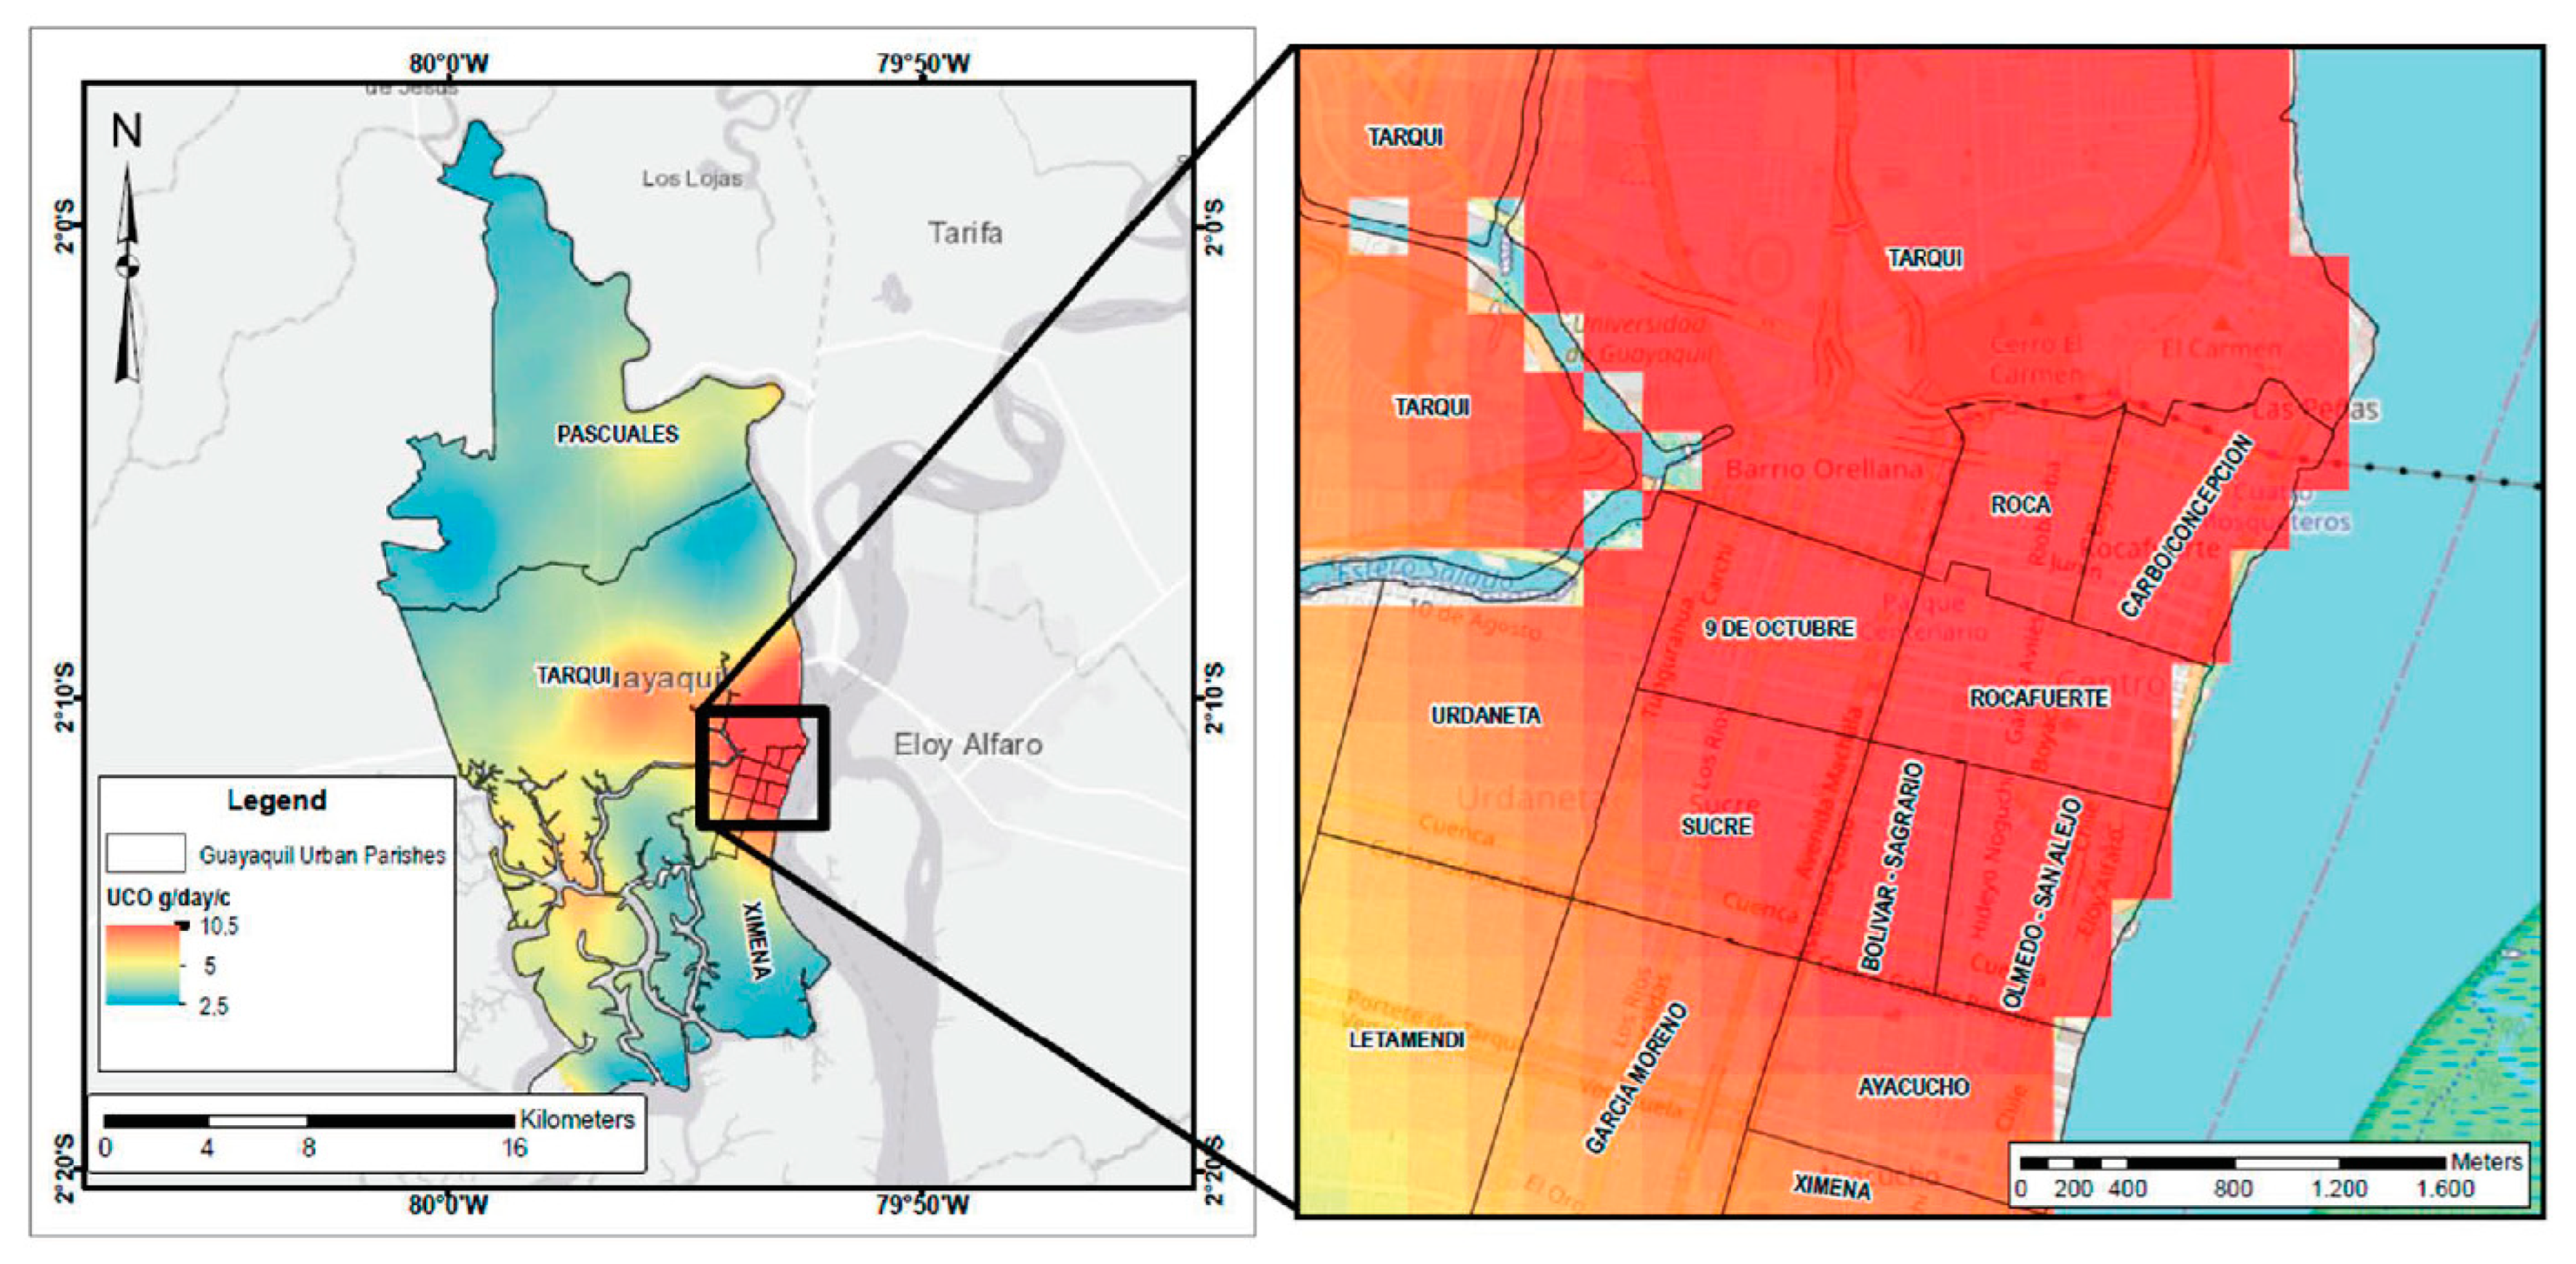
3.4. Household Mapping

Making the data-location quality control and using the GIS software, we have household mapping by domestic UCO generation. Thus, the areas near tourist sites have a higher UCO generation value, considering the household survey (Figure 6). Most of the high-density-UCO parishes are near the downtown. These parishes are Roca, Carbo, Rocafuerte, 9 de Octubre, Olmedo, Bolivar, Ayacucho, and the south of Tarqui. The Guayaquil downtown is a place where there are more people and dynamism. It means more workplaces, restaurants, and financial institutions. Moreover, HSEG and MHSEG people live in the downtown parishes, especially in the south of Tarqui. These phenomes could increase the city zones’ UCO density (g/day/c)

3.5. Empirical UCO-Generation Model

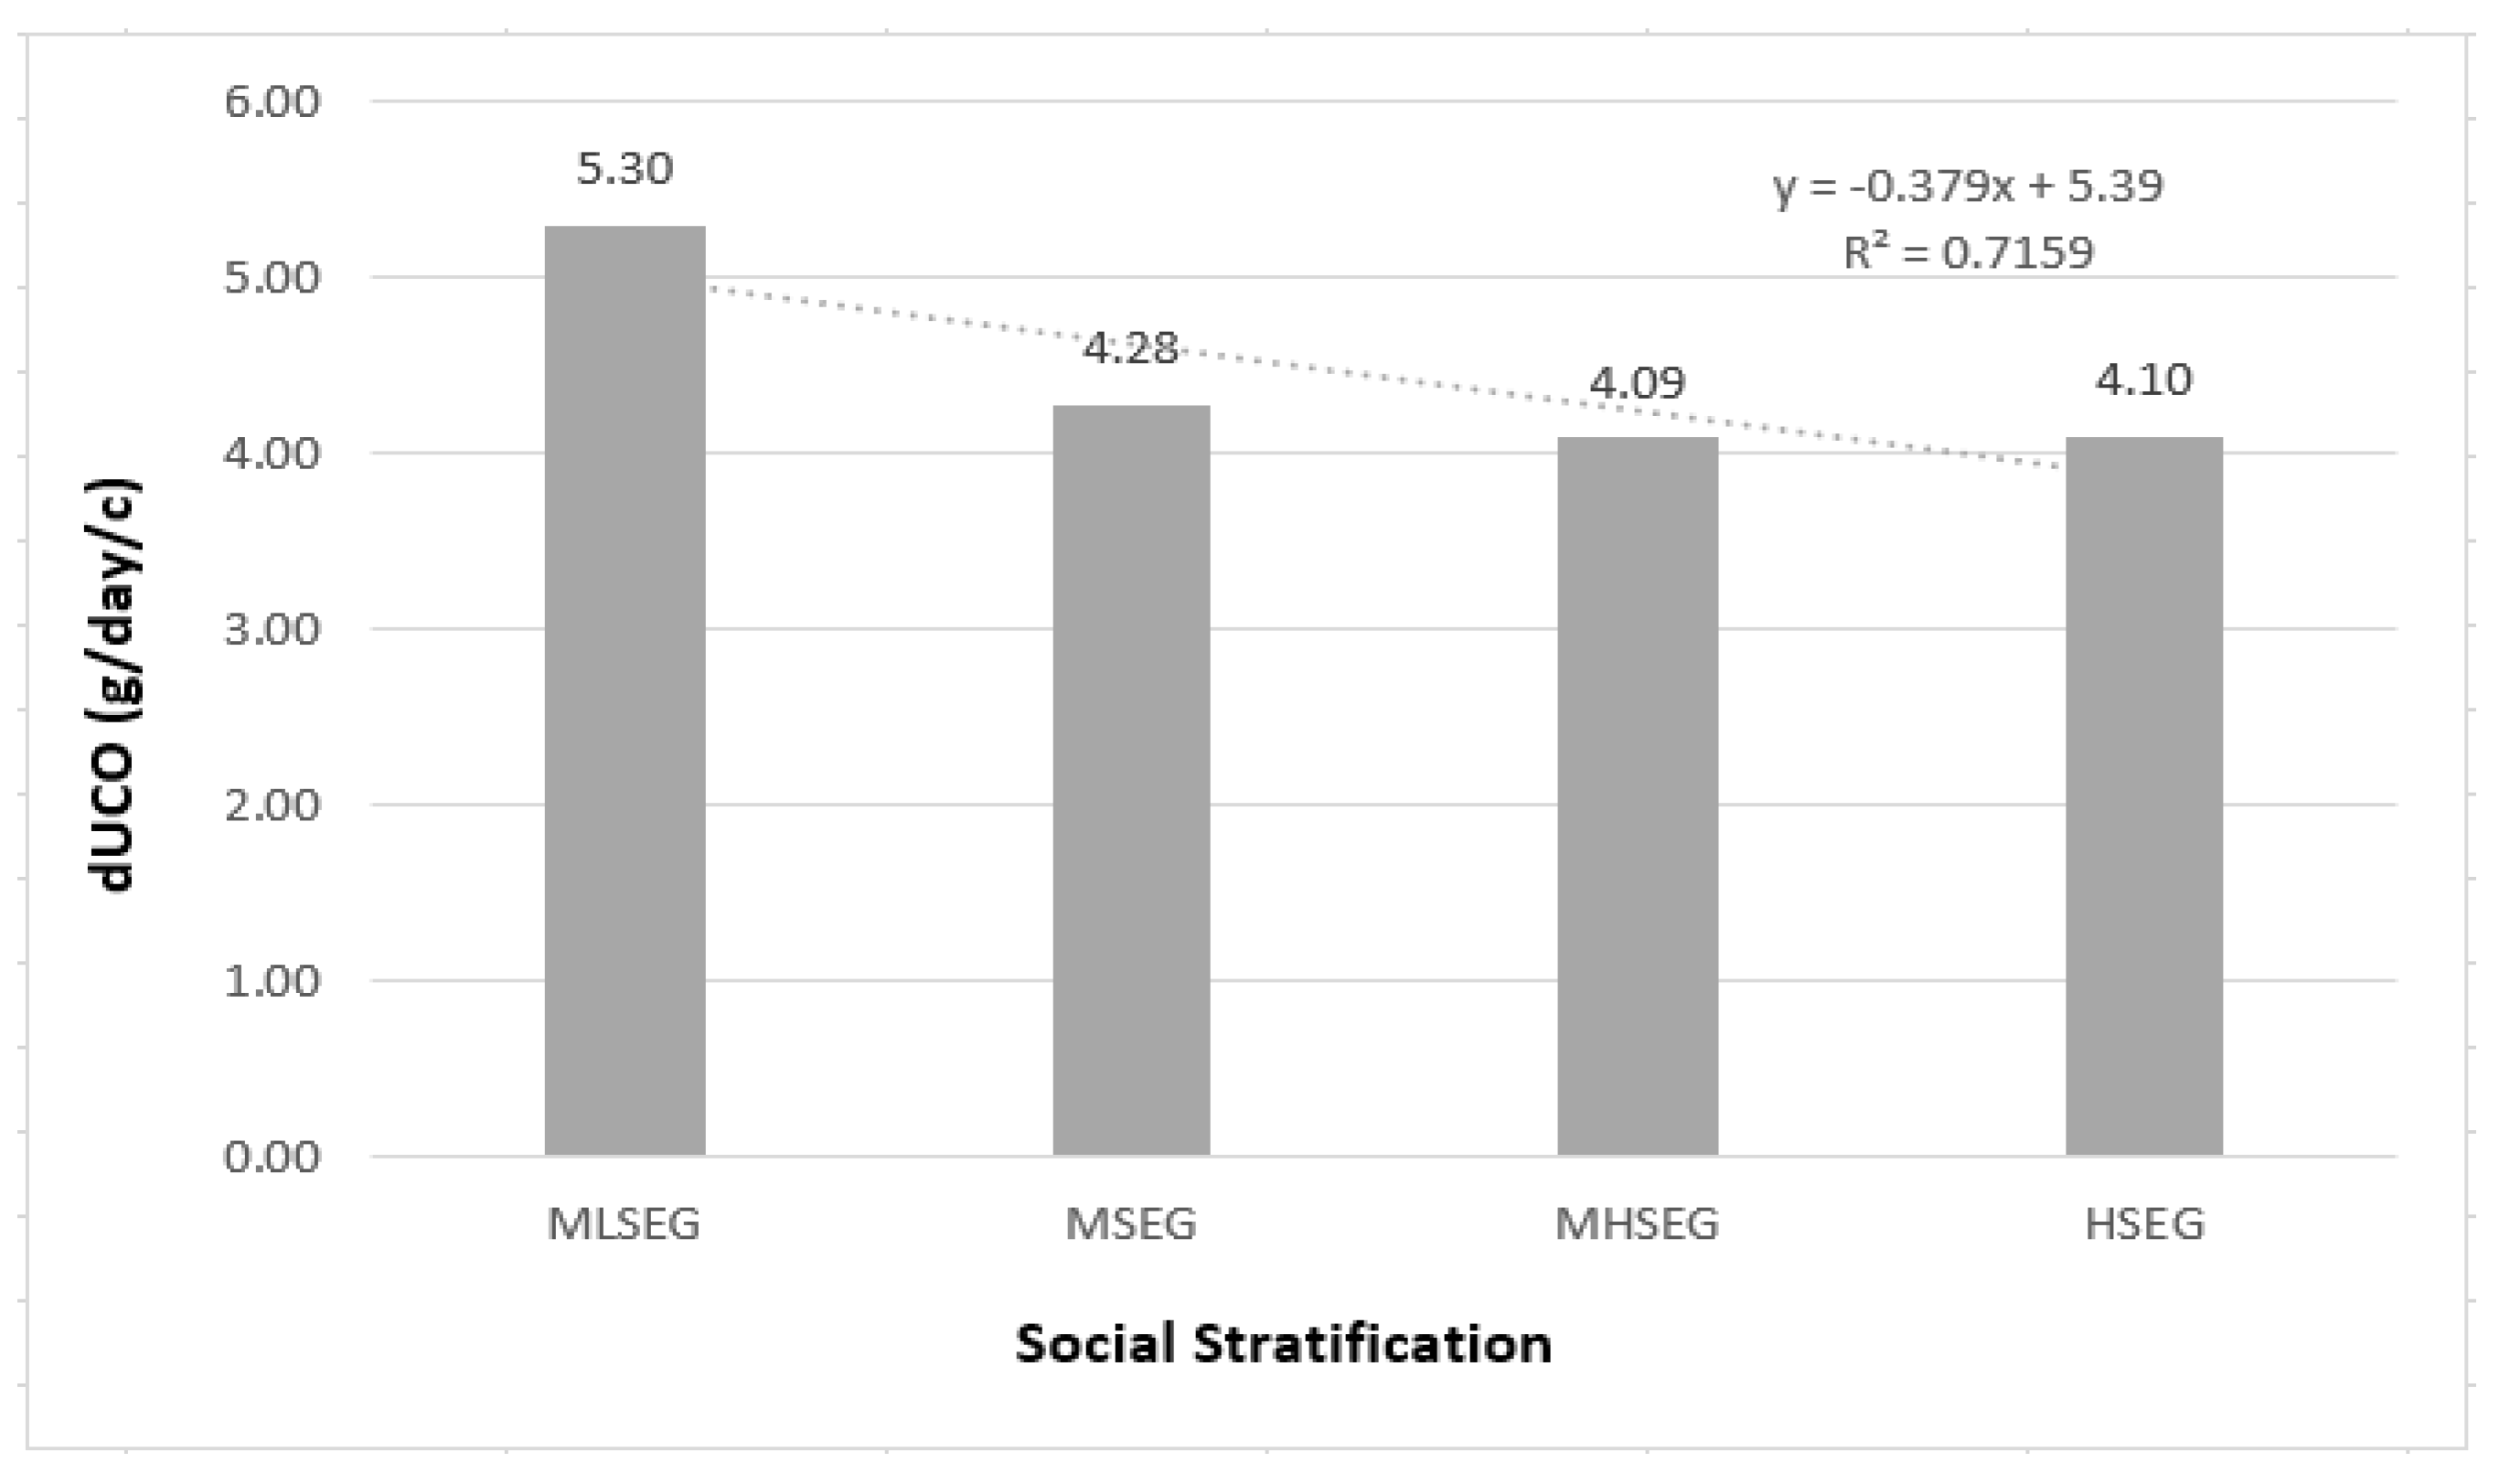
3.5.1. Socioeconomic Group

Figure 7 shows the daily dUCO generation per capita among socioeconomic groups. It can be observed that UCO generation has a level 1 polynomic tendency, with a high value of R2 of approximately 0.72 for every socioeconomic group, suggesting a high relationship. This result is in concordance with that reported by [48], when studying the case of Cap-Haïtien in the Republic of Haiti, finding a negative tendency of waste generation with three levels of socioeconomic groups, i.e., high, medium, and low socioeconomic groups with values of 0.39, 0.32, and 0.16 kg/capita/day, respectively. With this result, it can be assumed that social stratification strongly influences the amount of produced UCO.

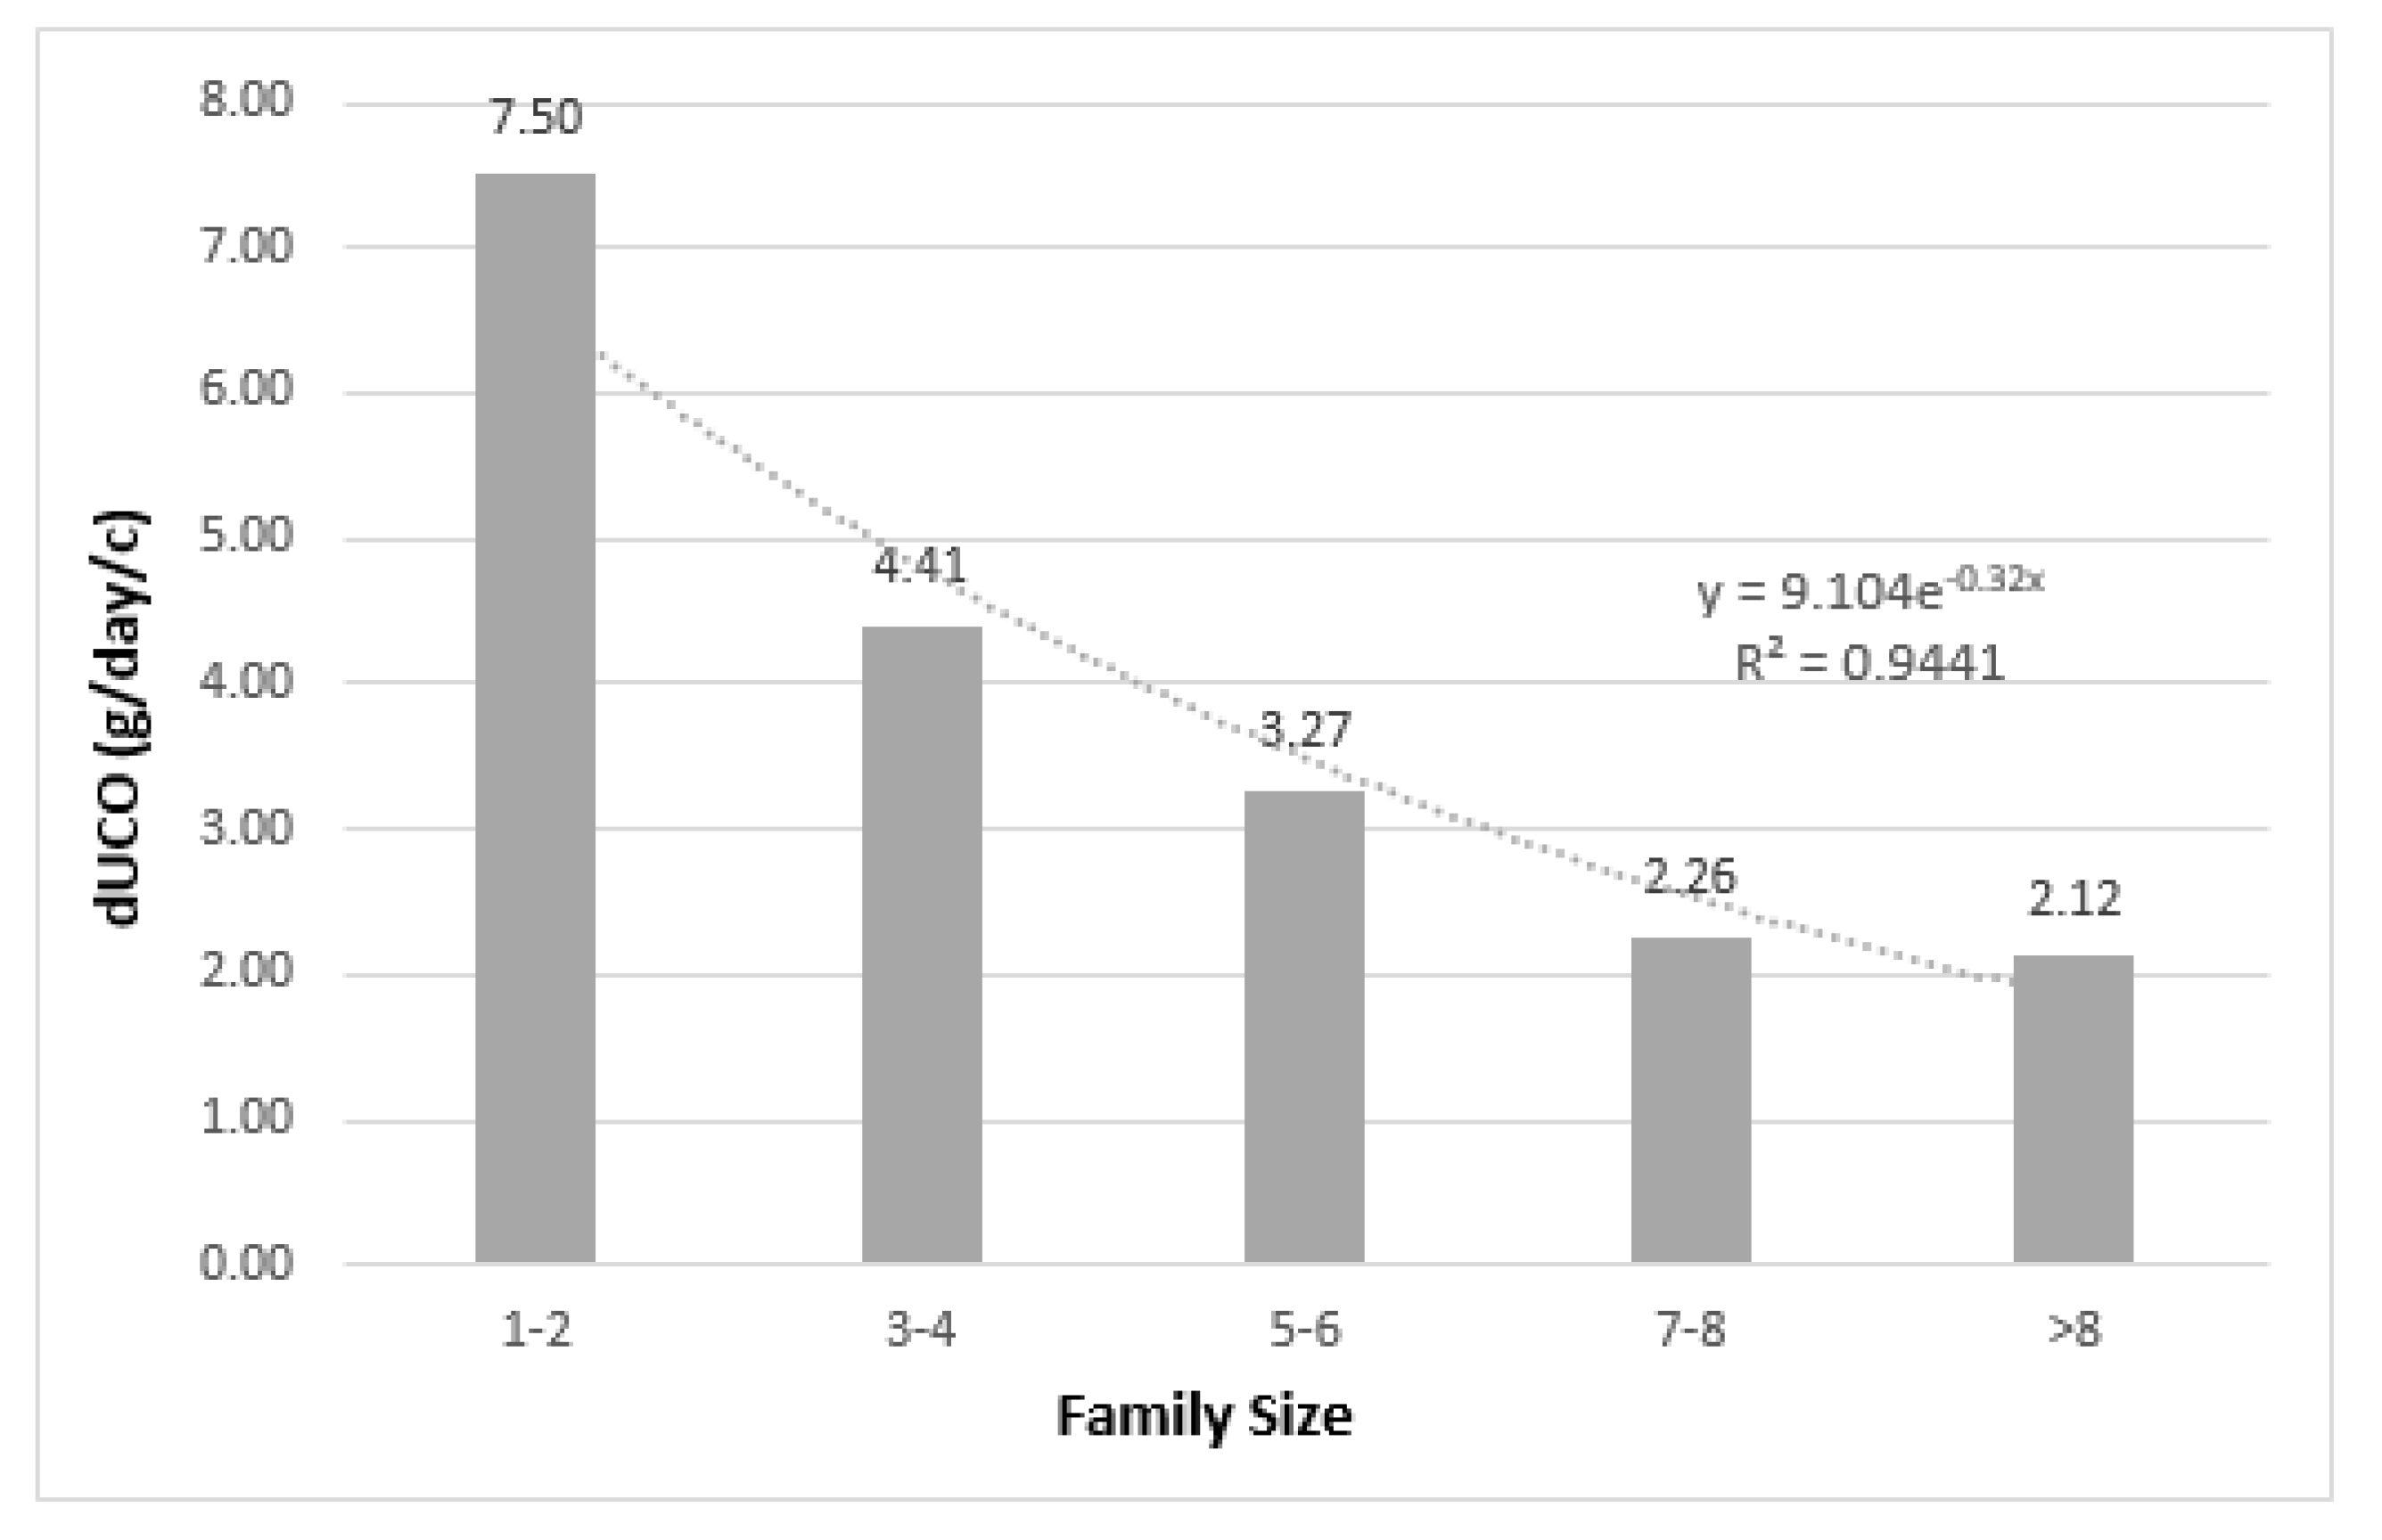
3.5.2. Household Size

The outcomes displayed in Figure 8 show that household size negatively influences the dUCO-generation rate. Indeed, an exponential trend shows an inverse relationship between UCO generation and family size. That R2 value is almost 0.94, demonstrating the high level of relationship among the variables.

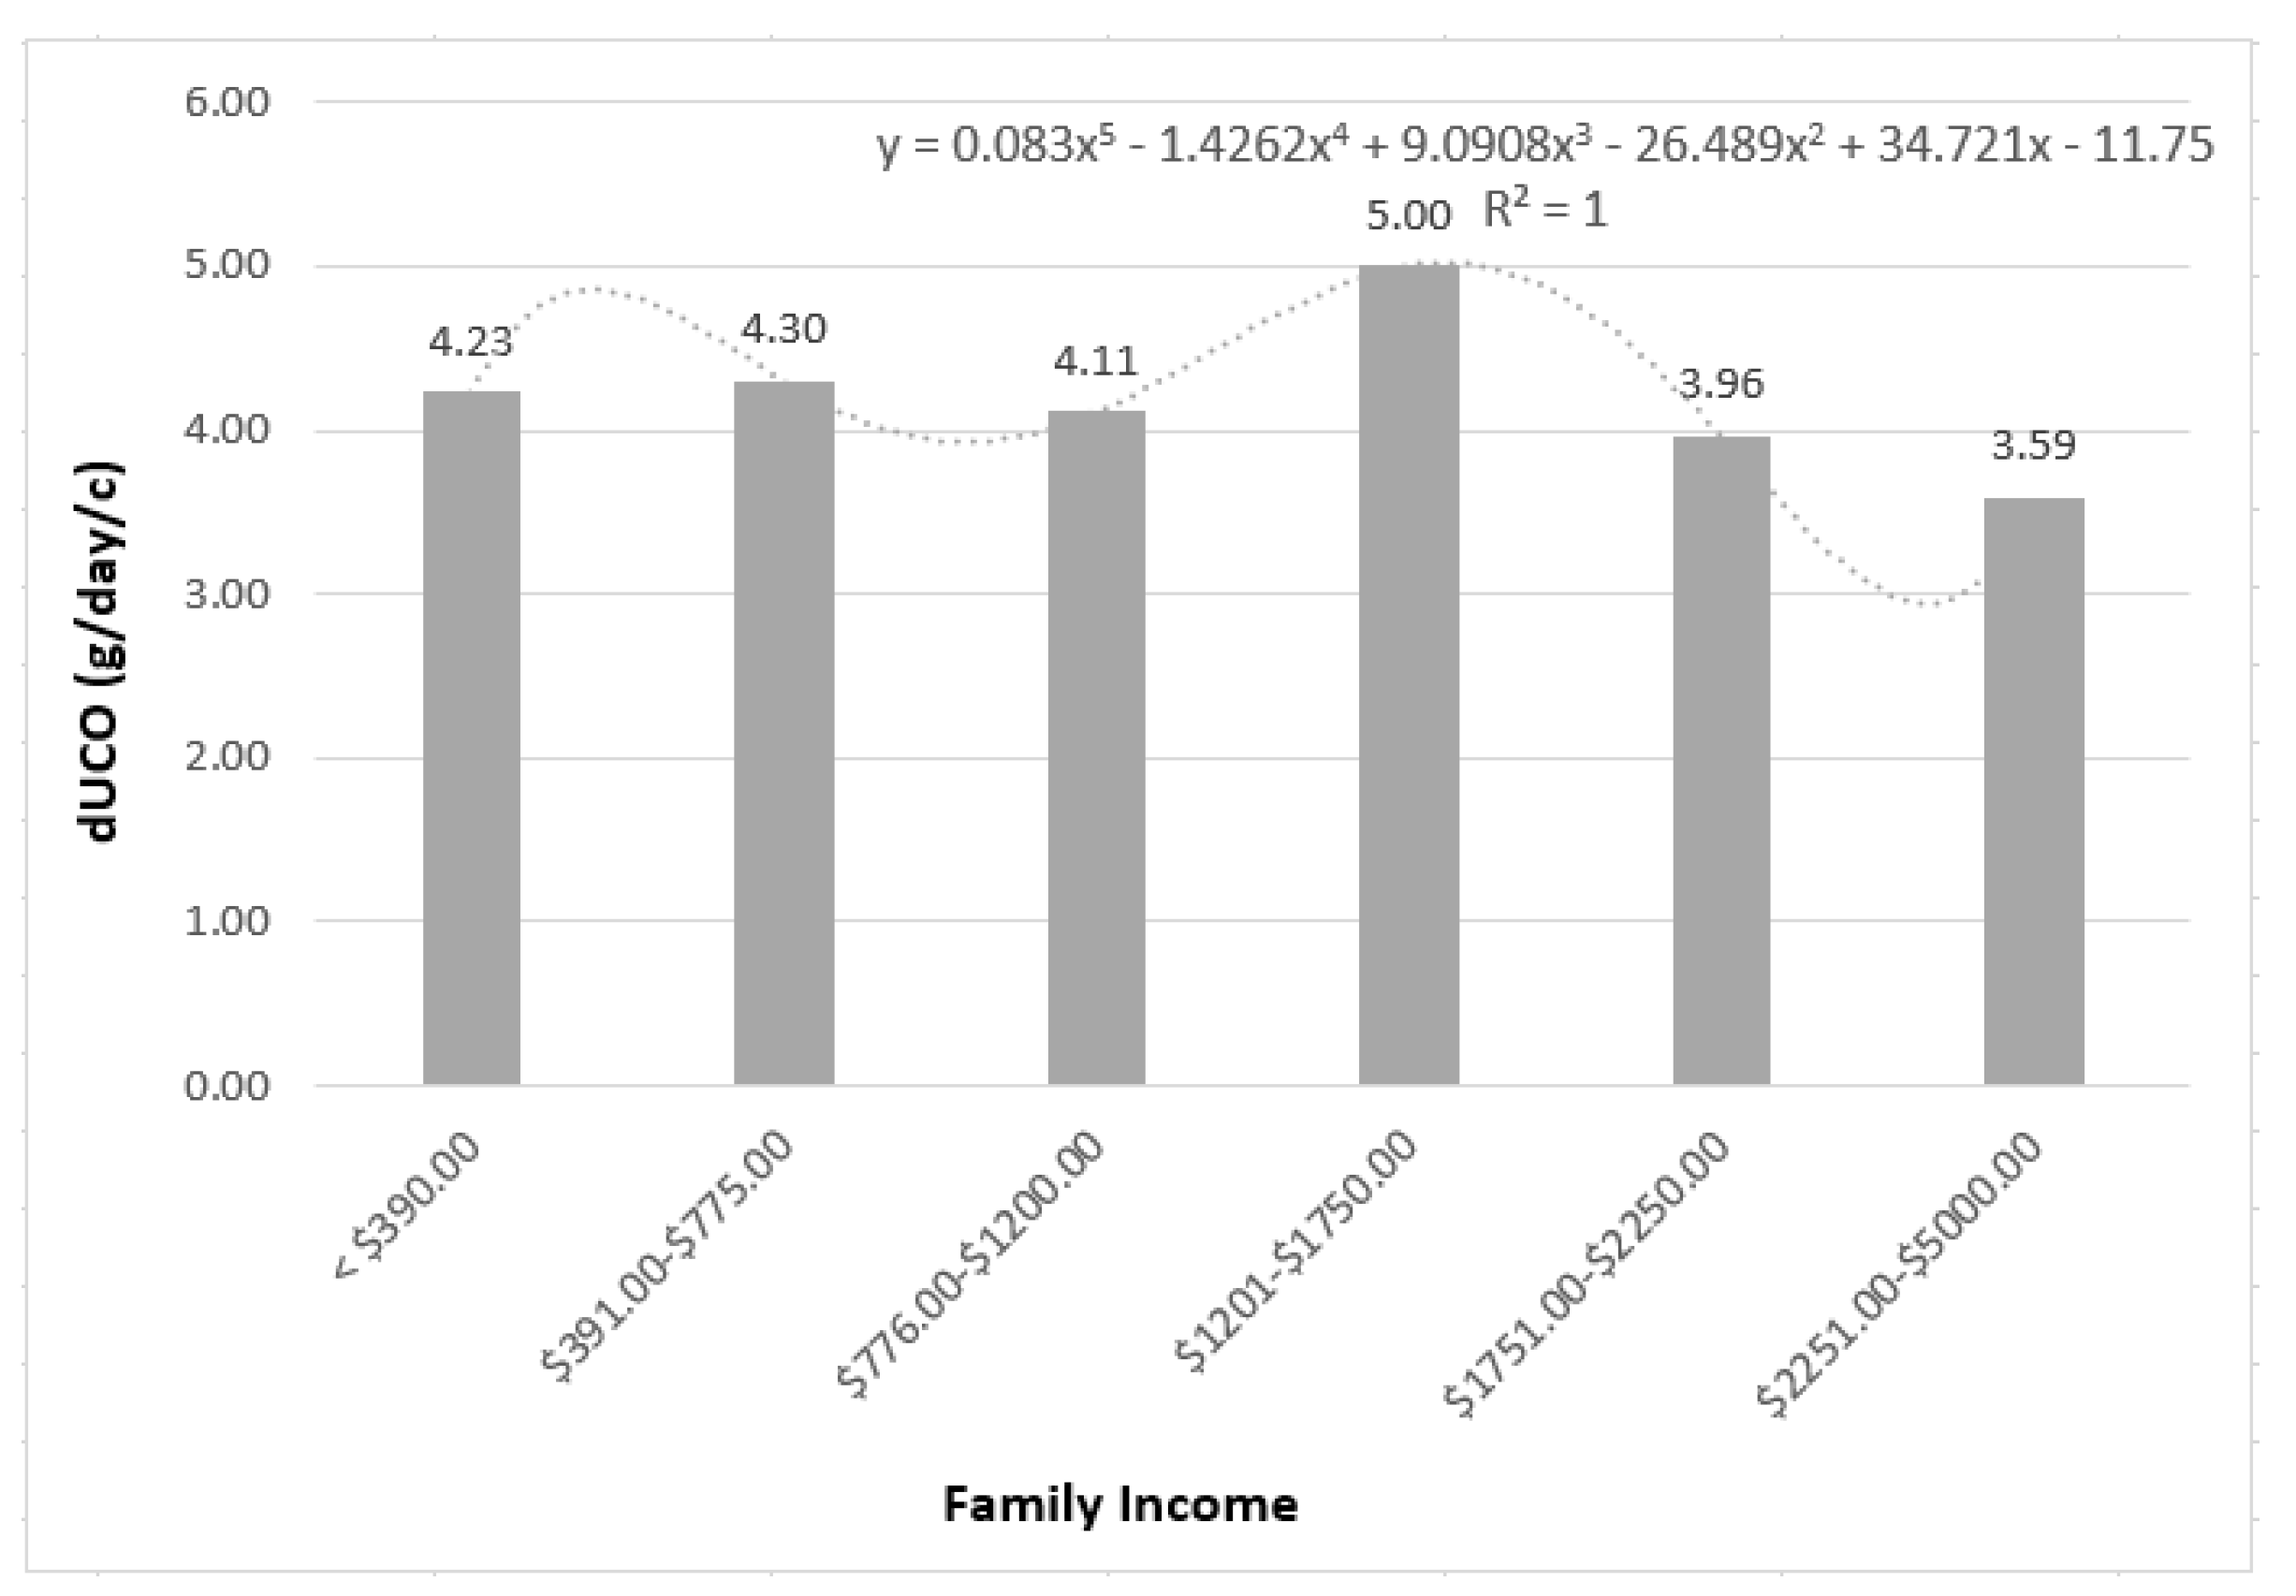
3.5.3. Household Income

The results displayed in Figure 9 suggest that monthly income influences the dUCO-generation rate and may be inferred that low-income households generate more cooking oil waste. The relationship between values is level 5 polynomic, with an R2 value of 1.00. This could be explained by the lesser acquisitive power of these low-income families and their need to eat in the home. These results coincide with those of [45] (Hidalgo-Crespo et al., 2021), which suggest no linear correlation between economic activity and municipal solid waste.

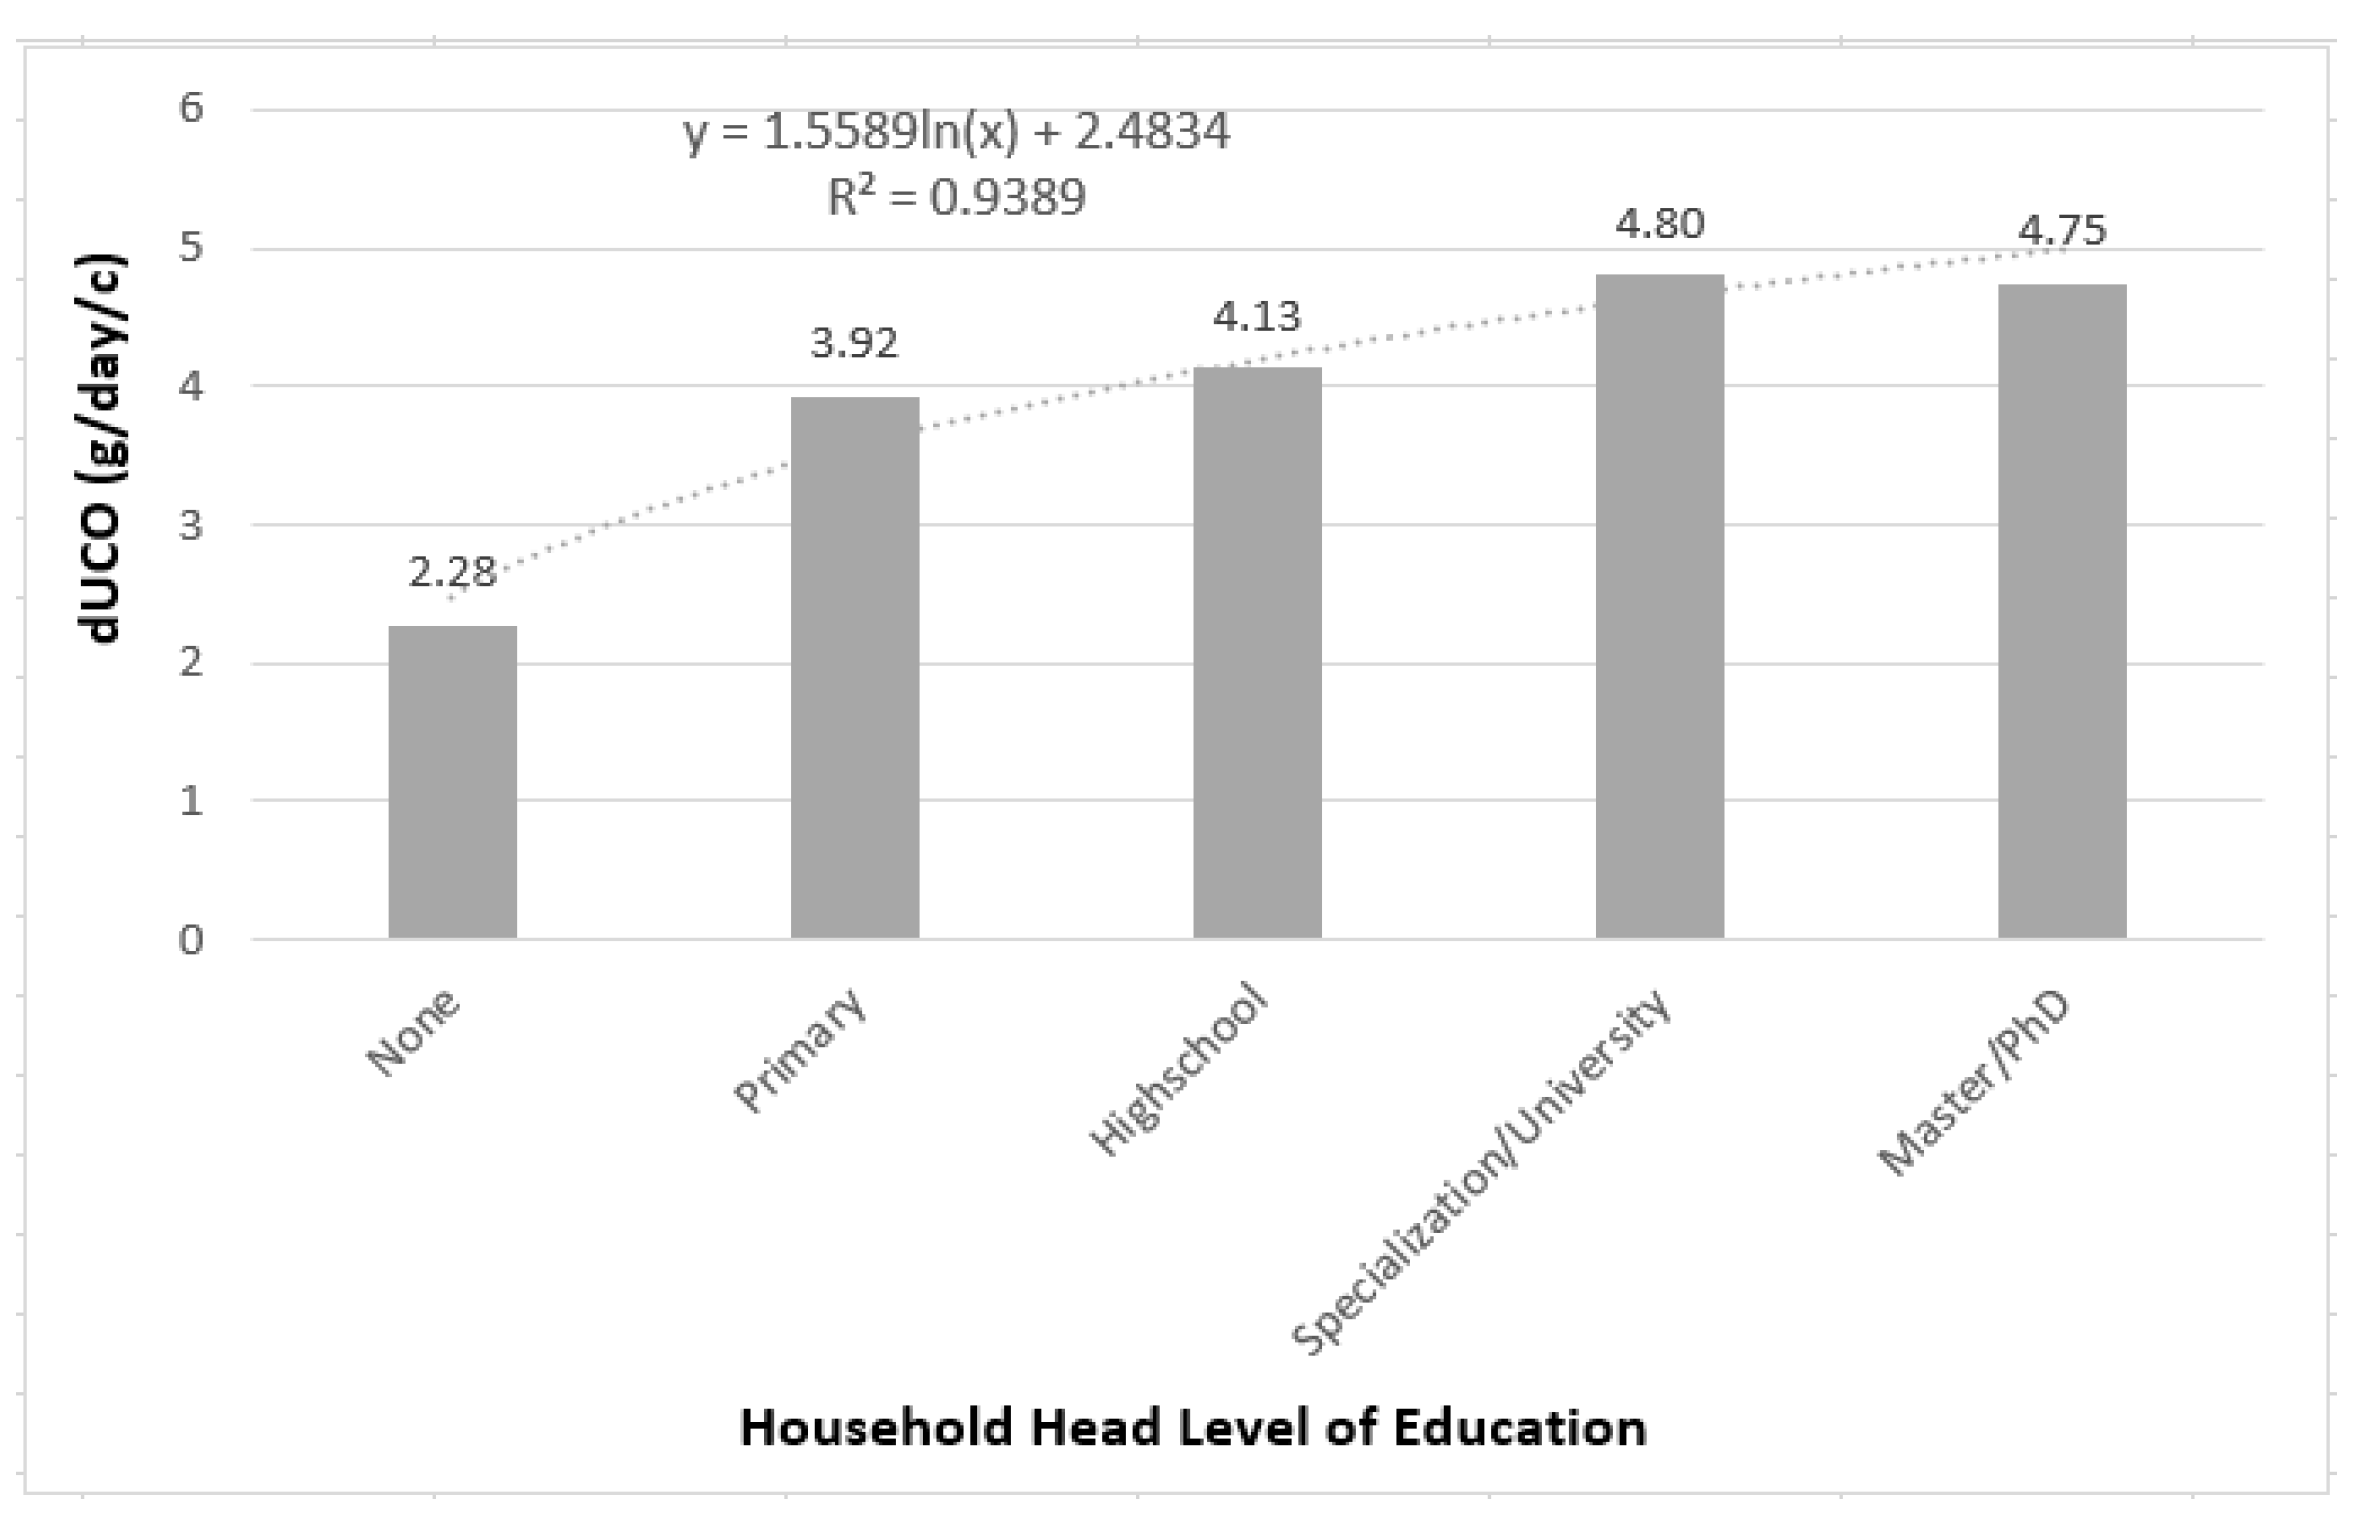
3.5.4. Household Head Education Level

In Figure 10, it can be observed the logarithmic relation between the dUCO generation and the level of education of the household head, with a high R2 value of 0.94; however, as shown in the figure, as the education level of the household head increases, so does the UCO generation. This is consistent with [45] Hidalgo-Crespo et al., 2021, for domestic solid-waste generation. It is clear evidence of the lack of environmental consciousness education for our students of all levels.

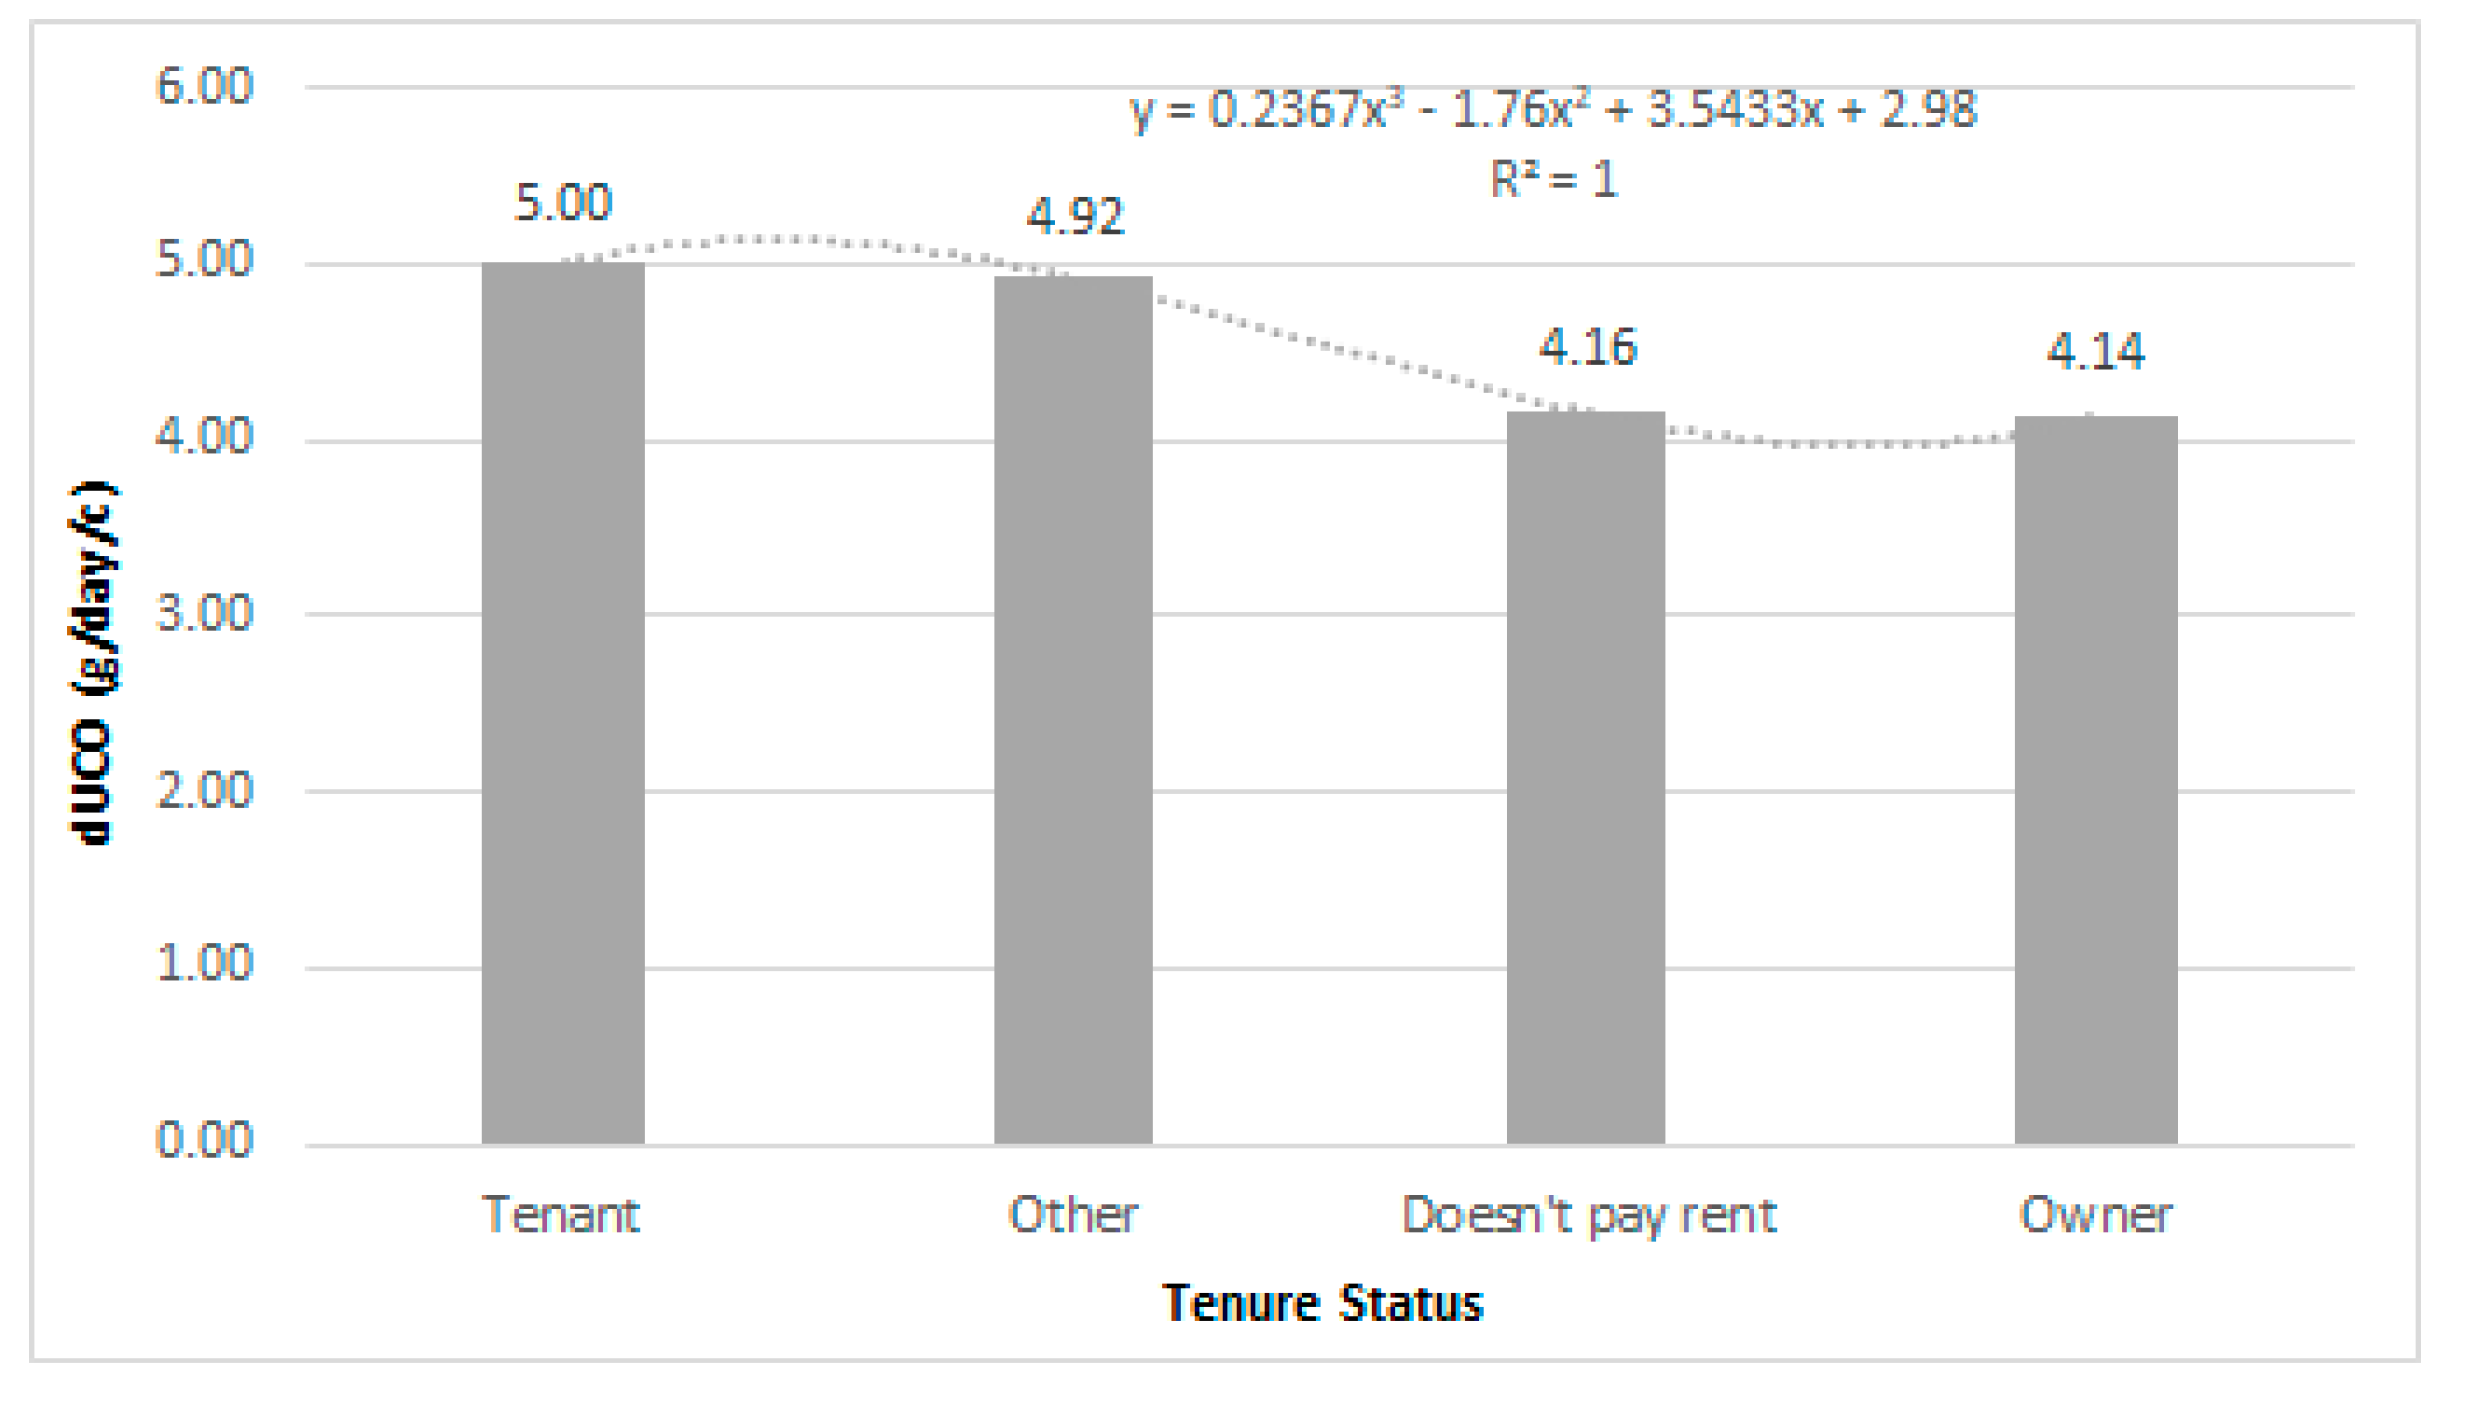
3.5.5. Tenure Status

Figure 11 suggests that the tenure status of the household has a solid quadratic relationship with an R2 value of 1.00, and it may be inferred that a sense of ownership for the people who own their home or do not pay rent helps reduce the amount of used cooking oil being generated.

3.5.6. Pearson Correlation

The bivariate analysis, otherwise named Pearson’s coefficient, was calculated to analyze the correlations between daily used cooking oil generation per capita (UCO) and all the predictors: household size, socioeconomic group, household income, tenure status, and level of education of the household head, as shown in Table 5. In the present study, a strong negative correlation (r = 0.422, p < 0.001) was found between UCO and HS. Moreover, there is a low positive correlation (r = 0.128, p < 0.05) between UCO and LE. Additionally, Table 5 shows correlations between HS, HI, and LE; moreover, SEG shows a correlation with HI, TS, and LE. Finally, we found a correlation between HI, TS, and LE.

3.5.7. Linear Regression

Table 6 shows the variance (ANOVA) analysis of the multivariate linear-regression model for the generation of daily used cooking oil per capita for the entire sample size of 532 households. The Model F-value of 29.24 implies that the model is significant enough. The Model F-value of 29.24 implies that the model is significant. There is a 0.00% chance that a “Model F-value” this large could occur due to noise. Values of “p-value” less than 0.05 indicate model terms are significant. In this case, HS, SEG, HI, and LE are significant model terms.
Equation (8) is obtained from the data analysis. R-squared and error standards are 0.1999 and 0.849, respectively. Considering the variance test of the regression coefficients, non-significant coefficient TS was excluded from Equation (8), yielding Equation (9):
d U C O C = 8.624 1.774 H S 0.486 S E G + 0.270 H I 0.175 T S + 0.408 L E
d U C O C = 8.153 1.788 H S 0.520 S E G + 0.258 H I + 0.426 L E
Given the coefficient values obtained and shown through Equation (9), it can be demonstrated that HS and SEG have the highest effect on dUCOC. Moreover, the positive sign of the LE, and HI coefficients, indicate that these two variables augment the dUCO generation if they too increase. However, the negative sign found in HS and SEG coefficients indicates a reverse relationship with the generated used cooking oil, emphasizing that higher percentages of these two variables lead to a decreased output of dUCOC and vice versa.

4. Discussion

The rising awareness of decreasing natural resources has brought forward the idea of a circular economy (CE) and resource efficiency worldwide. CE is a conditional concept for sustainability [49], which requires a change in generating value, understanding, and making business or management models [50]. It has been argued that the circular economy (CE) represents an opportunity to achieve a paradigm shift in the territory from the current linear model to a low-carbon, zero-waste economy. The success of implementing CE models will partly depend on local and regional environmental planning that must be designed to respond to the needs of different spheres [23].
The per capita daily dUCO-generation rate was found to be 4.30 g/day/c or 4.99 mL/day/c, less than the average dUCO produced in 2019 in the urban areas of Guayaquil of 5.11 g/day/c [48]. However, this previous study was more of a pilot to validate the proposed quantification methodology, so it only accounted for 441 households. The density of the dUCO was found to be 0.86 g/mL, slightly less than the average of 0.91 g/mL, according to the European Biomass Industry Association (EUBIA) (Used cooking oil) and the value found in the 2019 study for the same city of 0.90 g/mL [47]. The difference may be due to the share of the different types of edible cooking oil consumed by the population.
It is essential to monitor residual waste flows to make recycling more efficient [26]. Proper management will transform waste into resources that can be reintroduced into the economic system. Recycling is considered one of the critical strategies in the waste management framework globally. However, this method requires intensive energy, specifically collecting, transporting, and processing recyclables and recycled items. Situational factors mainly influence recycling behaviors, for example, recycling facilities, which are more controllable by the public authorities [51].
Most of these recycling problems come with the costs of collection. Nevertheless, relevant environmental damages are captured by waste disposal costs and litter. Then, reducing waste at the source and increasing the recycling rate are most necessary.
As large amounts of waste cooking oil are illegally dumped into rivers and landfills, the secondary use of UCO offers significant advantages because of the reduction in environmental pollution. However, lack of knowledge of the nature of UCO recycling, high transportation cost, and dispersal of UCO generators in the city associated with the zero recycling companies in the city for this type of waste makes the inverse logistic almost impossible.
Through its geospatial distribution of domestic used cooking oil, this research appoints that collection plans should begin with the most touristic sites located in the middle-town and its surroundings of the city. One method to cover the costs is the polluter pays principle, which lays down that both producers and consumers should pay for the total costs of their actions [52]. Another method of promoting waste circular models is the extended producer responsibility (or CPR), which can include a tax for selling edible cooking oil, thinking on the collection, as it is done for the waste motor oil.
Typically, UCO is collected from households and restaurants, which must be processed and utilized in various product segments to reduce waste oil. Thus, recycled UCO or other waste materials can benefit the future energy supply due to their high heating value and energy potential [53].

5. Conclusions and Future Perspectives

This study aimed to quantify, geo-locate, characterize, and model the generation of domestic used cooking oil for the city of Guayaquil. For this reason, we developed a novel methodology for acquiring information through 14-day fieldwork in 532 households from different districts of Guayaquil, combined with a survey to obtain data on the demographic and socioeconomic statistics and habits of UCO management and disposal. Artisanal characterization was completed for the subsamples, to determine the apparent and natural density, moisture, solids content, and volatile matter present in the UCO. GIS mapping was achieved to obtain heat zones of the city, with the help of the quantities of UCO generated, summed to the geographical location of the participating households.
The per capita daily dUCO-generation rate was found to be 4.30 g/day/c or 4.99 mL/day/c, with a density of 0.86 g/mL. The values of density remain within 0.86 and 0.87 g/mL. Tarqui parish produces more used cooking oil (4.51 g/day/c) than the other two most-populated ones, Ximena (3.79 g/day/c) and Febres Cordero (3.98 g/day/c). Considering the city’s total population of 2,698,807, we can estimate an entire daily generation of 11.60 tons of used cooking oil. This information can help decision-makers develop an integrated management system for this kind of waste.
Filterable solids represented 0.37% for the entire dUCO collected sample, while separable water and grease represented 1.58% and 0.014%, respectively. In addition, the percentage of the volatile matter was found to be 5%, which was 7.7% ± 2.1% of the filtered dUCO. Using GIS mapping, we found that the areas near the tourism sites have a higher dUCO generation value, considering the household survey. This can help plan future collection schemes for the city.
Following the developed multiple-regression model, it was found that household size and the socioeconomic group have the maximum effect on generating used cooking oil. When looking at the positive sign of HI and LE and the negative sign of HS and SEG coefficients, we can infer that the first two variables increase dUCOC and the last two decrease it, when the four of them augment, and vice versa.
Regarding its reutilization, the most famous and generally accepted application is the production of fatty acid methyl (FAME), which is usually referred to as biodiesel [54,55]. Blended UCO can be an auxiliary fuel for municipal solid-waste incinerators, while the heat produced can form super-heated steam and generate electricity. UCO usually contains a high ratio of hydrogen atoms compared to carbon and oxygen, making it available to crack hydrogen gas [56]. In 2015, an environmental assessment of three different utilization paths for UCO from households was studied. The best option was the esterification of dUCO, with savings of 3089 kg CO2-equivalent per ton of UCO. The utilization of dUCO in a cogeneration plant results in a similar range of environmental benefits with a 2967 kg CO2-equivalent [12]. When using dUCO as a co-substrate in an agricultural biogas plant, an ecological savings of 1459 kg of CO2-equivalent was achieved [53].
Future work should analyze the different pathways for UCO reutilization, both from an economic and environmental point of view. The development of a collection model should start with the development of waste indexes by different neighborhoods, not only parishes, amplifying the use of the GIS tool and obtaining the total UCO expected by area, allowing the planification waste-transfer stations, such as waste bins, to accept deposits of bottles filled with UCO.

Author Contributions

Formal analysis, M.S.; Investigation, J.H.-C.; Methodology, C.I.A.-M. and J.L.A.-R. Amaya-Rivas; Resources, C.I.A.-M.; Writing—original draft, J.H.-C.; Writing—review & editing, C.I.A.-M., M.S. and J.L.A.-R. All authors have read and agreed to the published version of the manuscript.

Funding

This research received no external funding.

Institutional Review Board Statement

Not applicable.

Informed Consent Statement

Informed consent was obtained from all subjects involved in the study.

Data Availability Statement

Not applicable.

Conflicts of Interest

The authors declare no conflict of interest.

References

  1. Ribić, B.; Voća, N.; Ilakovac, B. Concept of sustainable waste management in the city of Zagreb: Towards the implementation of circular economy approach. J. Air Waste Manag. Assoc. 2016, 67, 241–259. [Google Scholar] [CrossRef]
  2. Gomez, G.; Meneses, M.; Ballinas, L.; Castells, F. Characterization of urban solid waste in Chihuahua, Mexico. Waste Manag. 2008, 28, 2465–2471. [Google Scholar] [CrossRef]
  3. World Bank. Data World Bank—Population Growth (Annual%). 2019. Available online: https://data.worldbank.org/indicator/SP.POP.GROW (accessed on 6 June 2022).
  4. Stenmarck, A.; Jensen, C.; Quested, T.; Moates, G. Estimates of European Food Waste Levels; IVL Swedish Environmental Research Institute: Stockholm, Sweden, 2016. [Google Scholar]
  5. Afroz, R.; Hanaki, K.; Tudin, R. Factors affecting waste generation: A study in a waste management program in Dhaka City, Bangladesh. Environ. Monit. Assess. 2011, 179, 509–519. [Google Scholar] [CrossRef]
  6. FAO. Crops Processed, Food Agric Organ, United Nations; FAO: Rome, Italy, 2017. [Google Scholar]
  7. European Biomass Industry Association. Used Cooking Oil. Available online: https://www.eubia.org/cms/wiki-biomass/biomass-resources/challenges-related-to-biomass/used-cooking-oil-recycling/ (accessed on 6 June 2022).
  8. Gui, M.M.; Lee, K.T.; Bhatia, S. Feasibility of edible oil vs. non-edible oil vs. edible waste oil as biodiesel feedstock. Energy 2008, 33, 1646–1653. [Google Scholar] [CrossRef]
  9. Kulkarni, M.G.; Dalai, A.K. Waste Cooking Oil—An Economical Source for Biodiesel: A Review. Ind. Eng. Chem. Res. 2006, 45, 2901–2913. [Google Scholar] [CrossRef]
  10. Salmani, Y.; Mohammadi-Nasrabadi, F.; Esfarjani, F. A mixed-method study of edible oil waste from farm to table in Iran: SWOT analysis. J. Mater. Cycles Waste Manag. 2021, 24, 111–121. [Google Scholar] [CrossRef] [PubMed]
  11. Moftah, W.; Marković, D.; Moftah, O.; Nesseef, L. Characterization of Household Solid Waste and Management in Tripoli City—Libya. Open J. Ecol. 2016, 6, 435–442. [Google Scholar] [CrossRef] [Green Version]
  12. Agrawal, B.N.; Sinha, S.; Kuzmin, A.V.; Pinchuk, V.A. Effect of vegetable oil share on combustion characteristics and thermal efficiency of diesel engine fueled with different blends. Therm. Sci. Eng. Prog. 2019, 14, 100404. [Google Scholar] [CrossRef]
  13. Hidalgo, D.; Gómez, M.; Martín-Marroquín, J.M.; Aguado, A.; Sastre, E. Two-phase anaerobic co-digestion of used vegetable oils’ wastes and pig manure. Int. J. Environ. Sci. Technol. 2014, 12, 1727–1736. [Google Scholar] [CrossRef] [Green Version]
  14. Marchetti, R.; Vasmara, C.; Bertin, L.; Fiume, F. Conversion of waste cooking oil into biogas: Perspectives and limits. Appl. Microbiol. Biotechnol. 2020, 104, 2833–2856. [Google Scholar] [CrossRef]
  15. Mohammadshirazi, A.; Akram, A.; Rafiee, S.; Elnaz, B.K. Energy and cost analyses of biodiesel production from waste cooking oil. Renew. Sustain. Energy Rev. 2014, 33, 44–49. [Google Scholar] [CrossRef]
  16. La Fabril. Continues to Bet on Caring for the Environment with the Recycling of Used Cooking Oil and Its Transformation into Biofuel. Available online: https://ccq.ec/la-fabril-continua-apostando-por-el-cuidado-delmedioambiente-con-el-reciclaje-de-aceite-usado-de-cocina-y-su-transformacion-enbiocombustible/ (accessed on 20 October 2021).
  17. Vinyes, E.; Oliver-Solà, J.; Ugaya, C.; Rieradevall, J.; Gasol, C.M. Application of LCSA to used cooking oil waste management. Int. J. Life Cycle Assess. 2013, 18, 445–455. [Google Scholar] [CrossRef]
  18. Langley, J.; Yoxall, A.; Heppell, G.; Rodriguez, E.M.; Bradbury, S.; Lewis, R.; Luxmoore, J.; Hodzic, A.; Rowson, J. Food for Thought?—A UK pilot study testing a methodology for compositional domestic food waste analysis. Waste Manag. Res. J. Sustain. Circ. Econ. 2009, 28, 220–227. [Google Scholar] [CrossRef]
  19. Han, Z.; Liu, Y.; Zhong, M.; Shi, G.; Li, Q.; Zeng, D.; Zhang, Y.; Fei, Y.; Xie, Y. Influencing factors of domestic waste characteristics in rural areas of developing countries. Waste Manag. 2018, 72, 45–54. [Google Scholar] [CrossRef] [PubMed]
  20. Hidalgo, J.; Amaya, J.; Jervis, F.; Moreira, C. Influence of Socio-Economic Factors on Household Solid Waste (HSW) Generation of the City of Guayaquil, Ecuador. In Proceedings of the sixteen laccei international multi-conference for engineering, educa-tion and technology, Montego Bay, Jamaica, 24–26 July 2019. [Google Scholar] [CrossRef] [Green Version]
  21. INEC. Guayaquil en cifras. Instituto Nacional de Estadísticas y Censos. Available online: https://www.ecuadorencifras.gob.ec/guayaquil-en-cifras/ (accessed on 29 August 2021).
  22. Kwak, S.G.; Kim, J.H. Central Limit Theorem. In The Concise Encyclopedia of Statistics; Springer: New York, NY, USA, 2008. [Google Scholar] [CrossRef]
  23. Zhang, X.-F.; Yang, F.-B.; Wang, X.-Z. A theorem for calculation of the appropriate sample size in an estimation. Chaos Solitons Fractals 2017, 104, 291–297. [Google Scholar] [CrossRef]
  24. Dillman, D.A. Mail and Internet Surveys: The Tailored Design Method–2007 Update with New Internet, Visual, and Mixed-Mode Guide; John Wiley & Sons: Hoboken, NJ, USA, 2011. [Google Scholar]
  25. Liu, C.; Nguyen, T.T. Evaluation of Household Food Waste Generation in Hanoi and Policy Implications towards SDGs Target 12.3. Sustainability 2020, 12, 6565. [Google Scholar] [CrossRef]
  26. Sahimaa, O.; Hupponen, M.; Horttanainen, M.; Sorvari, J. Method for residual household waste composition studies. Waste Manag. 2015, 46, 3–14. [Google Scholar] [CrossRef] [PubMed]
  27. Ilakovac, B.; Voca, N.; Pezo, L.; Cerjak, M. Quantification and determination of household food waste and its relation to sociodemographic characteristics in Croatia. Waste Manag. 2019, 102, 231–240. [Google Scholar] [CrossRef]
  28. Saleem, N.; Rashid, M.; Jarad, F.; Kalsoom, A. Convergence of Generalized Quasi-Nonexpansive Mappings in Hyperbolic Space. J. Funct. Spaces 2022, 2022, 3785584. [Google Scholar] [CrossRef]
  29. Alvarez-Mendoza, C.I.; Teodoro, A.C.; Torres, N.; Vivanco, V. Assessment of Remote Sensing Data to Model PM10 Estimation in Cities with a Low Number of Air Quality Stations: A Case of Study in Quito, Ecuador. Environments 2019, 6, 85. [Google Scholar] [CrossRef] [Green Version]
  30. Alvarez-Mendoza, C.I.; Teodoro, A.; Freitas, A.; Fonseca, J. Spatial estimation of chronic respiratory diseases based on machine learning procedures—An approach using remote sensing data and environmental variables in quito, Ecuador. Appl. Geogr. 2020, 123, 102273. [Google Scholar] [CrossRef]
  31. Yousefi, H.; Noorollahi, Y.; Hajinezhad, A.; Alimohammadi, A. GIS-based spatially integrated bioenergy resources assessment in Kurdistan Province-Northwest Iran. Sustain. Energy Technol. Assess. 2017, 23, 11–20. [Google Scholar] [CrossRef]
  32. Zyadin, A.; Natarajan, K.; Latva-Käyrä, P.; Igliński, B.; Iglińska, A.; Trishkin, M.; Pelkonen, P.; Pappinen, A. Estimation of surplus biomass potential in southern and central Poland using GIS applications. Renew. Sustain. Energy Rev. 2018, 89, 204–215. [Google Scholar] [CrossRef]
  33. Dindaroğlu, T. The use of the GIS Kriging technique to determine the spatial changes of natural radionuclide concentrations in soil and forest cover. J. Environ. Health Sci. Eng. 2014, 12, 130. [Google Scholar] [CrossRef] [PubMed] [Green Version]
  34. Stephen, T.; Rohen, Y.; Saleem, N.; Devi, M.B.; Singh, K.A. Fixed Points of Generalized α -Meir-Keeler Contraction Mappings in S b -Metric Spaces. J. Funct. Spaces 2021, 2021, 4684290. [Google Scholar] [CrossRef]
  35. Longley, P.A.; Goodchild, M.F.; Maguire, D.J.; Rhind, D.W. Geographic Information Science and Systems; Wiley: Hoboken, NJ, USA, 2015; Available online: https://books.google.com.ec/books?id=C%5C_EwBgAAQBAJ (accessed on 6 June 2022).
  36. Ali, M.U.; Aydi, H.; Batool, A.; Parvaneh, V.; Saleem, N. Single and Multivalued Maps on Parametric Metric Spaces Endowed with an Equivalence Relation. Adv. Math. Phys. 2022, 2022, 6188108. [Google Scholar] [CrossRef]
  37. Bandara, N.J.G.J.; Hettiaratchi, J.P.A.; Wirasinghe, S.C.; Pilapiiya, S. Relation of waste generation and composition to socio-economic factors: A case study. Environ. Monit. Assess. 2007, 135, 31–39. [Google Scholar] [CrossRef]
  38. Gu, B.; Wang, H.; Chen, Z.; Jiang, S.; Zhu, W.; Liu, M.; Chen, Y.; Wu, Y.; He, S.; Cheng, R.; et al. Characterization, quantification and management of household solid waste: A case study in China. Resour. Conserv. Recycl. 2015, 98, 67–75. [Google Scholar] [CrossRef]
  39. Gu, B.; Zhu, W.; Wang, H.; Zhang, R.; Liu, M.; Chen, Y.; Wu, Y.; Yang, X.; He, S.; Cheng, R.; et al. Household hazardous waste quantification, characterization and management in China’s cities: A case study of Suzhou. Waste Manag. 2014, 34, 2414–2423. [Google Scholar] [CrossRef]
  40. Khan, D.; Kumar, A.; Samadder, S.R. Impact of socioeconomic status on municipal solid waste generation rate. Waste Manag. 2016, 49, 15–25. [Google Scholar] [CrossRef]
  41. Monavari, S.M.; Omrani, G.A.; Karbassi, A.; Raof, F.F. The effects of socioeconomic parameters on household solid-waste generation and composition in developing countries (a case study: Ahvaz, Iran). Environ. Monit. Assess. 2011, 184, 1841–1846. [Google Scholar] [CrossRef]
  42. Noufal, M.; Yuanyuan, L.; Maalla, Z.; Adipah, S. Determinants of Household Solid Waste Generation and Composition in Homs City, Syria. J. Environ. Public Health 2020, 2020, 7460356. [Google Scholar] [CrossRef] [PubMed]
  43. Trang, P.T.T.; Dong, H.Q.; Toan, D.Q.; Hanh, N.T.X.; Thu, N.T. The Effects of Socio-economic Factors on Household Solid Waste Generation and Composition: A Case Study in Thu Dau Mot, Vietnam. Energy Procedia 2017, 107, 253–258. [Google Scholar] [CrossRef]
  44. Vieira, V.H.A.D.M.; Matheus, D.R. The impact of socioeconomic factors on municipal solid waste generation in São Paulo, Brazil. Waste Manag. Res. J. Sustain. Circ. Econ. 2017, 36, 79–85. [Google Scholar] [CrossRef] [Green Version]
  45. Hidalgo-Crespo, J.; Moreira, C.; Jervis, F.; Soto, M.; Amaya, J.L. Development of Sociodemographic Indicators for Modeling the Household Solid Waste Generation in Guayaquil (Ecuador): Quantification, Characterization and Energy Valorization. In Proceedings of the European Biomass Conference and Exhibition, Marseille, France, 26–29 April 2021. [Google Scholar] [CrossRef]
  46. Hidalgo, J.; Crespo, T.; Coello, S.; González, Y. Household sustainable behavior evaluation and its relationship with socioeconomic indicators in the city of Guayaquil. In Proceedings of the LACCEI International Multi-Conference for Engineering, Education and Technology, Montego Bay, Jamaica, 24–29 July 2019. [Google Scholar] [CrossRef]
  47. Hidalgo-Crespo, J.; Coello-Pisco, S.; Crespo-Vaca, T.; Amaya, J.L.; Soto, M.; Jervis, F.X.; Moreira, C.M. Waste to energy potential of domestic waste cooking oil in Guayaquil: A review. In Proceedings of the LACCEI International Multi-Conference for Engineering, Education and Technology, Buenos Aires, Argentina, 27–31 July 2020. [Google Scholar] [CrossRef]
  48. Hidalgo-Crespo, J.; Coello-Pisco, S.; Crespo-Vaca, T.; López-Vargas, A.; Borja-Caicedo, D.; Martínez-Villacrés, H. Domestic waste cooking oil generation in the city of Guayaquil and its relationship with social indicators. In Proceedings of the LACCEI International Multi-Conference for Engineering, Education and Technology, Buenos Aires, Argentina, 27–31 July 2020. [Google Scholar] [CrossRef]
  49. Geissdoerfer, M.; Savaget, P.; Bocken, N.M.P.; Hultink, E.J. The Circular Economy: A new sustainability paradigm? J. Clean. Prod. 2017, 143, e757–e768. [Google Scholar] [CrossRef] [Green Version]
  50. Pieroni, M.P.P.; McAloone, T.C.; Pigosso, D.C.A. Business model innovation for circular economy and sustainability: A review of approaches. J. Clean. Prod. 2019, 215, 198–216. [Google Scholar] [CrossRef]
  51. Wan, C.; Shen, G.Q.; Yu, A. Key determinants of willingness to support policy measures on recycling: A case study in Hong Kong. Environ. Sci. Policy 2015, 54, 409–418. [Google Scholar] [CrossRef]
  52. Gómez, C.I.S. Problemática y gestión de residuos sólidos peligrosos en Colombia. Rev. Innovar J. 2000, 15, 41–42. Available online: https://revistas.unal.edu.co/index.php/innovar/article/download/24163/24792/84595 (accessed on 6 June 2022).
  53. Ortner, M.E.; Müller, W.; Schneider, I.; Bockreis, A. Environmental assessment of three different utilization paths of waste cooking oil from households. Resour. Conserv. Recycl. 2015, 106, 59–67. [Google Scholar] [CrossRef]
  54. da Silva César, A.; Werderits, D.E.; de Oliveira Saraiva, G.L.; da Silva Guabiroba, R.C. The potential of waste cooking oil as supply for the Brazilian biodiesel chain. Renew. Sustain. Energy Rev. 2017, 72, 246–253. [Google Scholar] [CrossRef]
  55. Sadaf, S.; Iqbal, J.; Ullah, I.; Bhatti, H.N.; Nouren, S.; Nisar, J.; Iqbal, M. Biodiesel production from waste cooking oil: An efficient technique to convert waste into biodiesel. Sustain. Cities Soc. 2018, 41, 220–226. [Google Scholar] [CrossRef]
  56. Foo, W.H.; Chia, W.Y.; Tang, D.Y.Y.; Koay, S.S.N.; Lim, S.S.; Chew, K.W. The conundrum of waste cooking oil: Transforming hazard into energy. J. Hazard. Mater. 2021, 417, 126129. [Google Scholar] [CrossRef] [PubMed]
Figure 1. Methodology for the quantification, characterization, data-factor analysis, and geospatial mapping.
Sustainability 14 09565 g001
Figure 2. The study area.
Sustainability 14 09565 g002
Figure 3. Household stratification by parishes, according to [21] INEC 2021.
Sustainability 14 09565 g003
Figure 4. Used materials for the fabrication of the artisanal decanter.
Sustainability 14 09565 g004
Figure 5. Household distribution classified by socioeconomic group.
Sustainability 14 09565 g005
Figure 6. The left image shows the distribution of UCO g/day/c in Guayaquil. The right image zooms in, showing the highest UCO generation parishes in red.
Sustainability 14 09565 g006
Figure 7. Generation of dUCO based on the social stratification of the population.
Sustainability 14 09565 g007
Figure 8. Generation of dUCO based on household size.
Sustainability 14 09565 g008
Figure 9. Generation of dUCO based on household income.
Sustainability 14 09565 g009
Figure 10. Generation of dUCO based on household head education level.
Sustainability 14 09565 g010
Figure 11. Generation of dUCO based on tenure status.
Sustainability 14 09565 g011
Table 1. Stratification of households’ samples by parishes.
ParishesExpected SampleActual SampleActual Household Stratification
Tarqui24516130.26%
Ximena12712623.68%
Pascuales1811020.67%
Febres Cordero808115.23%
Letamendi22264.89%
García Moreno12173.20%
Chongón
Urdaneta
Sucre
Ayacucho
Bolívar
Olmedo
Rocafuerte
9 de Octubre
Roca
Pedro Carbo
28112.07%
Total532532100.00%
Based on information obtained from [21] INEC (2021).
Table 2. The submitted household questionnaire (English translation and adaptation).
No.QuestionAnswers Allowed
1Age-
2SexMale; Female
3What is the level of education of the household head?Primary School; High School; Specialization/University; Master/Ph.D.; None
4Household Size1–2; 3–4; 5–6; > 6 people
5Socioeconomic GroupHigh (HSEG); Middle-High (MHSEG); Middle (MSEG); Middle-Low (MLSEG); Low (LSEG)
6Household Income<USD 390.00; USD 391.00–775.00; USD 776.00–1200.00; USD 1201.00–1750.00; USD 1751.00–2250.00; USD 2251.00–5000.00
7GPS Coordinates-
8Tenure StatusOwner; Tenant; User Does Not Pay Rent; Other
Table 3. Characteristics of the household sample (N = 532).
Demographic ValueNPercentage (%)
Gender of Surveyed People
Male21239.84
Female32060.15
Age of Household Head
<20 years366.77
21–25 years9517.86
26–30 years6612.41
31–35 years509.40
36–40 years5911.09
41–45 years5810.90
46–50 years458.46
51–60 years8215.41
>60 years417.71
Household Size
1–26311.84
3–428152.82
5–614527.26
>6437.26
Social Stratification
LSEG00
MLSEG5510.34
MSEG24145.30
MHSEG16531.02
HSEG7113.35
Household Income
<USD 390.007714.47
USD 391.00–775.0020237.97
USD 776.00–1200.0012723.87
USD 1201.00–1750.007614.29
USD 1751.00–2250.00387.14
USD 2251.00–5000.00122.26
Tenure Status
Owner41077.07
Tenant9016.92
Does Not Pay Rent203.76
Other122.26
Education of Household Head
Primary468.65
High school32661.28
Specialization/University14026.32
Master/Ph.D.183.38
None20.38
Table 4. Average dUCO per parish.
City ZoneMass (g/Day/c)Volume (mL/Day/c)Density (g/mL)
Tarqui4.515.420.87
Ximena3.794.360.87
Pascuales4.114.780.86
Febres Cordero3.984.570.87
Letamendi4.905.630.87
García Moreno6.347.370.86
Chongón
Urdaneta
Sucre
Ayacucho
Bolívar
Olmedo
Rocafuerte
9 de Octubre
Roca
Pedro Carbo
7.418.620.86
Total4.304.990.86
Table 5. Pearson correlation of the predictors for the entire sample size of 532 households (p-value).
MUCOHSSEGHITS
HS−0.422
(0.000)
SEG−0.0180.053
(0.660)(0.198)
HI0.0470.1000.448
(0.253)(0.015)(0.000)
TS−0.0750.0730.1590.154
(0.067)(0.074)(0.000)(0.000)
LE0.128−0.0870.3840.224−0.002
(0.002)(0.035)(0.000)(0.000)(0.961)
HS: household size; SEG: socioeconomic group; HI: household income; TS: tenure status; LE: level of education; MUCO: mass of domestic used cooking oil.
Table 6. Regression ANOVA analysis.
SourceSum of Squares.DFMean.F Valuep-Value
Model1368.775273.7529.240.000
HS1153.1111153.11123.170.000
SEG69.81169.817.460.007
HI49.06149.065.240.022
TS22.61122.612.420.121
LE35.96135.963.840.050
Residual5476.905859.36
Lack of Fit2296.9921810.541.220.051
Pure Error3179.903678.66
Cor Total6845.66
Publisher’s Note: MDPI stays neutral with regard to jurisdictional claims in published maps and institutional affiliations.

