Article

Impact of Earthing System Designs and Soil Characteristics on Tower Footing Impedance and Ground Potential Rise: A Modelling Approach for Sustainable Power Operation

by
Nur Alia Farina Mohamad Nasir
1,*,
Mohd Zainal Abidin Ab Kadir
2,
Miszaina Osman
1,
Muhamad Safwan Abd Rahman
1,
Ungku Anisa Ungku Amirulddin
1,
Mohd Solehin Mohd Nasir
3,
Nur Hazirah Zaini
4 and
Nik Hakimi Nik Ali
5
1
Institute of Power Engineering (IPE), Universiti Tenaga Nasional (UNITEN), Kajang 43000, Malaysia
2
Centre for Electromagnetic and Lightning Protection Research (CELP), Advanced Lightning, Power and Energy Research Centre (ALPER), Universiti Putra Malaysia (UPM), Serdang 43400, Malaysia
3
Faculty of Engineering, Universiti Pertahanan Nasional Malaysia, Kem Sungai Besi, Kuala Lumpur 57000, Malaysia
4
Power, High Voltage and Energy (PHIVE) Research Group, Faculty of Engineering and Built Environment, Universiti Sains Islam Malaysia, Bandar Baru Nilai, Nilai 71800, Malaysia
5
College of Engineering, Universiti Teknologi MARA, Shah Alam 40450, Malaysia
*
Author to whom correspondence should be addressed.
Sustainability 2021, 13(15), 8370; https://doi.org/10.3390/su13158370
Submission received: 17 June 2021 / Revised: 21 July 2021 / Accepted: 21 July 2021 / Published: 27 July 2021

Abstract

:
Improving a tower earthing system by reducing the impedance is an effective solution to prevent back flashover from occurring and thus maintaining the sustainable operation of power supply. Knowledge of the soil and earthing structure is an important element when designing an earthing system and to determine the parameters of a transmission line (TL). This paper presents the computation of soil structure interpretation based on several earthing designs using current distribution, electromagnetic interference, grounding, and soil structure analysis (CDEGS) software. The results showed that each tower has a multi-layer soil structure and it was also found that the soil resistivity at the surface layer strongly affected the earthing impedance. Subsequently, it was demonstrated that soil structure and the earthing design arrangement are the two parameters that significantly affected the ground potential rise (GPR). This aspect affects the resistance and impulse impedance of a tower and thus influences the performance of the TL system when subjected to lightning strike, which is undoubtedly one of the major culprits of power outages in Malaysia.

1. Introduction

Lightning has continued to be a major cause of disruption giving, rise to line outages in transmission systems. The TL is one of the main assets for power transfer in all countries and it is highly susceptible to lightning, especially those located in high lightning flash density. Each year, transmission line outages reported due to lightning are always the highest. In Brazil, for instance, a major cause of non-scheduled outages was reportedly lightning, which was responsible for 50% to 70% of the 230 kV lines outages [1,2]. Davis stated that lightning has probably been the most common cause of overhead lines flashovers [3]. Similarly, in Indonesia, 66% of 150 kV line outages were recorded due to lightning [4]. In Russia, 84.4% from total line outages on their 1150 kV line were due to lightning [5,6]. When lightning strikes directly to the tower, a high lightning current (typically in the order of greater than 20 kA for the case of backflashover [7,8]) will flow to earth through a shield wire installed along the tower and the impulse potential would be largely determined by the performance of the tower and earthing system. Whenever the potential exceeds the insulation strength, a backflashover (BFO) will take place along the insulator string [9,10,11,12]. Transmission system outage due to BFO is measured by the backflashover rate (BFR) and this will also reflect its performance [13]. To avoid this phenomenon, suitable lightning protection levels for TLs should be employed [14,15,16,17]. Typically, when involving such mechanisms and especially on an extra high voltage (EHV) line, improving the earthing system is the best mitigation to enhance TL lightning performance and it is one of the critical issues of concern for lightning protection for a power system. The purpose of the earthing system is to establish a safe and secure location for the electrical power system. The earthing system may be counted on to stay extremely near to zero voltage if the earthing resistance or impedance is low. Whatever is linked to the earthing system can possibly be raised to hazardous voltages if the earthing impedance is too high in the case of a lightning event [5,18,19]. Improving the earthing system to reduce the impedance of the tower footing is a common solution for overcoming BFO issues. Therefore, a good design of the earthing system is required to improve the operating reliability of the TL. Commonly, a high BFR is associated with high tower footing impedance coupled with high soil resistivity [20,21,22,23,24,25,26,27,28]. When designing the TL, the tower footing resistance (TFR) or impedance is the foremost parameter that should be considered [29,30,31,32]. Tower footing impedance change depends on many factors among which are the structure of the soil condition and the earthing design arrangement. These parameters typically must be less than the limit of the tower footing resistance or impedance required based on the requirements of the state-owned power utility. In Peninsular Malaysia, Tenaga Nasional Berhad (TNB) has fixed the tower footing resistance to be less than 5 ohm (Ω) and 8 ohm (Ω) for 500 kV and 132/275 kV lines, respectively [33]. Tower footing resistance or impedance values set by other countries are shown in Table 1.
The operation of a transmission system is strongly affected by the earthing. In fact, the earthing plays a significant role in the lightning response of these systems [38]. The response of soil and buried electrodes when subject to lightning is very different from the low frequency caused by the wideband frequency content of a lightning impulse [39]. Previous work by He et al. [40] shows that the electrode impedance starts to deviate from the low-frequency resistance at frequencies above 1 to 10 kHz. A further contribution to the change in impedance is the frequency dependence of the soil parameters, which results in a reduction in the dissipation resistance [39]. The attenuation, propagation, and distortion of current pulse injected onto one end of the earthing electrode is greatest in low resistivity soil and it also becomes greater at higher frequencies because of the frequency dependence of the soil resistivity [41,42,43]. Most of the previous works have focused on conventional modelling in which the magnitude of the tower impedance is only varied by the lightning current impulse through the earth electrode and there has been much research on earthing behaviour in uniform soil, the top layer depth of soil, and algorithm and reflection parameters [44,45,46,47,48]. Various studies were based on a variety of assumptions and physical techniques, resulting in the development of numerous equations over the last few years. To the authors’ knowledge, however, although mitigations were provided by many researchers in addressing these issues, there were not many analyses available based on the actual design and implementation at 500 kV towers, which are significantly different in terms of topography, types of soil, and earthing arrangement which includes the number of electrodes and how the impact of earthing design varies in different soil conditions on earthing system behaviour during high frequency. Having said that, there are many contributions available on the effect of soil around the earth electrode during a lightning phenomenon, namely on the frequency dependence of the soil parameter i.e., resistivity ( ρ ), permittivity (ε), and permeability (µ) [23,39,49]. The proposed method by Pappas et al. [19] based on the autoregressive moving average (ARMA) model, via off-line fitting on the actual data using the corrected Akaike information criterion (CAIC), for instance, provided the solution to deal with variation of the earthing resistances. In general, many guidelines and technical documents on lightning performance studies are available both for the transmission [9,11,50,51,52] and distribution lines [53,54]. Therefore, this paper intends to complement and focus on the following:
  • Interpreting the soil structure characteristics according to the selected 500 kV towers;
  • Evaluating tower footing impedance subjected to lightning stroke; and
  • Determining the frequency dependence behaviour of an earthing system under high frequency.
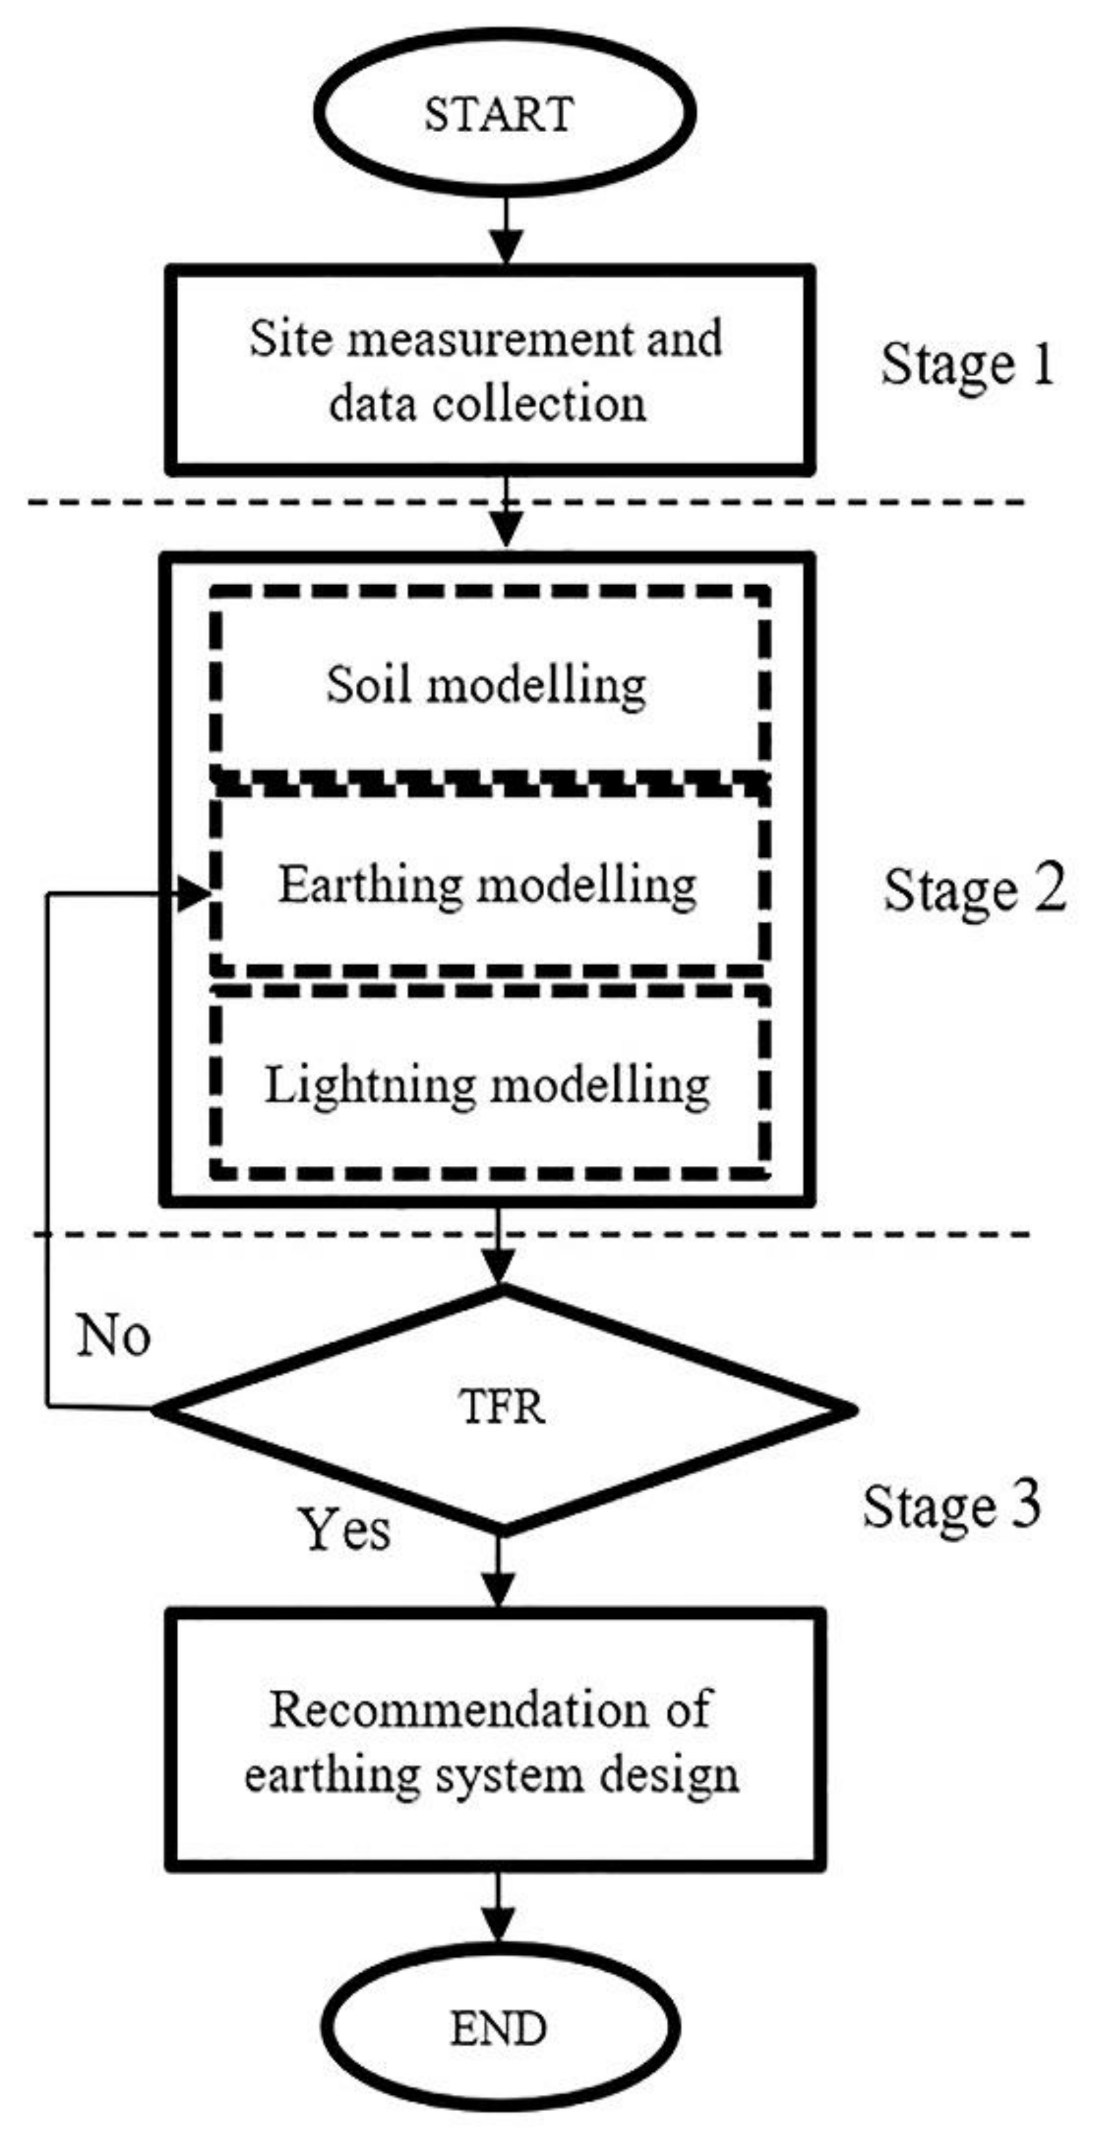
2. Methodology

The framework of this study comprised the various stages of the entire process to achieve the purpose of the study. It consisted of three stages, namely site measurement and data collection, modelling and simulation work, and results analysis. In Stage 1, the apparent resistance of the soil data were collected at B area for tower T40, tower T41, tower T44, tower T45, tower T46, and tower T49. Stage 2 involved the modelling and simulation process which used CDEGS software to conduct the modelling work in this study. Finally, after successful modelling, the simulation result showed the improved TFR value of a suitable earthing system design to be recommended for improving the performance of a 500 kV transmission line based on per real soil data in Malaysia. A reduced TFR following the TNB requirement and a suitable earthing system design will be recommended. Figure 1 summarises the overall research flowchart.
Specifically, there are three modelling designs in this study, soil modelling, earthing modelling, and lightning modelling. The process of all the modelling involves many sequential steps. All modelling simulations were carried out using the Safe Engineering Services & Technologies Ltd. (SES)—computer-aided design (SESCAD) tool known as current distribution, electromagnetic interference, grounding, and soil structure analysis software (CDEGS). CDEGS is used to model and interpret the measured data from the field, namely soil structure and earthing system impedance [55]. Since 1978, Safe Engineering Services and Technologies (SES) has been regarded as an undisputed world authority for the effects of soil on the connexion between electrical installations and other utilities such as gas and oil pipelines, as well as the communications and railway electrification industries. The CDEGS software is superior and constitutes a powerful collection of integrated engineering software tools designed to model the field measurement (i.e., soil profile and earthing system resistance) and interpret the measured data amongst others. Specifically, two computation modules in CDEGS are used in this study, namely the RESAP module and the HIFREQ module. This is the primary interface used for data entry, calculation execution, and result analysis. The first step of this study was to evaluate a soil model equivalent to the real soil structure using the soil resistivity analysis (RESAP) module from SES. Based on the equivalent soil model developed in the first step, the earthing system configuration was built and analysed using the SES electromagnetic fields analysis HIFREQ earthing analysis computation module. Next, the SES transient tools were used as an implementation strategy during lightning conditions. This section also presents a case study illustrating how to create and analyse a proper soil and lightning model simulation. Subsequently, the earthing system performance was determined by looking at the earthing impedance under lightning behaviour conditions. A case study was conducted and the results are presented in the next section.

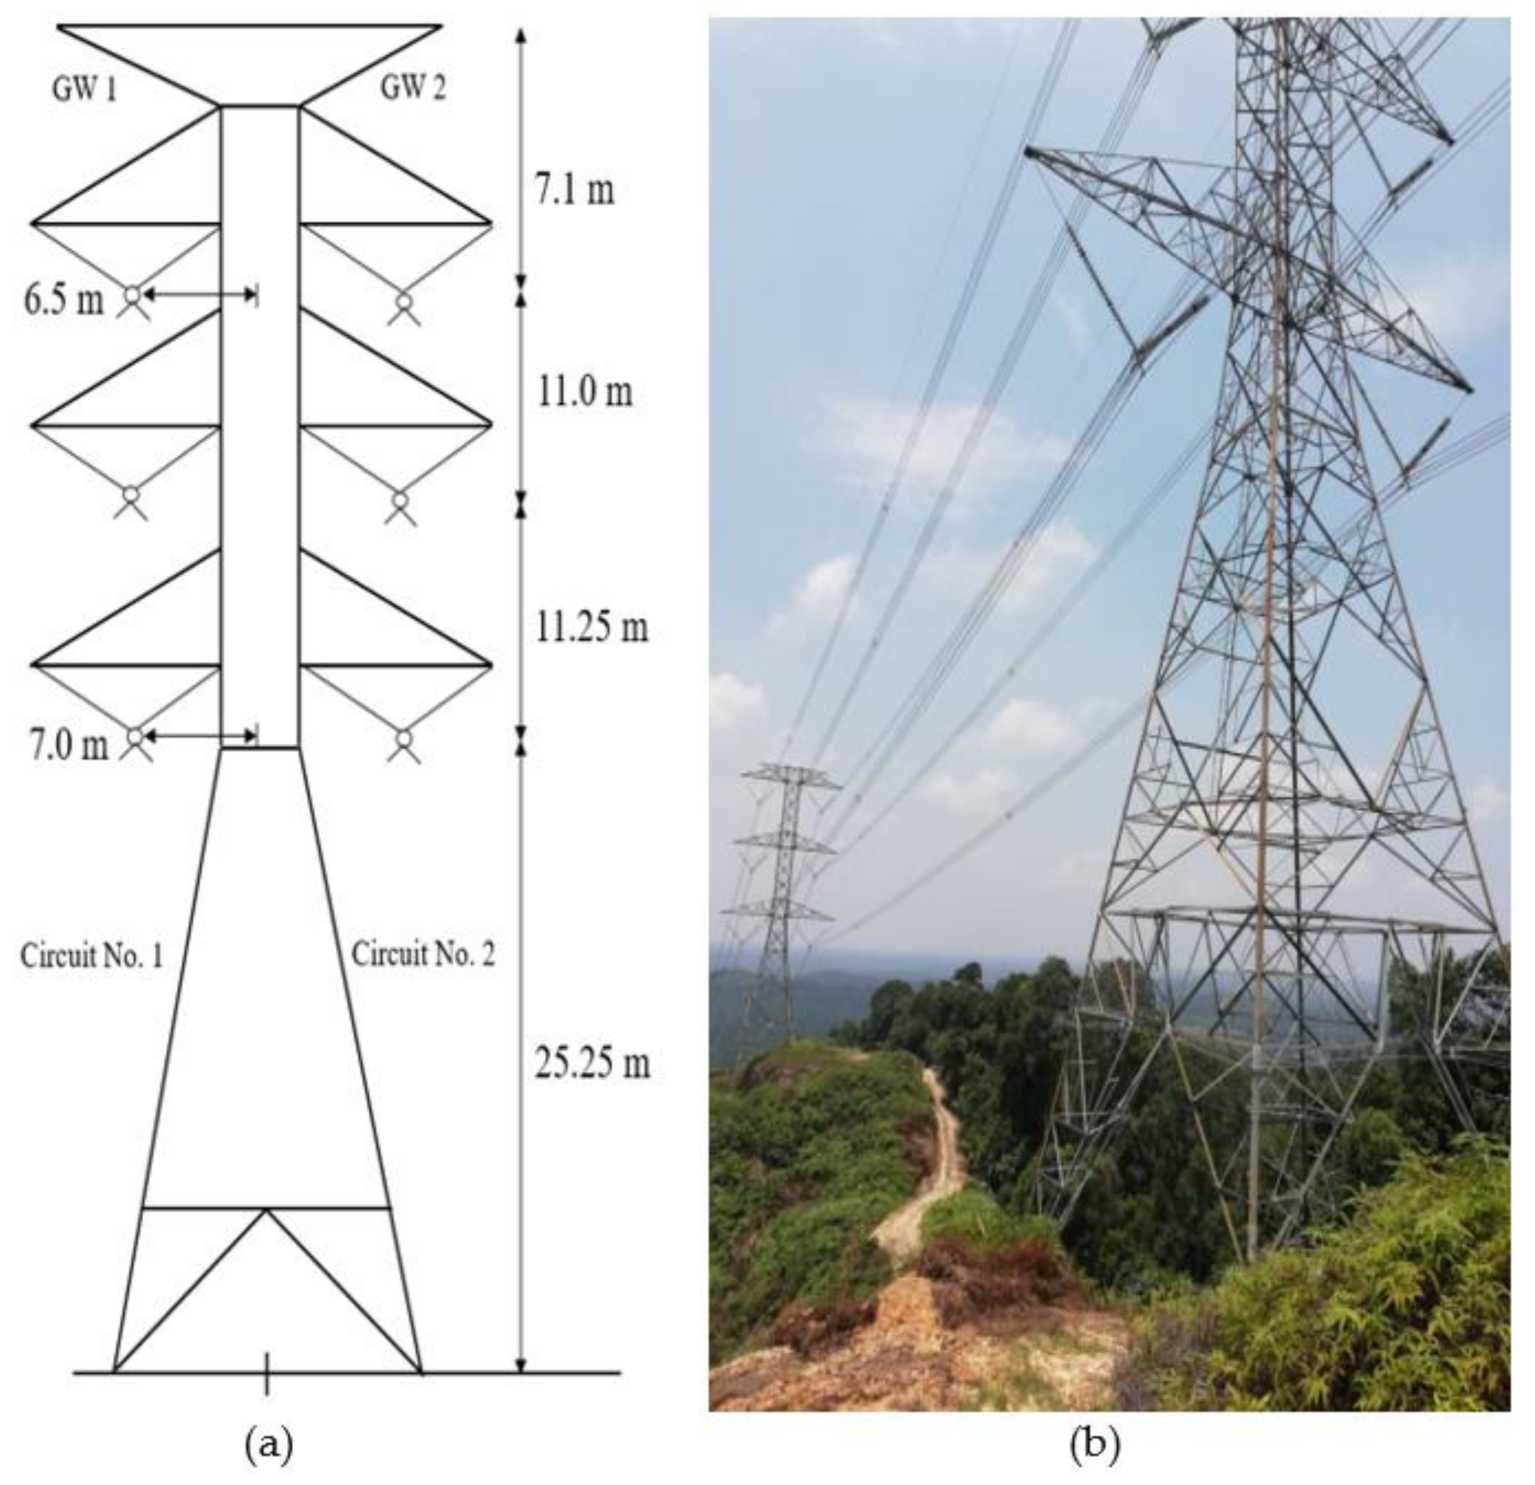
2.1. Real Case in Malaysia
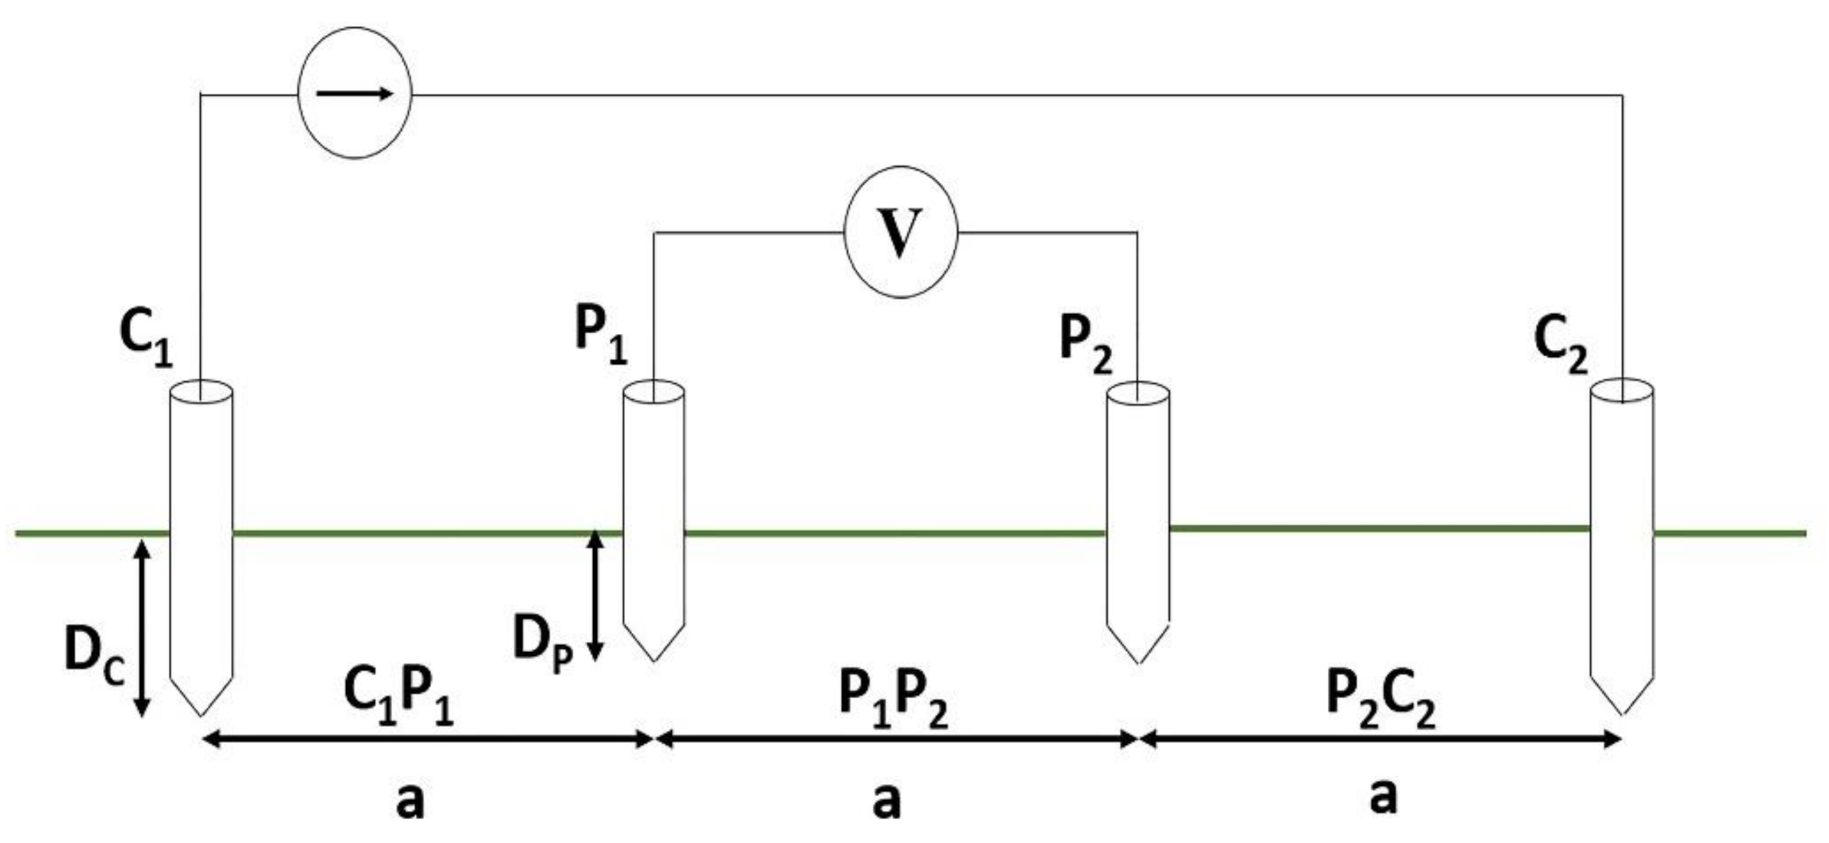
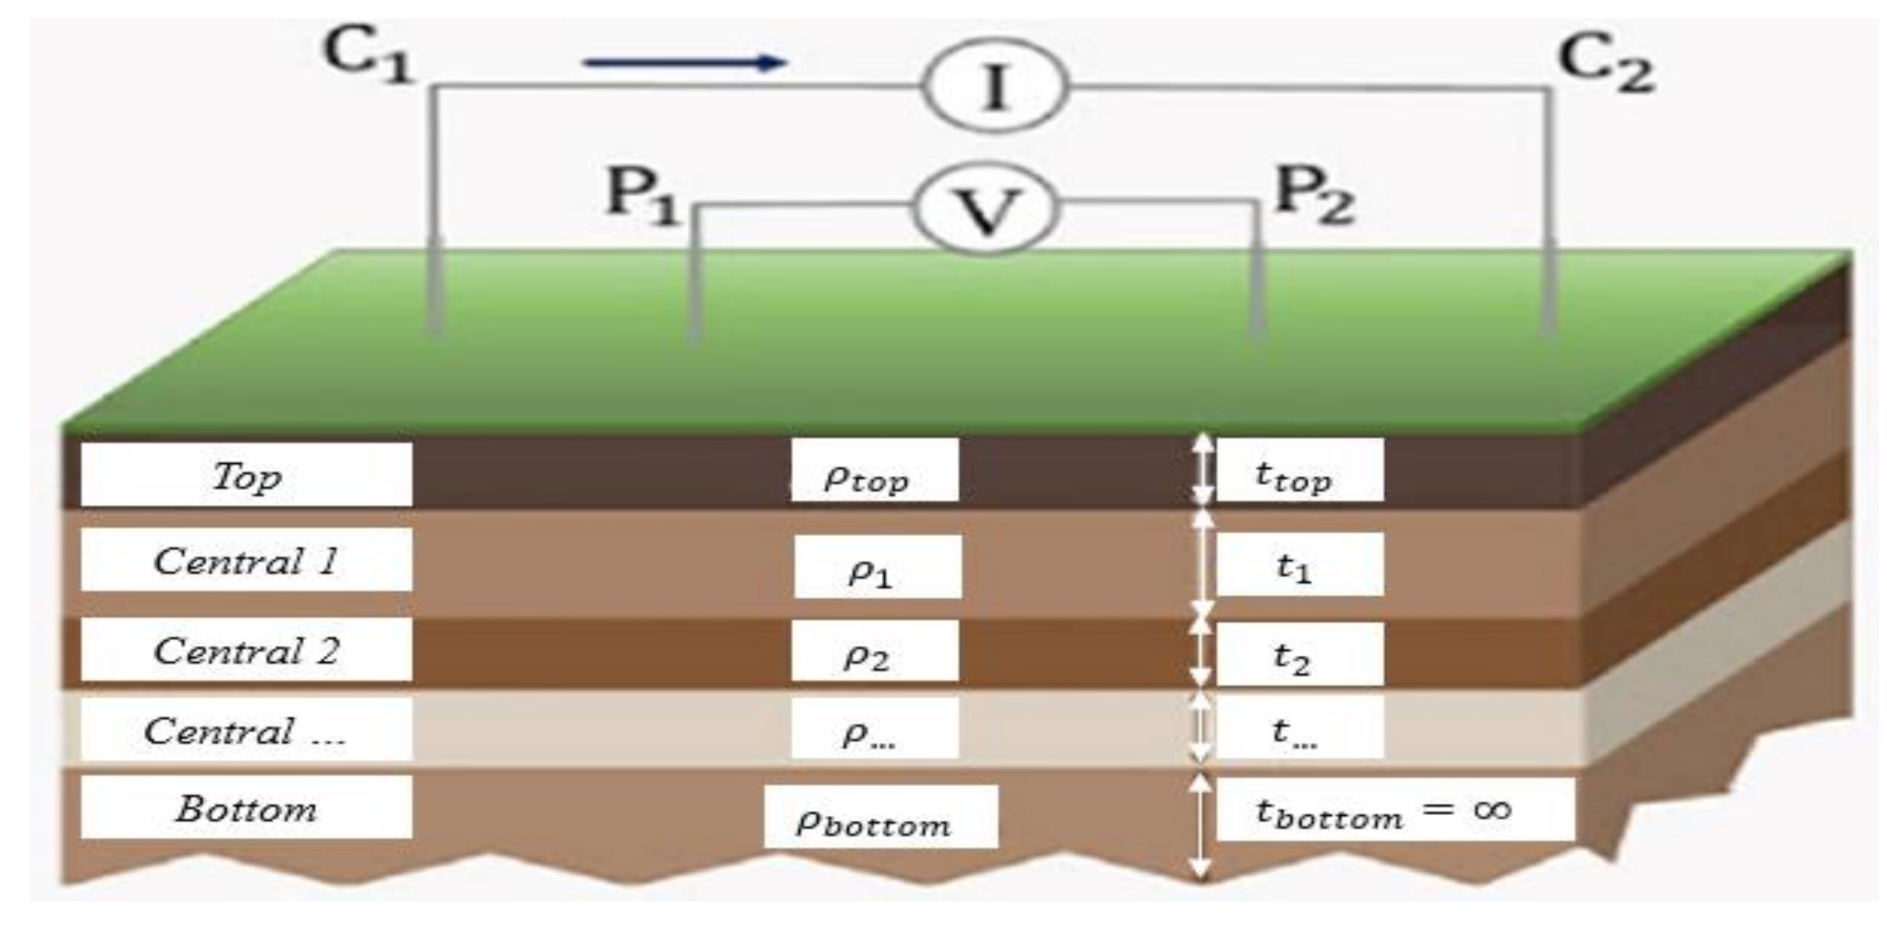
In this study, a 500 kV double circuit connecting line from A to B with 146.688 km and consisting of 351 towers was selected considering that this particular line recorded a high number of outages compared to other 500 kV lines in Malaysia during 2018. About 30% of the line located in this area is at a high altitude with a higher tower footing impedance due to the high altitude soil structure [52,56]. A study by the Malaysia Energy Supply Industry reported a load loss value of RM 10.47 per kWh per interruption of the network. Thus, with an average load of 994 MW on the B line from TNB NORM for the 500 kV A line, the expected energy loss could be as high as RM 10,407,180.00 per hour [57]. Basically, 500 kV towers consist of a two-earth wire design on the top with a height of around 46 m to 67 m. In this study, the methodology interpreted the characteristics of the soil model on a real case involving five towers in a 500 kV double-circuit line. Figure 2a shows the dimensions of a 500 kV transmission tower and Figure 2b shows the location of the 500 kV double circuit line from A to B.

2.2. Soil Modelling

The study began with the creation of a comprehensive soil model by using the RESAP computation module. RESAP is dedicated to developing an equivalent soil structure model based on soil resistance measurements [58]. In detail, RESAP is dedicated to designing and interpreting analogous earth profile models based on soil resistivity or apparent resistance data as measured. It can produce models with several horizontal layers and soil models that are both vertically and exponentially layered. The soil resistivity analysis module RESAP was used in this study to classify comparable horizontally layered soils based on the site measurements. The soil model is a methodology designed to mathematically describe the local soil profile for designing an earthing system. The soil has generally been considered uniform or homogenous, but in fact, it is usually multilayer soil. This is due to a geological feature allowing the soil type to differ from location to location and the existence of bedrock or groundwater as a function of depth that results in a significant change in resistivity. To develop detailed soil modelling in this study, apparent resistance data from the field site were made available by TNB. Table 2 shows the average of the apparent resistance (Ω) value that was determined as a final answer from a site measurement traverse whereby TNB took three measurements to acquire a good indication [59]. Figure 3 illustrates the Wenner method as a good technique to measure the apparent resistance as this method is the most used. A set of readings with increasing probe spacing during testing was employed to obtain an estimate of the resistance of the deeper layers [60]. Subsequently, the field data values were entered as input to the RESAP module of the CDEGS software and analysed by selecting the Wenner method during simulation to determine the soil structure [55]. Figure 4 shows a cross-section of the Wenner method computation in RESAP.

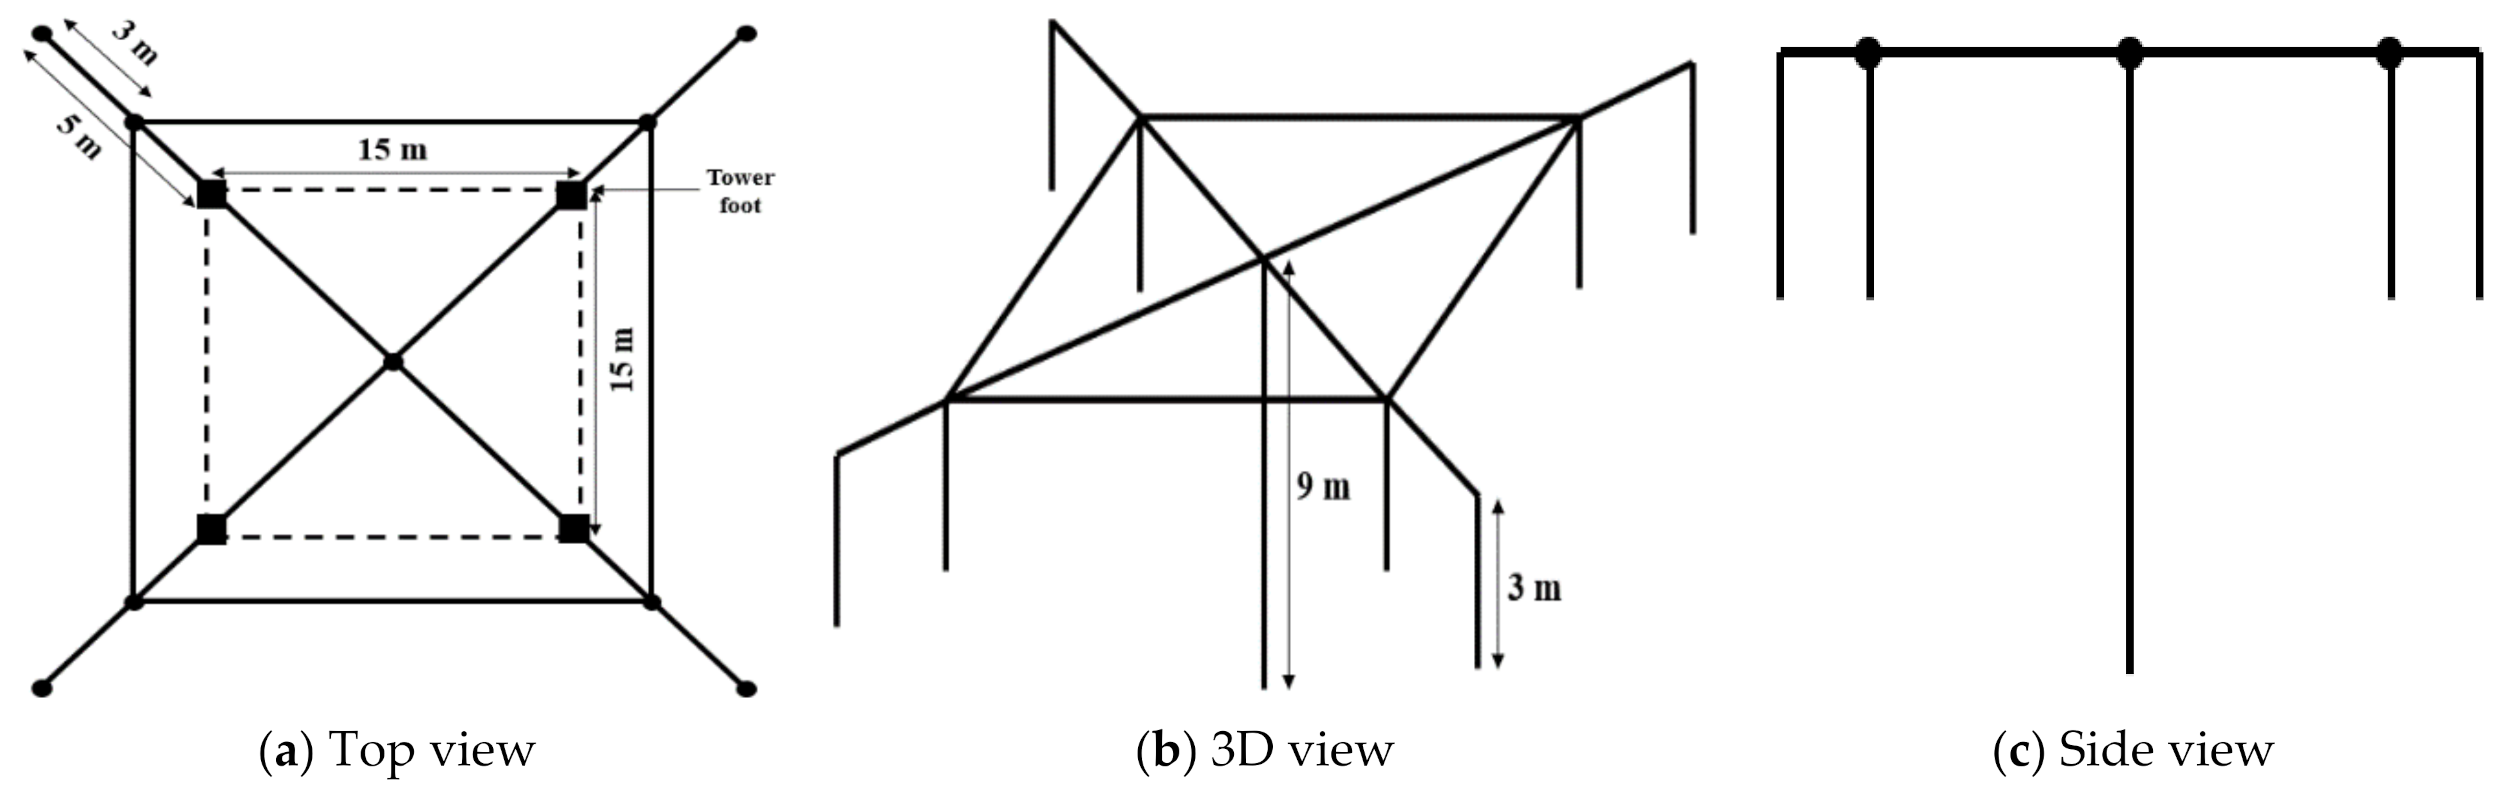
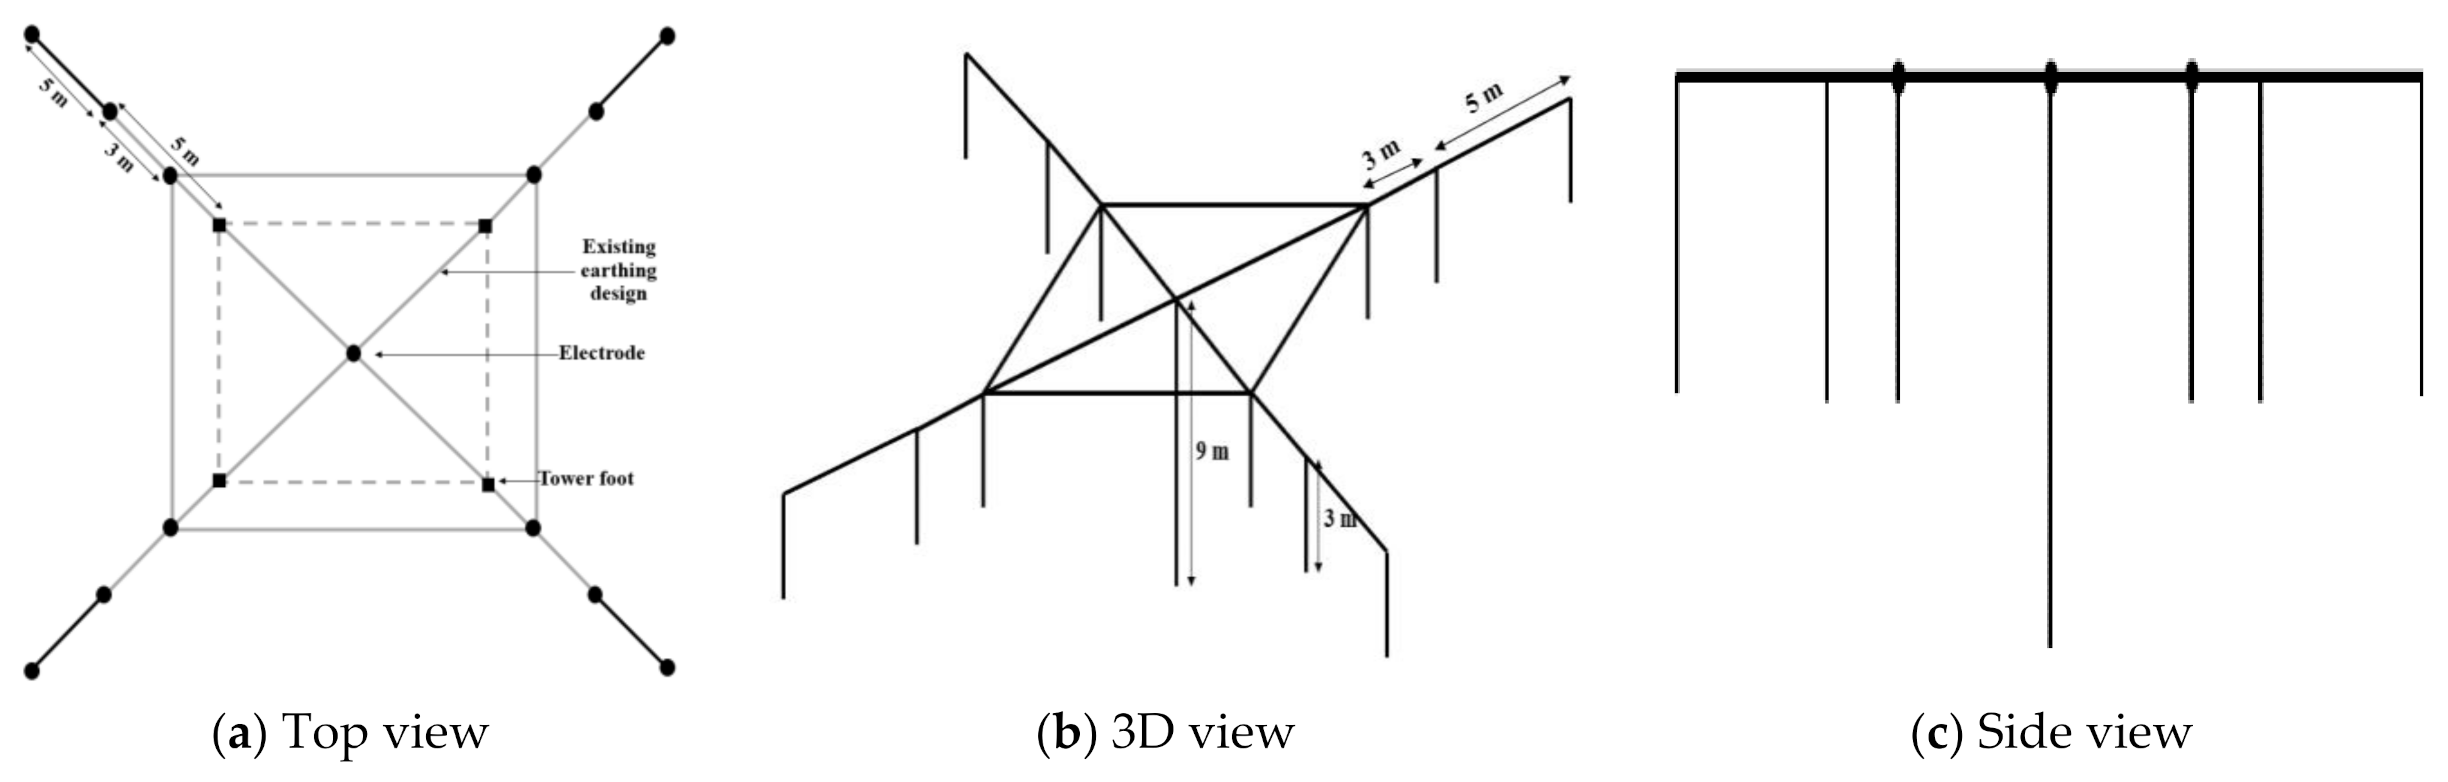
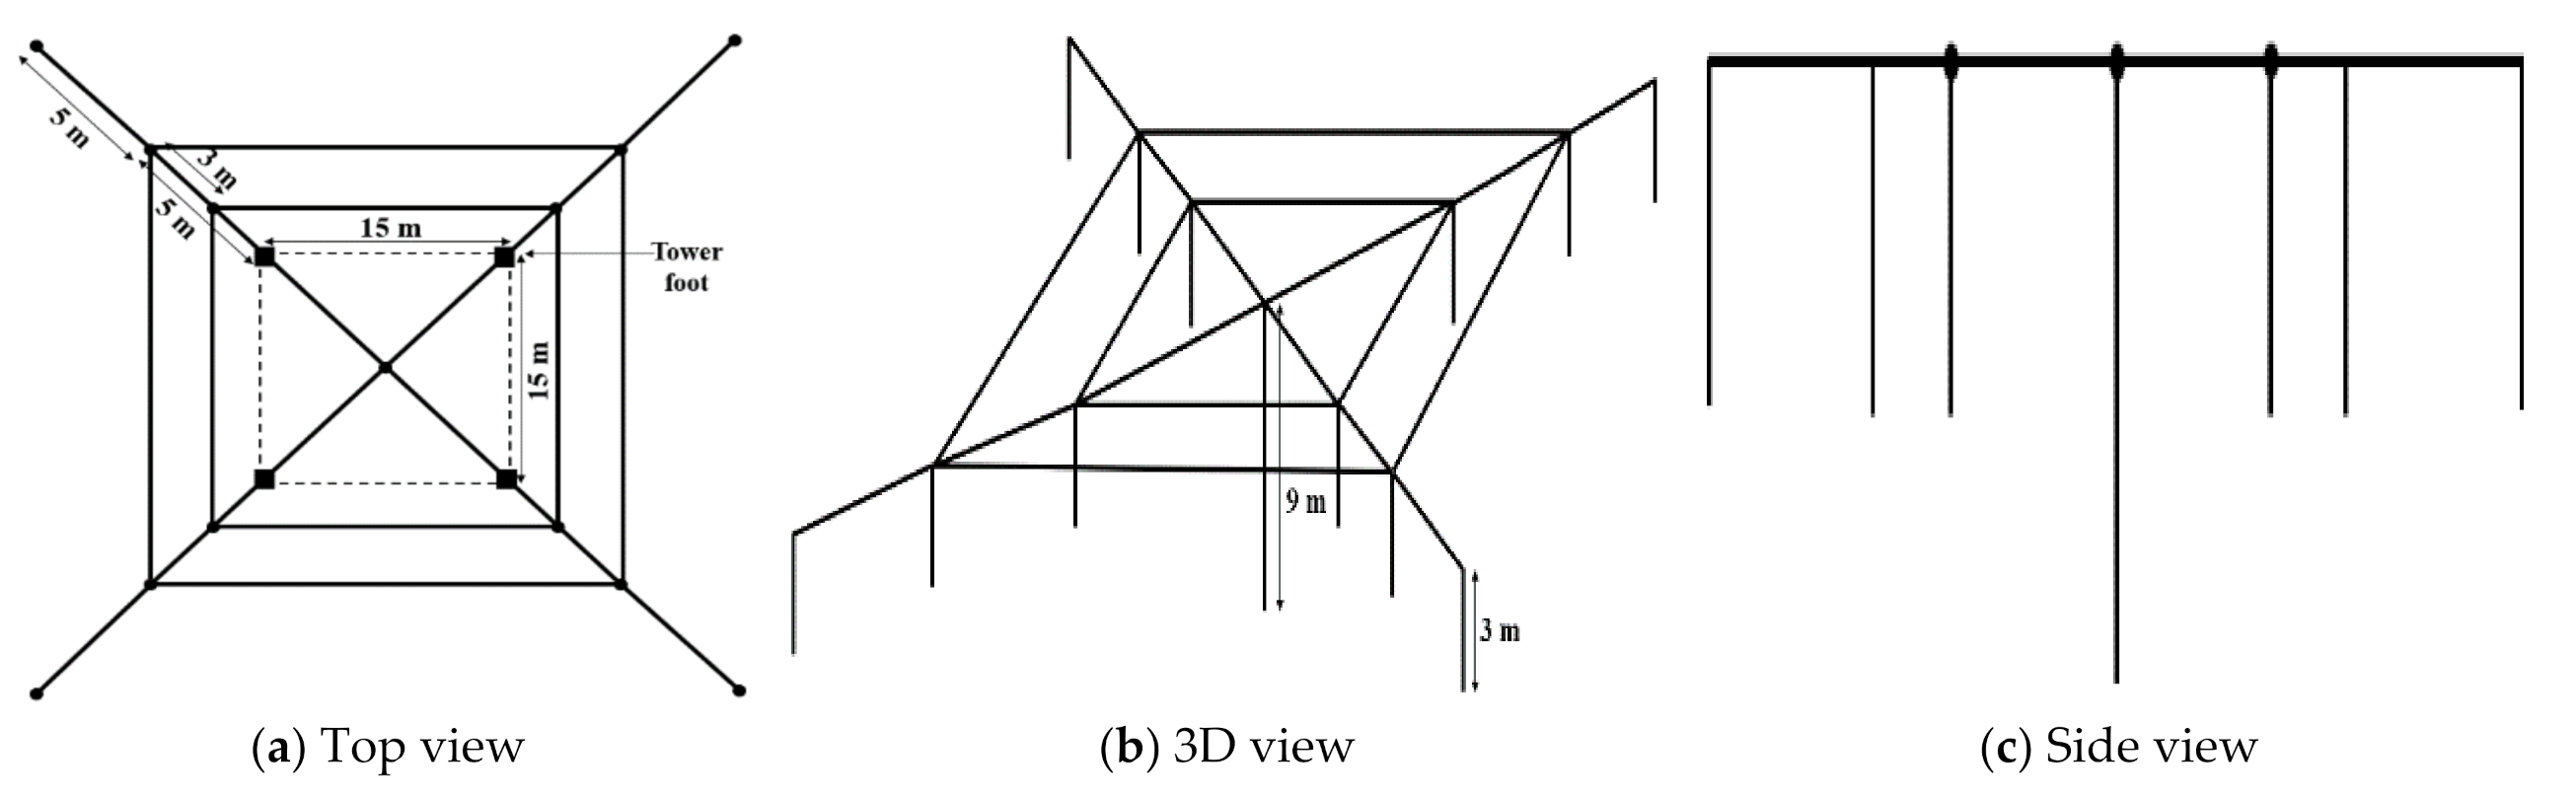
2.3. Earthing System Modelling

The earthing system design of a TL has a major impact on the number of outages due to lightning strikes. The configuration of an earthing system may have different geometries such as the grid concept, vertical and horizontal electrodes, or a combination of these configurations which is necessary to ensure the safety of people nearby and of electrical equipment. Specifically, two effects occur in the soil during a lightning impulse discharge through the earthing electrodes, namely soil ionisation and soil parameter frequency dependence [61,62,63]. However, this study focused on the frequency dependence of soil resistivity and the soil ionisation caused by the high impulse current injected into the earthing system was neglected. In this section of the study, three designs (Design A, Design B, and Design C) of an earthing system were evaluated to seek a good design for future earthing system design. Subsequently, all three of these designs were compared and the effect of the earthing system design was analysed to improve the lightning performance. The earthing system modelling was designed using SESCAD and executed in the HIFREQ module of the CDEGS software to obtain the earthing impedance. Figure 5 illustrates Design A of an earthing system whereby it would be recommended for medium soil resistivity on a site. This design formed the tower base as a square of a 15 m × 15 m ring extending 5 m of stranded copper cable and 9 electrodes embedded 10 feet deep into the earth. The burial depth of the electrodes was 0.5 m from the surface and made from stranded copper with a radius of 6.35 mm (or 0.00635 m).
Subsequently, Design B would be recommended for high soil resistivity conditions as shown in the model in Figure 6 with 5 m of stranded copper cable extending from Design A and 13 electrodes embedded 3.048 m length into the earth. The burial depth of the electrodes was 0.5 m from the surface and made from stranded copper with a radius of 6.35 mm (or 0.00635 m).
Figure 7 shows Design C, which would be recommended for very high soil resistivity conditions on site. This design formed an upgrade from the second design which had an additional stranded copper cable around the base tower with 13 electrodes which were buried in the soil at 0.5 m depth and made from stranded copper with a radius of 6.35 mm (or 0.00635 m).

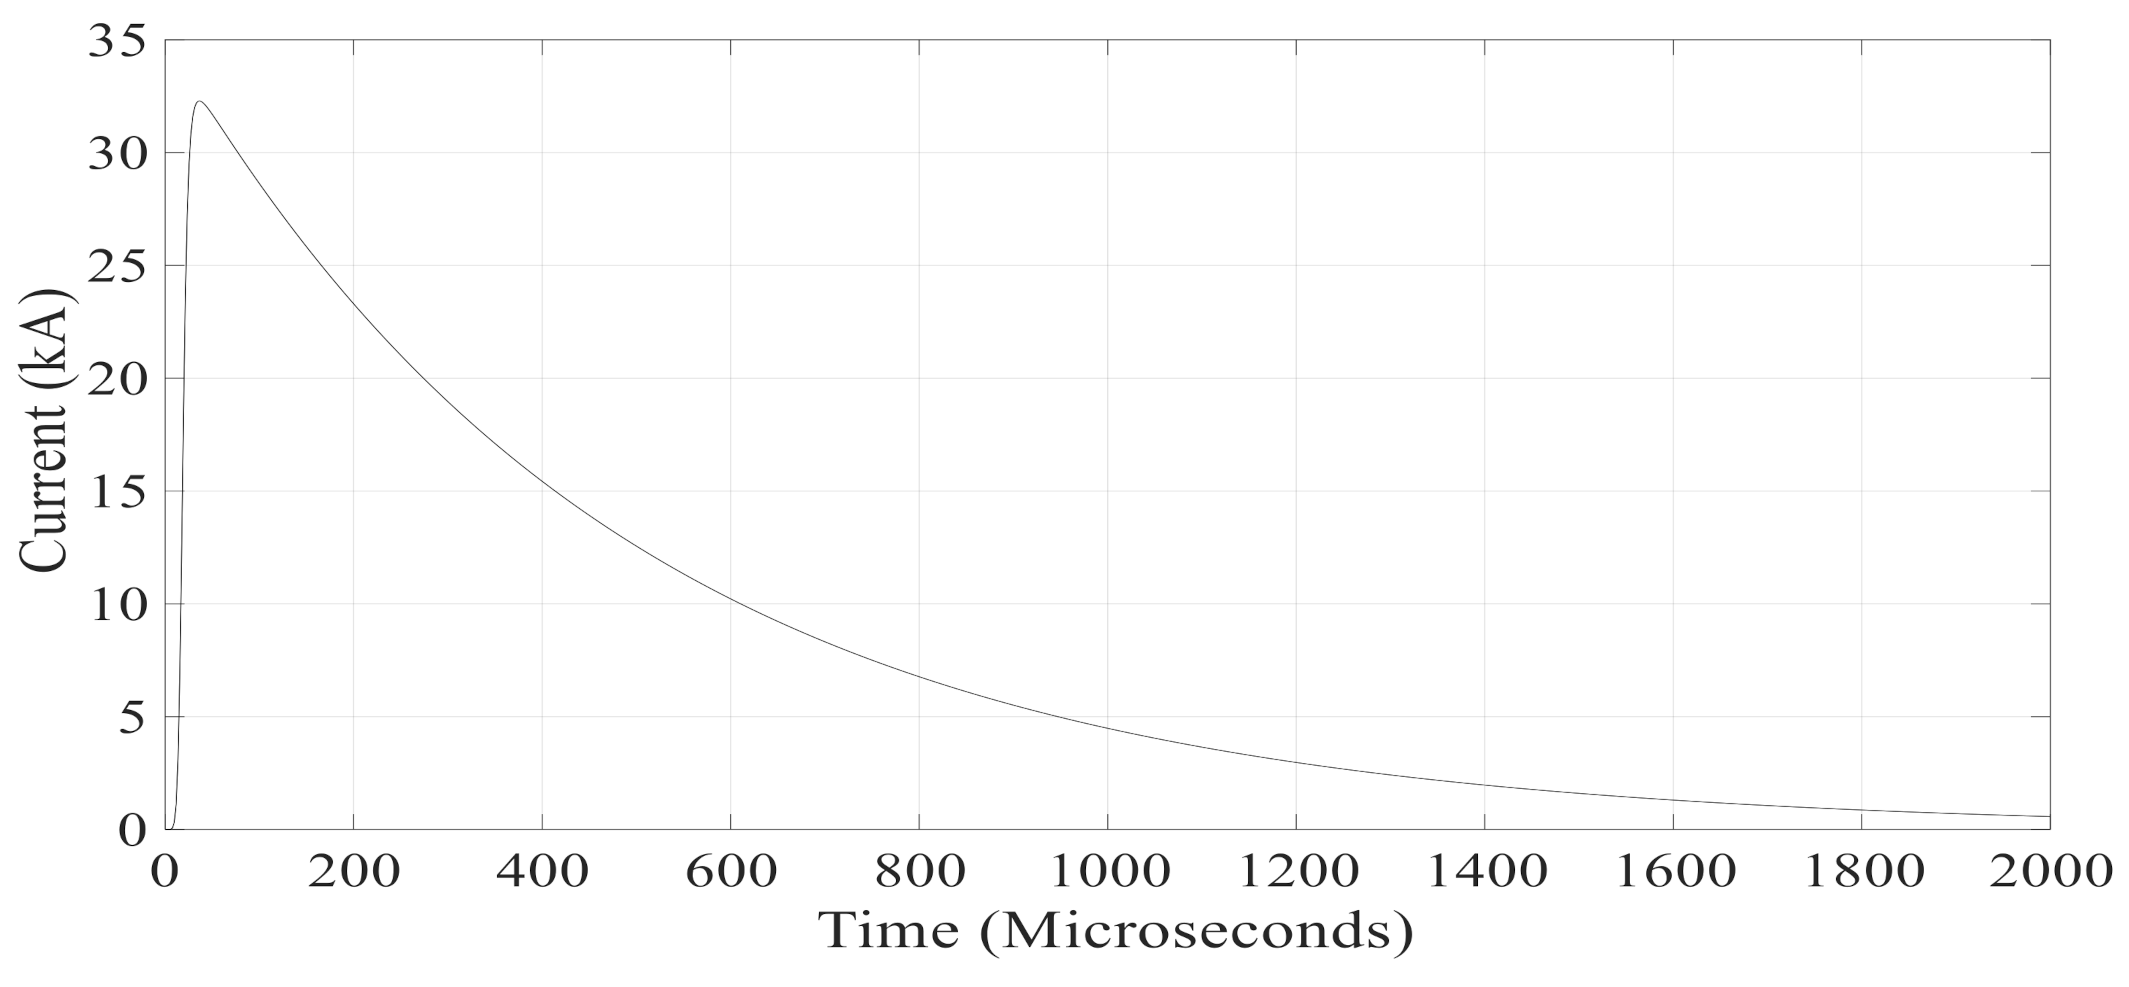
2.4. Lightning Modelling

The earthing system design of a TL has a major impact on the number of outages due to lightning strikes. A special signal transient type of Heidler function is recommended by IEC 62305-1 Ed. 2 [64] and selected in this study. The Heidler function has the advantage of representing a lightning current because it more realistically approximates the properties of a real lightning return stroke. At the start, the Heidler function does not have a discontinuity and it allows a good separation of the characteristic lightning current quantities [65]. The Heidler function equation is shown in Equation (1):
f t = I η   · t / τ n 1 + t τ 1 n   ·   e t / τ 2
where,
η = e t / τ 2   ·   n τ 2 τ 1 1 / n
The 10/350 µs waveform is used to represent the conducted lightning current and can be approximated by the Heidler function. Its waveform is used to characterise the current waves from a direct lightning strike. The signal transient was executed in the SEStransient tool of CDEGS to compute the forward and inverse fast Fourier transform (FFT). Table 3 represents the Heidler function parameters of the 10/350 µs waveform used with a time duration of 2000 µs and input of lightning impulse wave 10/350 µs by CDEGS is shown in Figure 8.

3. Results

This section presents the soil structure interpretation of the earthing design according to selected towers in Peninsular Malaysia. Other than that, the computation of the tower footing impedance and ground potential rise (GPR) simulated by using soil structure is also represented in this section, followed by a frequency domain computation.

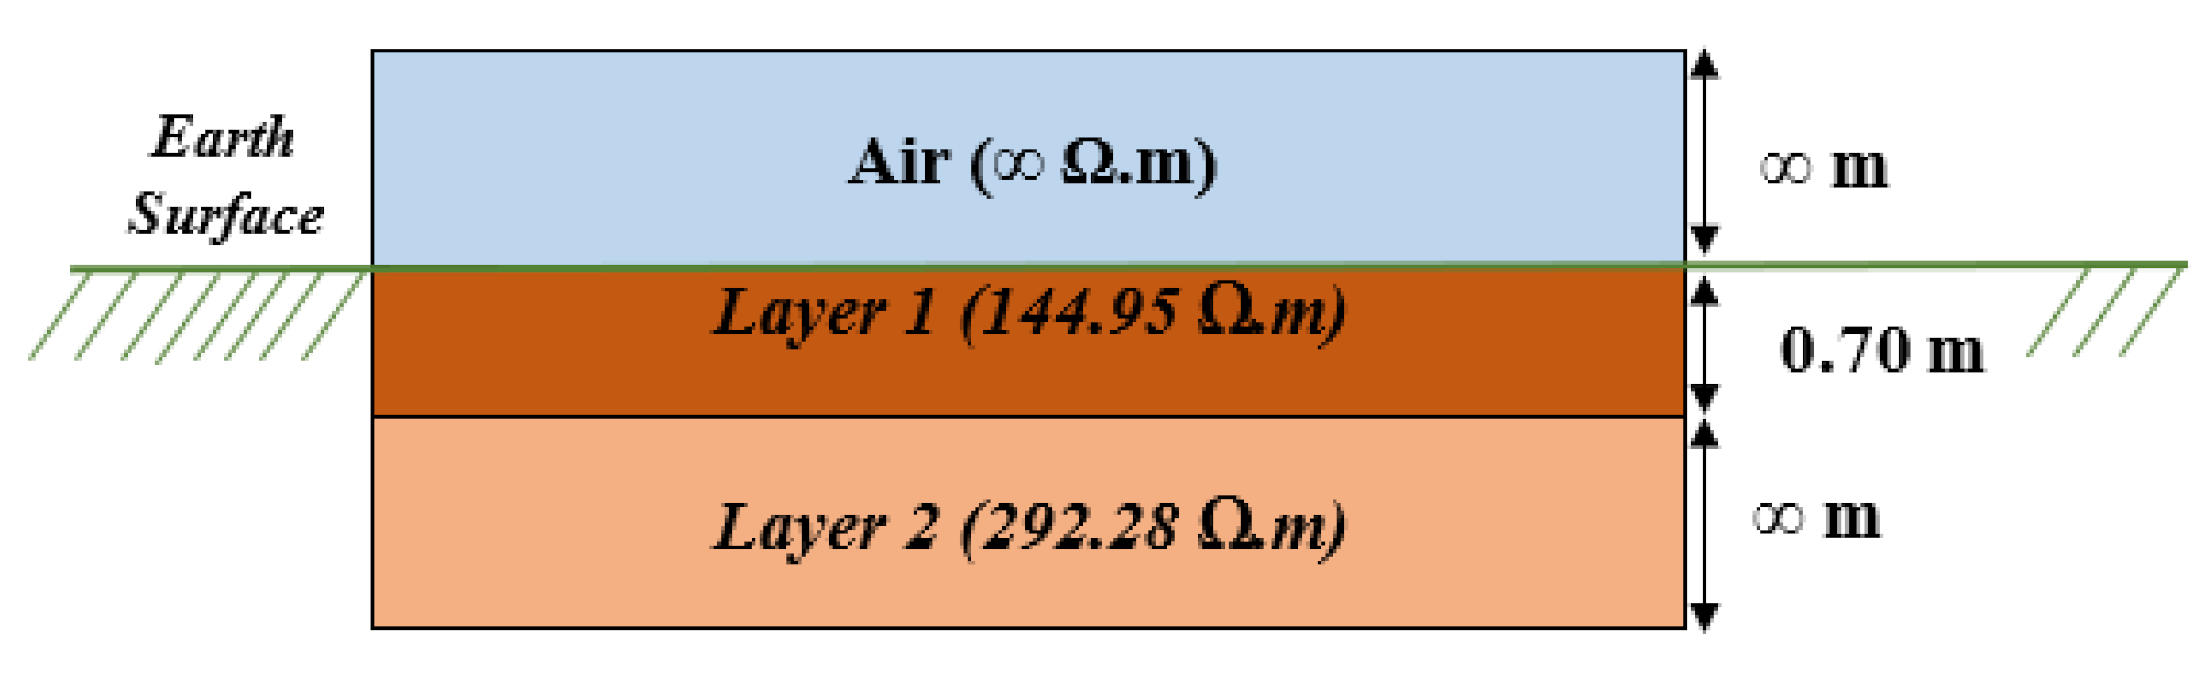
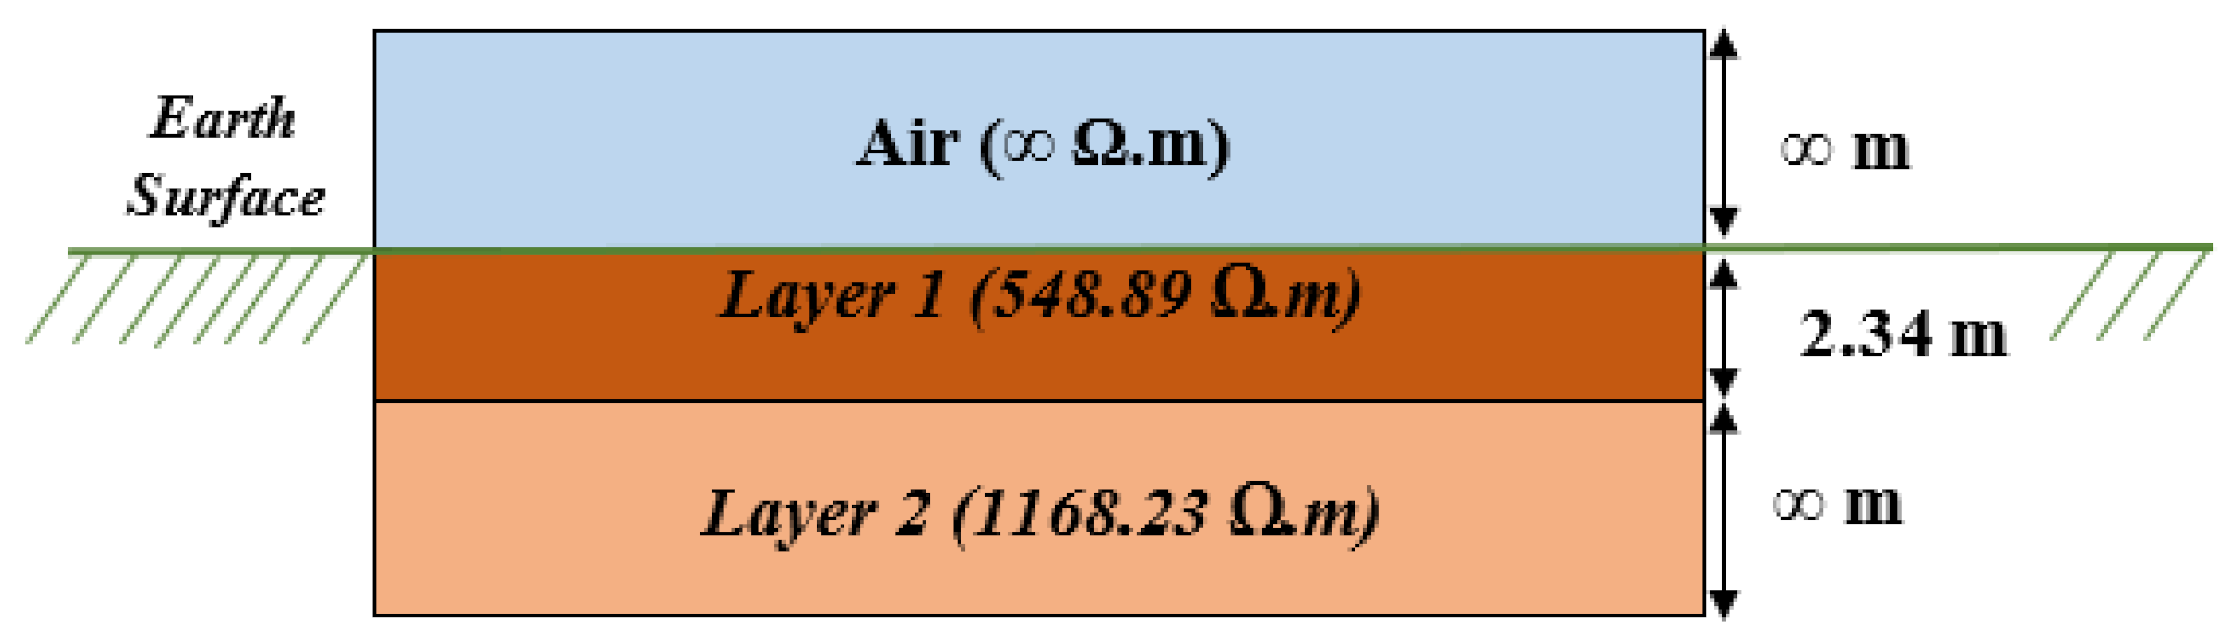
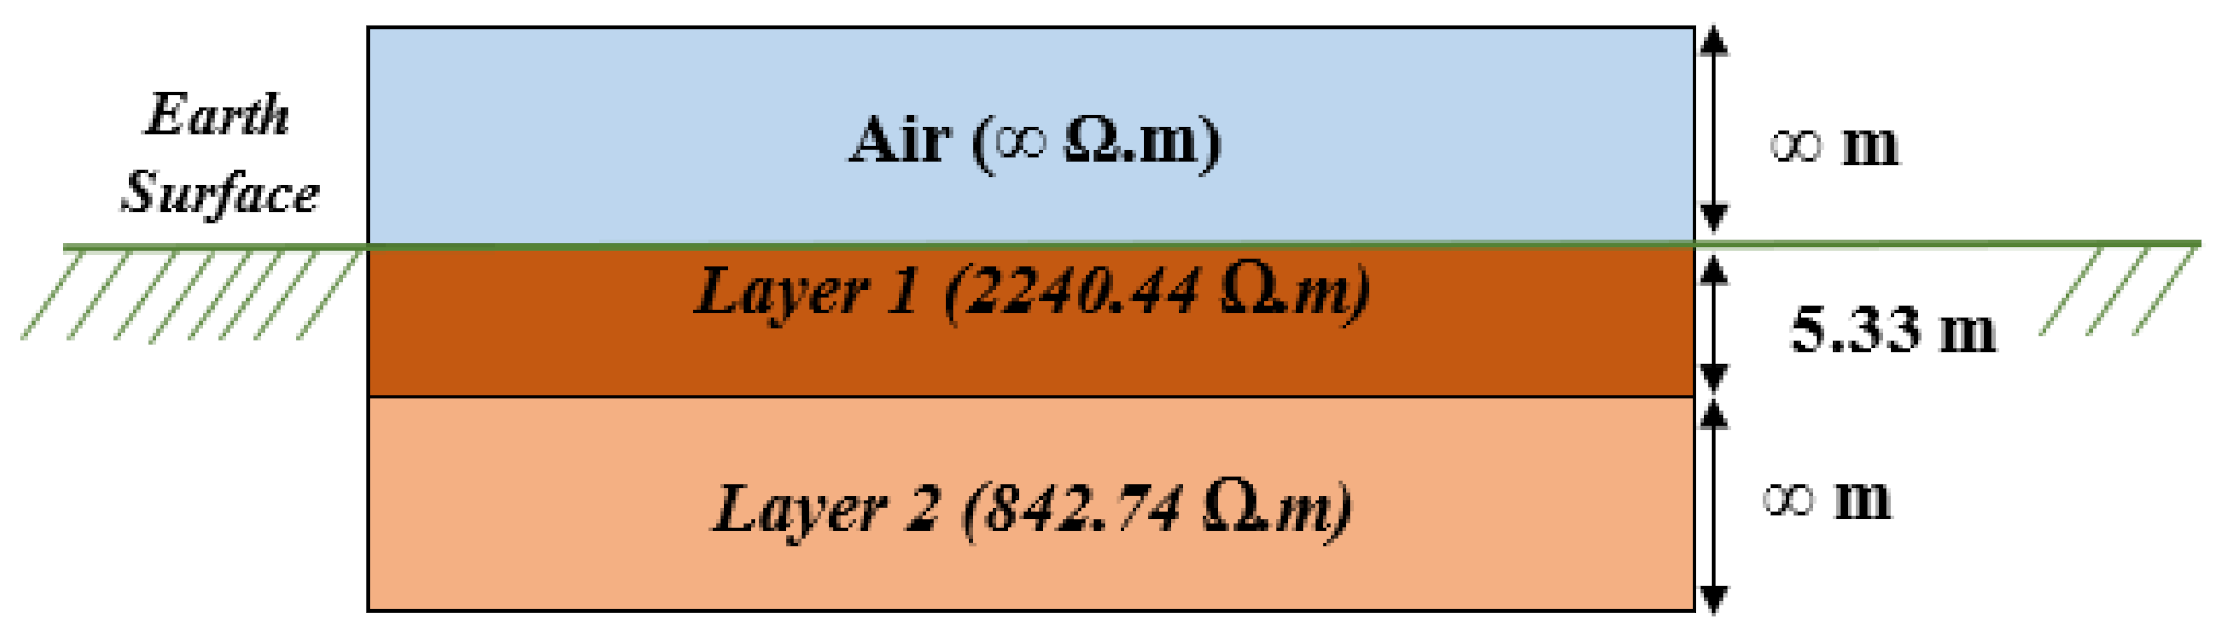
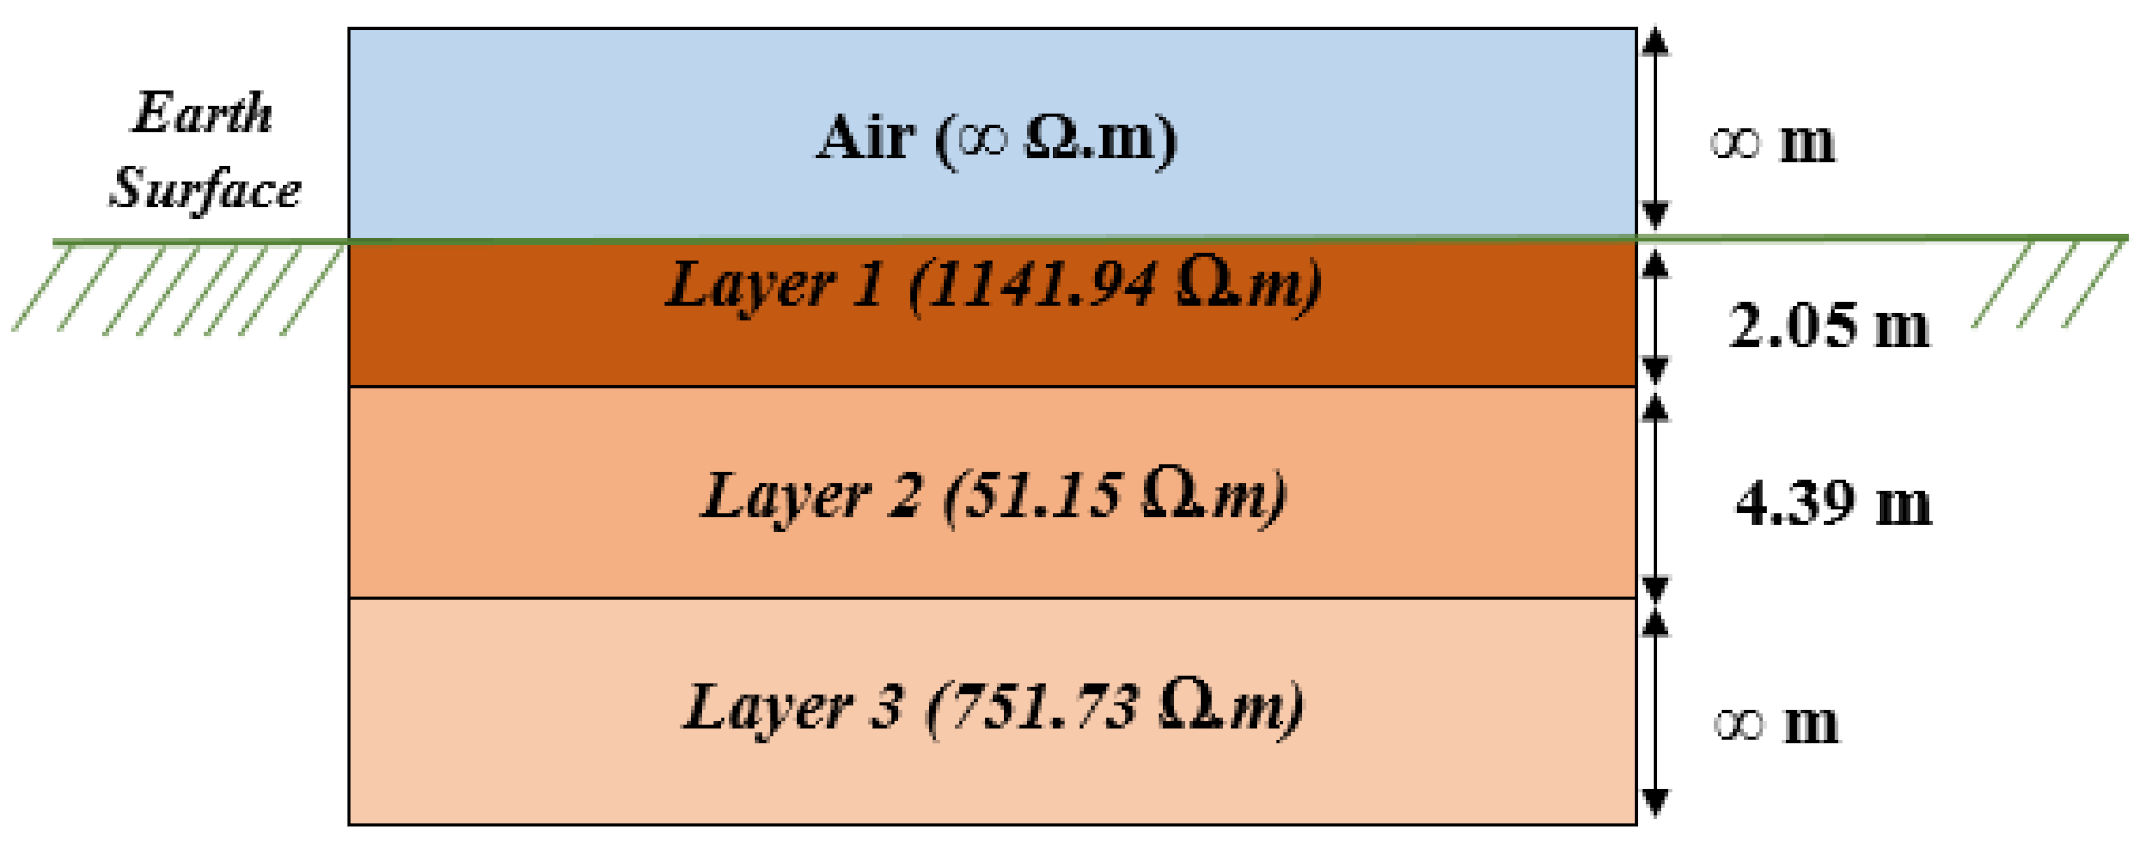
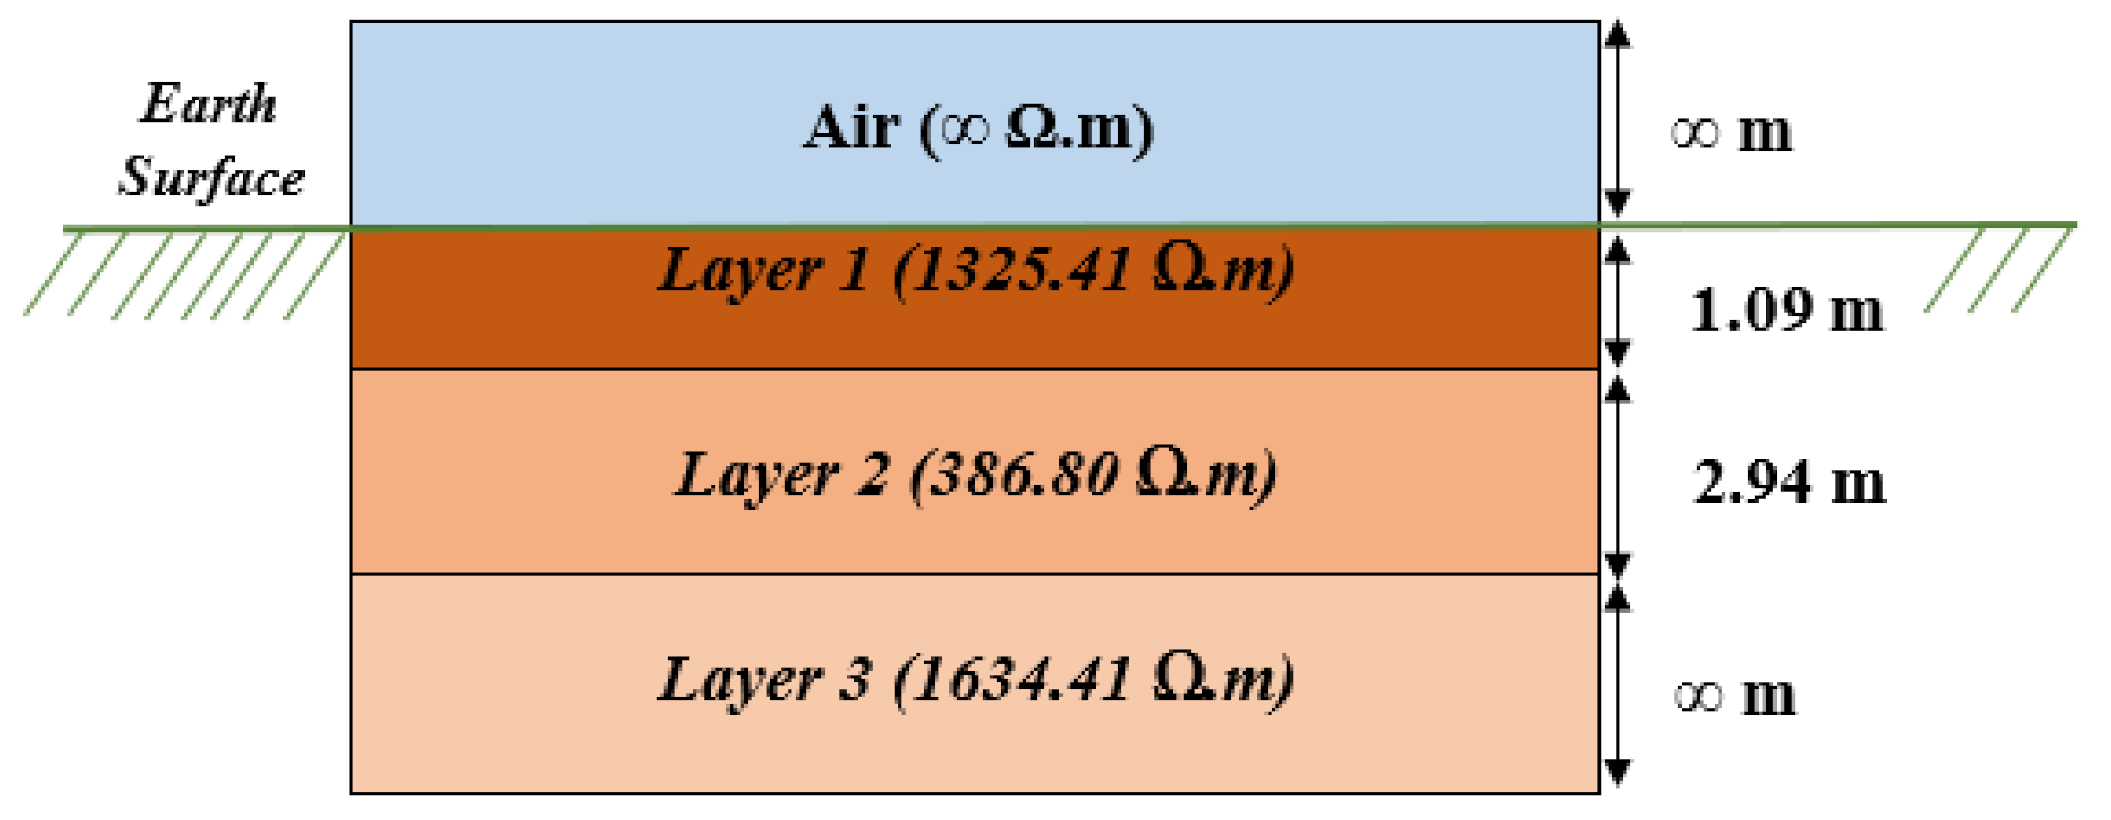
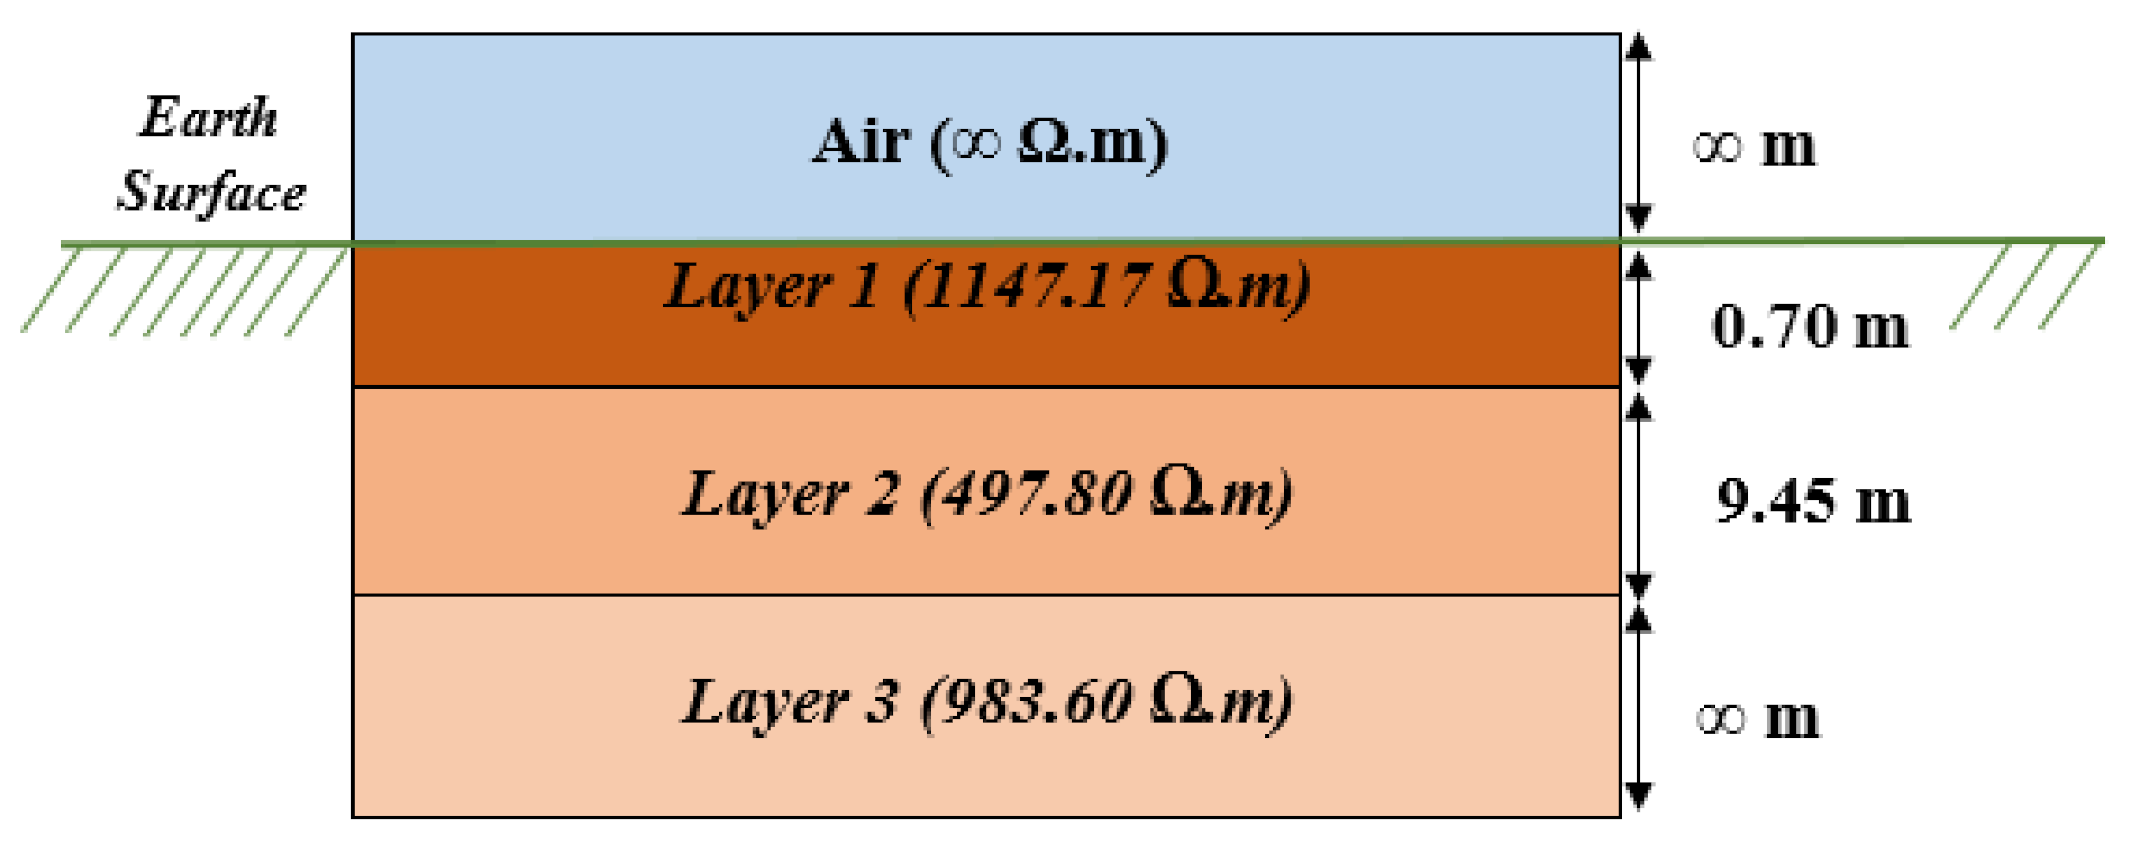
3.1. Soil Structure Interpretation

In the quest for interpretation of the soil structure, the result showed the difference in soil structure for every tower. The results of this study indicate that each tower area comprises two or three layers with different soil resistivity values. Figure 9, Figure 10 and Figure 11 represent the soil structure for tower T40, T41, and T44 which consist of two layers with different soil resistivity values. The surface layer for tower T40 as shown in Figure 9 is referred to as air and has infinite resistivity and thickness. The first layer of soil has a resistivity of 144.95 Ω m with a thickness of approximately 0.70 m and the second layer has a resistivity of 292.28 Ω m with infinite thickness. In other words, both layers were considered to have a low soil resistivity for this tower.
Figure 10 shows the first layer of soil of tower T41 with a resistivity of 548.89 Ω m with 2.34 m of thickness and 1168.23 Ω m with infinite thickness for the second layer. In this case, the result depicts that the bottom layer has a high soil resistivity, more than half of the first layer, and it shows that the second layer is considered as high resistivity.
In comparison, the soil structure for tower T44 shown in Figure 11 represents the first soil layer as having a higher soil resistivity than the second layer, in which the value of the soil resistivity of layer 1 is 2240.44 Ω m with a thickness of approximately 5.33 m and 842.74 Ω m with infinite thickness for layer two.
Figure 12, Figure 13 and Figure 14 demonstrate the soil structure for towers T45, T46, and T49, respectively, in which there are three layers present with different soil resistivity values. For tower T45, as shown in Figure 12, the soil result shows the highest soil resistivity in the first soil layer, which is 1141.94 Ω m and thickness 2.05 m. This was followed by the second and third layer at 51.15 Ω m and 751.73 Ω m, respectively. The thickness of layer two was 4.38 m and there was an infinite thickness for layer three. In this result, it indicates that the middle layer had low resistivity compared to the upper and lower layer.
Figure 13 shows the third layer having the highest soil resistivity, 1634.41 Ω m, and the thickness is infinity. This was followed by the first and second layer at 1325.41 Ω m and 386.80 Ω m, respectively. The thickness of layer 1 was 1.09 m and 2.94 m thickness for layer two.
For tower T49, Figure 14 presents the first soil layer at 1147.17 Ω m with 0.70 m of soil thickness. This is followed by the second and third layers at 497.80 Ω m and 983.60 Ω m, respectively. The thickness of layer two was 9.45 m and thickness is infinite for layer three. In this case, the middle layers remained as the lowest resistivity but the thickness of layer two was very high. For the overall comparison in this study regarding thickness of soil, the result showed this tower having the highest thickness.

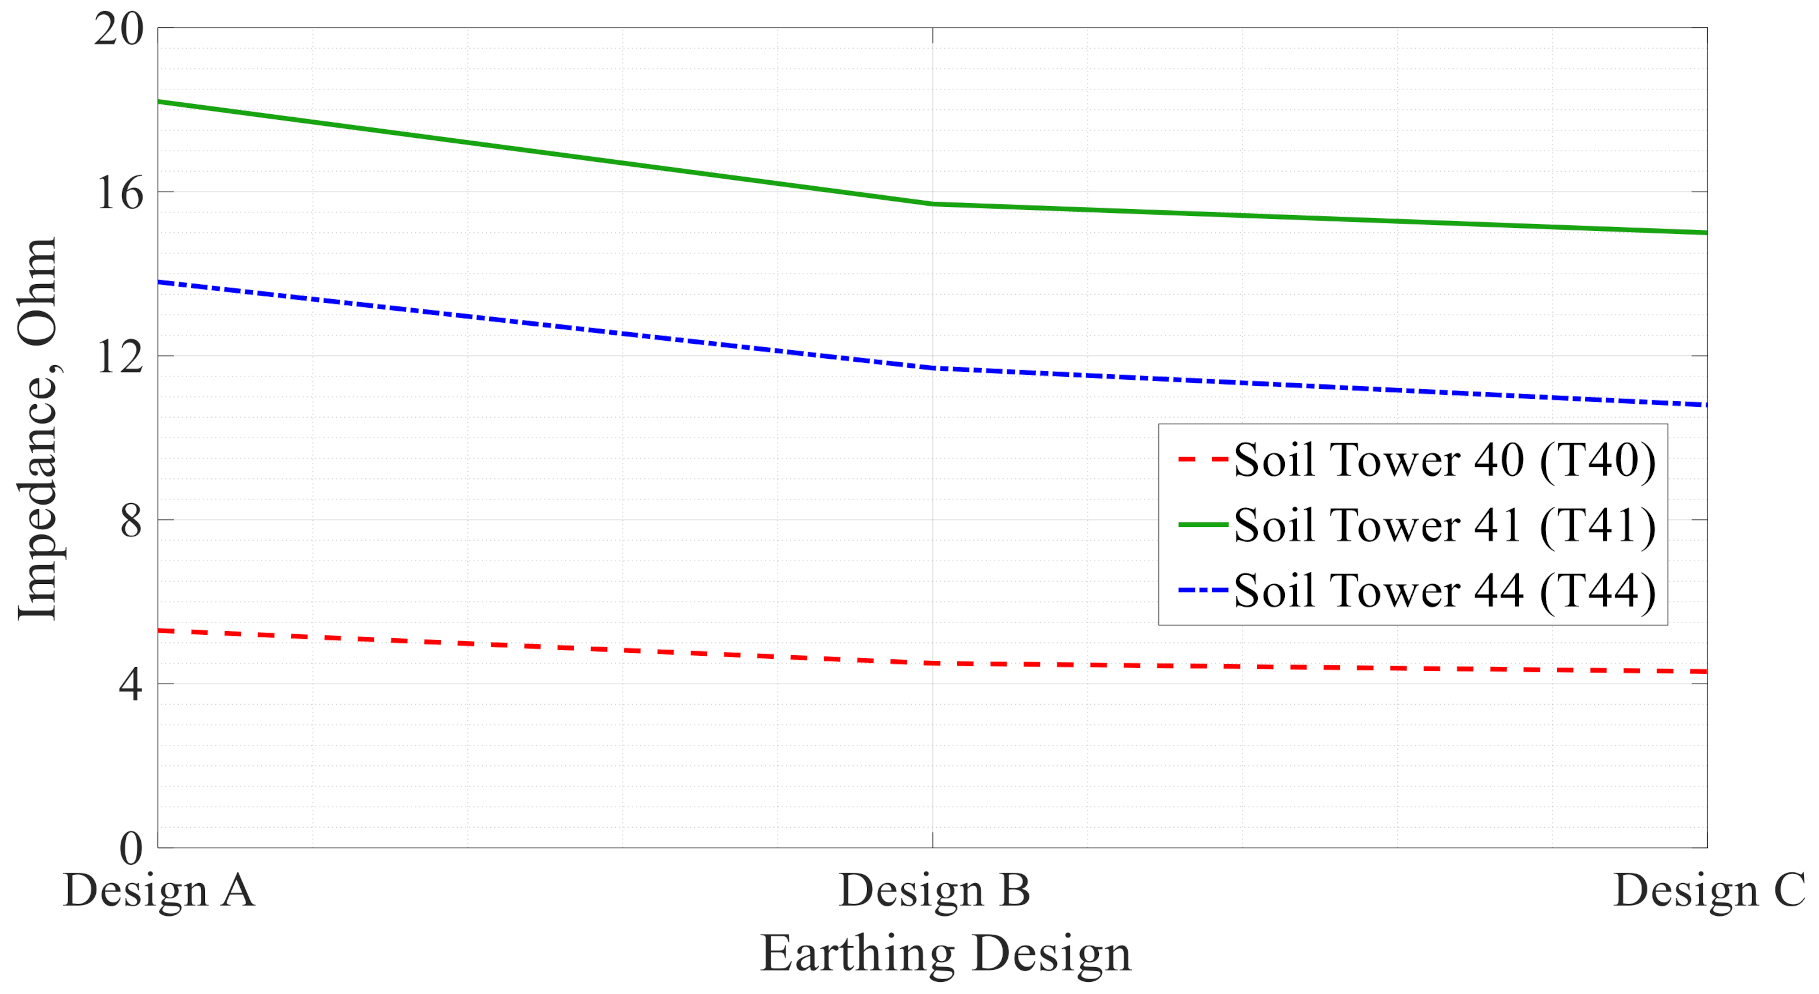
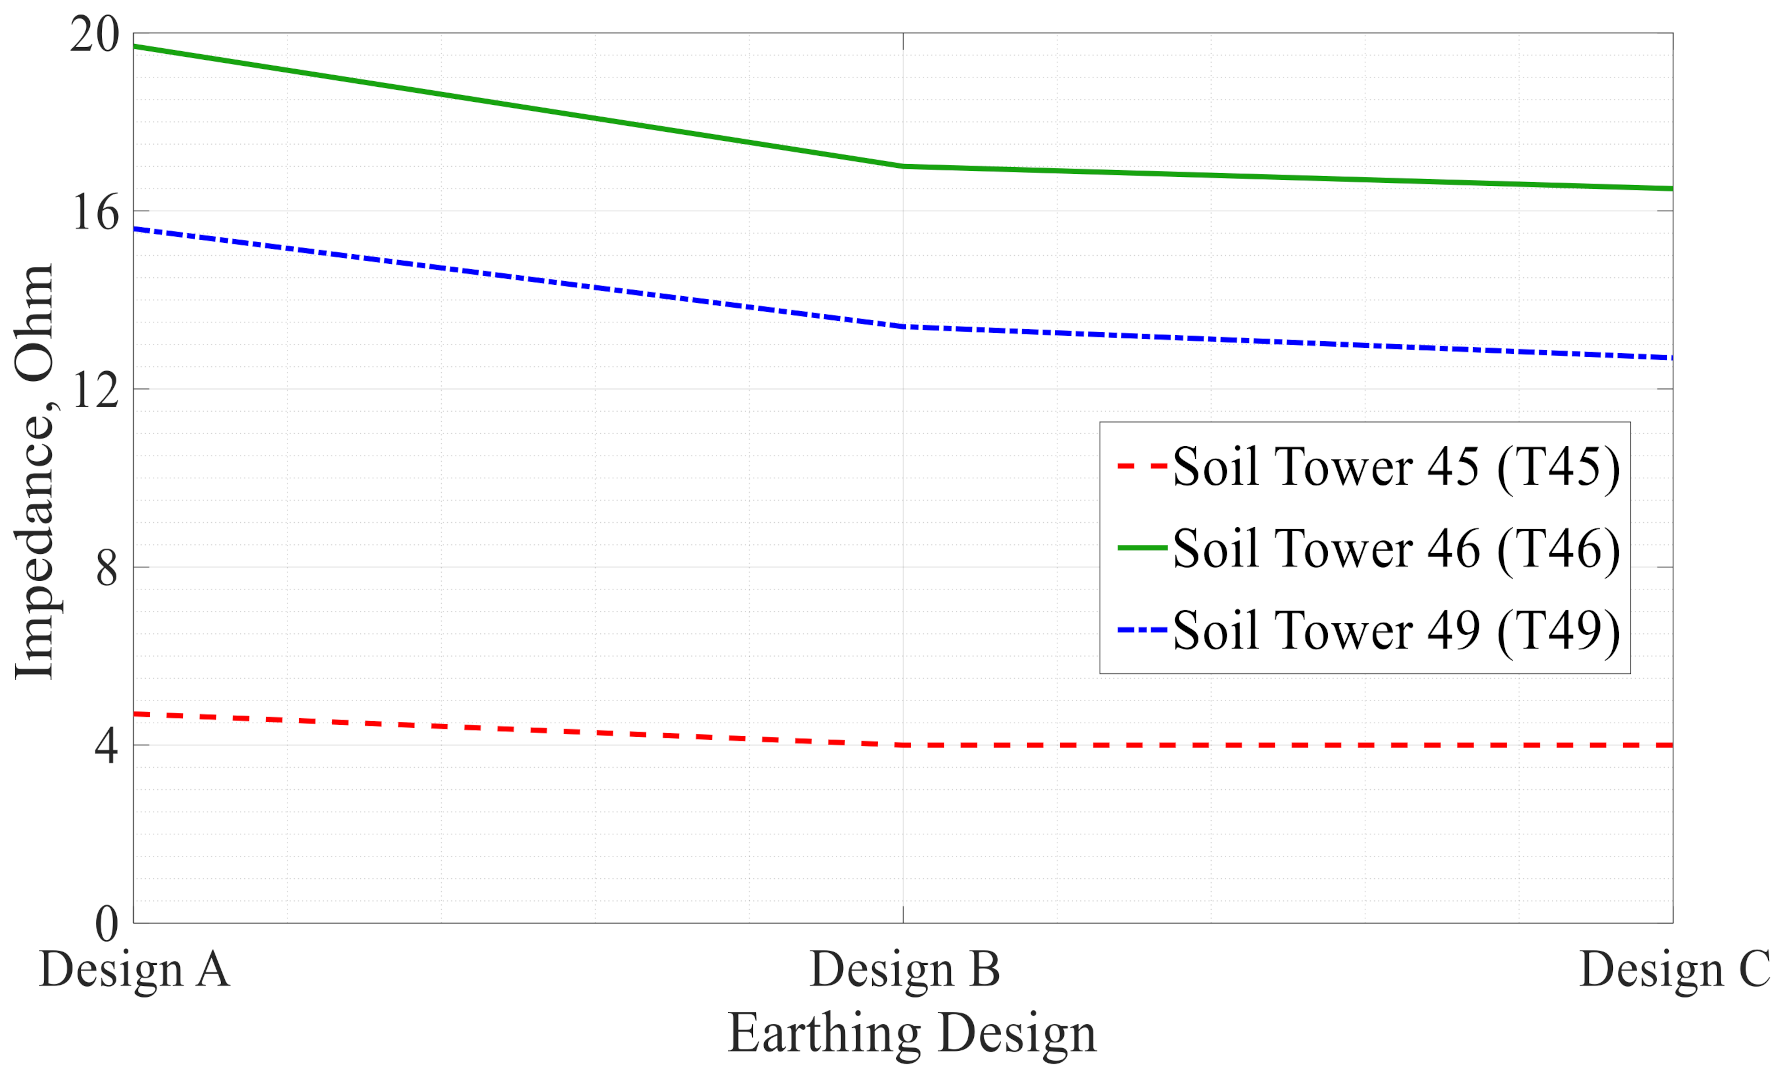
3.2. Computation of Tower Footing Impedance

In this section, the tower footing impedance computation is presented for two cases as follows: (i) the earthing impedance of radial and ring electrodes buried in two-layer soil and (ii) the earthing impedance of radial and ring electrodes buried in three-layer soil. Both cases considered the three designs of Design A, Design B, and Design C. Figure 14 represents the case of the tower footing impedance when the electrodes were buried in two-layer stratified soil. The result indicated that tower T41 had the highest value of footing impedance compared to tower T40 and T44. In this case, the footing impedance can be seen as being influenced by the presence of the second layer.
Subsequently, the second case in this study considered the electrodes buried in three layers of soil. It can be seen that in Figure 15, the result demonstrated tower T46 having a high footing impedance value of 19.7 Ω. This was followed by tower T49 and T45 at 15.6 Ω and 4.7 Ω respectively. In this case, tower T45 showed the lowest value due to the low resistivity of the middle and lower layers.
Comparing the tower footing impedance of the radial and ring electrodes under different conditions, the result of this study shows that the footing impedance decreased due to the earthing design arrangement. Table 4 shows a clear trend of decreasing footing impedance by as much as 18.87% for tower T40, 17.58% for tower T41, and around 21.74% for tower T44. Each is a percentage for the two layers of soil. This is followed by the three-layer case, in which the decreasing of footing impedance was 14.89%, 16.24%, and 18.59% for tower T45, tower T46 and tower T49, respectively. It can be inferred that in this analysis, the percentage of impedance was decreased by 14% to 22%.

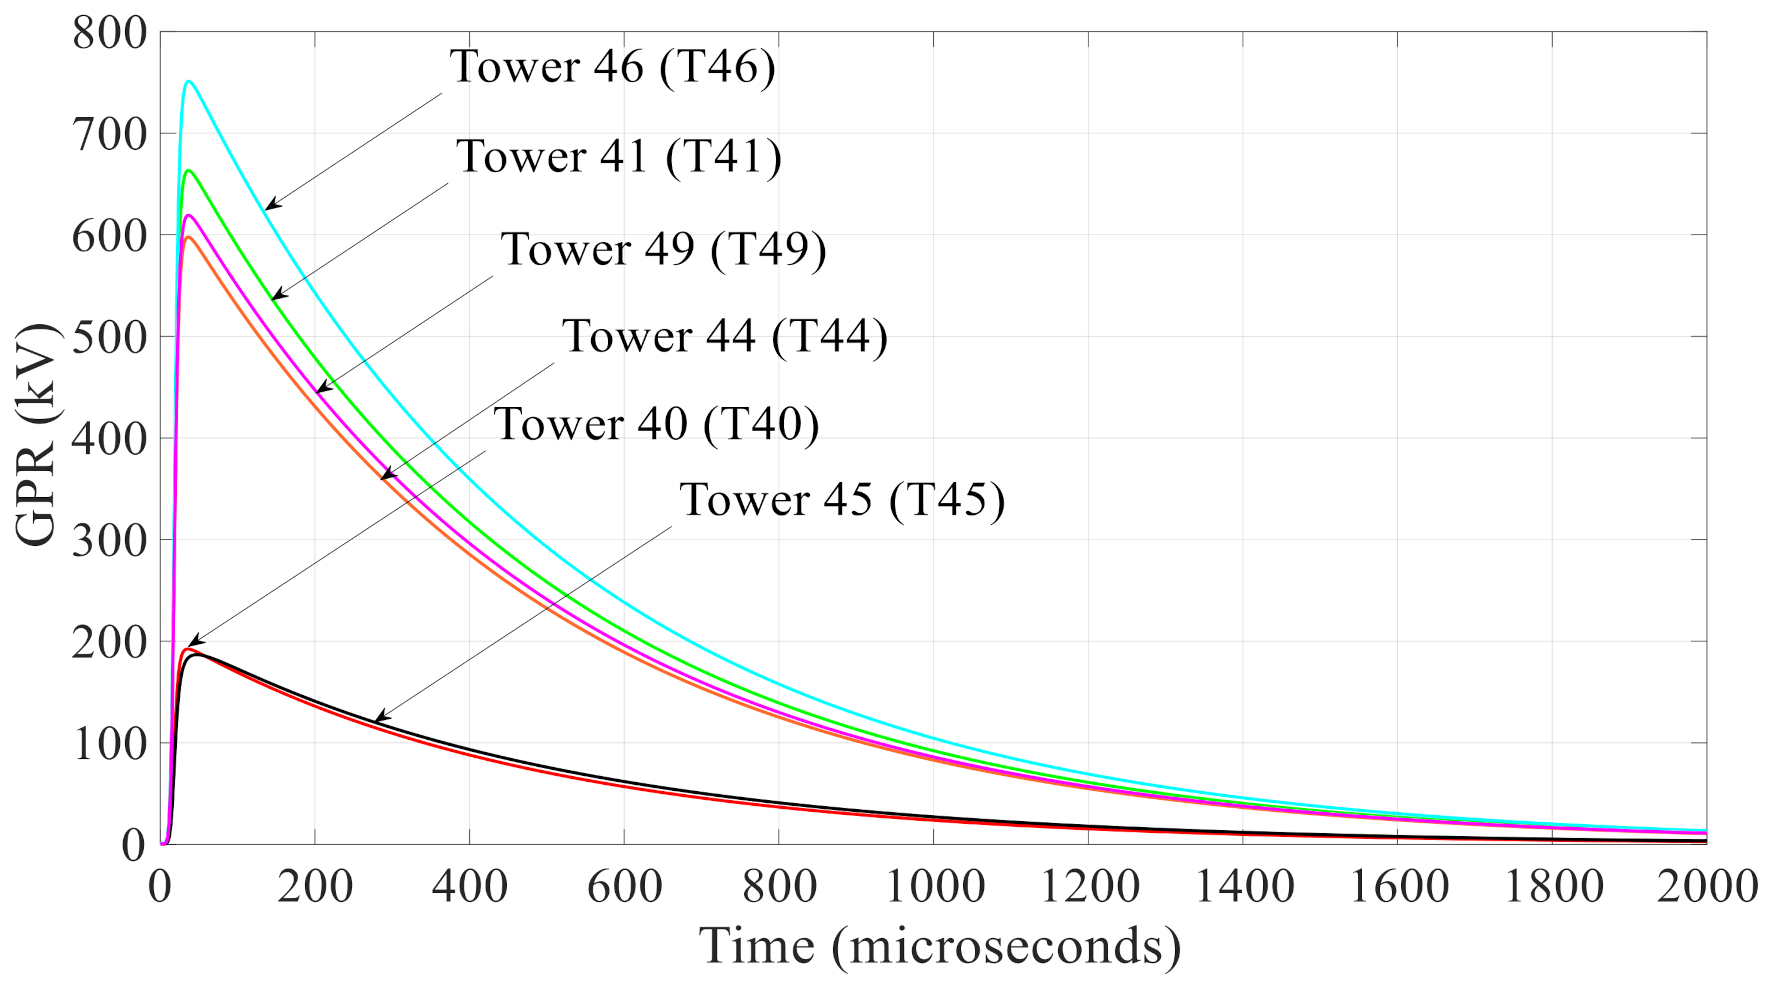
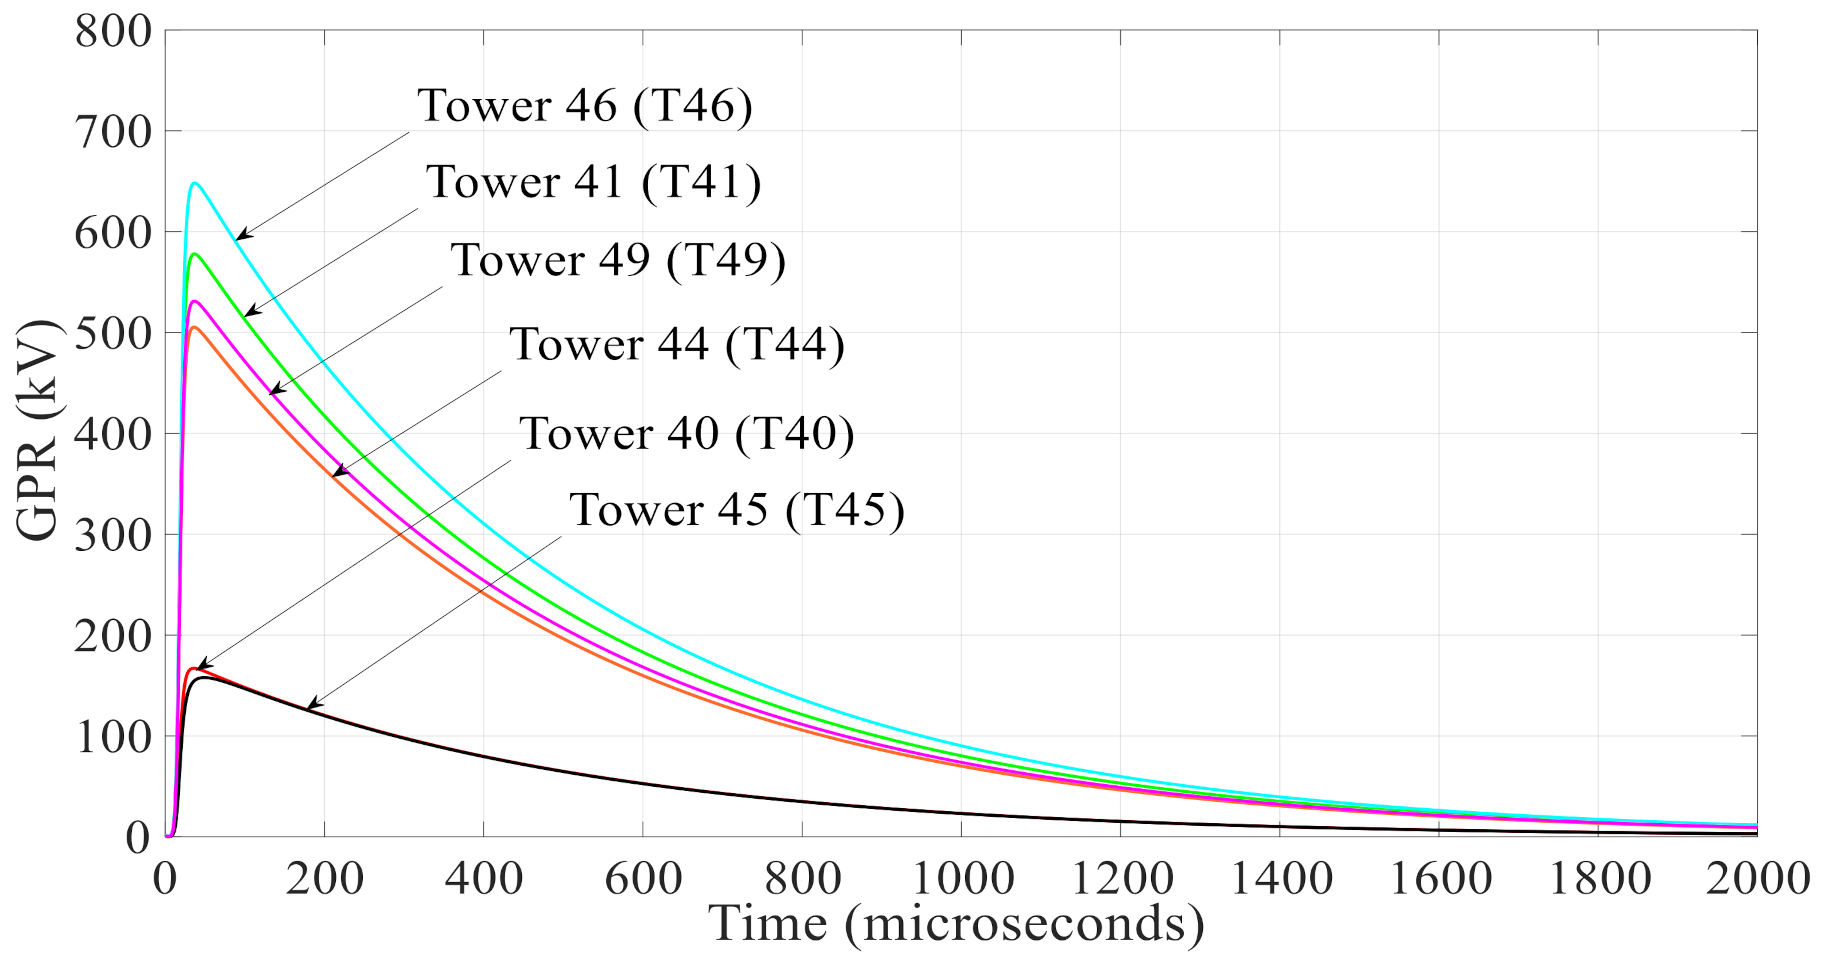
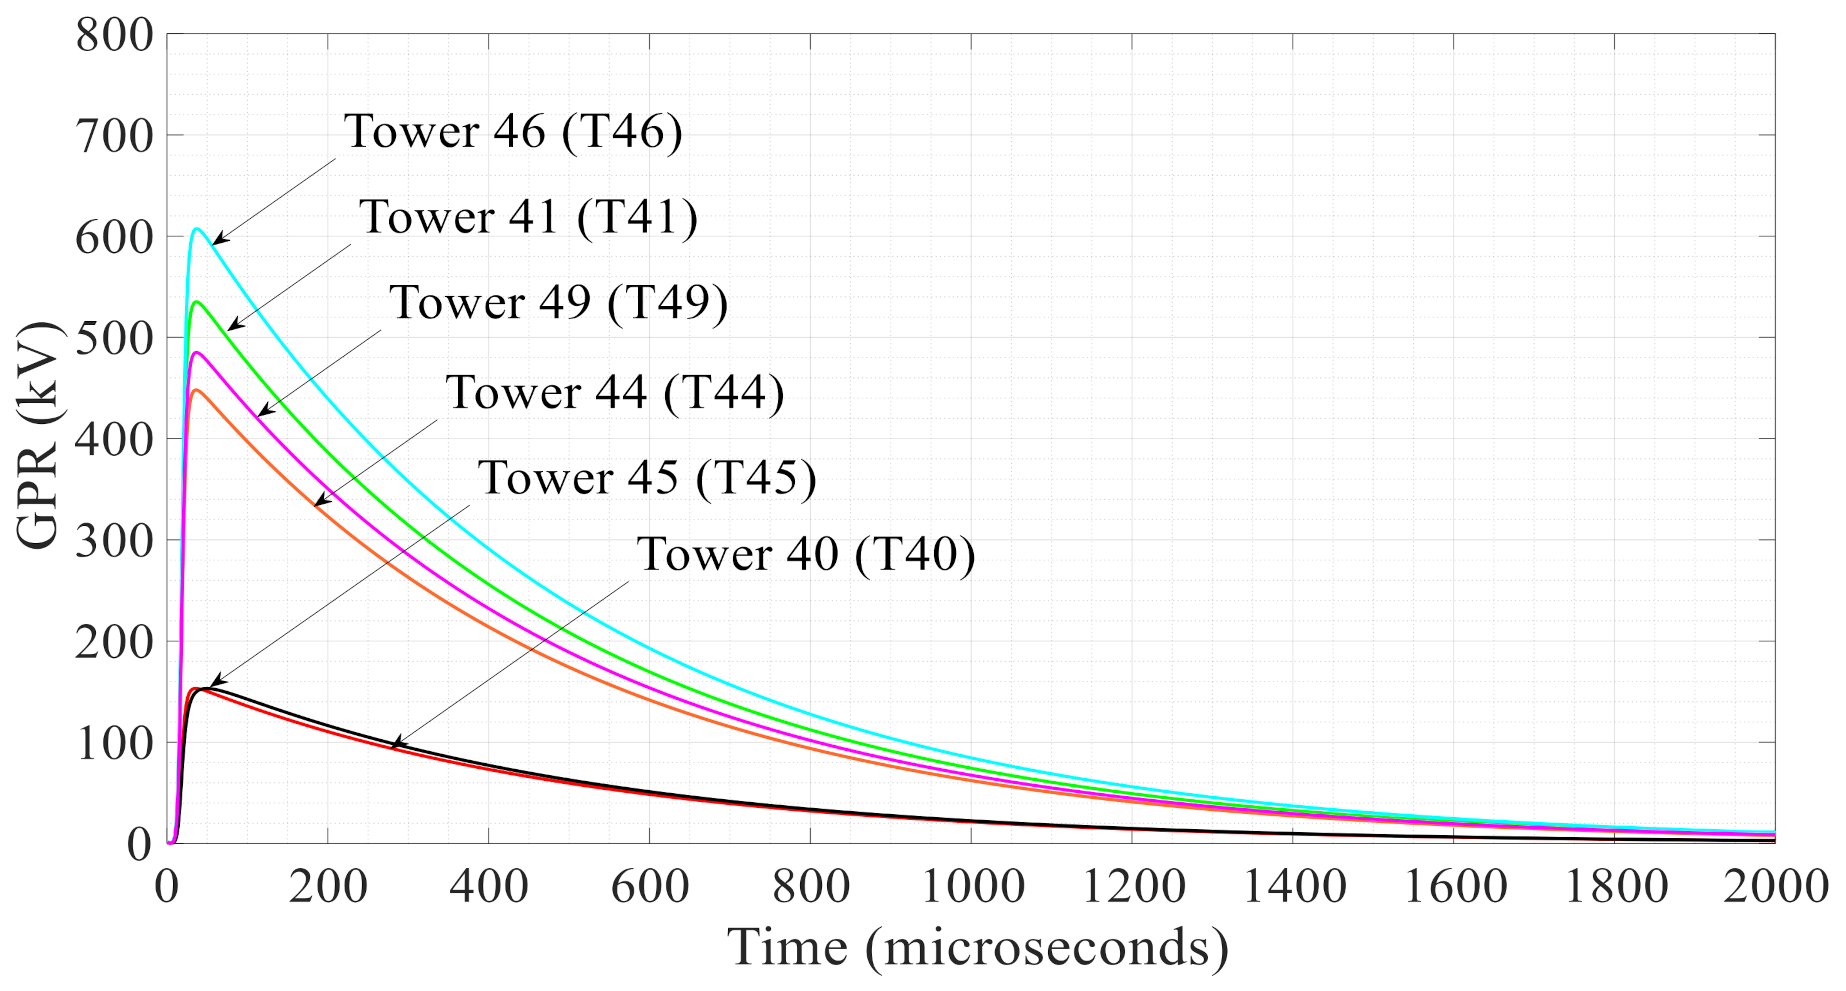
3.3. Simulated Ground Potential Rise (GPR)

The main response of the earthing electrodes subjected to lightning currents consisted of the ground potential rise (GPR). GPR analysis was required to determine if the step and touch voltage complied with specific earthing system standards as described in [66,67]. In this section, the simulated GPR when subject to a lightning impulse current on an earthing electrode buried in two and three-layer soil was analysed with three different designs, namely Design A, Design B, and Design C as depicted by Figure 16, Figure 17 and Figure 18 which represent the different curves of the GPR for the different design arrangements. GPR obtained for Design A gives the highest value compared to Design B and Design C due to the comprehensiveness in vertical and horizontal electrode arrangements, as shown in Figure 5, Figure 6 and Figure 7. This allows proper current to be dispersed to the ground and thus lowered the GPR value measured.

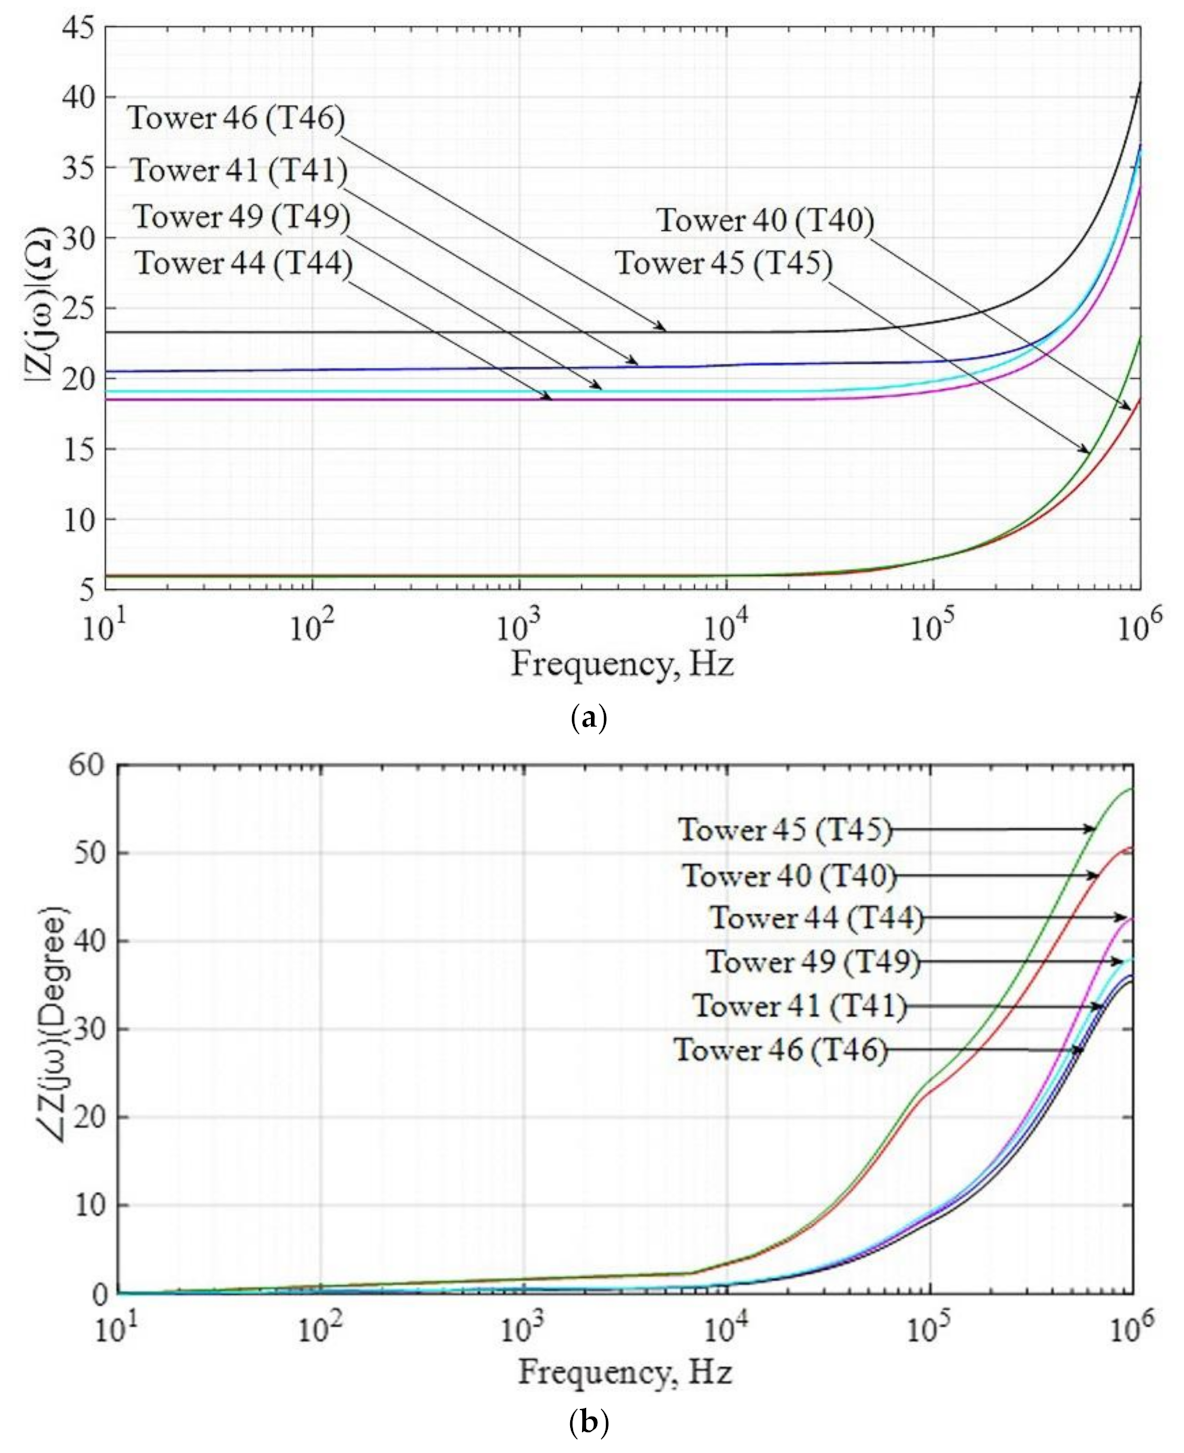
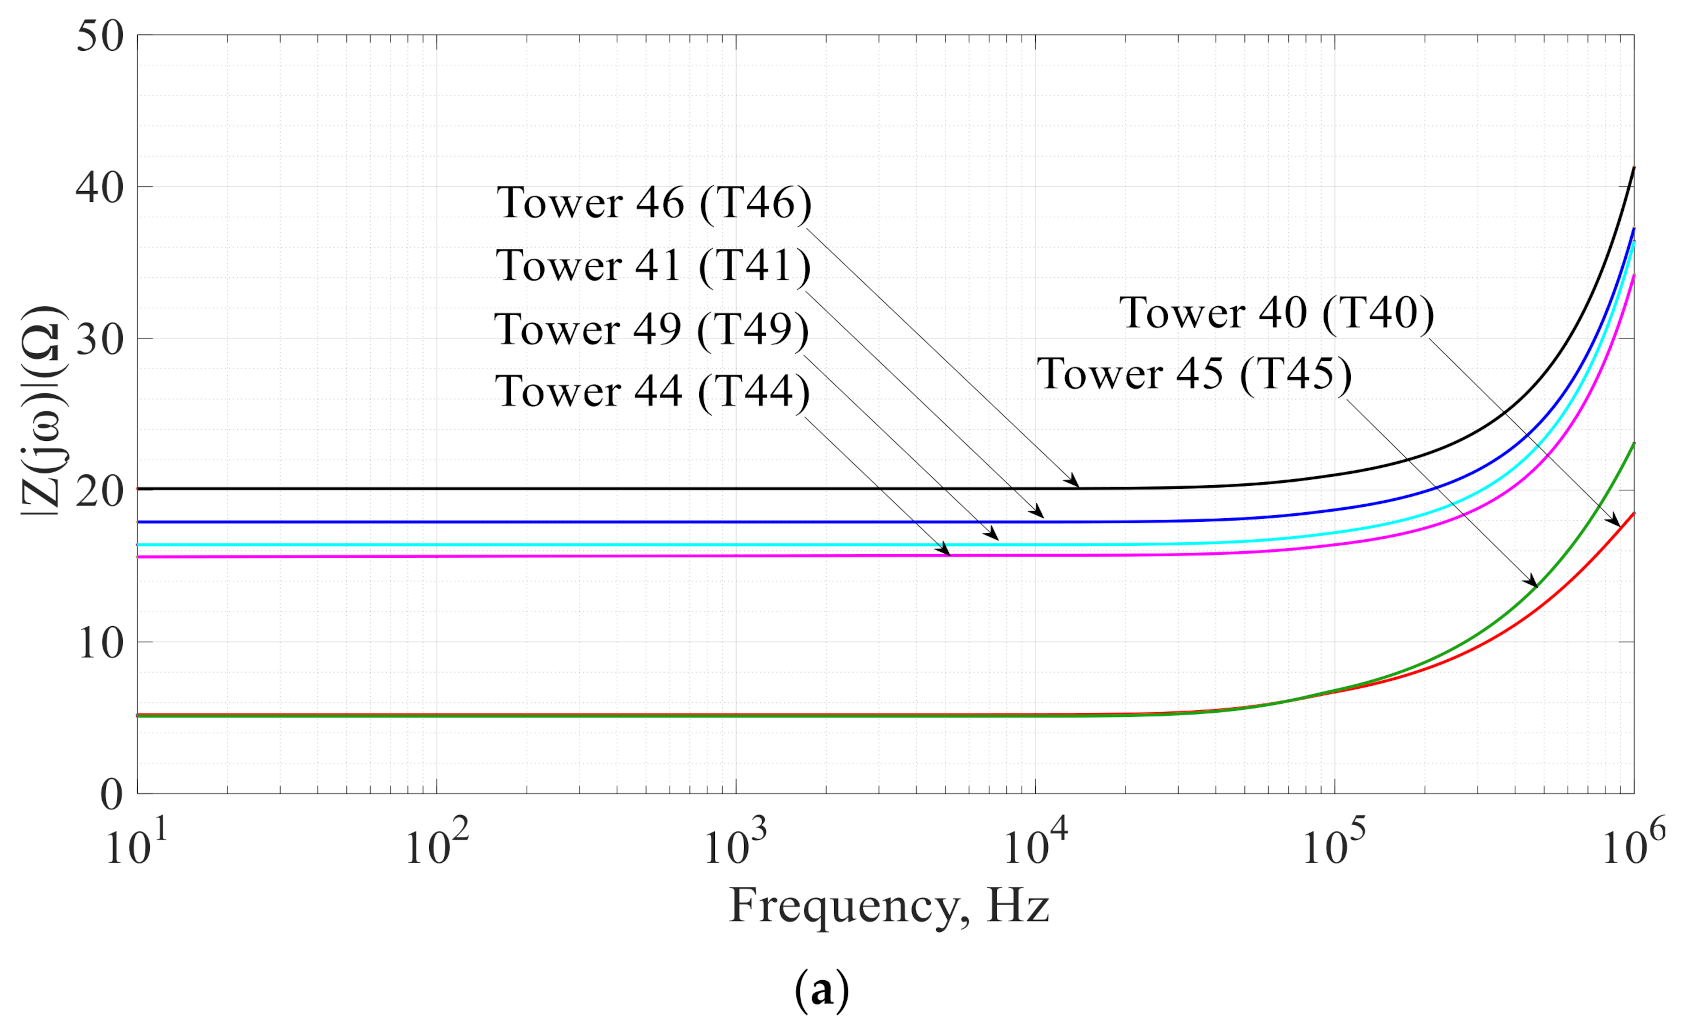
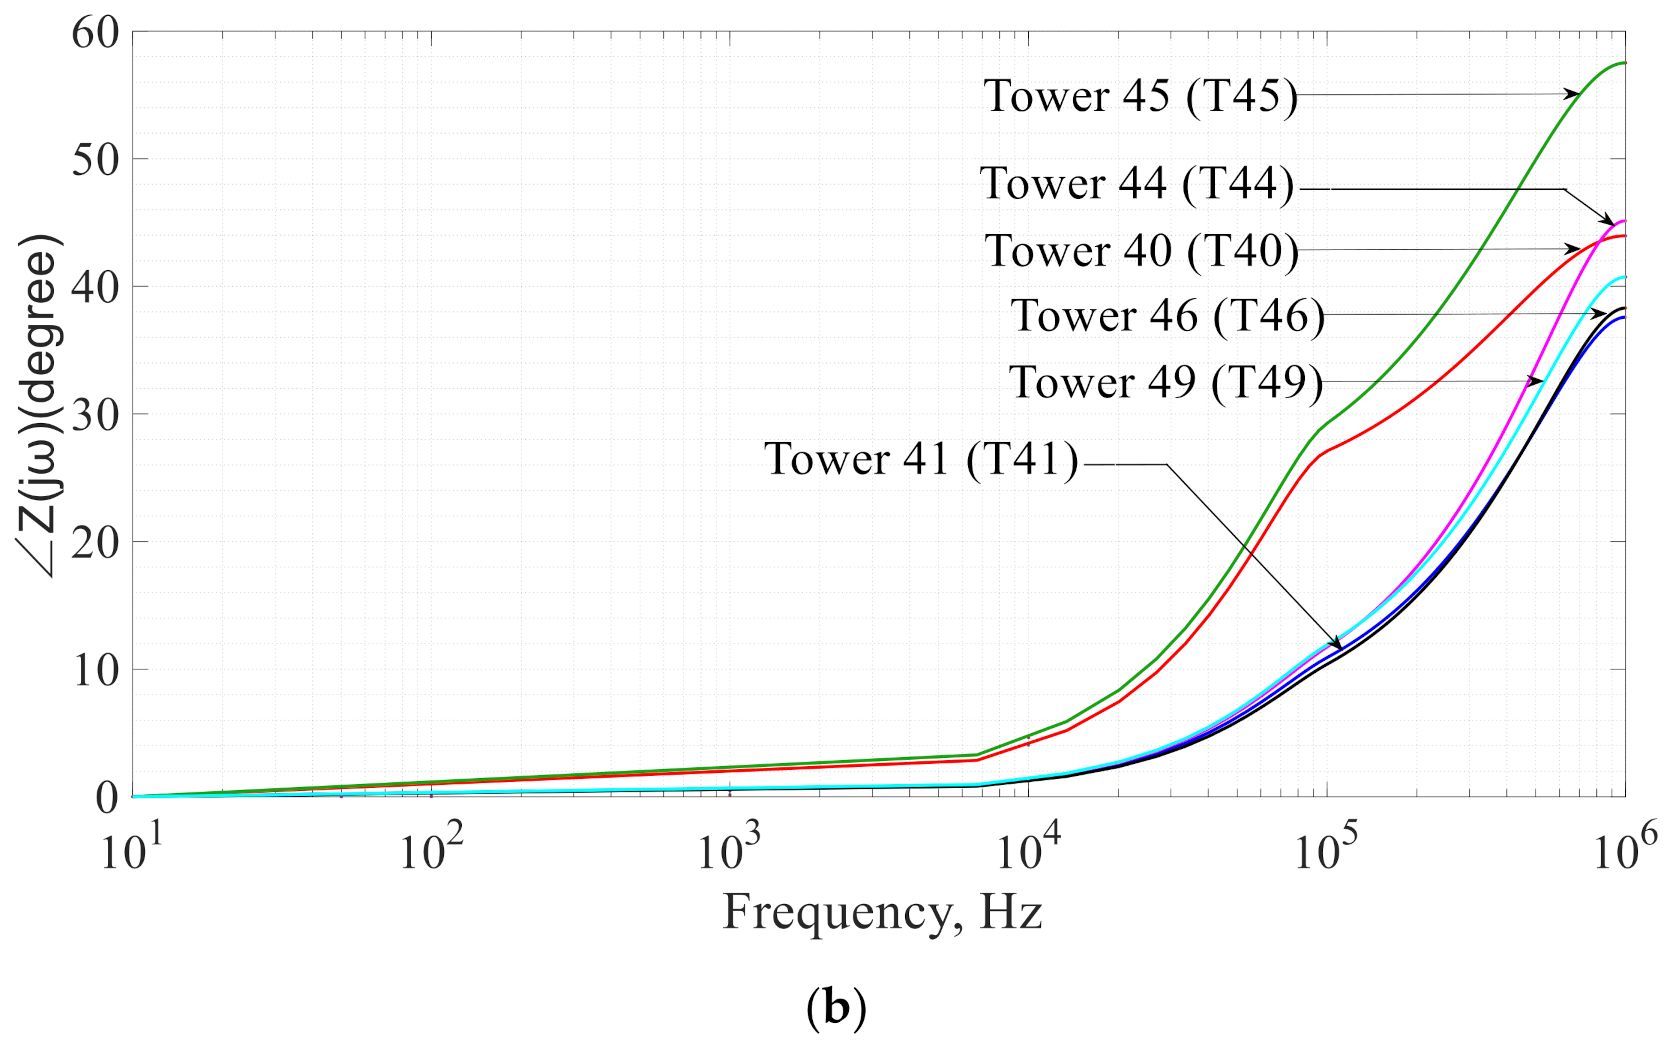
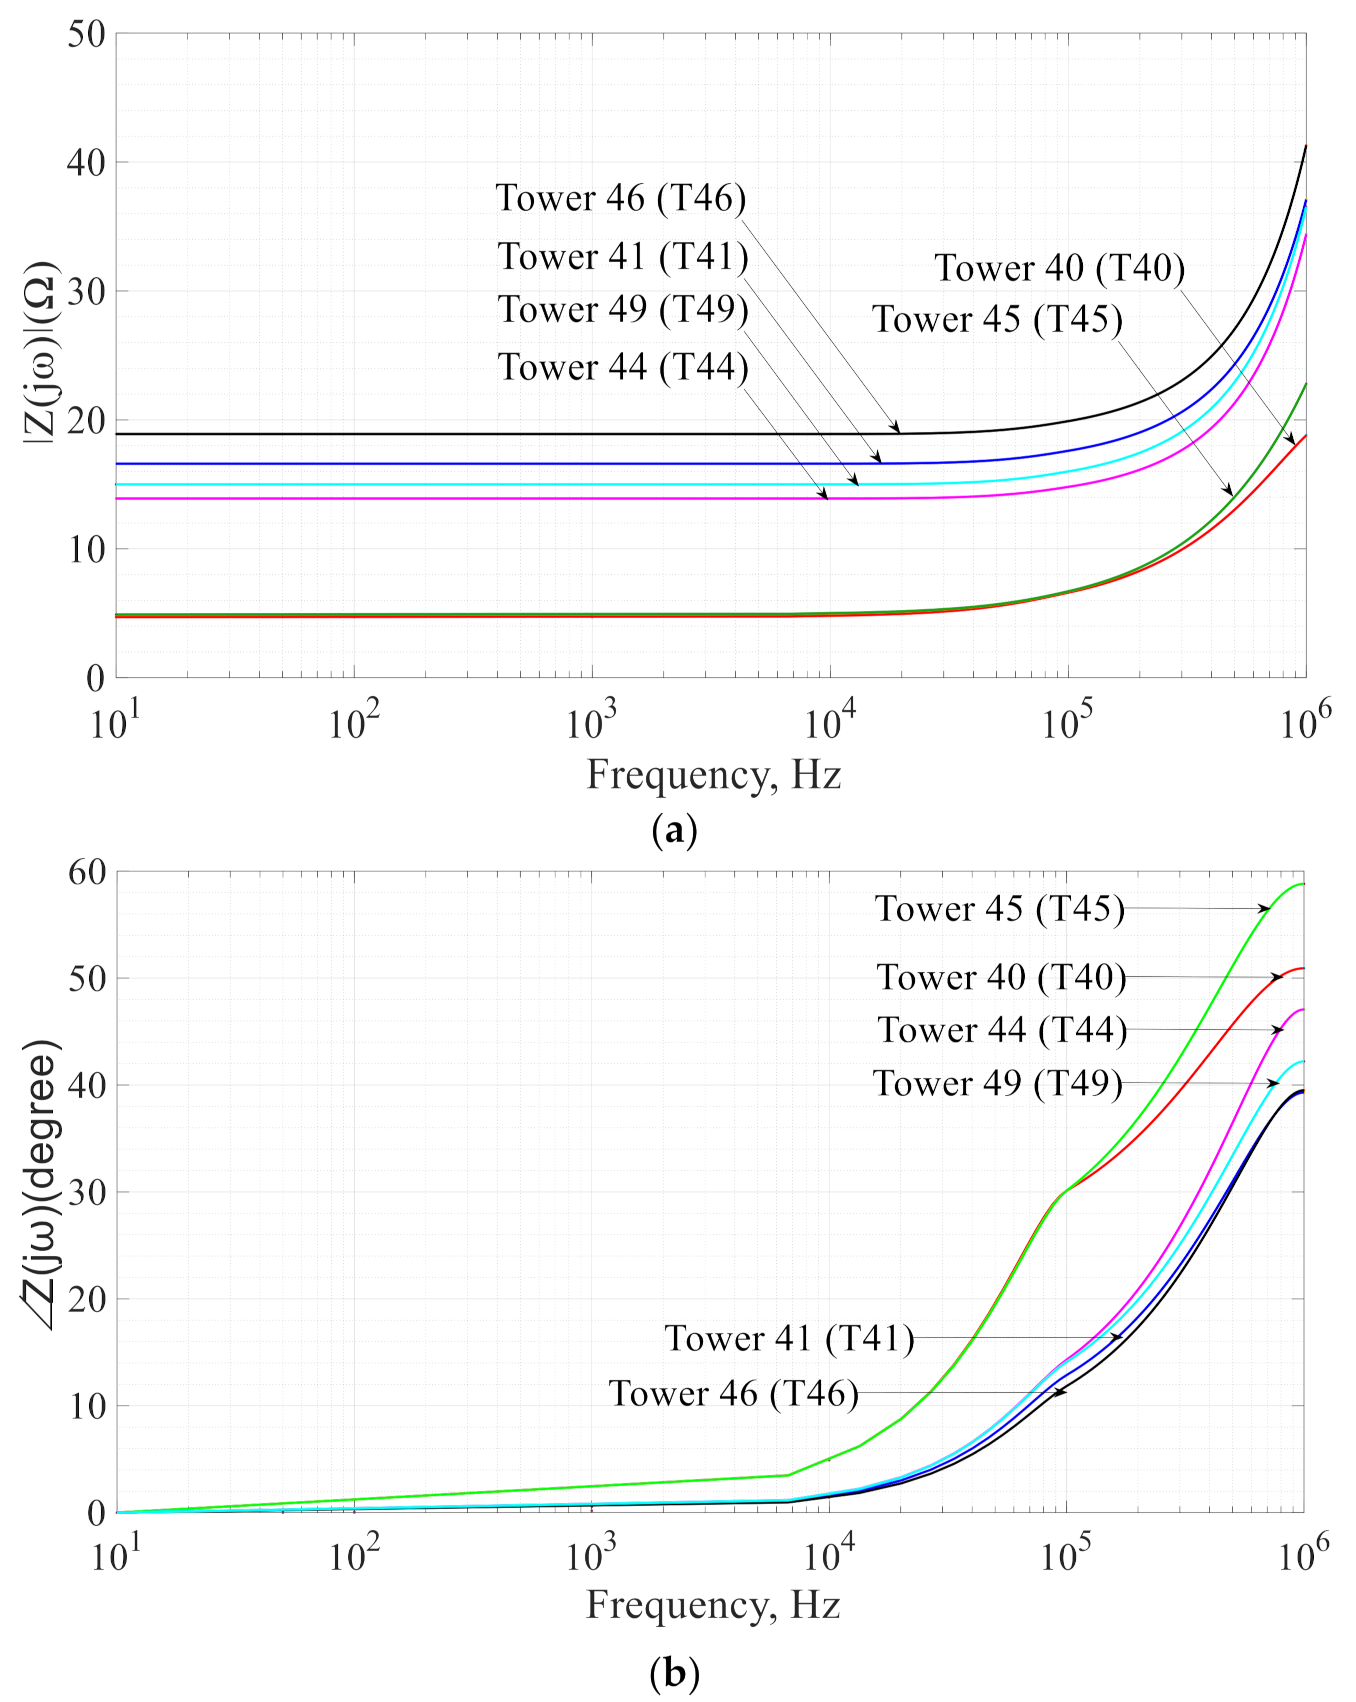
3.4. Frequency Domain Computation

To determine the frequency dependence behaviour of an earthing system, the footing impedance was computed by SEStransient tools as a function of frequency for different earthing design arrangements and soil resistivity. Figure 19, Figure 20 and Figure 21 show the impedance magnitude and phase for Design A, Design B, and Design C with different soil resistivity for every tower (T40, T42, T44, T45, T46, and T49).

4. Discussion

Based on Figure 9, Figure 10, Figure 11, Figure 12, Figure 13 and Figure 14, results indicated that all transmission line tower (T40, T41, T44, T45, T46, and T49) installations for this line possessed non-uniform and different soil structures. The results obtained showed that there are two-layer and three-layer configurations with different soil resistivity and thickness. This study demonstrates that soil features are unique from tower to tower and that each soil cannot be assumed the same although they are located within the same perimeters.
Meanwhile, the results in Section 3.2 showed that by increasing the size of the radial, the ring, and the number of earthing electrodes, it was possible to lower the tower footing impedance. This is the result of having a sufficient number of vertical rods in the earthing design, where the fault current can be dissipated away from the Earth’s surface and thus would help to reduce the step and touch potential. As far as the TFR limit of 5 Ω is concerned, only two towers, i.e., T40 and T45, fulfil the requirement, although the criterion is mainly suggested for the TFR value (low frequency) which is normally higher than the impedance.
In the case of the frequency dependence behaviour of an earthing system, Figure 20, Figure 21 and Figure 22 illustrated that the earthing impedance was almost constant up to 100 kHz and increased with the frequency due to soil inductive behaviour, which depends on the design arrangement and soil resistivity [68]. These results are in good agreement with other published reports [32].
Generally, most of the studies were determined by a variety of assumptions and physical methodologies, which led to the development of numerous equations based on uniform soil throughout the last few decades. With the availability of computer-aided software specifically for grounding system studies such as CDEGS, which allows engineers to understand several aspects of designs that influence performance of the systems; the design and research on earthing systems have gone through years of knowledge developments. Indeed, earthing system performance is highly tied to soil characteristics and the moisture content of the soil. It is worth noting that the impedance is a function of the low frequency TFR and is dependent on many other factors such as the series inductance of distributed electrodes and ionization of the soil when local electric field gradients exceed 150–300 kV/m in soil. Thus, by elevating high values of low-frequency TFR, this implies that the impedance would be higher too [69].

5. Conclusions

This paper presented a study of a comparison of footing impedance of different earthing system designs with the influence of soil characteristics on the transmission line towers under lightning behaviour. Six different types of soil in a real case for 500 kV and three designs of an earthing system were interpreted and modelled using the CDEGS software.
This paper provided an analysis of the soil structure for each tower under consideration with different soil resistivity values and layers. Each transmission tower possessed a unique soil structure, which can be reflected in the simulated cases. This study found that Design C represented the best of the design arrangements compared to Design A and Design B with the increasing size of radial, ring, and number of earthing electrodes used, and thus would help the transmission line tower to be safe by reducing the tower footing impedance. However, the depth of the earthing in the soil and the length of vertical rods also helps in decreasing tower footing impedance to some extent. It can be concluded that when a transmission line tower is in a high soil resistivity location, the earthing design and the number of electrodes are critical factors in determining the tower footing impedance design. This is due to the fact that more paths are required to disperse the current safely while reducing the negative reflection going up to the tower and crossarms. Therefore, the Design C arrangement was recommended for installing in situations with high soil resistivity in the top layer due to the need for the surge current to dissipate much more quickly as opposed to the soil with low resistivity located on the top layer. This is particularly true in the case of soil with multilayer structures. This paper also briefly explained the effect of GPR considering two types of soil with different earthing design arrangements. Results demonstrated that soil resistivity, soil layer, and earthing design arrangement are the three parameters with great influences on the GPR. Subsequently, the result was also presented that earthing impedance was almost constant at low frequencies (<100 kHz) and increased with increasing frequency.
Overall, it is clear that the study confirmed that the soil structure characteristic and earthing system arrangement play an important role in an earthing system. It was observed that the soil resistivity on the surface layer strongly affected the earthing impedance because the top layer required adequate soil moisture in which the wet soil had lower resistivity than the dry soil. This factor would affect the tower footing resistance and impulse impedance. High tower impedance may lead to an outage on the transmission tower. It can be concluded that increased resistivity will increase footing impedance [70]. Having said that, there is certainly a need to re-visit the TFR limit, which is currently fixed at less than or equal to 5 Ω. While Design C was found to be better for TFR reduction compared to other designs, the real scenario of having limited spaces on site and the configuration constraint of the tower legs may add to the difficulties in implementing such a design. Taking into account the fact that high magnitudes of lightning current flowing through the ground resistance and decreasing the resistance significantly below the measured TFR values [67] is another point to be considered, in addition to the cost of reducing even 1 Ω towards the desired value, which is certainly cost-heavy in operational expenses (opex) of the utility in order to maintain sustainable power supply to the customer.

Author Contributions

Conceptualization, M.Z.A.A.K., M.O., M.S.A.R. and U.A.U.A.; methodology, N.A.F.M.N. and N.H.Z.; validation, M.Z.A.A.K.; formal analysis, N.A.F.M.N. and M.S.M.N.; investigation, N.A.F.M.N., M.S.M.N., N.H.N.A. and N.H.Z.; writing—original draft preparation, N.A.F.M.N.; writing—review and editing, N.A.F.M.N.; supervision, M.Z.A.A.K., M.O., M.S.A.R. and U.A.U.A.; project administration, M.Z.A.A.K., M.O., M.S.A.R. and U.A.U.A.; funding acquisition, M.Z.A.A.K., M.O., M.S.A.R. and U.A.U.A.; software, N.H.N.A. and M.S.M.N. All authors have read and agreed to the published version of the manuscript.

Funding

This research was funded by Universiti Tenaga Nasional through UNITEN Bold Grant and URND for RA Scheme. Special thanks to Tenaga Nasional Berhad (Grid Maintenance) team for their kind support on the data.

Institutional Review Board Statement

Not applicable.

Informed Consent Statement

Not applicable.

Data Availability Statement

Not applicable.

Acknowledgments

Not applicable.

Conflicts of Interest

The authors declare no conflict of interest. The funders had no role in the design of the study; in the collection, analyses, or interpretation of data; in the writing of the manuscript, or in the decision to publish the results.

References

  1. Ekonomou, L.; Iracleous, D.P.; Gonos, I.F.; Stathopulos, I.A. An optimal design method for improving the lightning performance of overhead high voltage transmission lines. Sci. Direct 2006, 76, 493–499. [Google Scholar] [CrossRef]
  2. Bourscheidt, V.; Pinto, O.; Naccarato, K.P. Improvements on lightning density estimation based on analysis of lightning location system performance parameters: Brazilian case. IEEE Trans. Geosci. Remote Sens. 2014, 52, 1648–1657. [Google Scholar] [CrossRef]
  3. Davis, R. Lightning flashovers on the British grid. Proc. Inst. Electr. Eng. 1963, 110, 969–974. [Google Scholar] [CrossRef]
  4. Warmi, Y.; Michishita, K. A study on lightning outages on the 150 kV transmission line of Payakumbuh—Koto Panjang in West Sumatra in Indonesia. In Proceedings of the 19th International Symposium on High Voltage Engineering, Pilsen, Czech Republic, 23–28 August 2015; pp. 23–28. [Google Scholar]
  5. He, J.L.; Zeng, R. Lightning shielding failure analysis of 1000kV ultra-high voltage AC transmission line. In Proceedings of the CIGRE, Paris France, 22–27 August 2010; pp. 1–9. [Google Scholar]
  6. Rawi, I.M.; Kadir, M.Z.A.A. Procedures for evaluating the HV overhead lines lightning performance and methods for reducing the OHL trip rate in TNB Transmission. In Proceedings of the Proceedings of the IEEE 8th International Power Engineering and Optimisation Conference (PEOCO), Kedah, Malaysia, 24–25 March 2014; pp. 375–379. [Google Scholar]
  7. EPRI. AC Transmission Line Reference Book—200kV and Above, 3rd ed.; EPRI: Palo Alto, CA, USA, 2005; ISBN 1011974. [Google Scholar]
  8. Hileman, A.R. The Backflash. In Insulation Coordination for Power Systems; Taylor & Francais Group: Boca Raton, FL, USA, 1999; pp. 373–460. [Google Scholar]
  9. EPRI. Handbook for Improving Overhead Transmission Line Lightning Performance; EPRI: Palo Alto, CA, USA, 2004; p. 1002019. [Google Scholar]
  10. Radhika, G.; Suryakalavathi, D. Back flashover analysis improvement of a 220KV transmission line. Int. J. Eng. Res. 2013, 3, 533–536. [Google Scholar]
  11. Kadir, M.Z.A.A.; Cotton, I. Application of the insulator coordination gap models and effect of line design to backflashover studies. Int. J. Electr. Power Energy Syst. 2010, 32, 443–449. [Google Scholar] [CrossRef]
  12. Datsios, Z.G.; Mikropoulos, P.N.; Tsovilis, T.E. Effects of lightning channel equivalent impedance on lightning performance of overhead transmission lines. IEEE Trans. Electromagn. Compat. 2019, 61, 623–630. [Google Scholar] [CrossRef]
  13. IEEE Std. 1313.2. IEEE Guide for the Application of Insulation Coordination; IEEE-SA Standards Board: Piscataway, NJ, USA, 2005. [Google Scholar]
  14. Sestasombut, P.; Ngaopitakkul, A. Evaluation of a direct lightning strike to the 24 kV distribution lines in Thailand. Energies 2019, 12, 3193. [Google Scholar] [CrossRef] [Green Version]
  15. Shariatinasab, R.; Gholinezhad, J.; Sheshyekani, K.; Alemi, M.R. The effect of wide band modeling of tower-footing grounding system on the lightning performance of transmission lines: A probabilistic evaluation. Electr. Power Syst. Res. 2016, 141, 1–10. [Google Scholar] [CrossRef]
  16. Swalehe, H.; Chombo, P.V.; Marungsri, B. Flashover and back-flashover analysis with lightning strokes of 69 kV and 24 kV lines in Thailand using ATP/EMTP. Int. J. Energy Convers. 2018, 6, 111–120. [Google Scholar] [CrossRef]
  17. Thanasaksiri, T. Comparison of CIGRE Method and IEEE-Flash Software for Back-flashover Rate Calculations. Procedia Comput. Sci. 2016, 86, 445–448. [Google Scholar] [CrossRef] [Green Version]
  18. Okabe, S.; Tsuboi, T.; Takami, J. Analysis of aspects of lightning strokes to large-sized transmission lines. IEEE Trans. Dielectr. Electr. Insul. 2011, 18, 182–191. [Google Scholar] [CrossRef]
  19. Pappas, S.S.; Ekonomou, L.; Karampelas, P.; Katsikas, S.K.; Liatsis, P. Modeling of the grounding resistance variation using ARMA models. Simul. Model. Pract. Theory 2008, 16, 560–570. [Google Scholar] [CrossRef]
  20. Wong, C.; Yusop, Z.; Ismail, T. Trend of daily rainfall and temperature in Peninsular Malaysia based on gridded data set. Int. J. GEOMATE 2018. [Google Scholar] [CrossRef]
  21. Yang, T. Study of reducing ground resistance for transmission tower on rocky mountain tops with constrained area. IEEJE Trans. Electr. Electron. Eng. 2015, 249–255. [Google Scholar] [CrossRef]
  22. Reffin, M.S.; Ali, A.W.A.; Nor, N.M.; Ahmad, N.N.; Abdullah, S.A.S.; Mahmud, A.; Hanaffi, F. Seasonal influences on the impulse characteristics of grounding systems for tropical countries. Energies 2019, 12, 1334. [Google Scholar] [CrossRef] [Green Version]
  23. Ali, A.W.A.; Ahmad, N.N.; Nor, N.M.; Idris, N.F.; Hanaffi, F. Investigations on the performance of grounding device with spike rods (GDSR) with the effects of soil resistivity and configurations. Energies 2020, 13, 3538. [Google Scholar] [CrossRef]
  24. Kosztaluk, R. Experimental study of transient ground impedances. IEEE Trans. Power Appar. Syst. 1981, PAS-100, 8–15. [Google Scholar] [CrossRef]
  25. Moreno, J.; Simon, P.; Faleiro, E.; Asensio, G.; Fernandez, J.A. Estimation of an upper bound to the value of the step potentials in two-layered soils from grounding resistance measurements. Materials 2020, 13, 290. [Google Scholar] [CrossRef] [Green Version]
  26. Jacobson, M.Z.; Mark, A.; Bauer, Z.A.F.; Wang, J.; Weiner, E.; Yachanin, A.S.; Jacobson, M.Z.; Delucchi, M.A.; Bauer, Z.A.F.; Goodman, S.C.; et al. 100 % clean and renewable wind, water, and sunlight all-sector energy roadmaps for 139 countries of the world. Joule 2017, 1, 108–121. [Google Scholar] [CrossRef] [Green Version]
  27. Glushakow, B. 10/350 Lightning test waveform in focus. In Proceedings of the International Symposium on Lightning Protection (XI SIPDA), Fortaleza, Brazil, 3–7 October 2011; pp. 182–187. [Google Scholar]
  28. Caetano, C.E.F.; Lima, A.B.; Paulino, J.O.S.; Boaventura, W.C.; Cardoso, E.N. A conductor arrangement that overcomes the effective length issue in transmission line grounding. Electr. Power Syst. Res. 2018, 159, 31–39. [Google Scholar] [CrossRef]
  29. Silveira, F.H.; Visacro, S.; Conti, A. De Backflashovers of transmission lines due to subsequent lightning strokes. IEEE Trans. Electromagn. Compat. 2012, 54, 316–322. [Google Scholar] [CrossRef]
  30. Visacro, S.; Silveira, F.H.; Oliveira, C.H.D. Measurements for qualifying the lightning response of tower-footing electrodes of transmission lines. IEEE Trans. Dielectr. Electr. Insul. 2019, 61, 719–726. [Google Scholar] [CrossRef]
  31. Harid, N.; Griffiths, H.; Ullah, N.; Ahmeda, M.; Haddad, A. Experimental investigation of impulse characteristics of transmission line tower footings. J. Light. Res. 2012, 4, 36–44. [Google Scholar] [CrossRef] [Green Version]
  32. Visacro, S.; Silveira, F.H. The impact of the frequency dependence of soil parameters on the lightning performance of transmission lines. IEEE Trans. Electromagn. Compat. 2015, 57, 434–441. [Google Scholar] [CrossRef]
  33. TNB. Supplementary Document TTS-LN-TES (S): 500/275/132 kV Monopole and Lattice Tower Earthing Design; Tenaga Nasional Berhad: Kuala Lumpur, Malaysia, 2020. [Google Scholar]
  34. Arias Velásquez, R.M.; Mejía Lara, J.V. Failures in overhead lines grounding system and a new improve in the IEEE and national standards. Eng. Fail. Anal. 2019, 100, 103–118. [Google Scholar] [CrossRef]
  35. He, J.; Zeng, R.; Zhang, B. Methodology and Technology for Power System Grounding, 1st ed.; 2013 John Wiley & Sons Singapore Pte. Ltd.: Singapore, 2012; ISBN 9781118254950. [Google Scholar]
  36. Koehler, F.; Swingler, J. Unconventional flashover mitigation measures to improve the lightning performance of transmission lines. In Proceedings of the IET International Conference on Resilience of Transmission and Distribution Networks (RTDN 2017), Birmingham, UK, 26–28 September 2017. [Google Scholar]
  37. Yasuda, Y.; Hirakawa, Y.; The, N.; Electric, K.; Co, P. Flashover analysis 500 kV transmission grounding resistance. T. IEE Japan 2000, 120, 56–62. [Google Scholar]
  38. Aiello, G.; Alfonzetti, S.; Rizzo, S.A.; Salerno, N. Thin conductor modelling combined with a hybrid numerical method to evaluate the transferred potential from isolated grounding system. Energies 2019, 12, 1210. [Google Scholar] [CrossRef] [Green Version]
  39. WG C4.33. Impact of Soil-Parameter Frequency Dependence on the Response of Grounding Electrodes and on the Lightning Performance of Electrical Systems; CIGRE: New York, NY, USA, 2019. [Google Scholar]
  40. He, J.; Zhang, B.; Zeng, R.; Zhang, B. Experimental studies of impulse breakdown delay characteristics of soil. IEEE Trans. Power Deliv. 2011, 26, 1600–1607. [Google Scholar] [CrossRef]
  41. Bewley, L.V. Traveling waves on transmission systems. Trans. Am. Inst. Electr. Eng. 1963, 51, 532–550. [Google Scholar] [CrossRef] [Green Version]
  42. Visacro, S. A comprehensive approach to the grounding response to lightning currents. IEEE Trans. Power Deliv. 2007, 22, 381–386. [Google Scholar] [CrossRef]
  43. Martinez, J.A. Power System Transients: Parameter Determination, 1st. ed.; Taylor & Francais Group: Boca Raton, FL, USA, 2010; ISBN 9781420065299. [Google Scholar]
  44. Pavel, S.G.; Maier, V.; Ciorca, C.; Beleiu, H.G.; Birou, I. Optimal design of the vertical earthing with electrodes arranged in line. Appl. Sci. 2020, 10, 5–8. [Google Scholar] [CrossRef] [Green Version]
  45. Elzowawi, A.E. Laboratory Characterisation of Soil Ionisation under Impulse Voltages. Ph.D.’s Thesis, Cardiff University, Cardiff, Wales, 2016. [Google Scholar]
  46. Gouda, O.E.; El-Saied, T.; Salem, W.A.A.; Khater, A.M.A. Evaluations of the apparent soil resistivity and the reflection factor effects on the grounding grid performance in three-layer soils. IET Sci. Meas. Technol. 2019, 13, 469–477. [Google Scholar] [CrossRef]
  47. Choi, J.H.; Lee, B.H. An analysis on the Frequency-dependent grounding impedance based on the ground current dissipation of counterpoises in the two-layered soils. J. Electrostat. 2012, 70, 184–191. [Google Scholar] [CrossRef]
  48. Mokhtari, M.; Abdul-Malek, Z.; Gharehpetian, G.B. A critical review on soil ionisation modelling for grounding electrodes. Arch. Electr. Eng. 2016, 65, 449–461. [Google Scholar] [CrossRef]
  49. Ali, A.W.A.; Ahmad, N.N.; Nor, N.M.; Reffin, M.S.; Abdullah, S.A.S. Investigations on the performance of a new grounding device with spike rods under high magnitude current conditions. Energies 2019, 12, 1138. [Google Scholar] [CrossRef] [Green Version]
  50. WG 01; Study Committee 33. Guide to Procedures for Estimating the Lightning Performance of Transmission Lines; Cigre: Paris, France, 1991; Volume 1. [Google Scholar]
  51. IEEE Std.1410. IEEE Guide for Improving the Lightning Performance of Transmission Lines; IEEE-SA Standards Board: New York, NY, USA, 1997. [Google Scholar]
  52. Rawi, I.; Kadir, M.Z.A.A.; Izadi, M. Seasonal variation of transmission line outages in Peninsular. Pertanika J. Sci. Technol. 2017, 25, 213–220. [Google Scholar]
  53. Vita, V.; Maris, T.I. Sensitivity analyses of parameters that affect the lightning performance of distribution networks with distributed generation. J. Multidiscip. Eng. Sci. Stud. 2016, 2, 774–781. [Google Scholar]
  54. Rameli, N.; Ab Kadir, M.Z.A.; Izadi, M.; Gomes, C.; Jasni, J. Evaluation of lightning induced voltage due to the effect of design parameters on medium voltage distribution line. J. Teknol. Sci. Eng. 2013, 64, 151–155. [Google Scholar] [CrossRef] [Green Version]
  55. SES & Technologies ltd. A Simple Substation Grounding Grid Analysis; SES: Montreal, QC, Canada, 2017. [Google Scholar]
  56. Rawi, I.; Kadir, M.Z.A.A.; Gomes, C. A case study on 500 kV line performance related to lightning in Malaysia. IEEE Trans. Power Deliv. 2018, 33, 2180–2186. [Google Scholar] [CrossRef]
  57. Rawi, I.M. Establishment of Optimal Externally Gapped Line Arrester Specification for 500 kV Transmission Line in Malaysia; Universiti Putra Malaysia: Seri Kembangan, Malaysia, 2017. [Google Scholar]
  58. Wang, C.; Liang, X.; Adajar, E.; Loewen, P. Seasonal variations of tower footing impedance in various transmission line grounding systems. In Proceedings of the IEEE Industry Applications Society Annual Meeting, Detroit, MI, USA, 10–16 October 2020. [Google Scholar]
  59. Charvin Anoux Group. Understanding Soil Resistivity Testing Effects of Soil Resistivity on Understanding Soil Resistivity Testing; Application Notes; Charvin Anoux Group: Paris, France, 2019. [Google Scholar]
  60. IEEE-SA Standards Board. IEEE Std. 81—Guide for Measuring Earth Resistivity, Ground Impedance, and Earth Surface Potentials of a Grounding System; IEEE: Piscataway, NJ, USA, 2012. [Google Scholar]
  61. Moradi, M. Analysis of transient performance of grounding system considering frequency-dependent soil parameters and ionization. IEEE Trans. Electromagn. Compat. 2020, 62, 785–797. [Google Scholar] [CrossRef]
  62. Safar, J.G.; Shariatinasab, R.; He, J. Comprehensive modeling of grounding electrodes buried in ionized soil based on MoM-HBM approach. IEEE Trans. Power Deliv. 2020, 35, 1390–1398. [Google Scholar] [CrossRef]
  63. Mokhtari, M.; Gharehpetian, G.B. Integration of energy balance of soil ionization in CIGRE grounding electrode resistancemodel. IEEE Trans. Electromagn. Compat. 2018, 60, 402–413. [Google Scholar] [CrossRef]
  64. IEC 62305-1. Protection against Lightning Part 1: General Principles (IEC 62305-1:2010); IEC: Geneva, Switzerland, 2011. [Google Scholar]
  65. Lovrić, D.; Vujević, S.; Modrić, T. On the estimation of Heidler function parameters for reproduction of various standardized and recorded lightning current waveshapes. Int. Trans. Electr. Energy Syst. 2013, 20, 290–300. [Google Scholar] [CrossRef]
  66. Working Group. IEEE Guide for Safety in AC Substation Grounding; CIGRE: New York, NY, USA, 2015. [Google Scholar]
  67. The Power System Communications Committee. Summary of a guide for determining the maximum electric power station ground potential rise and induce voltage from a power fault. IEEE Trans. Power Appar. Syst. 1979, PAS-98, 72–73. [Google Scholar] [CrossRef]
  68. Shariatinasab, R.; Gholinezhad, J. The effect of grounding system modeling on lightning-related studies of transmission lines. J. Appl. Res. Technol. 2017. [Google Scholar] [CrossRef] [Green Version]
  69. Abi-Samra, N. Power Grid Resiliency for Adverse Conditions; Artech House: Norwood, MA, USA, 2017; ISBN 1630814946. [Google Scholar]
  70. Elgayar, A.I.; Abdul-Malek, Z. Induced voltages on a gas pipeline due to lightning strikes on nearby overhead transmission line. Int. J. Electr. Comput. Eng. 2016, 6, 495. [Google Scholar] [CrossRef]
Figure 1. Flowchart of the work.
Sustainability 13 08370 g001
Figure 2. Structure tower of 500 kV line: (a) dimensions of a 500 kV transmission tower; (b) location of the 500 kV double circuit line from line A to B.
Sustainability 13 08370 g002
Figure 3. Wenner method measurement.
Sustainability 13 08370 g003
Figure 4. Wenner configuration method and multilayer in RESAP.
Sustainability 13 08370 g004
Figure 5. Representation of Design A for moderate soil resistivity condition.
Sustainability 13 08370 g005
Figure 6. Representation of design B for high soil resistivity condition.
Sustainability 13 08370 g006
Figure 7. Representation of Design C for very high soil resistivity condition.
Sustainability 13 08370 g007
Figure 8. Lightning impulse wave 10/350 µs.
Sustainability 13 08370 g008
Figure 9. Tower T40 soil structure interpretation.
Sustainability 13 08370 g009
Figure 10. Tower T41 soil structure interpretation.
Sustainability 13 08370 g010
Figure 11. Tower T44 soil structure interpretation.
Sustainability 13 08370 g011
Figure 12. Tower T45 soil structure interpretation.
Sustainability 13 08370 g012
Figure 13. Tower T46 soil structure interpretation.
Sustainability 13 08370 g013
Figure 14. Tower T49 soil structure interpretation.
Sustainability 13 08370 g014
Figure 15. Earthing impedance when buried in the two-layer case.
Sustainability 13 08370 g015
Figure 16. Earthing impedance when buried in the three-layer case.
Sustainability 13 08370 g016
Figure 17. Simulated GPR of radial and ring electrodes for Design A, buried in two and three layers (T40, T41, T44, T45, T46, and T49).
Sustainability 13 08370 g017
Figure 18. Simulated GPR of radial and ring electrodes for Design B, buried in two and threelayers (tower T40, tower T41, tower T44, tower T45, tower T46, and tower T49).
Sustainability 13 08370 g018
Figure 19. Simulated GPR of radial and ring electrodes for Design C, buried in two and three layers (T40, T41, T44, T45, T46, and T49).
Sustainability 13 08370 g019
Figure 20. Earthing impedance: (a) magnitude and (b) phase of different soil resistivity for Design A.
Sustainability 13 08370 g020
Figure 21. Earthing impedance: (a) magnitude and (b) phase of different soil resistivity for Design B.
Sustainability 13 08370 g021aSustainability 13 08370 g021b
Figure 22. Earthing impedance: (a) magnitude and (b) phase of different soil resistivity for Design C.
Sustainability 13 08370 g022
Table 1. Tower footing resistance setting by other countries.
CountrySoil Resistivity, ΩmTFR, ΩReferenceRemark
Peru-25[34]For all line ratings
Columbia-20[34]For all line ratings
Spain-10[34]For all line ratings
China≤100
>100 to 500
>500 to 1000
>1000 to 2000
>2000
10
15
20
25
30
[35]Measured in summer without connection to the tower.
UK-10[36]For all line ratings
Japan-10[37]For all line ratings
Table 2. Average of apparent resistance (Ω) value.
Spacing, A
(m)
Average Apparent Resistance (Ω)
T40T41T44T45T46T49
1.0184.50185.70315.80236.40185.66162.63
1.5101.8092.53179.8395.9292.5394.52
2.067.5860.60148.0653.6360.6057.24
3.026.9636.0675.1735.9736.0636.20
4.510.7820.7949.0620.1420.7923.75
6.05.2618.0336.3216.9218.0316.87
9.02.1116.0225.8610.7216.0211.81
13.51.9112.5219.659.0012.5210.58
18.02.6810.0716.579.8710.077.46
Table 3. Heidler function parameters of 10/350 µs waveform [23,24].
Heidler Function Parameters Waveform
10/350 µs
Peak Current, I032.4 kA
Ʈ1 (µs)19
Ʈ2 (µs)485
n7
Table 4. Earthing impedance analysis for different design arrangement.
Num.Earthing ArrangementTower Footing Impedance Value, Ω
T40T41T44T45T46T49
1.Design A5.318.213.84.719.715.6
2.Design B4.515.711.741713.4
3.Design C4.31510.8416.512.7
Publisher’s Note: MDPI stays neutral with regard to jurisdictional claims in published maps and institutional affiliations.

