Seasonal Influences on the Impulse Characteristics of Grounding Systems for Tropical Countries

 , and
, and
Abstract
:1. Introduction
2. Experimental Arrangement
2.1. Review of Field Testing and Measurements
2.1.1. Distance of Remote Earth from the Electrode under Tests
2.1.2. Impulse Generator
2.1.3. Remote Earth/Auxiliary Earth
2.1.4. Placement of Current Transducer
2.2. Test Set up for This Study
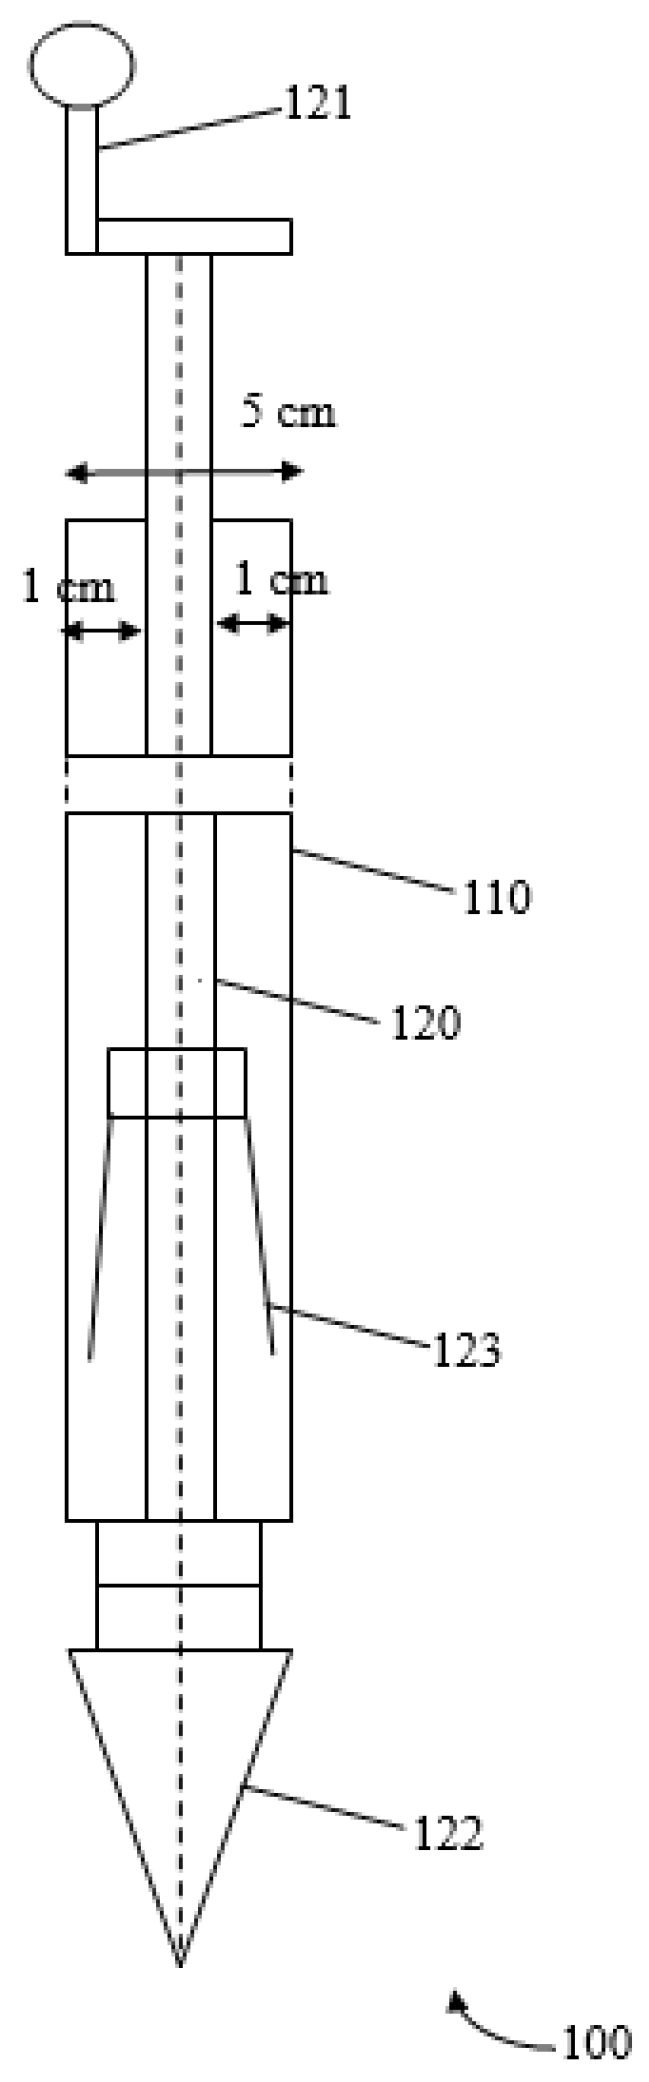
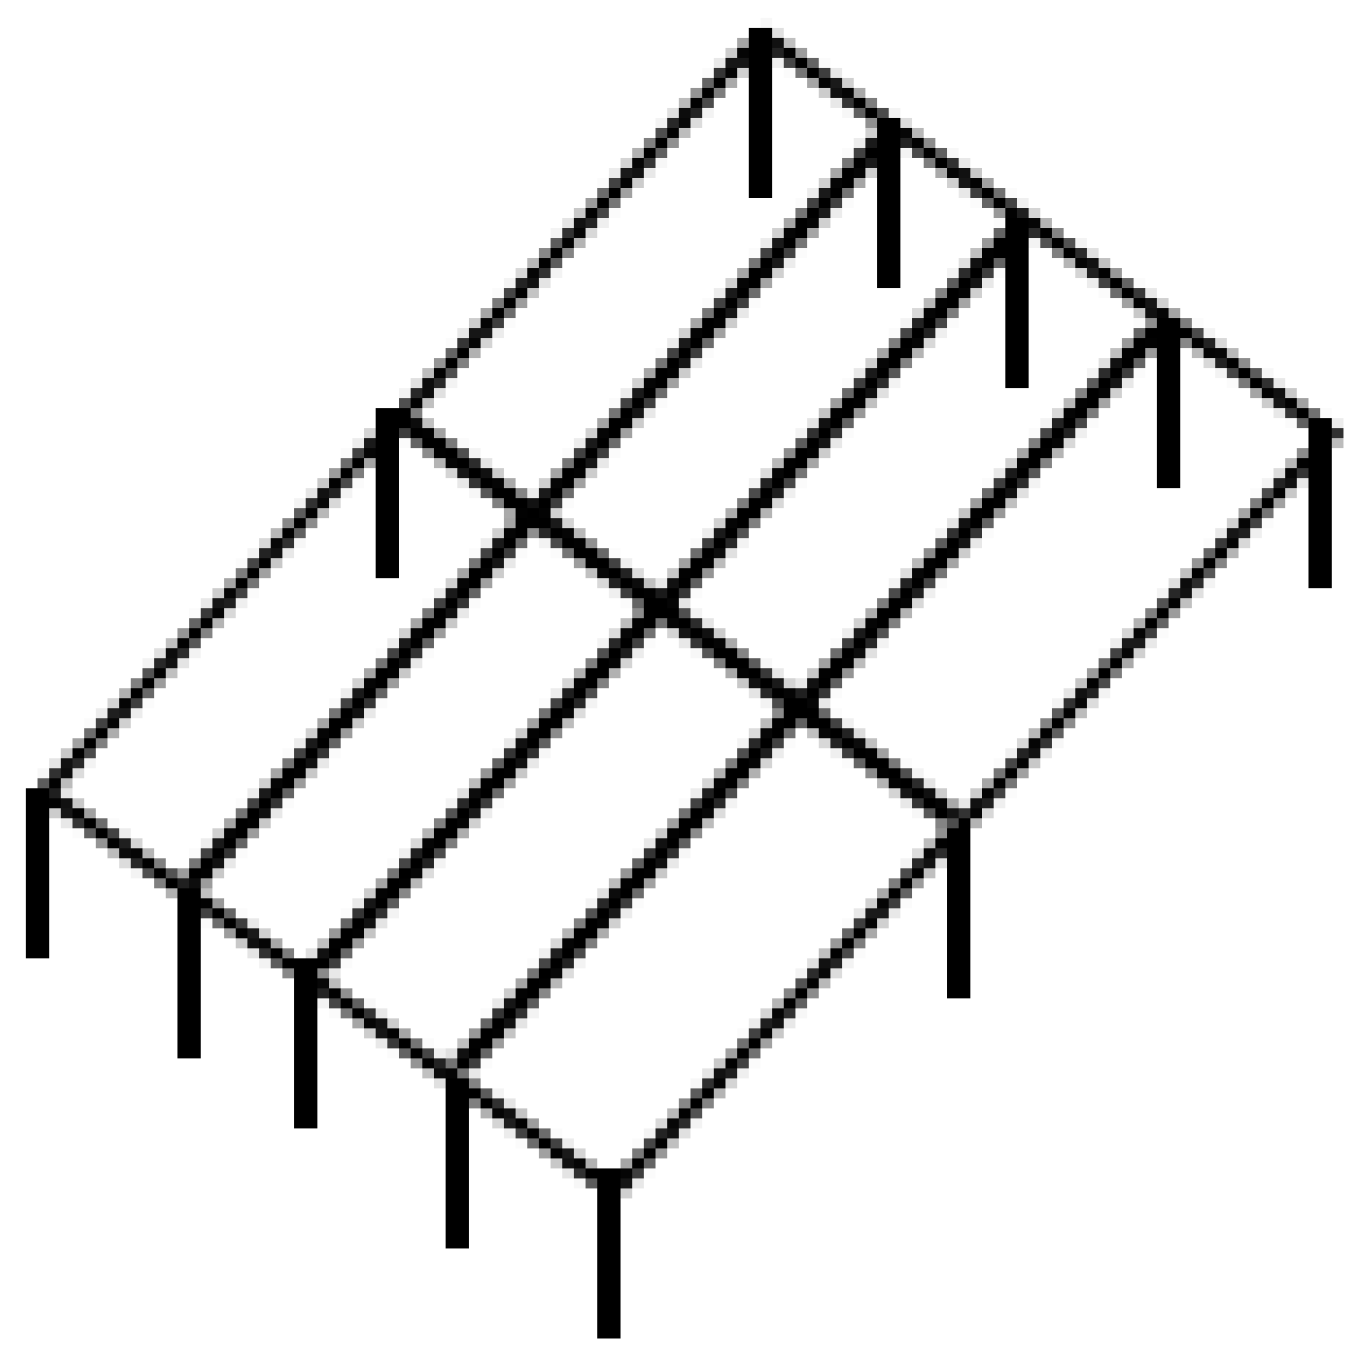
2.3. Electrodes under Tests
2.4. Auxillary or Remote Electrodes
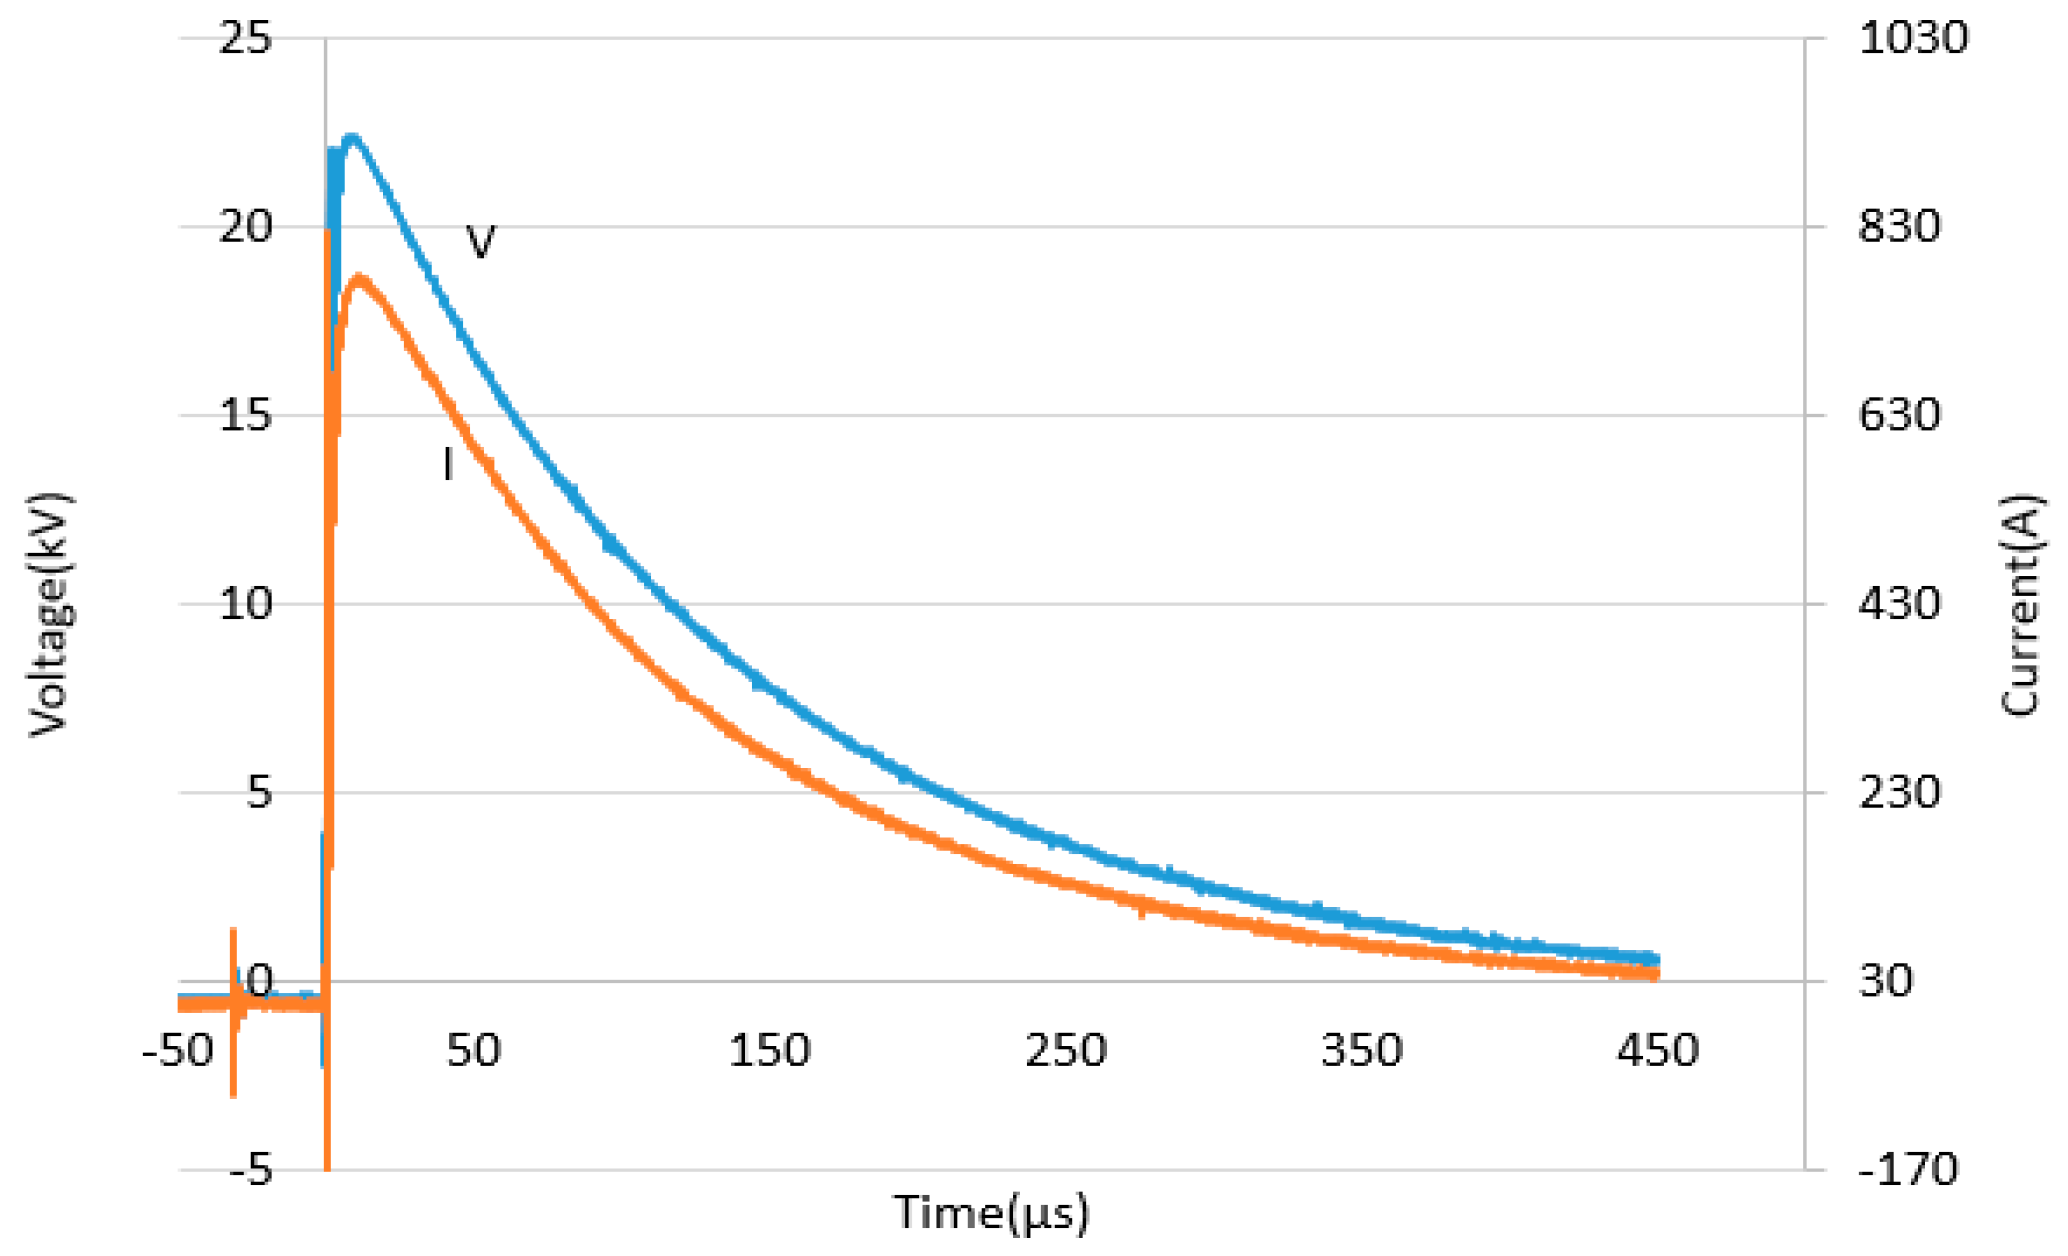
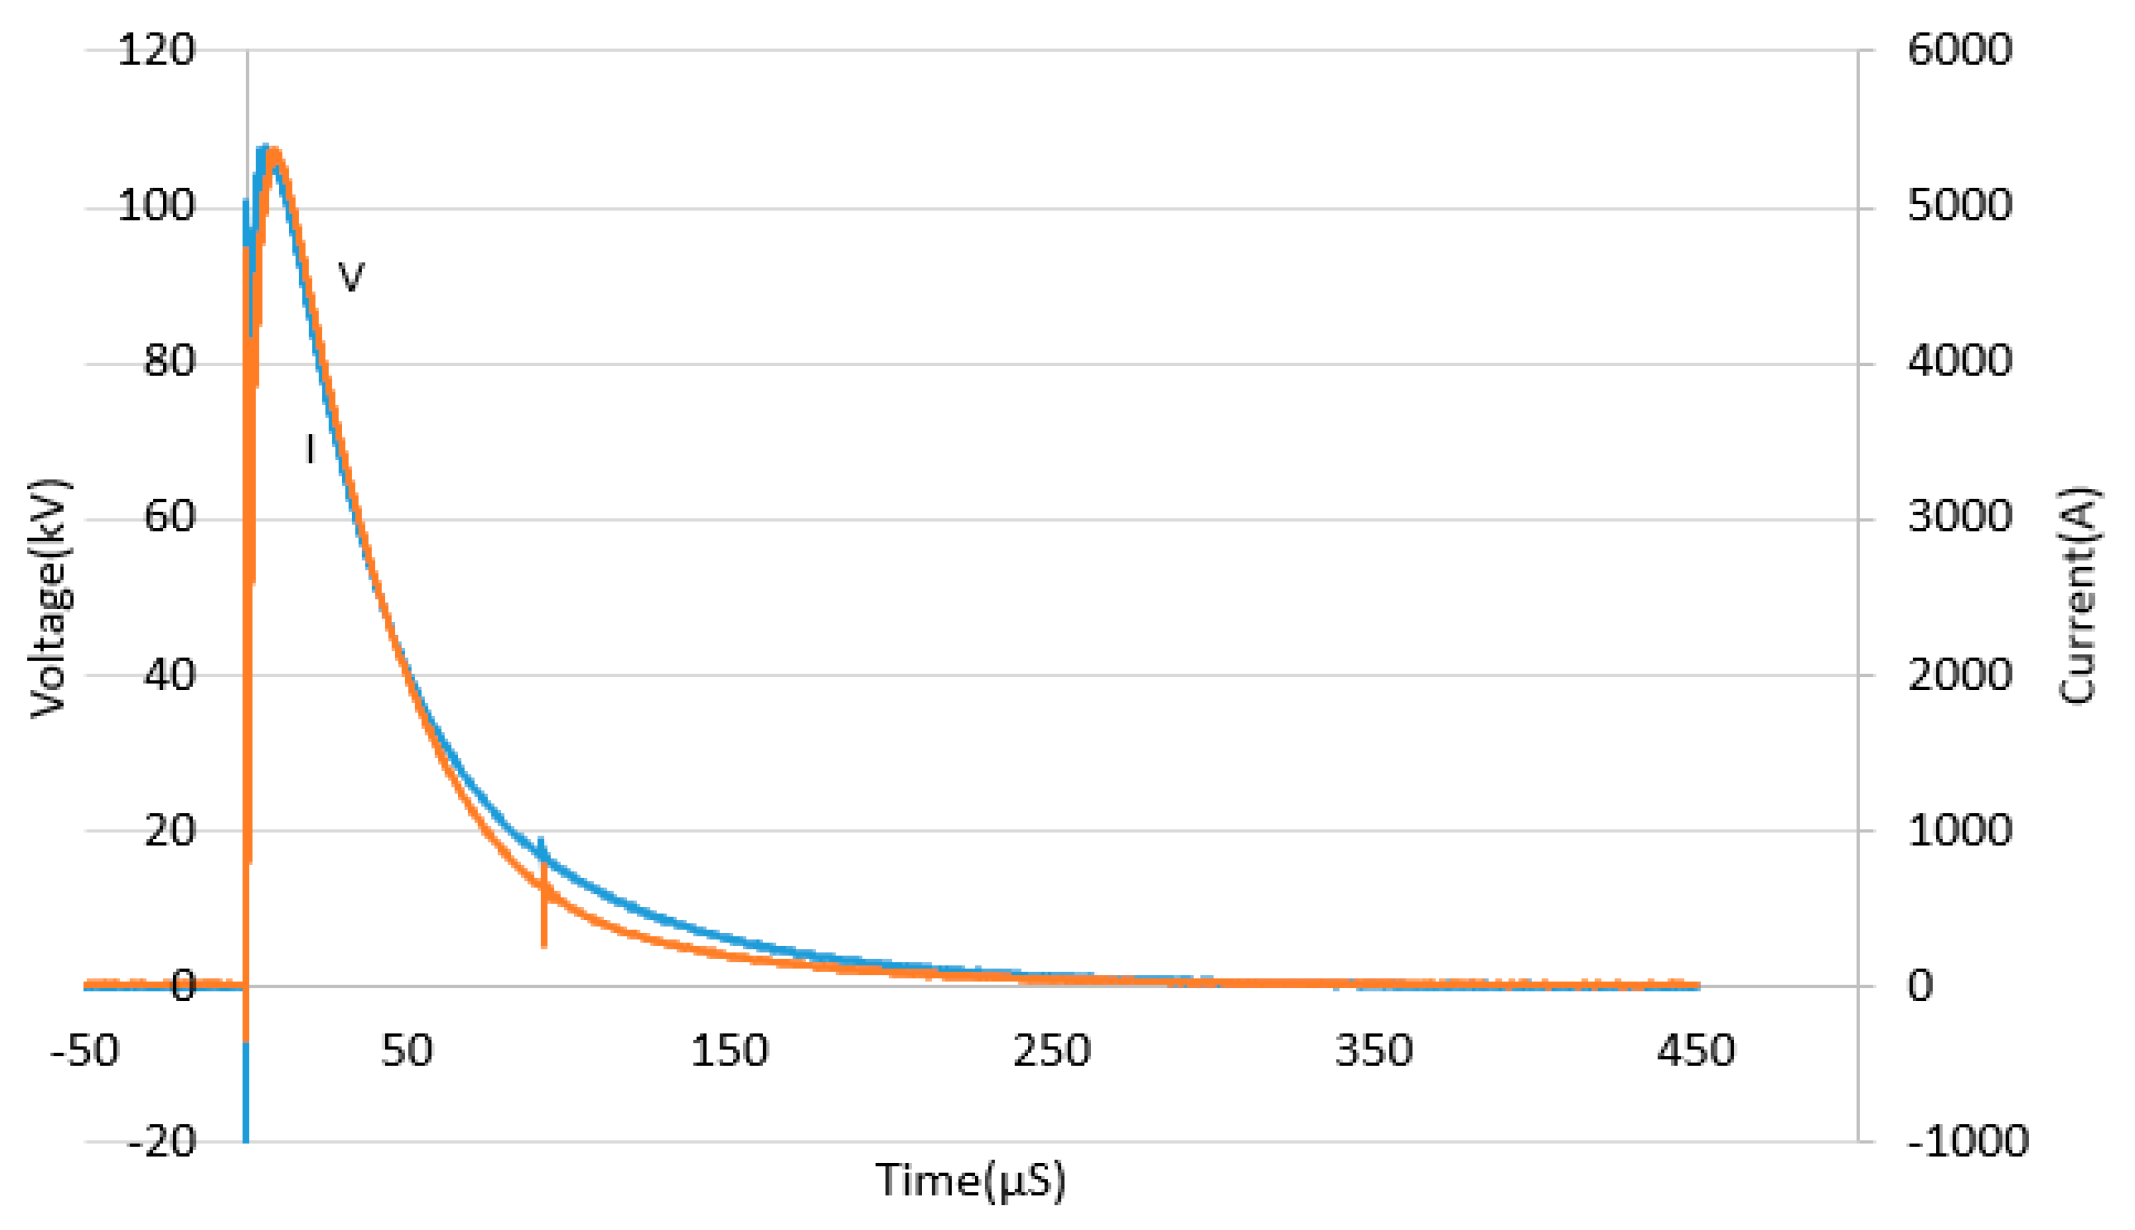
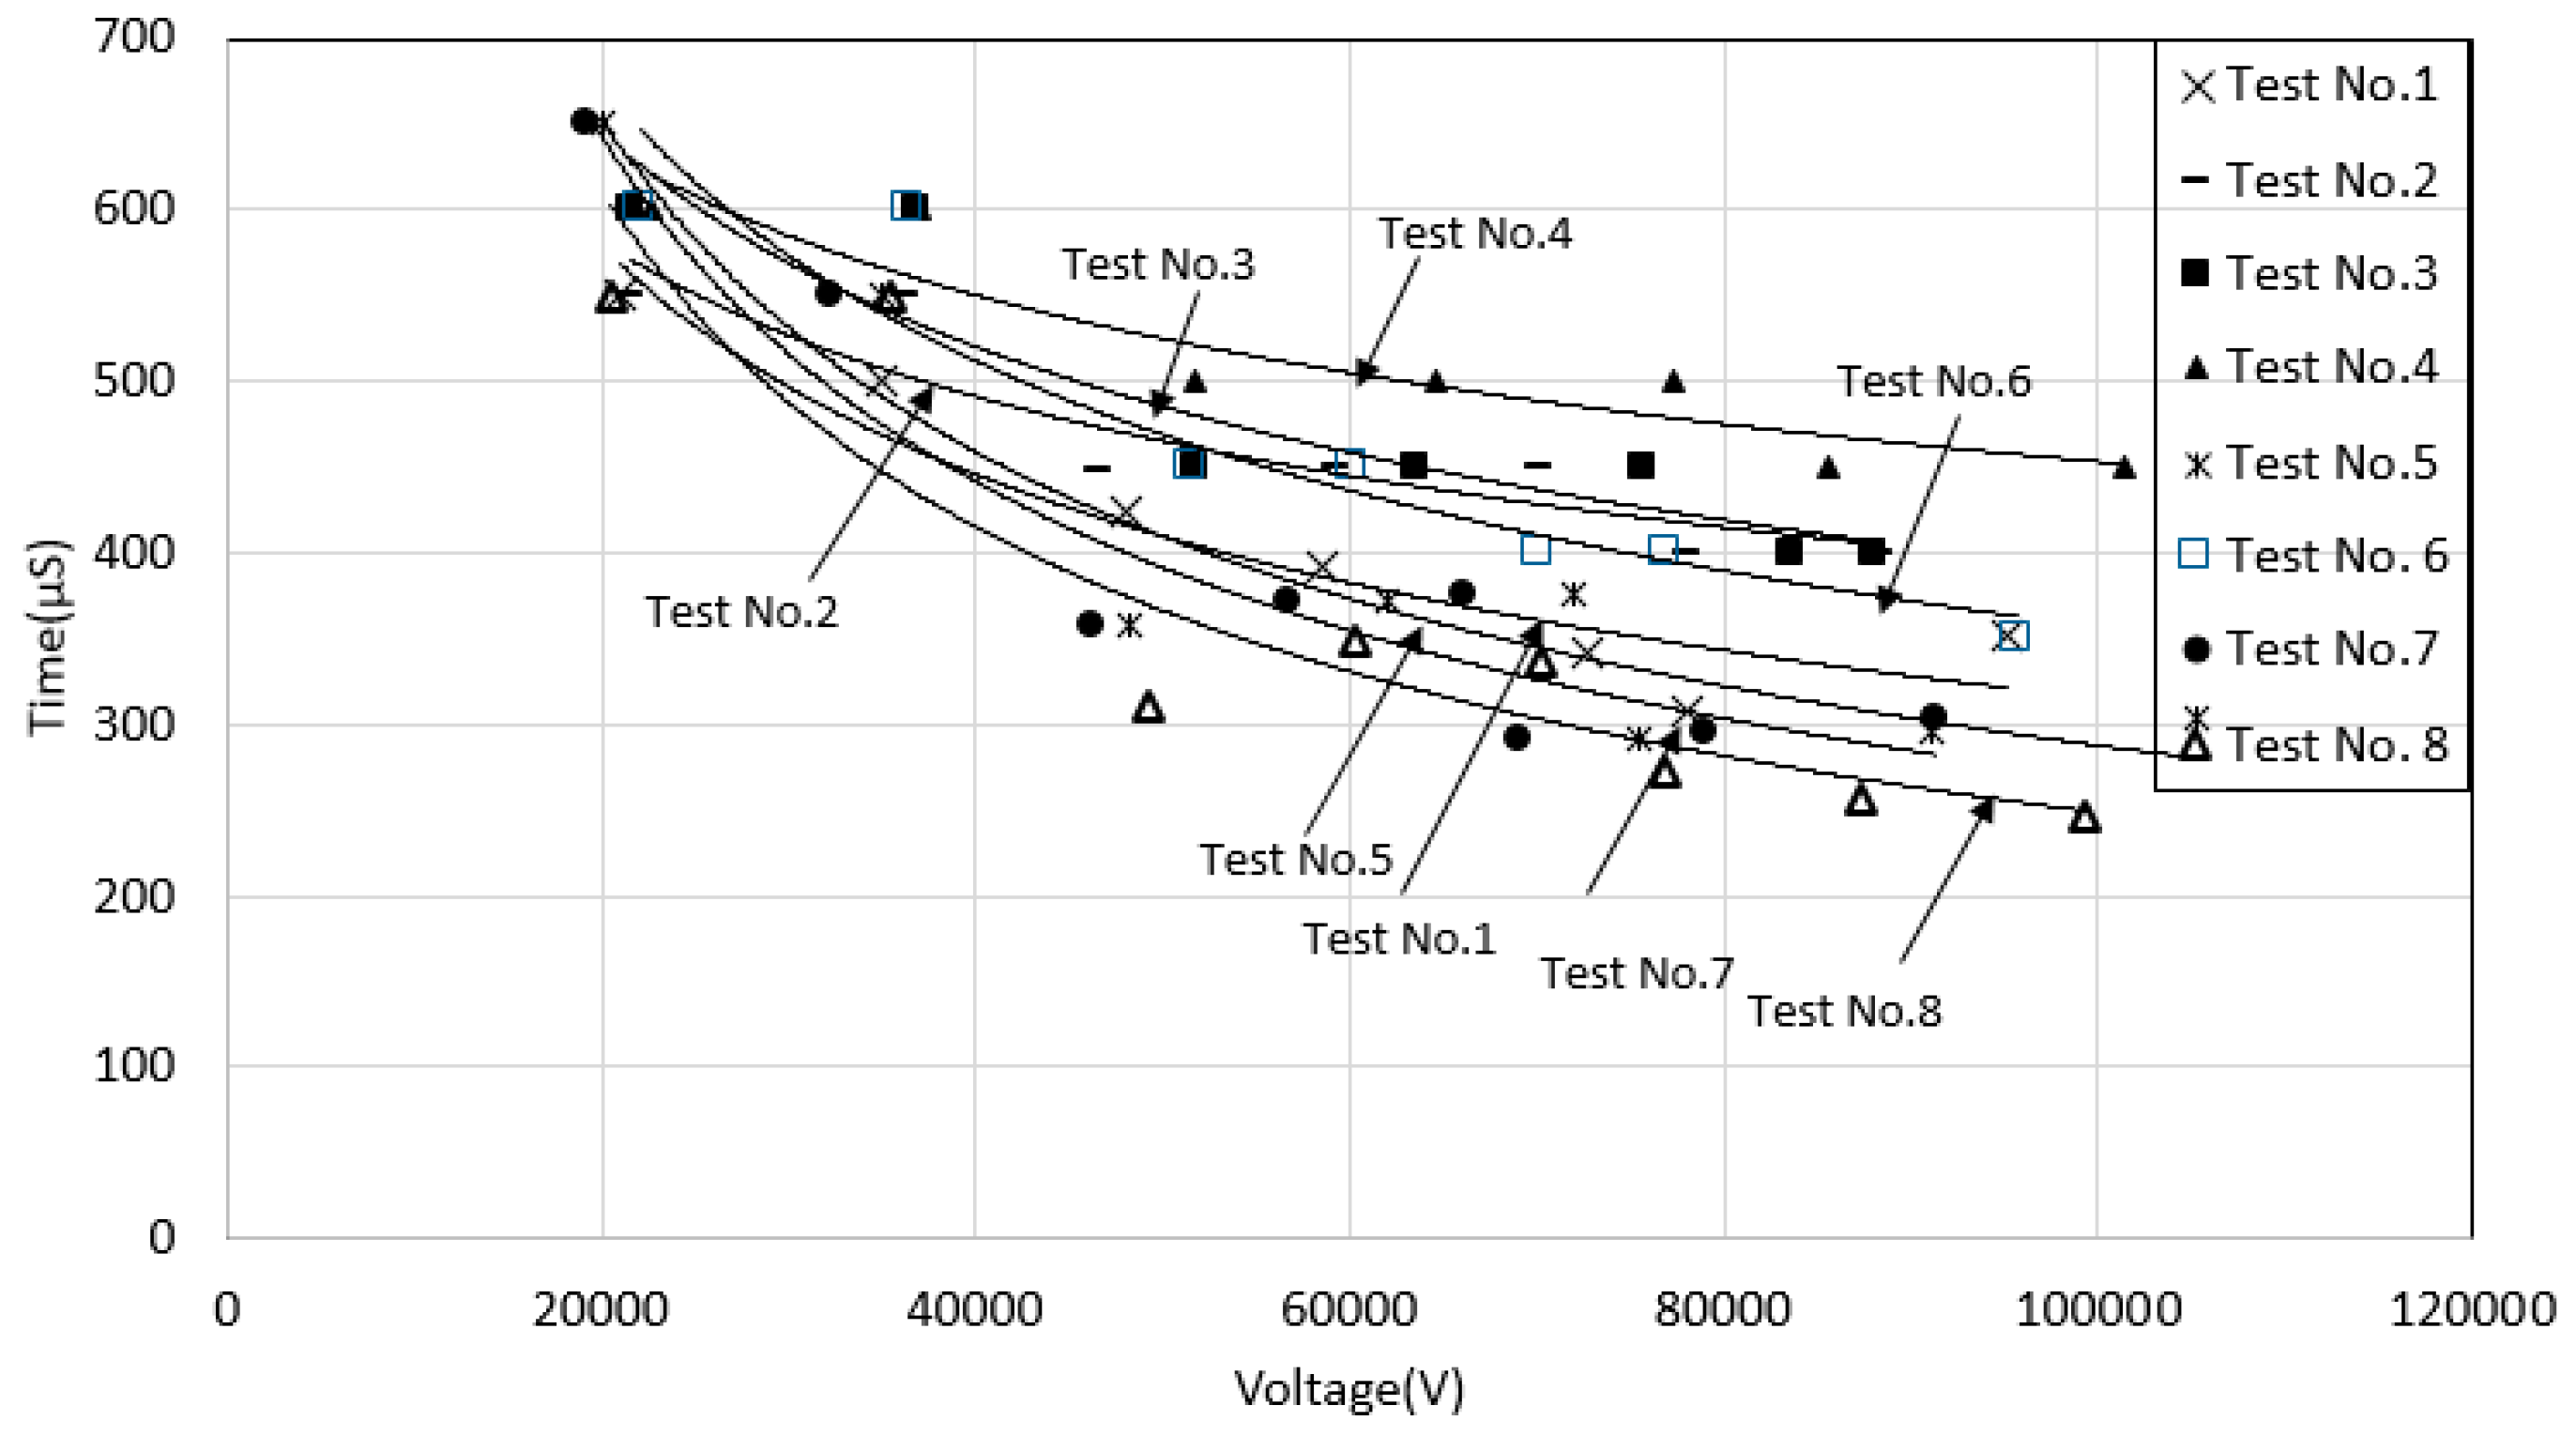
3. Results and Analysis
4. Conclusions
Author Contributions
Funding
Conflicts of Interest
Subscripts and Abbreviations
| DC | Direct current |
| Rimpulse | Resistance values measured under impulse condition |
| RDC | Resistance values measured at low voltage, low frequency currents |
| DSO | Digital Storage Oscilloscope |
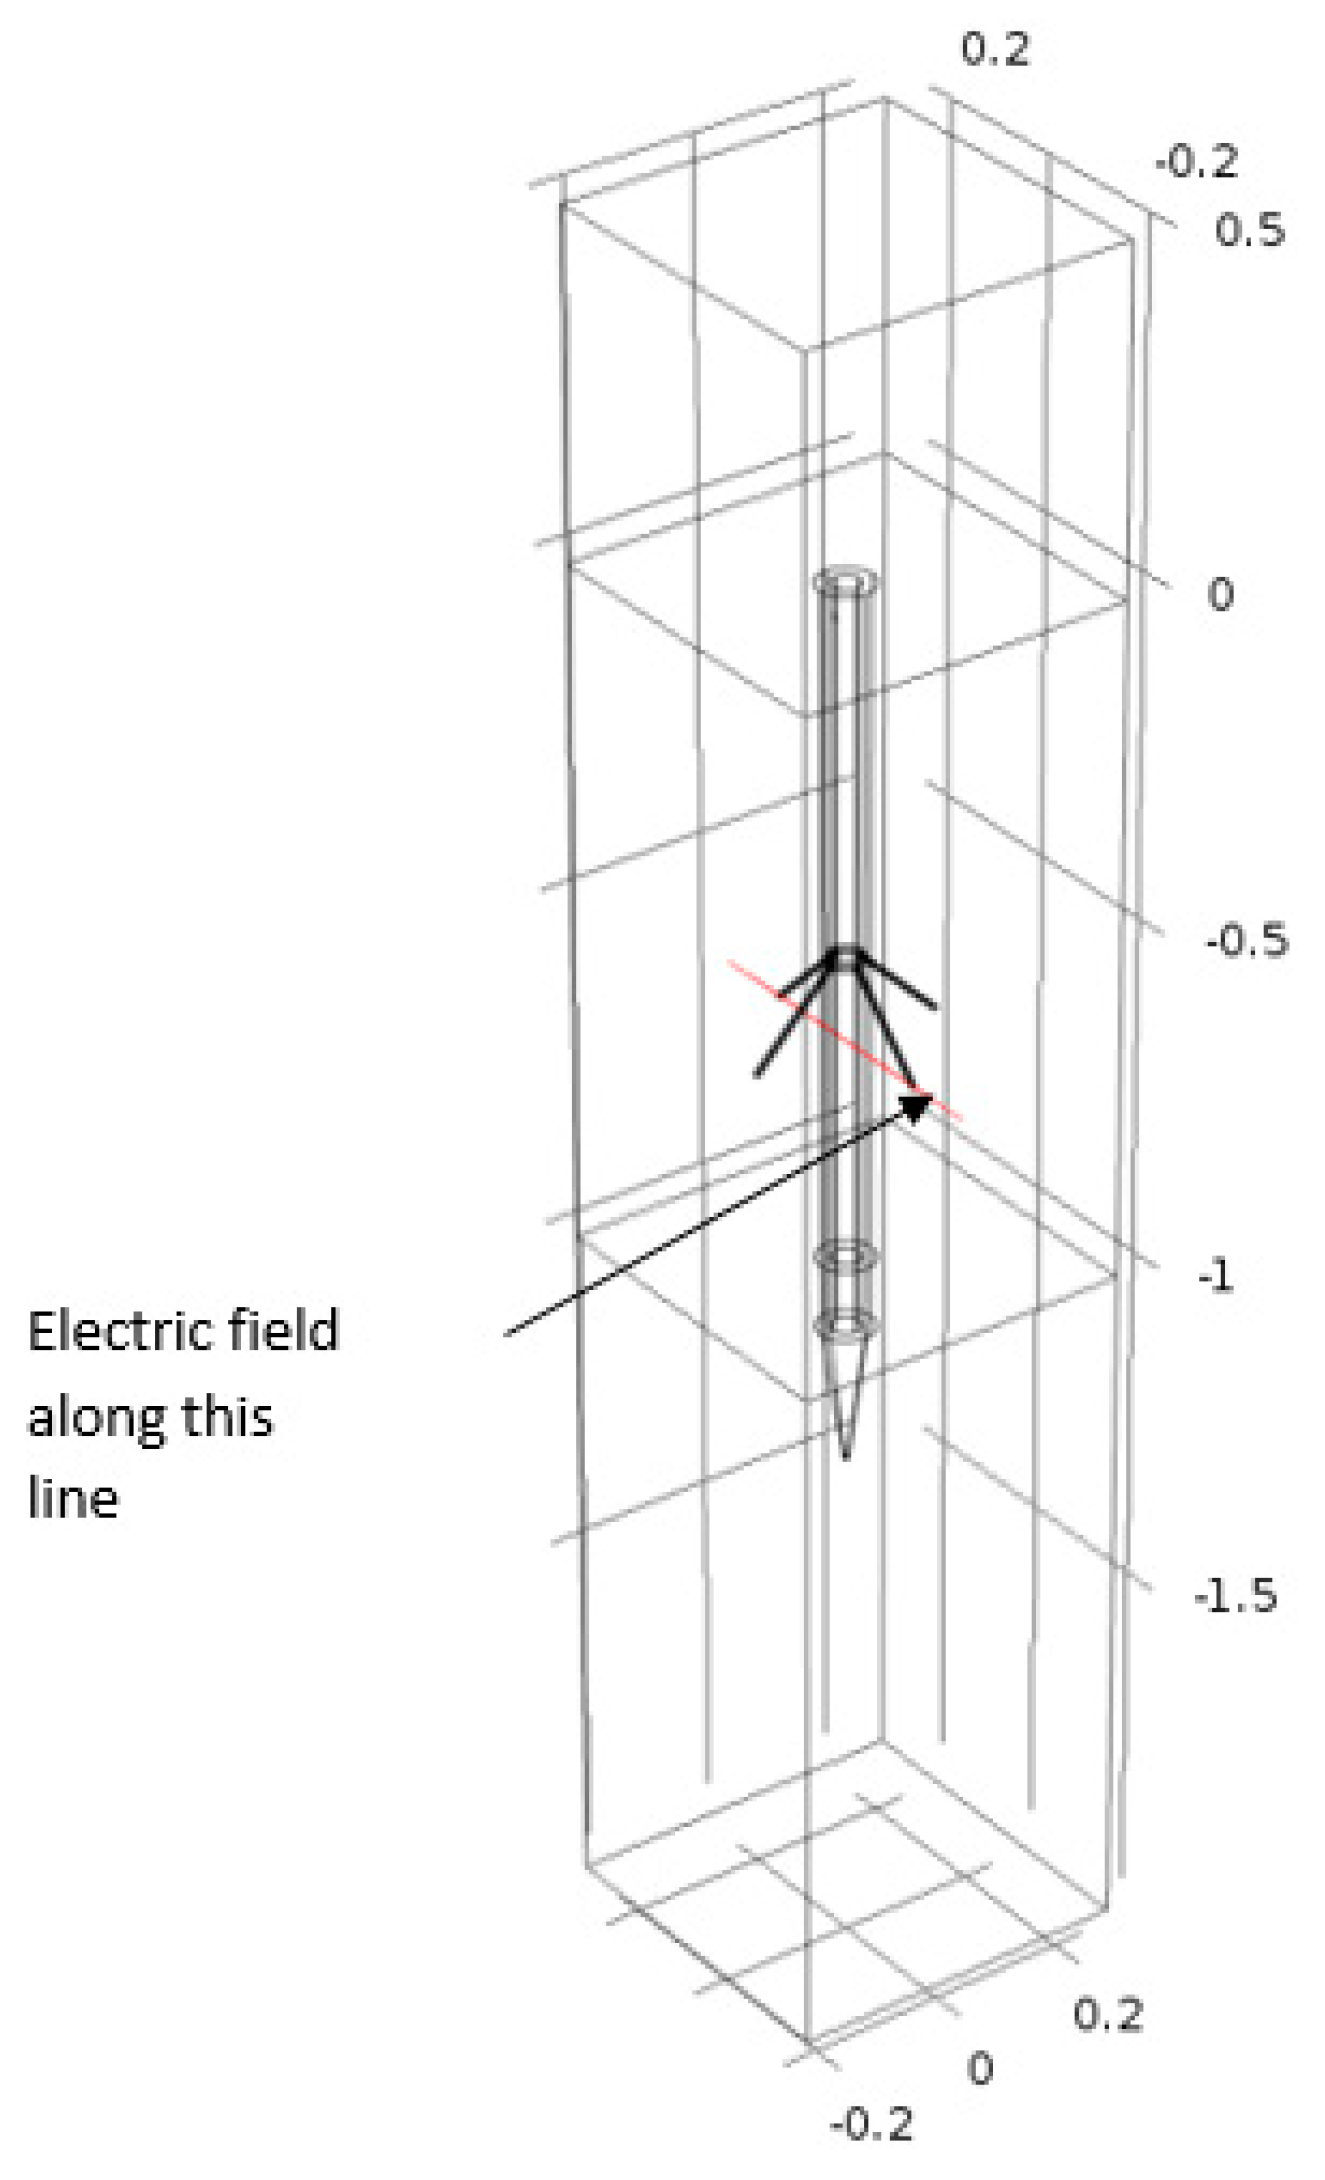
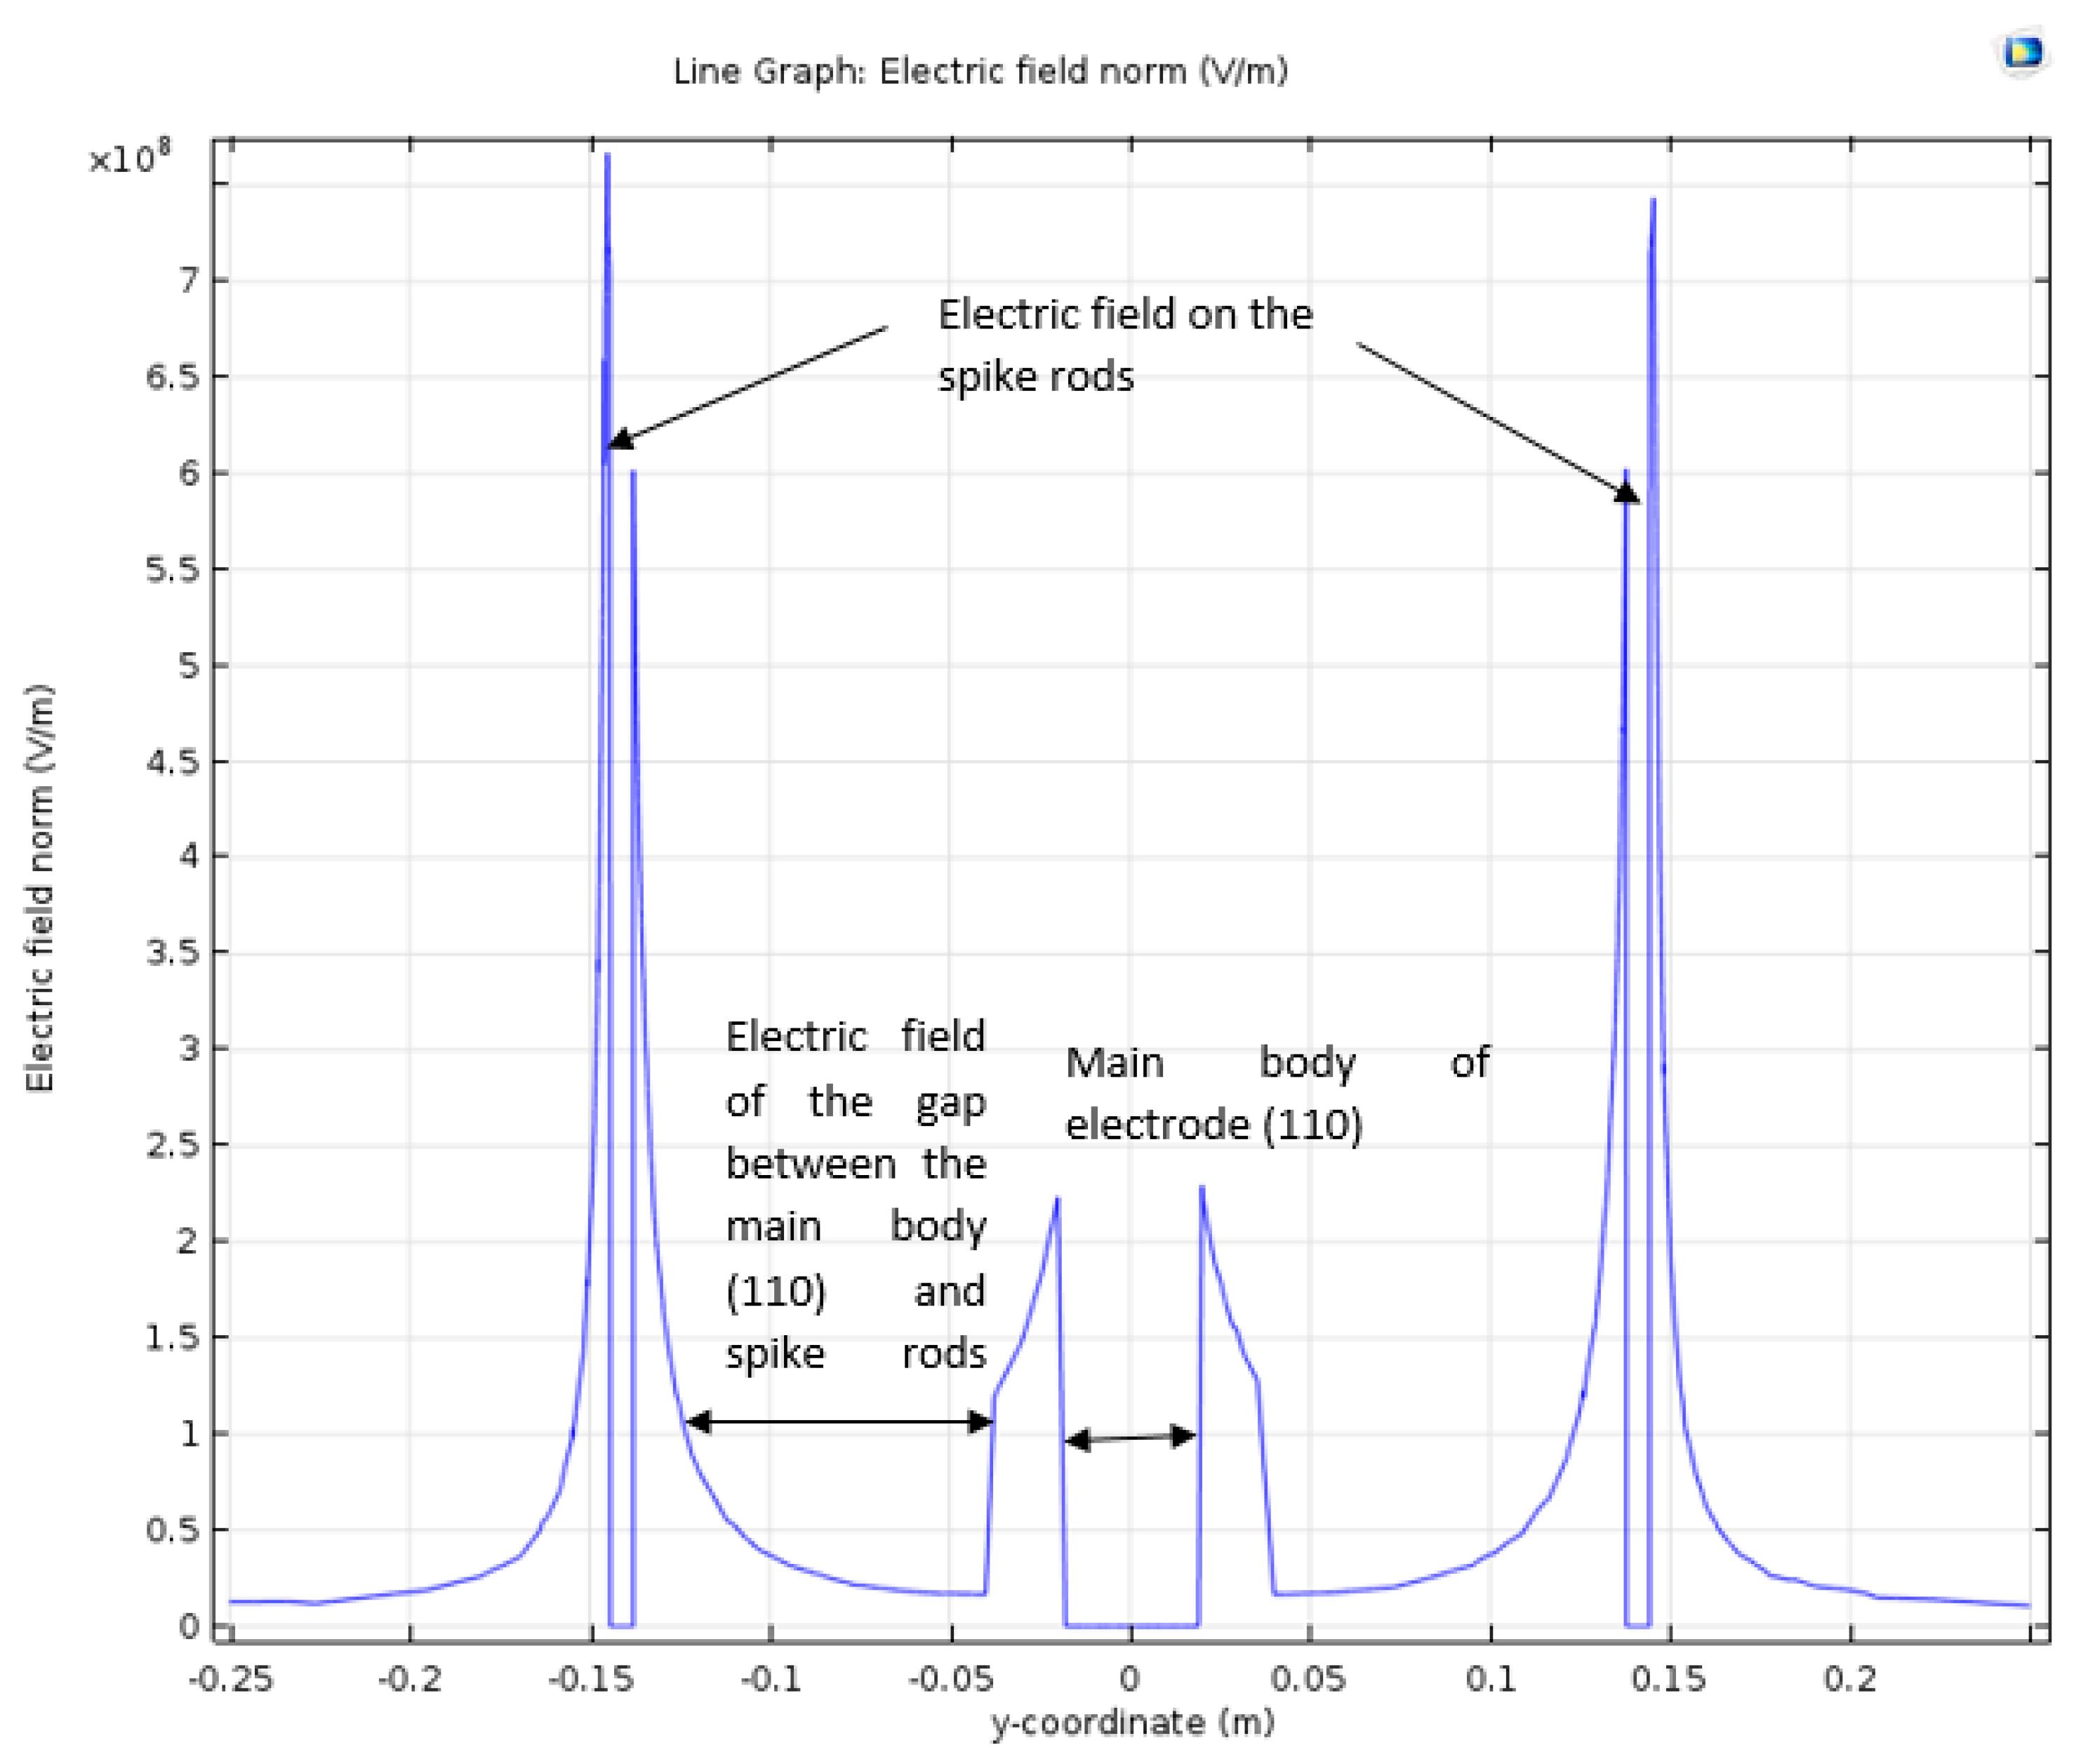
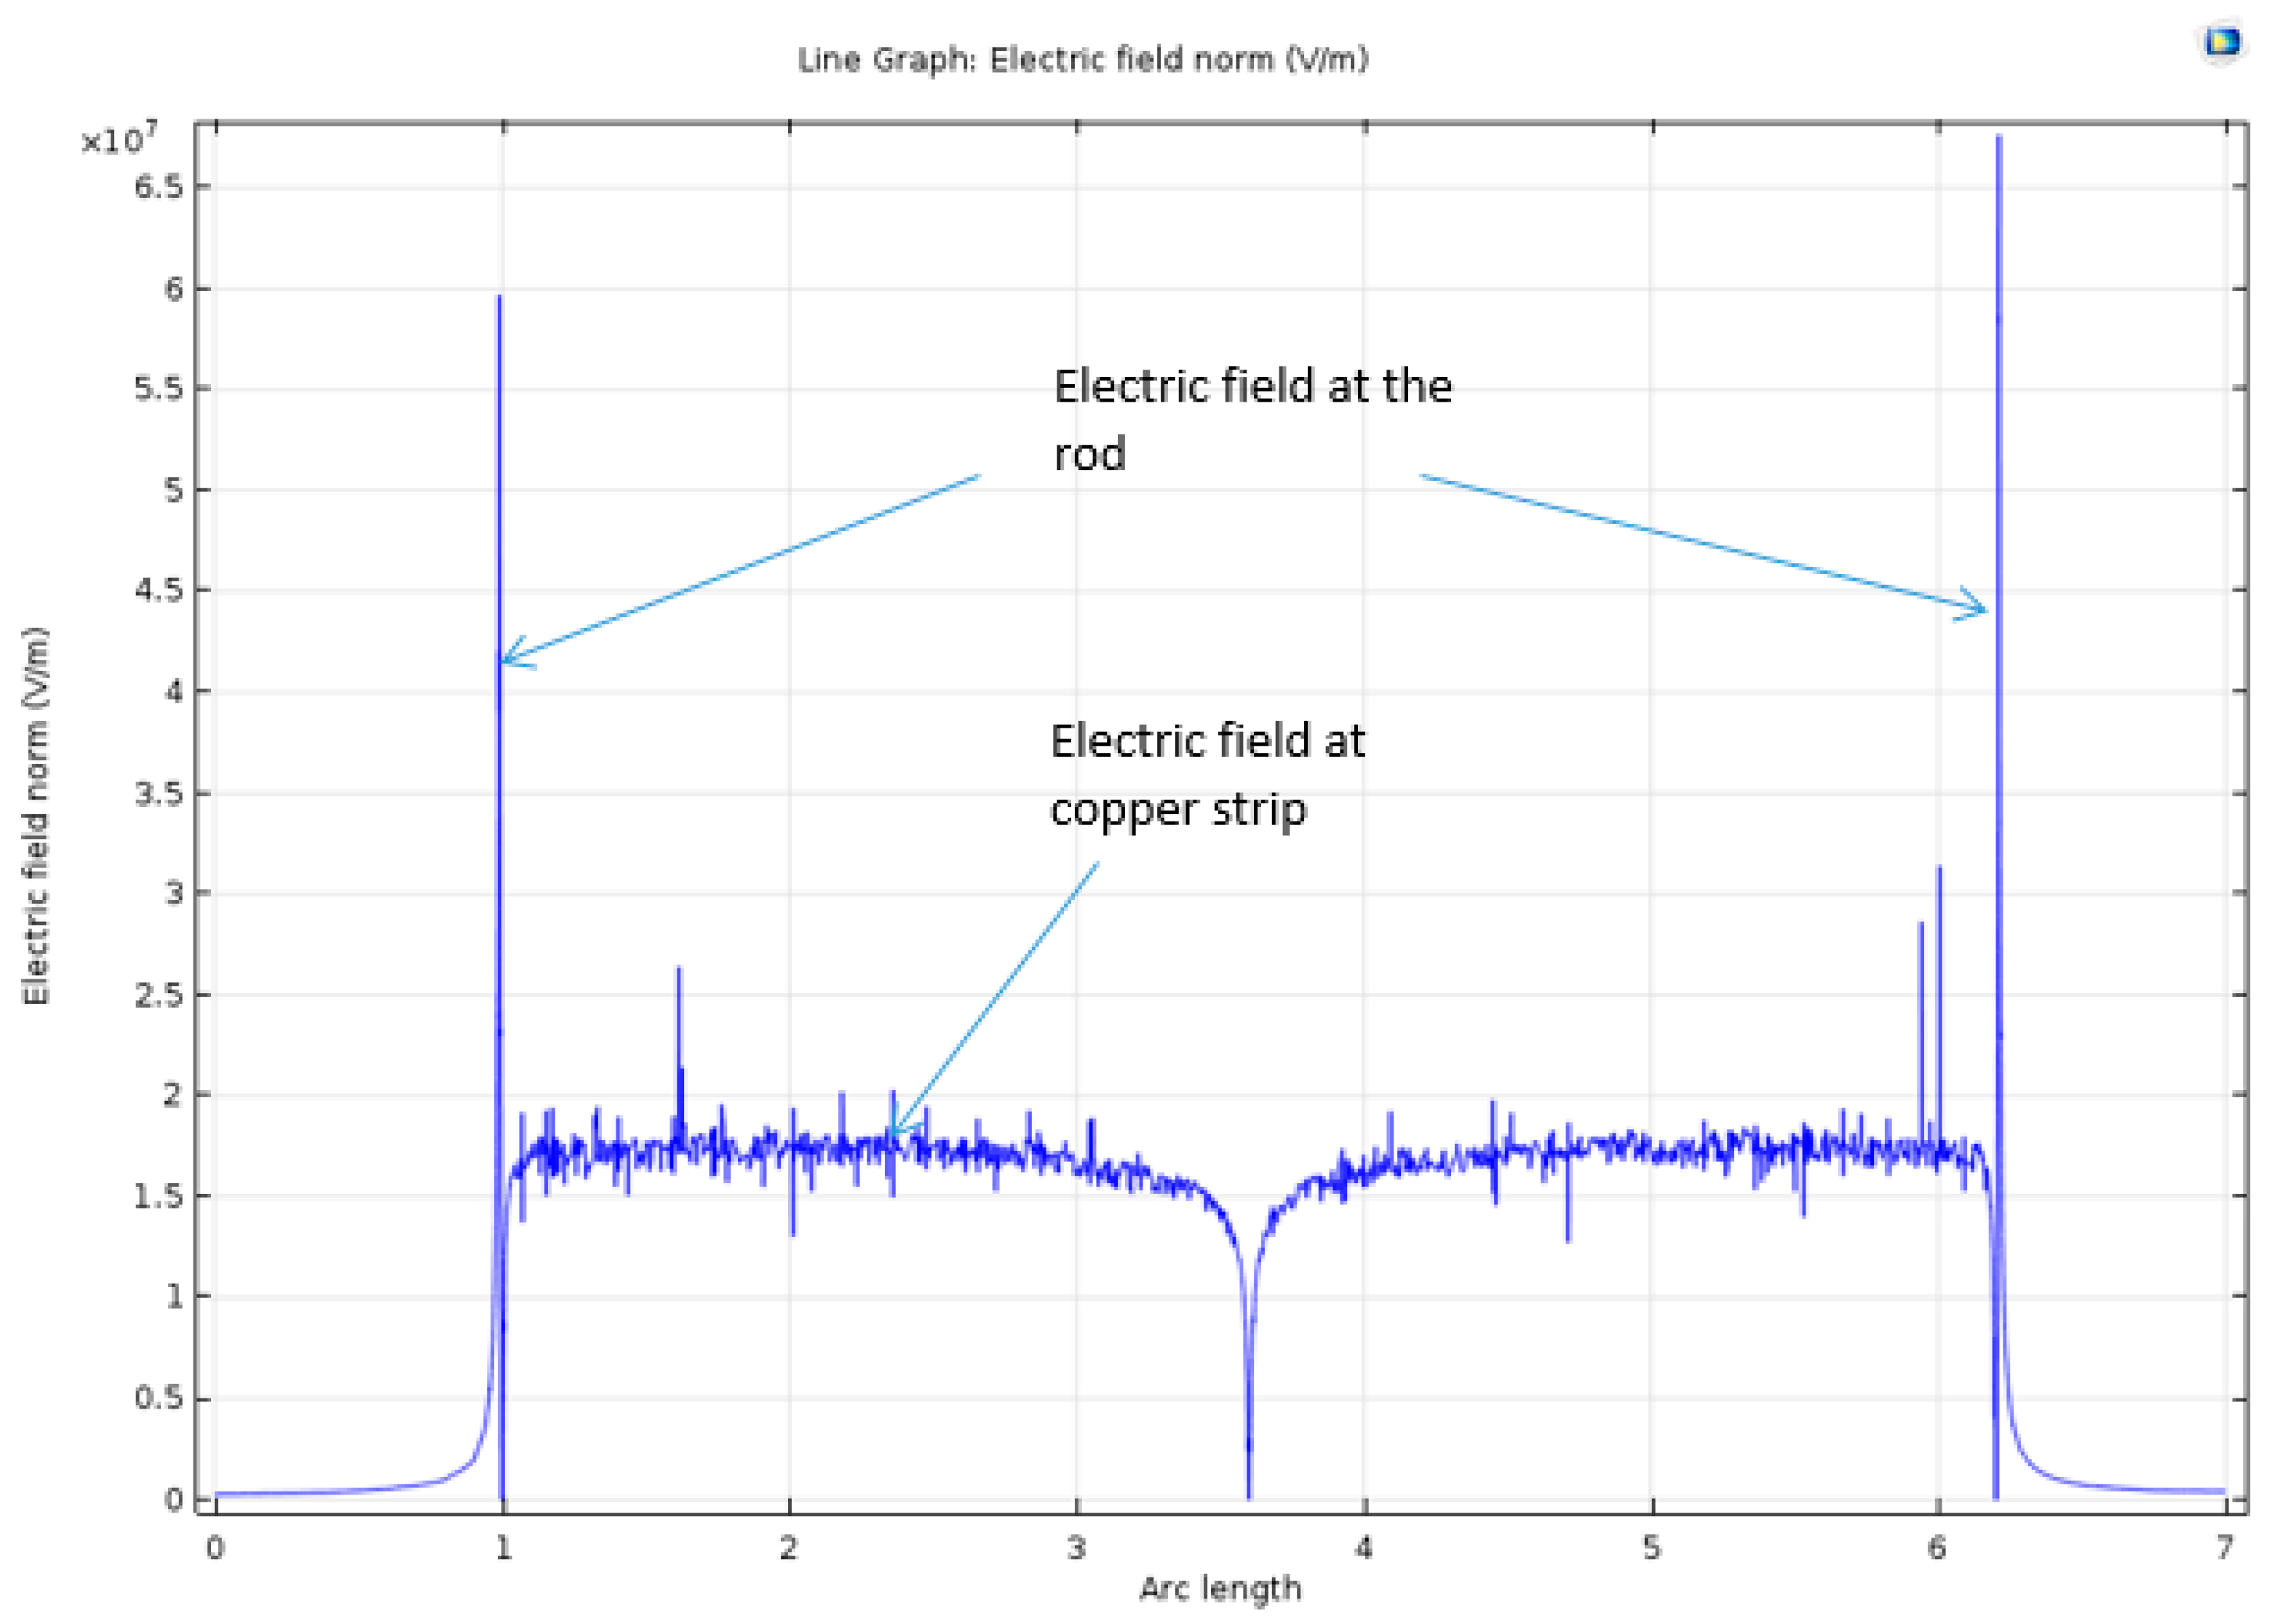
| FEM | Finite Element Method |
| CDEGS | Current Distribution, Electromagnetic Fields, Grounding and Soil Structure Analysis |
| FOP | Fall-of-Potential |
References
- ANSI/IEEE Std 81-2012. IEEE Guide for Measuring Earth Resistivity, Ground Impedance, and Earth Surface Potentials of a Ground System; IEEE: Piscataway, NJ, USA, 2012. [Google Scholar]
- Reffin, M.S.; Nor, N.M.; Ahmad, N.N.; Abdullah, S.A. Performance of Practical Grounding Systems under High Impulse Conditions. Energies 2018, 11, 3187. [Google Scholar] [CrossRef]
- Tu, Y.; He, J.; Zeng, R. Lightning Impulse Performances of Grounding Devices Covered with Low-Resistivity Materials. IEEE Trans. Power Deliv. 2006, 21, 1701–1706. [Google Scholar] [CrossRef]
- Gustafson, R.J.; Pursley, R.; Albertson, V.D. Seasonal Grounding Resistance Variation on Distribution Systems. IEEE Trans. Power Deliv. 1990, 5, 1013–1018. [Google Scholar] [CrossRef]
- Abdullah, N.; Marican, A.; Osman, M.; Abdul, N. Rahman Case Study on Impact of Seasonal Variations of Soil Resistivities on Substation Grounding Systems Safety in Tropical Country. In Proceedings of the 7th Asia-Pacific International Conference on Lightning, Chengdu, China, 1–4 November 2011; pp. 150–154. [Google Scholar]
- Gonos, I.; Gonos, I.F.; Moronis, A.X.; Stathopulos, I.A. Variation of Soil Resistivity and Ground Resistance during the Year. In Proceedings of the 28th International Conference on Lightning Protection (ICLP), Kanazawa, Japan, 17–21 September 2006; pp. 740–744. [Google Scholar]
- Androvitsaneas, V.P.; Gonos, I.; Stathopulos, I.A. Performance of Ground Enhancing Compounds during the Year. In Proceedings of the 34th International Conference on Lightning Protection (ICLP), Rzeszow, Poland, 2–7 September 2018; pp. 1–5. [Google Scholar]
- He, J.; Wu, J.; Zhang, B.; Yu, S. Field Testing for Observation of Seasonal Influence on Grounding Device at Impulse Condition. In Proceedings of the Asia-Pacific Symposium on Electromagnetic Compatibility, Singapore, 21–24 May 2012; pp. 445–448. [Google Scholar]
- ANSI/IEEE Std 80-2013: IEEE Guide for Safety in AC Substation Grounding; IEEE: Piscataway, NJ, USA, 2013.
- IEEE 142-2007: IEEE Recommended Practice for Grounding of Industrial and Commercial Power Systems; IEEE: Piscataway, NJ, USA, 2007.
- Bellaschi, P.L. Impulse and 60-Cycle Characteristics of Driven Grounds. IEE Trans. Power Appar. Syst. 1941, 60, 123–128. [Google Scholar]
- Kosztaluk, R.; Loboda, M.; Mukhedkar, D. Experimental Study of Transient Ground Impedances. IEEE Trans. Power Appar. Syst. 1981, 100, 4653–4660. [Google Scholar] [CrossRef]
- Sekioka, S.; Hara, T.; Ametani, A. Development of a Nonlinear Model of a Concrete Pole Grounding Resistance. In Proceedings of the International Conference on Power Systems Transients, Lisbon, Portugal, 3–7 September 1995; pp. 463–468. [Google Scholar]
- Dick, W.K.; Holliday, H.R. Impulse and Alternating Current Tests on Grounding Electrodes in Soil Environment. IEEE Trans. Power Appar. Syst. 1978, PAS-97, 102–108. [Google Scholar] [CrossRef]
- Sekioka, S.; Sonoda, T.; Ametani, A. Experimental Study of Current Dependent Grounding Resistance of Rod Electrode. IEEE Trans. Power Deliv. 2005, 20, 1569–1576. [Google Scholar] [CrossRef]
- Morimoto, A.; Hayashida, H.; Sekioka, S.; Isokawa, M.; Hiyama, T.; Mori, H. Development of Weatherproof Mobile Impulse Voltage Generator and Its Application to Experiments on Nonlinearity of Grounding Resistance. Trans. Inst. Electr. Eng. Jpn. 1997, 117, 22–33. (In English) [Google Scholar] [CrossRef]
- Yunus, S.; Nor, N.M.; Agbor, N.; Abdullah, S.; Ramar, K. Performance of Earthing Systems for Different Earth Electrode Configurations. IEEE Trans. Ind. Appl. 2015, 51, 5335–5342. [Google Scholar] [CrossRef]
- Ramamoorty, M.; Narayanan, M.M.B.; Parameswaran, S.; Mukhedkar, D. Transient Performance of Grounding Grids. IEEE Trans. Power Deliv. 1989, 4, 2053–2059. [Google Scholar] [CrossRef]
- Yang, S.; Zhou, W.; Huang, J.; Yu, J. Investigation on Impulse Characteristic of Full-Scale Grounding Grid in Substation. IEEE Trans. Electromagn. Compat. 2017, 60, 1993–2001. [Google Scholar] [CrossRef]
- Clark, D.; Guo, D.; Lathi, D.; Harid, N.; Griffiths, H.; Ainsley, A.; Haddad, A. Controlled Large-Scale Tests of Practical Grounding Electrodes- Part II: Comparison of Analytical and Numerical Predictions with Experimental Results. IEEE Trans. Power Deliv. 2014, 29, 1240–1248. [Google Scholar] [CrossRef]
- Harid, N.; Griffiths, H.; Haddad, A. Effect of Ground Return Path on Impulse Characteristics of Earth Electrodes. In Proceedings of the 7th Asia-Pacific International Conference on Lightning, Chengdu, China, 1–4 November 2011; pp. 686–689. [Google Scholar]
- Abdullah, S.; Nor, N.M.; Etopi, N.; Reffin, M.; Othman, M. Influence of Remote Earth and Impulse Polarity on Earthing Systems by Field Measurements. IET Sci. Meas. Technol. 2017, 12, 308–313. [Google Scholar] [CrossRef]
- Towne, H.M. Impulse Characteristics of Driven Grounds. Gen. Electr. Rev. 1928, 31, 605–609. [Google Scholar]
- Vainer, A.L. Impulse Characteristics of Complex Earth Grids. Elektrichestvo 1965, 3, 107–117. [Google Scholar]
- Vainer, A.L.; Floru, V.N. Experimental Study and Method of Calculating of the Impulse Characteristics of Deep Earthing. Electical Technol. Ussr (Gb) 1971, 2, 18–22. [Google Scholar]
- Liew, A.C.; Darveniza, M. Dynamic Model of Impulse Characteristics of Concentrated Earths. IEE Proc. 1974, 121, 123–135. [Google Scholar] [CrossRef]
- Chen, Y.; Chowdhuri, P. Correlation between Laboratory and Field Tests on the Impulse Impedance of Rod-type Ground Electrodes. IEE Proc. Gener. Transm. Distrib. 2003, 150, 420–426. [Google Scholar] [CrossRef]
- Petropoulos, G.M. The High-Voltage Characteristics of Earth Resistances. J. IEE 1948, 95, 172–174. [Google Scholar]


| Month of Measurement | Soil Resistivity of Layer 1, ρ1 (Ωm) | Soil Resistivity of Layer 2, ρ2 (Ωm) | Height of Layer 1 (m) |
|---|---|---|---|
| March 2018 | 119.5 | 391.0 | 7.2 |
| March 2019 | 111.4 | 454.2 | 5.2 |
| Test No. | Date of Measurement | DC Resistance, RDC (Ω) | |||
|---|---|---|---|---|---|
| Conf. 1 | Percentage Difference from the First Reading (%) | Conf. 2 | Percentage Difference from the First Reading (%) | ||
| 1 | 21/03/2018 | 91 | 0 | 60.9 | 0 |
| 2 | 07/05/2018 | 69.1 | 24.1 | 55.2 | 9.36 |
| 3 | 02/08/2018 | 69.7 | 23.4 | 57.5 | 5.58 |
| 4 | 03/09/2018 | 84.2 | 7.25 | 80.3 | −31.9 |
| 5 | 17/10/2018 | 71.9 | 20.99 | 57.1 | 6.24 |
| 6 | 21/11/2018 | 70.7 | 22.3 | 55.9 | 8.2 |
| 7 | 17/12/2018 | 70.1 | 23 | 57.1 | 6.24 |
| 8 | 25/2/2019 | 69 | 24.2 | 55.5 | 8.9 |
| Test No. | Configuration 1 | Configuration 2 | ||||
|---|---|---|---|---|---|---|
| RDC | Average Rimpulse (Ω) | Resistance Reduction from RDC (%) | RDC | Average Rimpulse (Ω) | Resistance Reduction from RDC (%) | |
| 1 | 91 | 33.94 | 62.7 | 60.9 | 33.4 | 45.1 |
| 2 | 69.1 | 32.4 | 53.1 | 55.2 | 22.0 | 60.1 |
| 3 | 69.7 | 23.5 | 66.3 | 57.5 | 23.3 | 59.5 |
| 4 | 84.2 | 28.2 | 66.5 | 80.3 | 27.6 | 65.6 |
| 5 | 71.9 | 23 | 68 | 57.1 | 22.2 | 61.1 |
| 6 | 70.7 | 22.5 | 68.2 | 55.9 | 21.4 | 61.7 |
| 7 | 70.1 | 21.1 | 69.9 | 57.1 | 18.4 | 67.8 |
© 2019 by the authors. Licensee MDPI, Basel, Switzerland. This article is an open access article distributed under the terms and conditions of the Creative Commons Attribution (CC BY) license (http://creativecommons.org/licenses/by/4.0/).
Share and Cite
Reffin, M.S.; Abdul Ali, A.W.; Mohamad Nor, N.; Ahmad, N.N.; Abdullah, S.A.S.; Mahmud, A.; Hanaffi, F. Seasonal Influences on the Impulse Characteristics of Grounding Systems for Tropical Countries. Energies 2019, 12, 1334. https://doi.org/10.3390/en12071334
Reffin MS, Abdul Ali AW, Mohamad Nor N, Ahmad NN, Abdullah SAS, Mahmud A, Hanaffi F. Seasonal Influences on the Impulse Characteristics of Grounding Systems for Tropical Countries. Energies. 2019; 12(7):1334. https://doi.org/10.3390/en12071334
Chicago/Turabian StyleReffin, Muhd Shahirad, Abdul Wali Abdul Ali, Normiza Mohamad Nor, Nurul Nadia Ahmad, Syarifah Amanina Syed Abdullah, Azwan Mahmud, and Farhan Hanaffi. 2019. "Seasonal Influences on the Impulse Characteristics of Grounding Systems for Tropical Countries" Energies 12, no. 7: 1334. https://doi.org/10.3390/en12071334