

Biomechanical Factors Predisposing to Knee Injuries in Junior Female Basketball Players
 , , , ,
Abstract
:1. Introduction
2. Materials and Methods
2.1. Experimental Design
2.2. Ethical Considerations
2.3. Study Subjects
- Inclusion criteria: aged between 15 and 16 years; healthy subjects; being athletes and members of the Community of Madrid; active in sports and authorized to compete.
- Exclusion criteria: any diagnosed systemic affectation; any recent injury; allergy to any of the components of the measurement and/or intervention systems.
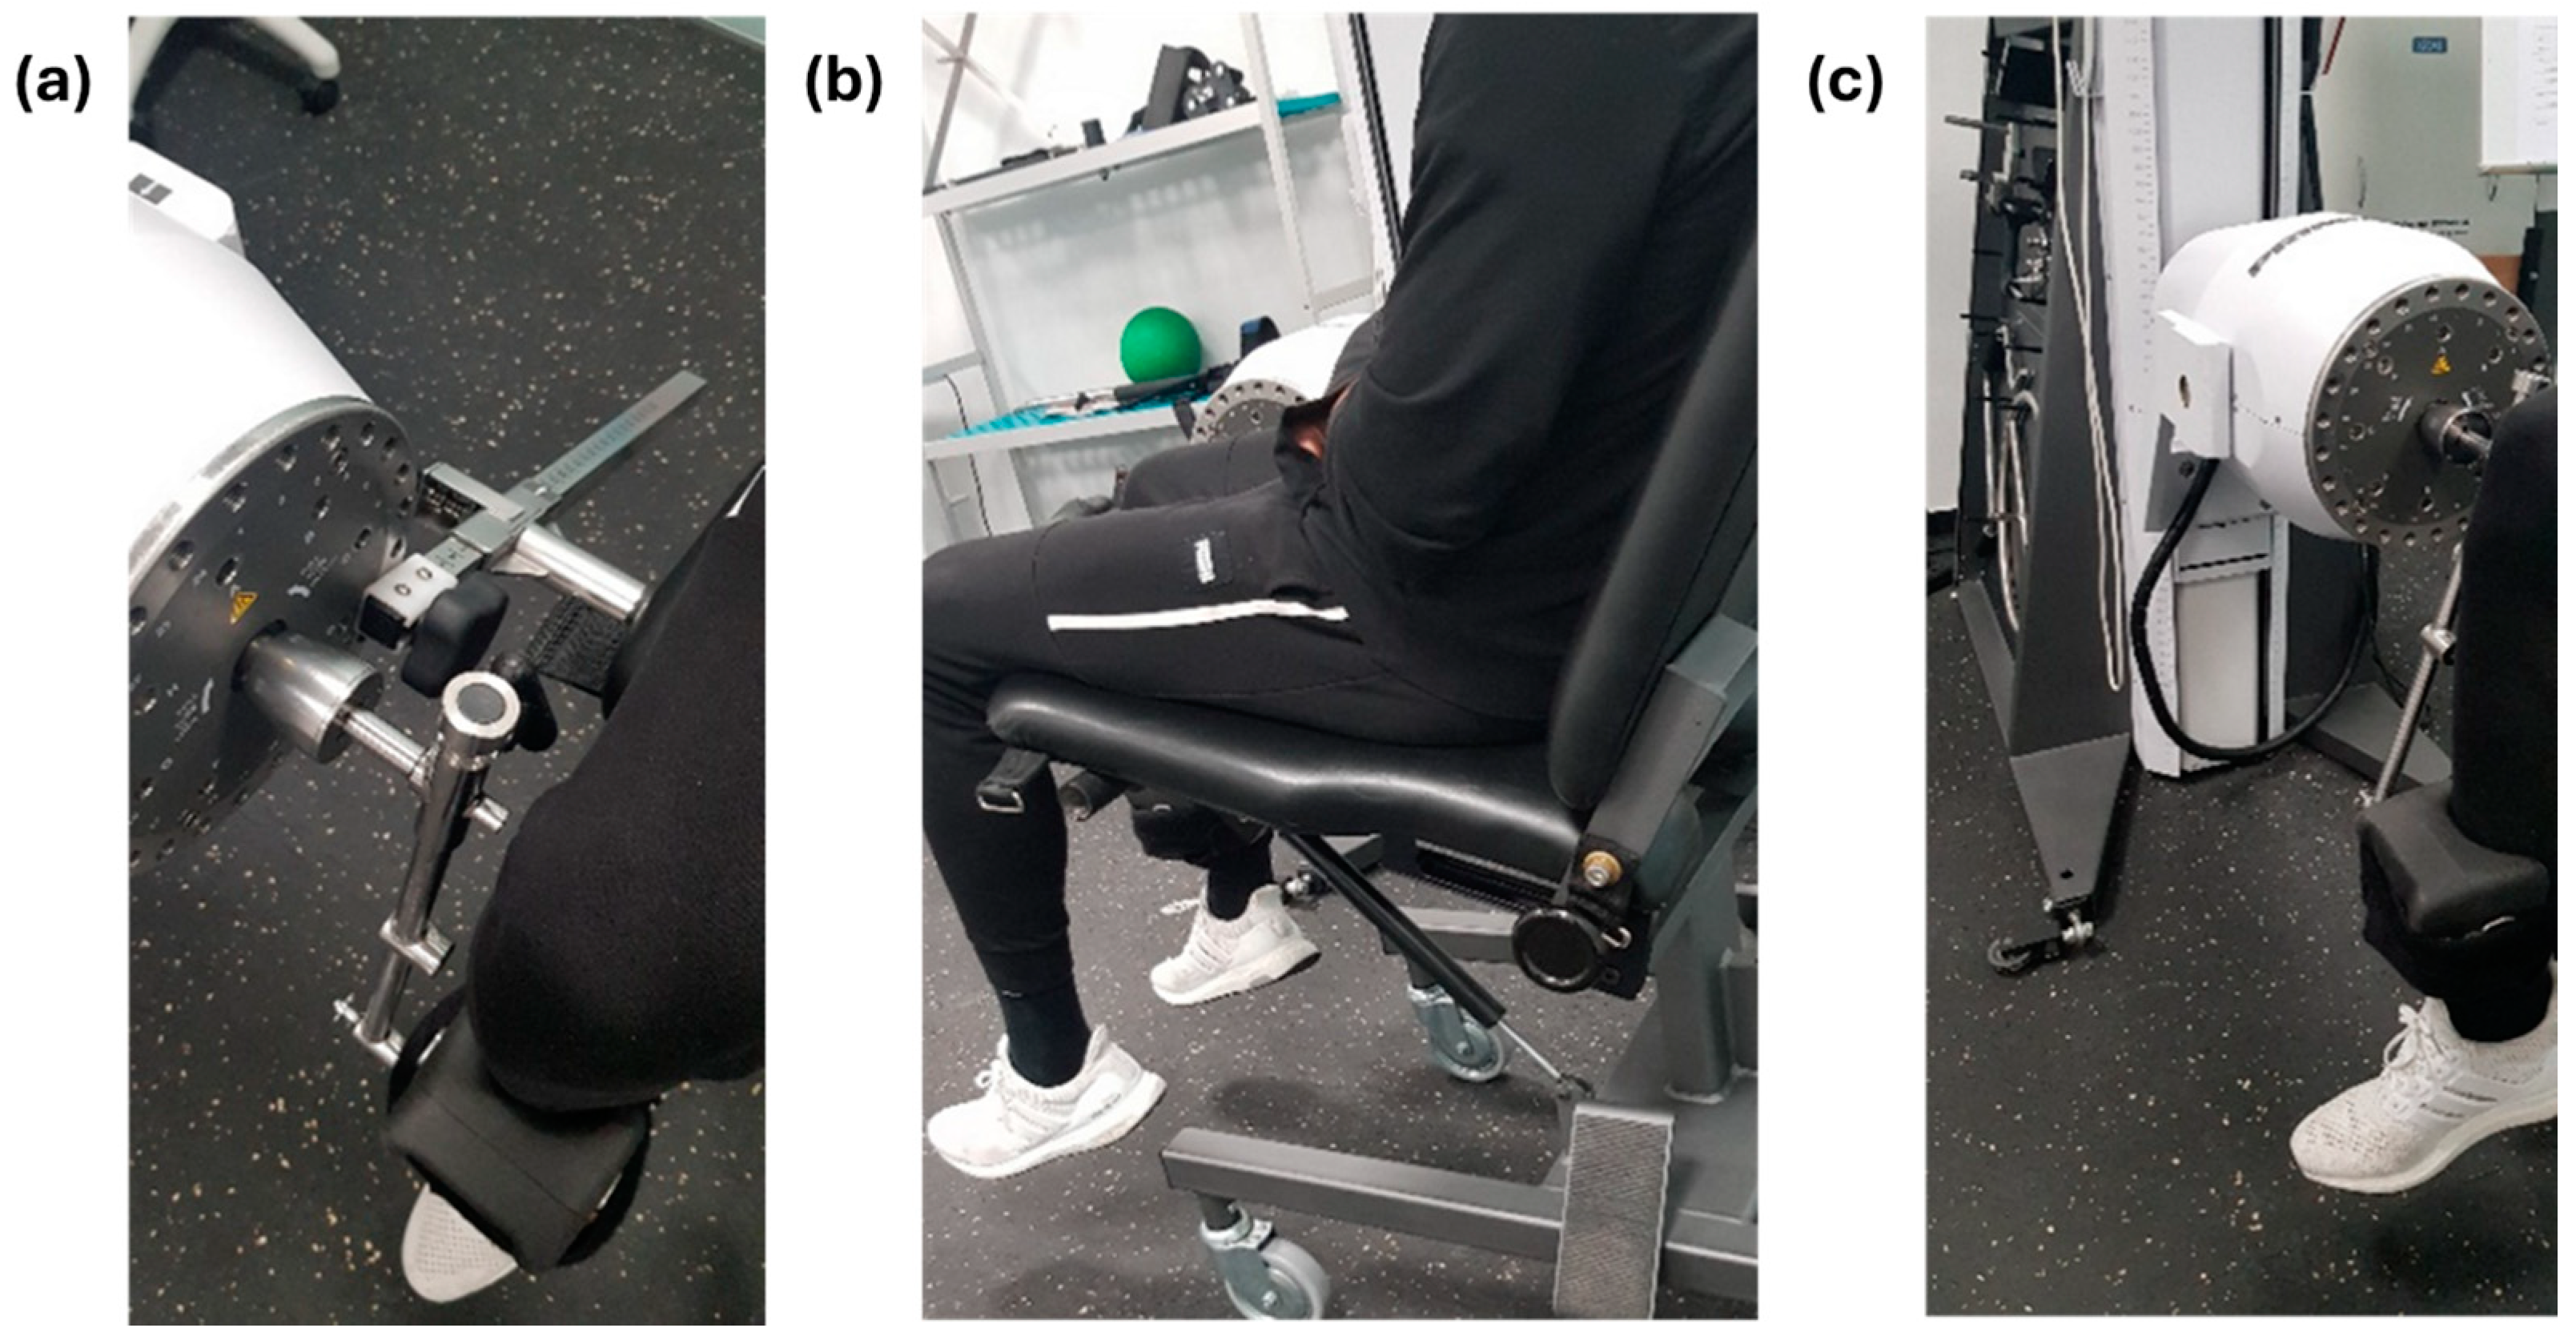
2.4. Procedure
- Isokinetic flexion/extension, concentric–concentric mode: support on the ventral aspect of the ankle (Figure 1).
- Isokinetic inversion/eversion, concentric–concentric mode: knee at 45° flexion/extension.
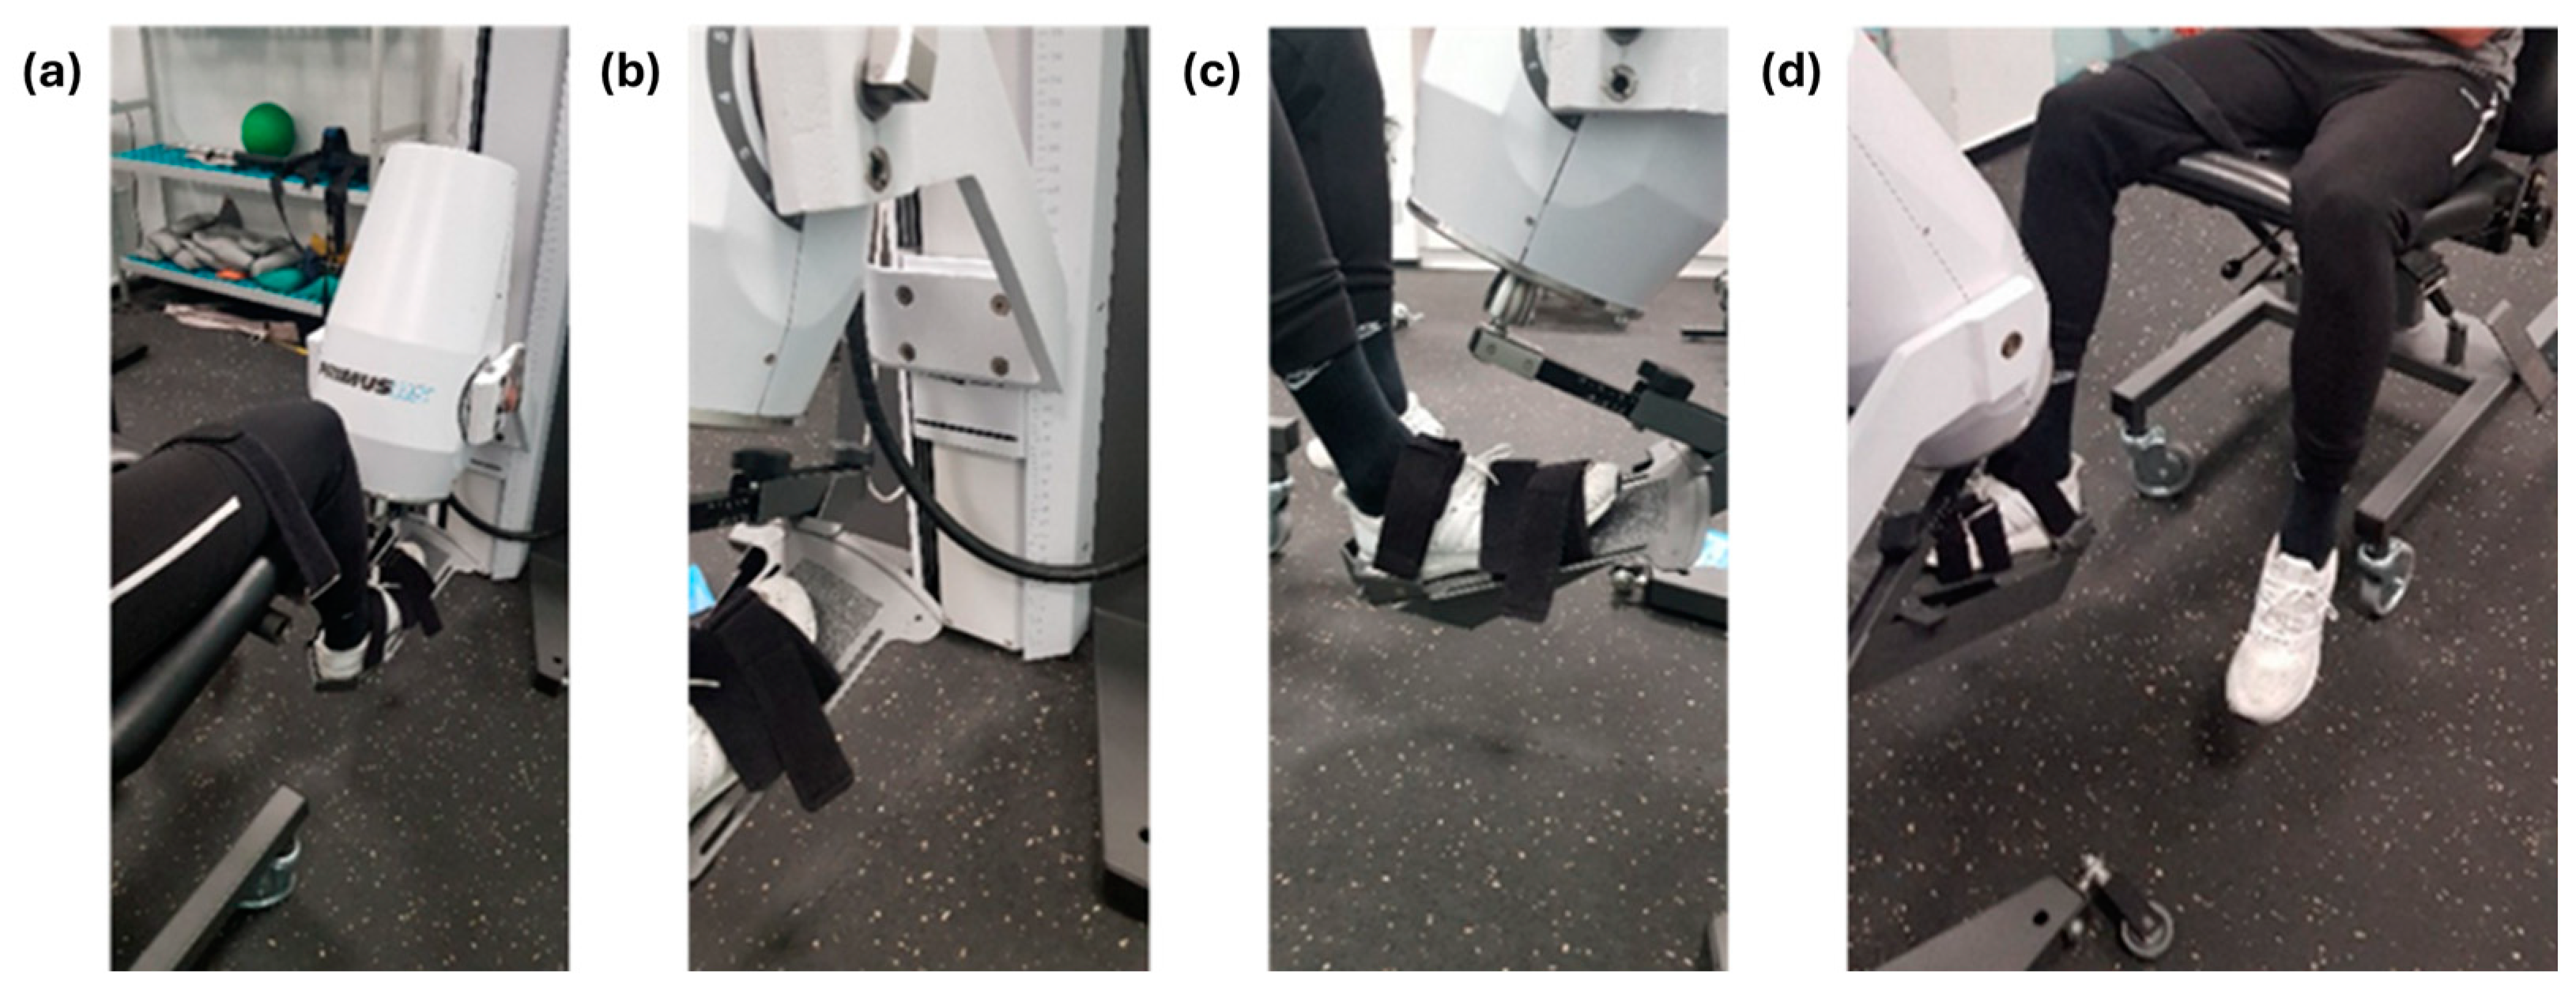
- 2.
- Isometric inversion and eversion in anatomical ankle position (more details in Figure 2).
2.5. Data Collection and Analysis
3. Results
4. Discussion
5. Limitations
6. Conclusions
Author Contributions
Funding
Institutional Review Board Statement
Informed Consent Statement
Data Availability Statement
Conflicts of Interest
References
- Stojanović, E.; Stojiljković, N.; Scanlan, A.T.; Dalbo, V.J.; Berkelmans, D.M.; Milanović, Z. The activity demands and physiological responses encountered during basketball match-play: A systematic review. Sports Med. 2018, 48, 111–135. [Google Scholar] [CrossRef] [PubMed]
- Jackson, T.J.; Starkey, C.; McElhiney, D.; Domb, B.G. Epidemiology of hip injuries in the National Basketball Association: A 24-year overview. Orthop. J. Sports Med. 2013, 1, 2325967113499130. [Google Scholar] [CrossRef]
- Moore, M.L.; Haglin, J.M.; Hasscbrock, J.D.; Anastasi, M.B.; Chhabra, A. Management of ankle injuries in professional basketball players: Prevalence and rehabilitation. Orthop. Rev. 2021, 13, 9108. [Google Scholar] [CrossRef] [PubMed]
- Kilic, Ö.; Van Os, V.; Kemler, E.; Barendrecht, M.; Gouttebarge, V. The ‘Sequence of Prevention’ for musculoskeletal injuries among recreational basketballers: A systematic review of the scientific literature. Phys. Sportsmed. 2018, 46, 197–212. [Google Scholar] [CrossRef] [PubMed]
- Tummala, S.V.; Hartigan, D.E.; Makovicka, J.L.; Patel, K.A.; Chhabra, A. 10-Year epidemiology of ankle injuries in men’s and Women’s Collegiate Basketball. Orthop. J. Sports Med. 2018, 6, 2325967118805400. [Google Scholar] [CrossRef]
- Morris, S.N.; Chandran, A.; Boltz, A.J.; Robison, H.J.; Collins, C.L.; Lempke, L.B. Epidemiology of injuries in National Collegiate Athletic Association men’s basketball: 2014–2015 through 2018–2019. J. Athl. Train. 2021, 56, 681–687. [Google Scholar] [CrossRef] [PubMed]
- Tramer, J.S.; Khalil, L.S.; Jildeh, T.R.; Sattar, M.; Ziedas, A.; Abbas, M.J.; Kolowich, P.A.; Okorocha, K.R. Association of prior Anterior Cruciate Ligament tear with decreased career longevity in Women’s National Basketball Association. Orthop. J. Sports Med. 2021, 9, 23259671211009248. [Google Scholar] [CrossRef]
- Gray, A.M.; Gugala, Z.; Baillargeon, J.G. Effects of oral contraceptive use on anterior cruciate ligament injury epidemiology. Med. Sci. Sports Exerc. 2016, 48, 648–654. [Google Scholar] [CrossRef]
- Herzber, S.D.; Motu’apuaka, M.L.; Lambert, W.; Fu, R.; Brady, J.; Guise, J.-M. The effect of menstrual cycle and contraceptives on ACL injuries and laxity: A systematic review and meta-analysis. Orthop. J. Sports Med. 2017, 5, 2325967117718781. [Google Scholar]
- Taylor, J.B.; Ford, K.R.; Nguyen, A.-D.; Terry, L.N.; Hegedus, E.J. Prevention of lower extremity injuries in basketball: A systematic review and meta-analysis. Sports Health 2015, 7, 392–398. [Google Scholar] [CrossRef]
- Baker, H.; Rizzi, A.; Athiviraham, A. Injury in the Women’s National Basketball Association (WNBA) from 2015 to 2019. Arthrosc. Sports Med. Rehabil. 2020, 2, e213–e217. [Google Scholar] [CrossRef]
- Lempke, L.B.; Chandran, A.; Boltz, A.J.; Robison, H.J.; Collins, C.L.; Morris, S.N. Epidemiology of injuries in National Collegiate Athletic Association Women’s Basketball: 2014–2015 through 2018–2019. J. Athl. Train. 2021, 56, 674–680. [Google Scholar] [CrossRef]
- Edwards, T.; Spiteri, T.; Piggott, B.; Bonhotal, J.; Haff, G.G.; Joyce, C. Monitoring and managing fatigue in basketball. Sports 2018, 6, 19. [Google Scholar] [CrossRef]
- Sturnick, D.R.; Vacek, P.M.; DeSarno, M.J.; Gardner-Morse, M.G.; Tourville, T.W.; Slauterbeck, J.R.; Johnson, R.J.; Shultz, S.J.; Beynnon, B.D. Combined anatomic factors predicting risk of anterior cruciate ligament injury for males and females. Am. J. Sports Med. 2015, 43, 839–847. [Google Scholar] [CrossRef]
- Brown, K.A.; Patel, D.R.; Darmawan, D. Participation in sports in relation to adolescent growth and development. Transl. Pediatr. 2017, 6, 150–159. [Google Scholar] [CrossRef]
- Costa e Silva, L.; Teles, J.; Fragoso, I. Sports injuries patterns in children and adolescents according to their sports participation level, age and maturation. BMC Sports Sci. Med. Rehabil. 2022, 14, 35. [Google Scholar] [CrossRef] [PubMed]
- Caldemeyer, L.E.; Brown, S.M.; Mulcahey, M.K. Neuromuscular training for the prevention of ankle sprains in female athletes: A systematic review. Phys. Sportsmed. 2020, 48, 363–369. [Google Scholar] [CrossRef] [PubMed]
- Post, E.G.; Rosenthal, M.D.; Root, H.J.; Rauh, M.J. Sport specialization behaviors are associated with history of reported injury in youth basketball. J. Pediatr. Orthop. 2021, 41, 507–513. [Google Scholar] [CrossRef] [PubMed]
- Kambič, T.; Hadžić, V.; Lainščak, M. Reproducibility of isokinetic knee testing using the novel isokinetic SMM iMoment dynamometer. PLoS ONE 2020, 15, e0237842. [Google Scholar] [CrossRef]
- Risberg, M.A.; Steffen, K.; Nilstad, A.; Myklebust, G.; Kristianslund, E.; Moltubakk, M.M.; Krosshaug, T. Normative quadriceps and hamstring muscle strength values for female, healthy, elite handball and football players. J. Strength Cond. Res. 2018, 32, 2314–2323. [Google Scholar] [CrossRef] [PubMed]
- Rhyu, H.-S.; Han, H.-G.; Rhi, S.-Y. The effects of instrument-assisted soft tissue mobilization on active range of motion, functional fitness, flexibility, and isokinetic strength in high school basketball players. Technol. Health Care 2018, 26, 833–842. [Google Scholar] [CrossRef] [PubMed]
- Palmer, T.G.; Uhl, T.L. Interday reliability of peak muscular power outputs on an isotonic dynamometer and assessment of active trunk control using the chop and lift tests. J. Athl. Train. 2011, 46, 150–159. [Google Scholar] [CrossRef] [PubMed]
- Schectman, O.; Davenport, R.; Malcolm, M.; Nabavi, D. Reliability and validity of the BTE Primus grip tool. J. Hand Ther. 2003, 16, 36–42. [Google Scholar] [CrossRef] [PubMed]
- Stauber, W.T.; Barill, E.R.; Stauber, R.E.; Miller, G.R. Isotonic dynamometry for the assessment of power and fatigue in the knee extensor muscles of females. Clin. Physiol. 2000, 20, 225–233. [Google Scholar] [CrossRef] [PubMed]
- Yielder, P.; Gutnik, B.; Kobrin, V.; Hudson, G. A possible anatomical and biomechanical explanation of the 10% rule used in the clinical assessment of prehensile hand movements and handed dominance. J. Electromyogr. Kinesiol. 2009, 19, 472–480. [Google Scholar] [CrossRef]
- Vosburg, E.; Hinkey, M.; Meyers, R.; Csonka, J.; Salesi, K.; Siesel, T.; Fonseca, J.; Zarzour, R.; Sell, T.; Faherty, M. The association between lower extremity strength ratios and the history of injury in collegiate athletes. Phys. Ther. Sport 2022, 55, 55–60. [Google Scholar] [CrossRef]
- Rosa-Guillamón, A.; Carrillo-López, P.J.; García-Cantó, E. Analysis of physical fitness according to sex, age, body mass index and level of physical activity in Spanish elementary school students. Rev. De La Fac. De Med. 2020, 68, 92–99. [Google Scholar]
- Odabaş, İ.; Güler, L.; Günay, A. Evaluation of body mass index and body compositions of elite and non-elite korfball athletes by gender: Descriptive-comparative study. Turk. Klin. J. Sports Sci. 2022, 14, 61–68. [Google Scholar]
- Center for Disease Control and Prevention. Center for Disease Control and Prevention, US Department of Health and Human Services: Atlanta, GA, USA, 2022. Available online: https://www.cdc.gov/growthcharts/percentile_data_files.htm (accessed on 16 November 2022).
- Bowers, A.L.; Spindler, K.P.; McCarty, E.C.; Arrigain, S. Height, weight, and BMI predict intra-articular injuries observed during ACL reconstruction: Evaluation of 456 cases from a prospective ACL database. Clin. J. Sport Med. 2005, 15, 9–13. [Google Scholar] [CrossRef]
- Sameshima, S.; Inui, H.; Taketomi, S.; Yamagami, R.; Kono, K.; Kawaguchi, K.; Kage, T.; Tanaka, S. The intraoperative gap differences due to joint distraction force differences in total knee arthroplasty are affected by preoperative lower limb alignment and body mass index. Clin. Biomech. 2022, 99, 105765. [Google Scholar] [CrossRef]
- Bersotti, F.M.; Mochizuki, L.; Brech, G.C.; Soares, A.L.S.; Soares-Junior, J.M.; Baracat, E.C.; Greve, J.M.D.A.; Alonso, A.C. The variability of isokinetic ankle strength is different in healthy older men and women. Clinics 2022, 77, 100125. [Google Scholar] [CrossRef]
- Nuzzo, J.L. The case for retiring flexibility as a major component of physical fitness. Sports Med. 2020, 50, 853–870. [Google Scholar] [CrossRef] [PubMed]
- Huston, L.J.; Greenfield, M.L.V.; Wojtys, E.M. Anterior cruciate ligament injuries in the female athlete: Potential risk factors. Clin. Orthop. Relat. Res. 2000, 372, 50–63. [Google Scholar] [CrossRef] [PubMed]
- Veeck, F.; Lopez, P.; Grazioli, R.; Machado, C.L.F.; Wilhelm, E.N.; Cadore, E.L.; Pinto, R.S. Dissociation between fatigued power output and traditional peak torque for isokinetic hamstring:quadriceps ratios in professional soccer players. Sport Sci. Health 2022, 18, 967–973. [Google Scholar] [CrossRef]
- Liporaci, R.F.; Saad, M.; Grossi, D.B.; Riberto, M. Clinical features and isokinetic parameters in assessing injury risk in elite football players. Int. J. Sports Med. 2019, 40, 903–908. [Google Scholar] [CrossRef] [PubMed]
- Kirkendall, D.T.; Garrett, W.E. The anterior cruciate ligament enigma: Injury mechanisms and prevention. Clin. Orthop. Rel. Res. 2000, 372, 64–68. [Google Scholar] [CrossRef]
- Chaudhary, D.; Chengappa, R.; Bawa, H. Comparison between isokinetic quadriceps and hamstring strength and clinical outcomes after single bundle and double bundle ACL reconstruction in sportspersons. Indian J. Physiother. Occup. Ther.-Int. J. 2016, 10, 30–36. [Google Scholar] [CrossRef]
- Suh, D.K.; Lee, J.H.; Rhim, H.C.; Cho, I.-Y.; Han, S.-B.; Jang, K.-M. Comparison of muscle strength and neuromuscular control up to 1 year after anterior cruciate ligament reconstruction between patients with dominant leg and non-dominant leg injuries. Knee 2021, 29, 15–25. [Google Scholar] [CrossRef]
- Brígido-Fernández, I.; San José, F.G.-M.; Charneco-Salguero, G.; Cárdenas-Rebollo, J.M.; Ortega-Latorre, Y.; Carrión-Otero, O.; Fernández-Rosa, L. Knee isokinetic profiles and reference values of professional female soccer players. Sports 2022, 10, 204. [Google Scholar] [CrossRef]
- Alt, T.; Knicker, A.J.; Strüder, H.K. Assessing thigh muscle balance of male athletes with special emphasis on eccentric hamstring strength. Phys. Sportsmed. 2020, 48, 327–334. [Google Scholar] [CrossRef]
- Heinert, B.L.; Collins, T.; Tehan, C.; Ragan, R.; Kernozek, T.W. Effect of hamstring-to-quadriceps ratio on knee forces in females during landing. Int. J. Sports Med. 2021, 42, 264–269. [Google Scholar] [CrossRef]
- Andrade, M.S.; Junqueira, M.S.; De Lira, C.A.B.; Vancini, R.L.; Seffrin, A.; Nikolaidis, P.T.; Roseman, T.; Knechtle, B. Age-related differences in torque in angle-specific and peak torque hamstring to quadriceps ratios in female soccer players from 11 to 18 years old: A Cross-sectional study. Res. Sports Med. 2021, 29, 77–89. [Google Scholar] [CrossRef]
- Collings, T.J.; Diamond, L.E.; Barrett, R.S.; Timmins, R.G.; Hickey, J.T.; DU Moulin, W.S.; Williams, M.D.; Beerworth, K.A.; Bourne, M.N. Strength and biomechanical risk factors for noncontact ACL injury in elite female footballers: A prospective study. Med. Sci. Sports Exerc. 2022, 54, 1242–1251. [Google Scholar] [CrossRef]
- Pradhan, P.; Kaushal, S.G.; Kocher, M.S.; Kiapour, A.M. Development of anatomic risk factors for ACL injuries: A comparison between ACL-injured knees and matched controls. Am. J. Sports Med. 2023, 51, 2267–2274. [Google Scholar] [CrossRef] [PubMed]
- Kellis, E.; Sahinis, C.; Baltzopoulos, V. Is hamstrings-to-quadriceps torque ratio useful for predicting anterior cruciate ligament and hamstring injuries? A systematic and critical review. J. Sport Health Sci. 2023, 12, 343–358. [Google Scholar] [CrossRef] [PubMed]
- Perkins, S.; Canavan, P. Isokinetic Assessment of knee flexor and extensor strength and lower extremity flexibility assessment of an NCAA Division III men’s soccer team. Int. J. Sports Phys. Ther. 2023, 18, 626–635. [Google Scholar] [CrossRef] [PubMed]
- Macedo, M.C.; Souza, M.A.; Ferreira, K.R.; Campos, L.O.; Souza, I.S.O.; Barbosa, M.A.; Brito, C.J.; Intelangelo, L.; Barbosa, A.C. Validity and test-retest reliability of a novel push low-cost hand-held dynamometer for knee strength assessment during different force ranges. Diagnostics 2022, 12, 186. [Google Scholar] [CrossRef] [PubMed]
- Muff, G.; Dufour, S.; Meyer, A.; Masat, J.; Vautravers, P.; Lecocq, J.; Isner-Horobeti, M.E. Comparative study on the assessment of the strength of the knee extensor and flexor muscles by hand-held dynamometer and isokinetic dynamometer. Ann. Phys. Rehabil. Med. 2015, 58, e159–e160. [Google Scholar] [CrossRef]
- Wiażewicz, A.; Eider, J. Assessment of shoulder joint strength disproportion of masters swimmers. Central Eur. J. Sport Sci. Med. 2016, 16, 85–90. [Google Scholar] [CrossRef]
- Webber, S.C.; Porter, M.M. Reliability of ankle isometric, isotonic, and isokinetic strength and power testing in older women. Phys. Ther. 2010, 90, 1165–1175. [Google Scholar] [CrossRef]


| Sex | N | Mean | SD 1 | Median | Q1–Q3 4 | Mean Difference between Sexes | Sig. (Bilateral) | Cohen’s d | |
|---|---|---|---|---|---|---|---|---|---|
| Right knee—flexion peak strength 2 at 30°/s | Men | 28 | 191.25 | 34.27 | 185.00 | 168.00–217.00 | 20.96 | 0.030 * | 0.665 |
| Women | 14 | 170.29 | 24.81 | 167.00 | 147.00–189.00 | ||||
| Right knee—flexion peak strength at 120°/s | Men | 28 | 177.96 | 48.09 | 173.00 | 139.00–209.00 | 27.10 | 0.027 * | 0.635 |
| Women | 14 | 150.86 | 28.28 | 144.00 | 133.00–163.00 | ||||
| Right knee—flexion peak strength at 180°/s | Men | 28 | 187.36 | 49.87 | 190.50 | 148.00–217.00 | 16.85 | 0.280 | 0.359 |
| Women | 14 | 170.50 | 40.44 | 161.00 | 147.00–191.00 | ||||
| Left knee—flexion peak strength at 30°/s | Men | 28 | 188.89 | 33.71 | 183.50 | 171.00–204.00 | 22.32 | 0.033 * | 0.722 |
| Women | 14 | 166.57 | 24.14 | 162.50 | 152.00–178.00 | ||||
| Left knee—flexion peak strength at 120°/s | Men | 28 | 181.46 | 42.16 | 173.00 | 153.50–199.50 | 31.75 | 0.014 a,* | 0.838 |
| Women | 14 | 149.71 | 26.84 | 149.50 | 125.00–169.00 | ||||
| Left knee—flexion peak strength at 180°/s | Men | 28 | 194.71 | 46.51 | 184.00 | 162.50–223.50 | 29.17 | 0.043 * | 0.701 |
| Women | 14 ** | 165.54 | 27.53 | 165.00 | 145.00–177.00 | ||||
| Right knee—extension peak strength at 30°/s | Men | 28 | 361.54 | 75.09 | 370.00 | 297.00–431.00 | 74.03 | 0.005 * | 0.978 |
| Women | 14 | 287.50 | 76.86 | 279.50 | 215.00–313.00 | ||||
| Right knee—extension peak strength at 120°/s | Men | 28 | 260.00 | 71.94 | 223.50 | 207.00–331.00 | 69.07 | 0.004 a,* | 0.998 |
| Women | 14 | 190.93 | 63.20 | 175.00 | 160.00–229.00 | ||||
| Right knee—extension peak strength at 180°/s | Men | 28 | 253.32 | 61.81 | 245.00 | 209.50–300.50 | 46.67 | 0.027 a* | 0.752 |
| Women | 14 | 206.64 | 62.69 | 179.50 | 165.00–242.00 | ||||
| Left knee—extension peak strength at 30°/s | Men | 28 | 357.43 | 64.92 | 376.50 | 302.50–411.00 | 46.92 | 0.049 * | 0.665 |
| Women | 14 | 310.50 | 81.13 | 303.50 | 265.00–365.00 | ||||
| Left knee—extension peak strength at 120°/s | Men | 28 | 275.79 | 65.35 | 270.00 | 226.00–329.50 | 68.14 | 0.002 * | 1.067 |
| Women | 14 | 207.64 | 60.56 | 201.00 | 160.00–232.00 | ||||
| Left knee—extension peak strength at 180°/s | Men | 28 | 256.75 | 56.64 | 246.00 | 211.00–311.50 | 56.28 | 0.004 * | 1.015 |
| Women | 14 ** | 200.46 | 52.63 | 185.00 | 170.00–237.00 | ||||
| Right knee—work 3 at 30°/s | Men | 28 | 473.18 | 86.27 | 475.50 | 397.50–540.00 | 69.10 | 0.014 * | 0.844 |
| Women | 14 | 404.07 | 71.85 | 396.50 | 360.00–483.00 | ||||
| Right knee—work at 120°/s | Men | 28 | 557.86 | 143.32 | 527.00 | 468.50–656.50 | 122.50 | 0.013 * | 0.852 |
| Women | 14 | 435.36 | 144.86 | 430.00 | 340.00–506.00 | ||||
| Right knee—work at 180°/s | Men | 28 | 1041.79 | 312.13 | 1036.50 | 843.50–1163.00 | 268.35 | 0.009 * | 0.898 |
| Women | 14 | 773.43 | 268.75 | 714.50 | 599.00–1082.00 | ||||
| Left knee—work at 30°/s | Men | 28 | 480.29 | 82.27 | 497.50 | 423.50–541.50 | 73.00 | 0.009 * | 0.899 |
| Women | 14 | 407.29 | 78.89 | 400.00 | 368.00–450.00 | ||||
| Left knee—work at 120°/s | Men | 28 | 616.14 | 135.44 | 659.50 | 532.00–719.50 | 141.50 | 0.002 * | 1.099 |
| Women | 14 | 474.64 | 113.74 | 457.50 | 400.00–521.00 | ||||
| Left knee—work at 180°/s | Men | 28 | 1034.61 | 289.91 | 1003.50 | 804.00–1230.50 | 219.37 | 0.019 a,* | 0.819 |
| Women | 14 ** | 815.23 | 209.88 | 670.00 | 670.00–1045.00 |
| Sex | N | Mean | SD 1 | Median | Q1–Q3 3 | Mean Difference between Sexes | Sig. (Bilateral) | Cohen’s d | |
|---|---|---|---|---|---|---|---|---|---|
| Right knee—H/Q peak strength 2 ratio at 30°/s | Men | 28 | 0.5397 | 0.0920 | 0.5485 | 0.4818–0.5804 | −0.0791 | 0.060 | 0.738 |
| Women | 14 | 0.6189 | 0.1336 | 0.6113 | 0.5174–0.7131 | ||||
| Right knee—H/Q peak strength ratio at 120°/s | Men | 28 | 0.7104 | 0.1950 | 0.6635 | 0.5744–0.8158 | −0.1481 | 0.054 | 0.649 |
| Women | 14 | 0.8585 | 0.2851 | 0.7856 | 0.6094–1.1167 | ||||
| Right knee—H/Q peak strength ratio at 180°/s | Men | 28 | 0.7518 | 0.1471 | 0.7321 | 0.6346–0.8850 | −0.1001 | 0.052 | 0.674 |
| Women | 14 | 0.8519 | 0.1516 | 0.8627 | 0.7815–0.9388 | ||||
| Left knee—H/Q peak strength ratio at 30°/s | Men | 28 | 0.5353 | 0.0805 | 0.5378 | 0.4541–0.6048 | −0.0265 | 0.403 | 0.277 |
| Women | 14 | 0.5619 | 0.1224 | 0.5738 | 0.4366–0.6284 | ||||
| Left knee—H/Q peak strength ratio at 120°/s | Men | 28 | 0.6740 | 0.1372 | 0.6548 | 0.5725–0.7473 | −0.0910 | 0.110 | 0.535 |
| Women | 14 | 0.7650 | 0.2235 | 0.6844 | 0.5770–0.9522 | ||||
| Left knee—H/Q peak strength ratio at 180°/s | Men | 28 | 0.7742 | 0.1720 | 0.7335 | 0.6735–0.8526 | −0.0817 | 0.156 | 0.486 |
| Women | 14 * | 0.8559 | 0.1593 | 0.8312 | 0.5770–0.9522 | ||||
| Right ankle—I/E peak strength ratio at 30°/s | Men | 28 | 1.0479 | 0.3604 | 1.0190 | 0.7802–1.1871 | −0.0745 | 0.493 | 0.227 |
| Women | 14 | 1.1225 | 0.2516 | 1.0828 | 1.0013–1.3348 | ||||
| Right ankle—I/E peak strength ratio at 90°/s | Men | 28 | 1.1420 | 0.3570 | 1.0742 | 0.8414–1.3688 | −0.1710 | 0.209 a | 0.410 |
| Women | 14 | 1.3130 | 0.5009 | 1.1821 | 0.9622–1.6134 | ||||
| Right ankle—I/E peak strength ratio at 120°/s | Men | 28 | 1.2040 | 0.4083 | 1.1215 | 0.9087–1.5311 | 0.0135 | 0.917 a | 0.034 |
| Women | 14 | 1.1905 | 0.3598 | 1.1652 | 0.9890–1.2432 | ||||
| Left ankle—I/E peak strength ratio at 30°/s | Men | 28 | 1.0256 | 0.2621 | 1.0299 | 0.8383–1.2566 | −0.0148 | 0.880 | 0.050 |
| Women | 14 | 1.0404 | 0.3604 | 0.9528 | 0.7299–1.2690 | ||||
| Left ankle—I/E peak strength ratio at 90°/s | Men | 28 | 1.1216 | 0.3874 | 1.0664 | 0.8421–1.3374 | −0.0215 | 0.878 a | 0.050 |
| Women | 14 | 1.1432 | 0.4979 | 1.0163 | 0.9096–1.2446 | ||||
| Left ankle—I/E peak strength ratio at 120°/s | Men | 28 | 1.1666 | 0.2938 | 1.1515 | 0.9913–1.3035 | −0.0082 | 0.941 | 0.024 |
| Women | 14 | 1.1748 | 0.4094 | 1.0512 | 0.9339–1.3529 |
| Sex | N | Mean | SD 1 | Median | Q1–Q3 4 | Mean Difference between Sexes | Sig. (Bilateral) | Cohen’s d | |
|---|---|---|---|---|---|---|---|---|---|
| Right ankle—inversion peak strength 2 at 30°/s | Men | 28 | 129.11 | 41.50 | 122.00 | 96.95–146.50 | 6.250 | 0.617 | 0.165 |
| Women | 14 | 122.86 | 28.86 | 123.50 | 104.75–138.25 | ||||
| Right ankle—inversion peak strength at 90°/s | Men | 28 | 117.75 | 42.87 | 111.50 | 85.00–152.00 | −9.107 | 0.544 | 0.200 |
| Women | 14 | 126.86 | 50.31 | 125.50 | 83.00–160.00 | ||||
| Right ankle—inversion peak strength at 120°/s | Men | 28 | 146.96 | 53.60 | 136.00 | 106.25–184.25 | −2.321 | 0.888 a | 0.046 |
| Women | 14 | 149.29 | 41.41 | 160.00 | 132.75–166.50 | ||||
| Left ankle—inversion peak strength at 30°/s | Men | 28 | 135.07 | 43.62 | 124.00 | 97.25–173.25 | 23.000 | 0.094 | 0.561 |
| Women | 14 | 112.07 | 34.81 | 105.00 | 91.25–126.50 | ||||
| Left ankle—inversion peak strength at 90°/s | Men | 28 | 121.11 | 52.87 | 105.00 | 70.75–171.25 | 2.321 | 0.891 | 0.045 |
| Women | 14 | 118.79 | 48.08 | 119.00 | 68.50–157.25 | ||||
| Left ankle—inversion peak strength at 120°/s | Men | 28 | 144.75 | 38.32 | 148.50 | 116.25–174.50 | 10.321 | 0.391 | 0.284 |
| Women | 14 ** | 134.43 | 31.85 | 145.50 | 109.75–160.00 | ||||
| Right ankle—eversion peak strength at 30°/s | Men | 28 | 128.82 | 34.81 | 125.50 | 100.25–165.75 | 13.96 | 0.243 | 0.388 |
| Women | 14 | 114.86 | 38.42 | 110.50 | 84.75–140.00 | ||||
| Right ankle—eversion peak strength at 90°/s | Men | 28 | 107.89 | 39.55 | 97.50 | 79.25–145.50 | 9.17 | 0.437 a | 0.257 |
| Women | 14 | 98.71 | 25.95 | 100.50 | 74.75–120.50 | ||||
| Right ankle—eversion peak strength at 120°/s | Men | 28 | 126.21 | 35.76 | 119.00 | 98.00–151.50 | −4.14 | 0.735 | 0.111 |
| Women | 14 | 130.36 | 39.94 | 135.00 | 79.75–162.25 | ||||
| Left ankle—eversion peak strength at 30°/s | Men | 28 | 134.61 | 39.33 | 130.00 | 106.75–158.75 | 22.25 | 0.068 | 0.614 |
| Women | 14 | 112.36 | 28.79 | 107.50 | 93.50–124.50 | ||||
| Left ankle—eversion peak strength at 90°/s | Men | 28 | 110.21 | 38.35 | 97.50 | 78.25–145.75 | −0.10 | 0.994 a | 0.003 |
| Women | 14 | 110.31 | 38.61 | 101.00 | 78.25–140.25 | ||||
| Left ankle—eversion peak strength at 120°/s | Men | 28 | 129.00 | 39.32 | 118.50 | 100.50–156.25 | 5.00 | 0.713 | 0.121 |
| Women | 14 ** | 124.00 | 44.82 | 117.00 | 83.25–156.50 | ||||
| Right ankle—work 3 at 30°/s | Men | 28 | 68.93 | 21.96 | 62.00 | 50.00–87.75 | 3.714 | 0.598 | 0.174 |
| Women | 14 | 65.21 | 20.00 | 64.50 | 45.00–83.50 | ||||
| Right ankle—work at 90°/s | Men | 28 | 102.86 | 38.32 | 104.00 | 68.25–138.25 | 9.143 | 0.469 | 0.239 |
| Women | 14 | 93.71 | 38.02 | 91.50 | 59.50–132.75 | ||||
| Right ankle—work at 120°/s | Men | 28 | 193.29 | 71.73 | 203.50 | 121.50–248.00 | 11.357 | 0.628 | 0.160 |
| Women | 14 | 181.93 | 69.50 | 162.00 | 126.50–232.00 | ||||
| Left ankle—work at 30°/s | Men | 28 | 69.64 | 27.04 | 66.50 | 47.00–84.75 | 7.643 | 0.365 | 0.300 |
| Women | 14 | 62.00 | 21.87 | 57.50 | 45.50–75.25 | ||||
| Left ankle—work at 90°/s | Men | 28 | 101.71 | 42.67 | 93.00 | 64.75–137.00 | 16.714 | 0.209 | 0.418 |
| Women | 14 | 85.00 | 33.85 | 75.50 | 60.50–107.75 | ||||
| Left ankle—work at 120°/s | Men | 28 | 189.46 | 79.75 | 168.00 | 129.25–228.25 | 28.679 | 0.240 a | 0.391 |
| Women | 14 | 160.79 | 57.96 | 144.00 | 117.00–215.25 | ||||
| Right ankle—full RoM inversion/eversion | Men | 28 | 59.64 | 7.279 | 59.50 | 53.50–67.00 | −8.929 | 0.004 * | 1.007 |
| Women | 14 | 68.57 | 11.48 | 67.50 | 59.75–74.50 | ||||
| Left ankle—full RoM inversion/eversion | Men | 28 | 57.29 | 7.123 | 56.00 | 52.50–60.00 | −5.643 | 0.035 * | 0.714 |
| Women | 14 | 62.93 | 9.327 | 60.00 | 56.75–70.50 |
| Sex | N | Mean | SD 1 | Median | Q1–Q3 5 | Mean Difference between Sexes | Sig. (Bilateral) | Cohen’s d | |
|---|---|---|---|---|---|---|---|---|---|
| Right ankle—peak strength 2 neutral isometric inversion | Men | 28 | 76.55 | 24.05 | 75.35 | 61.10–94.60 | 20.71 | 0.005 * | 0.982 |
| Women | 14 | 55.84 | 12.91 | 56.30 | 48.20–63.15 | ||||
| Right ankle—peak isometric strength3 neutral inversion | Men | 28 | 90.66 | 26.91 | 88.30 | 73.32–108.17 | 20.18 | 0.013 * | 0.964 |
| Women | 14 | 70.47 | 14.75 | 71.90 | 62.67–79.77 | ||||
| Right ankle—CoV 4 neutral isometric inversion | Men | 28 | 7.98 | 5.19 | 7.90 | 3.20–11.62 | −2.01 | 0.258 | 0.376 |
| Women | 14 | 10.00 | 5.69 | 8.50 | 5.77–15.17 | ||||
| Left ankle—peak strength neutral isometric inversion | Men | 28 | 71.41 | 30.13 | 62.00 | 51.20–84.40 | 17.17 | 0.050 * | 0.643 |
| Women | 14 | 54.23 | 17.63 | 61.35 | 34.85–66.67 | ||||
| Left ankle—peak isometric strength neutral inversion | Men | 28 | 88.14 | 33.43 | 80.10 | 67.97–107.57 | 22.81 | 0.022 * | 0.778 |
| Women | 14 | 65.32 | 18.00 | 71.55 | 46.27–76.70 | ||||
| Left ankle—CoV neutral isometric inversion | Men | 28 | 11.28 | 7.53 | 10.35 | 5.97–14.15 | 0.84 | 0.717 | 0.119 |
| Women | 14 ** | 10.43 | 6.04 | 8.90 | 6.00–15.52 | ||||
| Right ankle—peak strength neutral isometric eversion | Men | 28 | 110.62 | 37.75 | 108.60 | 86.40–128.85 | 25.50 | 0.025 a,* | 0.761 |
| Women | 14 | 85.12 | 22.23 | 90.00 | 71.07–98.87 | ||||
| Right ankle—peak isometric strength neutral eversion | Men | 28 | 130.73 | 39.72 | 129.00 | 109.87–144.07 | 28.61 | 0.016 * | 0.822 |
| Women | 14 | 102.12 | 21.25 | 109.60 | 83.67–115.52 | ||||
| Right ankle—CoV neutral isometric eversion | Men | 28 | 6.99 | 4.91 | 6.10 | 3.30–9.15 | −1.47 | 0.457 | 0.246 |
| Women | 14 | 8.47 | 7.82 | 7.60 | 3.97–9.32 | ||||
| Left ankle—peak strength neutral isometric eversion | Men | 28 | 104.66 | 34.16 | 97.25 | 80.67–120.92 | 30.15 | 0.003 * | 1.017 |
| Women | 14 | 74.50 | 16.74 | 75.15 | 63.52–83.17 | ||||
| Left ankle—peak isometric strength neutral eversion | Men | 28 | 127.23 | 37.13 | 120.95 | 99.22–148.07 | 36.95 | 0.001 * | 1.175 |
| Women | 14 | 90.28 | 13.43 | 87.75 | 81.05–99.45 | ||||
| Left ankle—CoV neutral isometric eversion | Men | 28 | 10.51 | 11.02 | 7.85 | 5.02–11.52 | 2.51 | 0.414 a | 0.270 |
| Women | 14 | 7.99 | 3.79 | 7.75 | 4.75–9.25 |
Disclaimer/Publisher’s Note: The statements, opinions and data contained in all publications are solely those of the individual author(s) and contributor(s) and not of MDPI and/or the editor(s). MDPI and/or the editor(s) disclaim responsibility for any injury to people or property resulting from any ideas, methods, instructions or products referred to in the content. |
© 2024 by the authors. Licensee MDPI, Basel, Switzerland. This article is an open access article distributed under the terms and conditions of the Creative Commons Attribution (CC BY) license (https://creativecommons.org/licenses/by/4.0/).
Share and Cite
Mallada, N.P.; Beltrán, M.J.M.; Nuño, M.A.S.; Ribeiro, A.S.F.; Villa, I.d.M.; Molina, C.M.; Tabares, A.M.E.; Santamaría, A.P.; Sánchez, H.L. Biomechanical Factors Predisposing to Knee Injuries in Junior Female Basketball Players. Sports 2024, 12, 60. https://doi.org/10.3390/sports12020060
Mallada NP, Beltrán MJM, Nuño MAS, Ribeiro ASF, Villa IdM, Molina CM, Tabares AME, Santamaría AP, Sánchez HL. Biomechanical Factors Predisposing to Knee Injuries in Junior Female Basketball Players. Sports. 2024; 12(2):60. https://doi.org/10.3390/sports12020060
Chicago/Turabian StyleMallada, Néstor Pérez, María Jesús Martínez Beltrán, María Ana Saenz Nuño, Ana S. F. Ribeiro, Ignacio de Miguel Villa, Carlos Miso Molina, Ana María Echeverri Tabares, Andrés Paramio Santamaría, and Hugo Lamas Sánchez. 2024. "Biomechanical Factors Predisposing to Knee Injuries in Junior Female Basketball Players" Sports 12, no. 2: 60. https://doi.org/10.3390/sports12020060