INTRODUCTION
Hamstring injuries are among the most common injuries in soccer, accounting for 5-15% of all soccer-related injuries.1,2 These injuries can be frustrating for players and coaches as there are high rates of reinjury, with a recurrence rate of up to 68%.1 Since 2001, there has been an observed annual average increase of 2.3% in hamstring injuries in professional soccer.3 Injury tends to occur during activities like running and sprinting as the hamstrings develop tension while lengthening as they quickly transition their function from eccentrically decelerating the lower leg to concentrically contracting as active hip extensors.4–7 The impact of these injuries is widespread and can affect individuals both physically and psychologically. There is very little research related to screening and prevention of hamstring injuries at the Division III level due to a lack of time and resources.
It is important to identify risk factors for hamstring injuries in order to prevent them for the benefit of the athlete, the team, and the institution/team for which they play. Identification of risk factors is a significant first step in primary prevention, where the injury is prevented before it happens. It is also necessary to utilize secondary and tertiary prevention strategies for those who may have already sustained a hamstring injury. Utilizing the scientific literature to develop and implement an injury prevention screening with valid, reliable, and objective methods can help identify those at-risk individuals who would most benefit from effective exercise interventions. As a university looking to recruit talented prospective players, monitoring risk factors and taking steps to prevent injury emphasizes that the institution cares about athletes and their well-being. If teams can prevent any of the 15 muscle injuries that research has shown teams of 25 players are expected to suffer each season, such prevention could result in better team performance, more wins, and greater fan attendance.8 This study serves as a first step in enacting injury prevention by screening Division III athletes for known risk factors.
The literature identifies multiple risk factors that may be predictive of hamstring injuries. Meta-analytic reviews conducted between 2009 to 2020 have confidently identified non-modifiable factors like previous injury and older age as risk factors for hamstring injuries, but the consensus is lacking regarding modifiable risk factors.9–13
One such modifiable factor that has been described is strength imbalance. In relation to the lower extremities, the main muscles involved in extension and flexion of the knee are the hamstrings and the quadriceps. Croisier et al. investigated strength imbalances in professional soccer players, and found that 47% of elite players had a strength imbalance, which they defined as having bilateral differences of more than 15% or a hamstring-to-quadriceps (H:Q) ratio of less than 0.47.4 Players identified as having a strength imbalance in the preseason screening were four to five times more likely to suffer a hamstring strain during the season, suggesting that a player’s strength profile could be a predictor of injury and addressing identified imbalances could reduce the frequency of these injuries.4 Orchard et al. studied Australian professional soccer athletes and found that participants’ injured legs were all significantly weaker in their H:Q muscle peak torque ratio compared to the uninjured leg.14 Those researchers also identified the hamstring muscle side-to-side peak torque ratio as a good predictor (.880 for injured legs and 1.005 for uninjured legs).14 Similarly, a meta-analysis identified quadriceps peak torque as a potential predictor for hamstring injury.10 Other authors who have used using isokinetic testing at 60°/sec and 240°/sec have also reported that athletes with lower H:Q ratios (below .505) are more likely to sustain hamstring injuries, which indicates that an imbalance in strength between this antagonistic muscle pair, could leave an individual susceptible to injury.15 Authors have suggested that the ideal H:Q ratios are 60% at 60°/sec and 75% at 180°/sec.13,16–18 Further research indicates that a bilateral strength difference of over 15% can lead to injury, making this parameter a useful way to define a strength imbalance, in addition to H:Q ratios.13,16
Another commonly studied modifiable factor is flexibility. Researchers have found that male athletes have less flexible hamstrings and iliopsoas muscles than female athletes and that their lack of flexibility has been associated with knee injuries.19 Corkery et al. offers normative values for iliopsoas flexibility in college-age students using the Thomas test, finding a mean hip flexion angle of 2.3° (SD=1.9°).20 Additionally, Gabbe et al. and Ocarino et al. identified decreased quadriceps flexibility, particularly of the rectus femoris, which is involved in knee extension and hip flexion, as a risk factor for hamstring injury.21,22 In professional soccer, elite players that suffered hip or knee flexors were less flexible during preseason screening compared to players that remained healthy, further suggesting lack of flexibility as a predictor or risk factor for injury.23 Similarly, Witvrouw et al. found that professional players injured during the season had significantly less flexible hamstrings (measured with a goniometer in the preseason) compared to uninjured players (88.1° and 94.6° respectively).24 Other authors have also corroborated or noted the correlation between hamstring flexibility and risk of injury.5,25,26
However, solid consensus in the literature regarding the potential etiological factors related to hamstring injury does not exist. Authors have reported that muscle strength imbalances and flexibility were only weak factors for hamstring injury.10,27 Only low quadriceps concentric strength and low hamstring eccentric strength, both adjusted for bodyweight, were identified as risks factor for injury in a study that utilized isokinetic testing to examine professional soccer players.27 Conversely, the meta-analysis by Freckleton and Pizzari identified increased quadriceps peak torque but neither eccentric nor concentric strength as risk factors.10 Regardless of conflicting studies on risk factors, there is evidence that implementing interventions, particularly consisting of eccentric hamstring exercises, significantly decreases hamstring injury rates if the program has good compliance rates.28–30
In professional soccer, it has been shown that there is a need for the utilization of isokinetic testing in the preseason followed by an intervention aimed at reducing the number of injuries teams and players will suffer from.4 At lower levels of play there is a significant lack of resources and time available to be proactive rather than reactive to hamstring injuries, and there is little existing research on isokinetic testing at the Division III level. The current study aimed to fill some of this gap by identifying left to right differences in isokinetic peak torque of the quadriceps and hamstrings, hamstring-to-quadriceps ratios, and quadriceps and hamstring length in Division III male soccer players. Therefore, the purpose of this study was to conduct isokinetic and flexibility assessments to screen male soccer athletes at risk of sustaining a hamstring injury.
METHODS
Prior to the start of the testing, approval was received from the Institutional Review Board to conduct research with human subjects and participants gave their informed consent. Players were screened so that those who had prior hamstring injuries were identified, as prior injury is a risk factor for future injury.10–12 Any players that felt any pain or discomfort during isokinetic testing discontinued testing and were excluded from the study. Leg dominance was determined by asking participants what leg they would use if they were to kick a ball.24
Isokinetic Testing
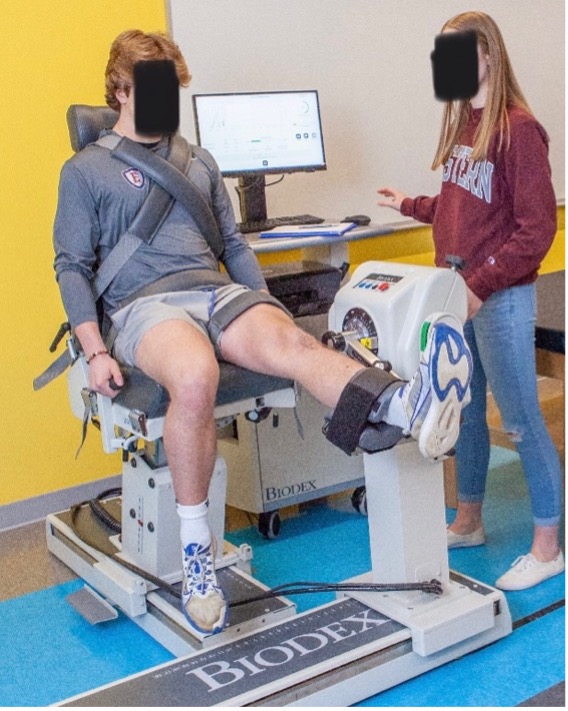
A Biodex isokinetic dynamometer (Biodex, Shirley, NY) was used to measure participants’ hamstring and quadriceps torque output bilaterally throughout the range of motion (0-90°). Participants were secured in the seat by per manufacturer protocol to isolate movement of the lower extremity (Figure 1). Prior to testing, the knee range of motion and gravity correction were set for each patient. Especially when these measures are taken, isokinetic testing has been found to be a reliable way to measure muscle strength throughout the range of motion.31–34 Pincivero et al. found that values for peak torque, peak torque/ body weight, work, and power are highly reliable, in addition to stating that isokinetic testing should be the method used if there is an interest in assessing and comparing bilateral muscle groups or antagonistic muscle pairs.33

Participants were provided with a practice session to help familiarize them with the machine and necessary movements, consisting of three submaximal contractions and three maximal contractions before the start of the test. Once the participants reported that they had completed their last maximal contraction and indicated that they were ready to begin, the test started with five repetitions at a speed of 60°/sec, followed by a 60 second rest period. After the rest period, participants received the same practice session as prior and were then tested at 180°/sec for 15 repetitions. Both speeds and the number of repetitions have been found to produce reliable data while preventing excessive fatigue for the participant.31,35
The flexibility portion of the study utilized the Thomas test and active knee extension (AKE) test. These tests are commonly used in clinical practice and have been found to be reliable measures of hamstring and hip flexor flexibility.19,36,37 For each flexibility test, three trials for the right and left leg were conducted. Measurements were taken using a standard goniometer. As intrarater measurements are more reliable than interrater measurements, all measurements were recorded by the same registered physical therapist with over 25 years of experience in goniometric measurement.38 Because error is common in goniometric measurements, an emphasis was placed on the standardization of procedures to ensure proper reliability and validity of the results.38
Active Knee Extension Test
To measure hamstring flexibility, participants were asked to lay down supine on an examination table while the leg not being tested was secured to the table. The tested leg was raised to 90° of hip flexion and held at that position by the researcher. The participant was then placed in 90° of knee flexion as a starting point and instructed to extend their knee to the point that they felt stretching in the hamstrings, and that angle was recorded by the researcher. The goniometer was placed with the axis at the center of the knee on the lateral side, the stationary arm in line with the shaft of the femur, and the moving arm in line with the lateral malleolus.20
Thomas Test
Participants were instructed to lay supine on the table, holding their opposite knee as close to their chest as possible to keep the lumbar spine flat on the table.39 The leg being tested remained extended on the table. The goniometer was placed on the lateral side of extended leg with the axis on the greater trochanter of the femur, the stationary arm parallel to the table, and the moving arm in line with the lateral condyle of the femur to get a measurement of iliopsoas flexibility.19,21,22,39
Intervention
Based on the results of the screening procedures, the researchers opted to intervene with players who were identified as having a strength or flexibility deficit and provided instructions detailing three exercises that aimed to stretch and strengthen the hamstrings. The exercises were intended to be integrated into the athlete’s usual off-season workouts, and they were sourced from the FIFA 11 injury prevention program, which has been found to improve isokinetic knee flexor and extensor strength and reduce injury rates.28,40–42
STATISTICAL ANAYSIS
Means, standard deviations, and ranges for were calculated for all outcomes. Imbalances between right and left limbs were calculated for each variable by the formula (Right leg – Left leg/ Right leg × 100). Balance between dominant (D) and non-dominant (ND) limbs was calculated using (D – ND/ D × 100) and hamstring-to-quadriceps (H:Q) peak torque ratios were analyzed for each leg. The Grubb’s test was also used to see if any of the subjects were significantly different in their agonist/antagonist ratio compared to the other subjects.43 Using all three measurements taken during the AKE test, the Two-Way Analysis of Variance model was used with two fixed effects (leg and trial). Paired sample t-tests were used to compare left and right lower extremities for all outcomes.44 A p<0.05 value was set for the level of significance.
RESULTS
Twenty collegiate athletes on a Division III men’s soccer team participated in this study (Table 1). Researchers recruited participants with the help of the head coach, who relayed information about the screening to all players.
Isokinetic Testing
Due to technical issues, the isokinetic data for three of the participants was lost, so the isokinetic results are reported on data from the remaining 17 participants. Of those 17 participants, three players indicated that they had sustained a prior hamstring injury.
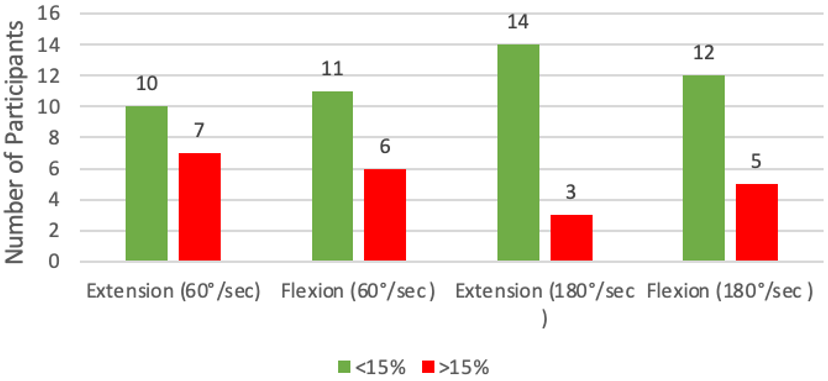
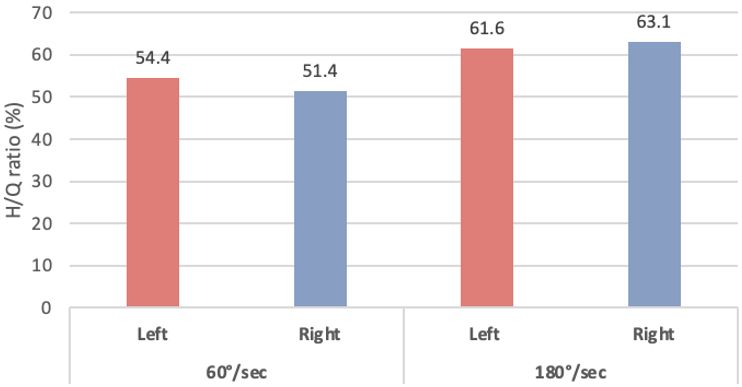
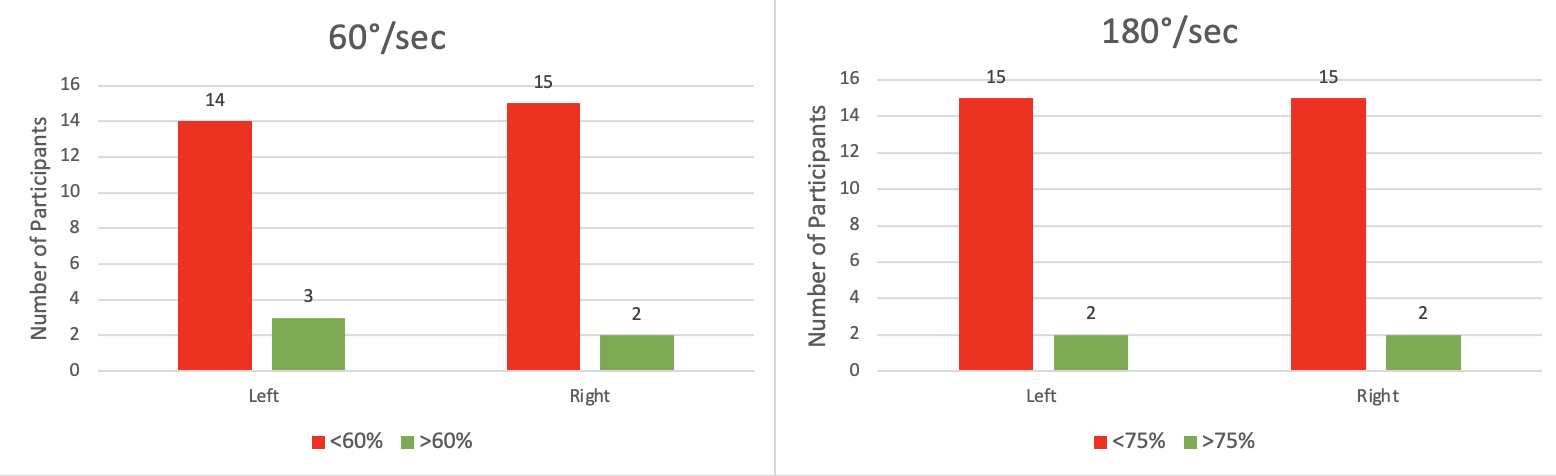
At 60°/sec, the mean PT/BW bilateral deficit was 14.1% for extension and 12.9% for flexion. At 180°/sec, the mean deficit was 9.9% for extension and 11.4% for flexion. Figure 2 shows the number of participants in each left-to-right deficit range at each speed. Additionally, the mean ratios were less than the ideal ratios H:Q ratios at both 60°/sec and 180°/sec (Figure 3). On the left at 60°/sec, 82% of participants had low H:Q ratios and this number rose to 88% on the right. Ratios were also low at 180°/sec, with 88% of participants falling short both on the left and right. The number of participants in each category for H:Q ratios at both speeds can be seen in Figure 4.


The results show that at a speed of 60 °/sec, there were not significant differences between left and right knee extension PT/BW (p=0.31) or flexion PT/BW (p=.093). At 180 °/sec, there also was not a significant difference between left and right knee extension PT/BW (p=.062) or flexion PT/BW (p=0.62). Similarly, there were no significant differences between left and right leg hamstring/quadriceps (H:Q) ratios at 60°/sec (p=0.25) or 180°/sec (p=.056). For the left leg, Subject 4, who had suffered a prior injury to this leg, had values that differed the most in isokinetic strength compared to the other participants, with a maximum H:Q ratio of 73.9, but this result was not significantly different (p=0.06). Similarly, Subject 7 differed the most from the team, though not significantly, for the right leg (p=0.19), as well as for both legs (p=.08).
Flexibility Assessments
All participants’ flexibility assessments data were included in the analysis (n=20). The average range of motion during the AKE was 158° for left leg extension and 160° for right leg extension (Table 3). During the Thomas test, on average, participants were 3.6° away from the neutral position on the right and 1.6° on the left (Table 4). There were nine positive tests (participants couldn’t reach a hip neutral position) and 11 negative tests, where players could reach that hip neutral position. None of the participants could reach full knee extension (180°). There was no significant difference between left and right measurements taken from the AKE test (p=0.182).
DISCUSSION
Nine participants (45%) had positive Thomas tests, indicating those participants had tight hip flexors. The found averages from the Thomas test (R: 3.6°; L: 1.6°) can be compared to the normative values for male college students established by Corkery et al. (R: 2.8°; L: 2.4°).20 These values suggest that the athletes in this study have less flexible iliopsoas muscles on the right than the typical healthy male college student. The current results can further be compared to prior research that also utilized the AKE test; Witvrouv et al. found that having less than full extension (180°) left participants more likely to sustain a hamstring injury.24 All the participants in the current study were below that benchmark, both individually and as a group, which highlights hamstring flexibility as a potential area players need to work on. While the researchers prioritized the standardization of procedures to establish proper reliability and validity of the results, it is of note that these mean values are within the margin of measurement error for goniometry (generally accepted as +/- 5 degrees).38
Previous research has determined that a bilateral deficit in PT/BW of greater than 15% indicates that an individual is at risk for injury.16 Mean deficits in the current study were less than this established value at 60 °/sec (extension: 14.1%; flexion: 12.9%). However, when examined qualitatively 41.2% of participants had bilateral deficits of over 15% during leg extension, while 35.3% had this deficit during leg flexion. At 180 °/sec, 17.6% of participants had a deficit above this threshold for extension and that percentage rose to 29.4% for flexion.
Another important finding was that most participants – over 80% of players at each speed and in each leg – were below the ideal H:Q ratios, established by prior research as 60% at 60°/sec and 75% at 180°/sec.17,18 Statistical analysis identified two participants as having the greatest difference in isokinetic strength from the rest of the team due to their low H:Q ratios, but those results were not significant; one of these participants indicated that they had suffered a prior hamstring injury, which is a risk factor for reinjury.10–12 These bilateral differences in strength and lower-than-ideal H:Q ratios show that there were multiple players in this study who are likely at risk for injury or reinjury and are most likely to benefit from intervention.
While the current results align with those of past research, a large portion of the literature on hamstring injuries in soccer and potential risk factors is centered around elite or professional athletes, with little focus on the collegiate level, especially Division III.4,6,8,14,22,24,25 As a result, many of the strength or flexibility profiles seen in prior research are likely representative of a different demographic than the current study. As Division III athletes differ from those at elite levels of play, the resources and time devoted to injury prevention are also different, which can create differences in fitness between Division III athletes and those at higher levels. The Division I level typically has the means to provide their athletes with nutritionists, strength coaches, and supervised training.45 Due to the scarcity of these resources at lower levels, previous research suggests that the neuromuscular profiles of Division III soccer players may be closer to those of non-athletes than to Division I athletes.45 For this reason, having access to the necessary technology to conduct this research at the Division III level may be an opportunity to fill some of this gap in the existing body of research and helped determine what normative values for flexibility and strength profiles at this level might look like.
The main limitation of this study was the lack of follow-up testing. The exercises distributed to players were provided as a means of participant education on how to prevent injury, but prior research has shown the importance of coupling baseline testing with follow-up testing when implementing an intervention.11,46,47 A re-test allows for injury risk to be better monitored and may encourage athletes to comply with the exercises if they know that they will be tested again.11,46,47 This indicates the need for further research, where researchers should consider incorporating follow-up sessions to investigate the effectiveness of any given intervention as well as collection of injury surveillance data that would be necessary to determine if the injury predictors identified in the initial screening were prevalent in players that suffered injuries.
CONCLUSION
The results of the current study suggest that isokinetic testing and flexibility testing may be useful for identifying non-optimal strength ratios and flexibility deficits in male collegiate soccer players. Similar research is not often performed at the Division III level, giving this study the opportunity to fill a gap in the existing research.
Conflicts of interest
The authors report no conflicts of interest.