
A Wireless Sensor Network for Residential Building Energy and Indoor Environmental Quality Monitoring: Design, Instrumentation, Data Analysis and Feedback


Abstract
:1. Introduction
- Industrial programs such as PROFEEL (characterizing the impact of retrofit actions) or Agence Parisienne du climat (energy performance in residential condominiums). Industrial projects deploy a large number of sensors on a large number of buildings. They target the development of operative methods and broadcast the acquired knowledge for professionals from the construction and energy sectors. Because of the significant budget and human resources involved, monitoring and data analysis opportunities are superior to academic projects.
- Academic research projects. These projects focus on specific smaller-scale case studies. The academic research digs deeper into the specificity and details of a given case study and instrumentation method.

| Studies | Frei et al. [11,12] | Martín-Garín et al. [13] | Karami et al. [14] | Jankovic [15] | Guyot et al. [16] | Deb et al. [17] | Jnat et al. [18] | Jacopo et al. [19] |
|---|---|---|---|---|---|---|---|---|
| Country | Switzerland | Spain | N.C. | United Kingdom | France | Switzerland | France | Italy |
| Case study | 8 single-family individual houses | 1 apartment | 1 computer lab | 2 half-attached houses | 1 mix-used building (mostly instrumented office spaces) | 1 single house | 3 social apartments | 20 apartments |
| Sensor network | Arduino-based sensor kits | Arduino-based | Arduino-based | Wireless | BEMS system | c.f. Frei et al. [12] | Rapsberry-based | LoRaWAN-based |
| Measurements | Air temperature, relative humidity, volumetric oil flow, light pulses for electricity meters, CO concentration, luminosity, window opening | Temperature, humidity, barometric pressure, CO concentration, window opening | Dry bulb temperature, elevation temperature, relative humidity, horizontal illuminance, vertical illuminance, CO concentration, VOCs, PM2.5, occupancy | Natural gas, electricity, indoor temperature, outdoor temperature, humidity, solar irradiation, rainfall, wind speed and direction | Measurements on air handlers, radiant panels, indoor temperature, humidity, lighting, occupancy, window opening, window shading, energy system setups | Air temperature, CO concentration, inlet heating temperature, outdoor temperature, heat flow for walls and windows, window opening | Indoor air temperature, relative humidity | Indoor air temperature, pressure, relative humidity, indoor illuminance, VOC. |
| Acquisition time-step | 5 min | 1 min | N.C. | Daily energy consumption, 15 min for other data | 5 min | 5 min | 30 min | 1 h |
| Acquisition period | 5 months | 7 days | 10 days | 2 and a half years | N.C. | 1 heating season | 6 months | 1 year and 1 month |
| Number of sensors | 144 (18 per apartment) | N.C. | 9 | 12 | 6000 | 16 | 6 | 40 (2 per apartment) |
| Communication | GPRS, Zigbee | WiFi | Zigbee | N.C. | N.C. | Zigbee | Radio frequencies | LoRa |
| Storage | PhP, MySQL | Google Drive excel sheets | VOLTRON sMap open-source software | N.C. | N.C. | MySQL | SD card | N.C. |
2. Materials and Methods
2.1. Related Work
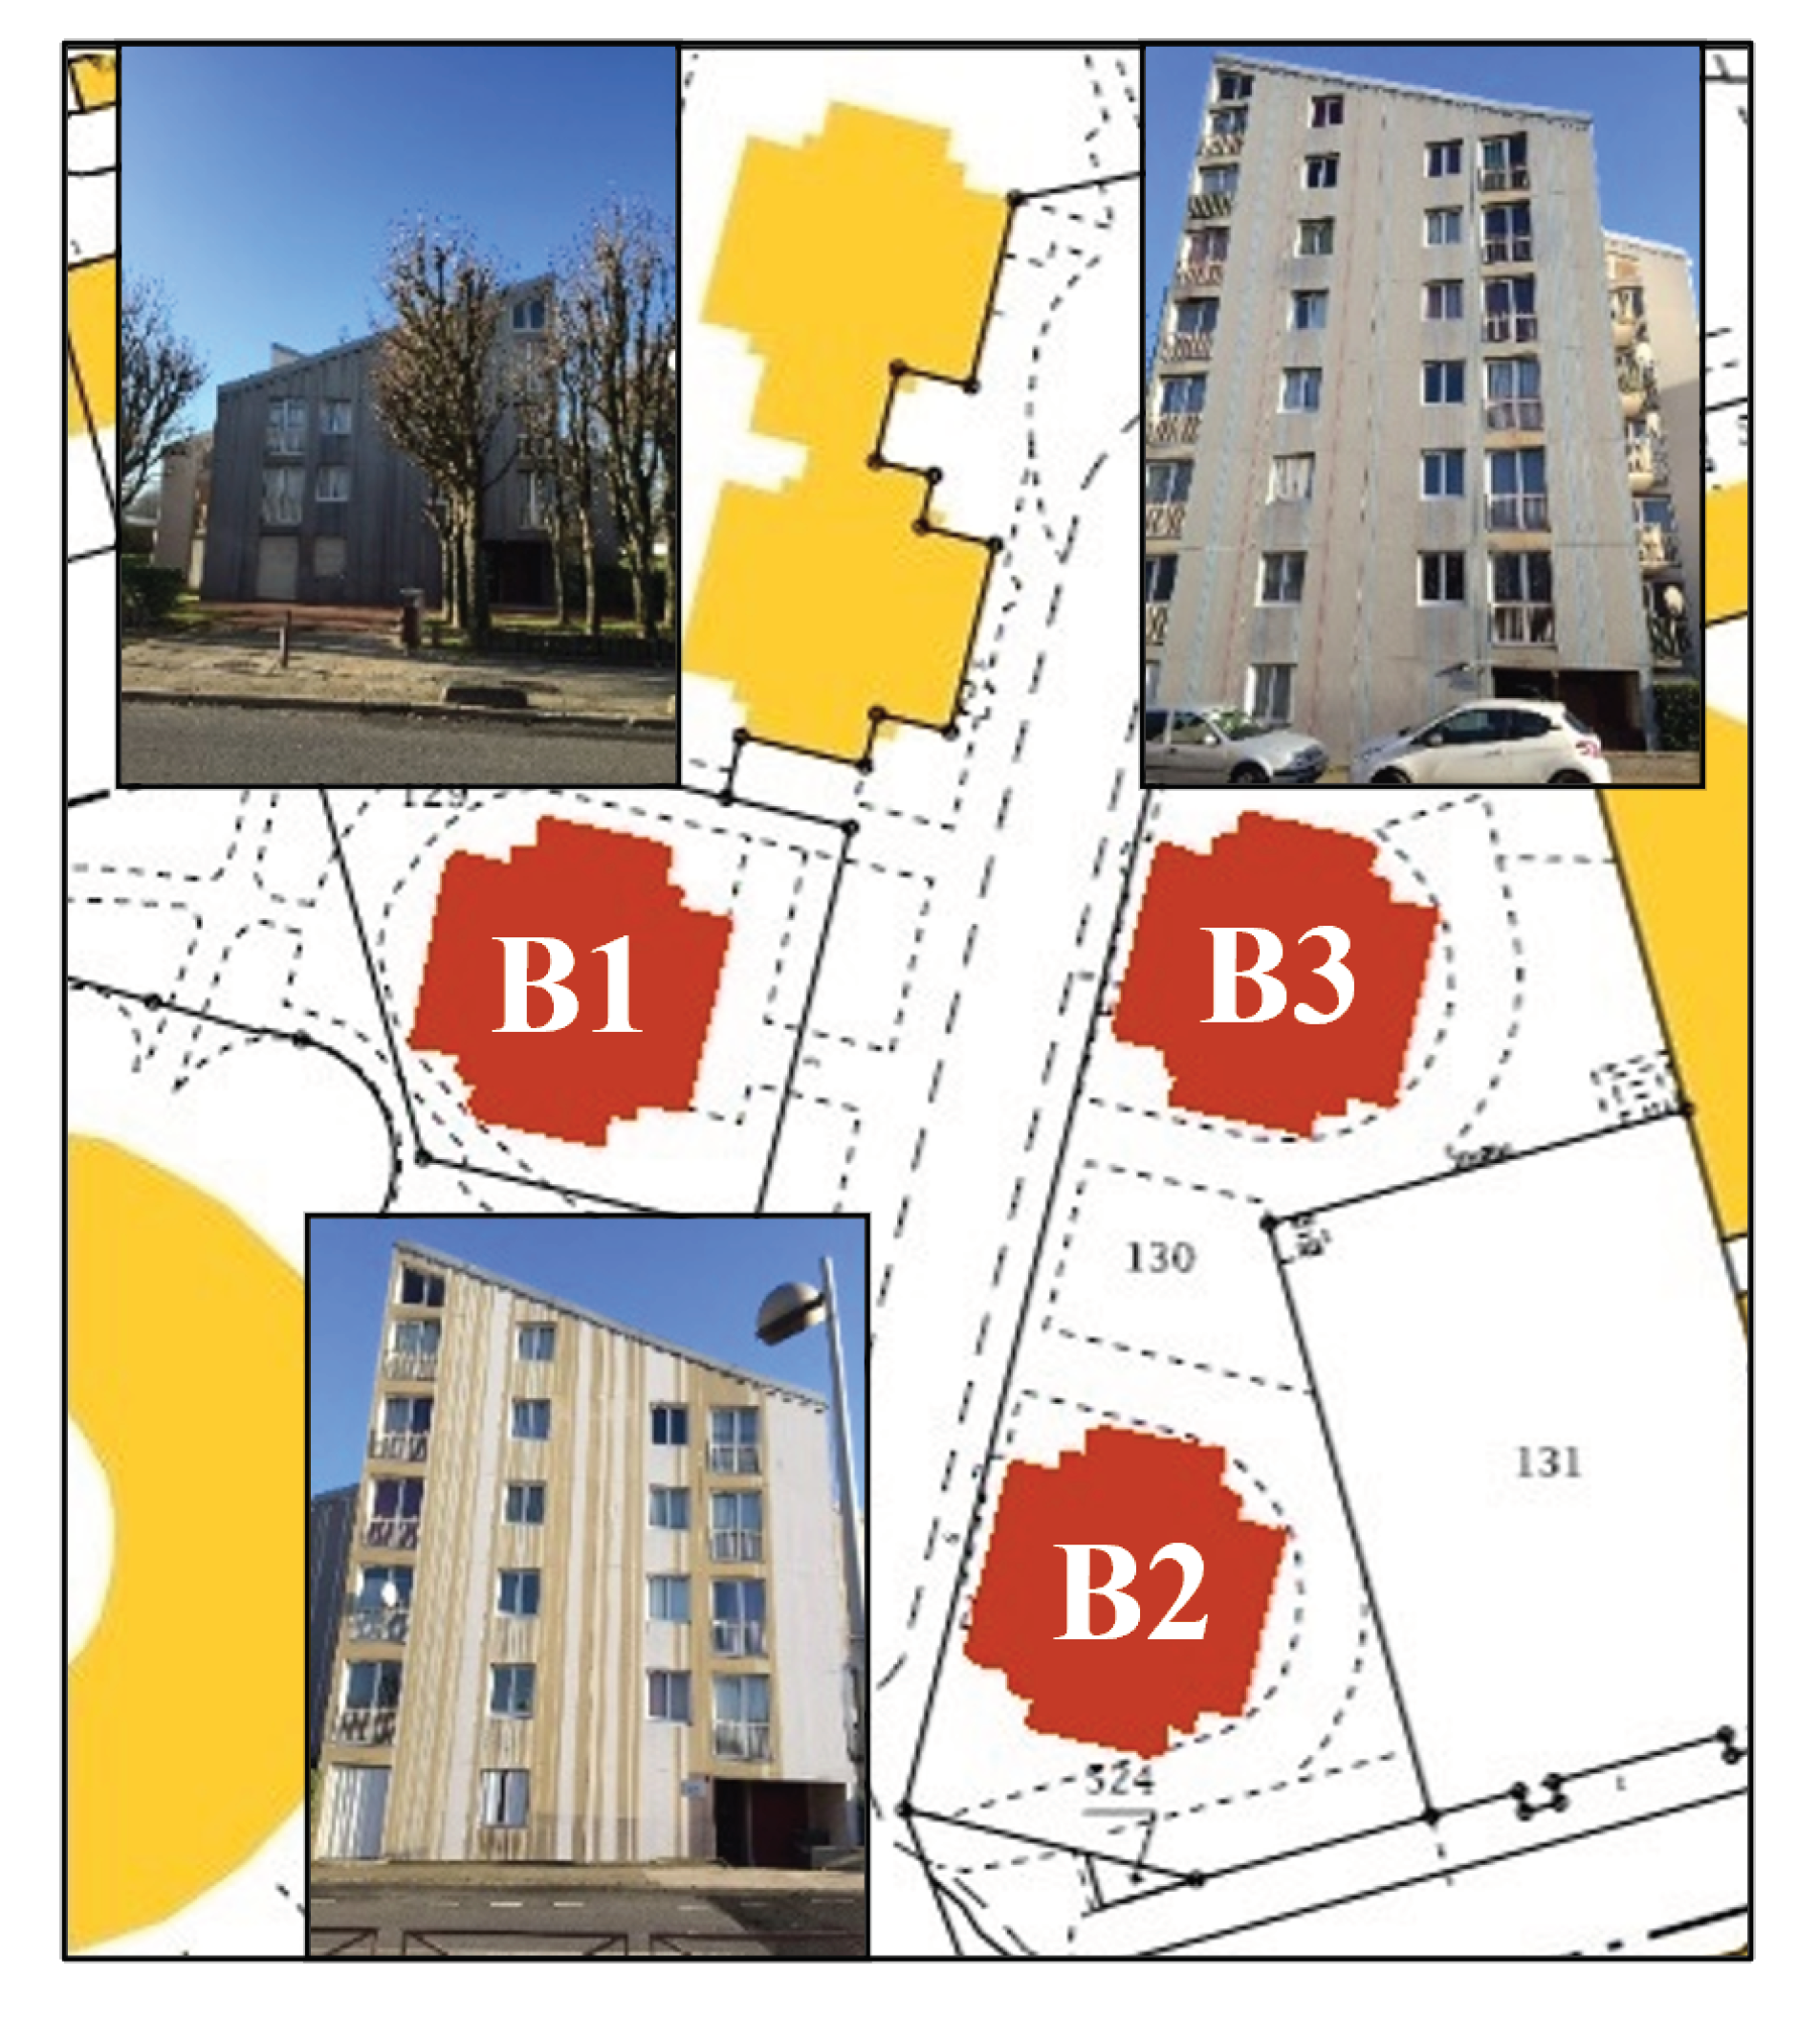
2.2. Case Study
2.2.1. General Description
2.2.2. Summary of the Buildings’ Characteristics and Retrofit Actions
2.2.3. Description of Housings
2.3. The Wireless Sensor Network
2.3.1. Target and Deployment
- Step 1: instrumentation in common areas and building-scale measurements, including the IEQ, the occupants’ behavior in common areas, the building-scale electricity and thermal energy consumption monitoring, and the weather station;
- Step 2: instrumentation in households, including the IEQ, occupants’ behavior and energy consumption (thermal, electricity, and natural gas).
2.3.2. The Measurement Campaign Preparation
- The relationship between the landlord and other project actors;
- The communication means and documents regarding the research project and the residents;
- Collected data usage: potential use outside of the European Union (resulting in modified regulations), storage specifications, data transmission means, and residents’ personal data transferred to the landlord—both the researchers and the landlord are responsible for collected data use, since the data are related to residents living in the landlord’s buildings, despite data being processed by the research team only;
- A written residents’ agreement.
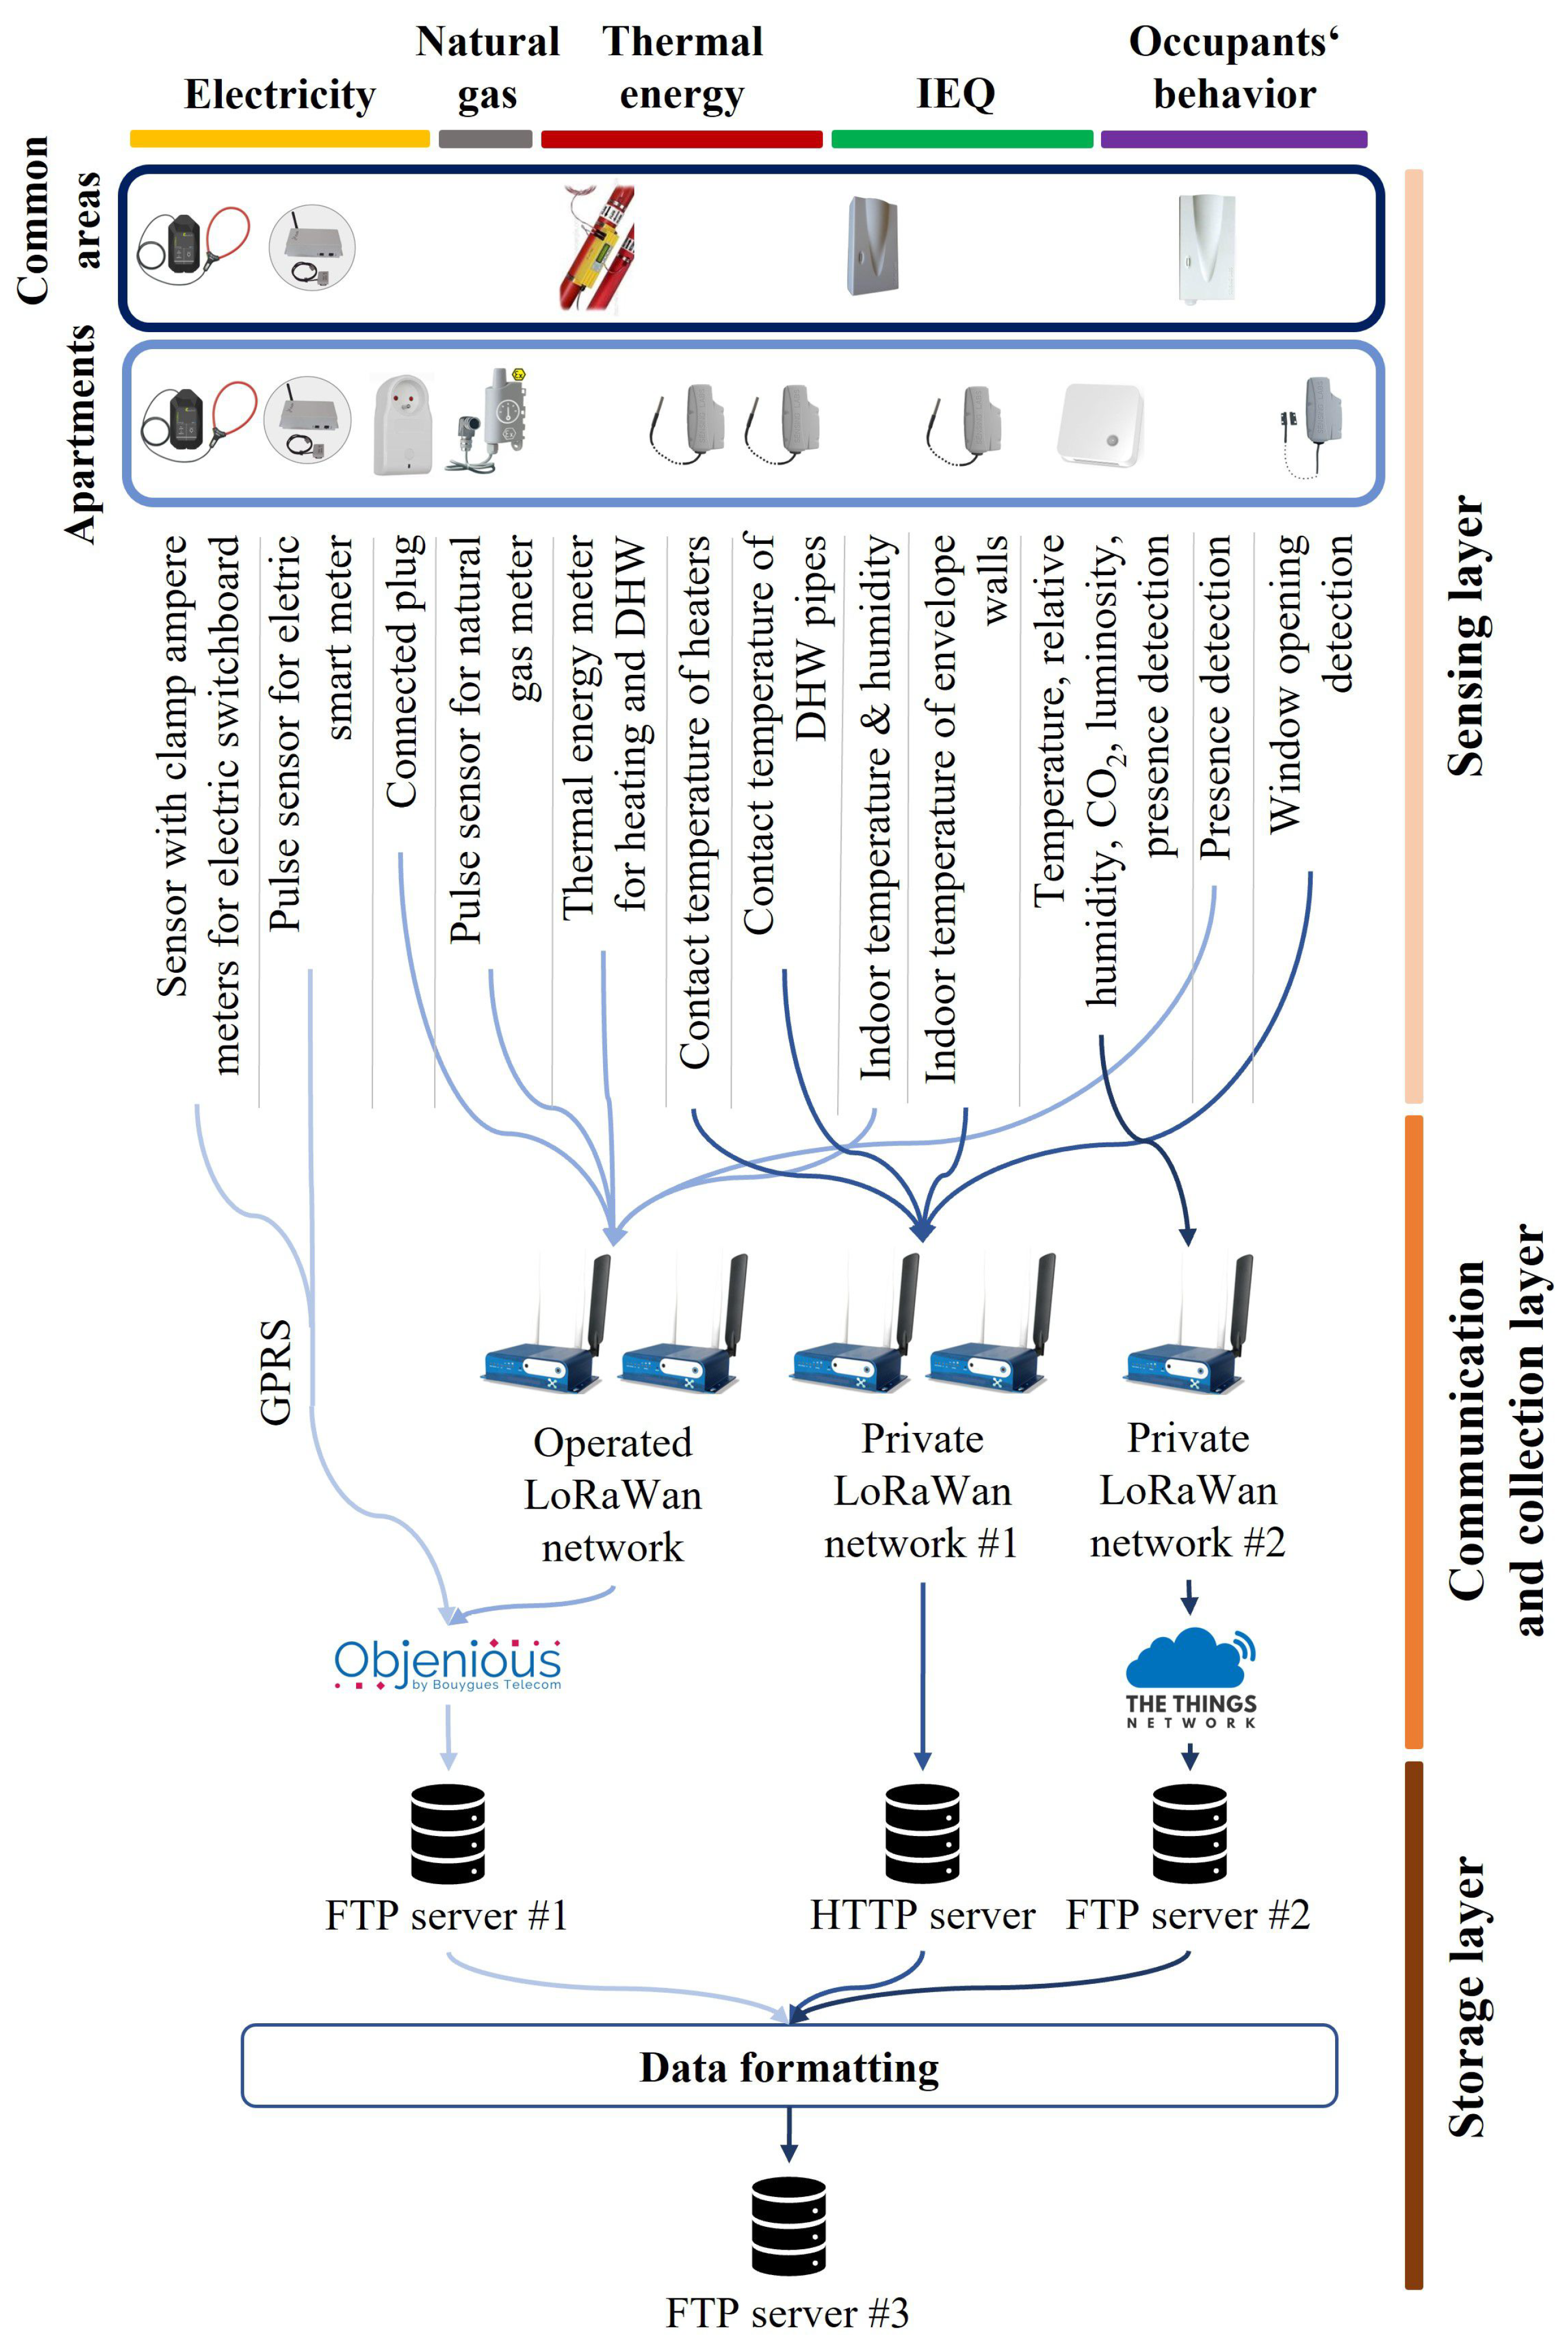
2.3.3. Data Communication and Storage
2.3.4. Measurements
- 1.
- Local weather.
- Context: Reliable quality weather data are needed for a consistent energy analysis. A dedicated weather station was acquired and deployed for this purpose. With a reasonable budget, it provides customized data collection with little day-to-day supervision and an autonomous power supply.
- Technical specifications: The weather station monitors outdoor air temperature, relative humidity, rainfall, wind speed, wind direction, and atmospheric pressure. Two sensors are added: a black globe to measure the radiant temperature, and a pyranometer to measure the incident solar radiation intensity. Specifications of the sensors are summarized in Table 6.
- Setup: The weather station is set up on the roof of a university building, three kilometers away from the instrumentation site. Installing the weather station directly onsite would have been the optimal solution. However, the local building configuration could not enable simple and secure access to a roof for occasional maintenance. The weather station data collection and transmission are entirely managed by a data logger using GPRS data communication. The data acquisition and communication time-steps are set to five minutes. Data are stored on a dedicated FTP server and on the cloud storage of the manufacturer. The latter solution provides an online visualization platform of the collected data. The weather station has an autonomous power supply, including a photovoltaic solar panel and a battery.
- 2.
- Energy consumption: electricity.
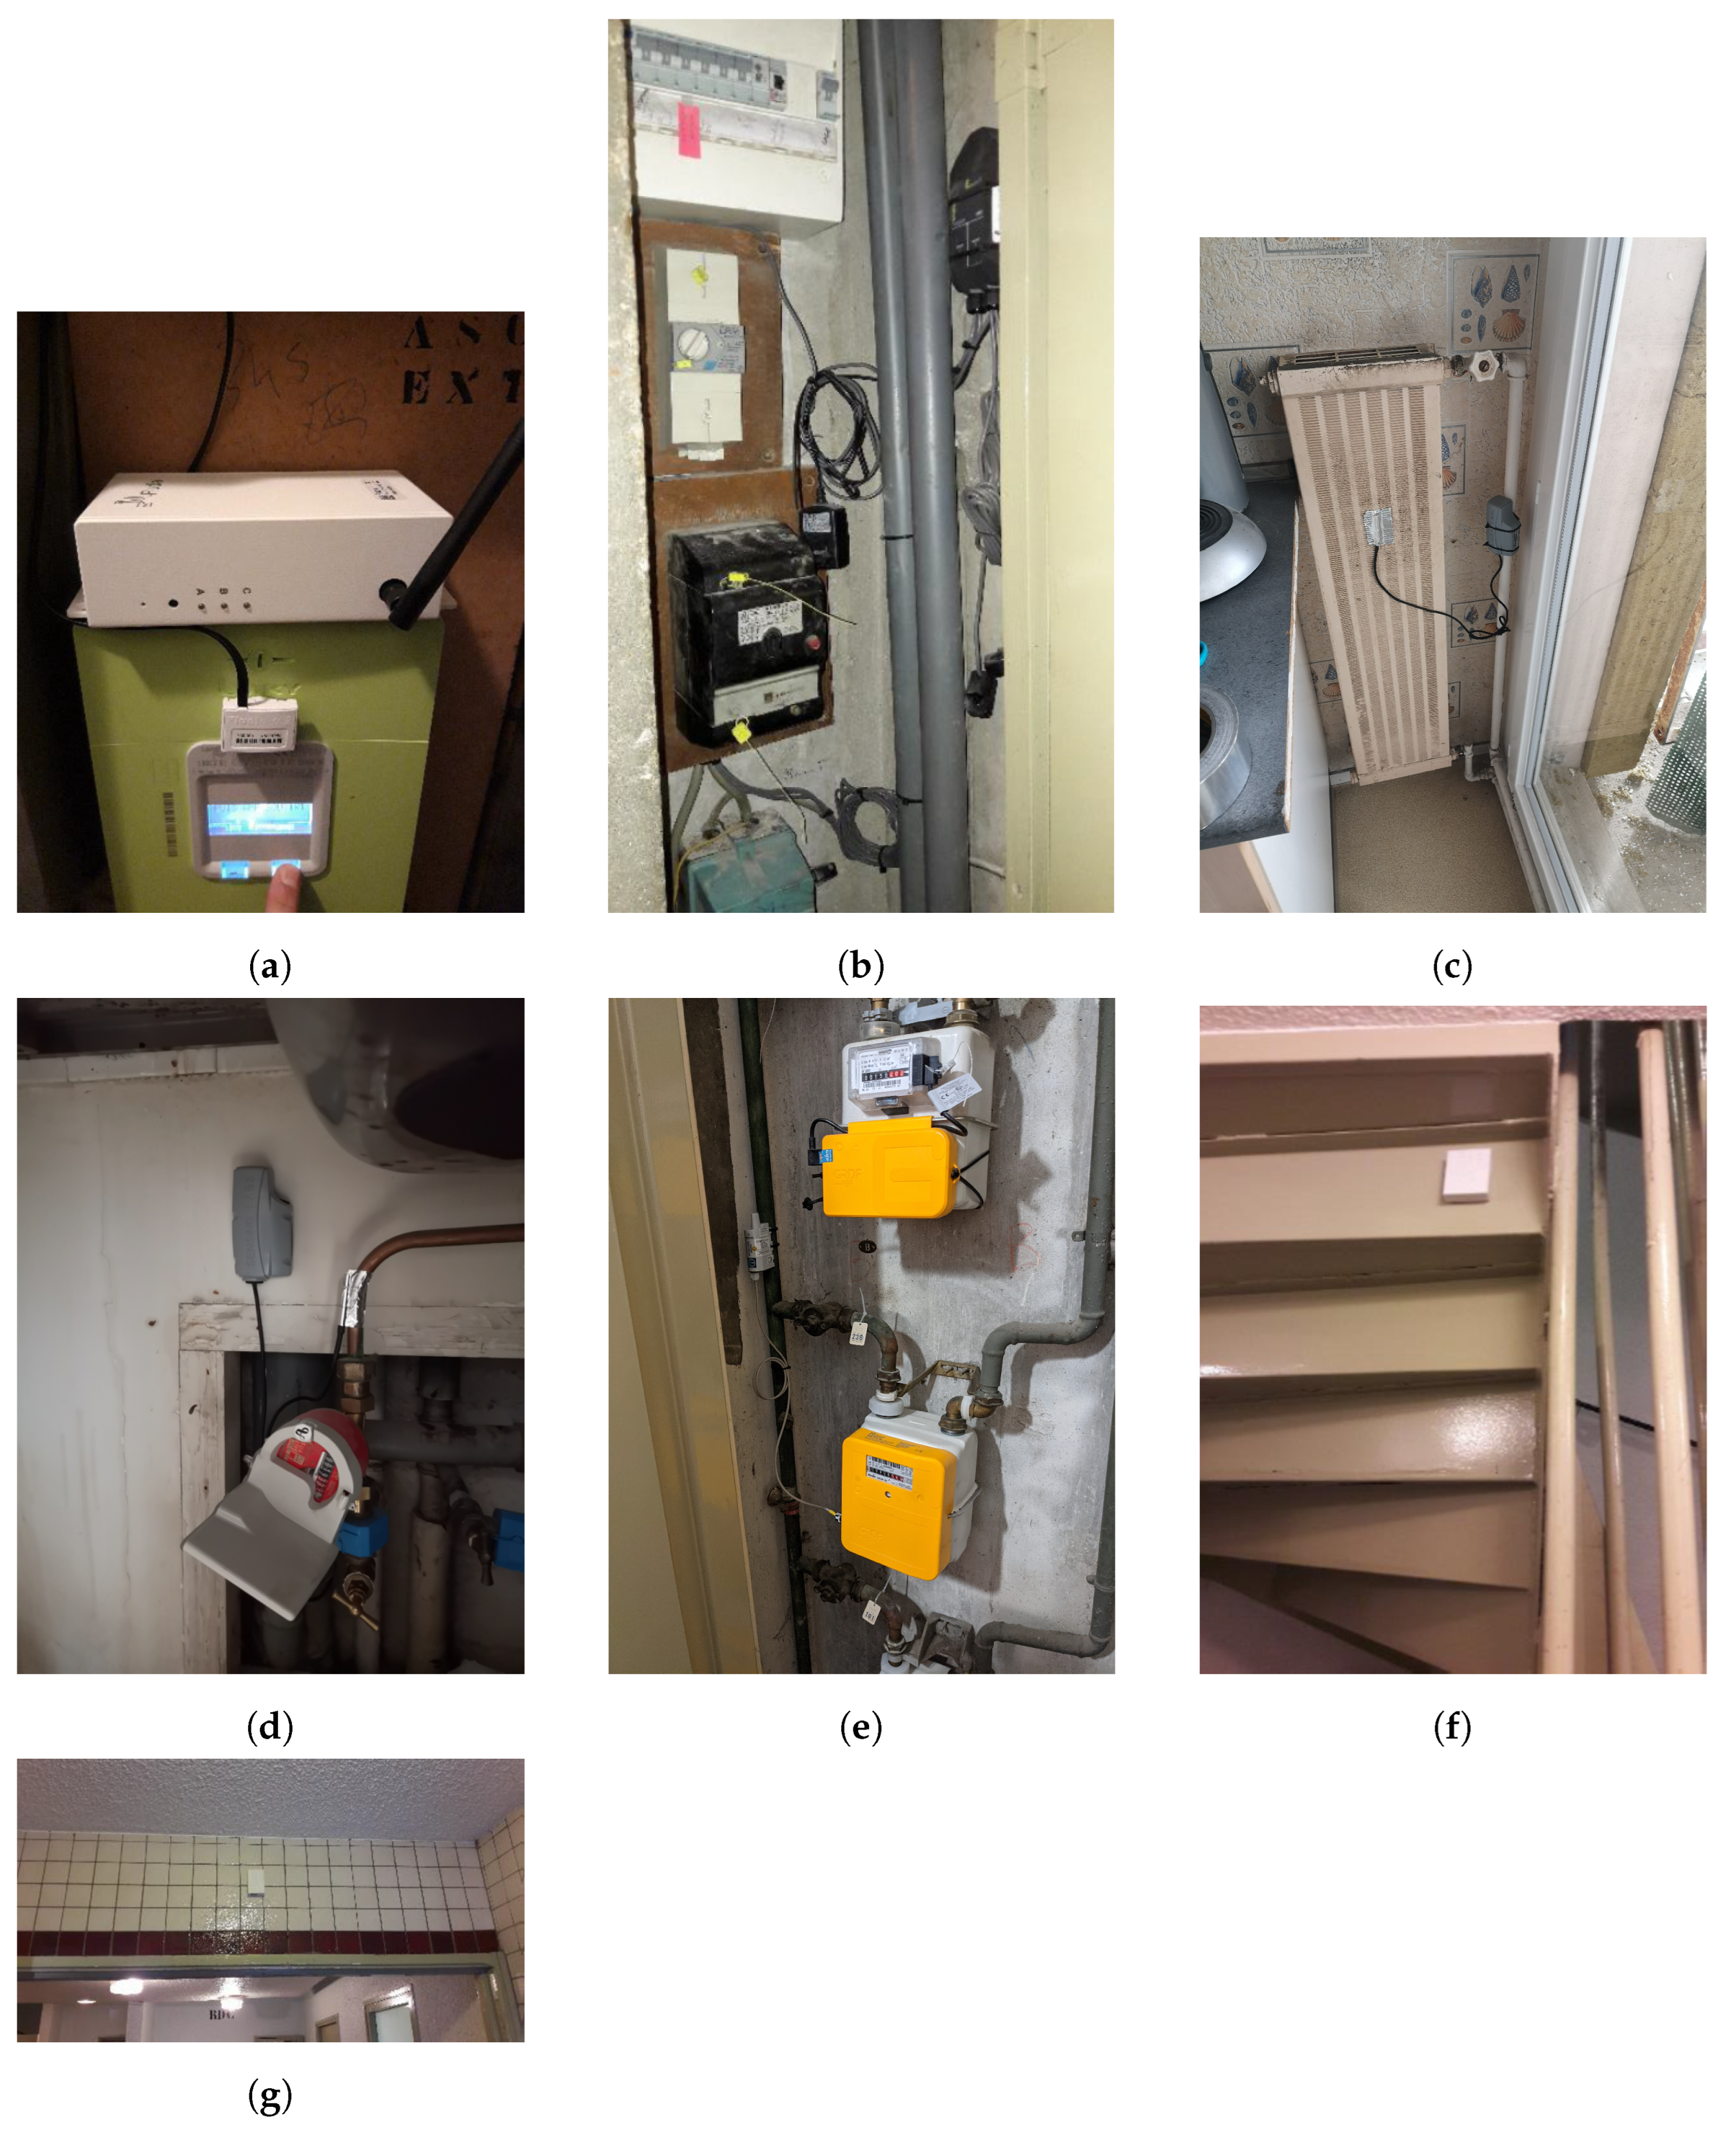
- Common areas:Electric appliances at the building scale include elevators, lighting, CMV, and hot water pumps. Linky smart electricity meters are already installed onsite. Although Linky data can be collected through a specific process with the utility company Enedis (see Appendix A), data granularity is thirty minutes at the lowest. A smaller acquisition time-step is expected to capture small triggering events. Hence, Linky meters are instrumented using a pulse sensor (Figure 3a) to count the number of light pulses; one pulse equals one unit of electricity consumption (in Wh). Data are acquired and transferred at a one-minute time-step using the GPRS communication protocol.Sensors are installed in technical rooms. In all three buildings, there is one sensor for the elevator, CMV, floor lighting, elevator lighting, and the magnetic entrance door. A meter is also used for the hot water pumps of the heating substation and later removed when the heating substation is modified following energy retrofit actions. Pulse sensors are powered with batteries.The main electrical switchboard of B3 is instrumented with a sensor connected to six clamp ampere meters (Appendix A). It is shown in Figure 3b. It measures the current of indoor lighting in shared areas and calculates the corresponding energy consumption, assuming a constant 240 V voltage and single-phased current (C = 0.9). Data are collected and transferred with a ten-minute time-step using GPRS. A dedicated power supply and circuit breaker are required for this sensor.
- Housings: In housings, electricity monitoring targets two spatial scales for data collection. Pulse-reading sensors for Linky smart meters are installed in each instrumented apartment. They monitor the overall electricity consumption of the apartment. Sensors with clamp ammeters for electrical switchboards are also used. Only three of these sensors are installed, in B1/3, B2/0, and B3/0, because of the intrusive data collection process, the difficult installation, and the cost of the sensors and their installation. The supervision of the electricity switchboard focuses on room-aggregated electricity consumption, lighting, and large appliances whose electricity consumption cannot be accessed by other means. The electricity monitoring system is complemented with connected plugs (Appendix A) that measure the energy consumption of household appliances. They are used to represent the energy consumption of the apartments at the appliance level. The number of smart plugs depends on the configuration of the households and the identified appliances.Data collection is performed using the operated LoRaWAN network with a one-minute acquisition time-step and a ten-minute data communication time-step. Hence, electricity consumption can be analyzed at three different scales: apartment, room, and appliance.
- 3.
- Energy consumption: thermal energy.
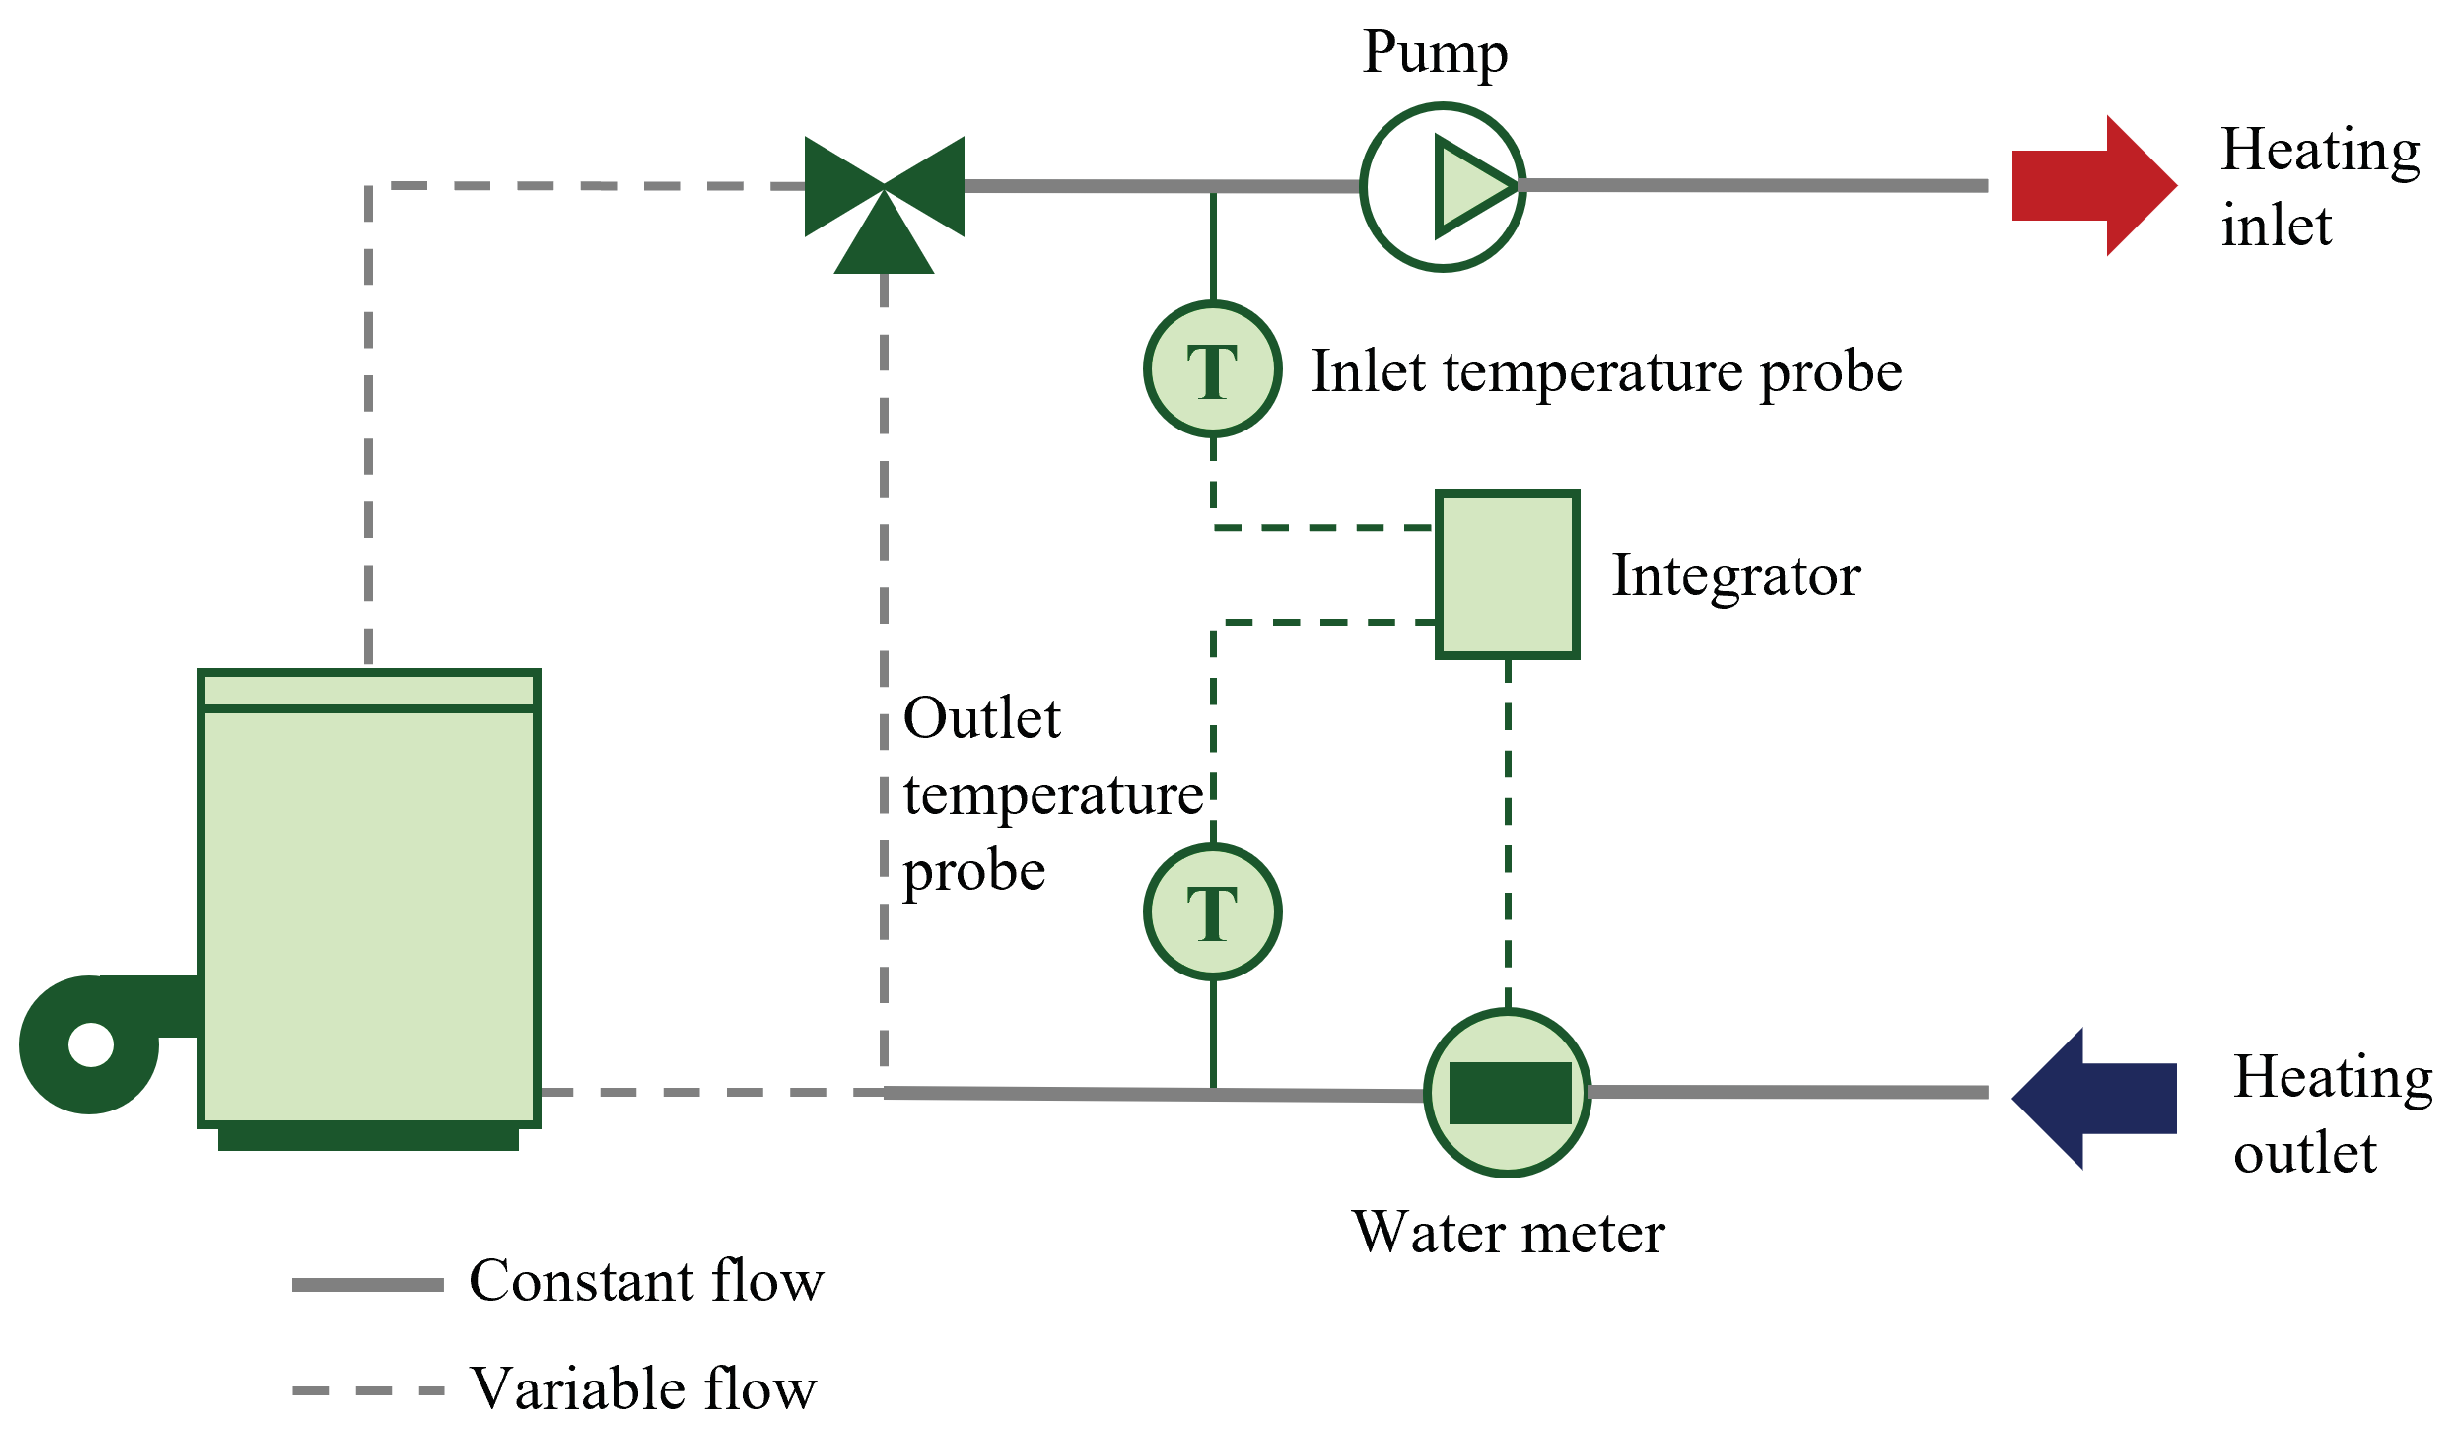
- Common areas: Thermal energy consumption refers to hot water production for heating and domestic use. It is monitored using specifically designed thermal energy meters. Thermal energy meters have three distinctive elements (Figure 4): (i) two temperature probes, one on the inlet and one on the outlet water pipe, (ii) a flow meter installed on the outlet water pipe, and (iii) a computer to calculate the corresponding thermal energy consumption using temperature and flow measurements with respect to features of the piping system.Implemented thermal meters use ultrasonic water flow probes that do not require an intrusive integration into the water circuit. They are simply installed on the water pipes. Ultrasonic meters measure the time needed by an ultrasonic impulsion to move from the sending probe to the receiving probe through the water pipes. Knowing the traveling time and depending on the inner diameter, outer diameter, and material of the pipe, the water flow is assessed. Temperature probes are located on the outside of the pipe and are insulated from the surrounding environment.Thermal energy meters available on the IoT market are not communicating meters, and it is necessary to add a pulse sensor (Appendix A). As for electricity meters, this sensor counts the number of pulses from the energy meter (one pulse equals one kWh of thermal energy consumption). Thermal energy meters require a power supply with a circuit breaker, and the pulse sensors are powered with batteries.Thermal energy consumption data are collected for relatively large-time-range analyses (daily, monthly, or annual). Hence, an hourly acquisition and transmission time-step is established for all thermal energy meters using the operated LoRaWAN network.
- Housings: Thermal energy in apartments is characterized considering heaters and DHW pipes, but it is more difficult to characterize for building-scale data acquisition. Ideally, measurements for both end-uses should be performed on the main hot water pipes with thermal energy meters. However, these pipes can hardly be accessed and such an instrumentation setup would be too expensive for consideration.Contact temperature sensors (Appendix A) are installed on all heaters of each instrumented apartment. See Figure 3c. Measurements are performed on a private LoRaWAN network with thirty-minute data acquisition and communication time-steps.For DHW, the same sensor given in Figure 3d is used with a one-minute acquisition time-step and a twenty-minute communication time-step. The small data acquisition time-step aims to precisely capture DHW consumption through the variations in DHW temperature. The sensor is installed on the outlet of hot water meters in the apartments.
- 4.
- Energy consumption: natural gas. Natural gas is used only in apartments for cooking. Natural gas meters are equipped with Gazpar modules (see documentation in Appendix A). As for the Linky smart electric meter, the Gazpar meter is a smart meter implemented by the national utility GRDF (Gaz Reseau Distribution France) and collects consumption data. A pulse sensor is used on Gazpar meters (Figure 3e). It reads every pulse corresponding to a 10 dm change in gas consumption. Unlike other pulse sensors, it is specifically adapted to be used in explosive atmospheres. A total of four sensors are implemented with a one-hour data acquisition and communication time-step on the operated LoRaWAN network.
- 5.
- Indoor environment quality (IEQ).
- Common areas: In common areas of the buildings, IEQ is characterized through Indoor Air Temperature (IAT) and relative humidity measurements. For each building, three sensors are installed: one on the ground floor, one on the intermediate floor and one on the last floor. Preferably, these sensors would be installed at a height of 1.50 m. However, since sensors are installed in corridors, they need to be out of sight and reach. Sensors are located under the ceiling, on the structure of the stairs (Figure 3f).The data acquisition time-step is set to one hour. No sudden variations in temperature and humidity are expected, apart from doors or windows that could be opened near the sensors. Data are communicated with an hourly time-step using the LoRaWAN operated network.
- Housings: IEQ measurements in housings are IAT, relative humidity, brightness, CO concentration (Appendix A), and occupants’ presence detection, which is described below. The sensors are located in the living room of housings. Measurements are performed with a half-hour time-step on a private LoRaWAN network (private LoRaWAN network #2 in Figure 2).Another sensor measures the contact temperature of the inner surface of walls. The sensor is the same as for heaters and DHW. These data aim to assess the radiant temperature of walls, which is a relevant parameter regarding indoor comfort; even though the air temperature might be sufficiently high, if the surrounding walls are excessively cold, it affects the feeling of comfort [33]. These data can be combined with IAT measurements to calculate the operative temperature, the average between IAT and the indoor temperature of walls. These sensors are set up with hourly data acquisition and communication time-steps on the operated LoRaWAN network.
- 6.
- Occupants’ behavior.
- Common areas: Occupants’ behavior characterization in building common areas is performed with infrared presence detectors (Appendix A) positioned above the main entrance door of the buildings (Figure 3g). This technology is commonly found in automated lighting systems linked with timers [10]. PIR sensors do not discriminate between people entering or leaving the building and they cannot count the number of detected people. Presence detection is aggregated and communicated at an hourly time-step using the operated LoRaWAN network.
- Housings: Occupants’ behavior in households is characterized through presence detection in the apartments (from the same multimeasurement sensor used for IEQ monitoring (Appendix A)) and window and glazed door opening detection. Presence is assessed using an infrared sensor as in common portions of the buildings. Data are aggregated at a half-hour time-step. It counts the number of passes in front of the sensor.Window opening detection is monitored with contact sensors (Appendix A). Data acquisition and communication are event-driven; data are acquired and transferred when the window opening status changes. Then, if there is no status change for over an hour, a data point is sent every hour to recall the latest opening/closing status of the window.
3. Data Analysis and Key Learnings
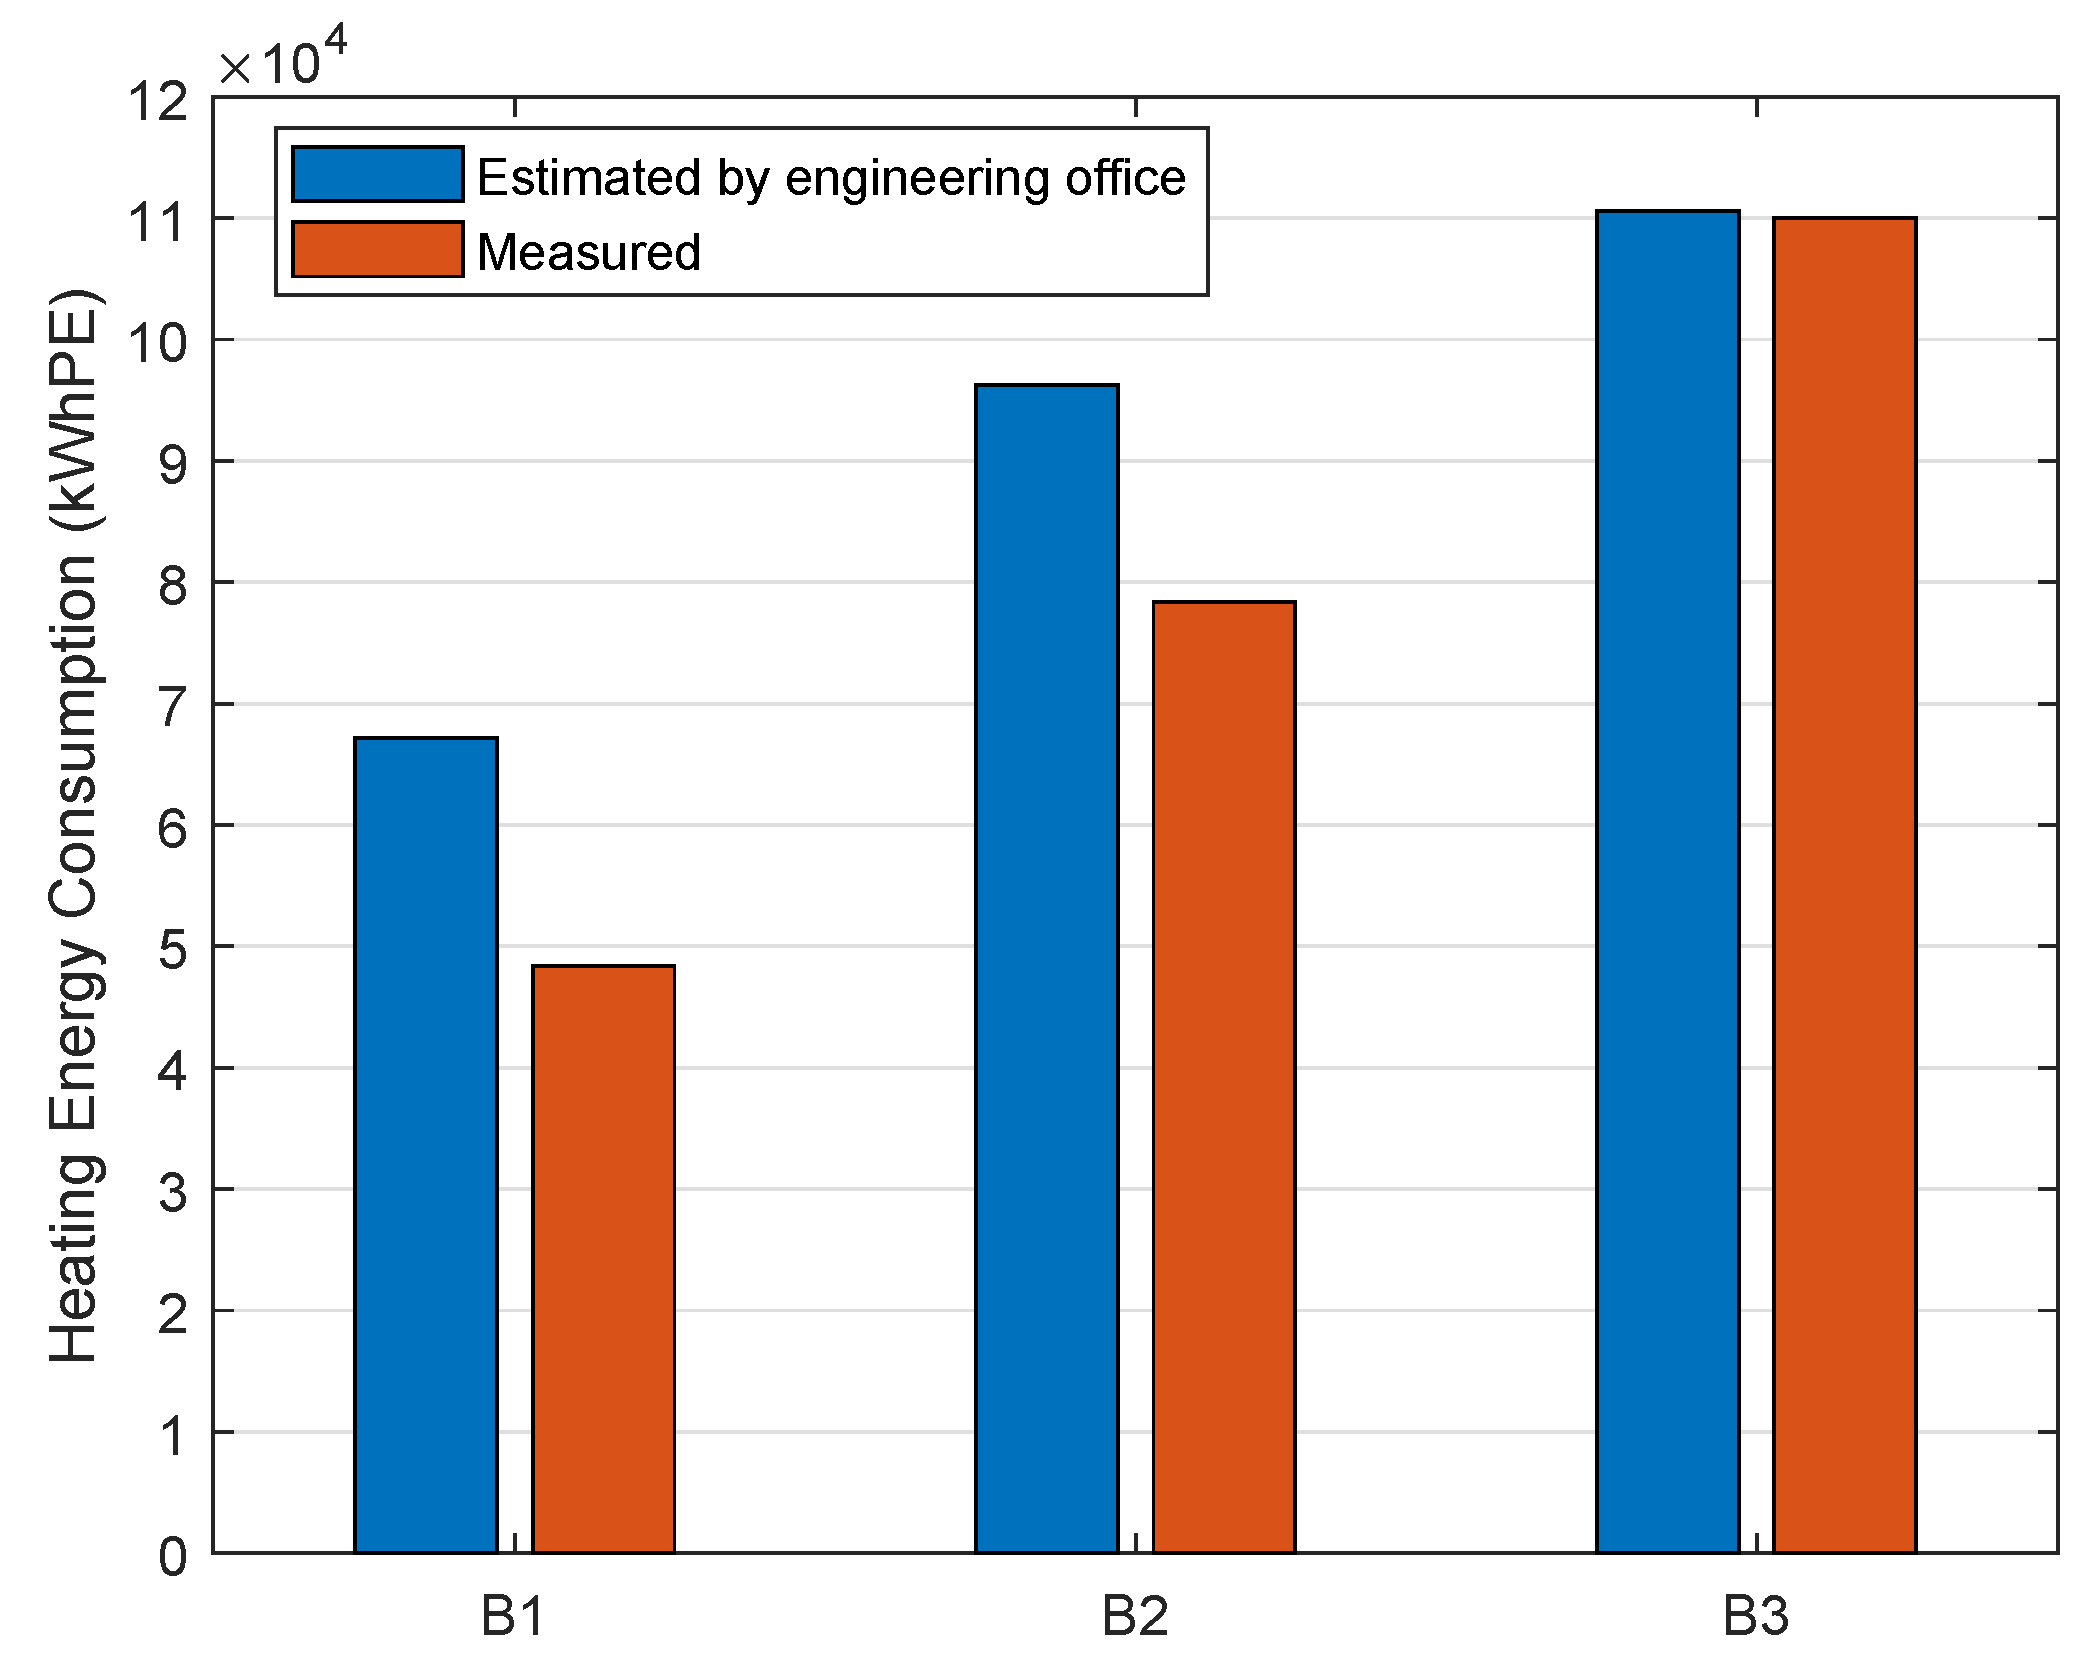
3.1. Heating Energy Consumption of the Buildings
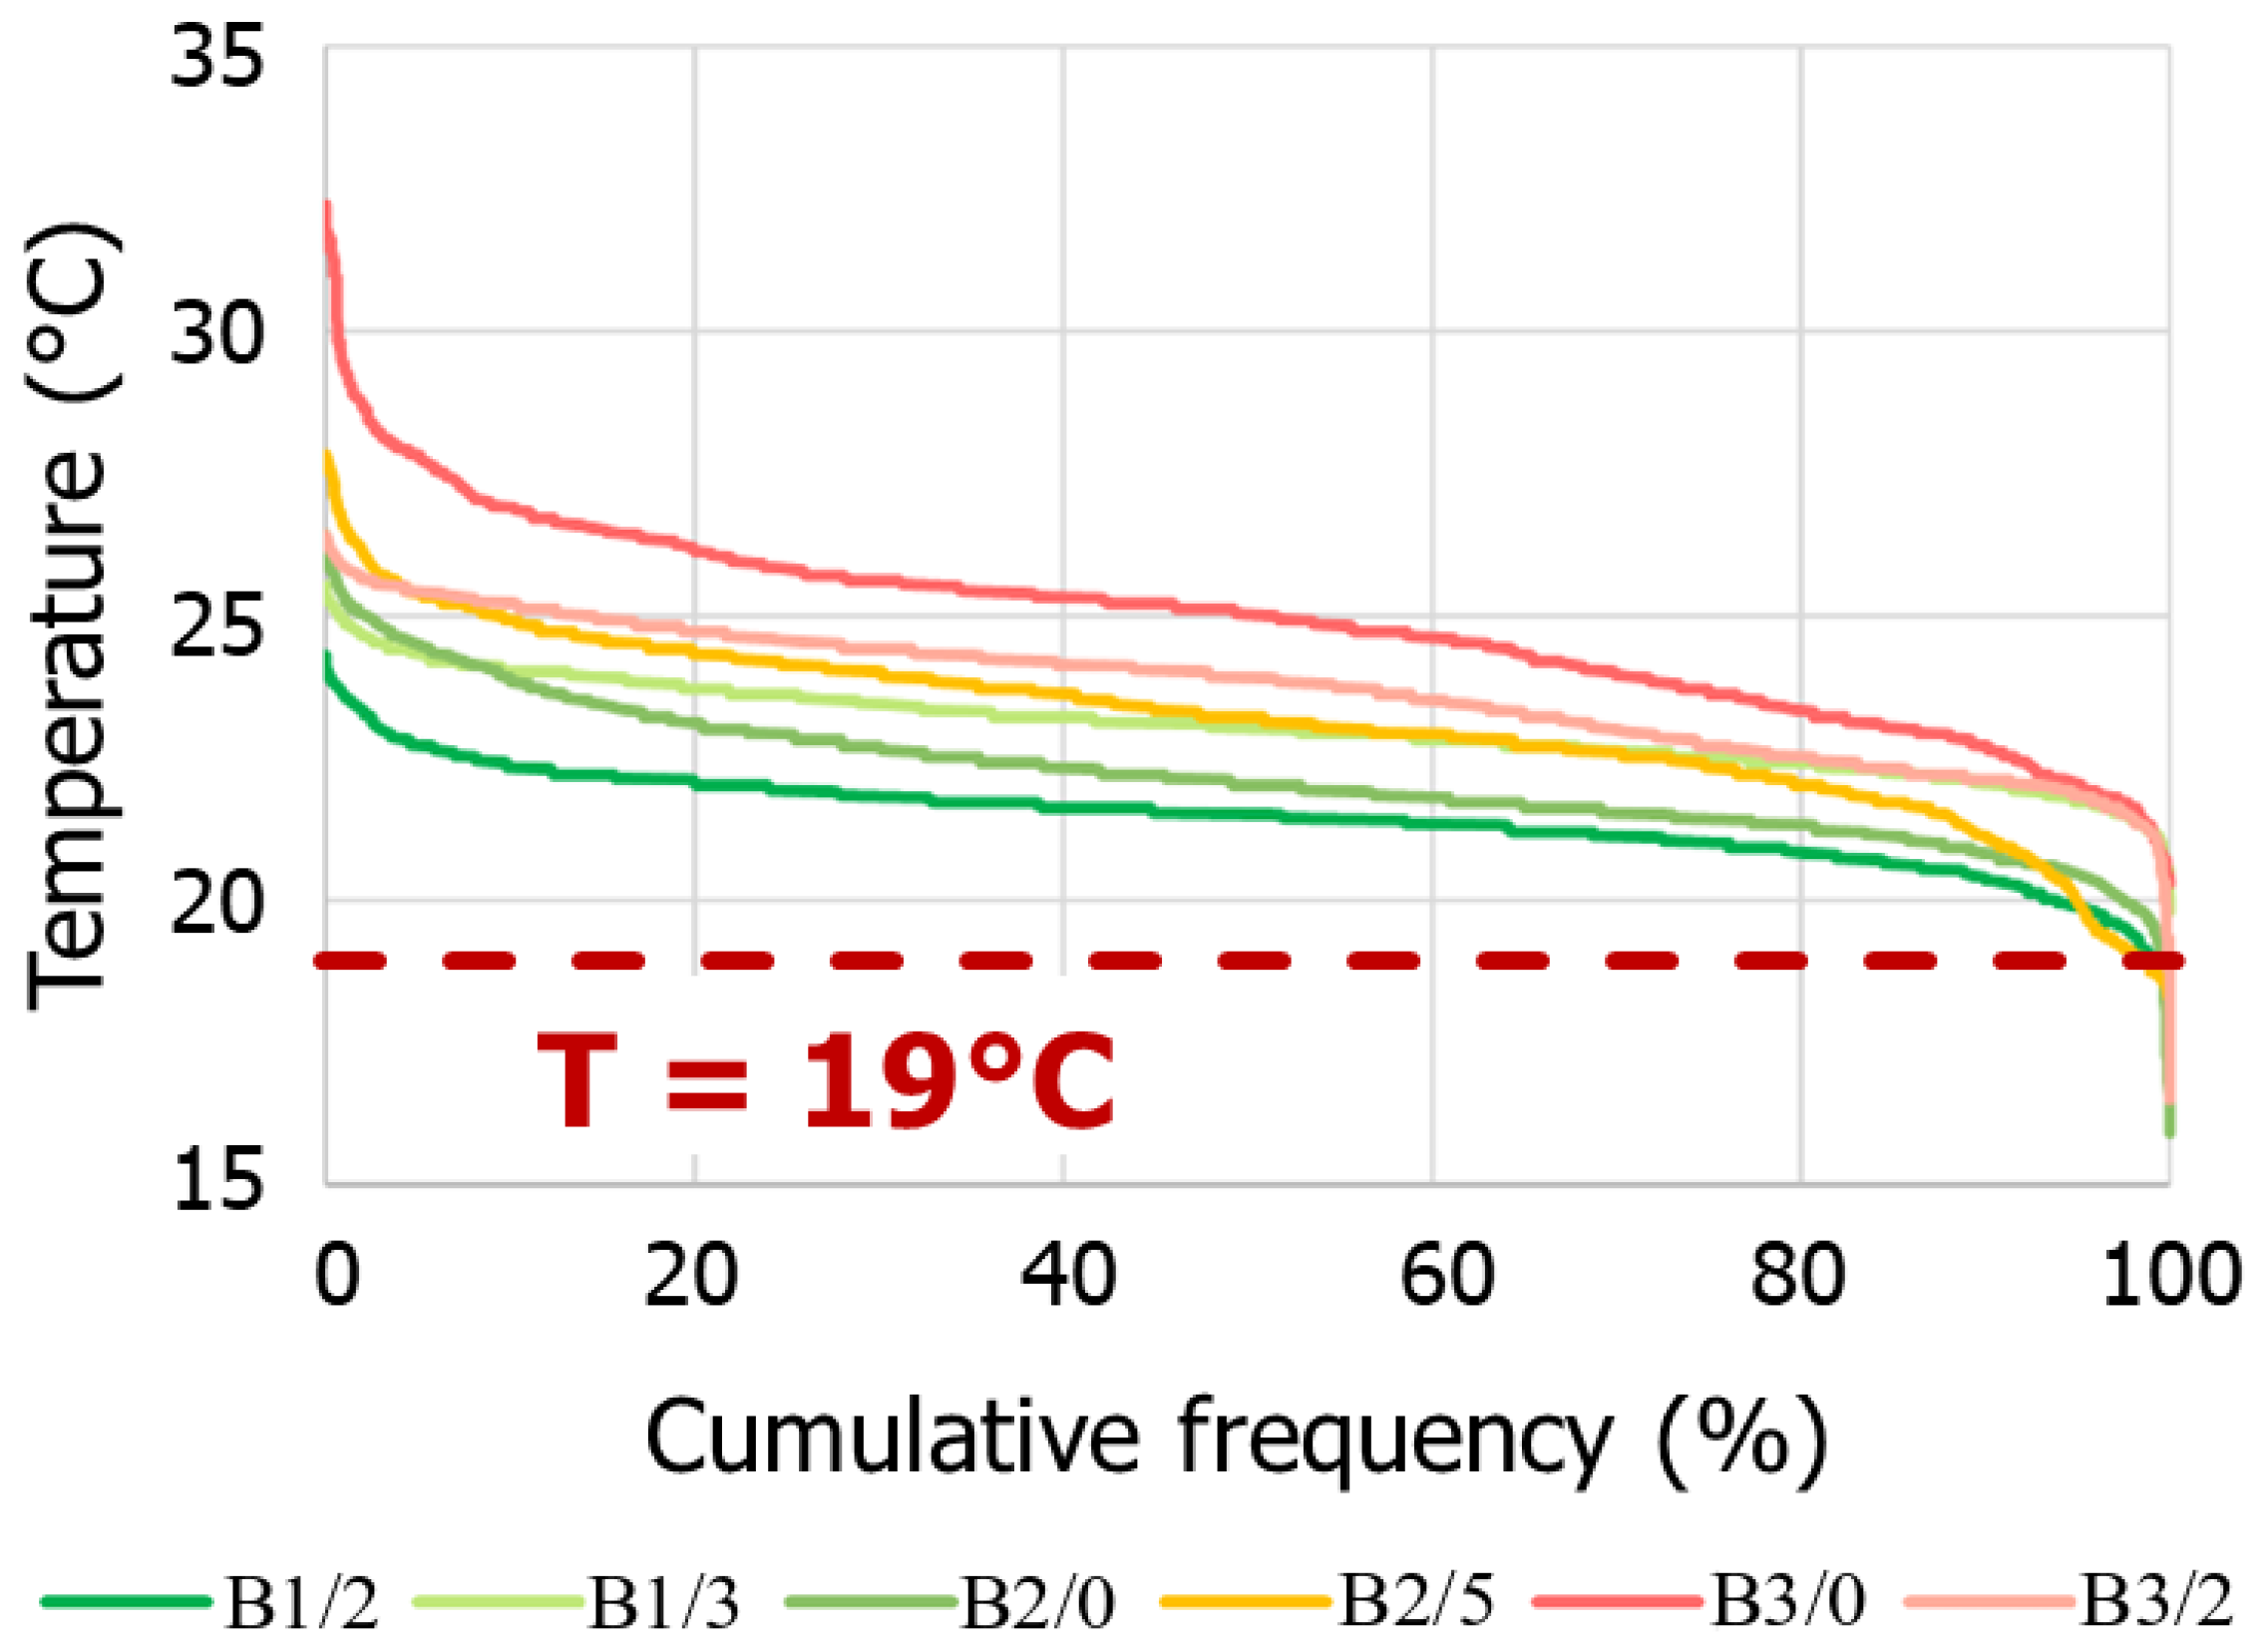
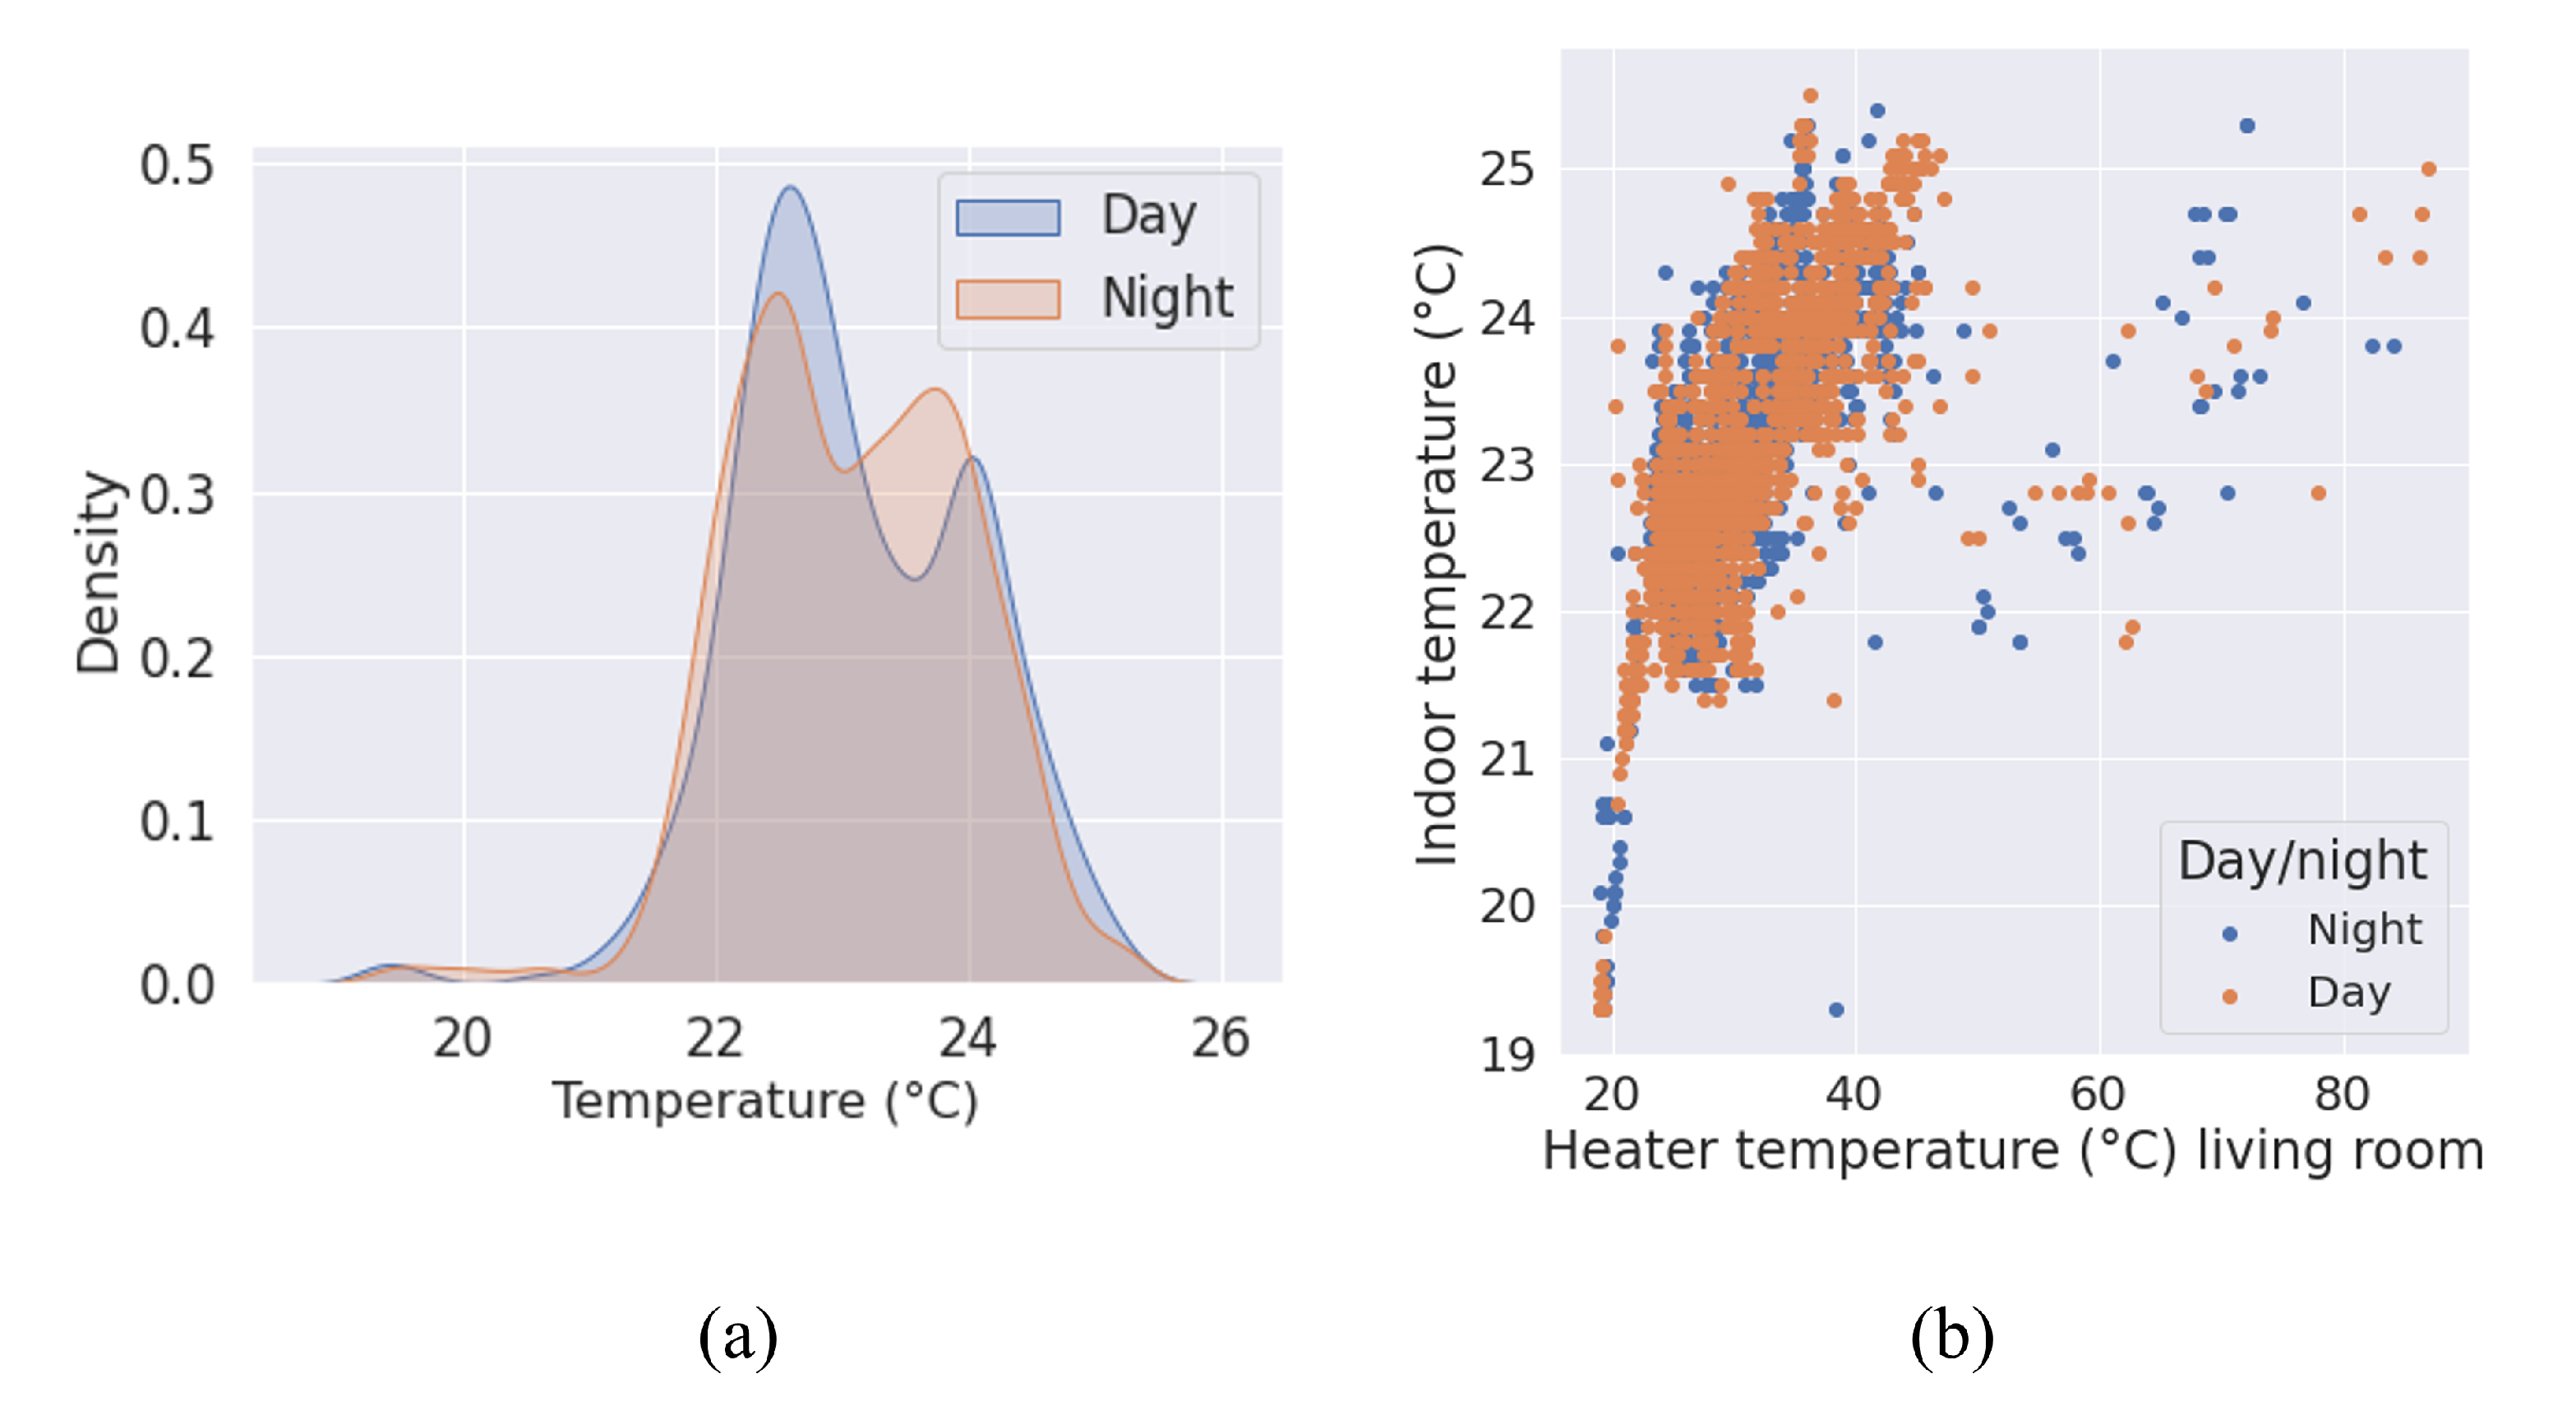
3.2. Indoor Air Temperature in Apartments and Heating Patterns
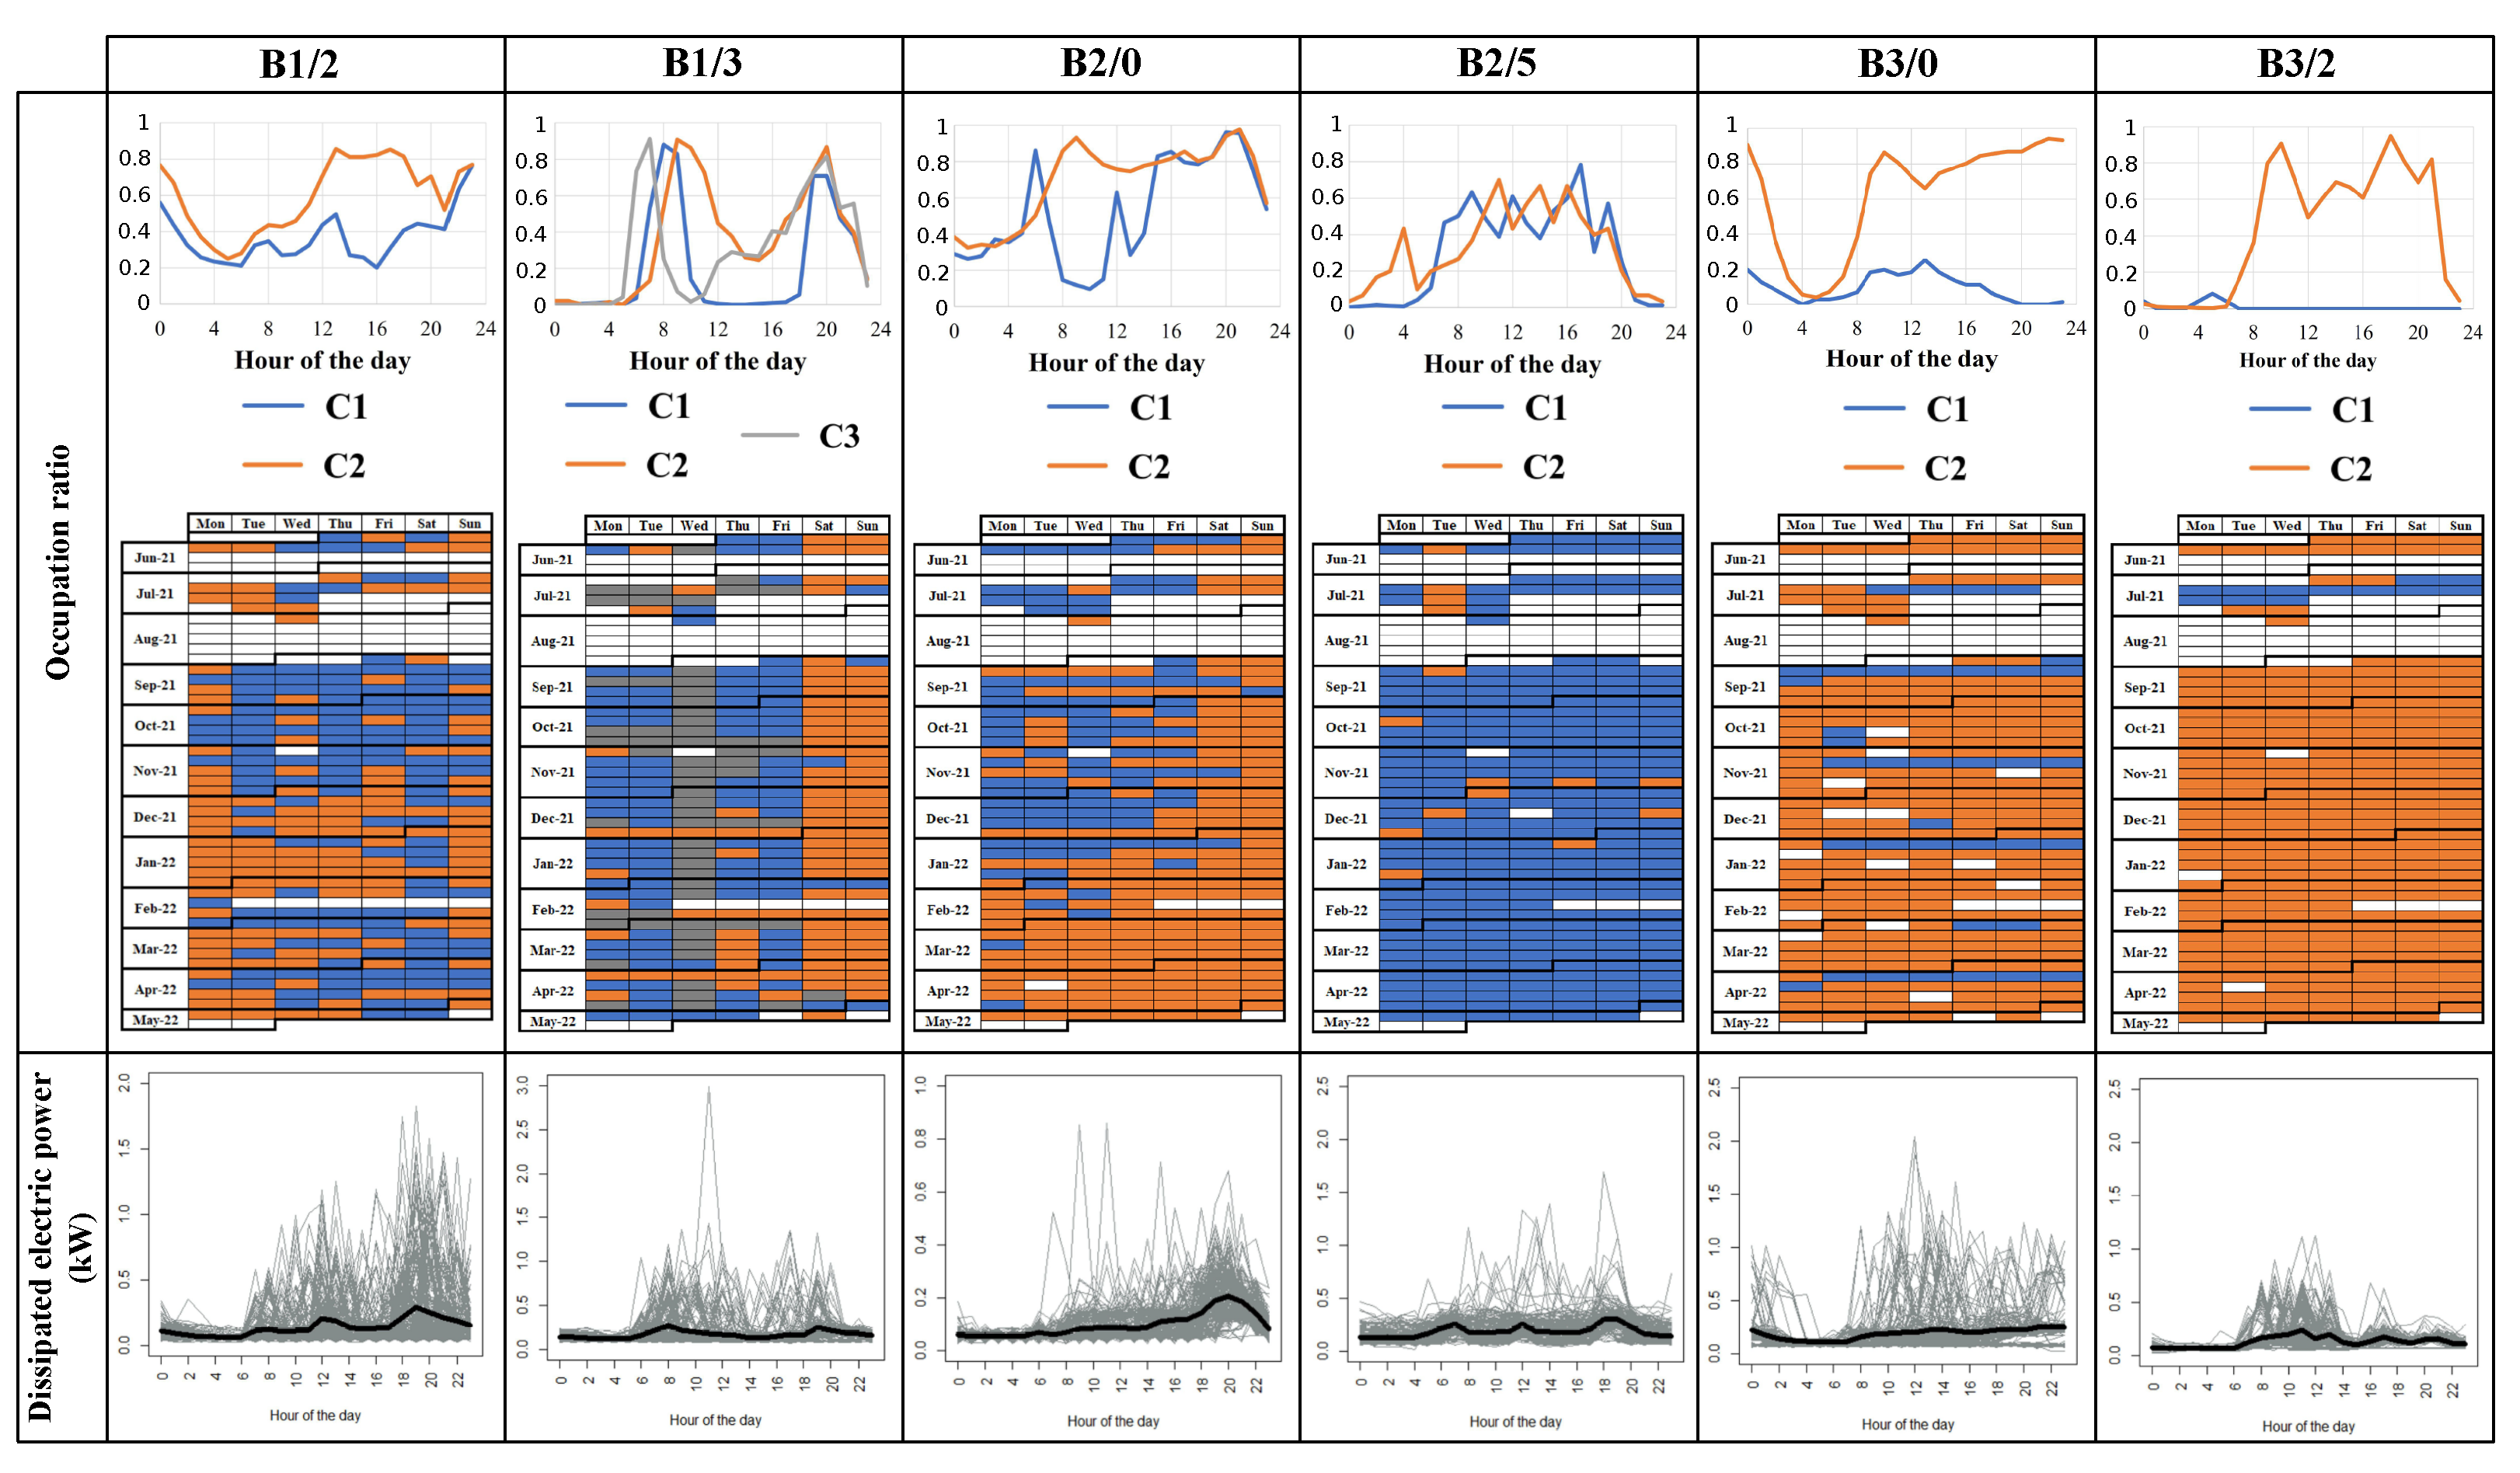
3.3. Occupancy and Dissipated Electric Power Consumption in Apartments
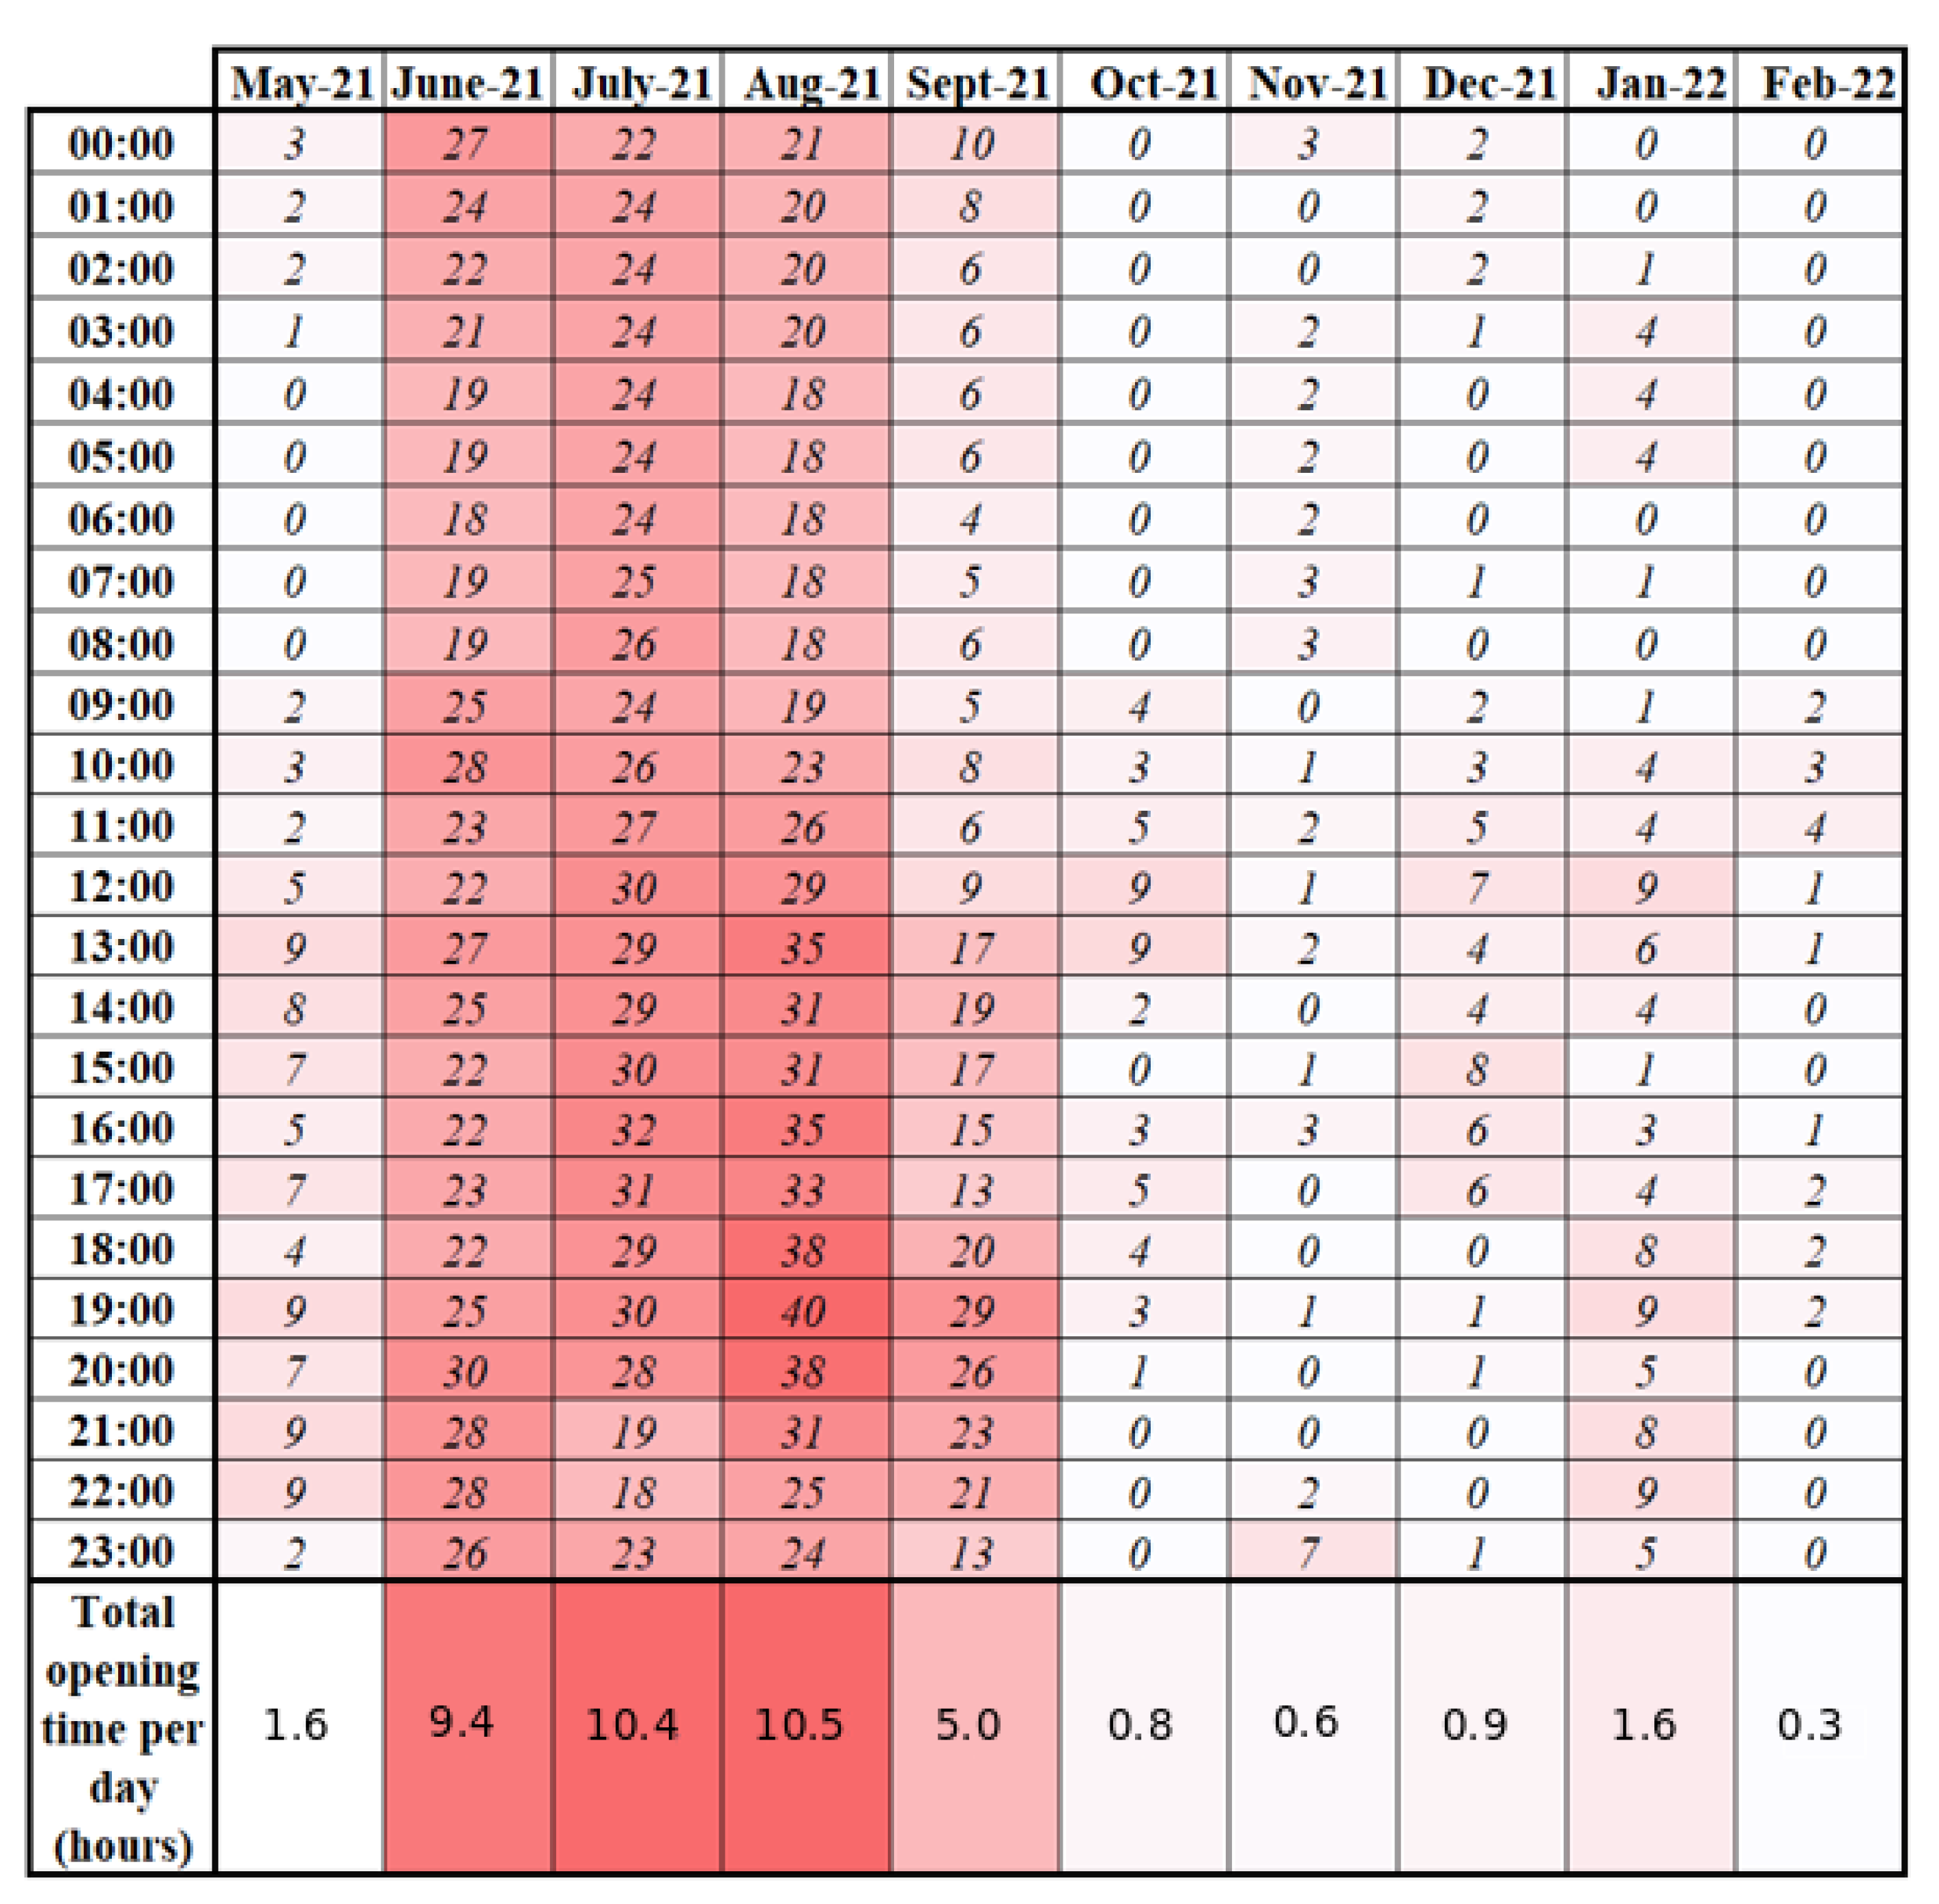
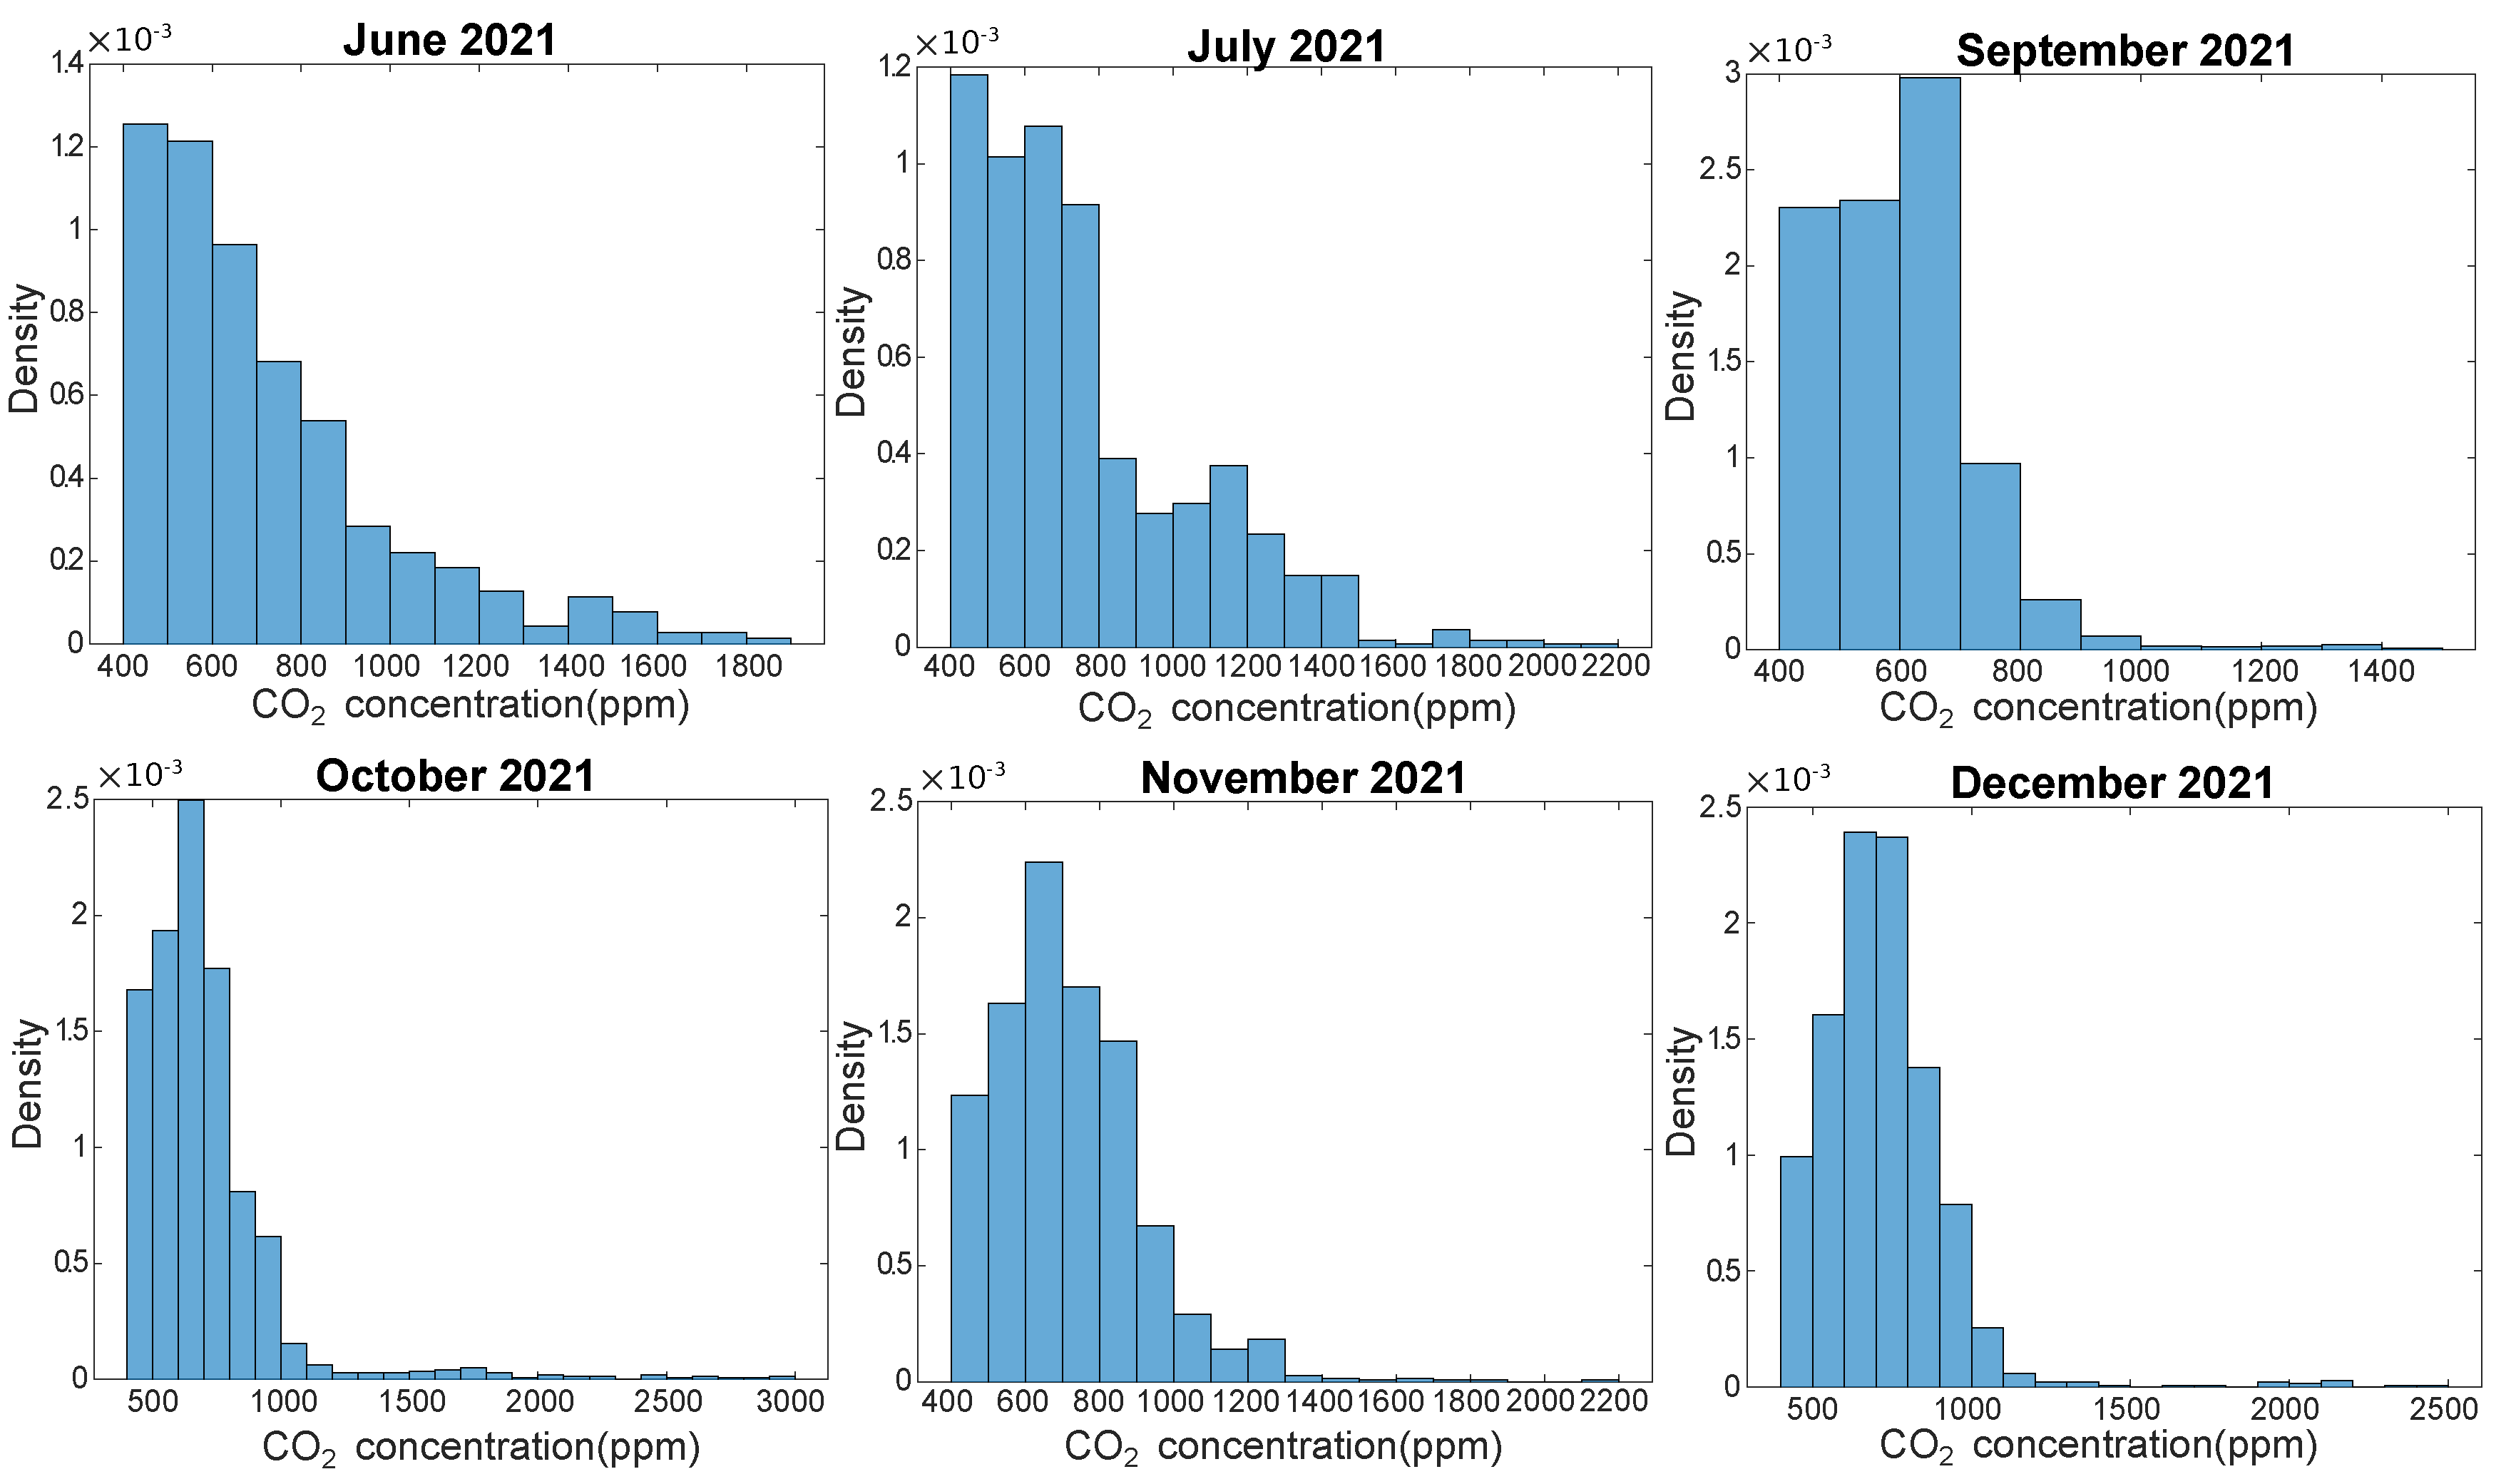
3.4. Natural Ventilation and CO Measurement in Apartments
4. Feedback on the Implementation and Operation of the Sensor Network and Possibilities for Improvement
4.1. Feedback on the Deployed Sensor Network
- Installation conditions and environment. The case study is a group of three existing buildings built in 1974. The integration of a sensor network in existing buildings is more difficult than that in a newly built or recently built structure. Another difficulty is that buildings are occupied. Hence, the sensor network must be as minimally intrusive as possible. Nevertheless, necessary maintenance can still disturb inhabitants and data collection may be disturbed by inhabitants (moving or switching off sensors and gateways, for instance). Finally, retrofit actions are conducted during part of the instrumentation process, which results in several issues.
- Targets of the sensor network. Because the sensor network targets a large range of measurements, it is necessary to mix many different technologies of sensors, data acquisition, communication, and storage. These technologies are not always fully compatible and result in additional challenges for long-term project maintenance. Additionally, the sensor network relies on IoT objects. We observed that the current IoT market is more fitted for large-scale deployment strategies over approximately one year than for high-precision measurements and long-term monitoring.
- Project management. From the design brief to the installation and long-term maintenance, the sensor network requires optimized management, specifically regarding third parties, such as volunteering housings and contractors. Participants are essential to the project, since the results entirely depend on a sufficient amount and diversity of collected field data. Contractors also play a significant role. They usually provide “plug-and-play” management; sensors are provided, set up, installed, and maintained. However, most IoT contractors are energy managers who delegate installation and maintenance tasks to other contractors and have limited field knowledge. Hence, it is very time-consuming to solve any technical issue.
4.2. Limitations and Potential Improvements
4.2.1. Measurements
4.2.2. Technological Choices
4.2.3. Calibration and Long-Term Maintenance
4.2.4. Data Loss
- Installation conditions and environment: walls, scaffolding, metal elements, sensor location, or distance to the gateways;
- Unexpected sensors and gateway handling, from residents, construction teams, or visitors, willingly or accidentally;
- Electricity shortage affecting sensors and gateways with grid power supply;
- Equipment failure: worn out batteries, crashed sensors or gateways, either because of manufacturing defects, punctual bugs, overuse, or long-term usage defects;
- Network issues including difficulties for sensors or gateways to access GPRS or LoRaWAN networks;
- Server issues.
5. Conclusions
Author Contributions
Funding
Data Availability Statement
Acknowledgments
Conflicts of Interest
Abbreviations
| AQC | Agence Qualité Contruction |
| APC | Agence Parisienne du Climat |
| BEMS | Building Energy Management System |
| CMV | Controlled Mechanical Ventilation |
| CNIL | Commission Nationale Informatique et Libertés |
| CSV | Comma Separated Values |
| CPCU | Compagnie Parisienne de Chauffage Urbain |
| CSTB | Centre Technique et Scientifique du Bâtiment |
| DHW | Domestic Hot Water |
| EDF | Electricité de France |
| EPD | Energy Performance Diagnosis |
| FTP | File Transfer Protocol |
| GPRS | General Packet Radio Service |
| GRDF | Gaz Reseau Distribution France |
| HVAC | Heating Ventilation Air Conditioning |
| HTTP | Hypertext Transfer Protocol |
| IAT | Indoor Air Temperature |
| IAQ | Indoor Air Quality |
| IEQ | Indoor Environment Quality |
| IoT | Internet of Things |
| LoRaWAN | Long Range Wide area network |
| NILM | Non Intrusive Load Monitoring |
| PIR | Passive InfraRed |
| QSE | Qualité Sanitaire et Energétique |
| SEREINE | Solution d’Evaluation de la peRformance Energétiuqe IntrinsèquE des bâtiments |
| TIC | Télé-Information Client |
| VOC | Volatile Organic Compound |
Appendix A. List of Sensors with Their References
| Sensor | Label | Documentation |
|---|---|---|
| Le compteur communicant|Enedis | Linky | https://www.enedis.fr/linky-compteur-communicant (accessed on 6 June 2023) |
| Compteur d’énergie thermique | EWATTCH | |
| LoRaWAN SMART PLUG | LoRaWAN SMART PLUG | http://www.nke-watteco.fr/wp-content/uploads/2018/06/LoRaWAN-Smart-Plug-Fiche-Technique-v1.1.pdf (accessed on 6 June 2023) |
| Capteur Tyness Energy | EWATTCH | https://www.ewattch.com/portfolio-835item/tyness-energy-lora/ (accessed on 10 April 2020) |
| PUL-LAB-13XS Outdoor ATEX LoRa | PUL-LAB-13XS Outdoor ATEX LoRa | SensingLabs |
| Compteur gaz communicant | Gazpar | https://www.grdf.fr/particuliers/fonctionnement-compteur-gaz-communicant-grdf (accessed on 6 June 2023) |
| Capteur Temperature-Hygrometrie LoRa | THY-LAB-61NS | SensingLab |
| ERS LoRaWAN room sensor for measuring indoor environment | ELSYS | https://www.elsys.se/en/ers/ (accessed on 6 June 2023) |
| Capteur PIR Indoor | PIR-LAB-21NS | SensingLab |
| Transmetteur contact magnetique outdoor | OPE-LAB-13NS | SensingLab |
| Transmetteur contact magnetique outdoor | OPE-LAB-13NS | SensingLab |
| Module temperature LoRa | TEM-LAB-14NS | SensingLabs |
References
- Reiter, S. Energy Consumption: Impacts of Human Activity, Current and Future Challenges, Environmental and Socio-Economic Effects; Nova Science Publishers: Hauppauge, NY, USA, 2014. [Google Scholar]
- Guerra-Santin, O.; Tweed, C.A. In-use monitoring of buildings: An overview of data collection methods. Energy Build. 2015, 93, 189–207. [Google Scholar] [CrossRef]
- Zhao, L.; Zhang, J.-L.; Liang, R.-B. Development of an energy monitoring system for large public buildings. Energy Build. 2013, 66, 41–48. [Google Scholar] [CrossRef]
- Li, Y.; Yang, G.; Su, Z.; Li, S.; Wang, Y. Human activity recognition based on multienvironment sensor data. Fusion 2023, 91, 47–63. [Google Scholar] [CrossRef]
- Yang, G.; Liu, S.; Li, Y.; He, L. Short-term prediction method of blood glucose based on temporal multi-head attention mechanism for diabetic patients. Biomed. Signal Process. Control 2023, 82, 104552. [Google Scholar] [CrossRef]
- Wang, Q.; Fan, Z.; Sheng, W.; Zhang, S.; Liu, M. Cloud-assisted cognition adaptation for service robots in changing home environments. Front. Inf. Technol. Electron. Eng. 2022, 23, 246–257. [Google Scholar] [CrossRef]
- Weerainghe, A.S.; Rasheed, E.O.; Rotimi, J.O.B. Occupant Energy Behaviours—A Review of Indoor Environmental Quality (IEQ) and Influential factors. In Proceedings of the 54th International Conference of the Architectural Science Association (ANZAScA) 2020, Auckland, New Zealand, 26–27 November 2020. [Google Scholar]
- Pedersen, E.; Borell, J.; Li, Y.; Stålne, K. Good indoor environmental quality (IEQ) and high energy efficiency in multifamily dwellings: How do tenants view the conditions needed to achieve both? Build. Environ. 2021, 191, 107581. [Google Scholar] [CrossRef]
- De Boeck, L.; Verbeke, S.; Audenaert, A.; De Mesmaeker, L. Improving the energy performance of residential buildings: A literature review. Renew. Sustain. Energy Rev. 2015, 52, 960–975. [Google Scholar] [CrossRef]
- Yang, J.; Santamouris, M.; Lee, S.E. Review of occupancy sensing systems and occupancy modeling methodologies for the application in institutional buildings. Energy Build. 2016, 121, 344–349. [Google Scholar] [CrossRef]
- Frei, M.; Deb, C.; Stadler, R.; Nagy, Z.; Schlueter, A. Wireless sensor network for estimating building performance. Autom. Constr. 2020, 111, 103043. [Google Scholar] [CrossRef]
- Frei, M.; Hofer, J.; Schlüter, A.; Nagy, Z. An easily-deployable wireless sensor network for building energy performance assessment. Energy Procedia 2017, 122, 523–528. [Google Scholar] [CrossRef]
- artín-Garín, A.; Millán-García, J.A.; Baïri, A.; Millán-Medel, J.; Sala-Lizarraga, J.M. Environmental monitoring system based on an Open Source Platform and the Internet of Things for a building energy retrofit. Autom. Constr. 2018, 87, 201–214. [Google Scholar] [CrossRef]
- Karami, M.; McMorrow, G.V.; Wang, L. Continuous monitoring of indoor environmental quality using an Arduino-based data acquisition system. J. Build. Eng. 2018, 19, 412–419. [Google Scholar] [CrossRef]
- Jankovic, L. Lessons learnt from design, off-site construction and performance analysis of deep energy retrofit of residential buildings. Energy Build. 2019, 186, 319–338. [Google Scholar] [CrossRef]
- Guyot, D.; Giraud, F.; Simon, F.; Corgier, D.; Marvillet, C.; Tremeac, B. Detailed monitoring as an essential tool for achieving energy performance targets in operation conditions: The HIKARI case study. In Proceedings of the 12th Nordic Symposium on Building Physics (NSB 2020), Tallinn, Estonia, 7–9 September 2020; Volume 172. [Google Scholar]
- Deb, C.; Frei, M.; Schlueter, A.D. Identifying temporal properties of building components and indoor environment for building performance assessment. Build. Environ. 2020, 168, 106506. [Google Scholar] [CrossRef]
- Jnat, K.; Shahrour, I.; Zaoui, A. Impact of smart monitoring on energy savings in a social housing residence. Buildings 2020, 10, 21. [Google Scholar] [CrossRef] [Green Version]
- Vivian, J.; Carnieletto, L.; Carli, M.D. Monitoring the change of indoor environmental conditions of refurbished buildings in Milan. In Proceedings of the CLIMA 2022 The 14th REHVA HVAC World Congress, Rotterdam, The Netherlands, 22–25 May 2022; pp. 1–8. [Google Scholar]
- Djatouti, Z.; Waeytens, J.; Chamoin, L.; Chatellier, P. Thermal behavior of a two-story concrete building under controlled winter and heat wave scenarios in the sense-city equipment through temperature, flux and energy consumption dataset. Data Brief 2020, 33, 106458. [Google Scholar] [CrossRef]
- Djatouti, Z.; Waeytens, J.; Chamoin, L.; Chatellier, P. Goal-oriented sensor placement and model updating strategies applied to a real building in the Sense-City equipment under controlled winter and heat wave scenarios. Energy Build. 2021, 231, 110486. [Google Scholar] [CrossRef]
- Khan, M.A.; Nasralla, M.M.; Umar, M.M.; Iqbal, Z.; Rehman, G.U.; Sarfraz, M.S. A survey on the noncooperative environment in smart nodes-based Ad Hoc networks: Motivations and solutions. Secur. Commun. Netw. 2021, 2021, 9921826. [Google Scholar] [CrossRef]
- Martini, M.G.; Hewage, C.; Nasralla, M.M.; Ognenoski, O.; Chen, C. QoE Control, Monitoring, and Management Strategies. In Multimedia Quality of Experience (QoE): Current Status and Future Requirements; John Wiley & Sons: Hoboken, NJ, USA, 2015. [Google Scholar] [CrossRef]
- Nasralla, M.M.; García-Magariño, I.; Lloret, J. MASEMUL: A simulation tool for movement-aware MANET scheduling strategies for multimedia communications. Wirel. Commun. Mob. Comput. 2021, 2021, 6651402. [Google Scholar] [CrossRef]
- Derkx, F.; Lebental, B.; Bourouina, T.; Bourquin, F.; Cojocaru, C.-S.; Robine, E.; Van Damme, H. The Sense-City project. In Proceedings of the XVIIIth Symposium on Vibrations, Shocks and Noise, Rio de Janeiro, Brazil, 10–14 July 2012; p. 9. [Google Scholar]
- Humphreys, M.A. Quantifying occupant comfort: Are combined indices of the indoor environment practicable? Build. Res. Inf. 2007, 10, 317–325. [Google Scholar] [CrossRef]
- He, Y.; Chen, W.; Wang, Z.; Zhang, H. Review of fan-use rates in field studies and their effects on thermal comfort, energy conservation, and human productivity. Energy Build. 2019, 194, 140–162. [Google Scholar] [CrossRef] [Green Version]
- Biyik, E.; Kahraman, A. A predictive control strategy for optimal management of peak load, thermal comfort, energy storage and renewables in multi-zone buildings. J. Build. Eng. 2019, 19, 100826. [Google Scholar] [CrossRef]
- Asdrubali, F.; D’Alessandro, F.; Baldinelli, G.; Bianchi, F. Evaluating in situ thermal transmittance of green buildings masonries—A case study. Case Stud. Constr. Mater. 2014, 1, 53–59. [Google Scholar] [CrossRef]
- Pasolini, G.; Buratti, C.; Feltrin, L.; Zabini, F.; De Castro, C.; Verdone, R.; Andrisano, O. Smart City Pilot Projects Using LoRa and IEEE802.15.4 Technologies. Sensors 2018, 18, 1118. [Google Scholar] [CrossRef] [PubMed] [Green Version]
- Objenious by Bouygues Telecom. Available online: https://objenious.com/ (accessed on 4 July 2022).
- The Things Network. Available online: https://www.thethingsnetwork.org/ (accessed on 4 July 2022).
- Atmaca, I.; Kaynakli, O.; Yigit, A. Effects of radiant temperature on thermal comfort. Build. Environ. 2007, 42, 3210–3220. [Google Scholar] [CrossRef]
- Bourdeau, M.; Nefzaoui, E.; Basset, P.; Waeytens, J.; Bouzidi, A. Measurement and characterization of energy related behaviors and IEQ in residential buildings for physics-based building energy modeling using a wireless sensor network in Cosenza, Italy. In Proceedings of the 2022 IEEE International Workshop on Metrology for Living Environment (MetroLivEn), Cosenza, Italy, 25–27 May 2022; pp. 115–120. [Google Scholar]
- Bourdeau, M.; Basset, P.; Beauchêne, S.; Da Silva, D.; Guiot, T.; Werner, D.; Nefzaoui, E. Classification of daily electric load profiles of non-residential buildings. Energy Build. 2021, 233, 110670. [Google Scholar] [CrossRef]
- Bourdeau, M.; Werner, D.; Basset, P.; Nefzaoui, E. A Sensor Network for Existing Residential Buildings Indoor Environment Quality and Energy Consumption Assessment and Monitoring-Lessons Learnt from a Field Experiment. Sensornets 2020, 105–112. [Google Scholar] [CrossRef]
- Wei, W.; Ramalho, O.; Mandin, C. Indoor air quality requirements in green building certifications. Build. Environ. 2015, 92, 10–19. [Google Scholar] [CrossRef]
- Allab, Y.; Pellegrino, M.; Guo, X.; Nefzaoui, E.; Kindinis, A. Energy and comfort assessment in educational building—Case study in a French university campus. Energy Build. 2017, 143, 202–219. [Google Scholar] [CrossRef]
- Oral, G.K.; Yener, A.K.; Bayazit, N.T. Building envelope design with the objective to ensure thermal, visual and acoustic comfort conditions. Build. Environ. 2004, 39, 281–287. [Google Scholar] [CrossRef]
- EN ISO 9869; Thermal Insulation: Building Elements: In-Situ Measurement of Thermal Resistance and Thermal Transmittance. International Organization for Standardization: Geneva, Switzerland, 2017.
- Asdrubali, F.; Baldinelli, G. Thermal transmittance measurements with the hot box method: Calibration, experimental procedures, and uncertainty analyses of three different approaches. Energy Build. 2011, 43, 1618–1626. [Google Scholar] [CrossRef]
- Ha, T.-T.; Feuillet, V.; Waeytens, J.; Zibouche, K.; Peiffer, L.; Garcia, Y.; Le Sant, V.; Bouchie, R.; Koenen, A.; Monchau, J.-P.; et al. Measurement prototype for fast estimation of building wall thermal resistance under controlled and natural environmental conditions. Energy Build. 2022, 268, 112166. [Google Scholar] [CrossRef]
- Ha, T.-T.; Feuillet, V.; Waeytens, J.; Zibouche, K.; Thebault, S.; Bouchie, R. Le Sant, V.; Ibos, L. Benchmark of identification methods for the estimation of building wall thermal resistance using active method: Numerical study for IWI and single-wall structures. Energy Build. 2020, 224, 110130. [Google Scholar] [CrossRef]
- The Modbus Organization. Available online: https://modbus.org (accessed on 6 June 2023).


| Apt. Type | B1 | B2 | B3 | nb. | Area (m) |
|---|---|---|---|---|---|
| 1 living room/bedroom (T1) | 2 | 2 | 2 | 6 | 36 |
| 1 bedroom (T2) | 4 | 5 | 7 | 15 | 50–53 |
| 2 bedrooms (T3) | 4 | 10 | 14 | 28 | 63–58 |
| 3 bedrooms (T4) | 3 | 4 | 6 | 13 | 74–79 |
| TOTAL | 13 | 21 | 29 | 63 | / |
| Building | Floor | Orientation | Type | Surface (m) | Nb. of Occupants |
|---|---|---|---|---|---|
| B1 | 2 | SE | T3 | 63 | 2 |
| B1 | 3 | NE | T2 | 50 | 1 |
| B2 | 0 | NW | T3 | 64 | 1 |
| B2 | 1 | SE | T2 | 53 | 1 |
| B2 | 2 | SE | T2 | 53 | 1 |
| B2 | 5 | SE | T2 | 50 | 1 |
| B3 | 0 | SE | T4 | 74 | 2 |
| B3 | 2 | SE | T3 | 70 | 1 |
| Building | Floor | Nb. of Occupants | Occupation | Children | Pets |
|---|---|---|---|---|---|
| B1 | 2 | 2 | Public servant | 1 | None |
| B1 | 3 | 1 | Public servant | None | None |
| B2 | 0 | 1 | Private sector employee | None | 6 |
| B2 | 1 | 1 | Public servant | None | None |
| B2 | 2 | 1 | Teacher | None | 2 |
| B2 | 5 | 1 | Unemployed | None | 2 |
| B3 | 0 | 2 | Retired | None | None |
| B3 | 2 | 1 | Retired | None | 1 |
| Building | B1 | B2 | B3 | TOTAL | |||||
|---|---|---|---|---|---|---|---|---|---|
| Sensors inside the Apartments | |||||||||
| Floor | 2 | 3 | 0 | 1 | 2 | 5 | 0 | 2 | |
| Clamp. Amp. meters | 0 | 1 | 1 | 0 | 0 | 0 | 1 | 0 | 3 |
| Elec. pulse sensor | 1 | 1 | 1 | 1 | 1 | 1 | 1 | 1 | 8 |
| plug | 4 | 6 | 4 | 3 | 2 | 6 | 6 | 5 | 36 |
| Gas pulse sensor | 0 | 1 | 1 | 0 | 1 | 0 | 1 | 0 | 4 |
| heater temp. | 4 | 4 | 4 | 3 | 3 | 3 | 4 | 4 | 29 |
| DHW pipe temp. | 1 | 1 | 1 | 1 | 1 | 1 | 1 | 1 | 8 |
| Indoor wall temp. | 2 | 3 | 2 | 0 | 2 | 3 | 3 | 2 | 17 |
| Temp., RH, lum., CO, motion | 1 | 1 | 1 | 1 | 1 | 1 | 1 | 1 | 8 |
| Window opening | 4 | 4 | 4 | 3 | 3 | 4 | 5 | 4 | 31 |
| Total apartments | 17 | 22 | 19 | 12 | 14 | 19 | 23 | 18 | 144 |
| Sensors in common areas | |||||||||
| Clamp Amp. meters | 0 | 0 | 1 | 1 | |||||
| Elec. pulse | 2 | 3 | 2 | 7 | |||||
| Thermal energy | 2 | 2 | 2 | 5 | |||||
| Temp., RH | 3 | 3 | 3 | 9 | |||||
| Motion | 1 | 1 | 1 | 3 | |||||
| Total common areas | 6 | 8 | 8 | 26 | |||||
| TOTAL | 45 | 72 | 49 | 170 | |||||
| Sensors | Accuracy | Operating Range |
|---|---|---|
| Temperature | ±0.3 °C (0 °C…+70 °C) 0.4 °C otherwise | −40…+105 °C |
| Humidity | ±1.8% (0…85%, T = +15…+35 °C) ±2.5% (85…100%, T = +15…+35 °C) ±2+1.5% otherwise | 0…100% |
| Rainfall | N.C. | N.C. |
| Solar irradiation | ±10 W/m | 0…2000 W/m |
| Wind speed | ±2% (0…65 m/s), ±3% otherwise | 0…80 m/s |
| Wind direction | ±2° | 0…359.9° |
| Atmospheric pressure | ±0.5 hPa (800…1100 hPa, T = 25 °C)±1 hPa (300…1100 hPa, T = 0…50 °C) | 300…1100 hPa |
| Radiant temperature | ±0.1 °C | −200…+650 °C |
| Dew point temperature | N.C. | N.C. |
| Measurement Targets | Sensors | Accuracy | Operating Range |
|---|---|---|---|
| Electricity | Sensor with clamp ampere meters (Ewattch Tyness) | N.C. | N.C. |
| Pulse sensor for electric smart meter (Fludia BelSenso FM410e) | N.A. | 10 pulse/sec max | |
| Connected plug (NKEWatteco Smartplug) | >1% (P > 40 W) <1% (P < 40 W) | Voltage: 100…250 V Frequency: 50…60 Hz | |
| Natural gas | Pulse sensor for gas meter (Adeunis Pulse ATEX) | N.A. | 8 pulse/sec max |
| Thermal energy | Thermal energy meter for DHW and heating (Ultraflow U1000) | ±1…3% (flow > 0.3 m/s) | Flow: 0.1…10 m/s Temperature: 0…+85 °C |
| Contact temperature of heaters (SensingLab TEM-LAB-14NS) | ±0.5 °C (−10…+85 °C) ±2 °C otherwise | Temperature: −45…+125 °C | |
| Contact temperature of DHW pipes (SensingLab TEM-LAB-14NS) | ±0.5 °C (−10…+85 °C) ±2 °C otherwise | Temperature: −45…+125 °C | |
| IEQ | Indoor temperature and humidity (SensingLab THY-LAB-41NS) | Temperature: ±0.3 °C Humidity: ±2% | Temperature: 0…+55 °C Humidity 0…80% |
| Indoor temperature of cold walls (SensingLab TEM-LAB-14NS) | ±0.5 °C (−10…+85 °C) ±2 °C otherwise | Temperature: −45…+125 °C | |
| Temperature | ±0.2 °C (0…+60 °C) | −40…+120 °C | |
| Humidity | ±0.2% (10…90%, T = 25 °C) | 0…100% | |
| CO | ±50 ppm | 0…2000 ppm | |
| Luminosity | ±10 Lux | 0…65,535 Lux | |
| (ELSYS ERSCO2) | |||
| Occupants’ behavior | Presence detection | N.A | 0…255 motions |
| (ELSYS ERSCO2) | |||
| Presence detection (common areas) (SensingLab PIR-LAB-41NS) | N.A. | N.C. | |
| Window opening detection (SensingLab OPE-LAB-41NS) | N.C. | N.C. |
Disclaimer/Publisher’s Note: The statements, opinions and data contained in all publications are solely those of the individual author(s) and contributor(s) and not of MDPI and/or the editor(s). MDPI and/or the editor(s) disclaim responsibility for any injury to people or property resulting from any ideas, methods, instructions or products referred to in the content. |
© 2023 by the authors. Licensee MDPI, Basel, Switzerland. This article is an open access article distributed under the terms and conditions of the Creative Commons Attribution (CC BY) license (https://creativecommons.org/licenses/by/4.0/).
Share and Cite
Bourdeau, M.; Waeytens, J.; Aouani, N.; Basset, P.; Nefzaoui, E. A Wireless Sensor Network for Residential Building Energy and Indoor Environmental Quality Monitoring: Design, Instrumentation, Data Analysis and Feedback. Sensors 2023, 23, 5580. https://doi.org/10.3390/s23125580
Bourdeau M, Waeytens J, Aouani N, Basset P, Nefzaoui E. A Wireless Sensor Network for Residential Building Energy and Indoor Environmental Quality Monitoring: Design, Instrumentation, Data Analysis and Feedback. Sensors. 2023; 23(12):5580. https://doi.org/10.3390/s23125580
Chicago/Turabian StyleBourdeau, Mathieu, Julien Waeytens, Nedia Aouani, Philippe Basset, and Elyes Nefzaoui. 2023. "A Wireless Sensor Network for Residential Building Energy and Indoor Environmental Quality Monitoring: Design, Instrumentation, Data Analysis and Feedback" Sensors 23, no. 12: 5580. https://doi.org/10.3390/s23125580