Graphene Decorated with Iron Oxide Nanoparticles for Highly Sensitive Interaction with Volatile Organic Compounds †

 , , , , and
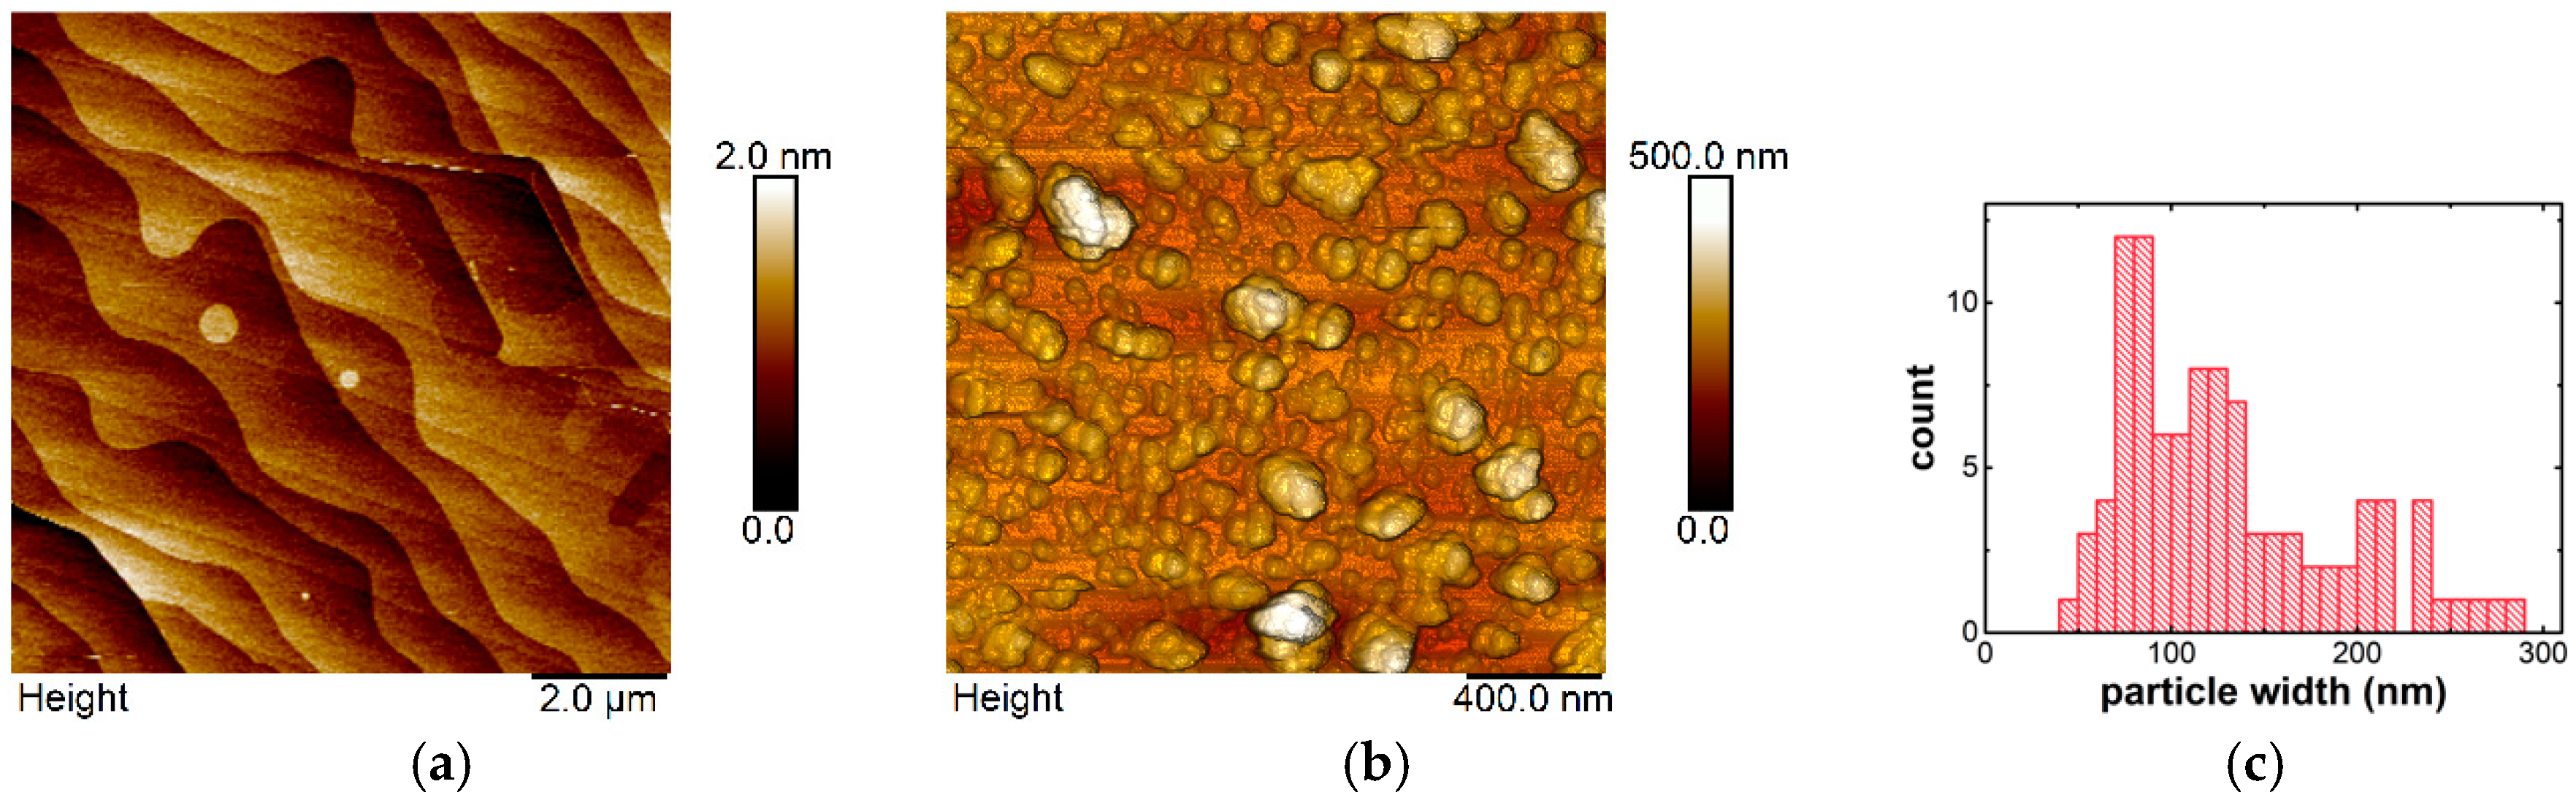
Abstract
:1. Introduction
2. Materials and Methods
2.1. Sensing Layer Preparation
2.2. Characterization Techniques
2.3. Sensor Device Fabrication
2.4. Theoretical Approach
3. Results and Discussions
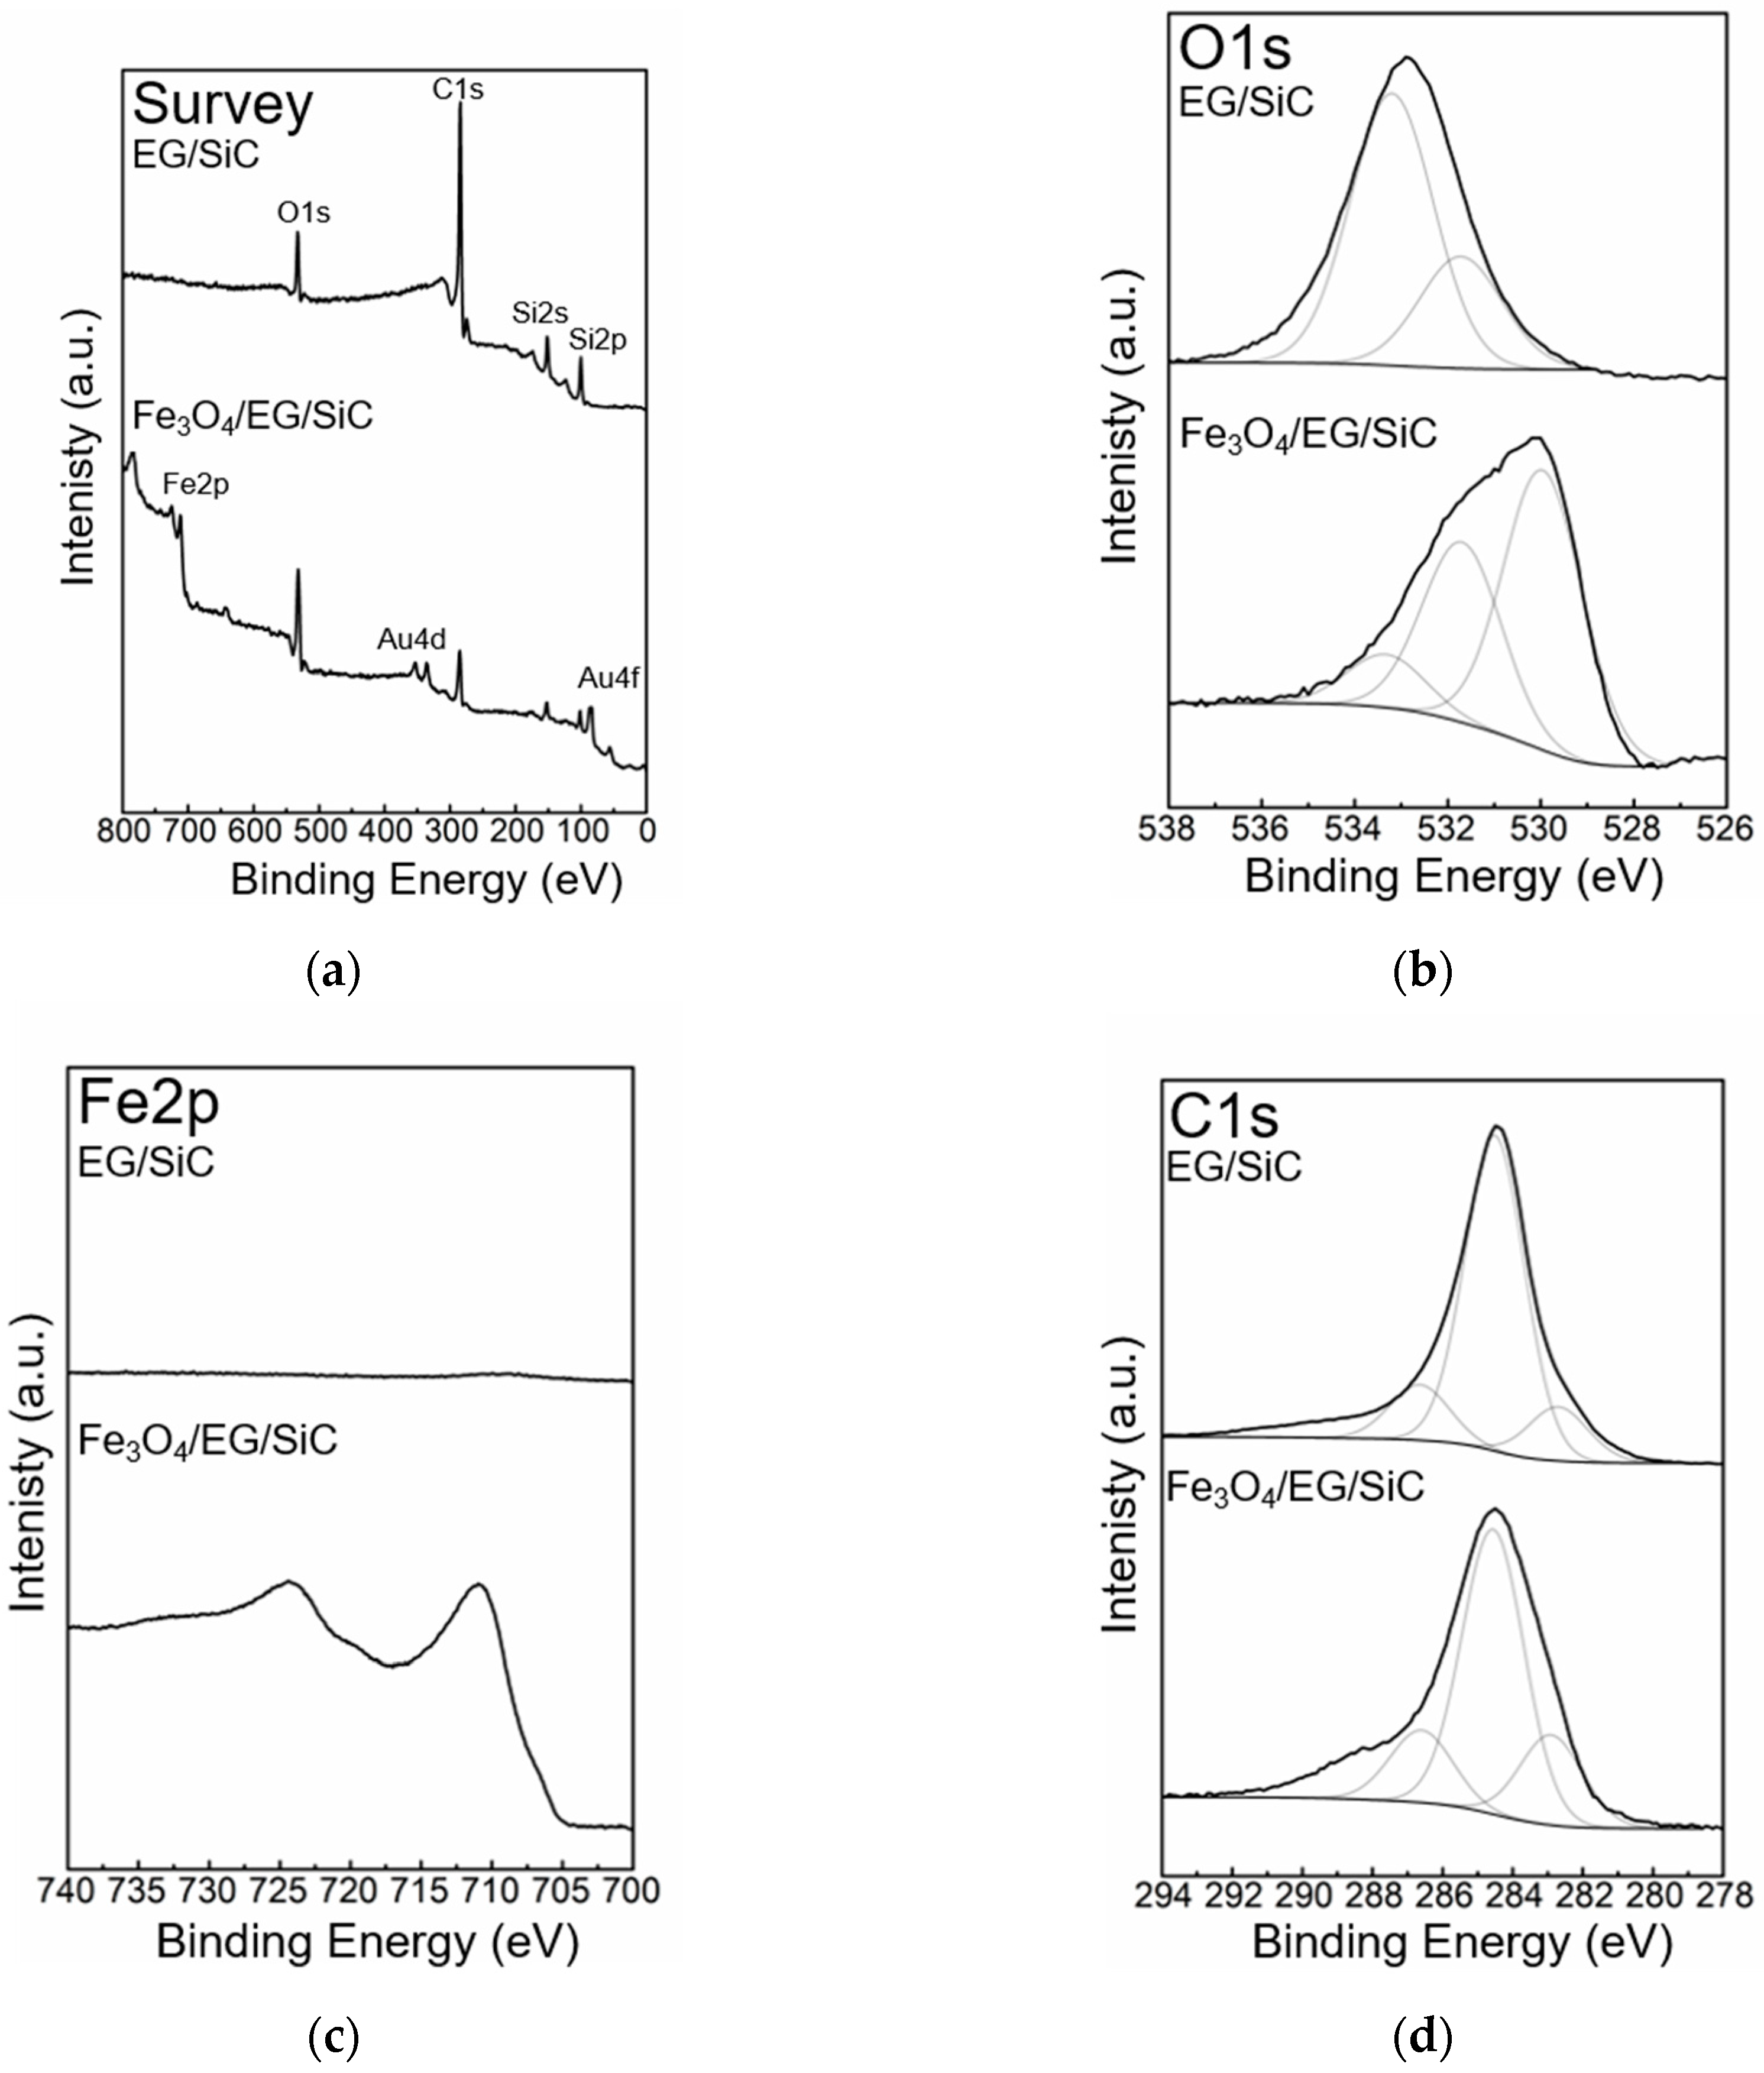
3.1. Morphological and Structural Characterization
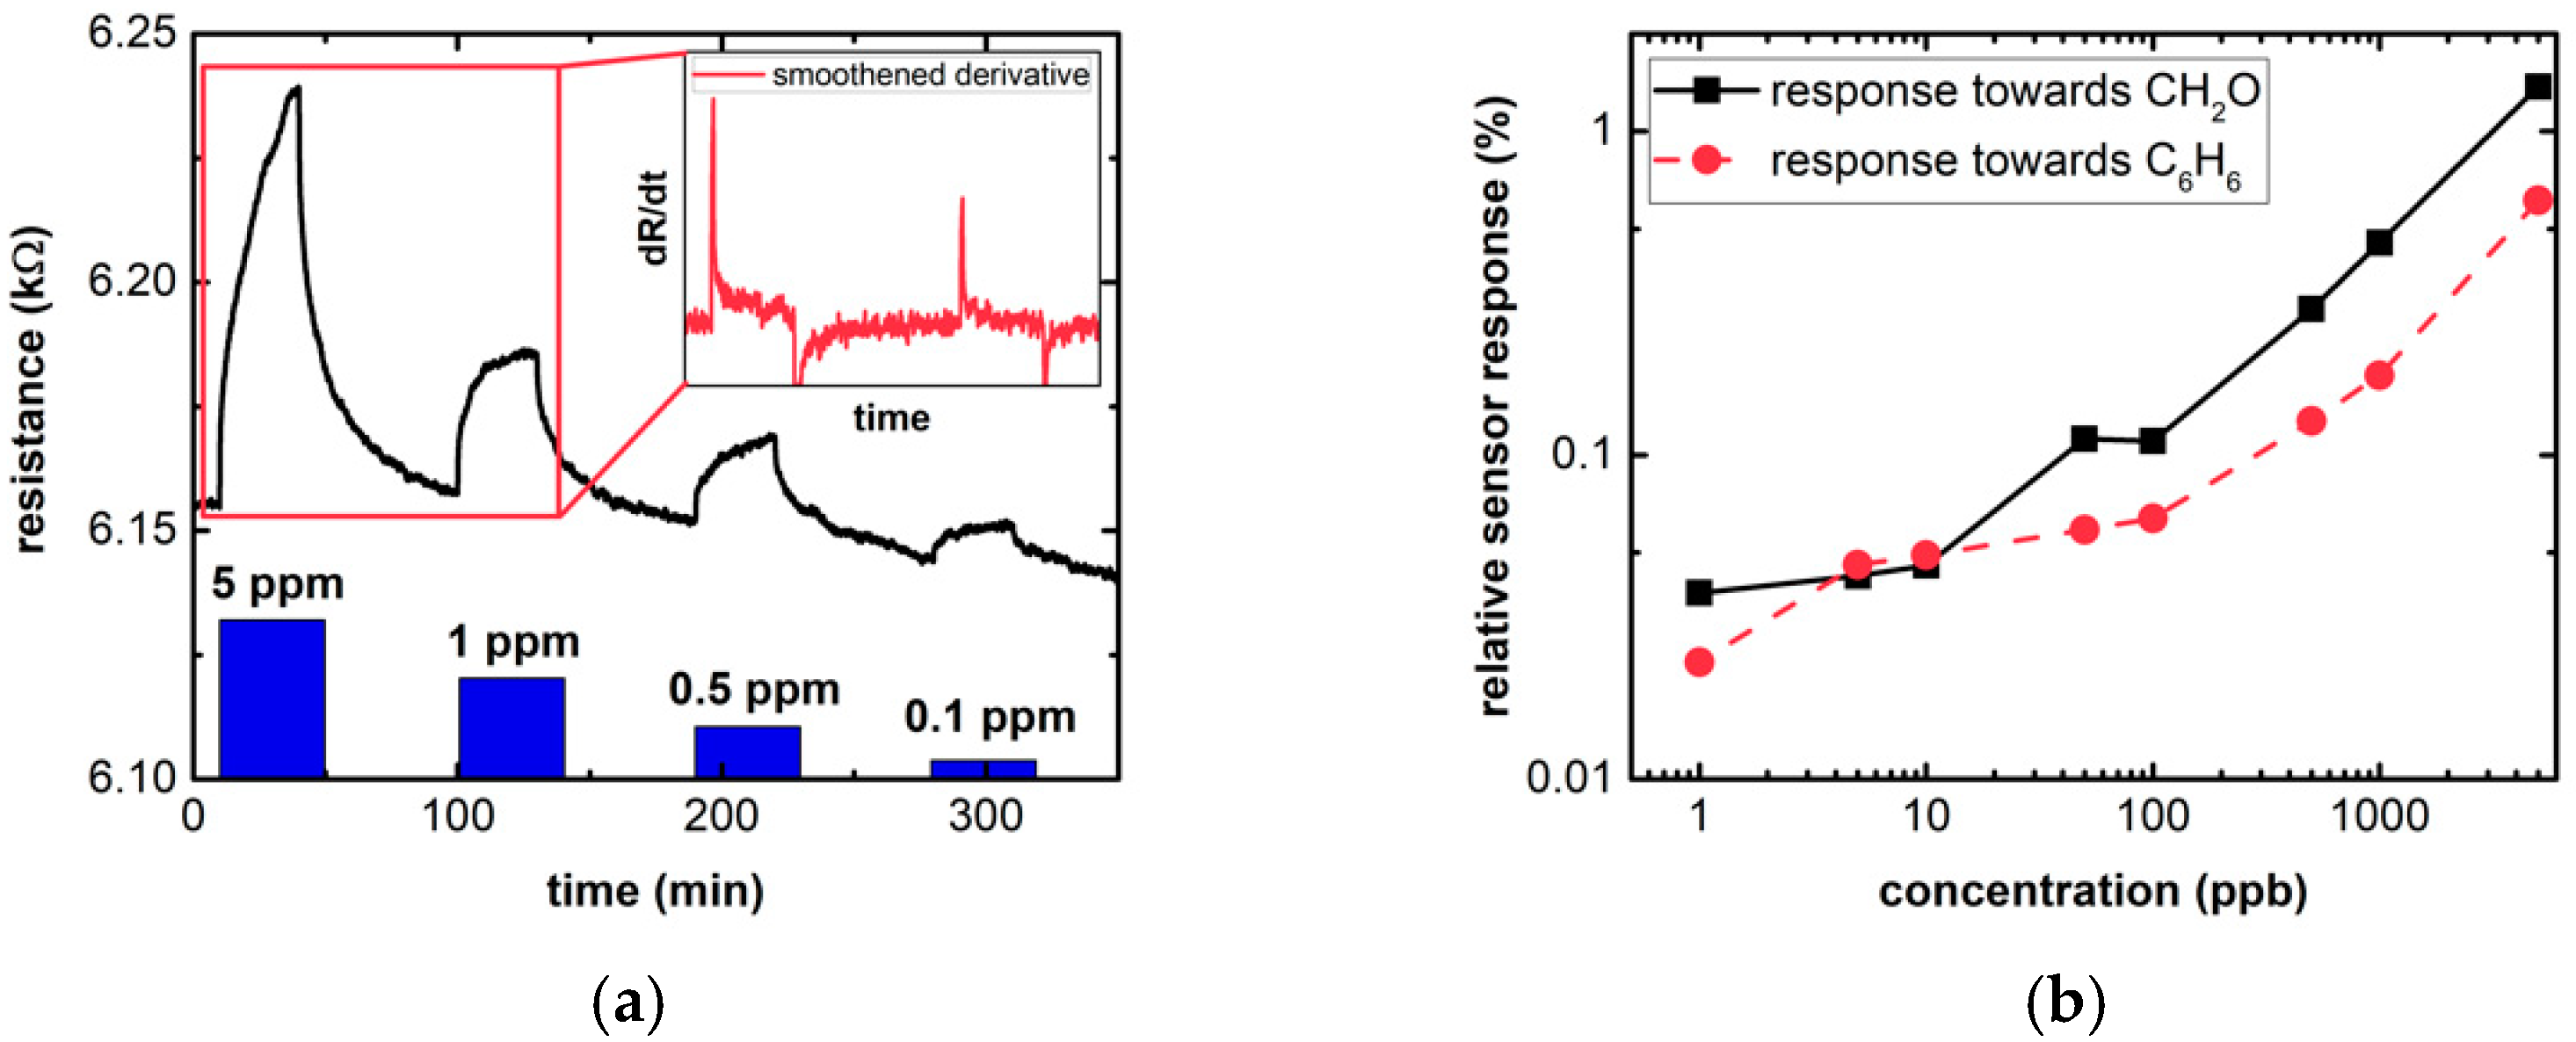
3.2. Gas Measurements
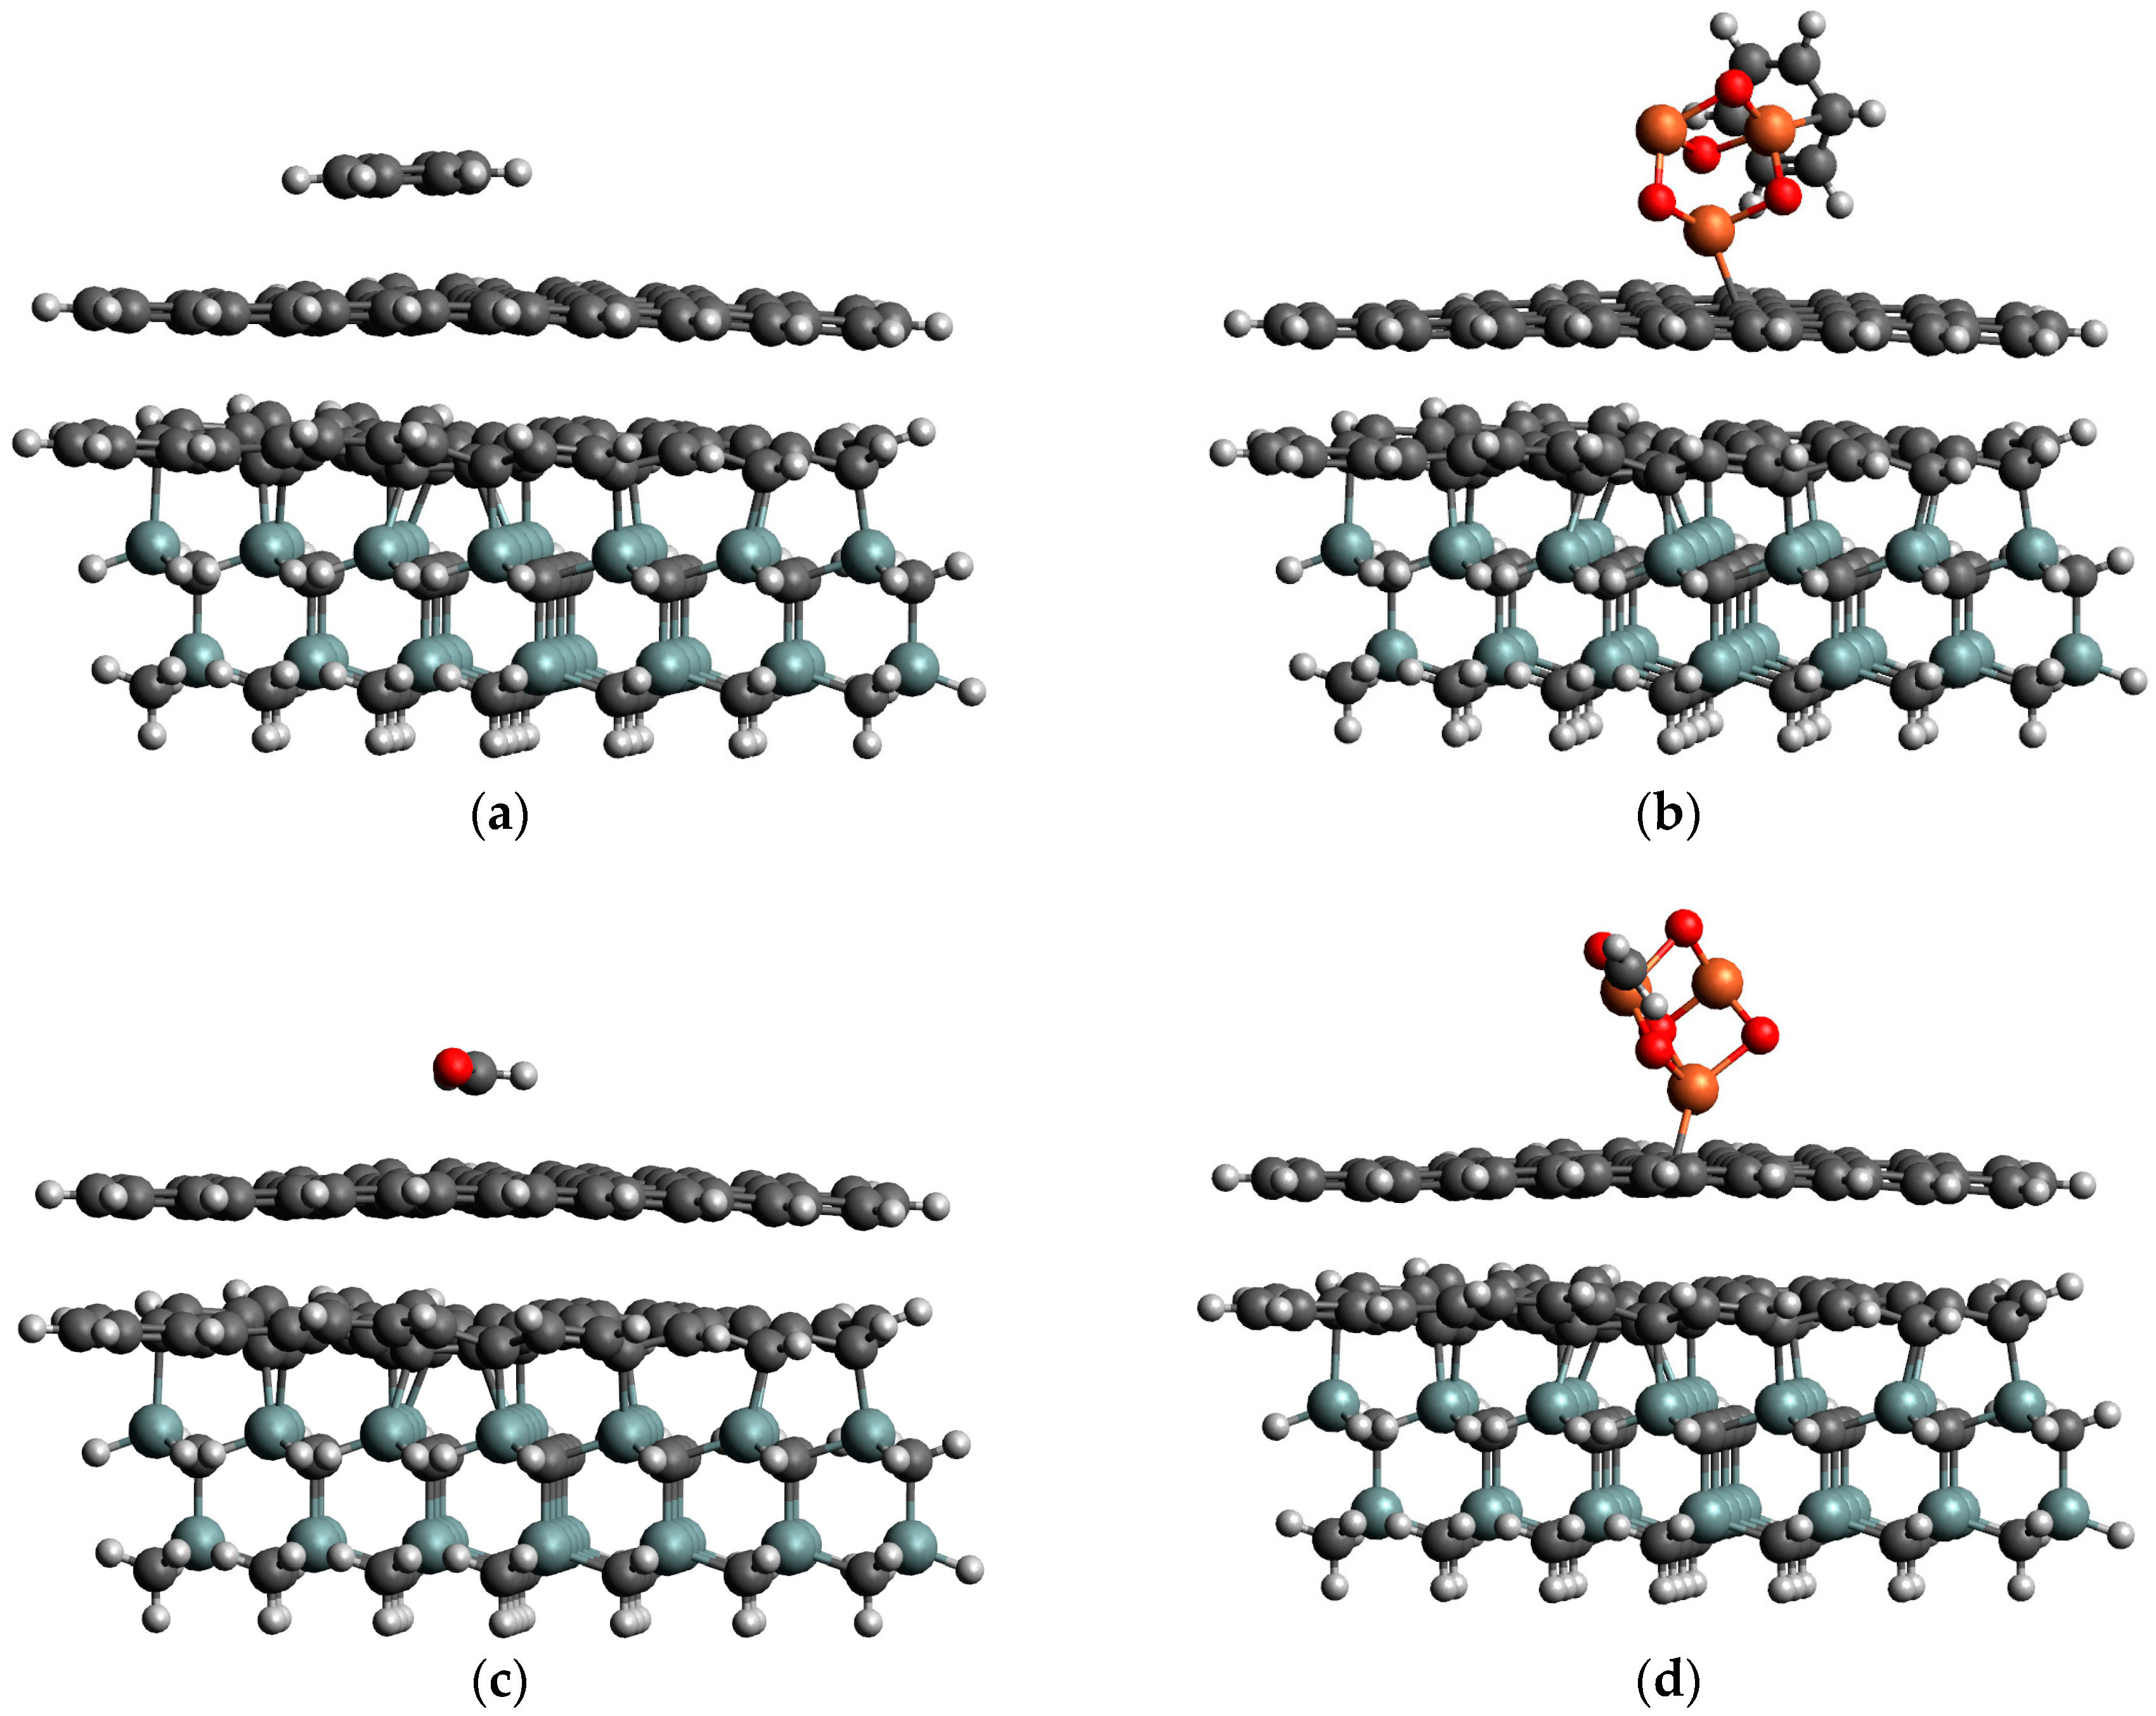
3.3. DFT Calculations
4. Conclusions
Supplementary Materials
Author Contributions
Funding
Acknowledgments
Conflicts of Interest
References
- WHO Social Media Toolkit for Air Pollution and Child Health: Prescribing Clean Air Launch. Available online: https://www.who.int/ceh/publications/Social_Media_Toolkit_AirPollution_Chidren_Health_Report_Launch.pdf (accessed on 21 February 2019).
- Economic Cost of the Health Impact of Air Pollution in Europe: Clean Air, Health and Wealth. Available online: http://www.euro.who.int/__data/assets/pdf_file/0004/276772/Economic-cost-health-impact-air-pollution-en.pdf (accessed on 21 February 2019).
- Szulczyński, B.; Gębicki, J. Currently Commercially Available Chemical Sensors Employed for Detection of Volatile Organic Compounds in Outdoor and Indoor Air. Environments 2017, 4, 21. [Google Scholar] [CrossRef]
- World Health Organization. Guidelines for Indoor Air Quality: Selected Pollutants. Available online: http://www.euro.who.int/__data/assets/pdf_file/0009/128169/e94535.pdf (accessed on 21 February 2019).
- Directive 2008/50/EC of the European Parliament and of the Council of 21 May 2008 on Ambient Air Quality and Cleaner Air for Europe. Available online: http://eur-lex.europa.eu/LexUriServ/LexUriServ.do?uri=OJ:L:2008:152:0001:0044:EN:PDF (accessed on 21 February 2019).
- Décret no 2011-1727 du 2 Décembre 2011 Relatif aux Valeurs-Guides pour L’air Intérieur pour le Formaldéhyde et le Benzène. Available online: https://www.legifrance.gouv.fr/eli/decret/2011/12/2/2011-1727/jo/texte (accessed on 21 February 2019).
- Batterman, S.; Chambliss, S.; Isakov, V. Spatial resolution requirements for traffic-related air pollutant exposure evaluations. Atmos. Environ. 2014, 94, 518–528. [Google Scholar] [CrossRef] [PubMed] [Green Version]
- Spinelle, L.; Gerboles, M.; Kok, G.; Persijn, S.; Sauerwald, T. Review of portable and low-cost sensors for the ambient air monitoring of benzene and other volatile organic compounds. Sensors 2017, 17, 1520. [Google Scholar] [CrossRef] [PubMed]
- Schütze, A.; Baur, T.; Leidinger, M.; Reimringer, W.; Jung, R.; Conrad, T.; Sauerwald, T. Highly Sensitive and Selective VOC Sensor Systems Based on Semiconductor Gas Sensors: How to? Environments 2017, 4, 20. [Google Scholar] [CrossRef]
- Puglisi, D.; Eriksson, J.; Bur, C.; Schuetze, A.; Lloyd Spetz, A.; Andersson, M. Catalytic metal-gate field effect transistors based on SiC for indoor air quality control. J. Sens. Sens. Syst. 2015, 4, 1–8. [Google Scholar] [CrossRef] [Green Version]
- Bur, C.; Bastuck, M.; Puglisi, D.; Schütze, A.; Lloyd Spetz, A.; Andersson, M. Discrimination and quantification of volatile organic compounds in the ppb-range with gas sensitive SiC-FETs using multivariate statistics. Sens. Actuators B Chem. 2015, 214, 225–233. [Google Scholar] [CrossRef] [Green Version]
- Leidinger, M.; Sauerwald, T.; Reimringer, W.; Ventura, G.; Schütze, A. Selective detection of hazardous VOCs for indoor air quality applications using a virtual gas sensor array. J. Sens. Sens. Syst. 2014, 3, 253–263. [Google Scholar] [CrossRef] [Green Version]
- Leidinger, M.; Rieger, M.; Sauerwald, T.; Alépée, C.; Schütze, A. Integrated pre-concentrator gas sensor microsystem for ppb level benzene detection. Sens. Actuators B Chem. 2016, 236, 988–996. [Google Scholar] [CrossRef]
- Trzciński, J.W.; Pinalli, R.; Riboni, N.; Pedrini, A.; Bianchi, F.; Zampolli, S.; Elmi, I.; Massera, C.; Ugozzoli, F.; Dalcanale, E. In Search of the Ultimate Benzene Sensor: The EtQxBox Solution. ACS Sens. 2017, 2, 590–598. [Google Scholar] [CrossRef]
- Eriksson, J.; Puglisi, D.; Strandqvist, C.; Gunnarsson, R.; Ekeroth, S.; Ivanov, I.G.; Helmersson, U.; Uvdal, K.; Yakimova, R.; Lloyd Spetz, A. Modified Epitaxial Graphene on SiC for Extremely Sensitive and Selective Gas Sensors. Mater. Sci. Forum 2016, 858, 1145–1148. [Google Scholar] [CrossRef]
- Rodner, M.; Bahonjic, J.; Mathisen, M.; Gunnarsson, R.; Ekeroth, S.; Helmersson, U.; Ivanov, I.G.; Yakimova, R.; Eriksson, J. Performance tuning of gas sensors based on epitaxial graphene on silicon carbide. Mater. Des. 2018, 153, 153–158. [Google Scholar] [CrossRef]
- Gong, J.; Li, Y.; Chai, X.; Hu, Z.; Deng, Y. UV-light-activated ZnO fibers for organic gas sensing at room temperature. J. Phys. Chem. C 2010, 114, 1293–1298. [Google Scholar] [CrossRef]
- Clément, P.; Hafaiedh, I.; Parra, E.J.; Thamri, A.; Guillot, J.; Abdelghani, A.; Llobet, E. Iron oxide and oxygen plasma functionalized multi-walled carbon nanotubes for the discrimination of volatile organic compounds. Carbon N. Y. 2014, 78, 510–520. [Google Scholar] [CrossRef]
- Rodner, M.; Puglisi, D.; Ekeroth, S.; Helmersson, U.; Ivanov, I.G.; Yakimova, R.; Uvdal, K.; Schütze, A.; Eriksson, J. Iron Oxide Nanoparticle Decorated Graphene for Ultra-Sensitive Detection of Volatile Organic Compounds. Proceedings 2018, 2, 985. [Google Scholar] [CrossRef]
- Yakimova, R.; Virojanadara, C.; Gogova, D.; Syväjärvi, M.; Siche, D.; Larsson, K.; Johansson, L. Analysis of the Formation Conditions for Large Area Epitaxial Graphene on SiC Substrates. Mater. Sci. Forum 2010, 645–648, 565–568. [Google Scholar] [CrossRef]
- Pilch, I.; Söderström, D.; Hasan, M.I.; Helmersson, U.; Brenning, N. Fast growth of nanoparticles in a hollow cathode plasma through orbit motion limited ion collection. Appl. Phys. Lett. 2013, 103, 193108. [Google Scholar] [CrossRef] [Green Version]
- Lloyd Spetz, A.; Andersson, M. Technology and Application Opportunities for SiC-FET Gas Sensors. In Solid State Gas Sensors—Industrial Application; Fleischer, M., Lehmann, M., Eds.; Springer: Berlin/Heidelberg, Germany, 2012; pp. 189–214. ISBN 978-3-642-28092-4. [Google Scholar]
- Available online: http://gaussian.com/citation/ (accessed on 22 February 2019).
- Zhao, Y.; Truhlar, D.G. A new local density functional for main-group thermochemistry, transition metal bonding, thermochemical kinetics, and noncovalent interactions. J. Chem. Phys. 2006, 125, 194101. [Google Scholar] [CrossRef] [Green Version]
- Zhao, Y.; Truhlar, D.G. The M06 suite of density functionals for main group thermochemistry, thermochemical kinetics, noncovalent interactions, excited states, and transition elements: Two new functionals and systematic testing of four M06-class functionals and 12 other function. Theor. Chem. Acc. 2008, 120, 215–241. [Google Scholar] [CrossRef]
- Hay, P.J.; Wadt, W.R. Ab initio effective core potentials for molecular calculations. Potentials for K to Au including the outermost core orbitale. J. Chem. Phys. 1985, 82, 299–310. [Google Scholar] [CrossRef]
- Boys, S.F.; Bernardi, F. The calculation of small molecular interactions by the differences of separate total energies. Some procedures with reduced errors. Mol. Phys. 1970, 19, 553–566. [Google Scholar] [CrossRef]
- Wang, G.; Zhang, X.; Skallberg, A.; Liu, Y.; Hu, Z.; Mei, X.; Uvdal, K. One-step synthesis of water-dispersible ultra-small Fe3O4 nanoparticles as contrast agents for T1 and T2 magnetic resonance imaging. Nanoscale 2014, 6, 2953–2963. [Google Scholar] [CrossRef] [PubMed]


© 2019 by the authors. Licensee MDPI, Basel, Switzerland. This article is an open access article distributed under the terms and conditions of the Creative Commons Attribution (CC BY) license (http://creativecommons.org/licenses/by/4.0/).
Share and Cite
Rodner, M.; Puglisi, D.; Ekeroth, S.; Helmersson, U.; Shtepliuk, I.; Yakimova, R.; Skallberg, A.; Uvdal, K.; Schütze, A.; Eriksson, J. Graphene Decorated with Iron Oxide Nanoparticles for Highly Sensitive Interaction with Volatile Organic Compounds. Sensors 2019, 19, 918. https://doi.org/10.3390/s19040918
Rodner M, Puglisi D, Ekeroth S, Helmersson U, Shtepliuk I, Yakimova R, Skallberg A, Uvdal K, Schütze A, Eriksson J. Graphene Decorated with Iron Oxide Nanoparticles for Highly Sensitive Interaction with Volatile Organic Compounds. Sensors. 2019; 19(4):918. https://doi.org/10.3390/s19040918
Chicago/Turabian StyleRodner, Marius, Donatella Puglisi, Sebastian Ekeroth, Ulf Helmersson, Ivan Shtepliuk, Rositsa Yakimova, Andreas Skallberg, Kajsa Uvdal, Andreas Schütze, and Jens Eriksson. 2019. "Graphene Decorated with Iron Oxide Nanoparticles for Highly Sensitive Interaction with Volatile Organic Compounds" Sensors 19, no. 4: 918. https://doi.org/10.3390/s19040918