
Monitoring and Analysis of the Collapse at Xinjing Open-Pit Mine, Inner Mongolia, China, Using Multi-Source Remote Sensing

 , , ,
, , ,
Abstract
:1. Introduction
2. Study Area and Datasets
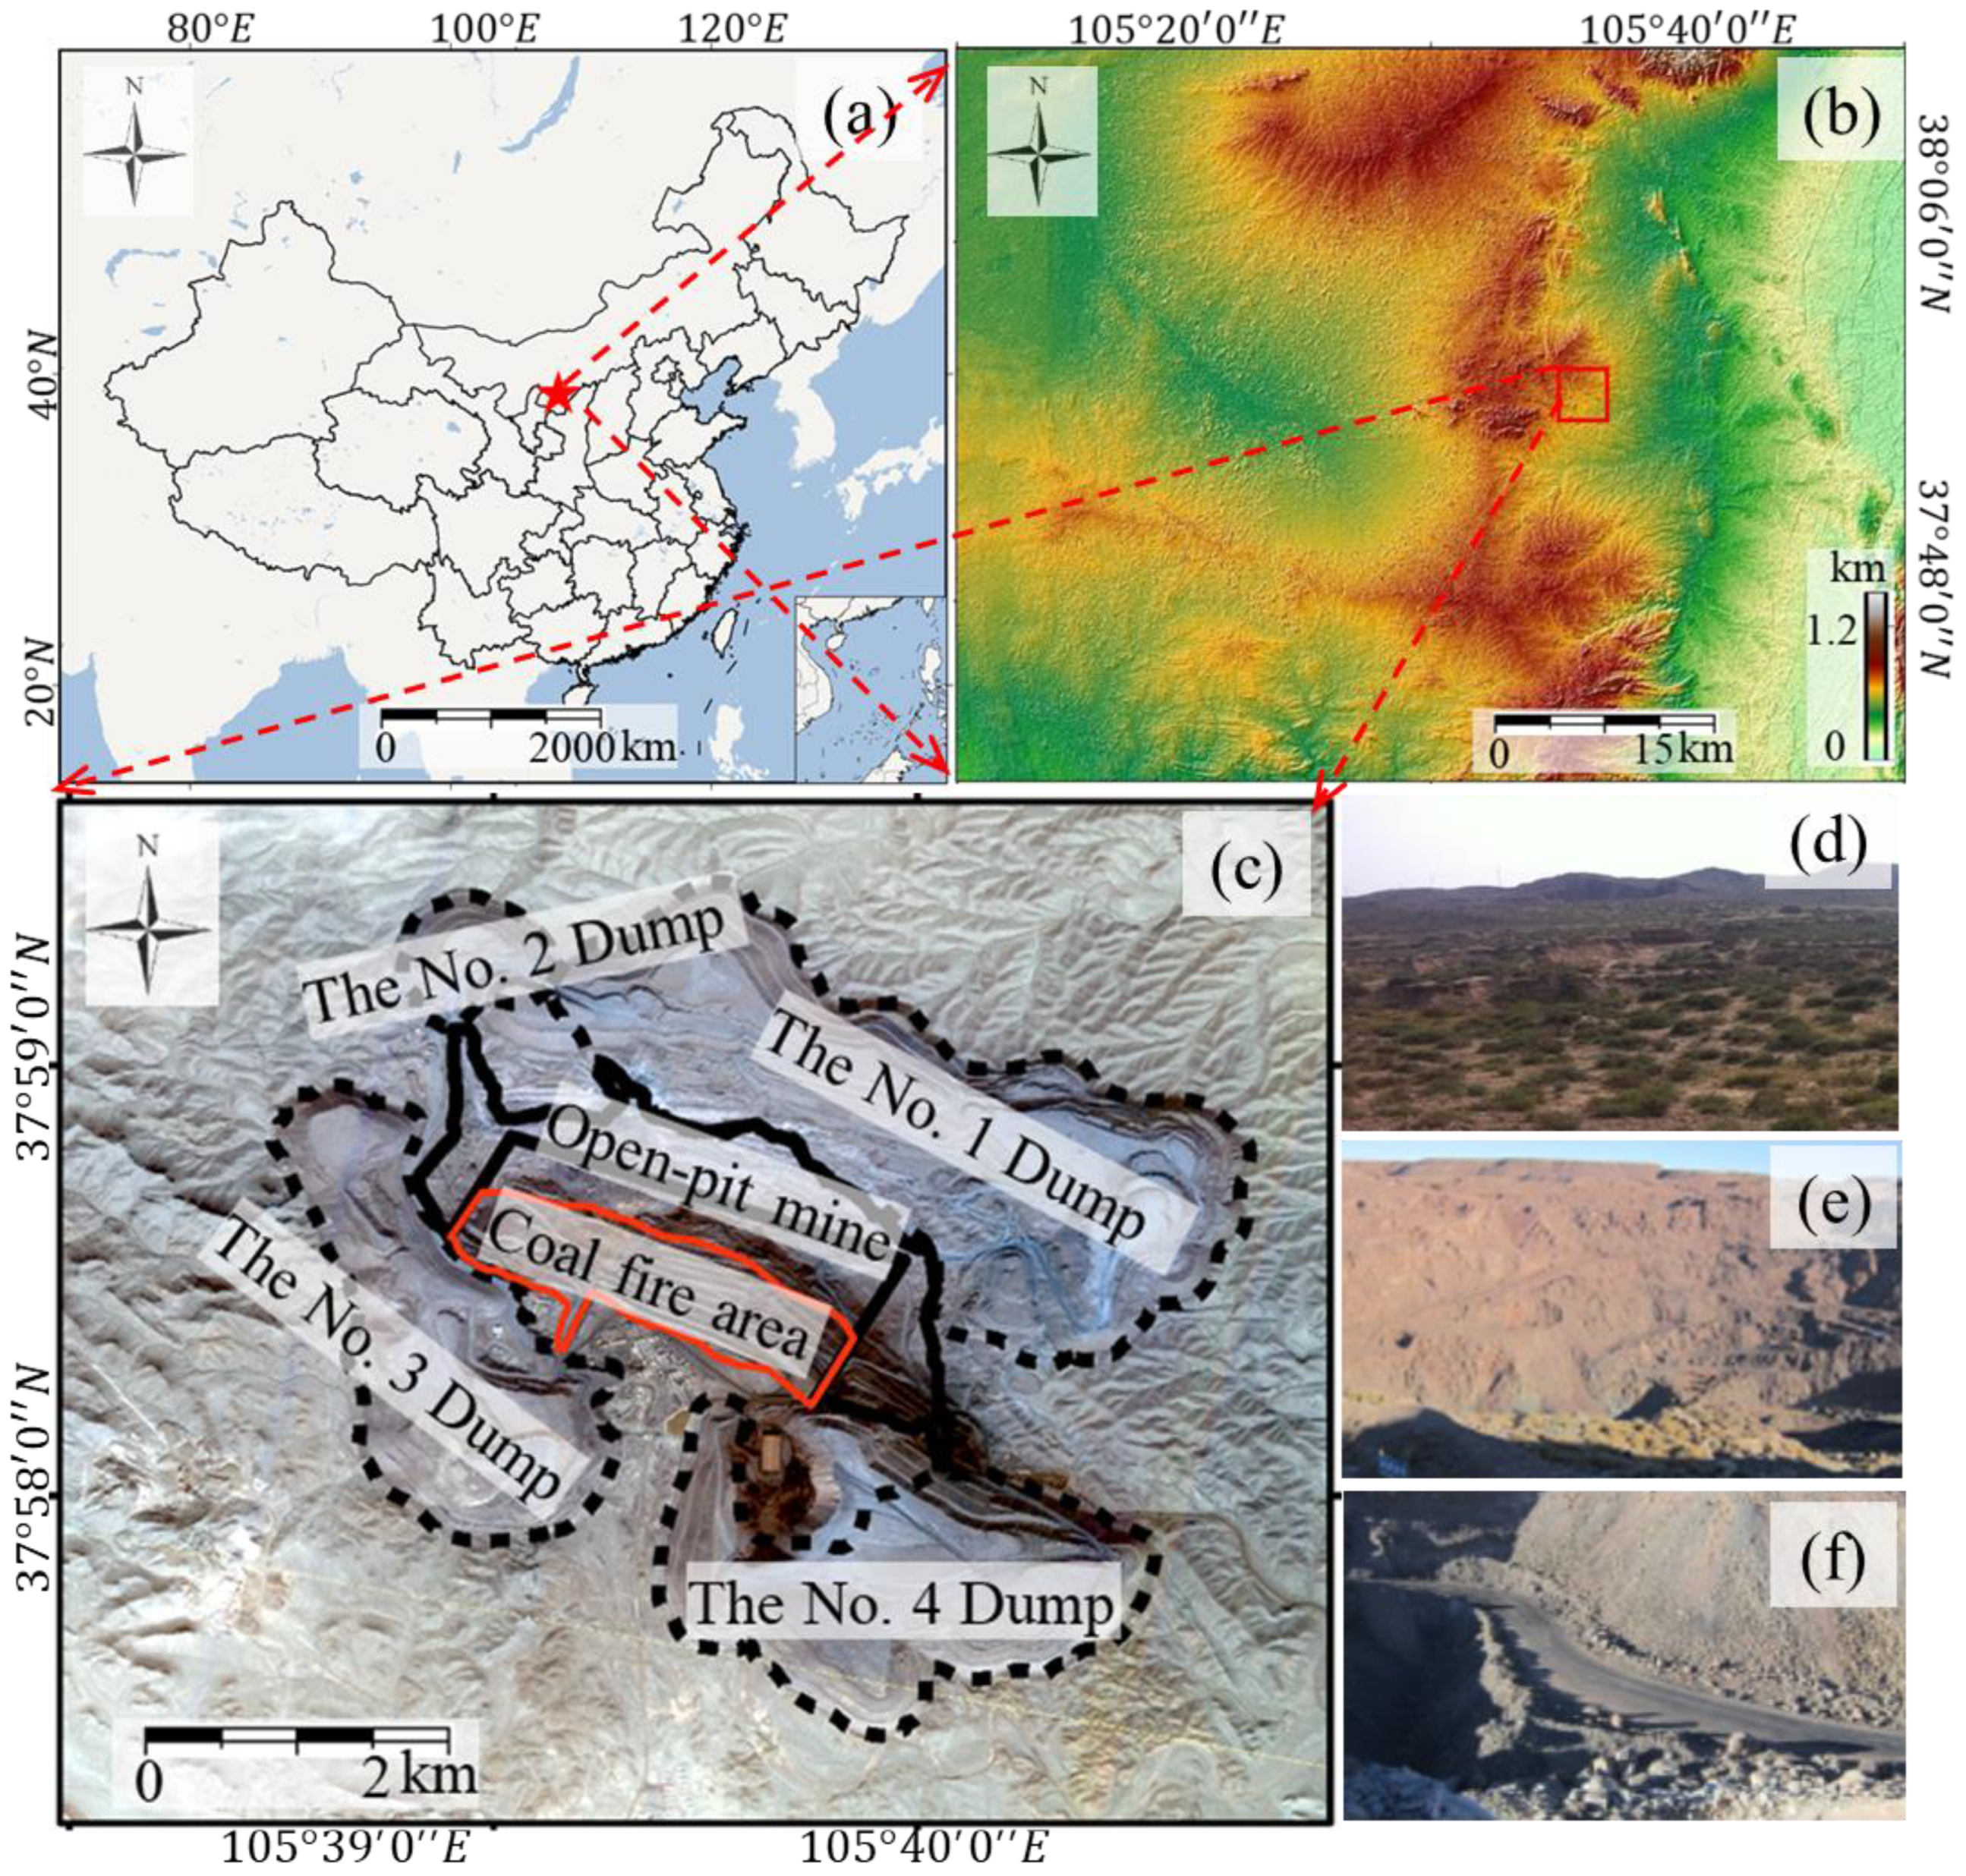
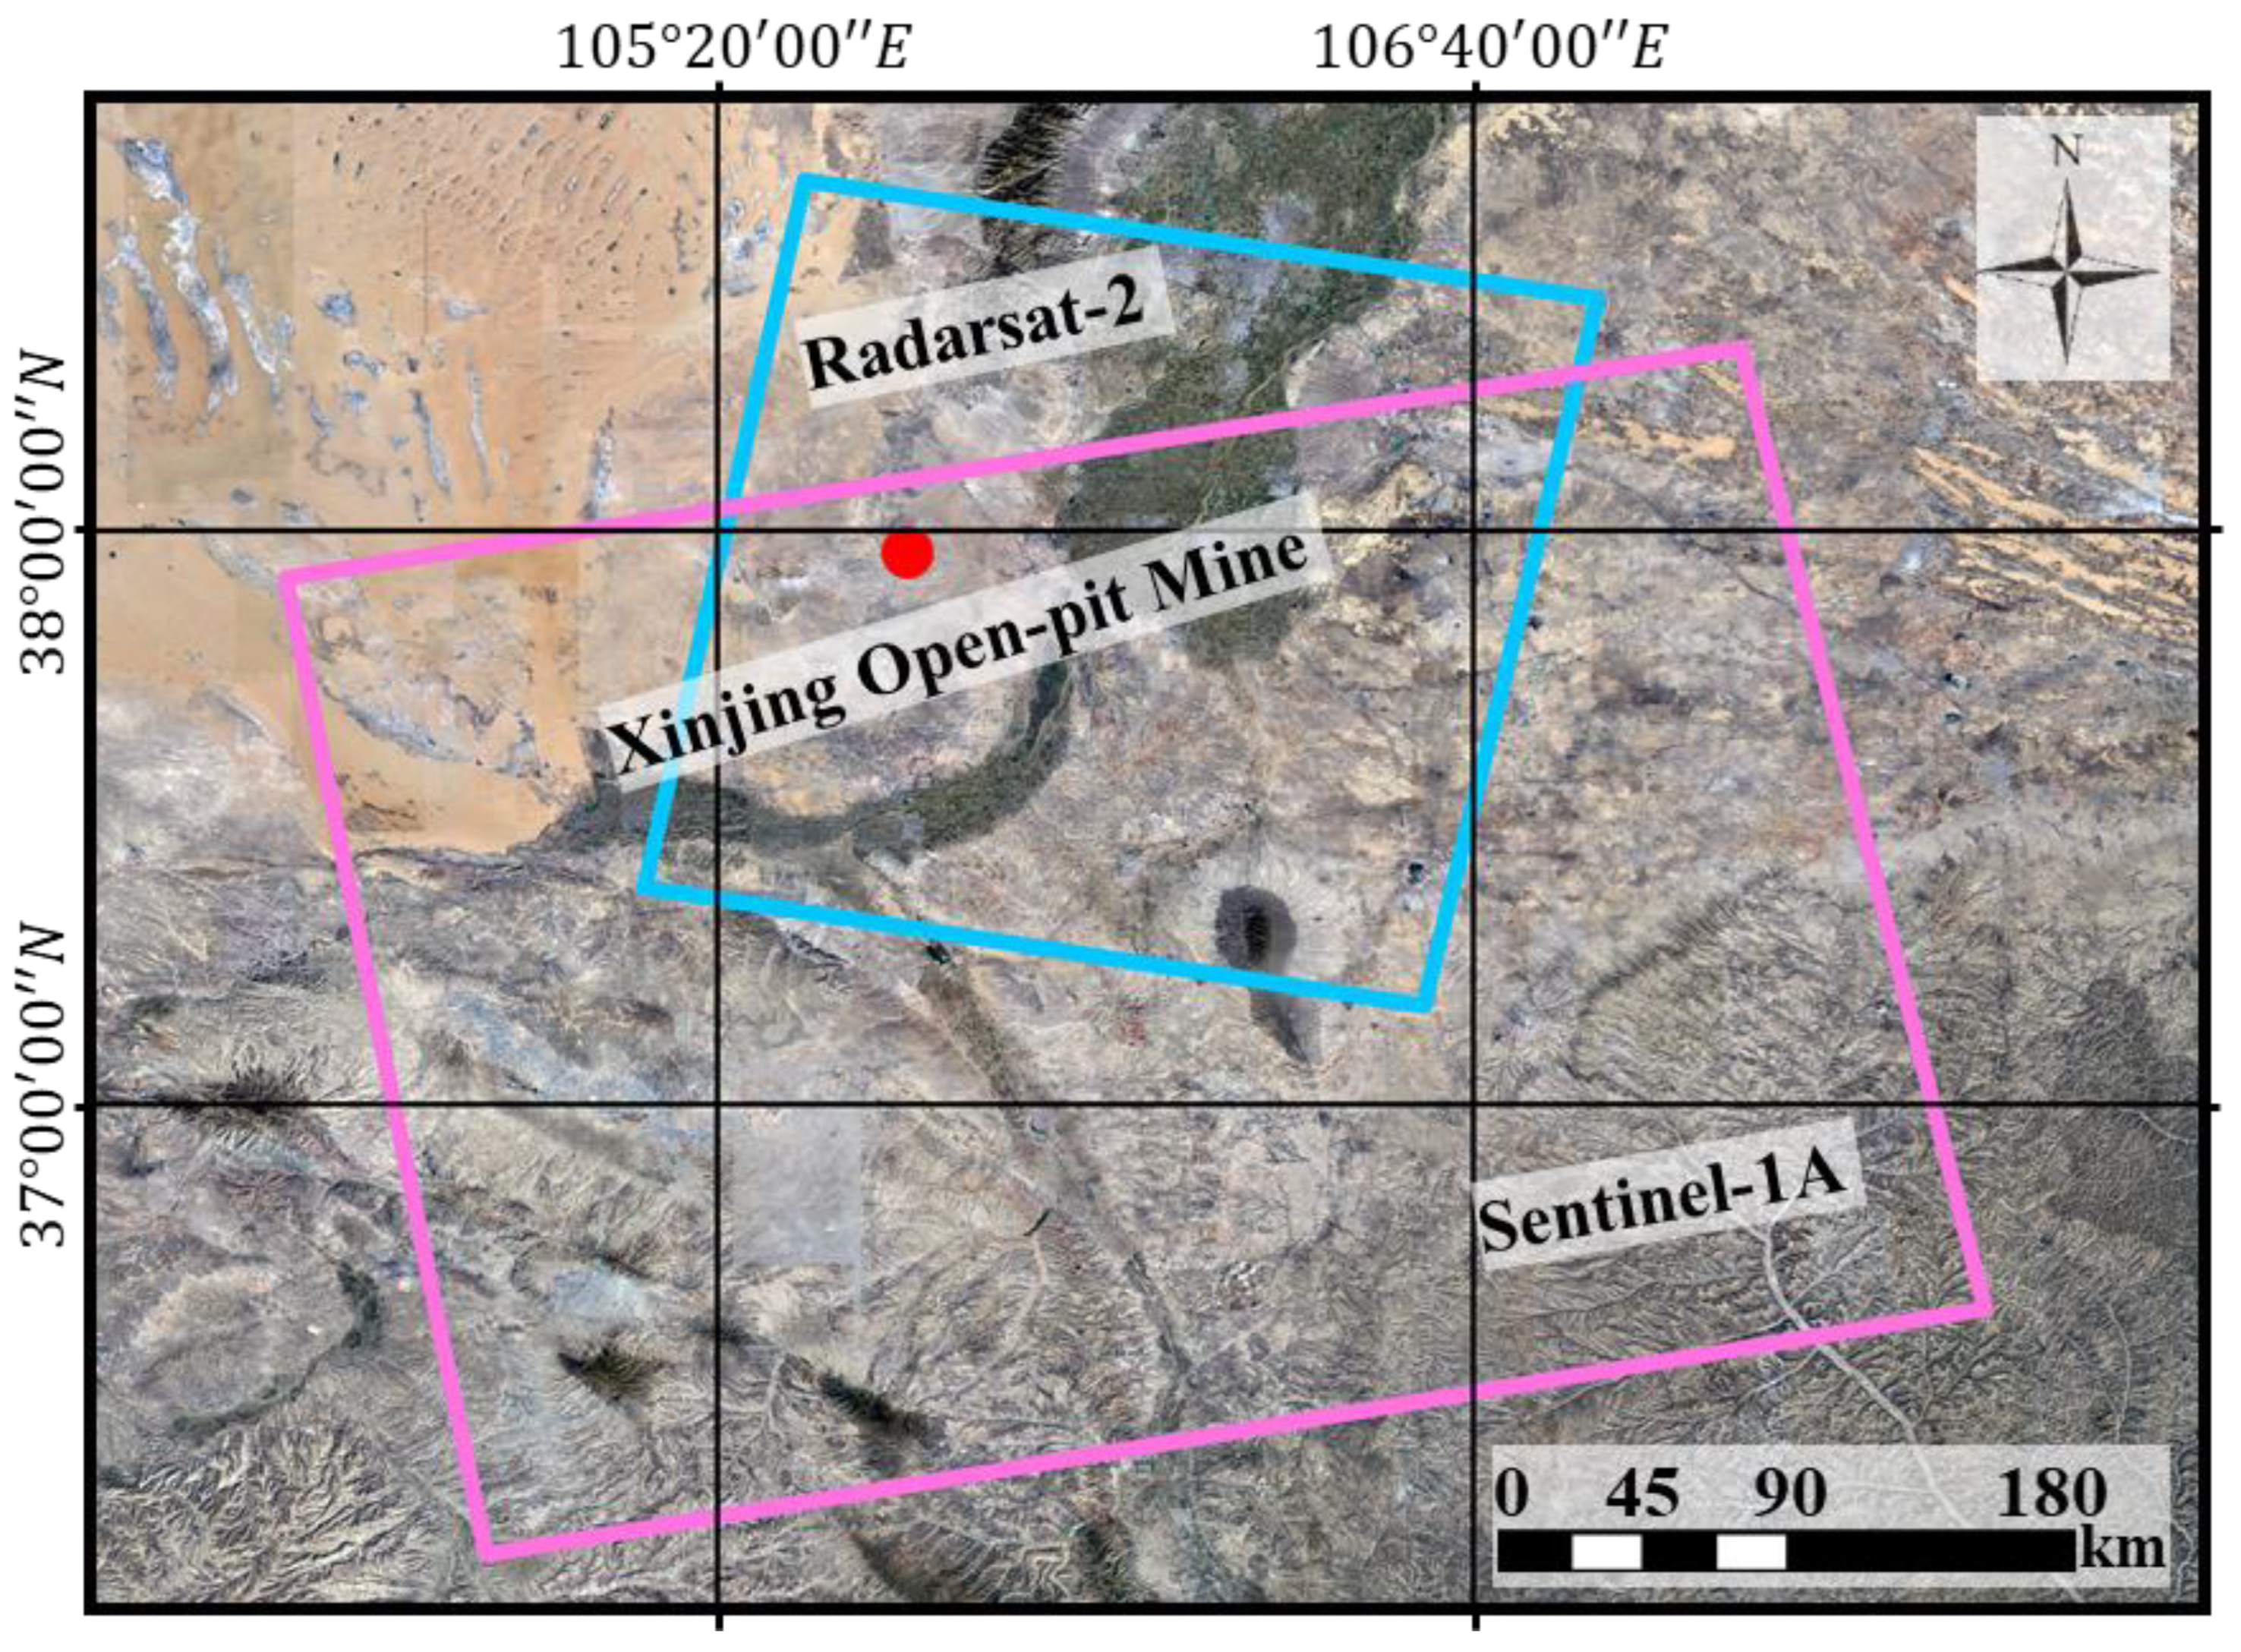
2.1. Study Area
2.2. Datasets
2.2.1. GF-2
2.2.2. Radarsat-2
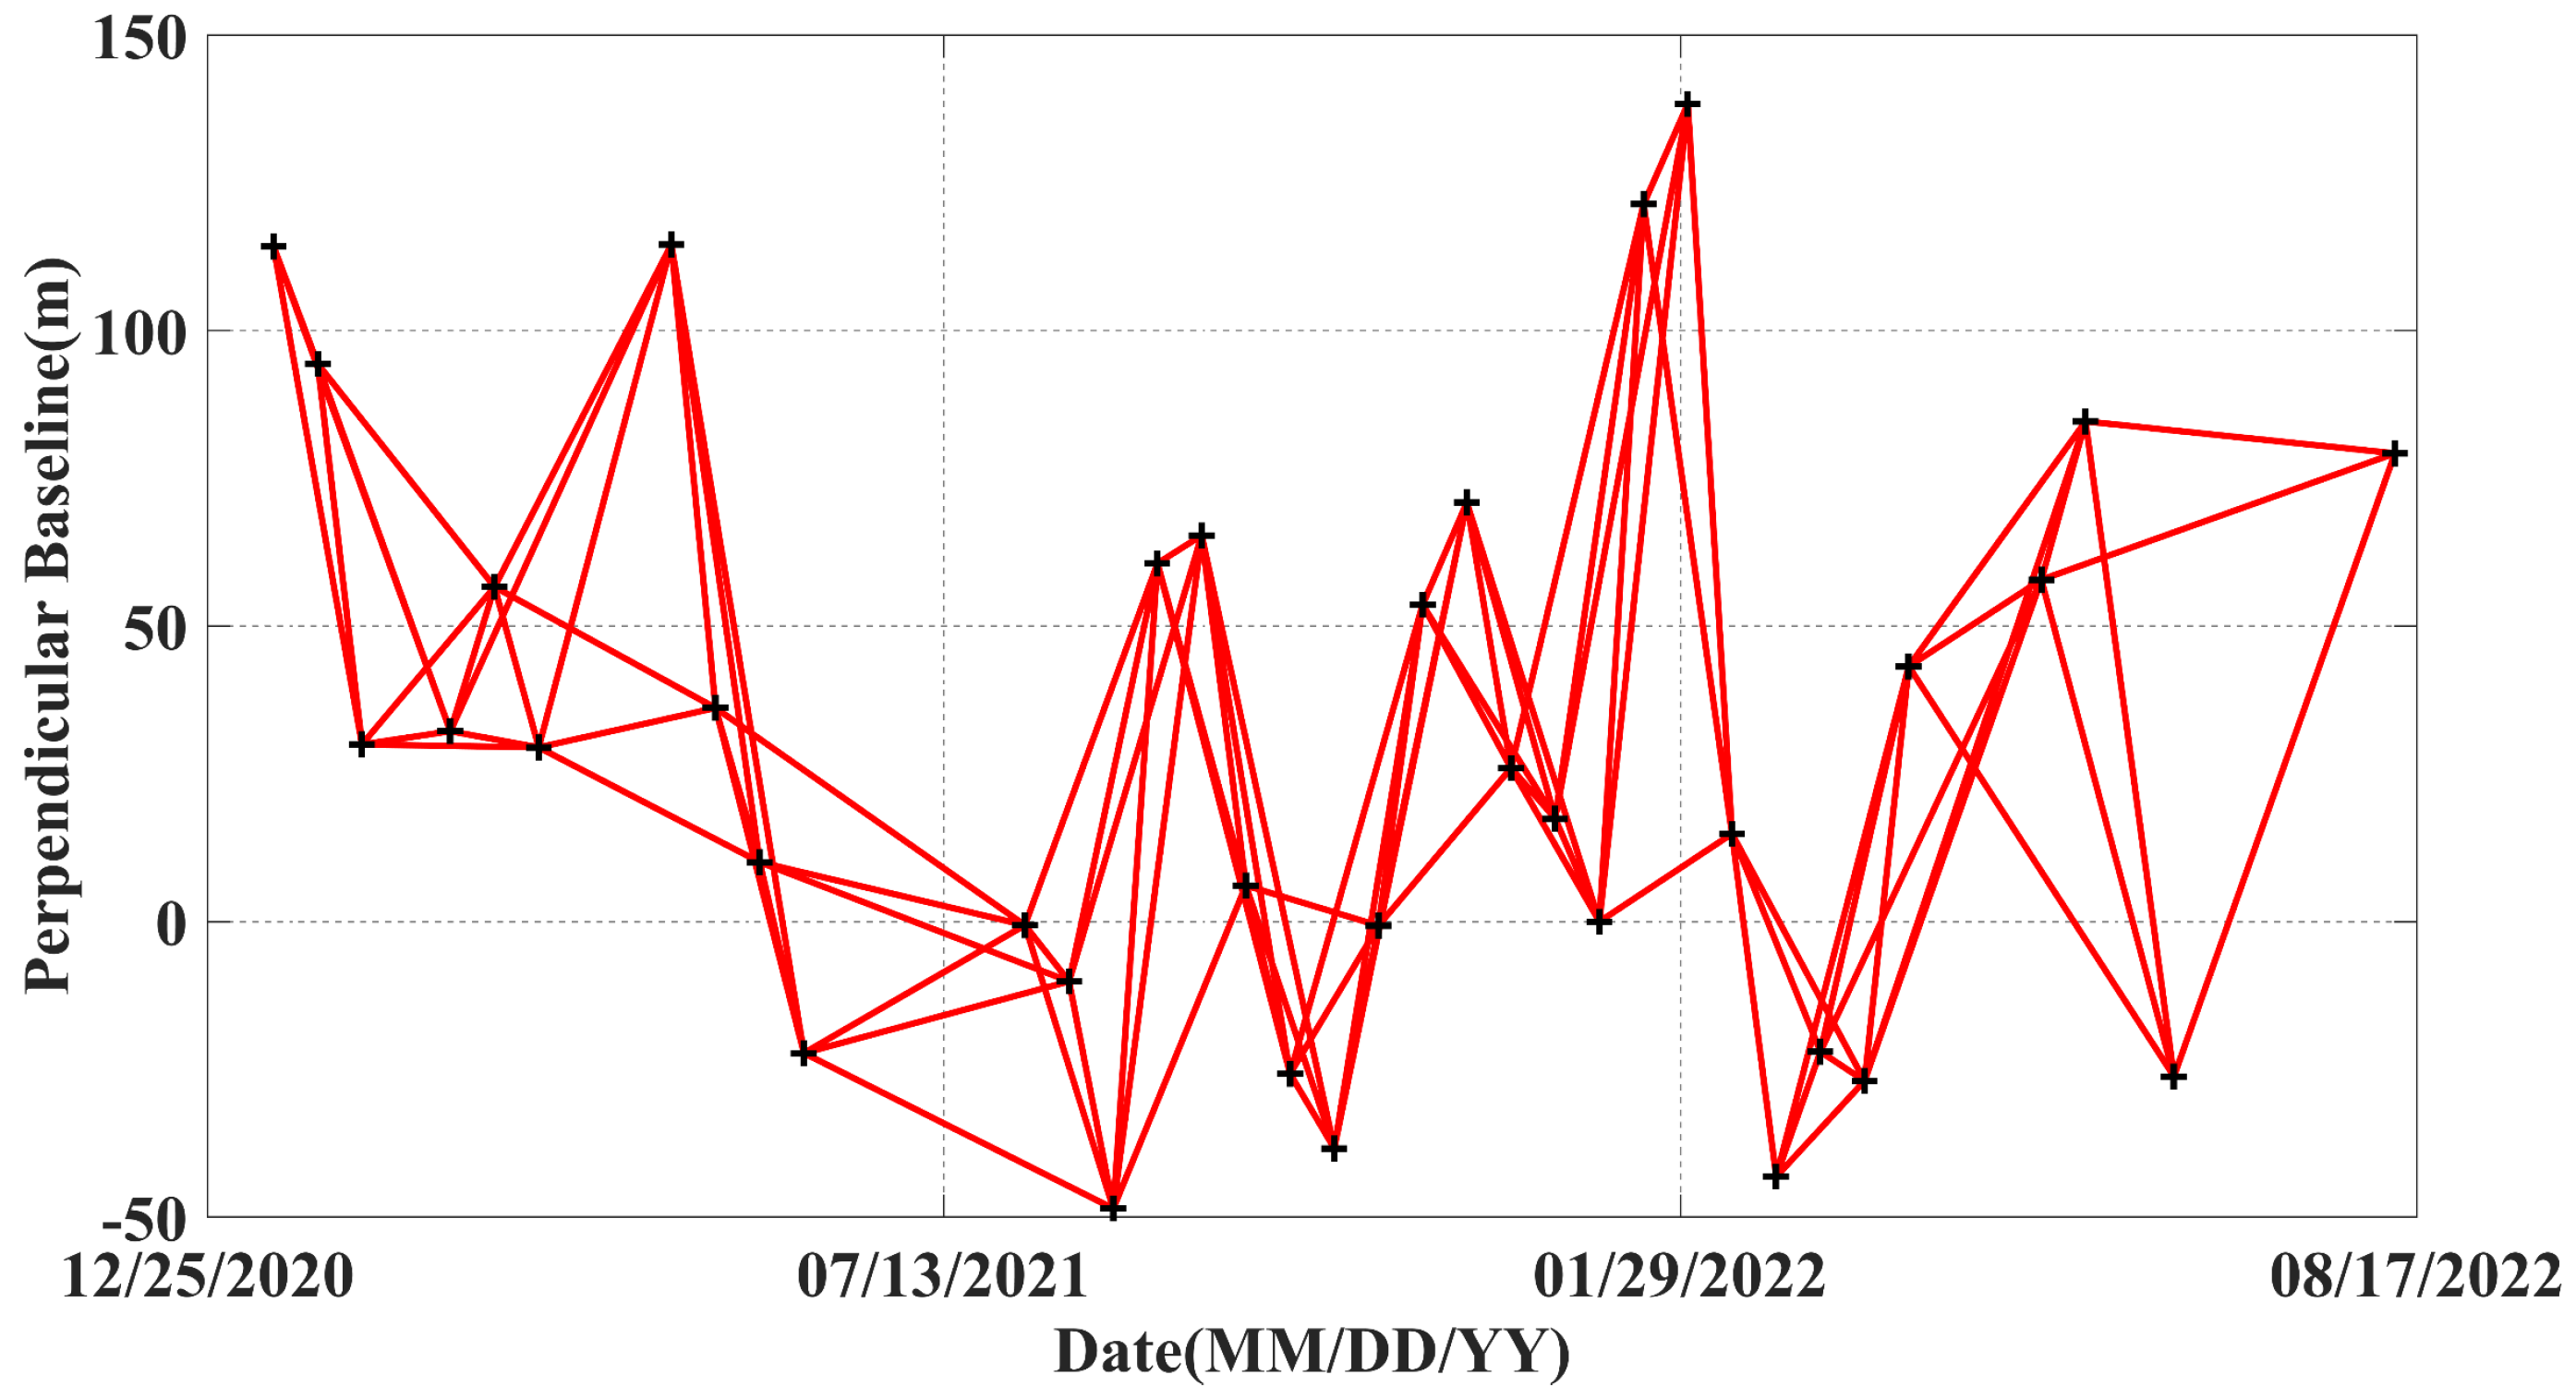
2.2.3. Sentinel-1A
3. Methods
3.1. Differential InSAR
3.2. Distributed Scatterer InSAR
3.2.1. Fast Statistically Homogeneous Pixel Identification
3.2.2. Distributed Scatterer Phase Optimization
3.2.3. DS-InSAR Data Processing
4. Results
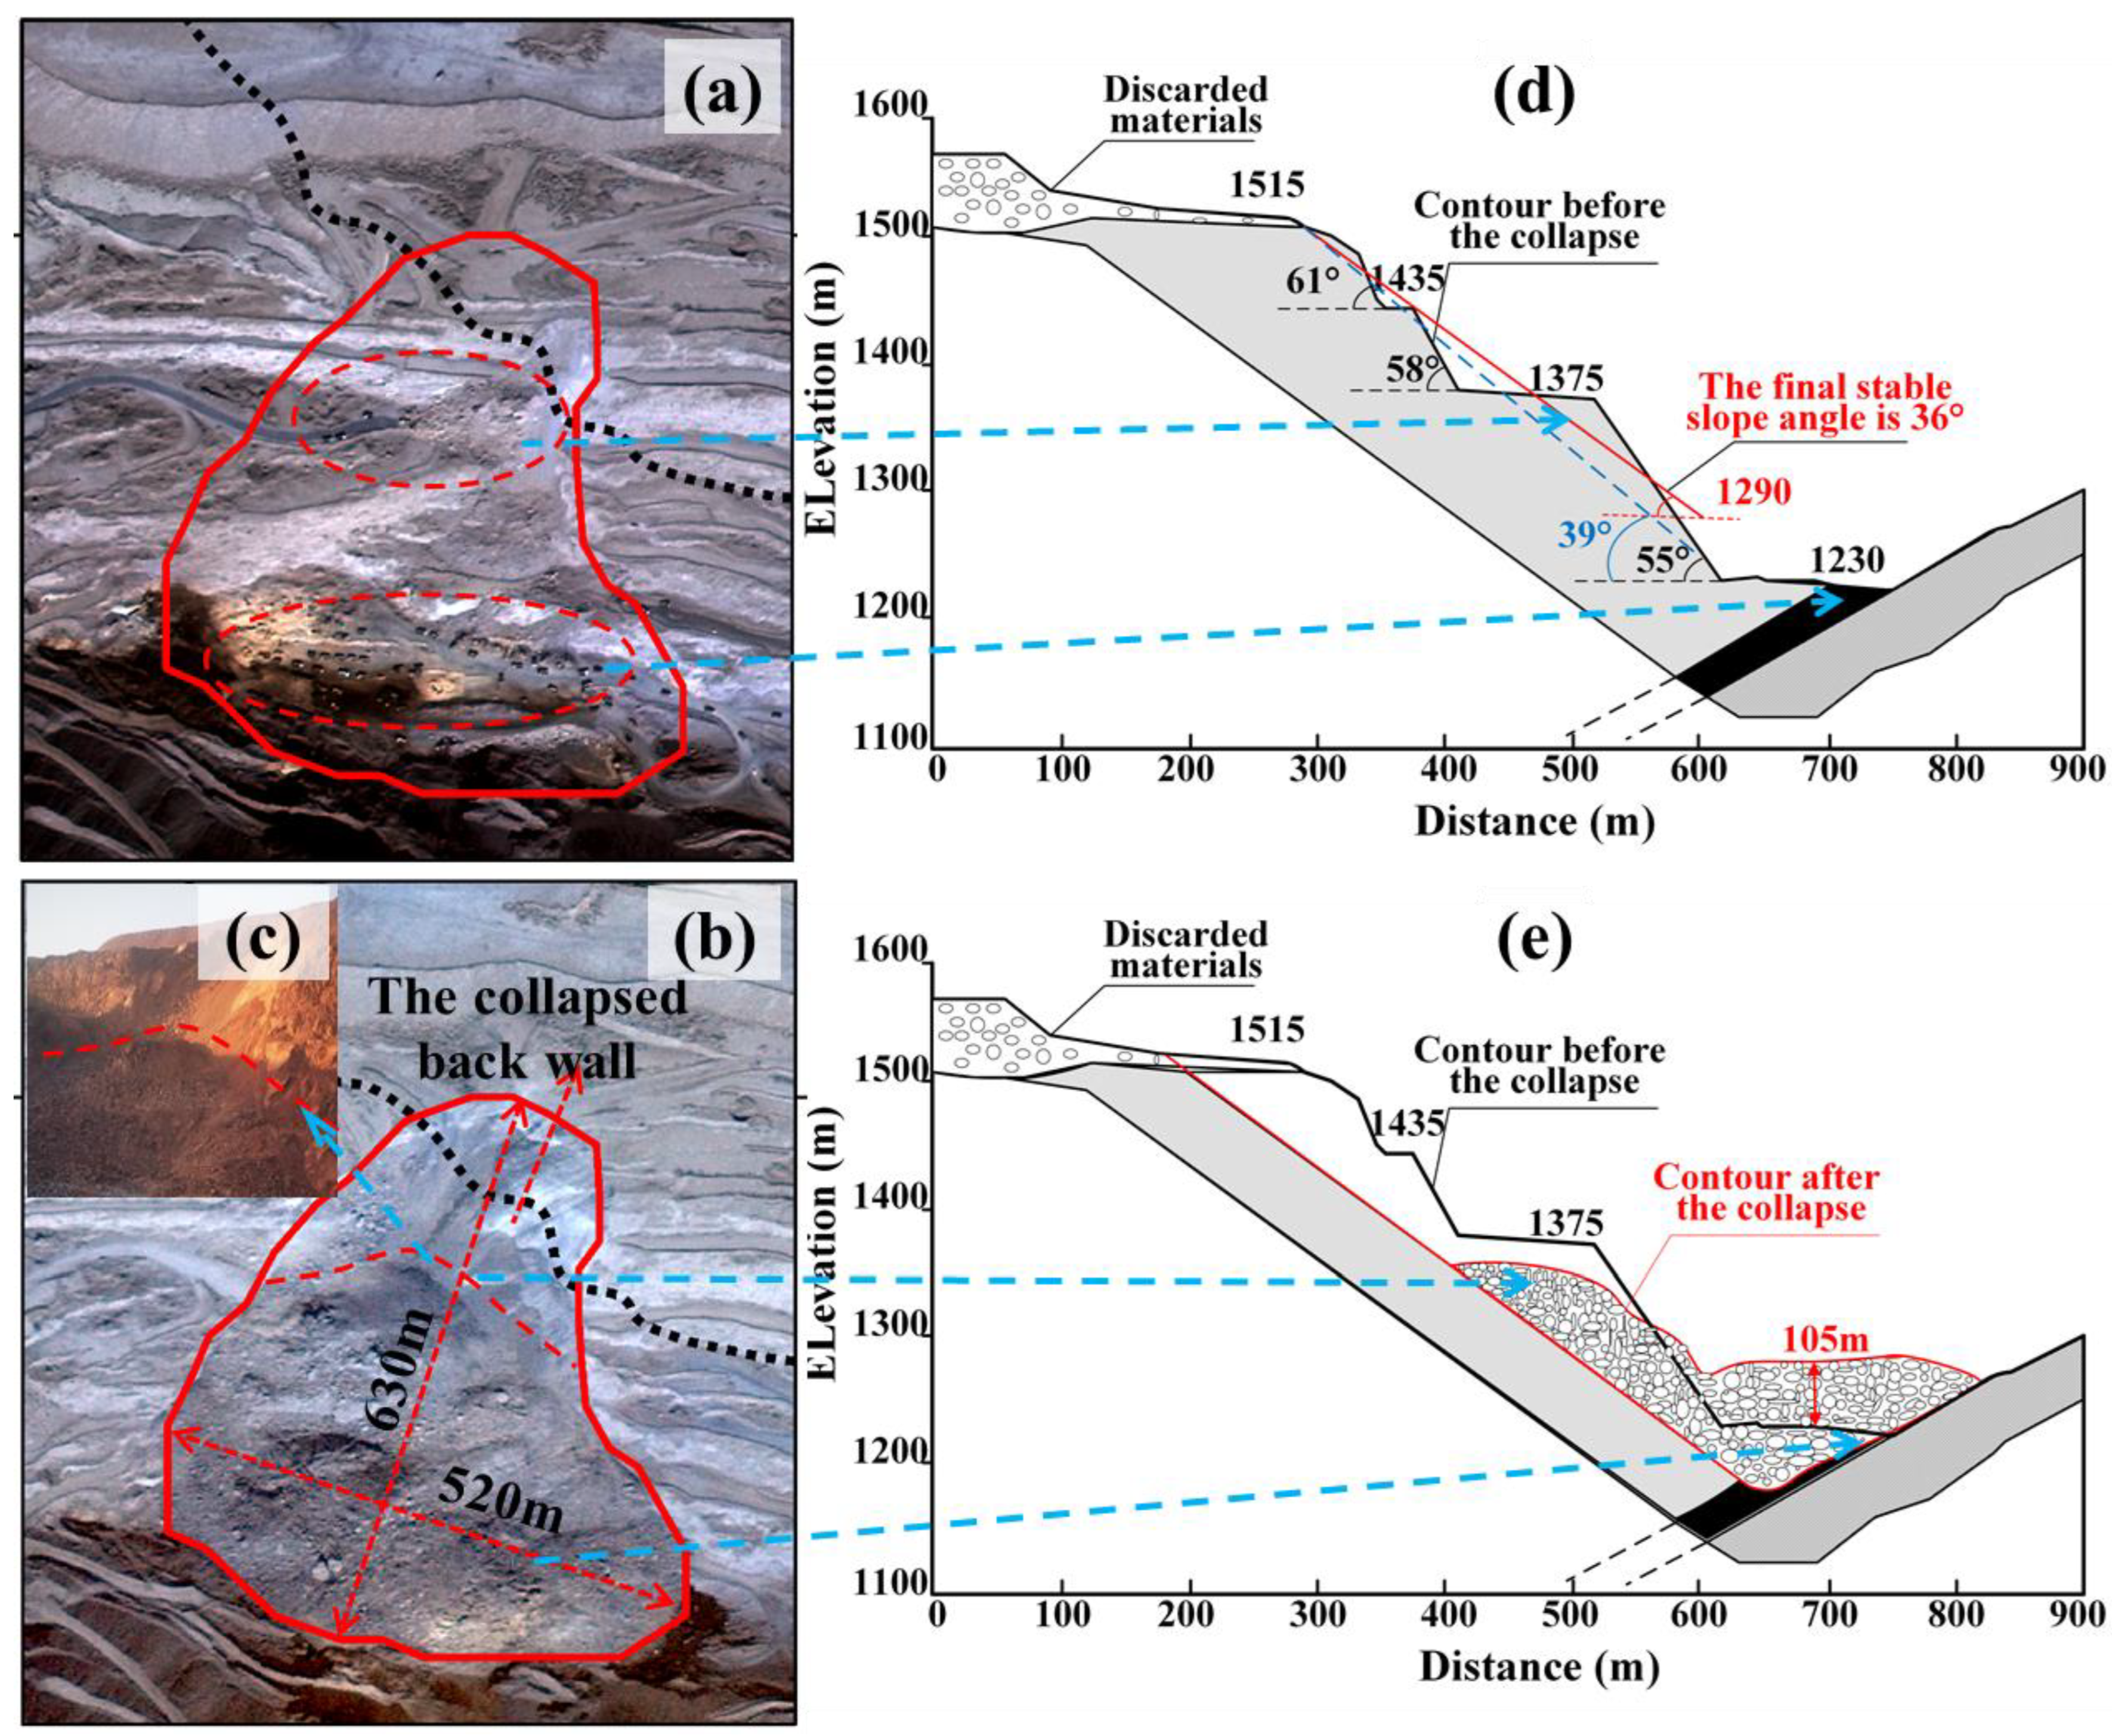
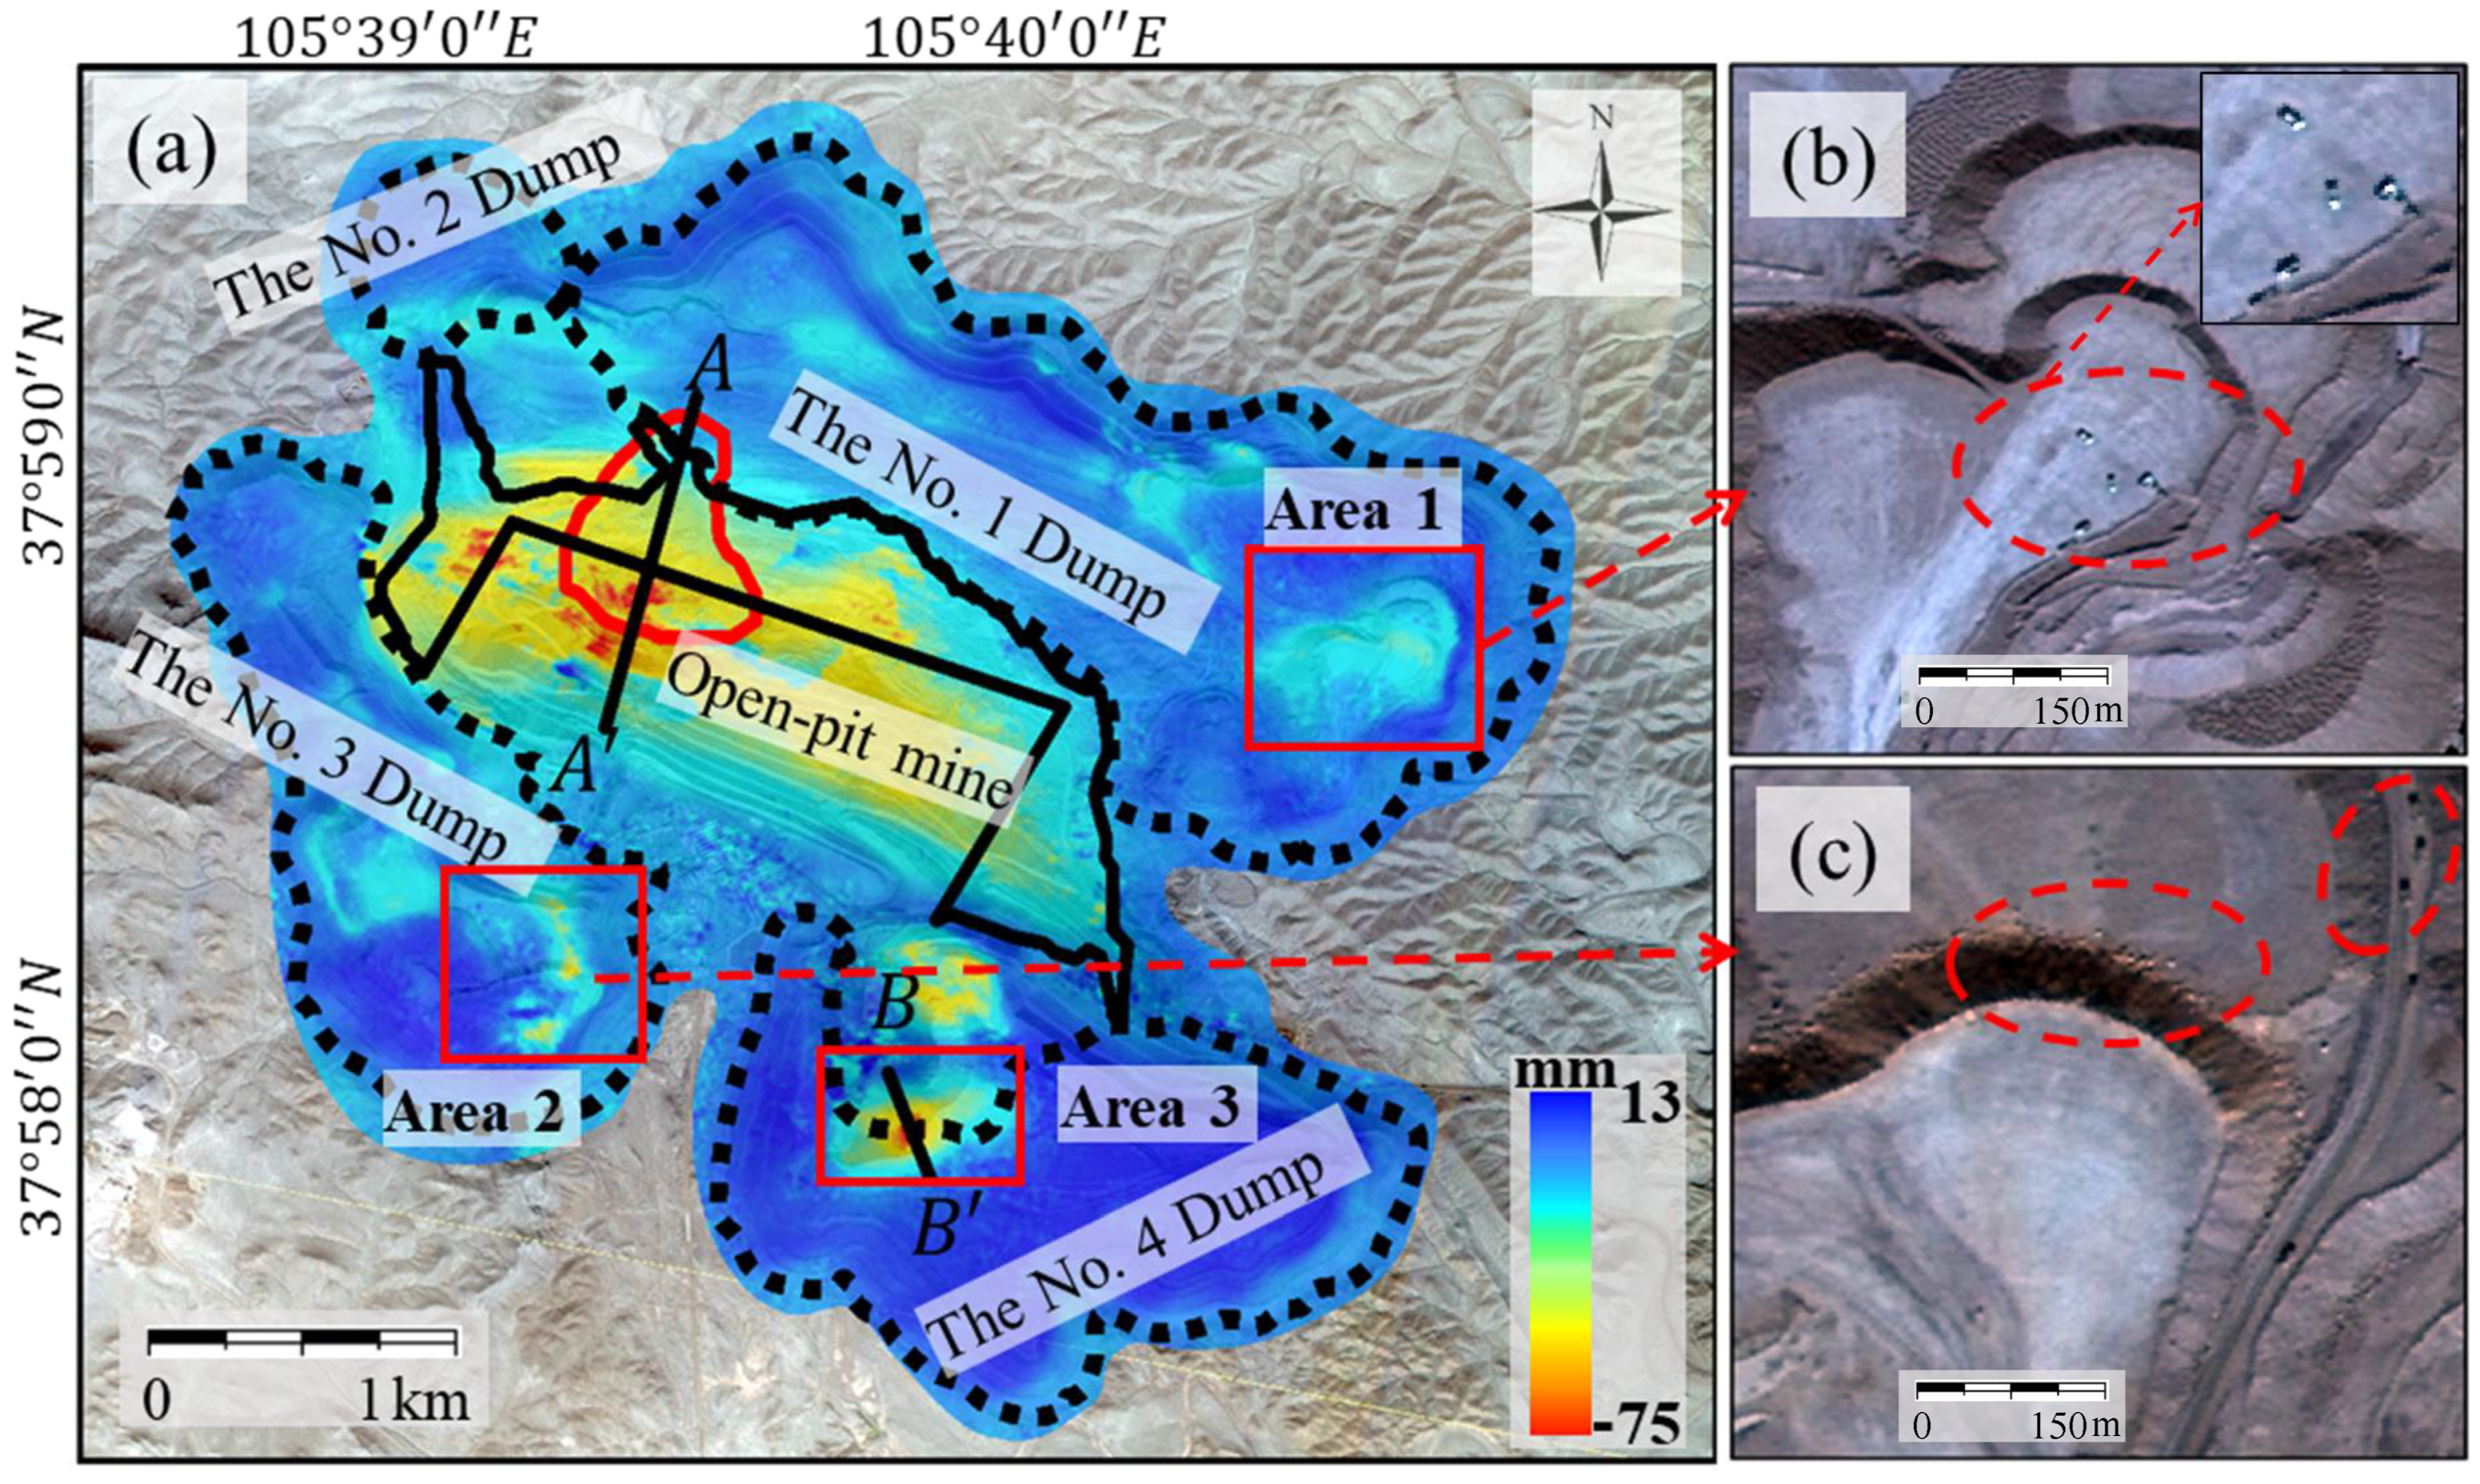
4.1. Collapse Area Delineation
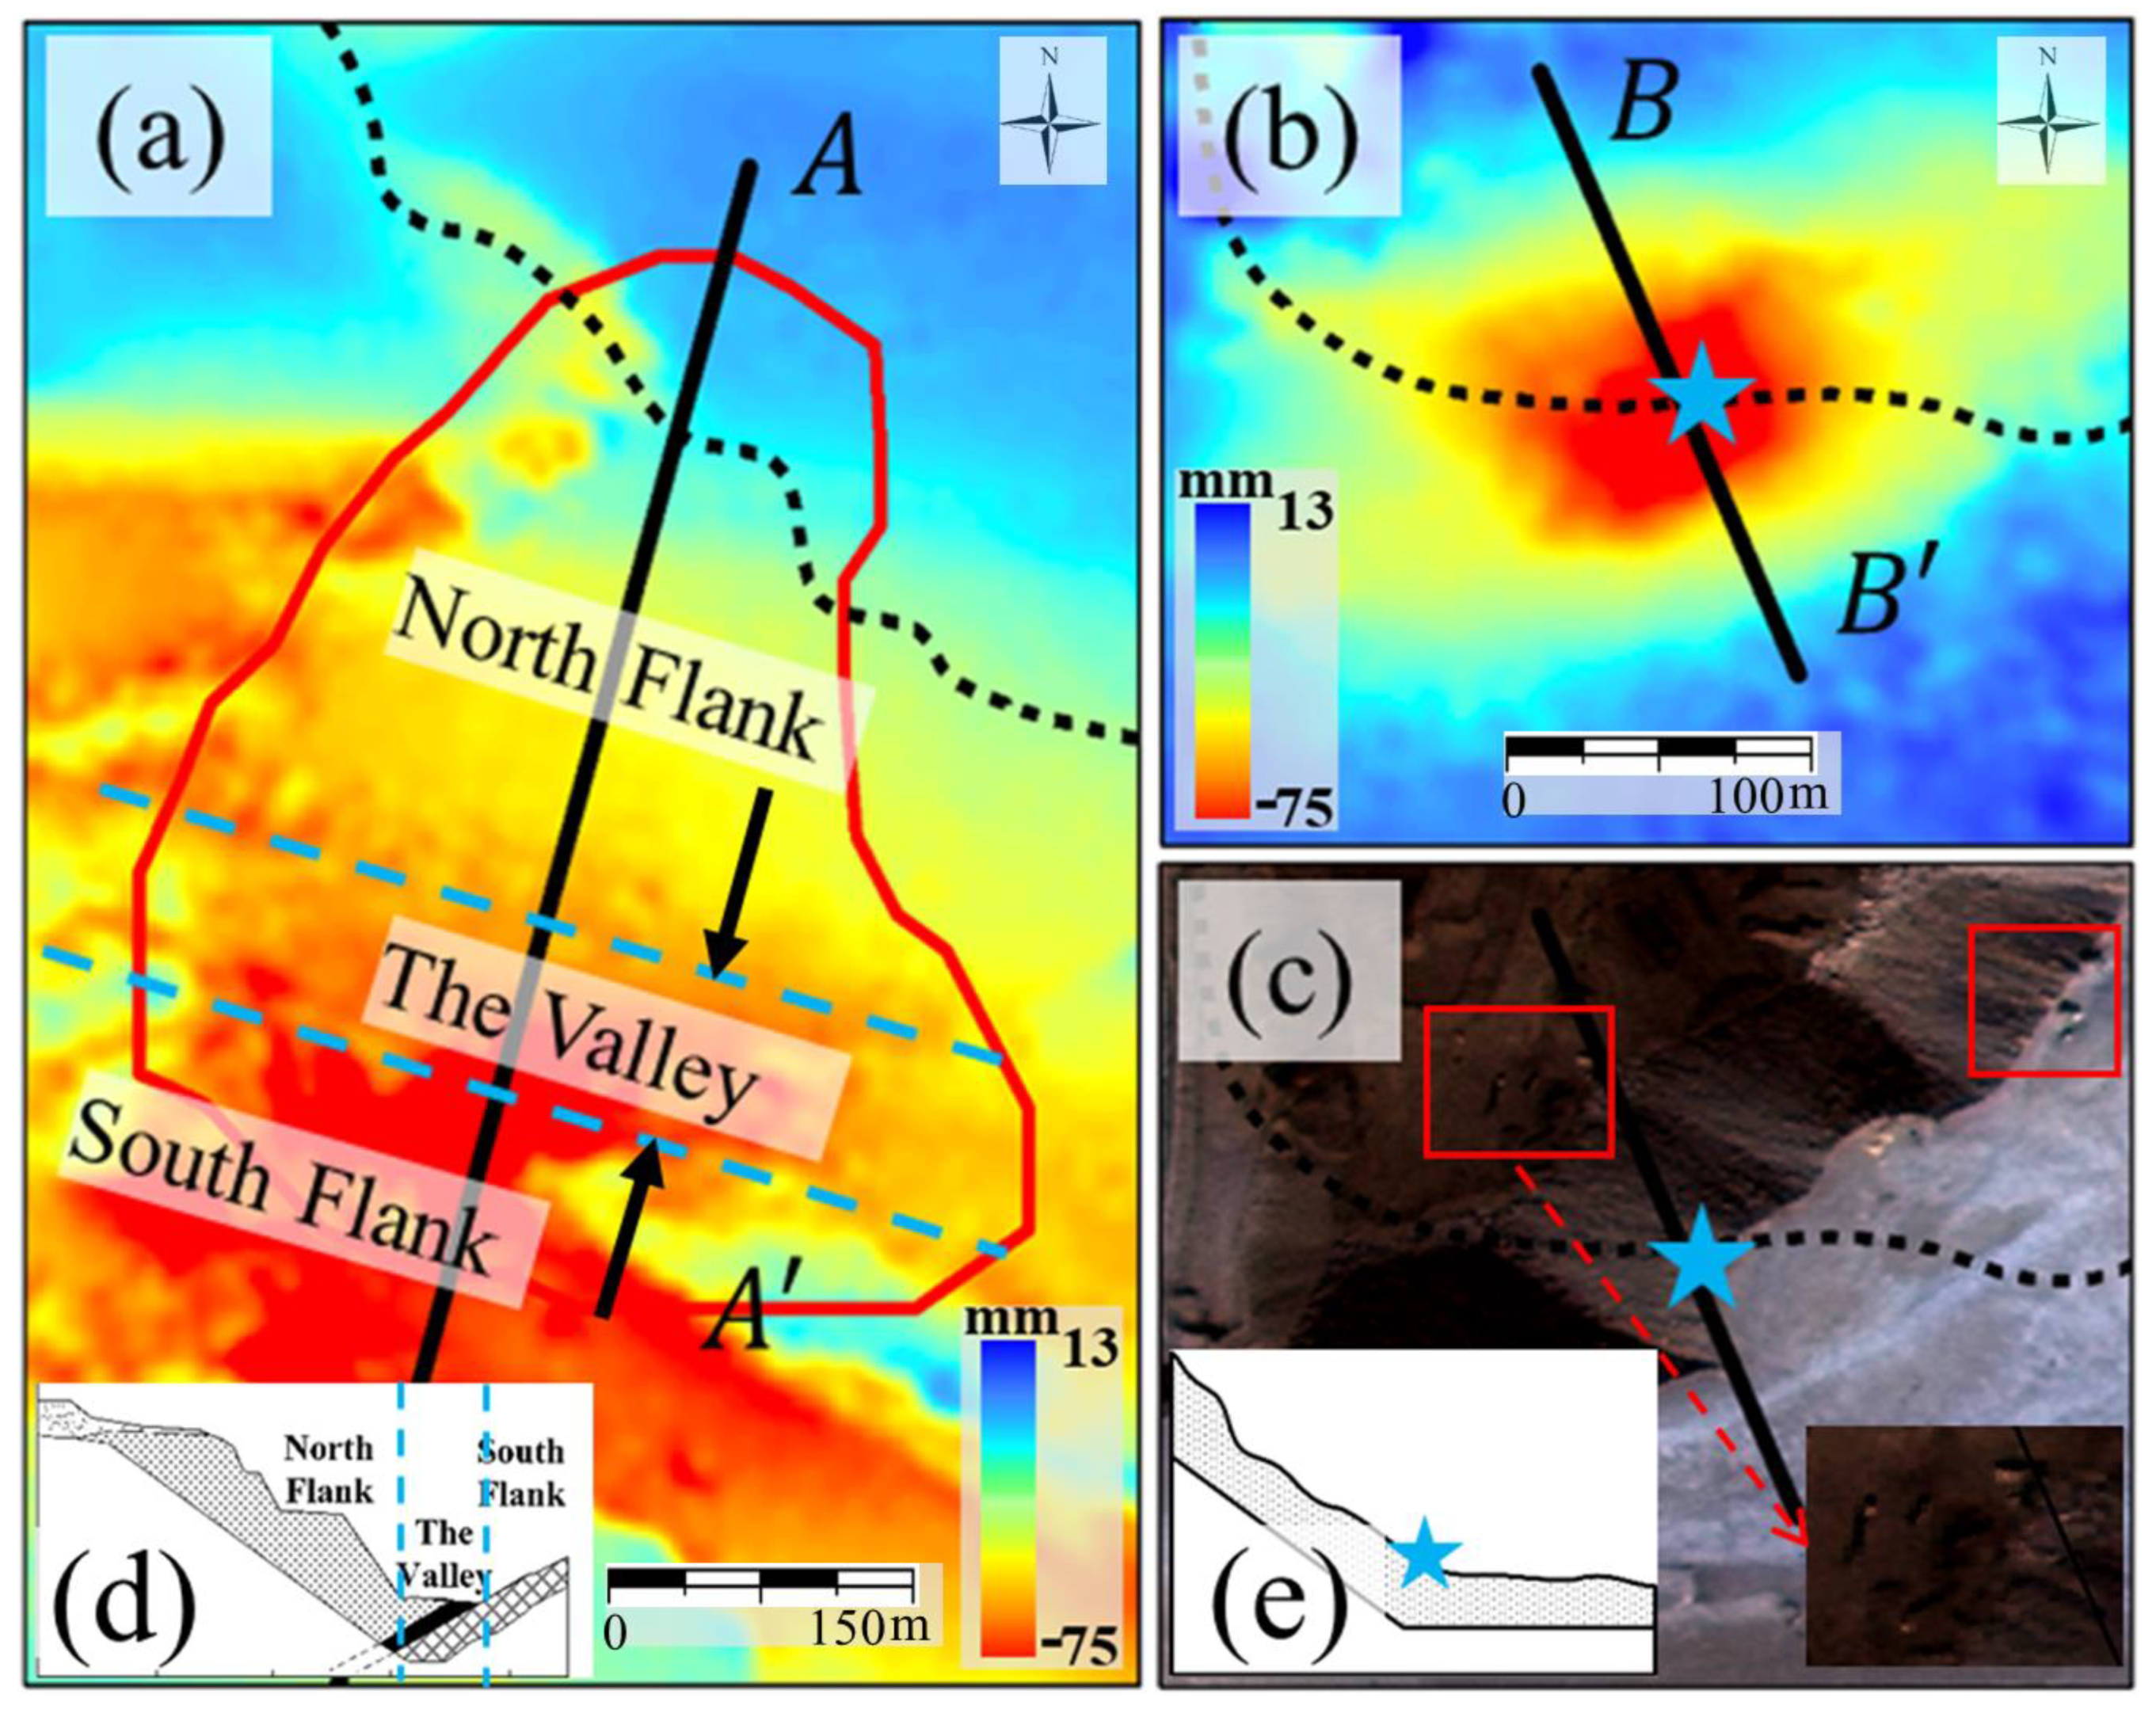
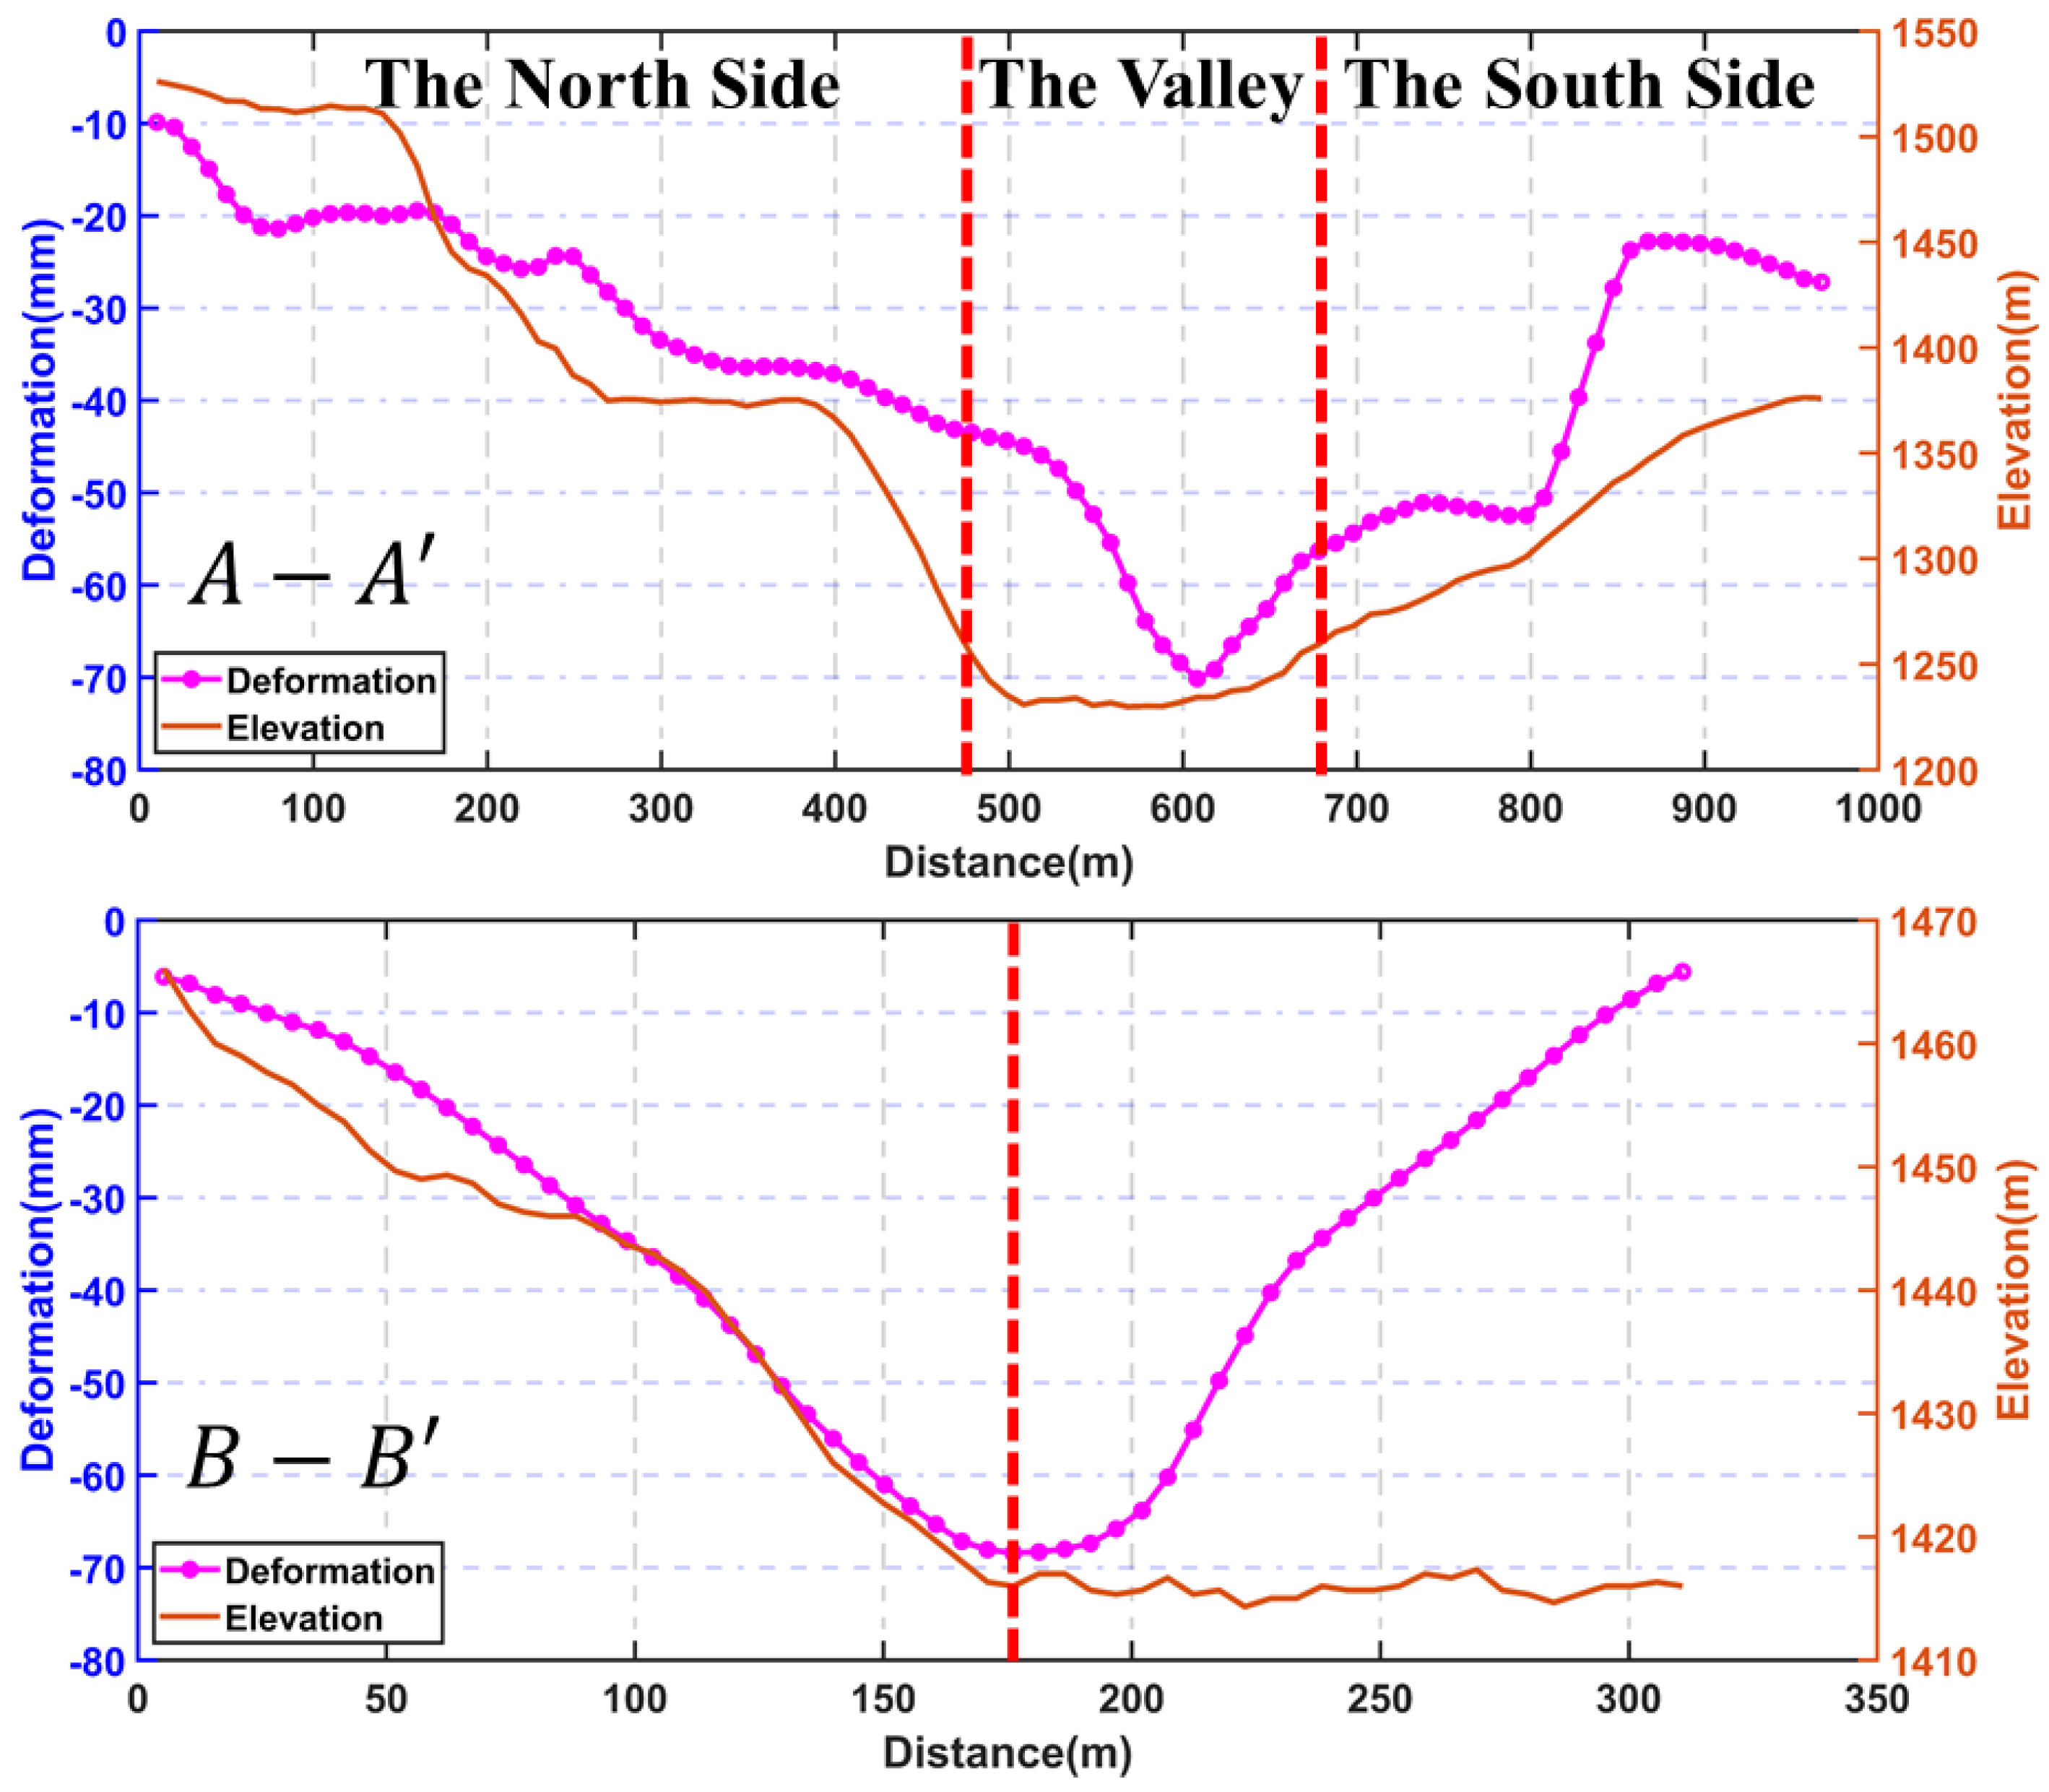
4.2. D-InSAR Deformation Analysis
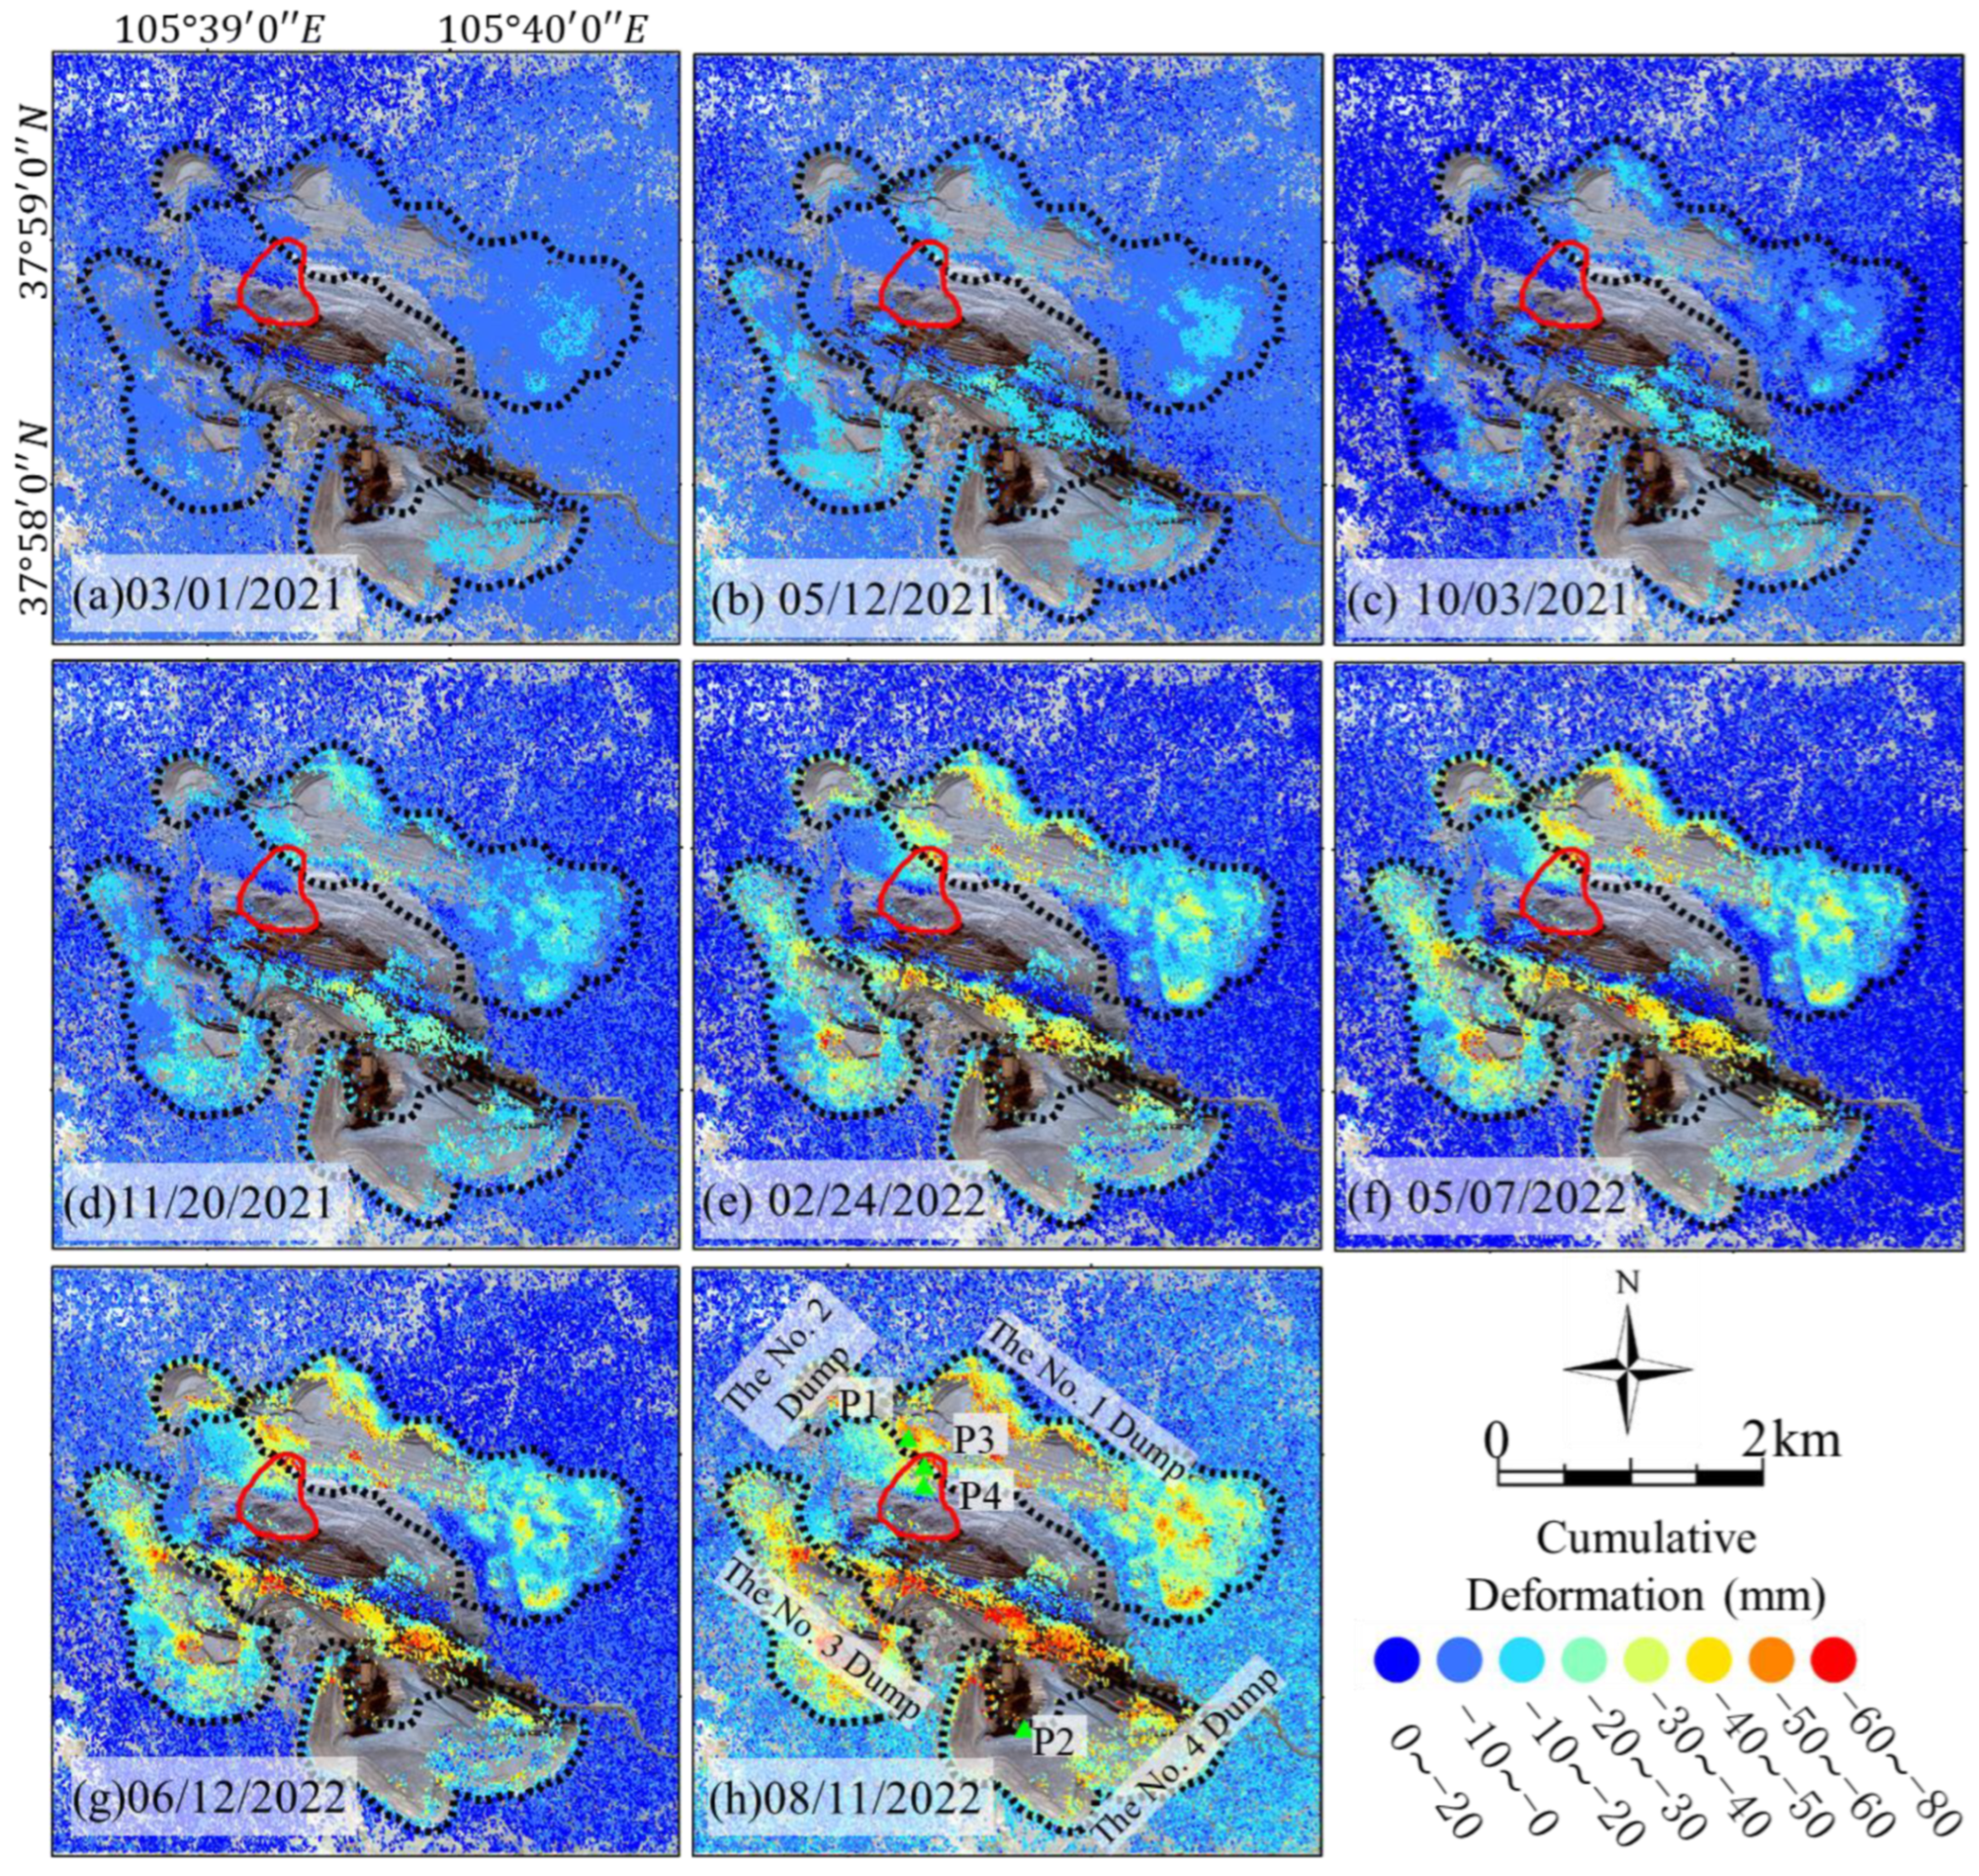
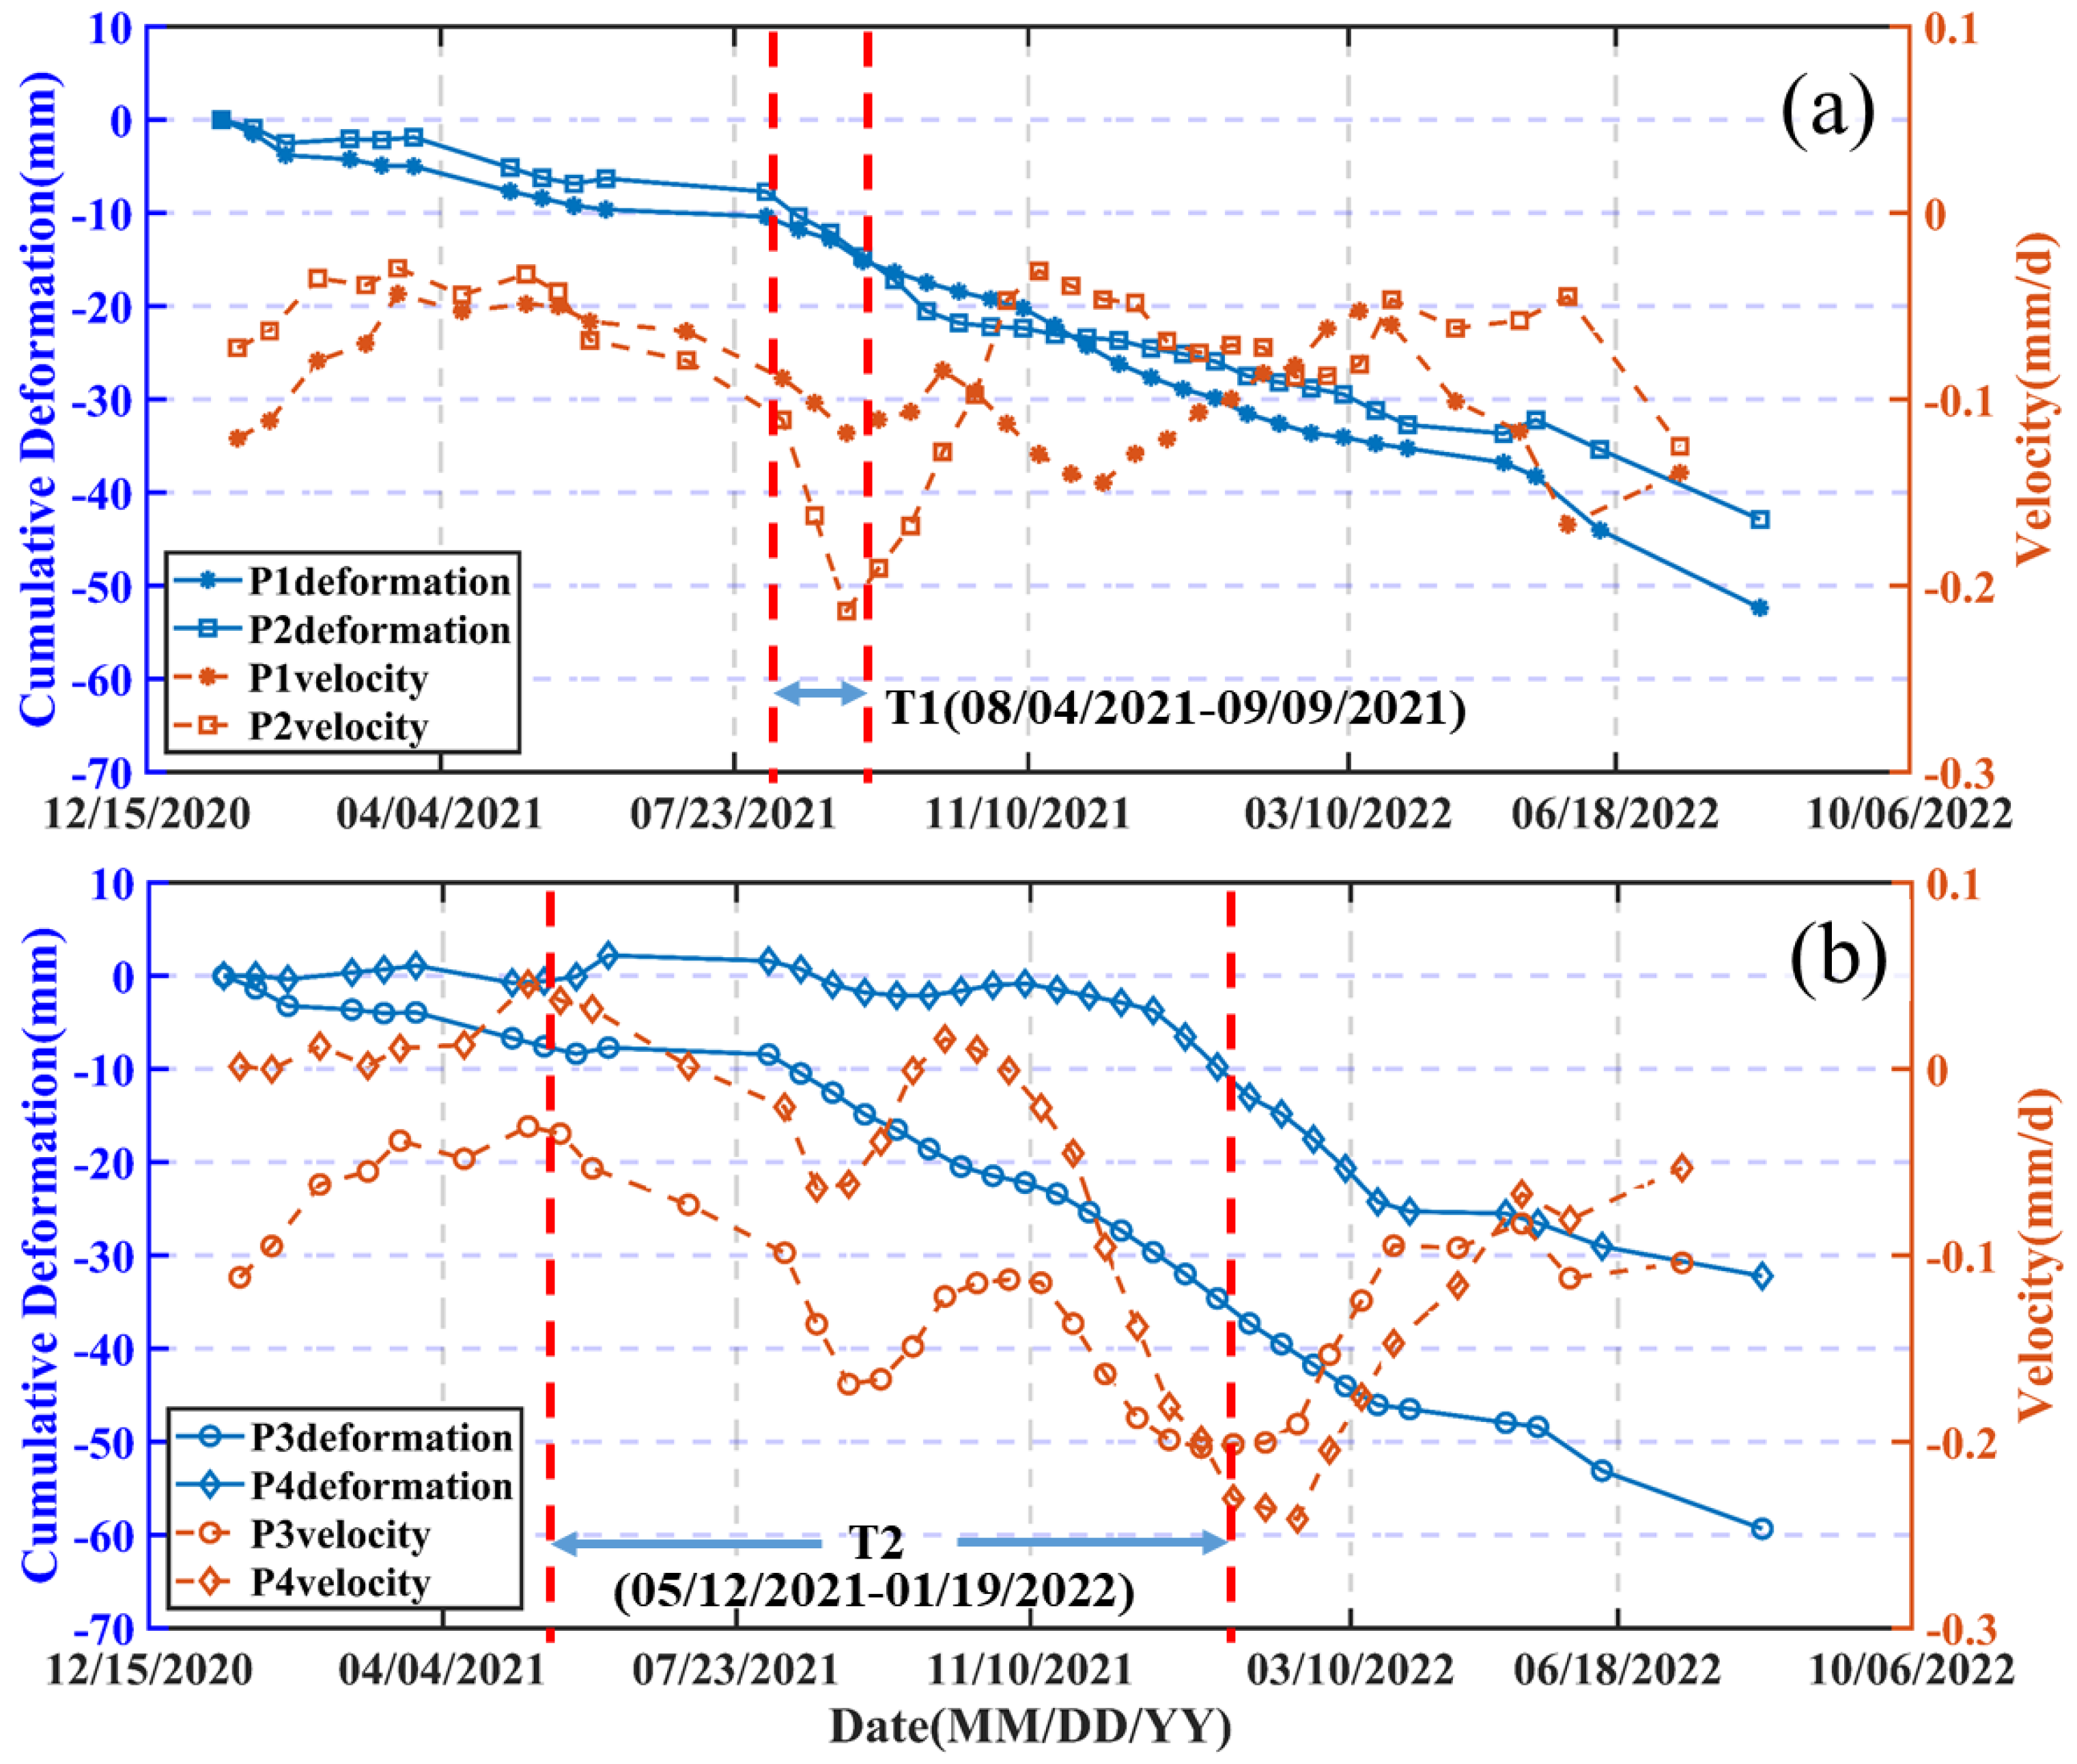
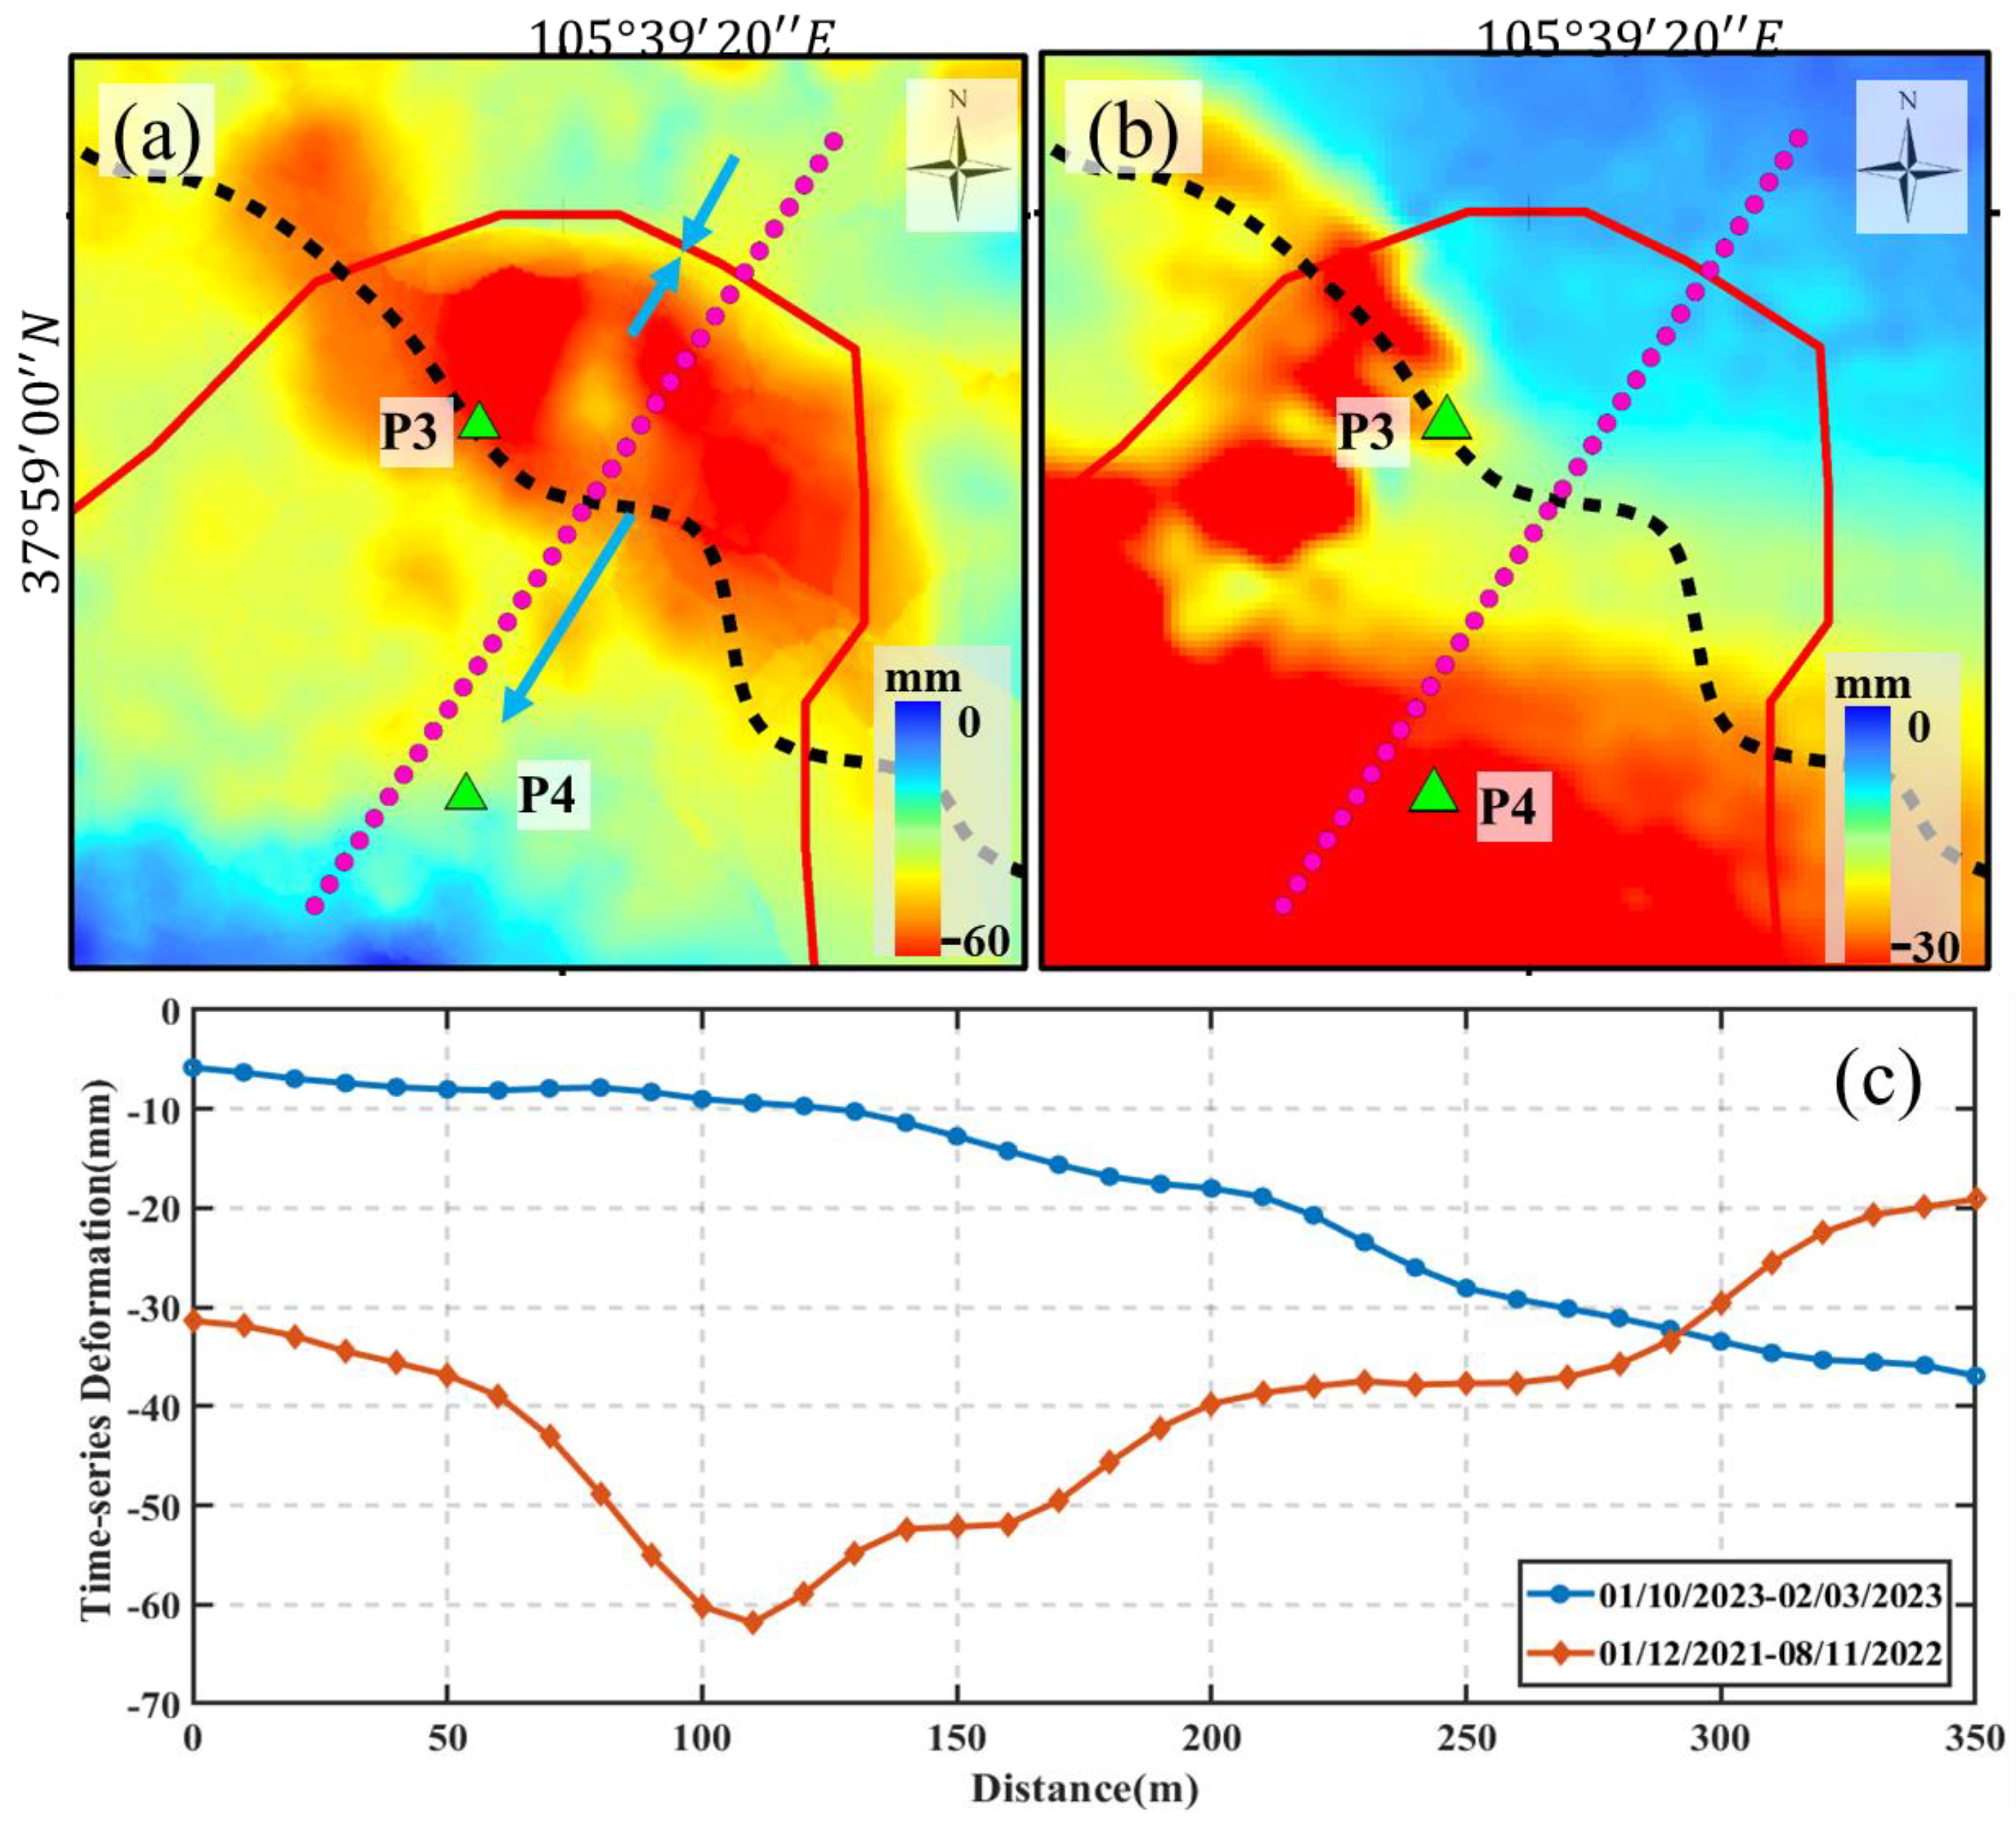
4.3. DS-InSAR Deformation Analysis
5. Discussion
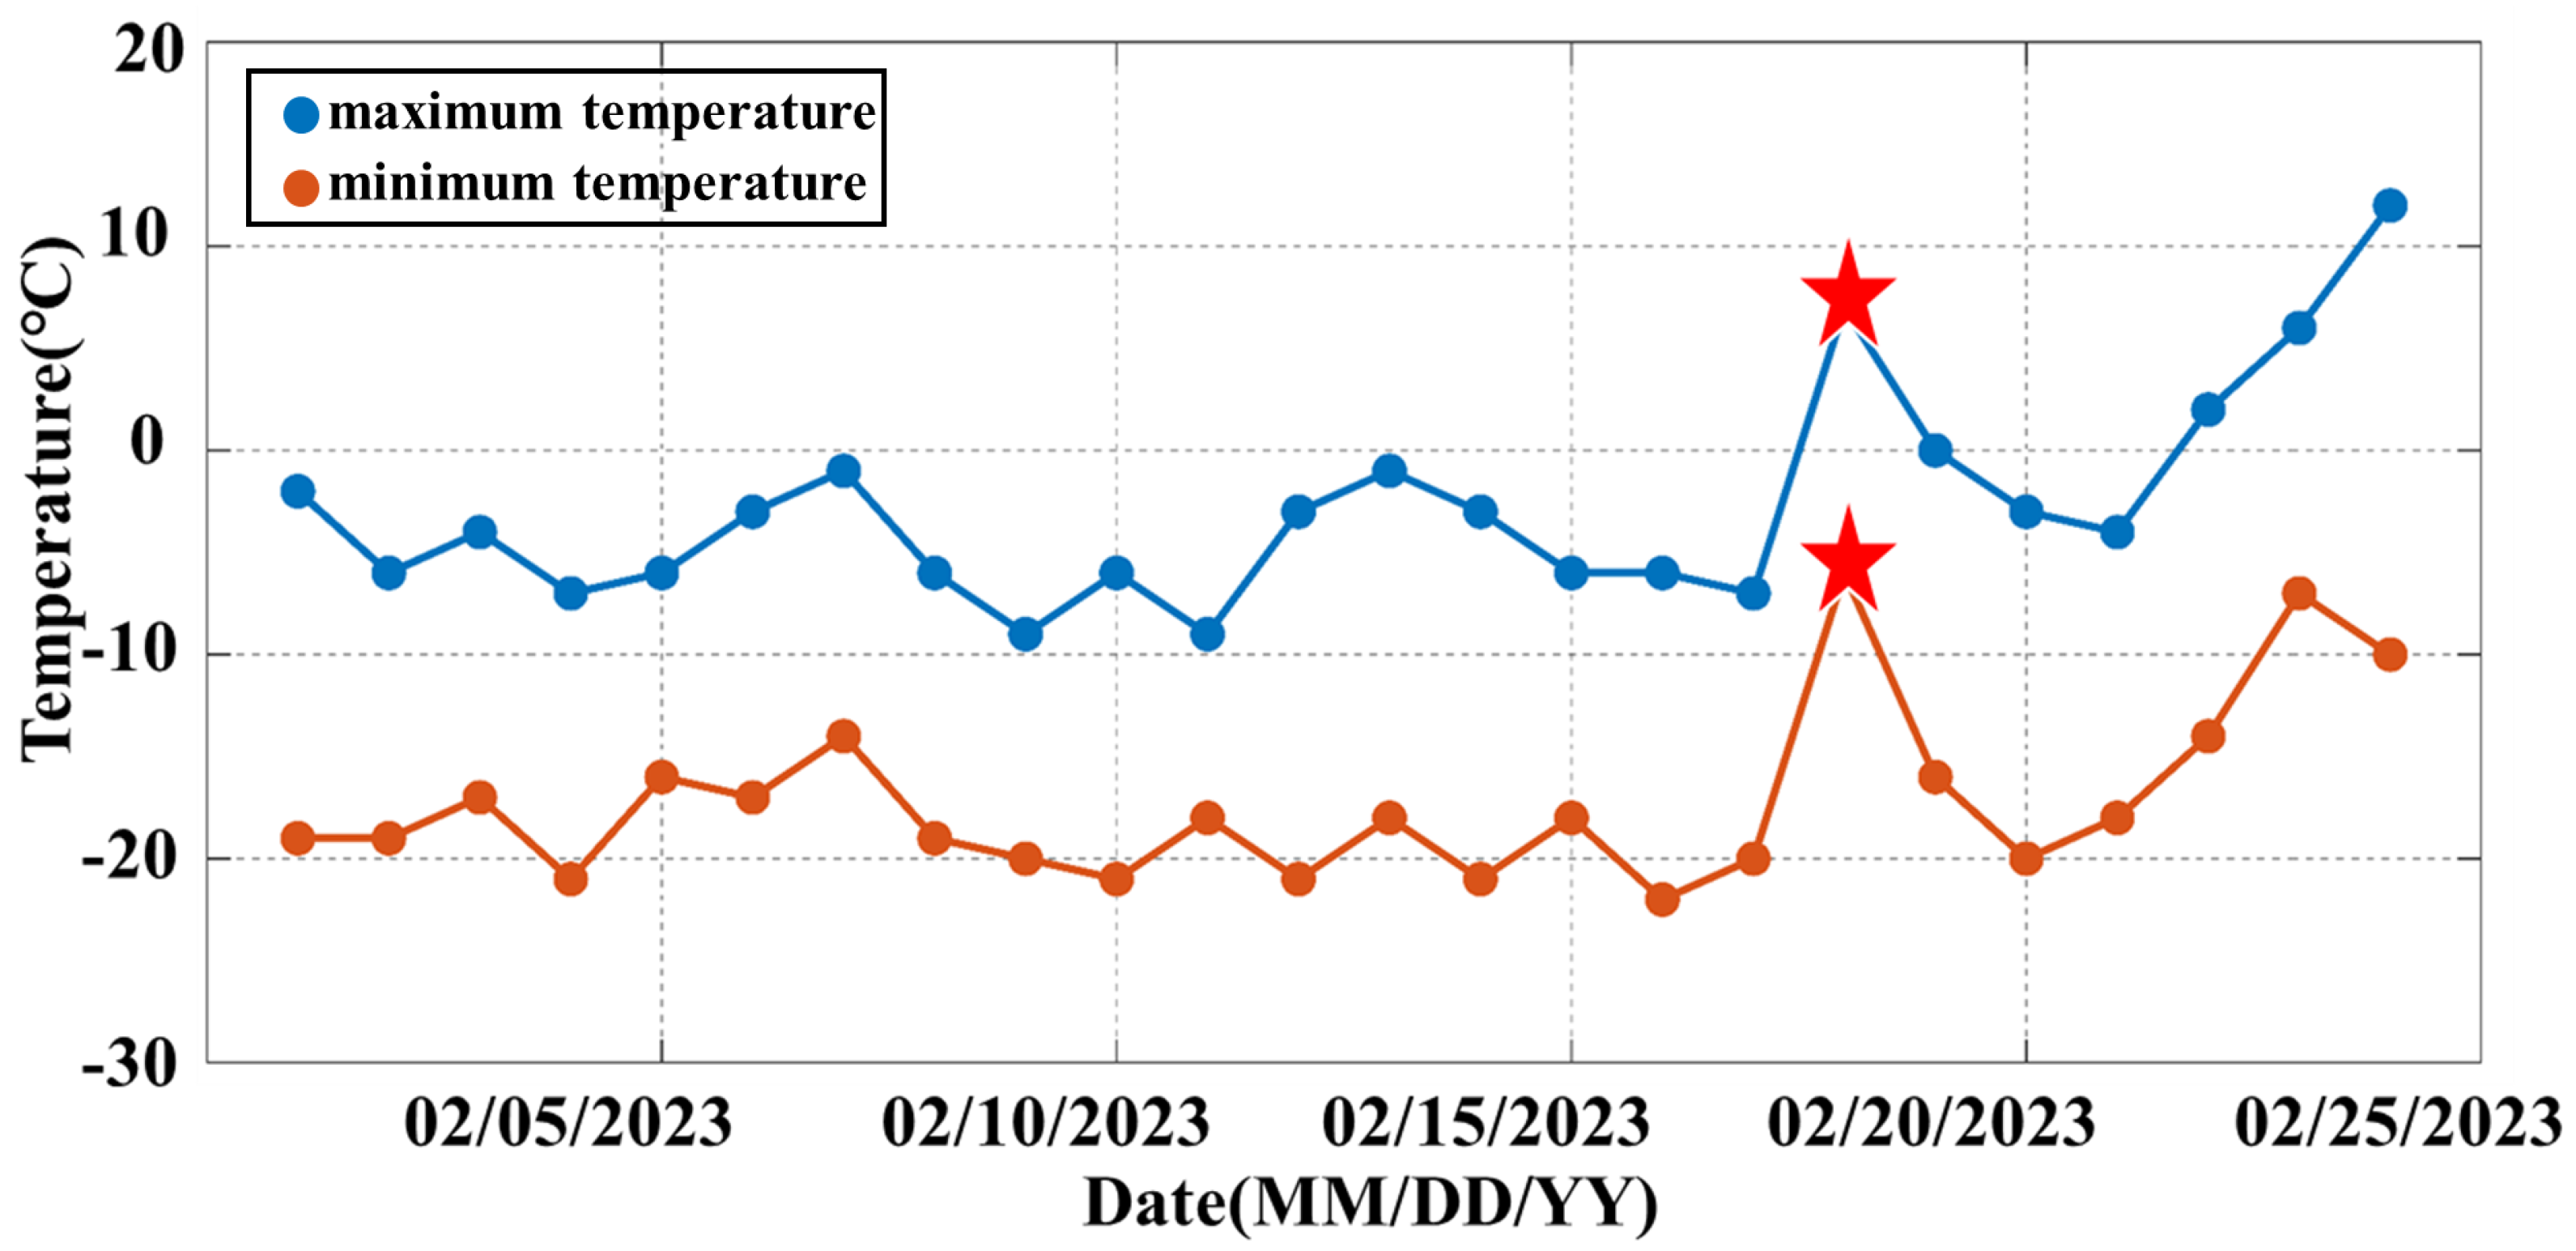
5.1. Main Causes of the Accident
5.2. Other Potential Causes
5.3. The Other Applications of Multi-Source Remote Sensing of Open-Pit Mines
5.4. Challenging Issues and Future Research
6. Conclusions
Author Contributions
Funding
Conflicts of Interest
References
- Chen, Y.; Li, M.; Pu, H.; Ju, F.; Zhang, K.; Wu, H. Experimental study on dynamic mechanical characteristics of coal specimens considering initial damage effect of cyclic loading. J. China Coal Soc. 2023, 48, 2123–2137. [Google Scholar]
- Liu, L.; Guo, E.; Li, Z.; Zhou, P. Suggestions on strengthening the environmental management in open-pit coal mines during the 14th Five-Year Plan. China Coal 2021, 10, 61–66. [Google Scholar]
- Du, S.; Saroglou, C.; Chen, Y.; Lin, H.; Yong, R. A new approach for evaluation of slope stability in large open-pit mines: A case study at the Dexing Copper Mine, China. Environ. Earth Sci. 2022, 81, 102. [Google Scholar] [CrossRef]
- Nie, L.; Li, Z.; Zhang, M.; Xu, L. Deformation characteristics and mechanism of the landslide in West Open-Pit Mine, Fushun, China. Arab. J. Geosci. 2015, 8, 4457–4468. [Google Scholar] [CrossRef]
- Gama, F.F.; Cantone, A.; Mura, J.C.; Pasquali, P.; Paradella, W.R.; dos Santos, A.R.; Silva, G.G. Monitoring subsidence of open pit iron mines at Carajás Province based on SBAS interferometric technique using TerraSAR-X data. Remote Sens. Appl. Soc. Environ. 2017, 8, 199–211. [Google Scholar] [CrossRef]
- Bond, J.; Chrzanowski, A.; Wilkins, R. Using GPS for augmenting deformation monitoring systems in open pit mines-problems and solutions. Geomatica 2005, 59, 73–82. [Google Scholar]
- Shan, Z.; Han, H.; Jiang, K. Optimization model of GNSS/pseudolites structure design for open-pit mine positioning. Trans. Nonfer. Met. Soc. China 2013, 23, 2201–2208. [Google Scholar] [CrossRef]
- Dick, G.J.; Eberhardt, E.; Cabrejo-Liévano, A.G.; Stead, D.; Rose, N.D. Development of an early-warning time-of-failure analysis methodology for open-pit mine slopes utilizing ground-based slope stability radar monitoring data. Can. Geotech. J. 2015, 52, 515–529. [Google Scholar] [CrossRef]
- Poyraz, B.; Yavuz, G.; Poyraz, F. Evaluation of the monitoring of surface deformations in open-pit mines with Sentinel-1A satellite radar data. J. Sci. Rep. A 2023, 54, 194–211. [Google Scholar] [CrossRef]
- Gama, F.F.; Cantone, A.; Mura, J.C. Monitoring horizontal and vertical components of SAMARCO mine dikes deformations by DInSAR-SBAS using TerraSAR-X and Sentinel-1 Data. Mining 2022, 2, 725–745. [Google Scholar] [CrossRef]
- Du, S.; Wang, Y.; Zheng, M.; Zhou, D.; Xia, Y. Goaf locating based on InSAR and probability integration method. Remote Sens. 2019, 11, 812. [Google Scholar] [CrossRef]
- Xia, Y.; Wang, Y. InSAR and PIM based inclined goaf determination for illegal mining detection. Remote Sens. 2020, 12, 3884. [Google Scholar] [CrossRef]
- Wu, P.C.; Wei, M.; D’Hondt, S. Subsidence in coastal cities throughout the world observed by InSAR. Geophys. Res. Lett. 2022, 49, e2022GL098477. [Google Scholar] [CrossRef]
- Henderson, S.; Pritchard, M. Decadal volcanic deformation in the Central Andes Volcanic Zone revealed by InSAR time series. Geochem. Geophys. Geosys. 2013, 14, 1358–1374. [Google Scholar] [CrossRef]
- Zhang, X.; Feng, M.; Zhang, H.; Wang, C.; Tang, Y.; Xu, J.; Yan, D.; Wang, C. Detecting rock glacier displacement in the central himalayas using multi-temporal InSAR. Remote Sens. 2021, 13, 4738. [Google Scholar] [CrossRef]
- Jarosz, A.; Zahiri, H. Interferometric synthetic aperture radar (InSAR) and its potential to monitor subsidence over caving zones induced by underground mining. Future Min. 2008, 143–149. [Google Scholar]
- Yang, F.; Shao, Y.; Ma, G. Application research of InSAR technology used to monitor the slope deformation in Haizhou open-pit mine. Sci. Surv. Mapp. 2009, 34, 56–58. [Google Scholar]
- He, X.; Gao, Z.; Xiao, R.; Luo, H.; Jia, D.; Zhang, Z. Application and prospect of the integration of InSAR and BDS/GNSS for land surface deformation monitoring. Acta Geod. Cartogr. Sin. 2022, 51, 1338. [Google Scholar]
- Yan, S.; Ruan, Z.; Liu, G.; Deng, K.; Lv, M.; Perski, Z. Deriving ice motion patterns in mountainous regions by integrating the intensity-based pixel-tracking and phase-based D-InSAR and MAI approaches: A case study of the Chongce glacier. Remote Sens. 2016, 8, 611. [Google Scholar] [CrossRef]
- Ferretti, A.; Prati, C.; Rocca, F. Nonlinear subsidence rate estimation using permanent scatterers in differential SAR interferometry. IEEE Trans. Geosci. Remote Sens. 2000, 38, 2202–2212. [Google Scholar] [CrossRef]
- Khoshlahjeh Azar, M.; Hamedpour, A.; Maghsoudi, Y.; Perissin, D. Analysis of the deformation behavior and sinkhole risk in Kerdabad, Iran using the PS-InSAR method. Remote Sens. 2021, 13, 2696. [Google Scholar] [CrossRef]
- Berardino, P.; Fornaro, G.; Lanari, R.; Sansosti, E. A new algorithm for surface deformation monitoring based on small baseline differential SAR interferograms. IEEE Trans. Geosci. Remote Sens. 2002, 40, 2375–2383. [Google Scholar] [CrossRef]
- Zhao, R.; Li, Z.; Feng, G.; Wang, Q.; Hu, J. Monitoring surface deformation over permafrost with an improved SBAS-InSAR algorithm: With emphasis on climatic factors modeling. Remote Sens. Environ. 2016, 184, 276–287. [Google Scholar] [CrossRef]
- Cao, N.; Lee, H.; Jung, H.C. Mathematical framework for phase-triangulation algorithms in distributed-scatterer interferometry. IEEE Geosci. Remote Sens. Lett. 2015, 12, 1838–1842. [Google Scholar]
- Du, Y.; Yan, S.; Yang, H.; Jiang, J.; Zhao, F. Investigation of deformation patterns by DS-InSAR in a coal resource-exhausted region with Spaceborne SAR imagery. J. Asian Earth Sci. X 2021, 5, 100049. [Google Scholar] [CrossRef]
- Zhao, C.; Li, Z.; Tian, B.; Zhang, P.; Chen, Q. A ground surface deformation monitoring InSAR method using improved distributed scatterers phase estimation. IEEE J. Sel. Top. Appl. Earth Obs. Remote Sens. 2019, 12, 4543–4553. [Google Scholar] [CrossRef]
- Li, M.; Zhang, S.; Gao, Y. Optimized DS-InSAR technology for time series deformation monitoring in open-pit mines. Met. Mine 2023, 1, 110–118. [Google Scholar]
- Ding, L.; Cai, X.; Liu, L.; Ma, L.; Zhou, W. Effect of weak interlayer on slope stability of open-pit mine. Met. Mine 2012, 4, 40–42. [Google Scholar]
- Zhan, Q.; Sun, X.; Li, C.; Zhao, Y.; Zhou, X.; He, Y.; Zhang, Y. Stability analysis and reinforcement of a high-steep rock slope with faults: Numerical analysis and field monitoring. Adv. Civ. Eng. 2019, 2019, 3732982. [Google Scholar] [CrossRef]
- Wang, X.; Guan, X.; Wang, X.; Zhang, p.; Yue, P. Study on stability of open-pit mine slope and sensitivity of rock mass parameters. J. China Coal Soc. 2011, 36, 1806–1811. [Google Scholar]
- Xing, Z.; Peng, S.; Du, W.; He, Y.; Chong, S.; Feng, F.; Yu, P.; She, C.; Xu, D. Hydrogeological changes caused by opencast coal mining in steppe zone: A case study of Shengli 1 open-pit coal mine. Desalin. Water Treat. 2018, 121, 126–133. [Google Scholar] [CrossRef]
- Pathan, S.M.; Pathan, A.G.; Siddiqui, F.I.; Memon, M.B.; Soomro, M.H.A.A. Open pit slope stability analysis in soft rock formations at Thar Coalfield Pakistan. Arch. Min. Sci. 2022, 67, 437–454. [Google Scholar]
- Jiang, S.; Li, J.; Zhang, S.; Gu, Q.; Lu, C.; Liu, H. Landslide risk prediction by using GBRT algorithm: Application of artificial intelligence in disaster prevention of energy mining. Process Saf. Environ. Prot. 2022, 166, 384–392. [Google Scholar] [CrossRef]
- Jiang, N.; Zhou, C.; Lu, S.; Zhang, Z. Propagation and prediction of blasting vibration on slope in an open pit during underground mining. Tunn. Undergr. Space Technol. 2017, 70, 409–421. [Google Scholar] [CrossRef]
- Guo, H.; Gong, C. Study on stability relationship of slope under different cross section forms in Heishan Open-pit Mine. Opencast Min. Technol. 2023, 38, 56–60. [Google Scholar]
- Mura, J.C.; Paradella, W.R.; Gama, F.F.; Silva, G.G.; Galo, M.; Camargo, P.O.; Silva, A.Q.; Silva, A. Monitoring of non-linear ground movement in an open pit iron mine based on an integration of advanced DInSAR techniques using TerraSAR-X data. Remote Sens. 2016, 8, 409. [Google Scholar] [CrossRef]
- Yang, T.; Zhang, F.; Yu, Q.; Cai, M.; Li, H. Research situation of open-pit mining high and steep slope stability and its developing trend. Rock Soil Mech. 2011, 32, 1437–1451. [Google Scholar]
- Ministry of Emergency Management of the People’s Republic of China. Available online: https://www.mem.gov.cn (accessed on 29 August 2023).
- Wu, H.; Zhang, Y.; Kang, Y.; Wei, J.; Liu, Y.; Li, B. Fine Mapping of Surface Deformation in Xinjing Open-Pit Mine, Inner Mongolia Using FS-InSAR Technique; Geomatics and Information Science of Wuhan University: Wuhan, China, 2023. [Google Scholar]
- An, B.; Wang, C.; Liu, C.; Li, P. A multi-source remote sensing satellite view of the February 22nd Xinjing landslide in the mining area of Alxa left Banner, China. Landslides 2023, 20, 2517–2523. [Google Scholar] [CrossRef]
- Natural Resources Satellite Remote Sensing Service Cloud Platform. Available online: https://www.sasclouds.com (accessed on 2 March 2023).
- Canadian Space Agency. Available online: https://www.asc-csa.gc.ca/eng (accessed on 2 March 2023).
- Alaska Satellite Facility (ASF). Available online: Https://www.asf.alaska.edu (accessed on 2 May 2023).
- Wang, T.; Zhao, F.; Wang, Y.; Zhang, N.; Zhou, D.; Diao, X.; Zhao, X. An Algorithm for Locating Subcritical Underground Goaf Based on InSAR Technique and Improved Probability Integral Model. IEEE Trans. Geosci. Remote Sens. 2023, 61, 1–14. [Google Scholar] [CrossRef]
- Fan, H.; Deng, K.; Ju, C.; Zhu, C.; Xue, J. Land subsidence monitoring by D-InSAR technique. Min. Sci. Technol. 2011, 21, 869–872. [Google Scholar] [CrossRef]
- Chen, Y.; Li, J.; Li, H.; Gao, Y.; Li, S.; Chen, S.; Guo, G.; Wang, F.; Zhao, D.; Zhang, K.; et al. Revealing land surface deformation over the Yineng Backfilling Mining Area, China, by integrating Distributed Scatterer SAR Interferometry (DS InSAR) and a Mining Subsidence Model. IEEE J. Sel. Top. Appl. Earth Obs. Remote Sens. 2023, 16, 3611–3634. [Google Scholar] [CrossRef]
- Li, T.; Zhang, H.; Fan, H.; Zheng, C.; Liu, J. Position inversion of goafs in deep coal seams based on DS-InSAR data and the probability integral methods. Remote Sens. 2021, 13, 2898. [Google Scholar] [CrossRef]
- Jiang, M.; Ding, X.; Hanssen, R.F.; Malhotra, R.; Chang, L. Fast statistically homogeneous pixel selection for covariance matrix estimation for multitemporal InSAR. IEEE Trans. Geosci. Remote Sens. 2014, 53, 1213–1224. [Google Scholar] [CrossRef]
- Peng, K.; Zhao, F.; Wang, Y.; Yan, S.; Feng, H. DS-InSAR phase optimization based on singular value decomposition. Natl. Remote Sens. Bull. 2023, 27, 533–542. [Google Scholar] [CrossRef]
- Wang, Z. Landslide Remote Sensing; Science Press: Beijing, China, 2012; pp. 97–110. [Google Scholar]
- Cai, M.; Heng, M.; Liu, D. Rock Mechanics and Engineering; Science Press: Beijing, China, 2013; pp. 362–371. [Google Scholar]
- Yang, T.; Wang, H.; Dong, X.; Liu, F.; Zhang, P.; Deng, W. Current situation, problems and countermeasures of intelligent evaluation of slope stability in open pit. J. China Coal Soc. 2020, 45, 2277–2295. [Google Scholar]
- Intrieri, E.; Carlà, T.; Farina, P.; Bardi, F.; Ketizmen, H.; Casagli, N. Satellite interferometry as a tool for early warning and aiding decision making in an open-pit mine. IEEE J. Sel. Top. Appl. Earth Obs. Remote Sens. 2019, 12, 5248–5258. [Google Scholar] [CrossRef]
- China Meteorological Administration. Available online: https://www.cma.gov.cn/ (accessed on 28 February 2023).
- Xie, H.; Pan, Y.; Luan, J.; Yang, X.; Xi, Y. Open-pit mining area segmentation of remote sensing images based on DUSegNet. J. Indian Soc. Remote Sens. 2021, 49, 1257–1270. [Google Scholar] [CrossRef]
- Chen, T.; Hu, N.; Niu, R.; Zhen, N.; Plaza, A. Object-oriented open-pit mine mapping using Gaofen-2 satellite image and convolutional neural network, for the Yuzhou City, China. Remote Sens. 2020, 12, 3895. [Google Scholar] [CrossRef]
- Moon, J.; Lee, H. Analysis of activity in an open-pit mine by using InSAR coherence-based normalized difference activity index. Remote Sens. 2021, 13, 1861. [Google Scholar] [CrossRef]
- Hartwig, M.E.; Paradella, W.R.; Mura, J.C. Detection and monitoring of surface motions in active open pit Iron mine in the Amazon region, using persistent scatterer interferometry with TerraSAR-X satellite data. Remote Sens. 2013, 5, 4719–4734. [Google Scholar] [CrossRef]
- Hu, J.; Li, Z.; Ding, X.; Zhu, J.; Zhang, L.; Sun, Q. Resolving Three-dimensional Surface Displacements from InSAR measurements: A review. Earth-Sci. Rev. 2014, 133, 1–17. [Google Scholar] [CrossRef]


| Satellites | Incidence Angle () | Resolution (m) | Time | |
|---|---|---|---|---|
| Range | Azimuth | |||
| Radarsat-2 | 35.29 | 3 | 3 | 10 January 2023–3 February 2023 |
| Sentinel-1A | 39.12 | 2.3 | 13.9 | 7 January 2021–11 August 2022 |
Disclaimer/Publisher’s Note: The statements, opinions and data contained in all publications are solely those of the individual author(s) and contributor(s) and not of MDPI and/or the editor(s). MDPI and/or the editor(s) disclaim responsibility for any injury to people or property resulting from any ideas, methods, instructions or products referred to in the content. |
© 2024 by the authors. Licensee MDPI, Basel, Switzerland. This article is an open access article distributed under the terms and conditions of the Creative Commons Attribution (CC BY) license (https://creativecommons.org/licenses/by/4.0/).
Share and Cite
Zhang, N.; Wang, Y.; Zhao, F.; Wang, T.; Zhang, K.; Fan, H.; Zhou, D.; Zhang, L.; Yan, S.; Diao, X.; et al. Monitoring and Analysis of the Collapse at Xinjing Open-Pit Mine, Inner Mongolia, China, Using Multi-Source Remote Sensing. Remote Sens. 2024, 16, 993. https://doi.org/10.3390/rs16060993
Zhang N, Wang Y, Zhao F, Wang T, Zhang K, Fan H, Zhou D, Zhang L, Yan S, Diao X, et al. Monitoring and Analysis of the Collapse at Xinjing Open-Pit Mine, Inner Mongolia, China, Using Multi-Source Remote Sensing. Remote Sensing. 2024; 16(6):993. https://doi.org/10.3390/rs16060993
Chicago/Turabian StyleZhang, Nianbin, Yunjia Wang, Feng Zhao, Teng Wang, Kewei Zhang, Hongdong Fan, Dawei Zhou, Leixin Zhang, Shiyong Yan, Xinpeng Diao, and et al. 2024. "Monitoring and Analysis of the Collapse at Xinjing Open-Pit Mine, Inner Mongolia, China, Using Multi-Source Remote Sensing" Remote Sensing 16, no. 6: 993. https://doi.org/10.3390/rs16060993