
Analysis of the Deformation Behavior and Sinkhole Risk in Kerdabad, Iran Using the PS-InSAR Method


1
Photogrammetry and Remote Sensing Department, Geomatics Engineering Faculty, K.N. Toosi University of Technology, Tehran 15433-19967, Iran
2
Faculty of Environmental and Forest Sciences, Agricultural University of Iceland, Hvanneyri, IS-311 Borgarnes, Iceland
3
Svarmi, Data Company Specialized in Remote Sensing and Drones, Árleyni 22, IS-112 Reykjavík, Iceland
4
COMET, School of Earth and Environment, University of Leeds, Leeds LS2 9JT, UK
5
RASER Limited, Radar and Software Engineering Research Company, 9 Wing Hong St, Cheung Sha Wan, Hong Kong, China
*
Author to whom correspondence should be addressed.
Remote Sens. 2021, 13(14), 2696; https://doi.org/10.3390/rs13142696
Submission received: 8 May 2021
/
Revised: 26 June 2021
/
Accepted: 29 June 2021
/
Published: 8 July 2021
(This article belongs to the Special Issue InSAR Monitoring of Slow Steady-State and Episodic Ground Surface Displacements)
Abstract
:The unexpected collapse of land surface due to subsidence is one of the most significant geohazards that threatens human life and infrastructure. Kabudrahang and Famenin are two Iranian plains experiencing several sinkholes due to the characteristics of the underground soil layers and extreme groundwater depletion. In this study, space-based Synthetic Aperture Radar images are used to investigate the ground displacement behavior to examine the feasibility of Sentinel-1 data in detecting precursory deformation proceeding before the sinkhole formation. The selected sinkhole occurred in August 2018 in the vicinity of Kerdabad village in Hamedan province with a 40 m diameter and depth of ~40 m. Time series of the European constellation Sentinel-1 data, spanning from January 2015 to August 2018, is analyzed, and the results revealed a 3 cm annual subsidence (–3 cm/year) along with the line-of-sight direction. Time-series analysis demonstrated that the driving mechanism of the sinkhole formation had a gradual process. Displacement of persistent scatterers (PSs) near the cave area had an acceleration by approaching the sinkhole formation date. In contrast, other areas that are far from the cave area show linear subsidence behavior over time. Additionally, the one-kilometer deformation profile over the cave area indicates a high subsidence rate precisely at the location where the sinkhole was formed later on 20 August 2018.
1. Introduction
Collapsing of the surface layer that is mainly caused by karst processes [1], chemical dissolution of carbonate rocks [2], or suffusion processes [3] are the primary catalysts of sinkhole formation. From a geohazard point of view, a sinkhole, according to its potential risks and unpredictability, can pose significant hazards for people, properties, and agricultural activities [4]. Different factors, such as karst processes and overexploitation of groundwater, can make the ground susceptible to a sinkhole.
Dissolution of soluble minerals such as halite, anhydrite, gypsum, calcite, and dolomite has been identified as the major reason for karst formation. Gypsum is several times more soluble than carbonate rocks [5]. Therefore, karst in gypsum rocks evolves at a faster pace and often causes severe problems to the built environment, frequently fostered by anthropogenic effects [6]. Overexploitation of groundwater creates small inner cavities, and penetration of surface water into the subsurface layers, which is a result of high solubility, is another main reason for sinkhole formation [7].
According to different perspectives regarding geological properties and the formation rate, sinkholes are classified into various categories [8]. In the areas with limestone outcrops, surface water, e.g., rainwater, runoffs, and stagnant water, are conducted to the dissolution channel, leading to rock dissolution, then causing the solution sinkhole, which is a type of sinkhole that propagates slowly over time [9]. Soluble sediments remain on the limestone and form cavities termed cover collapse sinkholes. These kinds of sinkholes are formed by the percolated rainwater and other surface waters through the porous alluvial media on the solvent channels.
In cohesive sediments, the formed sinkhole might expand to the point that the roof collapses [10]; these cavities are called cover collapse sinkholes. Bowl, funnel-shaped, and cylindrical cavities are the result of a sudden rupture of cover collapse sinkholes. These types of sinkholes are filled in several ways and form buried sinkholes [11]. Collapse and sagging sinkholes fall into a more general category of subsidence sinkholes [12]. Various anthropogenic activities such as mining or non-standard tunnel boring may also cause other types of sinkholes.
Sinkhole formation and its subsequent impacts on infrastructures and human life are among the most remarkable geohazards; thus, adopting appropriate methodologies is highly recommended to identify, study, and predict stages of sinkhole occurrence. Practically, sinkhole studies are divided into two categories: surface and subsurface investigations [13]. The subsurface studies include speleological explorations, geophysical prospecting (such as electrical resistivity, electromagnetic conductivity, ground-penetrating radar, microgravimetry, and cross-hole tomography), probing and drilling, trenching, and hydrogeological investigations [13]. On the other hand, surface studies consist of several methods, including field studies, questionnaire surveys, aerial and satellite imagery, topographic information, and leveling. These geomatic applications are a good demonstration of the capability of geomatics in surface deformation analysis. One of the promising ways to study surface displacement is to use RADAR remote sensing imagery [14]. The most significant advantage of SAR is the daylight and weather independence of RADAR waves, enabling the monitoring of the Earth’s surface independent of sunlight, weather, or cloud-cover conditions [15]. There are many applications of radar remote sensing, but one of the most widespread is the PS-InSAR method, which allows researchers to analyze and assess land deformation at a millimetric level.
In recent years, a large number of studies have been conducted on sinkholes. Determining the relationship between gradual subsidence and sinkhole formation in the Dead sea coastline using radar imagery and optical data [16,17,18]; determining the amount of land displacement in the Ebro river basin of Spain caused by different factors such as sinkhole, landslide, and mining [19,20]; studying the Ebru valley railway in the northwest that is prone to active sinkholes using InSAR and GB-InSAR [21,22]; and detection of cavity migration and sinkhole risk in the Heerlen shopping mall incident in the Netherlands [23] are noteworthy studies which can be mentioned in this field. Moreover, notable studies have utilized various sensors and platforms, including thermal images [24] and UAV SAR images [25] in sinkhole identification. Such studies have been conducted in various countries, such as Italy [26,27], Israel [28,29,30,31,32,33,34], South Africa [35], the USA [36,37,38,39,40,41], Turkey [42,43], and Jordan [34,44].
Most plains in Iran, including those in Kabudrahang, Famenin, Eij, Rafsanjan, Moein Abad, and Isfahan, are prone to subsidence and sinkhole formation because of the geological characteristics of the soil horizons and bedrock [45,46,47,48]. The sinkhole near the Kerdabad village of Hamedan, formed in July 2018, and the one in Eij plain Fars province, formed in November 2015, are the most remarkable examples of sinkholes in Iran in recent years. The bedrock in Kabudrahang and Famenin plains is mainly made of gypsum, leading to favorable conditions for sinkhole formation [49]. In recent years, it has been reported that sinkhole formations have caused worries for local populations, which in some cases have even resulted in forced migrations.
This study aims to use the PS-InSAR method to investigate and assess the displacement behavior of the land before sinkhole formation in the Kerdabad region and demonstrate the feasibility of the Sentinel-1 images in detecting precursors before sinkhole formation. We assume that precursory deformation may occur before sinkhole formation, so we have exploited the SAR data archive before the sinkhole formation date. Several factors have made the study of displacement behavior in small areas challenging, such as sinkholes with radar images and InSAR techniques. These problems include low spatial resolution (for Sentinel-1 ~ 20 × 5 m) and extensive vegetation coverage in the sinkhole area, which leads to the limitation of PS selection in the low coherence area. Additionally, due to the lack of prior knowledge and unpredictable location of the cave, we need to examine the spatial deformation behavior in a sizeable area. For this purpose, the Sentinel-1 time-series data and the spatiotemporal deformation behavior have been investigated.
2. Study Area and Geological Setting
The study area is located in the northeast of Hamedan and approximately encompasses the area between longitudes 48°44′ to 48°49′ E and latitudes of 35°5′ to 35°9′ N WGS84 (Figure 1). The area is confined to Kabudrahang, Razan, and Ghahavand plains from northern, northeastern, and southeastern parts, respectively. This region is a smooth plain having an overall north-to-south slope that is intersected by the Hamedan-Tehran Road, on the side where the Mofatteh power plant is located. The Kabudrahang and Famenin are two adjacent plains, covering 1348 and 800 square kilometers, respectively, considered the lowest plains topographically in the semi-arid Hamadan state in west Iran, facing groundwater depletion and sinkhole formation [50].
Hamedan state consists of the central plains of Kabudrahang, Razan, Famenin, Ghahavand-Komijan, Hamedan Bahar, and Markazi plains. The Kabudrahang and Famenin plains are located on the northern border of the Sanandaj–Sirjan zone and the northern part of the central Zagros thrust belt [51]. On the surface of outcrops or heights adjacent to Kabudrahang and Famenin plains, faults are described as follows (see Figure 1a):
- Faults located in the highlands of Pashalu mountain, situated in the northeast of the area with a generally east–west direction with a length of 3 to 28 km.
- Faults located in the Achini mountain highlands with a general north–south direction of 5 to 20 km.
- Potential buried faults of the Kabudrahang-Famenin plains having a general west–southeast direction of 25 km.
Drillings in the Famenin and Kabudrahang fields show that the bedrock is made from Oligo-Miocene limestone, and the karst structure is predominant [52]; the bedrock in the area is highly prone to dissolving. Additionally, a significant amount of dissolved free carbon dioxide has been detected in the wells, representing a high CO2 pressure associated with the wells [52,53]. Investigating the gathered information and samples taken from Ghahavand and Famenin reveals that underground water containing CO2 gas has impacted the region’s bedrock by creating cavities, flaws, and cracks through dissolving a high proportion of available calcium carbonate [53]. The transformation process into karst happened inside the bedrock so that its porosity is about 20 to 25% [54].
The sinkhole studied in this research was formed in the last days of August 2018. It is worth mentioning that the occurrence date is remarkable, especially when there is a strong relationship between the groundwater level and land subsidence or sinkhole formation during summers [39]. In addition, overexploitation influences water levels in different seasons, and proportionally, most sinkholes can be found near wells excavated on limestone bedrock [51]. One of the major sources of water withdrawal in the area is the Mofatteh power plant situated on the Hamedan-Tehran Road, located in the southeastern part of the plain since 1994. It should be noted that the active power plant in the study area requires water for cooling and steam turbine; for this purpose, 50 wells with a depth of 80 to 120 m in the southeastern part of the power plant were drilled [55]. Deep wells with a pumping rate of 500 l/s have significantly lowered the underground water level of the southern and eastern regions of the Mofatteh power plant. Statistics indicate an average consumption of 15 million cubic meters of water for the power plant, so that in this area, the water drop in nine years (1992 to 2001) was about 50 m [52]. Sinkholes in the state of Hamedan consist of 50% subsidence, 43% collapse, and 7% solution sinkholes [56]. In total, most of the sinkholes in the Kabudrahang and Famenin plains are subsidence and cover sinkholes [56].
The sinkhole under analysis in this research is a subsidence sinkhole located 2 km southeast of Kerdabad, Hamedan, and was formed on 22 August 2018. The Kerdabad region’s bedrock is made of carbonate, and the sinkhole is formed by the rupture of the soil on the lower karst limestone. The solubility of calcium carbonate in solutions containing carbon dioxide is an essential factor in the dissolution of carbonate bedrock. Moreover, since the bedrock of Kerdabad is karst, this sinkhole is formed with a depth and width of 40 m (Figure 1 depicts the location of the study area). Characteristics of major sinkholes in the Hamedan state are presented in Table 1.
3. Materials and Methods
We acquired 76 Sentinel-1 images, all in ascending direction. Processing of all the images (76 SLC images) leads to a decrease in the amplitude dispersion index value and a low value of ADI, which causes a reduction in the PSs density or complete loss of PSs in the cave area. So, all images were divided into two groups, the first group represents the images taken from January 2015 to December 2016, and the second group includes the period of January 2017 to August 2018. Therefore, the reason for dividing the database into two separate groups is to process fewer dataset images to obtain PS candidates with high ADI values in the cave area. In addition, the overlap of the two groups has been considered to compare their displacements during the same months; therefore, both groups start from January. Additionally, the data of the second group is closer to the date of sinkhole formation (see Table 2). In the first instance, using a co-registered stack total of 28 and 46, interferograms were generated from first- and second-group S-1A datasets using a star graph (see Figure 2).
The methodology implemented in this study is based on the standard PS-InSAR method [57]. This technique selects image pixels with excellent phase stability over the SAR data acquisitions period, called persistent or permanent scatterers (PS) [57], and measures surface deformation over months or years. These pixels have strong backscattering to the SAR sensor to generate a reliable deformation velocity map. The powerful PS-InSAR method overcomes the shortcomings of the conventional differential SAR interferometry (DInSAR) method and makes it possible to create a deformation time-series at millimeter precision. Thus, this is a suitable method for investigating ground displacement behavior over time because stable pixels (PSs) over time are features of sub-pixels that are not affected by temporal and spatial decorrelation [58].
The temporal and spatial separation of image pairs is called the temporal and spatial baseline, respectively. Using the baselines of each image, we can set the spatiotemporal space interferometric configuration to use for selecting the master image(s) and generation interferometric image pairs (interferograms) [59].
The master image is selected approximately in the middle of interferometric configuration to minimize the spatiotemporal decorrelation [60]. The chosen master image is used for co-registration of all SLC images (slave images) into the single master stack and formation of the high coherence interferograms [61]. Finally, by a single master configuration for N number of SAR acquisitions, we can generate N − 1 interferograms. Each pixel in the interferograms is made of several terms, which are the orbital phase, flat earth effect, and topography phase component that can simply be removed by orbital information, simulated phase image related to imaging geometry, and external digital elevation model, respectively. Finally, the remaining terms as in the following equation [58]
where the first term is the residual topographic phase due to external DEM inaccuracy (), the second indicates linear deformation velocity between acquisitions (), is the atmospheric phase effect, and denotes decorrelation errors such as baseline estimation error, temporal, and geometrical decorrelations. The other parameters are as follows:
- is the perpendicular baseline of the ith interferogram.
- is the slant range.
- denotes the temporal baseline of the ith interferogram.
- is the wavelength.
It can be observed that to estimate the deformation value, it is necessary to remove all other terms except the deformation term. For this reason, coherent pixels should be selected to overcome some shortcomings of conventional InSAR, detailed information of which can be found in [57]. As the atmosphere is correlated in the spatial domain, this term can be ignored in the adjacent pixels in the spatial graph [62].
The amplitude stability index (ASI), which corresponds to a dispersion of amplitude (DA), is used for selecting pixels that have a low phase standard deviation as PS candidates. This step can be implemented by thresholding on a reflectivity map or amplitude stability index map. A threshold of ~ DA < 0.25 (ASI > 0.75) is recommended by Ferretti et al. [57], but in different situations, other values may be chosen. The PSCs as nodes establish a spatial network using Delaunay triangulation [57], which can be used for estimating unknowns on the edges (between nodes) using the maximization of the periodogram function [58]. Then, using at least one pixel reference point on a non-deformed area integrates all the estimations to achieve the absolute value at each PSC. Later, based on spatially and temporally correlated components [62], the atmospheric phase can be roughly estimated. Then, increasing the number of PSCs can be obtained by a lower threshold of ASI, and the parameters are re-estimated for whole final PSs. Estimations are assessed through analyzing temporal coherence to obtain guaranteed results. Finally, the deformation values of the PS points are used to generate the velocity map.
In this study, SARPROZ software, which utilizes the standard PSI method, was used for estimating deformation in PS-InSAR [63]. The PS-InSAR approach has been selected instead of SBAS to gain acceptable numbers of PSs in the sinkhole area. The applied workflow of processing steps is shown in Figure 2.
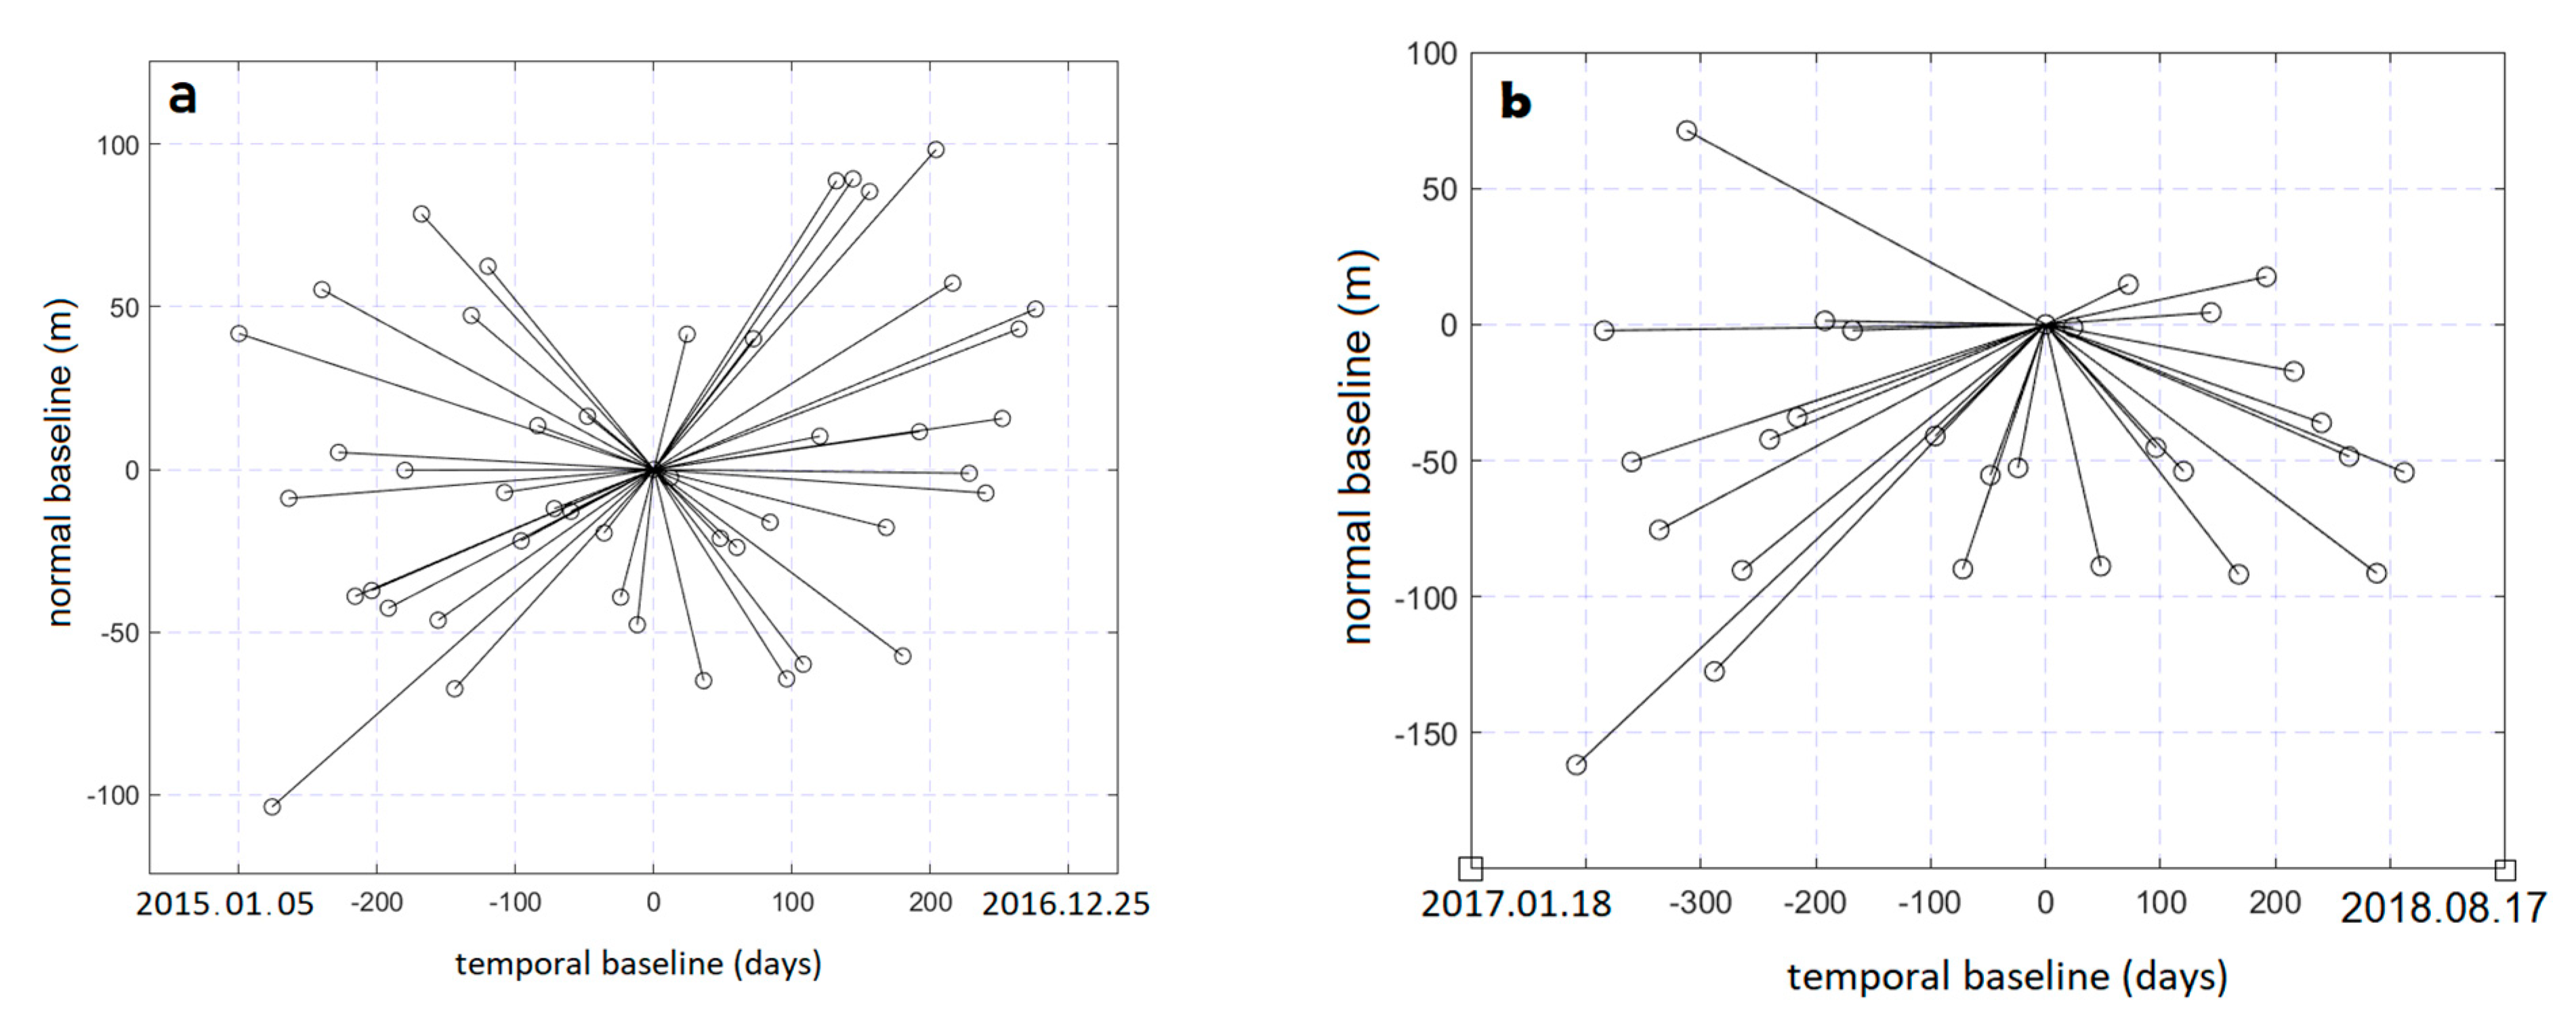
The mentioned PSInSAR method was implemented on ascending Sentinel-1 data in the IW imaging mode. In this study, the ground deformation trend was estimated using SARPROZ software [63]. The master image was selected based on the maximum correlation between temporal and spatial baseline and doppler centroid frequency for both groups [60]. First- and second-group slave images were co-registered concerning the master images acquired on 17 February 2016 and 14 November 2017, respectively. Using a single-master baseline configuration (star graph), which guarantees high coherence of whole interferograms, for the first and second groups, 28 and 46 interferograms were created, respectively (see Figure 3). For eliminating the main part of a topographic phase, the 1-arcsecond shuttle radar topography mission (SRTM) digital elevation model was used.
Figure 2.
Workflow of PSI processing in SARPROZ based on [64].
Figure 2.
Workflow of PSI processing in SARPROZ based on [64].

After removing the effect of the flat Earth and topographic phase, PS candidates were selected using the ASI criteria, and then the spatial network was formed by Delaunay triangulation. In our analysis, PS points were chosen to have a DA lower than 0.35 (ASI > 0.65). This resulted in 23712 PSC points for the first group and 24204 PSC points for the second group. The atmospheric phase component was estimated in the location of the PSCs, which were selected based on the ASI.
For each connection (edge) among points, the DEM error and amount of displacement via optimized periodogram function are estimated. A single reference point is taken based on the selected persistent scatterer candidates (PSCs), which are not affected by subsidence. The calculated parameters are subtracted from the observed interferometry phase, and only atmospheric effects and noise remained. Due to the atmospheric phase’s spatial correlation, applying a low pass filter will allow us to separate this term from noise. Finally, the deformation velocity of PSs was used to generate velocity deformation maps.
4. Results and Discussion
The linear model assumption was exerted for the first and second groups’ results to estimate the ground deformation and generate a displacement map. The velocity maps from the analyses are shown in Figure 4a,b. The displacement rates in the line of sight (LOS) direction were found in the range between −30 mm/year and +10 mm/year and −27 mm/year and +10 mm/year for groups 1 and 2, respectively. The annual velocity map indicates that we have the highest deformation at the southeast of the study area. The black circle represents the cave location (see Figure 4). As can be seen in the annual velocity map of the second group, the subsidence rate increases over time near the cave area (see Figure 4b).
In the following, several subjects, such as spatial and temporal deformation analysis, are explored. At the first step in Section 4.1, the deformation histogram velocities for the first and second groups are discussed. In the next part, spatiotemporal deformation analysis is investigated for both groups. Following this, to determine the uniqueness of the displacement behavior in the sinkhole prone area, the time-series behavior of the PSs on the cave region is compared with two other regions. Finally, the levels of piezometric wells and their relationship with the nearest PS time-series deformation are discussed in Section 4.4.
4.1. Progressive Subsidence
Velocity displacement maps for each group (first and second) reveal progressive subsidence in the study area. This can be determined by investigating peaks of histograms of PSs velocities (see Figure 5). One can conclude that the black curve, which is for the first group displacement rates (from 5 January 2015 to 25 December 2017), mostly includes displacements between +5 and −5 mm/year (histograms peak is in the range of zero deformation). In comparison, the second group’s diagram (red curves), which is drawn from 01/18/2017 to 08/17/2018, has tended to the left, including higher subsidence regions. This means the subsidence zone has increased in the area before sinkhole formation.
4.2. Investigating Temporal and Spatial Deformation Behavior of the Cave Area
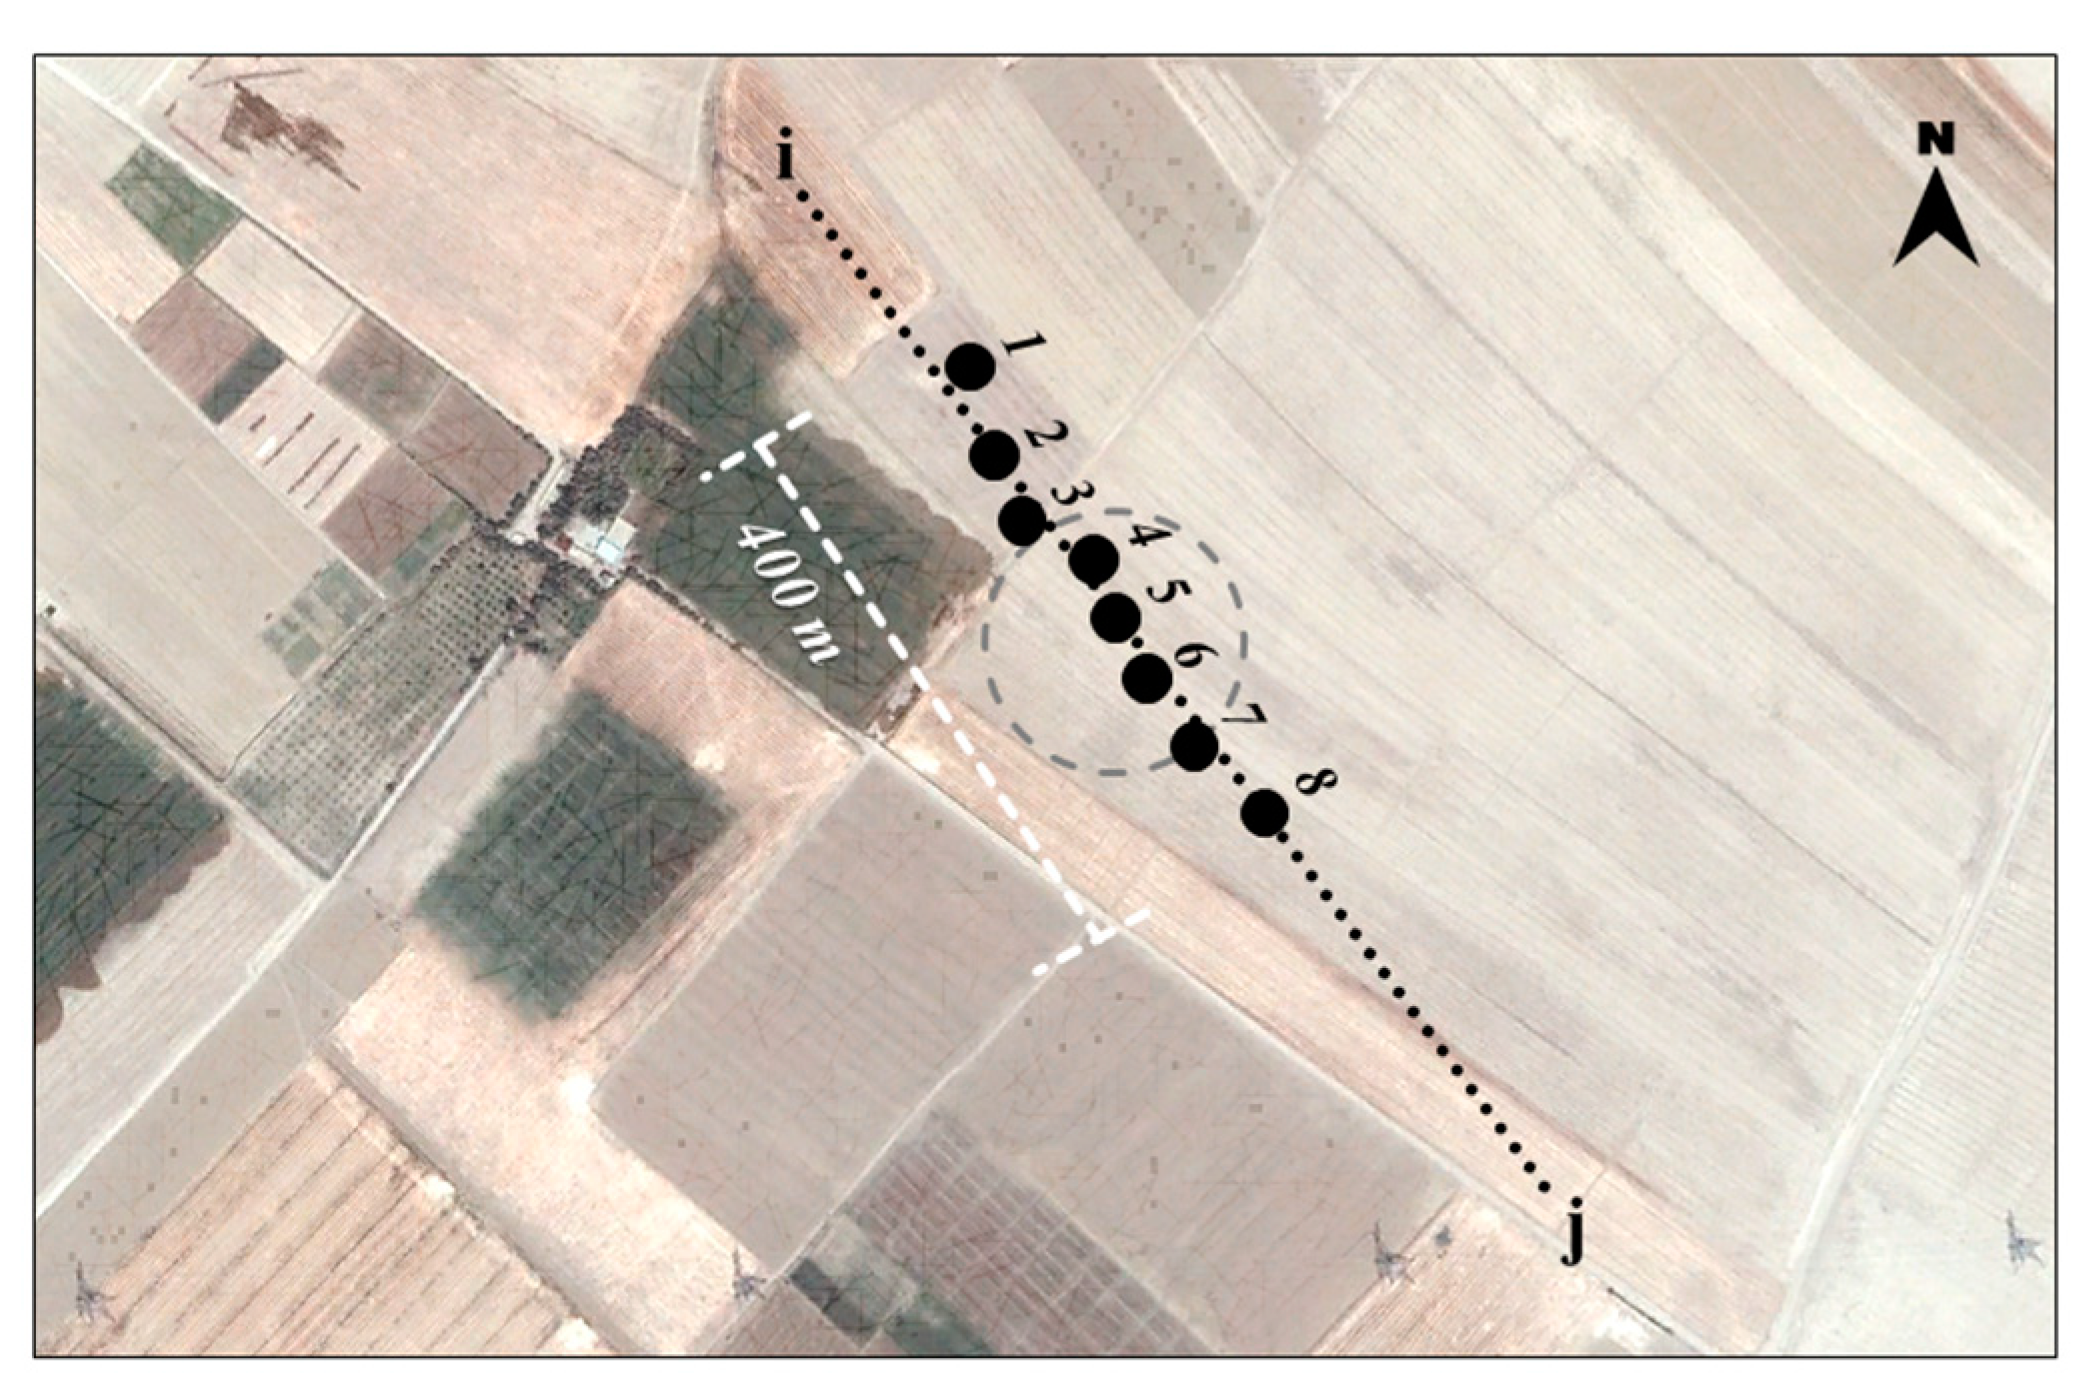
This section investigates the temporal and spatial behavior of ground deformation in the cave area. In this regard, sinkhole prone area PSs have to be selected and plot their time-series deformation trend. This leads to a better understanding of PSs temporal deformation behavior. Accordingly, eight PSs, which include boundaries inside and outside the cave area, were selected (see Figure 6).
Each PS diagram is divided into black and red parts (see Figure 7). Separation points for these diagrams are located on 26 March 2018 and 12 March 2016 for the second and first groups, respectively. To select the separation point, a third-order polynomial model was fitted, and its curvature is chosen as the separation point where the slope changes. Then, for showing their trends, each part of the diagram was interpolated with the linear method. As can be observed (Figure 7b), points outside the cave (the PSs number 1, 2, 3, 7, and 8) have the same slopes at each part of the diagrams (black and red). In other words, there is no difference in the interpolated displacement trend over time in the two parts. However, for the points inside the cave area (PSs number 4, 5, and 6), the second part of the diagram receives a steeper slope, which indicates a different behavior compared to prior sinkhole formation.
Additionally, the time-series deformation trend for the first group (January 2015 to December 2017) has been investigated. As shown (Figure 7a), there is no apparent change in the diagram slope at the black and red parts. For this part, the behavior observed in the PSs numbers 4, 5, and 6 have stable deformation behavior; consequently, the cave area is affected by deformation only before sinkhole formation (See Figure 7b, PSs numbers 4, 5, and 6).
Moreover, to study the local spatial deformation behavior over the cave area, a one-kilometer profile (ij dashed line in Figure 6) is drawn for the first and second groups (see Figure 8). According to Figure 8a, there is local subsidence of 40 mm in the sinkhole area for the second group (the displacement at the sinkhole’s area has increased), while for the first group (Figure 8b), the whole diagram fluctuated between +10 and −10 and there is no specific displacement behavior. In other words, the proximity of the near-sinkhole PSs shows homogeneously constant velocities and deformation trends (Figure 8b), but the deformation observed in sinkhole-prone land PSs shows a unique pattern similar to a sink (Figure 8a).
4.3. Comparison of the Displacement Behavior of the Cave Area with the Highest Subsidence Region and the Area Closest to the Cave
For investigating the temporal behavior in the second group (from January 2017 to August 2018), three regions were chosen (see Figure 9). The properties of regions are described in Table 3.
In each region, four PSs were chosen as representatives for the time-series displacement (Figure 10). Diagram depicts an increasing slope of trend only in the cave area (Figure 10b, region 2). As shown in Figure 10a,c, the trend slope at red and black colored parts are equal for regions 1 and 3, but the subsidence rate increases for the cave area at the red dots, which is close to the time of the collapse.
4.4. Deformation Behavior and Piezometric Wells
The groundwater level is one of the most critical factors influencing subsidence. Groundwater, due to its volume and pressure, can keep the substrates stable or cause instability. Accordingly, overexploitation leads to a disturbance in the underground layers.
The drop in the region’s water level due to overexploitation and subsequent compaction in the water table is the primary explanation for subsidence in this area. Excessive water withdrawal in the study area can be seen in the Khalatabad and Noabad piezometric wells (see Figure 11). As can be seen, the water level of the Khalatabad piezometric well has decreased sharply since 2013 and the Noabad piezometric well since 2007.
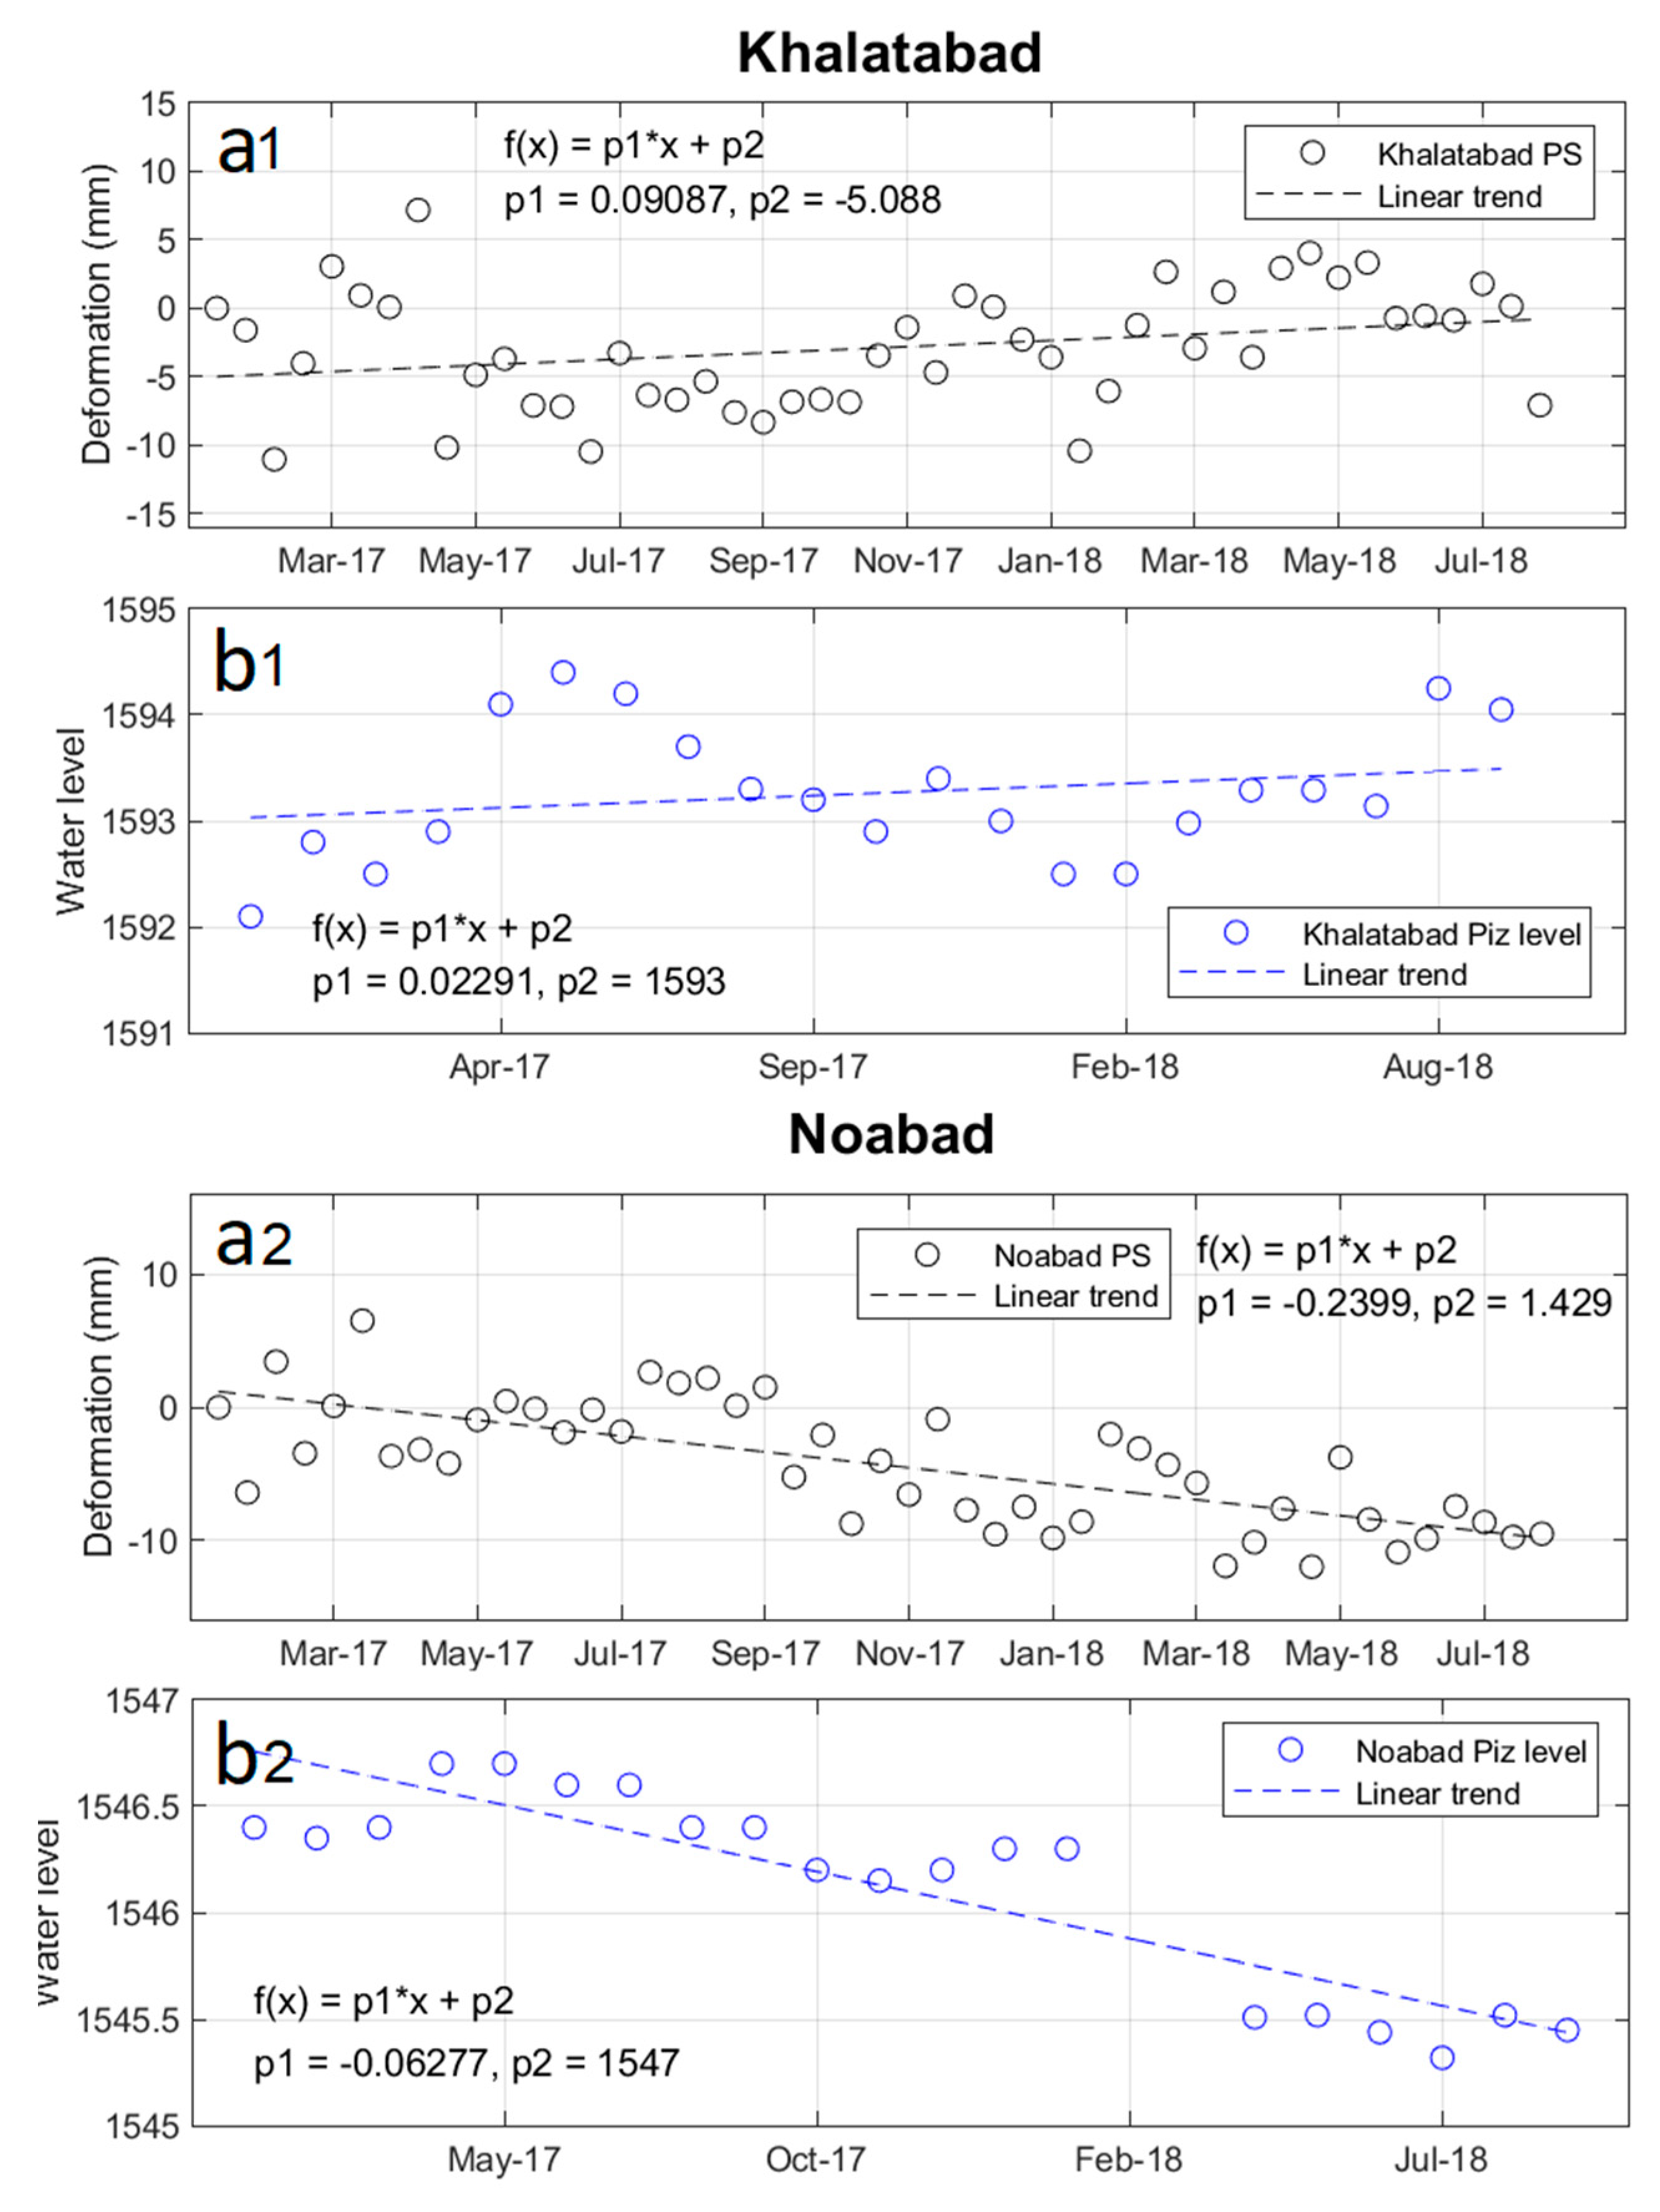
As can be observed in Figure 9, the Khalatabad and Noabad wells are the nearest ones to the deformation velocity map coverage, with a distance of 4 and 1.7 km from the cave, respectively (blue circles depict locations of these wells in Figure 9). According to PS deformation behavior near the Khalatabad well (see Figure 12, Khalatabad a1 and b1) and the water level fluctuations in the piezometric well, it can be seen that displacement changes in different sections are consistent with the piezometric water level fluctuations that are also true for Noabad well (Figure 12, Noabad a2 and b2). It should be noted that the break-in Noabad diagram is due to a lack of data. To summarize, taking a look at different parts of the diagram, one could note a proportional behavior between subsidence and piezometric changes in wells. To investigate this relationship quantitatively, the data have been interpolated using a linear model f(x) = p1*x + p2 (Figure 12), and the slope of each diagram can be expressed by the value of p1. As can be seen, there is a positive slope in the trend of the Khalatabad piezometric well, and this positive slope has revealed itself in the uplift of the time series. In contrast, in the Noabad well, the general trend is negative with the p1 value of −0.2399. Correspondingly, the time-series behavior of ground displacement shows it as the subsidence.
Groundwater level decline is one of the main causes of subsidence and sinkhole formation in this area. As shown in Figure 11, over a period of 20 years, there has been a severe decrease in water levels of 41 m for Khalatabad and 85 m for Hamedan. This is one of the causes of subsidence and sinkhole occurrence in the region. The empty karst spaces created by groundwater suction provide a large amount of room for sediment suffusion (see Figure 11, Khalatabad and Noabad stratigraphic columns), but it is not the only factor. The karst bedrock is covered with a thick overburden of soil and fine-grained sediments (alluvial deposits) to a depth of about 70 to 80 m. In this soil mass, due to the suction of sediments as a consequence of groundwater over-exploitation, a series of internal caves have been created. These caves, when the water table reaches the contact of sediment and karst, cause an imbalance of the retaining forces and initiate sinkhole formation. These factors must occur together, so there are many aquifers where groundwater levels declined, but no sinkholes have formed.
4.5. Uncertainty Assessment
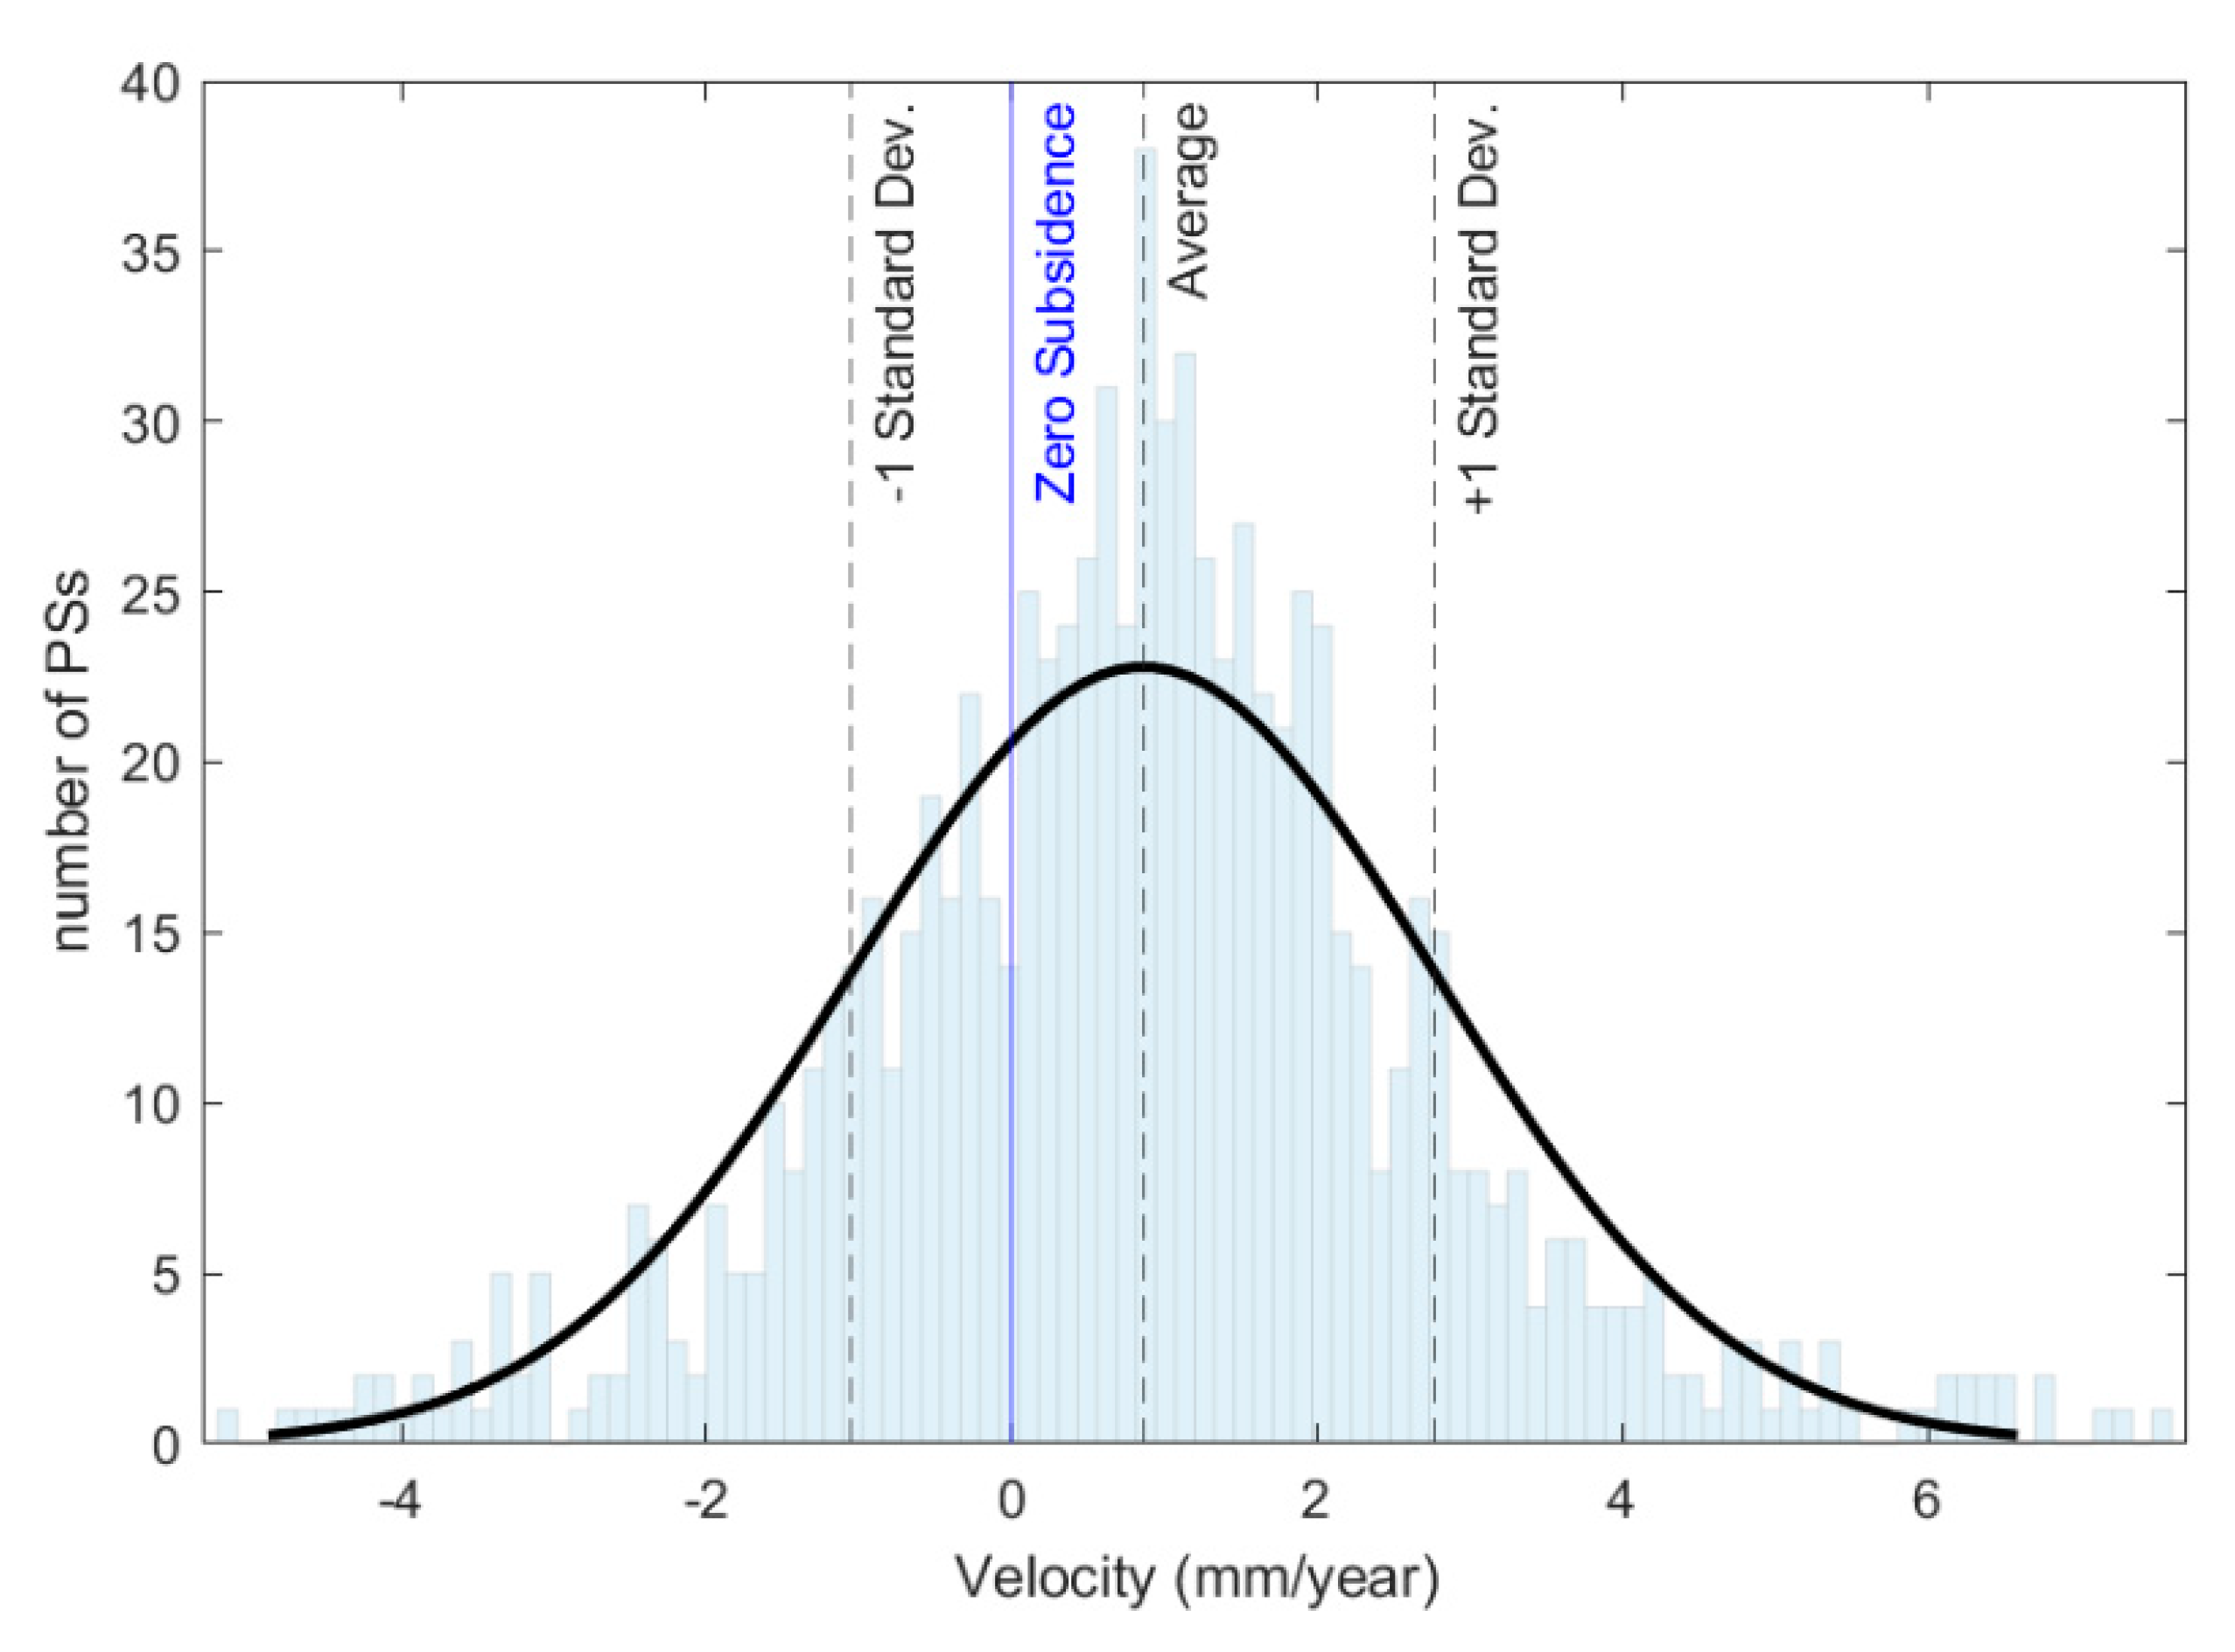
Due to the absence of a GPS station or leveling in the study area, it was impossible to evaluate our velocity and time series displacement against external observations. So, the spatial statistical uncertainty of the velocities was calculated to determine the error of the estimations. Assuming the PSs velocity of a selected region is zero (no displacement), the error of the velocity estimates in this non-subsided area is based on the Equations (2) and (3) [65].
where MEAN, STD, and N represent mean velocity values, the standard deviations of the velocities, and the number of PS points in the selected region, respectively.
The village of Vian in the southwest of the study area has little movement, so this area was chosen as a stable area without displacement. The average velocity is 0.85 mm/year, and 1778 points were selected in this area. Figure 13 shows the velocities histogram of this area. The error value calculated in this area based on Equations (2) and (3) is equal to 0.8 mm per year.
5. Conclusions
This research attempted to estimate the deformation of land prone to sinkholes using the PS-InSAR technique and to evaluate the feasibility of Sentinel-1 data in the detection of precursory signal before the sinkhole formation. The sinkhole formed on 22 August 2018 was selected for this purpose. We used the Sentinel-1 IW imaging mode data stack between 5 January 2015 and 17 August 2018 (a few days before sinkhole formation). The data were divided into two groups: (1) images that were taken between January 2015 and December 2016, and (2) images that were taken between January 2017 and August 2018. These groups were analyzed separately. In total, approximately −3 cm annual subsidence is observed on the entire period of the data stack.
By investigating and analyzing the temporal and spatial behavior of the cave area, a noteworthy deformation behavior before sinkhole formation was detected; i.e., a localized subsidence is observable exactly at the location where the sinkhole later formed on 20 August 2018. Additionally, the subsidence velocity of the PSs located on the cave was increased with time; therefore, local deformation can be detected before sinkhole formation. Time-series deformation behavior reveals steeper subsidence in the cave area at least three months before occurrence. According to the second data group results, three regions were chosen for further investigations. The results imply that noteworthy behavior and subsidence patterns can only be detected in the cave region. The analyses performed in this research detected precursors for small phenomena such as sinkholes. Additionally, the introduced method can be generalized to phenomena such as landslides, collapses, settlements, or any other phenomenon with gradual deformation. Since the studied sinkhole is located in the vicinity of a power plant, identifying the precursor helps design an early warning system for proper and timely management. However, the authors seek to use high-resolution SAR images in different bands (X and L bands) to find a more significant number of PSs for better analysis. Although the X-band provides a higher resolution, decorrelation effects due to vegetation are still the main limitations of the sinkhole study that make the retrieval of meaningful information more difficult. It is worth mentioning that the InSAR method only can study surface deformation, so other technologies and techniques must be used in the design of an EWS.
Author Contributions
Conceptualization, M.K.A. and A.H.; methodology, D.P. and M.K.A.; software, D.P.; validation, Y.M., M.K.A. and A.H.; formal analysis, M.K.A., A.H., Y.M. and D.P.; investigation, M.K.A.; resources, A.H.; writing—original draft preparation, M.K.A.; writing—review and editing, A.H., Y.M. and D.P.; visualization, M.K.A. and A.H.; supervision, Y.M. and D.P.; project administration, Y.M. and D.P. All authors have read and agreed to the published version of the manuscript.
Funding
This research received no external funding.
Data Availability Statement
Not applicable.
Acknowledgments
The authors acknowledge the European space agency (ESA) for providing Sentinel-1 data. Additionally, we acknowledge the Hamedan regional water authorities for sharing the piezometric well information and data.
Conflicts of Interest
The authors declare no conflict of interest.
References
- Gutiérrez, F. 13 Hazards associated with karst. In Geomorphological Hazards and Disaster Prevention; Cambridge University Press: Cambridge, UK, 2010; pp. 161–176. [Google Scholar] [CrossRef]
- Land, L.A.; Paull, C.K.; Hobson, B. Genesis of a submarine sinkhole without subaerial exposure: Straits of Florida. Geology 1995, 23, 949–951. [Google Scholar] [CrossRef]
- Waltham, T.; Waltham, A.C.; Bell, F.G.; Culshaw, M.G. Sinkholes and Subsidence: Karst and Cavernous Rocks in Engineering and Construction; Springer Science & Business Media: Berlin, Germany, 2005. [Google Scholar]
- Gutiérrez, F.; Parise, M.; De Waele, J.; Jourde, H. A review on natural and human-induced geohazards and impacts in karst. Earth Sci. Rev. 2014, 138, 61–88. [Google Scholar] [CrossRef]
- Benito, G.; Del Campo, P.P.; Gutiérrez-Elorza, M.; Sancho, C. Natural and human-induced sinkholes in gypsum terrain and associated environmental problems in NE Spain. Environ. Geol. 1995, 25, 156–164. [Google Scholar] [CrossRef]
- Cooper, A.H.; Gutiérrez, F. Dealing with Gypsum Karst Problems: Hazards, Environmental Issues and Planning; Elsevier: Amsterdam, The Netherlands, 2013. [Google Scholar]
- Stringfield, V.; LeGrand, H. Effects of karst features on circulation of water in carbonate rocks in coastal areas. J. Hydrol. 1971, 14, 139–157. [Google Scholar] [CrossRef]
- Culshaw, M.; Waltham, A. Natural and artificial cavities as ground engineering hazards. Q. J. Eng. Geol. Hydrogeol. 1987, 20, 139–150. [Google Scholar] [CrossRef]
- Ogden, A.E. Methods for describing and predicting the occurrence of sinkholes. In Proceedings of the First Multidisciplinary Conference on Sinkholes, Orlando, FL, USA, 15–17 October 1984; pp. 177–182. [Google Scholar]
- Quinlan, J.F. Legal aspects of sinkhole development and flooding in karst terranes: 1. Review and synthesis. Environ. Geol. Water Sci. 1986, 8, 41–61. [Google Scholar] [CrossRef]
- De Waele, J.; Gutiérrez, F.; Parise, M.; Plan, L. Geomorphology and natural hazards in karst areas: A review. Geomorphology 2011, 134, 1–8. [Google Scholar] [CrossRef]
- Kaufmann, G. Geophysical mapping of solution and collapse sinkholes. J. Appl. Geophys. 2014, 111, 271–288. [Google Scholar] [CrossRef]
- Gutierrez, F.; Cooper, A.H.; Johnson, K.S. Identification, prediction, and mitigation of sinkhole hazards in evaporite karst areas. Environ. Geol. 2008, 53, 1007–1022. [Google Scholar] [CrossRef] [Green Version]
- Theron, A.; Engelbrecht, J. The role of earth observation, with a focus on SAR Interferometry, for sinkhole hazard assessment. Remote Sens. 2018, 10, 1506. [Google Scholar] [CrossRef] [Green Version]
- Crosetto, M.; Monserrat, O.; Cuevas-González, M.; Devanthéry, N.; Crippa, B. Persistent scatterer interferometry: A review. ISPRS J. Photogramm. Remote Sens. 2016, 115, 78–89. [Google Scholar] [CrossRef] [Green Version]
- Atzori, S.; Baer, G.; Antonioli, A.; Salvi, S. InSAR-based modeling and analysis of sinkholes along the Dead Sea coastline. Geophys. Res. Lett. 2015, 42, 8383–8390. [Google Scholar] [CrossRef] [Green Version]
- Baer, G.; Magen, Y.; Nof, R.; Raz, E.; Lyakhovsky, V.; Shalev, E. InSAR measurements and viscoelastic modeling of sinkhole precursory subsidence: Implications for sinkhole formation, early warning, and sediment properties. J. Geophys. Res. Earth Surf. 2018, 123, 678–693. [Google Scholar] [CrossRef]
- Fiaschi, S.; Fabris, M.; Floris, M.; Achilli, V. Estimation of land subsidence in deltaic areas through differential SAR interferometry: The Po River Delta case study (Northeast Italy). Int. J. Remote Sens. 2018, 39, 8724–8745. [Google Scholar] [CrossRef]
- Castañeda, C.; Gutiérrez, F.; Manunta, M.; Galve, J.P. DInSAR measurements of ground deformation by sinkholes, mining subsidence, and landslides, Ebro River, Spain. Earth Surf. Process. Landf. 2009, 34, 1562–1574. [Google Scholar] [CrossRef] [Green Version]
- Gutiérrez, F.; Galve, J.P.; Lucha, P.; Castañeda, C.; Bonachea, J.; Guerrero, J. Integrating geomorphological mapping, trenching, InSAR and GPR for the identification and characterization of sinkholes: A review and application in the mantled evaporite karst of the Ebro Valley (NE Spain). Geomorphology 2011, 134, 144–156. [Google Scholar] [CrossRef] [Green Version]
- Galve, J.P.; Castañeda, C.; Gutiérrez, F. Railway deformation detected by DInSAR over active sinkholes in the Ebro Valley evaporite karst, Spain. Nat. Hazards Earth Syst. Sci. 2015, 15, 2439–2448. [Google Scholar] [CrossRef] [Green Version]
- Chang, L.; Hanssen, R.F. Detection of cavity migration and sinkhole risk using radar interferometric time series. Remote Sens. Environ. 2014, 147, 56–64. [Google Scholar] [CrossRef]
- Intrieri, E.; Gigli, G.; Nocentini, M.; Lombardi, L.; Mugnai, F.; Fidolini, F.; Casagli, N. Sinkhole monitoring and early warning: An experimental and successful GB-InSAR application. Geomorphology 2015, 241, 304–314. [Google Scholar] [CrossRef] [Green Version]
- Lee, E.J.; Shin, S.Y.; Ko, B.C.; Chang, C. Early sinkhole detection using a drone-based thermal camera and image processing. Infrared Phys. Technol. 2016, 78, 223–232. [Google Scholar] [CrossRef]
- Jones, C.E.; Blom, R.G. Bayou Corne, Louisiana, sinkhole: Precursory deformation measured by radar interferometry. Geology 2014, 42, 111–114. [Google Scholar] [CrossRef]
- Rosa, A.L.; Pagli, C.; Molli, G.; Casu, F.; Luca, C.D.; Pieroni, A.; D’Amato Avanzi, G. Growth of a sinkhole in a seismic zone of the northern Apennines (Italy). Nat. Hazards Earth Syst. Sci. 2018, 18, 2355–2366. [Google Scholar] [CrossRef] [Green Version]
- Busetti, A.; Calligaris, C.; Forte, E.; Areggi, G.; Mocnik, A.; Zini, L. Non-invasive methodological approach to detect and characterize high-risk sinkholes in urban cover evaporite karst: Integrated reflection seismics, PS-InSAR, leveling, 3D-GPR and ancillary data. A NE Italian case study. Remote Sens. 2020, 12, 3814. [Google Scholar] [CrossRef]
- Baer, G.; Schattner, U.; Wachs, D.; Sandwell, D.; Wdowinski, S.; Frydman, S. The lowest place on Earth is subsiding—An InSAR (interferometric synthetic aperture radar) perspective. Geol. Soc. Am. Bull. 2002, 114, 12–23. [Google Scholar] [CrossRef] [Green Version]
- Yechieli, Y.; Abelson, M.; Baer, G. Sinkhole formation and subsidence along the Dead Sea coast, Israel. Hydrogeol. J. 2016, 24, 601–612. [Google Scholar] [CrossRef]
- Abelson, M.; Baer, G.; Shtivelman, V.; Wachs, D.; Raz, E.; Crouvi, O.; Kurzon, I.; Yechieli, Y. Collapse-sinkholes and radar interferometry reveal neotectonics concealed within the Dead Sea basin. Geophys. Res. Lett. 2003, 30. [Google Scholar] [CrossRef]
- Abelson, M.; Yechieli, Y.; Baer, G.; Lapid, G.; Behar, N.; Calvo, R.; Rosensaft, M. Natural versus human control on subsurface salt dissolution and development of thousands of sinkholes along the Dead Sea coast. J. Geophys. Res. Earth Surf. 2017, 122, 1262–1277. [Google Scholar] [CrossRef]
- Nof, R.N.; Baer, G.; Ziv, A.; Raz, E.; Atzori, S.; Salvi, S. Sinkhole precursors along the Dead Sea, Israel, revealed by SAR interferometry. Geology 2013, 41, 1019–1022. [Google Scholar] [CrossRef]
- Nof, R.N.; Abelson, M.; Raz, E.; Magen, Y.; Atzori, S.; Salvi, S.; Baer, G. SAR interferometry for sinkhole early warning and susceptibility assessment along the Dead Sea, Israel. Remote Sens. 2019, 11, 89. [Google Scholar] [CrossRef] [Green Version]
- Closson, D.; Abou Karaki, N.; Klinger, Y.; Hussein, M.J. Subsidence and sinkhole hazard assessment in the southern Dead Sea area, Jordan. Pure Appl. Geophys. 2005, 162, 221–248. [Google Scholar] [CrossRef]
- Theron, A.; Engelbrecht, J.; Kemp, J.; Kleynhans, W.; Turnbull, T. Detection of sinkhole precursors through SAR interferometry: First results from South Africa. In Proceedings of the 2016 IEEE International Geoscience and Remote Sensing Symposium (IGARSS), Beijing, China, 10–15 July 2016; pp. 5398–5401. [Google Scholar]
- Al-Fares, R.A. The Utility of Synthetic Aperture Radar (SAR) interferometry in monitoring sinkhole subsidence: Subsidence of the Devil’s Throat Sinkhole Area (Nevada, USA). In Sinkholes and the Engineering and Environmental Impacts of Karst; American Society of Civil Engineers: Reston, VA, USA, 2005; pp. 541–547. [Google Scholar]
- Paine, J.G.; Buckley, S.M.; Collins, E.W.; Wilson, C.R. Assessing collapse risk in evaporite sinkhole-prone areas using microgravimetry and radar interferometry. J. Environ. Eng. Geophys. 2012, 17, 75–87. [Google Scholar] [CrossRef] [Green Version]
- Shi, Y.; Tang, Y.; Lu, Z.; Kim, J.-W.; Peng, J. Subsidence of sinkholes in Wink, Texas from 2007 to 2011 detected by time-series InSAR analysis. Geomat. Nat. Hazards Risk 2019. [Google Scholar] [CrossRef]
- Kim, J.-W.; Lu, Z.; Degrandpre, K. Ongoing deformation of sinkholes in Wink, Texas, observed by time-series Sentinel-1A SAR interferometry (preliminary results). Remote Sens. 2016, 8, 313. [Google Scholar] [CrossRef] [Green Version]
- Kim, J.-W.; Lu, Z.; Kaufmann, J. Evolution of sinkholes over Wink, Texas, observed by high-resolution optical and SAR imagery. Remote Sens. Environ. 2019, 222, 119–132. [Google Scholar] [CrossRef]
- Oliver-Cabrera, T.; Wdowinski, S.; Kruse, S.; Robinson, T. InSAR Detection of localized subsidence induced by sinkhole activity in suburban West-Central Florida. Proc. Int. Assoc. Hydrol. Sci. 2020, 382, 155–159. [Google Scholar] [CrossRef] [Green Version]
- Nefeslioglu, H.A.; Tavus, B.; Er, M.; Ertugrul, G.; Ozdemir, A.; Kaya, A.; Kocaman, S. Integration of an InSAR and ANN for sinkhole susceptibility mapping: A case study from Kirikkale-Delice (Turkey). ISPRS Int. J. Geo Inf. 2021, 10, 119. [Google Scholar] [CrossRef]
- Orhan, O.; Oliver-Cabrera, T.; Wdowinski, S.; Yalvac, S.; Yakar, M. Land subsidence and its relations with sinkhole activity in Karapınar region, Turkey: A multi-sensor InSAR time series study. Sensors 2021, 21, 774. [Google Scholar] [CrossRef]
- Closson, D.; Karaki, N.A.; Milisavljevic, N.; Hallot, F.; Acheroy, M. Salt-dissolution-induced subsidence in the Dead Sea area detected by applying interferometric techniques to ALOS Palsar Synthetic Aperture Radar images. Geodin. Acta 2010, 23, 65–78. [Google Scholar] [CrossRef] [Green Version]
- Motagh, M.; Shamshiri, R.; Haghighi, M.H.; Wetzel, H.-U.; Akbari, B.; Nahavandchi, H.; Roessner, S.; Arabi, S. Quantifying groundwater exploitation induced subsidence in the Rafsanjan plain, southeastern Iran, using InSAR time-series and in situ measurements. Eng. Geol. 2017, 218, 134–151. [Google Scholar] [CrossRef]
- Goorabi, A.; Maghsoudi, Y.; Perissin, D. Monitoring of the ground displacement in the Isfahan, Iran, metropolitan area using persistent scatterer interferometric synthetic aperture radar technique. J. Appl. Remote Sens. 2020, 14, 024510. [Google Scholar] [CrossRef]
- Haghighi, M.H.; Motagh, M. Ground surface response to continuous compaction of aquifer system in Tehran, Iran: Results from a long-term multi-sensor InSAR analysis. Remote Sens. Environ. 2019, 221, 534–550. [Google Scholar] [CrossRef]
- Foroughnia, F.; Nemati, S.; Maghsoudi, Y.; Perissin, D. An iterative PS-InSAR method for the analysis of large spatio-temporal baseline data stacks for land subsidence estimation. Int. J. Appl. Earth Obs. Geoinf. 2019, 74, 248–258. [Google Scholar] [CrossRef]
- Taheri, K.; Gutiérrez, F.; Mohseni, H.; Raeisi, E.; Taheri, M. Sinkhole susceptibility mapping using the analytical hierarchy process (AHP) and magnitude–frequency relationships: A case study in Hamadan province, Iran. Geomorphology 2015, 234, 64–79. [Google Scholar] [CrossRef]
- Jalali, M. Assessment of the chemical components of Famenin groundwater, western Iran. Environ. Geochem. Health 2007, 29, 357–374. [Google Scholar] [CrossRef]
- Amiri, M. Relationship between Sinkholes of Famenin-Kabudrahang-Ghahavand Plain and the Bed Rock of the Area. Geosci. J. 2005, 58, 134–147. [Google Scholar]
- Heidari, M.; Khanlari, G.; Beydokhti, A.T.; Momeni, A. The formation of cover collapse sinkholes in North of Hamedan, Iran. Geomorphology 2011, 132, 76–86. [Google Scholar] [CrossRef]
- Karimi, H.; Taheri, K. Hazards and mechanism of sinkholes on Kabudar Ahang and Famenin plains of Hamadan, Iran. Nat. Hazards 2010, 55, 481–499. [Google Scholar] [CrossRef]
- Amiri, M. The effect of bedrock dissolution and pumping on Hamadan sinkholes occurrences. In Proceedings of the Conference on Hazards of Sinkholes in Karst Terrains, Kermanshah, Iran, 28 December 2005. (In Farsi). [Google Scholar]
- Taleb Beydokhti, A. The Study of Sinkholes Mechanism around Hamedan Power House. Masters’s Thesis, Bu-Ali Sina University, Hamedan, Iran, 2004. (In Persian). [Google Scholar]
- Taheri, K. Sinkhole Hazards in Karst Terrains (with Emphasis on Sinkholes of Hamedan); West Regional Water Authority of Iran: Kermanshah, Iran, 2005. (In Farsi) [Google Scholar]
- Ferretti, A.; Prati, C.; Rocca, F. Permanent scatterers in SAR interferometry. IEEE Trans. Geosci. Remote Sens. 2001, 39, 8–20. [Google Scholar] [CrossRef]
- Ferretti, A.; Prati, C.; Rocca, F. Nonlinear subsidence rate estimation using permanent scatterers in differential SAR interferometry. IEEE Trans. Geosci. Remote Sens. 2000, 38, 2202–2212. [Google Scholar] [CrossRef] [Green Version]
- Hooper, A.; Segall, P.; Zebker, H. Persistent scatterer interferometric synthetic aperture radar for crustal deformation analysis, with application to Volcán Alcedo, Galápagos. J. Geophys. Res. Solid Earth 2007, 112. [Google Scholar] [CrossRef] [Green Version]
- Kampes, B.M. Displacement Parameter Estimation Using Permanent Scatterer Interferometry. Ph.D. Thesis, Civil Engineering and Geosciences, Delft, Netherlands, 2005. [Google Scholar]
- Zebker, H.A.; Villasenor, J. Decorrelation in interferometric radar echoes. IEEE Trans. Geosci. Remote Sens. 1992, 30, 950–959. [Google Scholar] [CrossRef] [Green Version]
- Hanssen, R.F. Radar Interferometry: Data Interpretation and Error Analysis; Springer Science & Business Media: Berlin, Germany, 2001; Volume 2. [Google Scholar]
- Perissin, D.; Wang, T. Repeat-pass SAR interferometry with partially coherent targets. IEEE Trans. Geosci. Remote Sens. 2011, 50, 271–280. [Google Scholar] [CrossRef]
- Minkyo, Y.; Hongsic, Y.; Kwangbae, K.; Hanbual, K.; Woneung, L. A Study on optimal D-InSAR filtering technique according to landform relief. Proceedings 2017, 1, 723. [Google Scholar] [CrossRef] [Green Version]
- Tarighat, F.; Foroughnia, F.; Perissin, D. Monitoring of power towers’ movement using persistent scatterer SAR interferometry in south west of Tehran. Remote Sens. 2021, 13, 407. [Google Scholar] [CrossRef]
Figure 1.
The study area. (a) The study area is marked with a black rectangle, faults with red lines, and sinkholes with yellow circles. (b) The region of the studied cave. (c) The sinkhole formed in August 2018. (d) A rod that indicates the existence of the long-term subsidence in the area. (e) Another hole near the Mofatteh power plant.

Figure 3.
The perpendicular baseline graph for the (a) first and (b) second group data stack. The circles and the edges represent the images and interferograms, respectively.
Figure 3.
The perpendicular baseline graph for the (a) first and (b) second group data stack. The circles and the edges represent the images and interferograms, respectively.

Figure 4.
Velocity maps using S-1A for the (a) first and (b) second group, generated by SARPROZ. The black circle and red dashed line indicate cave area and fault line, respectively.
Figure 4.
Velocity maps using S-1A for the (a) first and (b) second group, generated by SARPROZ. The black circle and red dashed line indicate cave area and fault line, respectively.

Figure 5.
Deformation histogram velocities for the first (black) and second (red) groups.

Figure 6.
PSs inside and outside of the cave area shown by black circles (the cave boundary is marked by a dashed circle), and the dashed line (ij) indicates the profile of one kilometer over the cave area.
Figure 6.
PSs inside and outside of the cave area shown by black circles (the cave boundary is marked by a dashed circle), and the dashed line (ij) indicates the profile of one kilometer over the cave area.

Figure 7.
Time-series behavior of the eight PSs shown in Figure 6 for (a) the first and (b) second groups. The vertical axis shows the millimeter displacement rate.
Figure 7.
Time-series behavior of the eight PSs shown in Figure 6 for (a) the first and (b) second groups. The vertical axis shows the millimeter displacement rate.

Figure 8.
One-kilometer profile of the ground’s deformation passing through the cave; (a) profile of the second group from January 2017 to August 2018 and, (b) profile of the first group from January 2015 to December 2017. The vertical axis represents the millimeter displacement, and the horizontal axis of the profile is plotted in meters.

Figure 9.
Noabad and Khalatabad stratigraphic columns and selected regions for investigating temporal behavior of displacement. Black squares represent each region.
Figure 9.
Noabad and Khalatabad stratigraphic columns and selected regions for investigating temporal behavior of displacement. Black squares represent each region.

Figure 10.
Temporal behavior of selected PSs in the regions, (a) near the cave area, (b) cave area, (c) near to the Mofatteh power plant.
Figure 10.
Temporal behavior of selected PSs in the regions, (a) near the cave area, (b) cave area, (c) near to the Mofatteh power plant.

Figure 11.
Piezometric records for Khalatabad and Noabad wells from 1998 to 2018. The vertical axis represents water level.
Figure 11.
Piezometric records for Khalatabad and Noabad wells from 1998 to 2018. The vertical axis represents water level.

Figure 12.
Comparing the PS-InSAR results and hydrological information. Figure (a1,a2) represent the temporal deformation behavior of the PSs close to the Khalatabad and Noabad piezometric wells, respectively. Figure (b1,b2) indicate piezometric water level fluctuation from 2017 to 2018/08. The linear interpolated lines are displayed using a dashed line, and their information is also shown on each subfigure.

Figure 13.
Distribution of velocity of the PSs in the Vian. Black line is the probability density function (PDF) of velocities.
Figure 13.
Distribution of velocity of the PSs in the Vian. Black line is the probability density function (PDF) of velocities.


Table 1.
Characteristics of significant sinkholes in Hamedan state [49].
Table 1.
Characteristics of significant sinkholes in Hamedan state [49].
| No. | Location | UTM—E(39N) | UTM—N(39N) | Depth (m) | Diameter (m) | Formation Date |
|---|---|---|---|---|---|---|
| 1 | Hamekasi | 313809 | 3877225 | 5 | 6 | Very old |
| 2 | Jahanabad | 315489 | 3883668 | 17 | 23 | 1994 |
| 3 | Khanabad | 295344 | 3894429 | 12 | 7 | 1995 |
| 4 | Bizanjerd | 313024 | 3879519 | 3 | 20 | 1998 |
| 5 | Famenin | 315290 | 3887200 | 30 | 20 | 2002 |
| 6 | Kerdabad | 298841 | 3888240 | 7 | 45 | 2003 |
| 7 | Hamekasi | 314375 | 3877350 | 20 | 8.5 | 2004 |
| 8 | Baban | 295576 | 3899807 | 20 | 20 | 2008 |
| 9 | Kerdabad | 298888 | 3888373 | 5 | 40 | 2009 |
| 10 | Hamekasi | 314439 | 3877234 | 10 | 9 | 2010 |
| 11 | Hamekasi | 314121 | 3877028 | 10 | 9.5 | 2011 |
Table 2.
Details of the analyzed dataset.
| Group | Acquisition Period | Total No. | Master Image | Track |
|---|---|---|---|---|
| first | 05 January2015–25 December 2016 | 29 | 17 February 2016 | 108 |
| second | 18 January 2017–17 August 2018 | 47 | 14 November 2017 | 108 |
Table 3.
Characteristics of three regions whose time-series behavior was analyzed.
| Regions | Description |
|---|---|
| Region 1 | Nearest subsidence area to the cave |
| Region 2 | cave area |
| Region 3 | Near to Mofatteh power plant |
Publisher’s Note: MDPI stays neutral with regard to jurisdictional claims in published maps and institutional affiliations. |
© 2021 by the authors. Licensee MDPI, Basel, Switzerland. This article is an open access article distributed under the terms and conditions of the Creative Commons Attribution (CC BY) license (https://creativecommons.org/licenses/by/4.0/).
Share and Cite
MDPI and ACS Style
Khoshlahjeh Azar, M.; Hamedpour, A.; Maghsoudi, Y.; Perissin, D. Analysis of the Deformation Behavior and Sinkhole Risk in Kerdabad, Iran Using the PS-InSAR Method. Remote Sens. 2021, 13, 2696. https://doi.org/10.3390/rs13142696
AMA Style
Khoshlahjeh Azar M, Hamedpour A, Maghsoudi Y, Perissin D. Analysis of the Deformation Behavior and Sinkhole Risk in Kerdabad, Iran Using the PS-InSAR Method. Remote Sensing. 2021; 13(14):2696. https://doi.org/10.3390/rs13142696
Chicago/Turabian StyleKhoshlahjeh Azar, Mahdi, Amir Hamedpour, Yasser Maghsoudi, and Daniele Perissin. 2021. "Analysis of the Deformation Behavior and Sinkhole Risk in Kerdabad, Iran Using the PS-InSAR Method" Remote Sensing 13, no. 14: 2696. https://doi.org/10.3390/rs13142696
Note that from the first issue of 2016, this journal uses article numbers instead of page numbers. See further details here.