
Combined Retrieval of Oil Film Thickness Using Hyperspectral and Thermal Infrared Remote Sensing
by
 ,
,
Junfang Yang
1,
Yabin Hu
2,*,
Yi Ma
2,
Meiqi Wang
1,
Ning Zhang
1,
Zhongwei Li
1 and
Jie Zhang
1,2 1
College of Oceanography and Space Informatics, China University of Petroleum, Qingdao 266580, China
2
First Institute of Oceanography, Ministry of Natural Resources, Qingdao 266061, China
*
Author to whom correspondence should be addressed.
Remote Sens. 2023, 15(22), 5415; https://doi.org/10.3390/rs15225415
Submission received: 8 September 2023
/
Revised: 1 November 2023
/
Accepted: 16 November 2023
/
Published: 18 November 2023
(This article belongs to the Special Issue Advances on Remote Sensing, Modeling, and Trajectory Prediction of Marine Oil Spill)
Abstract
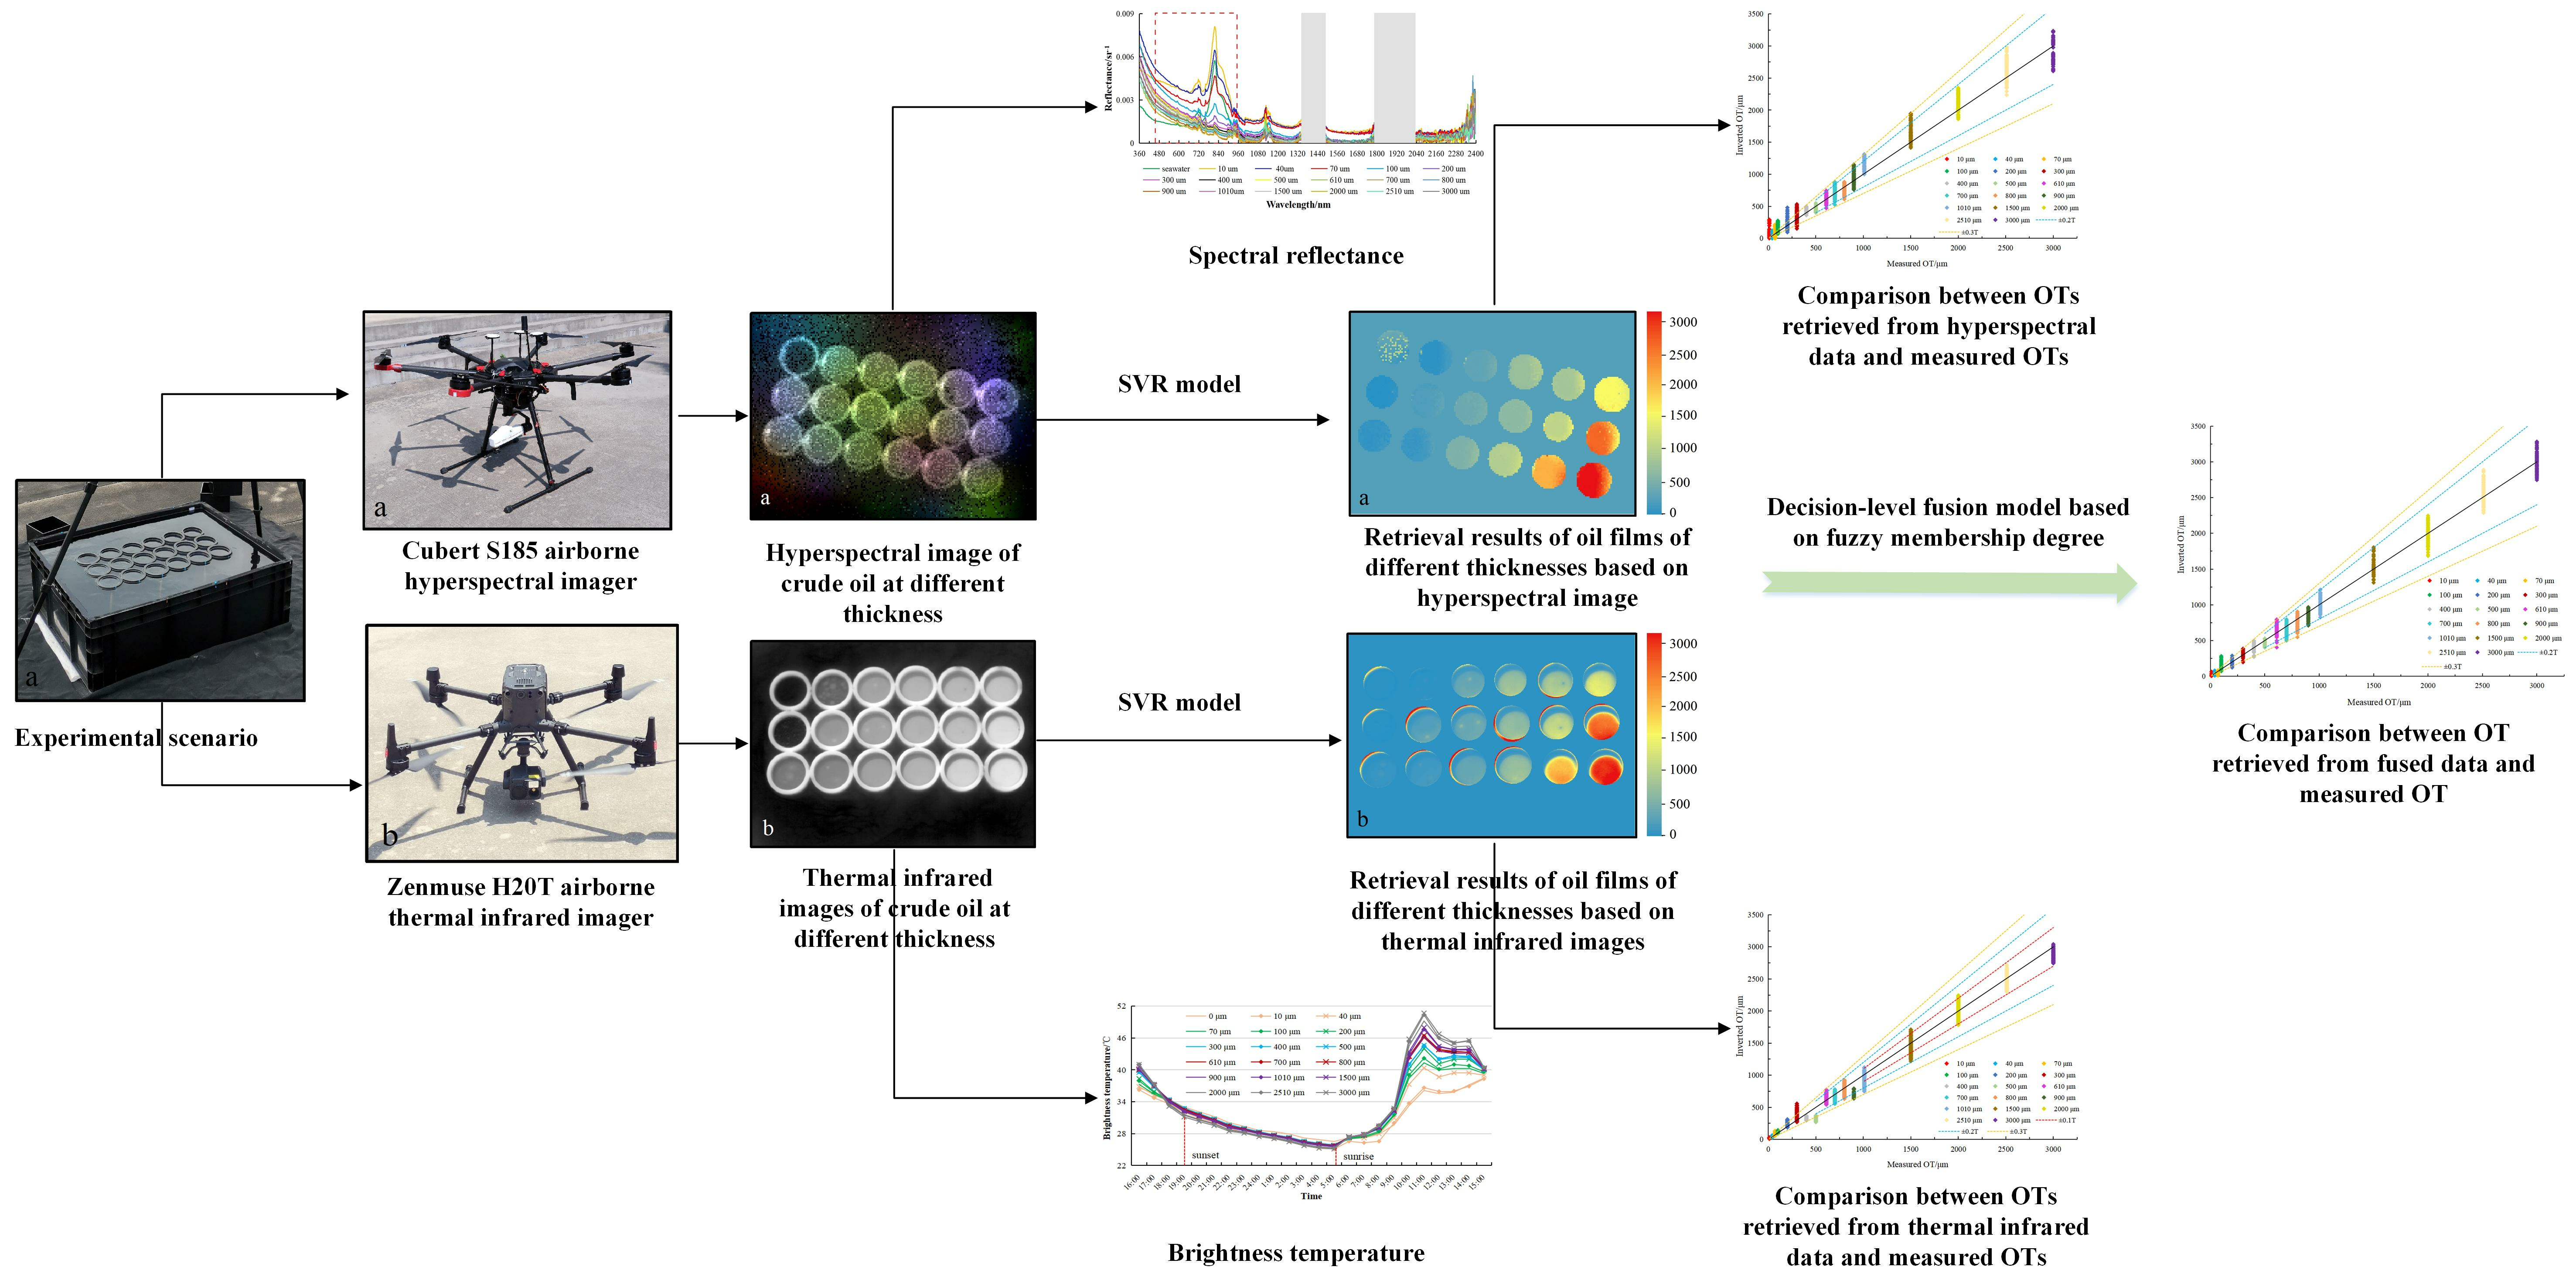
:An outdoor experiment was conducted to measure the thickness of oil films (0~3000 μm) using an airborne hyperspectral imager and thermal infrared imager, and the spectral response and thermal response of oil films of different thicknesses were analyzed. The classic support vector regression (SVR) model was used to retrieve the oil film thickness. On this basis, the suitable range for retrieving oil film thickness using hyperspectral and thermal infrared remote sensing was explored, and the decision-level fusion algorithm was developed to fuse the retrieval capabilities of hyperspectral and thermal infrared remote sensing for oil film thickness. The following conclusions can be drawn: (1) Based on airborne hyperspectral data and thermal infrared data, the retrieval accuracy of oil films of different thicknesses reached 154.31 μm and 116.59 μm, respectively. (2) The S185 hyperspectral data were beneficial for retrieving thicknesses greater than or equal to 400 μm, and the H20T thermal infrared data were beneficial for retrieving thicknesses greater than 500 μm. (3) The result of the decision-level fusion model based on a fuzzy membership degree was superior to those obtained using a single sensor (hyperspectral or thermal infrared), indicating that it can better integrate the retrieval results of hyperspectral and thermal infrared remote sensing for oil film thickness. Furthermore, the feasibility of using hyperspectral and thermal infrared remote sensing to detect water-in-oil emulsions of different thicknesses was investigated through spectral response and thermal response analysis.

1. Introduction
Marine oil spills are one of the most serious environmental pollution accidents in the process of human exploitation of the sea, and the pollution produced is very harmful to the marine environment and marine living resources. Under the influence of wind, waves, and currents, oil slicks on the sea surface undergo emulsification, resulting in the formation of water-in-oil (WO) emulsions and oil-in-water (OW) emulsions of varying concentrations [1,2]. These emulsions increase the volume and viscosity of oil slicks, making them less prone to dispersion and causing longer-lasting pollution to the marine ecological environment [3]. In recent years, the frequent occurrence of marine oil spill emergencies around the world [4,5,6,7,8,9,10] has highlighted the necessity and urgency of paying attention to the problem of marine oil spills.
At present, many remote sensing technologies have been used to monitor marine oil spills, such as ultraviolet remote sensing, multispectral remote sensing, hyperspectral remote sensing, infrared remote sensing, and synthetic aperture radar (SAR). Oil exhibits a higher reflectance than seawater in the ultraviolet range, and ultraviolet remote sensing can be used to monitor very thin oil films with a thickness of less than 0.1 μm [11], but the response to thicker oil films is weak, and it is difficult to achieve accurate detection over long distances due to a shorter wavelength [12,13]. Multispectral remote sensing provides a large imaging width and has a certain ability for estimating the thickness of oil films. However, it needs to be assisted by hyperspectral images, or it can only estimate the relative thickness of oil films [14,15,16]. Hyperspectral remote sensing has a high spectral resolution, which can identify the detailed characteristics of different oil spill pollution types [17,18,19,20], and it is easy to extract spectral characteristics related to the oil film thickness [21,22,23,24], but it is vulnerable to the interference of sun glints, clouds, and other environmental factors [25,26]. The radiant brightness temperature of the oil film on the sea surface differs significantly from that of clean seawater, making thermal infrared imaging technology effective in identifying and quantifying thicker oil films on the sea surface. It can also provide continuous detection capabilities throughout the day [27,28,29]. However, thermal infrared imaging technology has a weak detection effect on thin oil films [30] and cannot identify the non-emulsified oil and oil–water emulsions [31,32]. Lidar uses the difference in the laser echo signal and the spectral characteristics of oil-spill-induced fluorescence to determine the type and property of an oil spill. It has the advantages of all-day and all-weather operation, but its oil spill detection theory needs to be improved, and its practical application ability still needs to be verified [33,34]. Synthetic aperture radar (SAR) has become the primary means of emergency monitoring for marine oil spills due to its advantages of all-day, all-weather monitoring and being free from clouds [35,36,37,38]. However, it also has some disadvantages, such as a high false alarm rate in oil spill detection and difficulty in identifying oil spill pollution types and estimating oil film thickness [27,39].
Oil film thickness (OT) is an important factor in remote sensing monitoring of marine oil spills and serves as a significant and important indicator for estimating the amount of oil spills. Accurate information on oil spill distribution and thickness can help in assessing disaster losses and formulating emergency response strategies, which is of great significance for disaster prevention and mitigation. At the same time, remote sensing retrieval of OT has always been a challenging research topic at home and abroad [40,41]. Currently, in the business monitoring work of marine oil spills, the monitoring personnel mainly estimate the OT through visual interpretation of aerial true-color photographs according to the Bonn Agreement [42]. However, the main problem with the Bonn Agreement is that the identification of different colors of oil film is greatly affected by subjective and environmental factors. Moreover, the Bonn Agreement cannot accurately distinguish oil films with a thickness greater than 200 μm, and it is difficult to directly guide the interpretation and application of satellite optical remote sensing images [43]. To achieve the retrieval of OT based on optical remote sensing images, scholars at home and abroad have carried out extensive research. At present, the optical means used for OT retrieval mainly include hyperspectral remote sensing and thermal infrared remote sensing. Hyperspectral remote sensing employs the principles of spectral reflectance to achieve quantification of OT, making it a significant means for remote sensing retrieval of OT [44,45,46]. Thermal infrared remote sensing, on the other hand, utilizes the laws governing infrared emissivity or brightness temperature difference to achieve OT retrieval [30,47,48]. Due to the effect of ocean dynamics, marine oil spills often exist in the form of oil–water emulsions. Quantifying the oil–water ratio of emulsions is also an important aspect of estimating the oil spill amount [2,49,50].
Currently, most of the studies on estimating the OT using optical remote sensing technology are conducted based on a single sensor type. The mechanisms of hyperspectral remote sensing and infrared remote sensing for retrieving OT are different, leading to variations in their respective capabilities. For example, infrared remote sensing is sensitive to thick oil films [30], while ultraviolet remote sensing is sensitive to thin oil films [11]. The accuracy of the OT retrieved using a single sensor type cannot meet the needs of accurate monitoring applications. Recently, more and more scholars have paid attention to the combined monitoring of marine oil spills using two types of sensors, which can effectively improve the remote sensing monitoring level of marine oil spills [32,51,52,53,54,55].
The main contributions of our study are as follows:
- (1)
- The oil film thickness ranging from 200 to 1000 μm in the Bonn Agreement has been refined, and the retrieval of the oil film thickness has been conducted.
- (2)
- The study established the relationship between spectral reflectance, brightness temperature difference (BTD), and OT, constructed an OT retrieval model, and explored the suitable range for retrieving the OT using hyperspectral and thermal infrared remote sensing.
- (3)
- The study developed a decision-level fusion algorithm for OT retrieval using hyperspectral and thermal infrared remote sensing, enhancing the remote sensing capability for OT retrieval.
2. Materials and Methods
2.1. Experiment
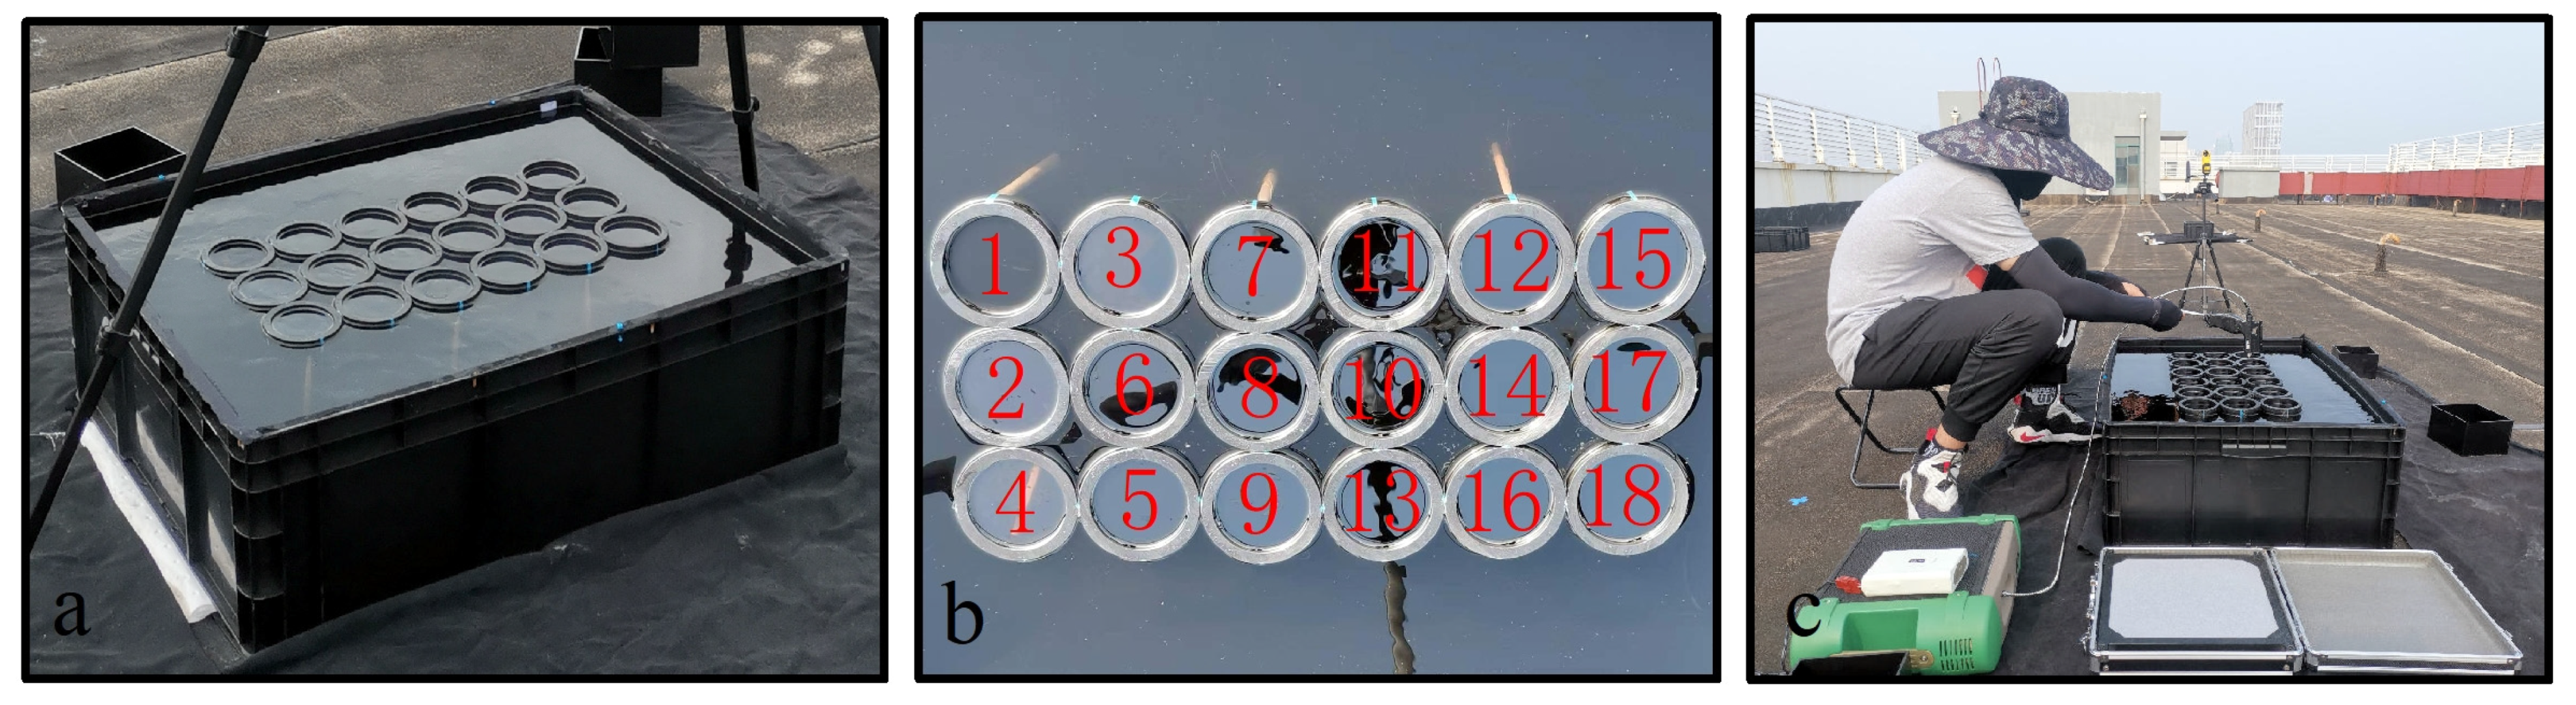
The outdoor simulated oil spill experiment was conducted in a plastic tank filled with seawater in August 2022 (Figure 1a). To minimize interference from the bottom and stray light, the bottom and walls of the plastic tank were covered with matte black cloth. In order to ensure a normal heat exchange between seawater and oil film, 18 different thicknesses (ranging from 0 to 3000 μm) of crude oil were distributed within floating black PVC circular rings with an inner diameter of 7 cm (Figure 1b). The main principle for achieving the OT (Table 1) is to finely divide the oil thicknesses greater than 100 μm and less than 1000 μm in the Bonn Agreement. The experiment started at 16:00 local time in Qingdao and continued until 16:00 the following day. Airborne hyperspectral data (collected only in the daytime) and thermal infrared data of oil films of different thicknesses were acquired every hour. At the same time, the spectral reflectance of seawater and oil films of different thicknesses in the range of 350~2500 nm was measured using analytical spectral devices (ASD) FieldSpec4 to better analyze the spectral characteristics of oil films of different thicknesses (Figure 1c).
During the entire experimental process, real-time information such as wind speed and temperature was recorded using an anemometer. The crude oil used in the experiment (asphalt content 1.57%, colloid 18.77%, wax 7.56, density 0.932 g/mL at 25 °C) was produced from China’s Shengli Oilfield. The OT was calculated by dividing the mass of oil dripped into the ring with the density of the crude oil and the area of the ring. The mass of crude oil dripped into the ring was obtained by averaging multiple measurements using a high-precision electronic balance with an accuracy of 0.001 g. To ensure a uniform distribution of the oil film within the PVC rings to the maximum extent, oil films need to be left to stand for at least 3 h.
2.2. Data
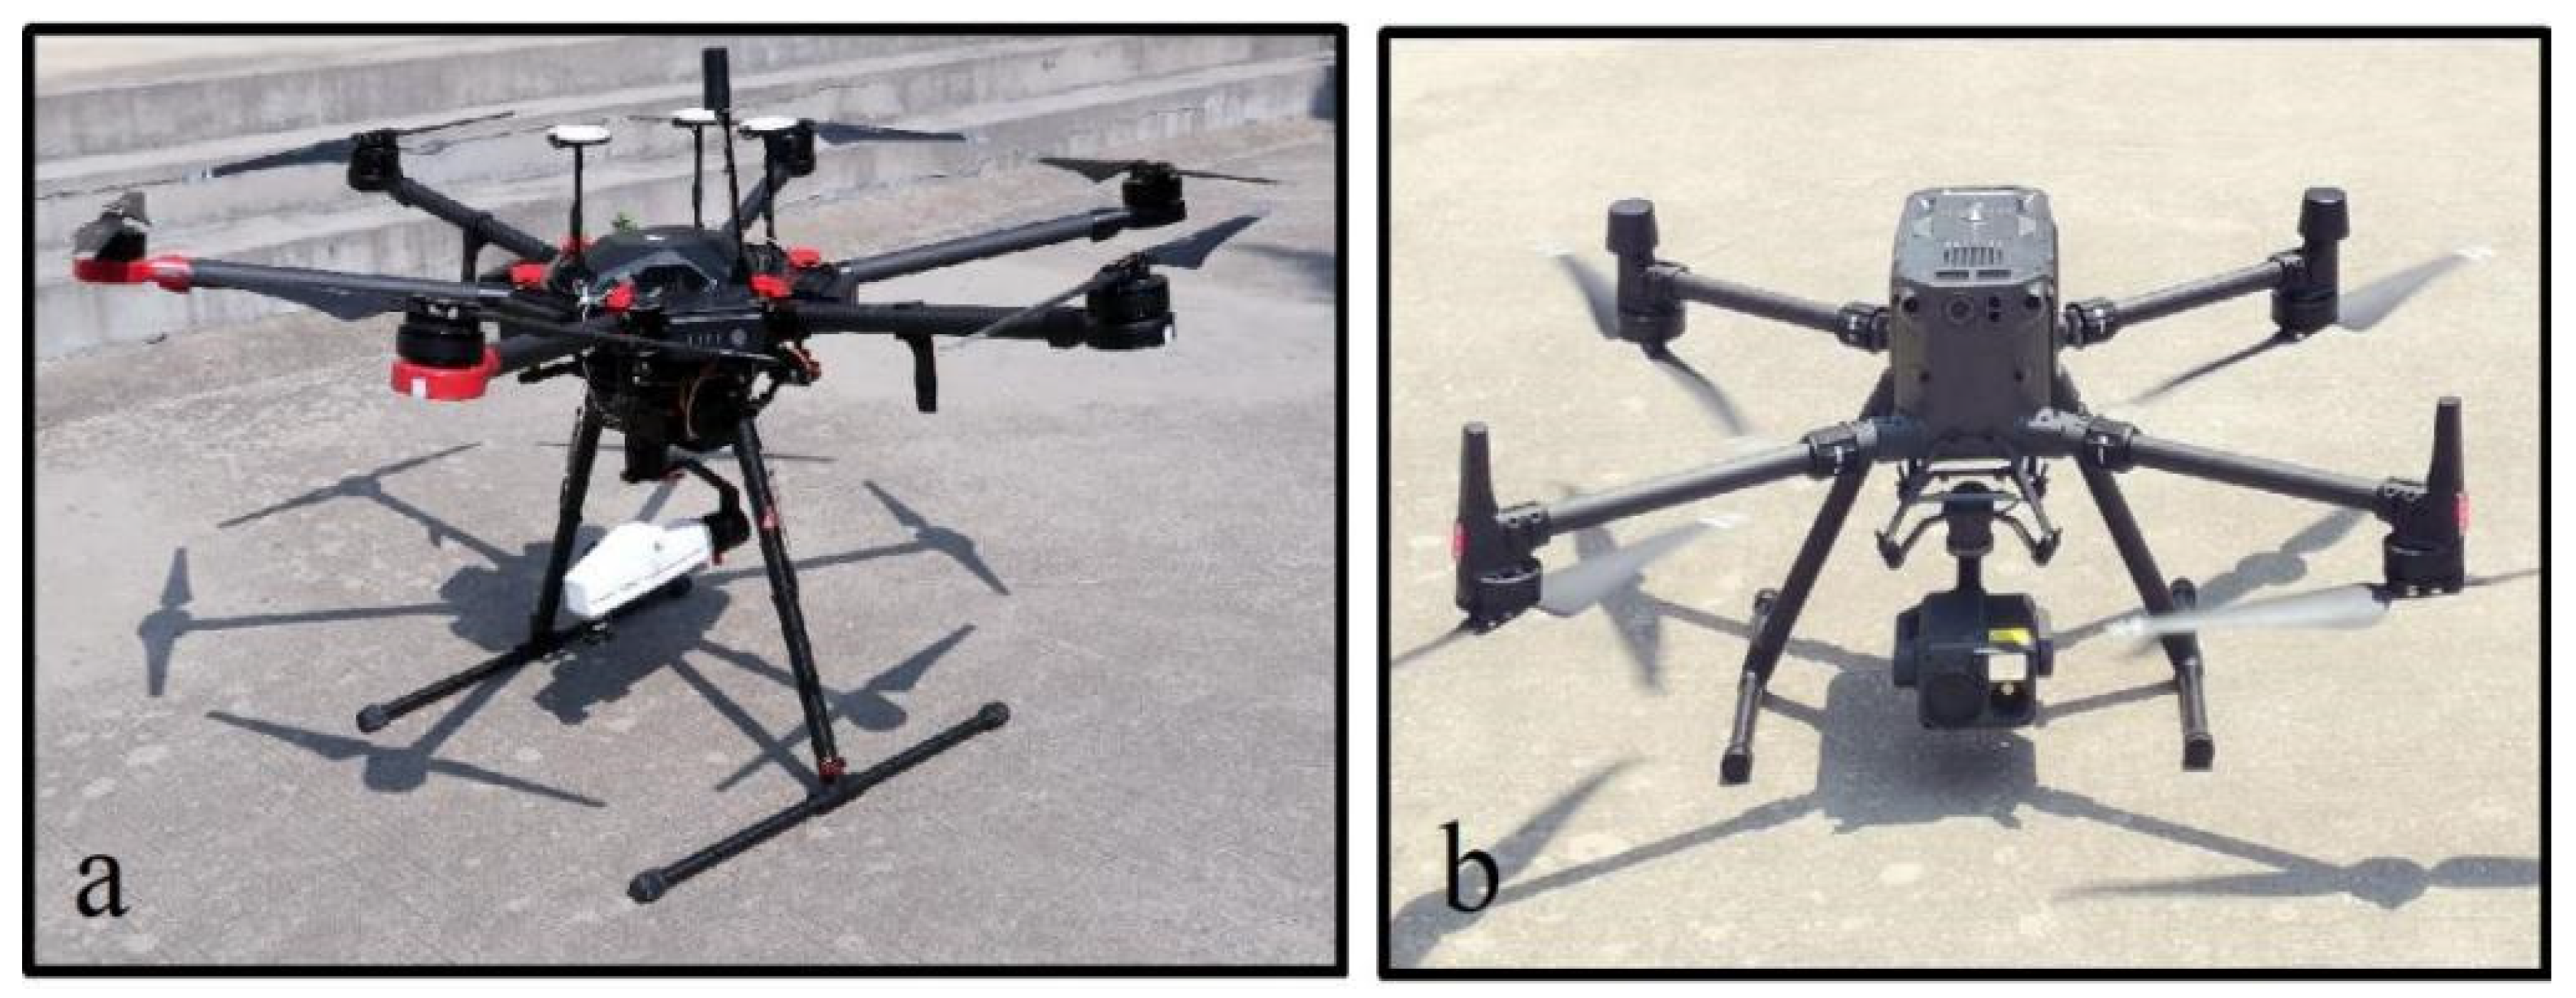
The experiment was conducted under clear weather and wind speeds less than 3 m/s. Hyperspectral and thermal infrared images of oil films of different thicknesses were approximately synchronously obtained using the Cubert S185 airborne hyperspectral imager (Cubert, Ulm, Germany) (Figure 2a) and the Zenmuse H20T airborne thermal infrared imager (DJI, Shenzhen, China) (Figure 2b). The main parameters of the Cubert S185 airborne hyperspectral imager and the Zenmuse H20T airborne thermal infrared imager are shown in Table 2.
The data acquired by the S185 hyperspectral imager include the raw spectral data, calibration data from the standard panel, and dark current measurement data. By running the Cubert Utils Touch 2.6.0 program on a computer, the data can be imported, and the software automatically recognizes the calibration data from the standard panel and dark current measurement data. The corresponding reflectance data can be exported using the data export function in the software. After obtaining raw data using the H20T thermal infrared imager, brightness temperature data can be exported through DJI Thermal Analysis Tool 2.1.8 and MATLAB 2014a program.
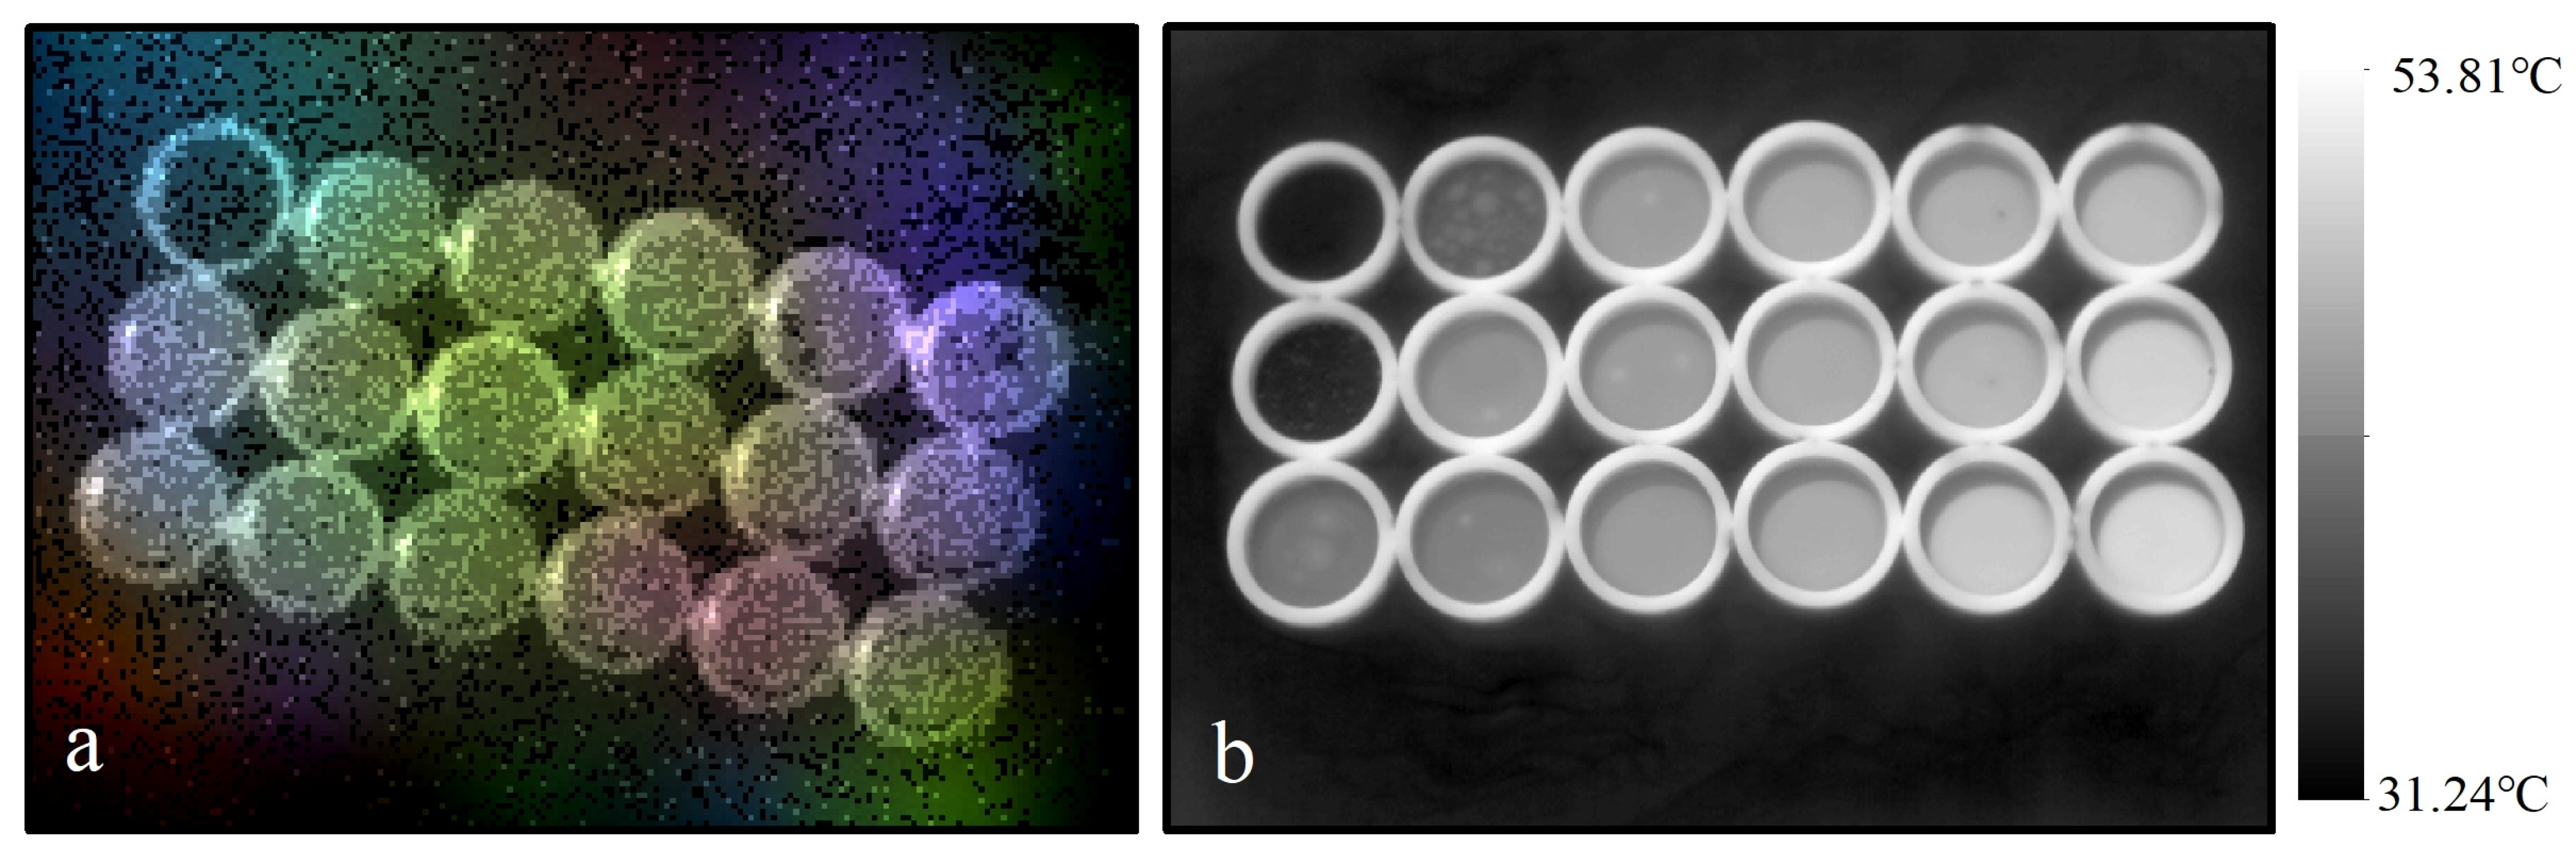
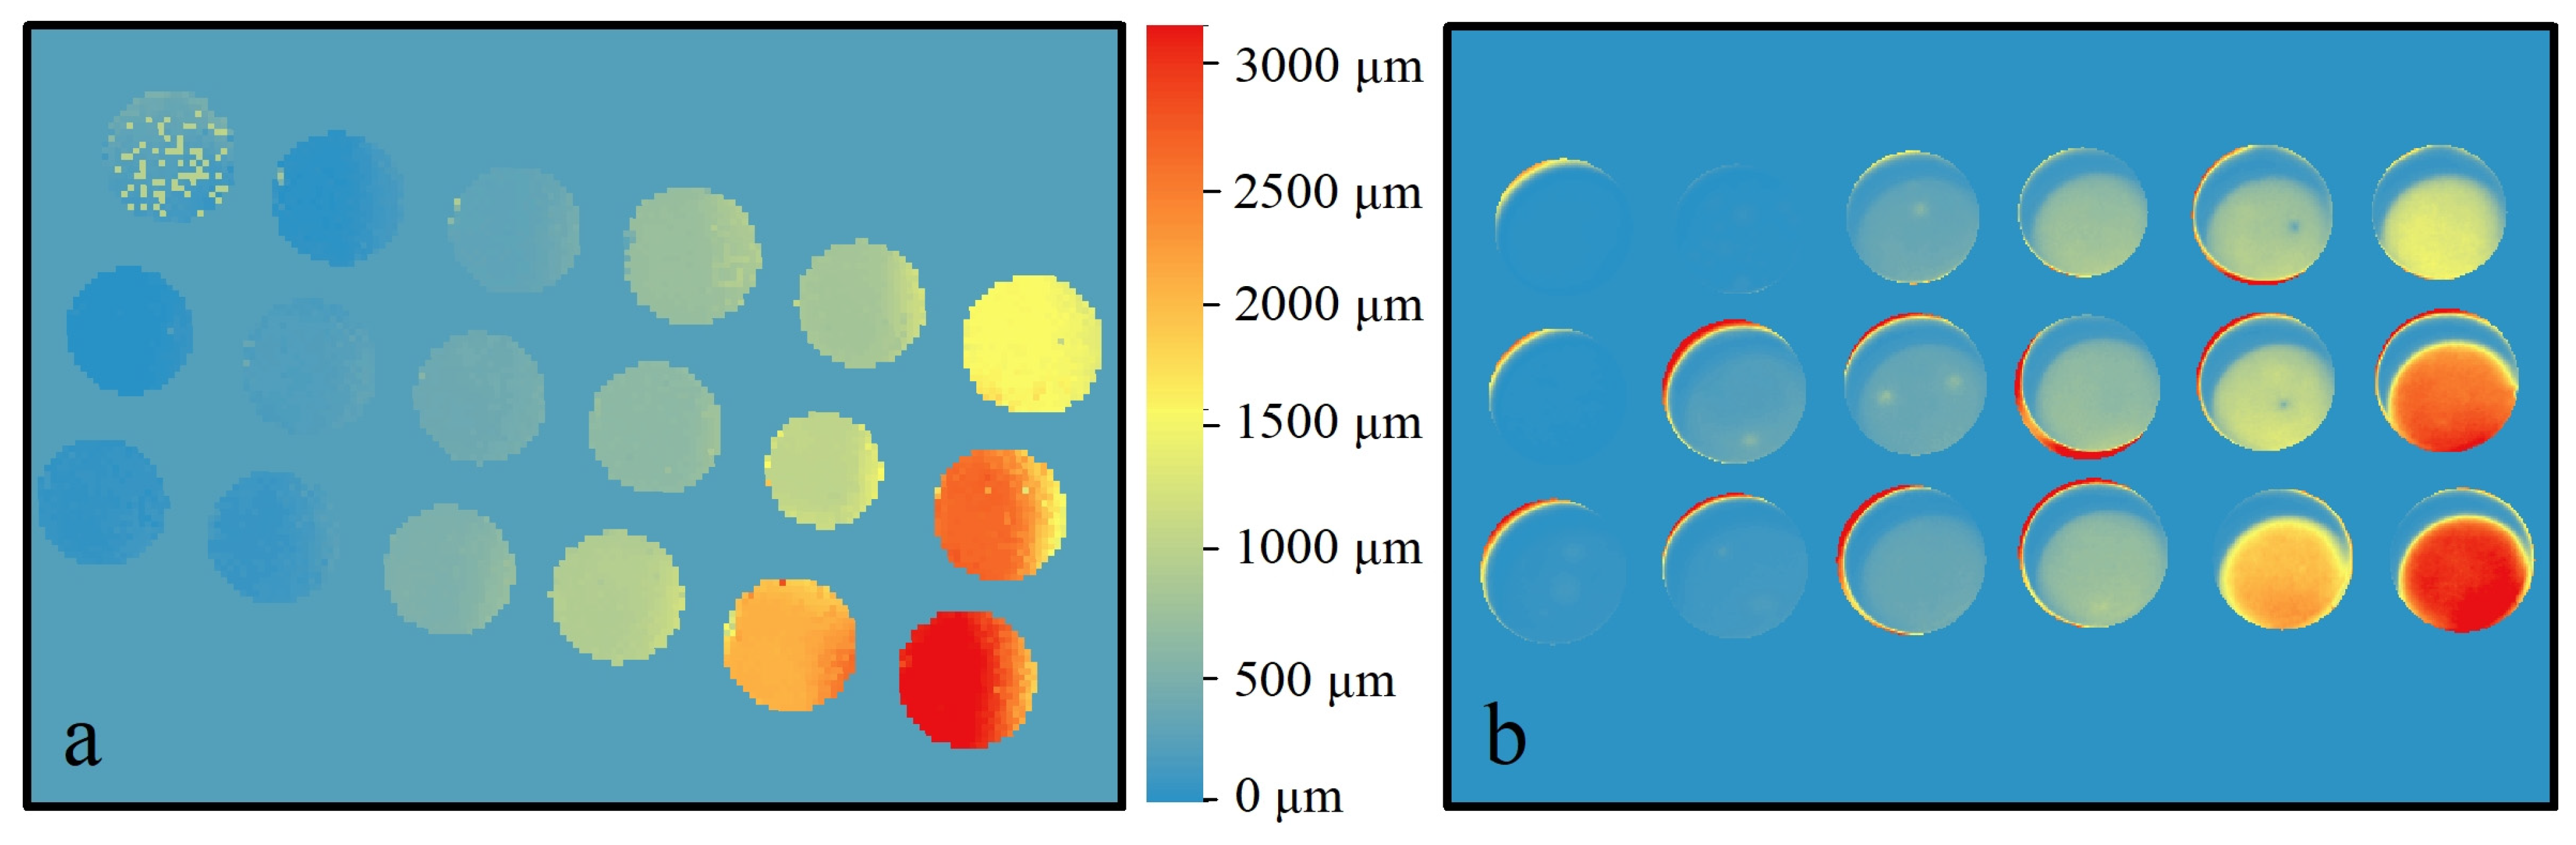
According to the size of the experimental scene, the preprocessed airborne hyperspectral image and airborne thermal infrared image were cropped using ENVI 5.3 software. Figure 3a shows the preprocessed and cropped airborne hyperspectral image acquired at 10:00, with spatial resolutions of 2.1 mm and a size of 126 px × 189 px. Figure 3b shows the preprocessed and cropped airborne thermal infrared image acquired at 10:00, with spatial resolutions of 2.7 mm and a size of, 480 px × 640 px. Mask the areas on the airborne hyperspectral image except for 18 circles. Register and crop the thermal infrared imagery based on the circular regions in the hyperspectral data.
The ASD FieldSpec4 spectrometer was used to measure Lambertian standard panel, seawater, oil films of different thicknesses, skylight, and Lambertian standard plate in order to obtain their radiance and then convert the radiance into the spectral reflectance of oil films of different thicknesses and seawater according to the formula in reference [18].
2.3. Methods
2.3.1. Support Vector Regression Model for Oil Film Thickness Retrieval
This study aims to preliminarily explore the feasibility of combined retrieval of OT using airborne hyperspectral remote sensing and thermal infrared remote sensing. Here, a classic support vector regression (SVR) model was selected to perform OT retrieval based on airborne hyperspectral and thermal infrared data, respectively.
The main idea of the SVR algorithm [56] is to use kernel function to map data to high-dimensional space and construct the best-fitting hyperplane in the new space, so that the hyperplane can maximize the gaps between data samples. In general, the SVR algorithm is an effective method for processing data with complex internal relations, which can establish an accurate regression model through the selection of appropriate kernel functions and parameters and calculate in high-dimensional space, effectively avoiding the problem of curse of dimensionality. The constrained optimization problem of the SVR model can be expressed as
where represents input sample, denotes the weight vector, represents the penalty factor, and are the slack variables, and refers to mapping to a high-dimensional space. indicates the sample number, is the threshold, represents the magnitude of the normal vector to the surface that is being approximated, and is the abbreviation of “subject to”, representing constraint conditions.
The kernel function of the SVR model used in this article is the radial basis function (RBF). The grid method is used to automatically optimize the penalty factor and kernel function parameter in the MATLAB environment using the libSVM function, and the results are tested using the 5-fold cross-validation (CV) method [57].
2.3.2. Decision-Level Fusion Model Based on Fuzzy Membership Degree
The mechanisms of hyperspectral remote sensing and infrared remote sensing for retrieving OT are different, leading to variations in their respective capabilities. The decision-level fusion algorithm based on fuzzy membership degree can fully utilize the information of multisource remote sensing images and inherit the advantages of different remote sensing information through fusion strategies. The decision-level fusion algorithm based on fuzzy membership [7] is used to fuse the retrieved results of OT obtained from hyperspectral images and thermal infrared images. The basic idea is to distinguish each pixel in sequence according to the established decision rules. For the pixels that cannot be distinguished, the membership degree belonging to each category is calculated (Equation (2)), and the category with the highest membership degree is selected as the OT segment to which the pixel ultimately belongs. and represent the OT retrieval results based on the hyperspectral image and thermal infrared image, and represent the OT range of a certain pixel on the hyperspectral image and thermal infrared image, and and represent the OT of the current pixel, respectively. and represent the mean relative error of the current pixel within the corresponding OT range, and and represent the fuzzy membership of the current pixel within the corresponding OT range, respectively. denotes the OT after decision-level fusion.
The rules for decision-level fusion are as follows:
- When , if , then ;
- When and , if , then , otherwise, ;
- When , if and , then ; otherwise, if and , then ;
- When , if and , then ; otherwise, if and , then .
2.3.3. Accuracy Evaluation
In order to evaluate the accuracy of the retrieval of OT based on hyperspectral and thermal infrared data, this paper adopts two accuracy evaluation indicators: root-mean-square error (RMSE) and mean relative error (MRE). RMSE and MRE reflect the degree of difference between retrieved values and measured values, with smaller values indicating a higher retrieval accuracy of OT. The expressions for RMSE and MRE are as follows:
where represents retrieved OT value (μm), represents measured OT value (μm), and denotes the number of samples.
3. Results and Analysis
3.1. Photothermal Response of Crude Oil at Different Thicknesses
The photothermal response refers to the incidence of light upon the surface of a material, which results in the absorption of photon energy by electrons, thereby inducing their excitation. These excited electrons then transfer the energy to molecules through collisions and other processes, thereby inducing vibration and rotational acceleration, ultimately generating thermal energy. The incident light undergoes distinct processes of refraction, reflection, and absorption within the oil film layer. With an increase in the thickness of the oil film, the interference effect of the oil film on the incident light gradually transitions from a state of multiple-beam interference to that of dual-beam interference. Simultaneously, thicker oil films exhibit a more intense absorption of incident light, leading to a reduction in reflectance within the visible and near-infrared spectral range. During daytime, thicker oil films absorb a greater amount of solar radiation, converting it into an increased quantity of thermal energy, which manifests as higher brightness temperatures, thereby presenting positive contrast image characteristics in thermal infrared imagery.
3.1.1. Spectral Characteristics of Oil Films of Different Thicknesses
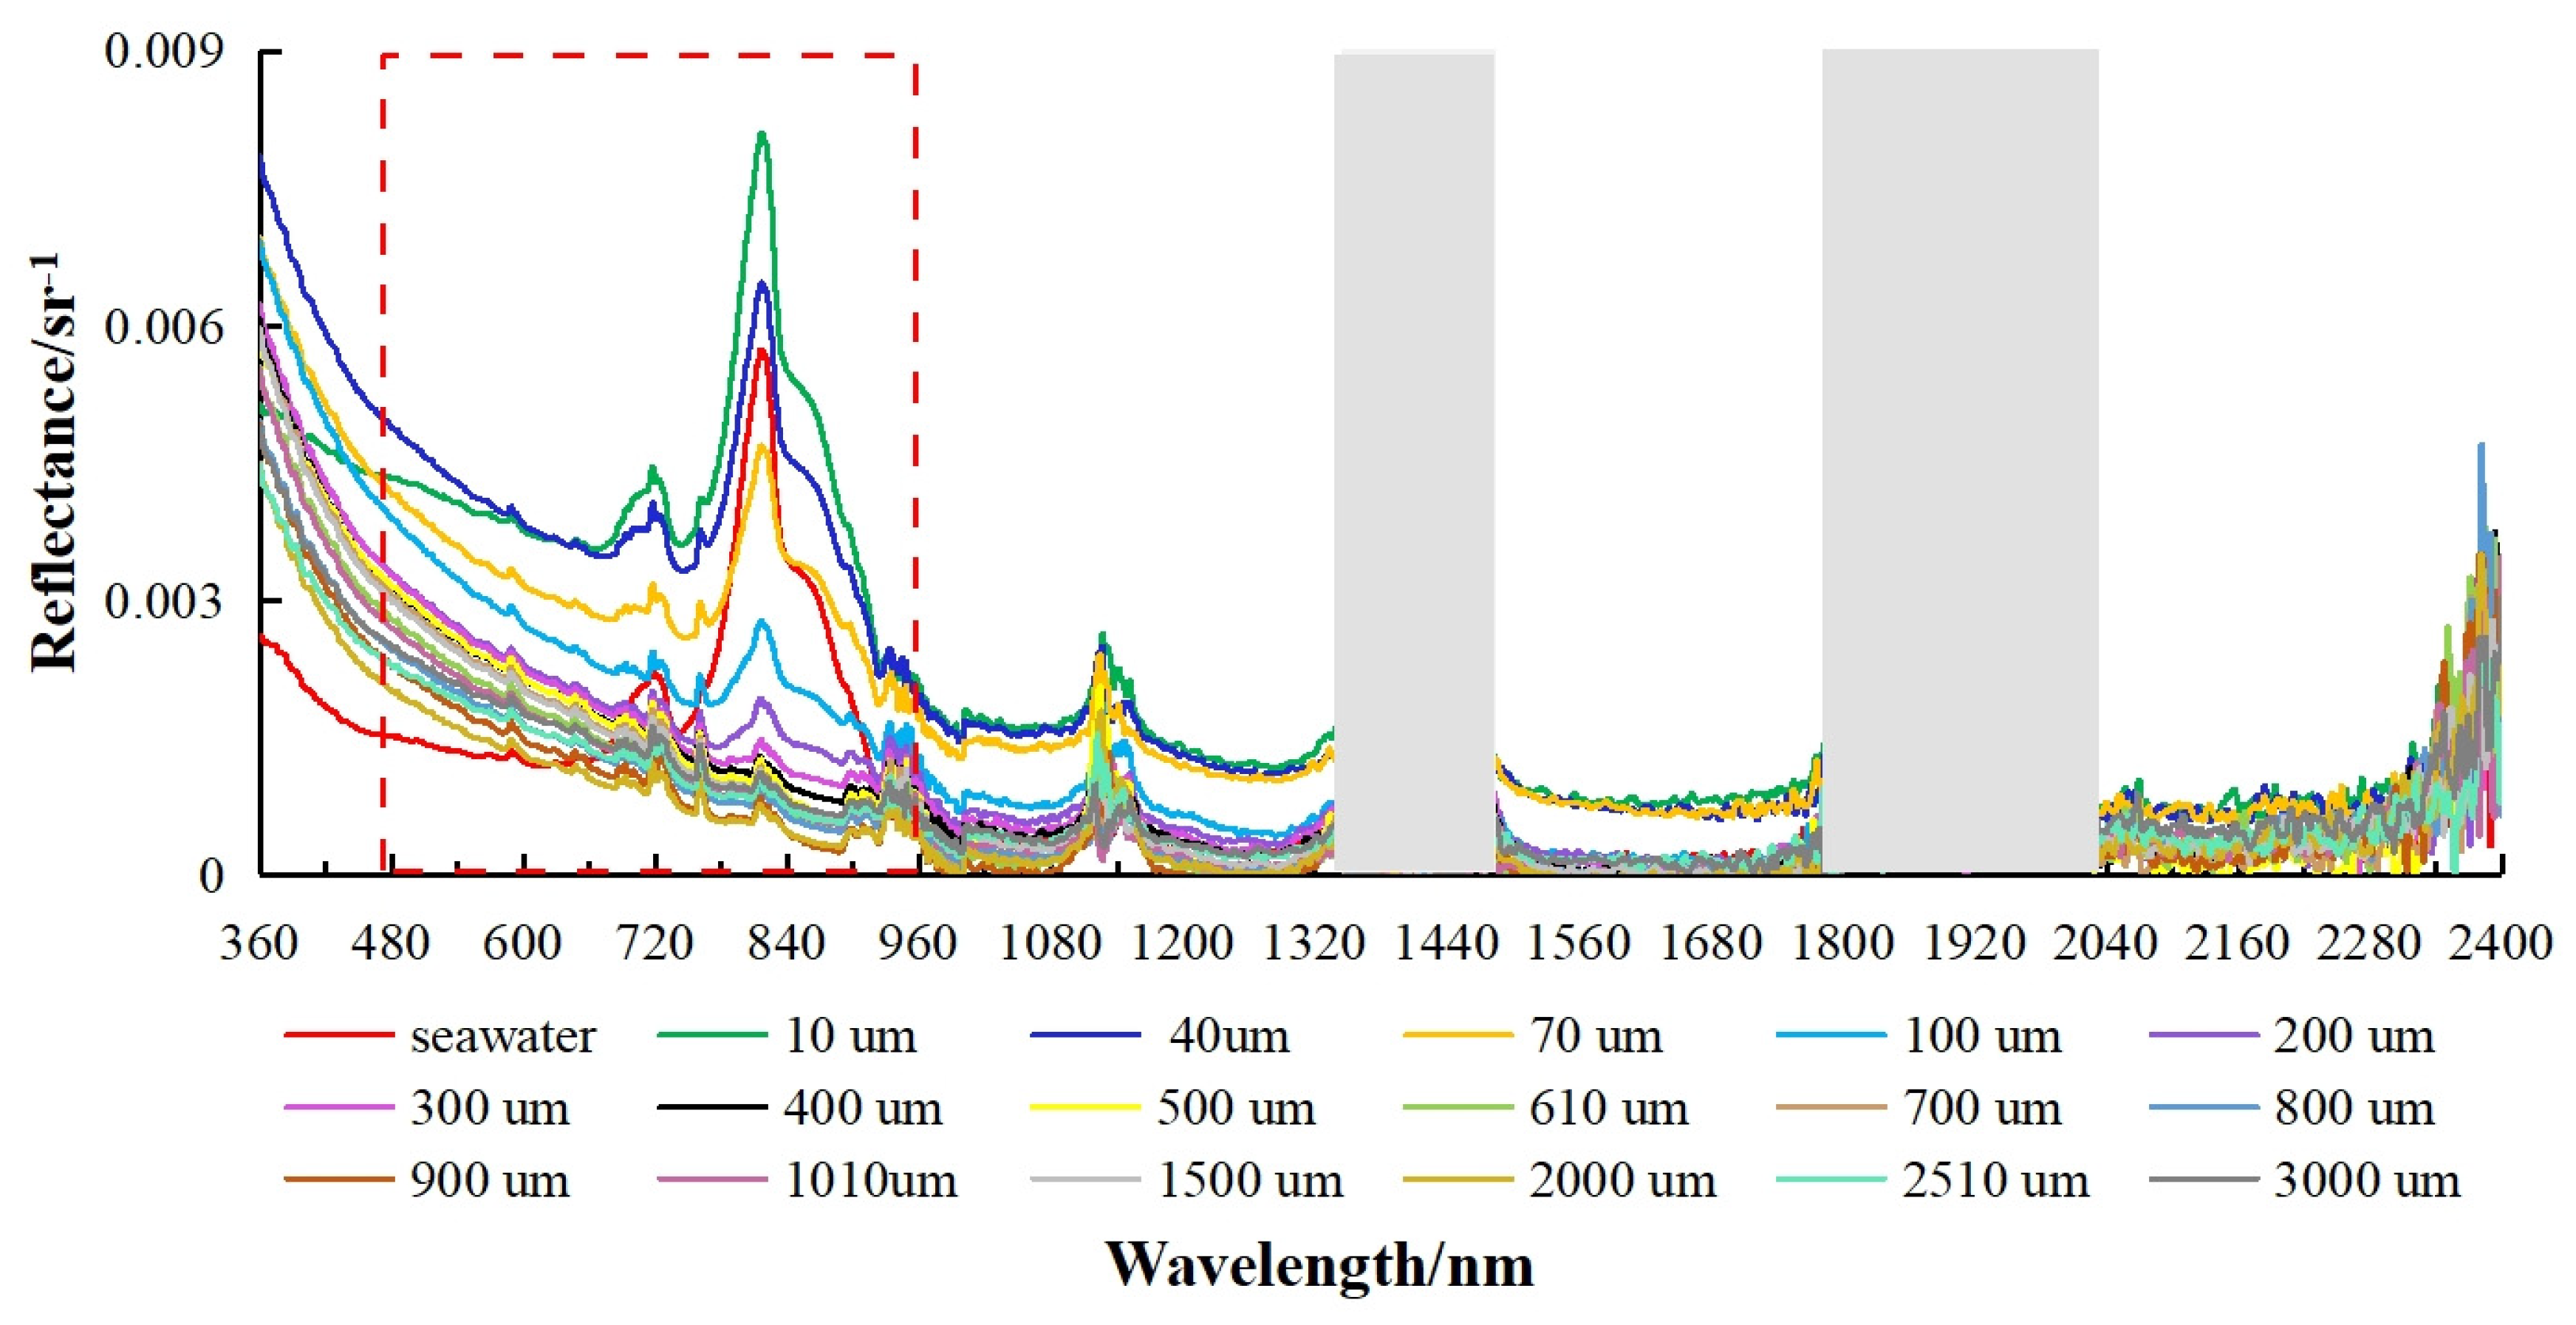
According to Figure 4, the spectral curves of the crude oil films of different thicknesses exhibit consistent reflection peaks at ~720 nm, ~815 nm, and ~1125 nm. Within the spectral range of less than 1200 nm, the spectral curves of the oil films decrease with increasing thickness. In the spectral range above 1200 nm, the spectral curves of the oil films remain relatively unchanged with varying thickness. Specifically, within the ultraviolet range, the spectral reflectance of the oil films of different thicknesses is higher than that of seawater. In the near-infrared spectral range of 760~900 nm, the spectral reflectance of seawater is higher than that of an oil film of a thickness greater than 100 μm, and the spectral reflectance of the crude oil gradually decreases with increasing thickness. The spectral reflectance of oil films of a thickness less than 40 μm is always higher than that of seawater. The spectral response of oil films of different thicknesses is influenced not only by the spectral absorption characteristics of the oil film, but also by the strength of the reflection signal of the background water body [14].
3.1.2. Thermal Response of Oil Films of Different Thicknesses
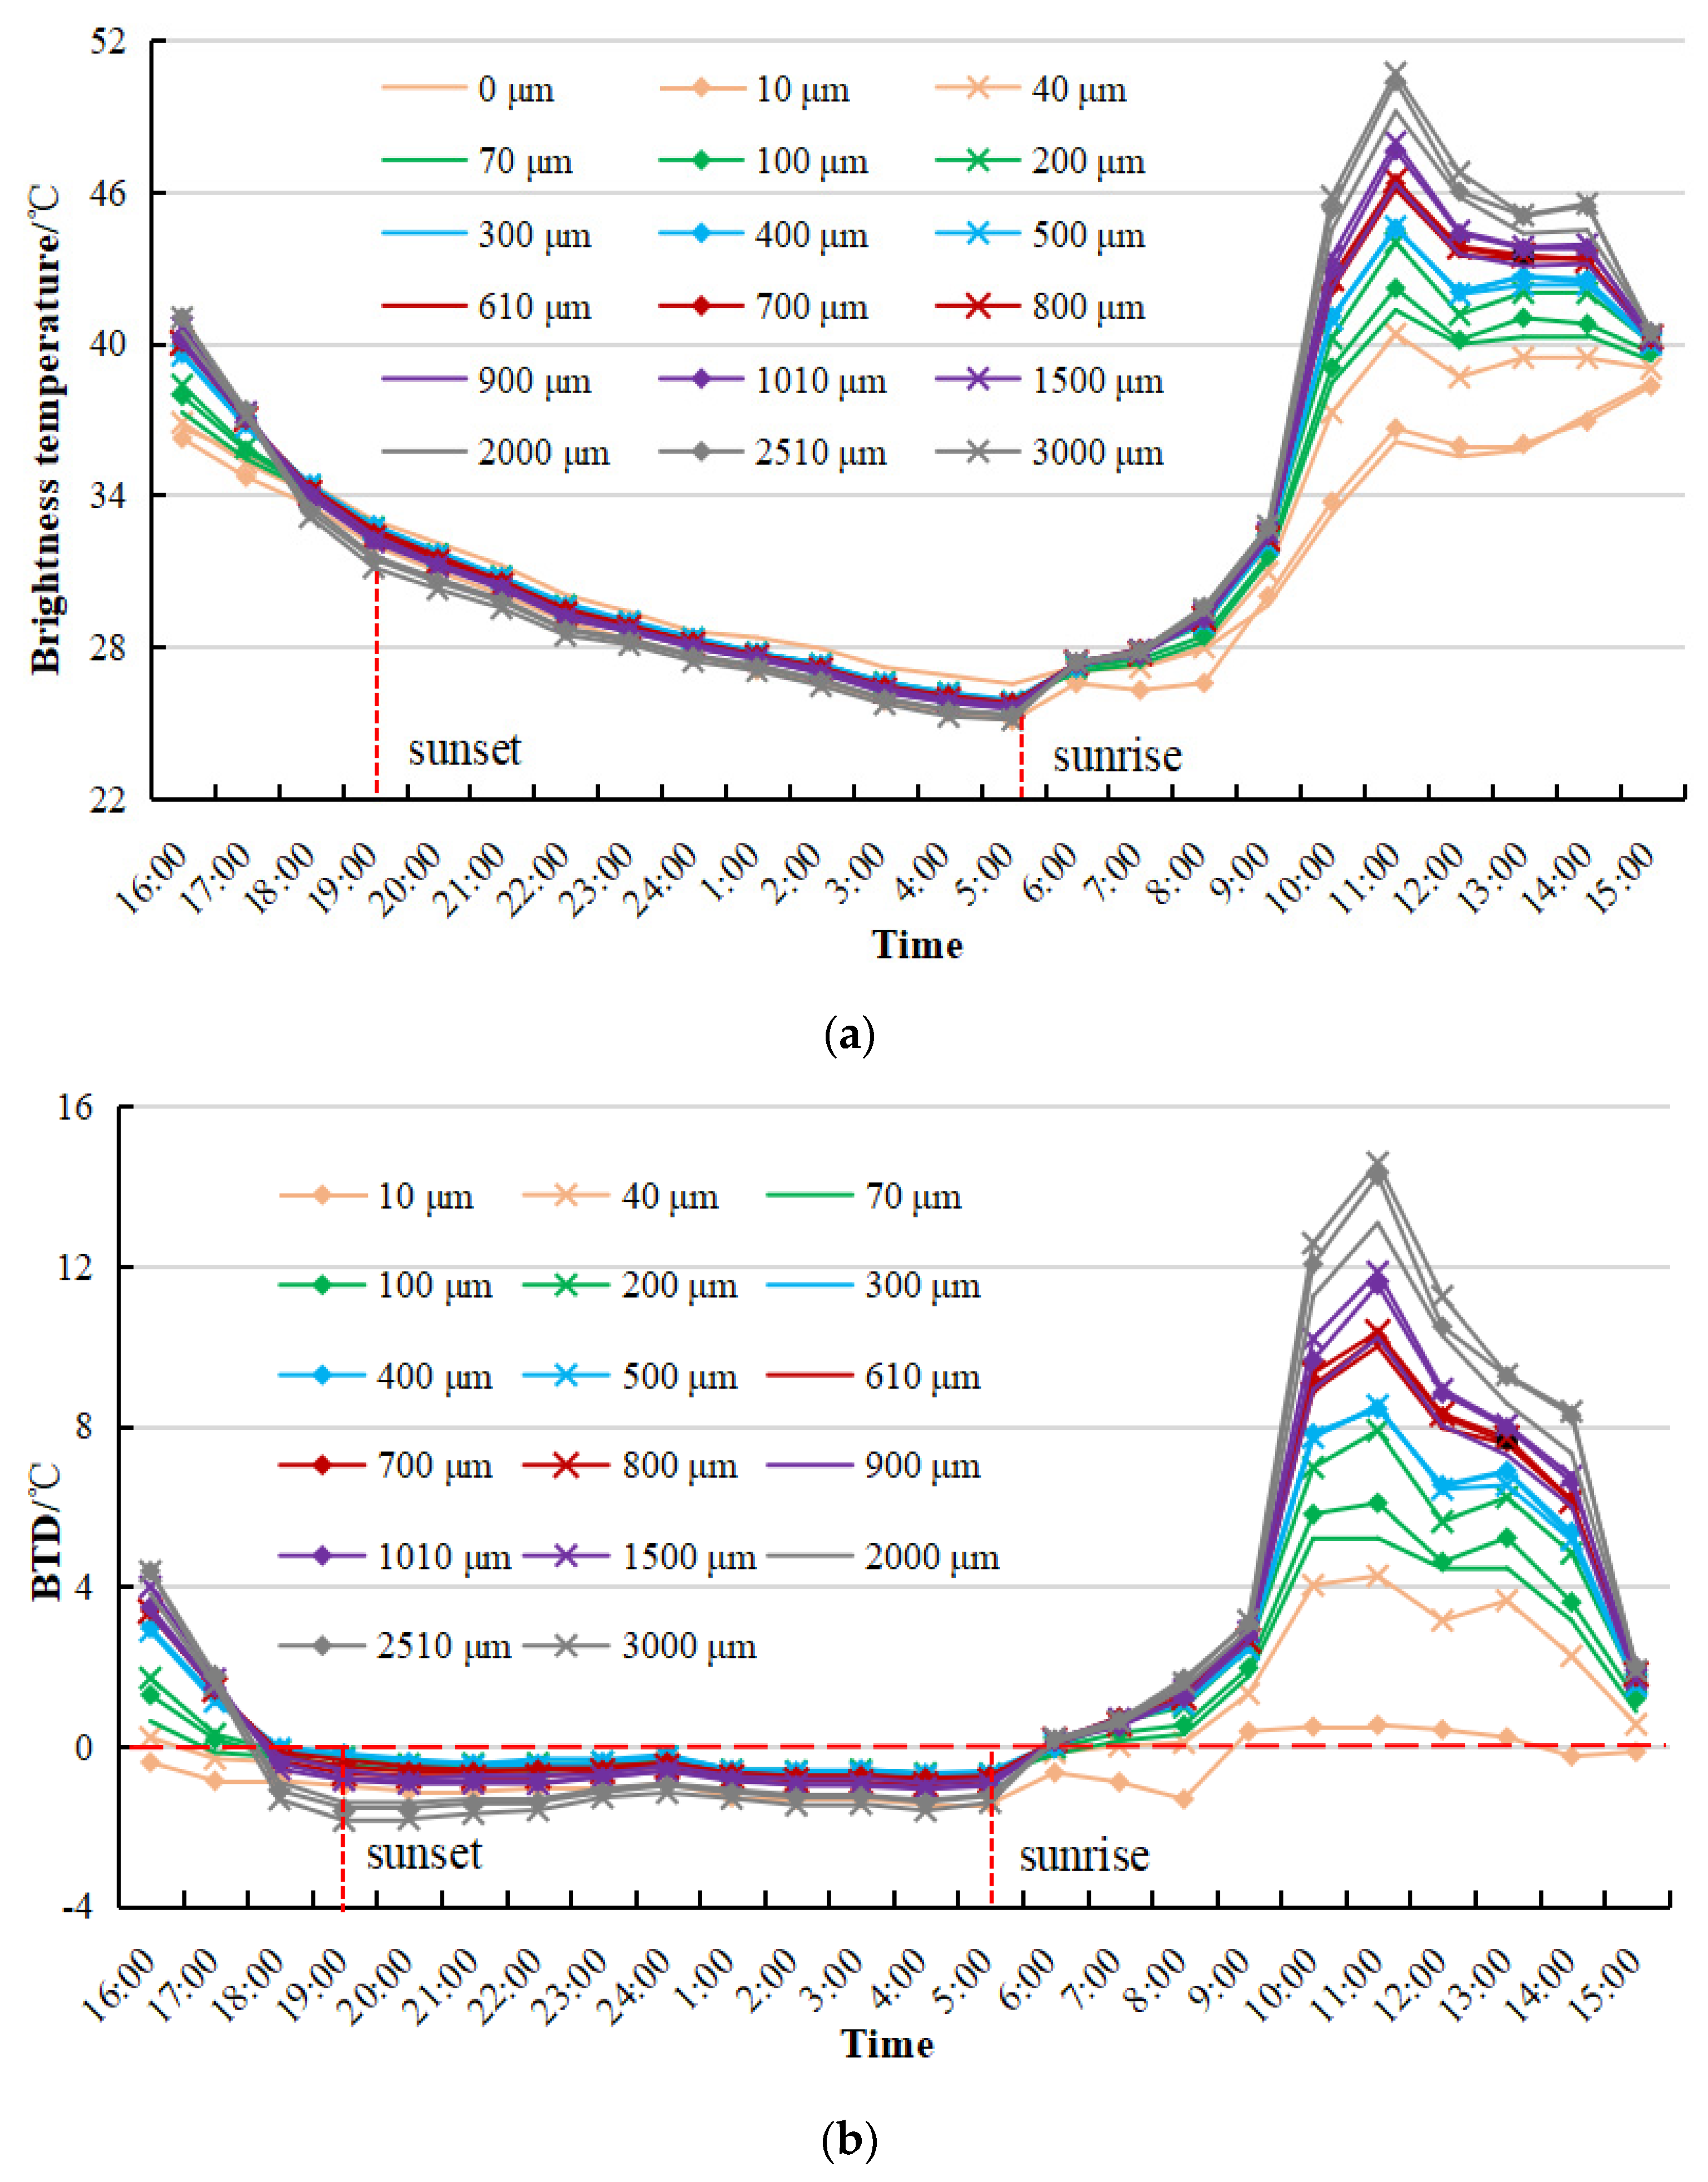
In the experiment, 400 pixels were, respectively, selected for seawater and each thickness of oil film, and the brightness temperature (BT) of 400 pixels was averaged for each thickness of oil film to reduce the influence of accidental factors. The BTs of 17 oil films of different thicknesses and seawater are shown in Figure 5a. The BTs of oil films of different thicknesses exhibit a similar trend. After sunrise, due to solar irradiation, the BTs of the oil films of different thicknesses and seawater increase gradually, reaching their maximum around noon (11:00), and then gradually decreases, reaching their minimum before sunrise (5:00). At the same time, it can be found that under solar irradiation, the BT of the oil film rises faster than that of seawater, because the oil film absorbs more solar radiation than seawater. After sunset, due to the lack of solar irradiation, the BT of the oil film decreases faster than that of seawater.
The BTD between oil films of different thicknesses and seawater are shown in Figure 5b. Under solar irradiation, the BT of the oil film rises faster than that of seawater, resulting in a positive BTD within this time window. When there is a lack of sunlight, the BT of the oil film decreases faster than that of seawater, resulting in a negative BTD within this time window. The BTD between oil films and seawater increases with an increasing OT, reaching its maximum around noon (11:00). The maximum BTD between an oil film of a thickness of 3000 μm and seawater can reach 15 °C at noon. There is a strong correlation between the BTD and OT, indicating that the retrieval results for oil films of different thicknesses should be good using thermal infrared data.
3.2. Retrieval Results of OT
3.2.1. Retrieval Results of OT Using Hyperspectral Data
A total of 200 training samples were selected for each thickness, and the remaining samples were used for testing. The spectral reflectance ratio between each OT and seawater was used as the input for the SVR model. The RBF was chosen as the kernel function of the SVR model, with the optimal penalty parameter determined to be 4.59 and the optimal kernel function parameter set as 0.01 using the grid search method. The retrieval results for oil films of different thicknesses based on hyperspectral images are shown in Figure 6a. Overall, the RMSE of oil films of different thicknesses based on airborne hyperspectral images is 154.31 μm, with MRE of 0.68. Meanwhile, the retrieved values for thinner oil films show larger discrepancies compared with the measured values, while thicker oil films exhibit smaller discrepancies. It should be noted that there is no oil film in the first ring, but some pixels are retrieved as oil films. This is because the airborne hyperspectral imager uses a standard white board for calibration. For weak reflection targets such as a marine oil spill, a standard gray board should be used for calibration, which needs be improved in the next experiment.
3.2.2. Retrieval Results of OT Using Thermal Infrared Data
A total of 400 training samples were selected for each thickness, and the remaining samples were used for testing. Due to the strong correlation between BTD and OT, the BTD between each thickness of oil film and seawater is used as the input for the SVR model. The RBF was chosen as the kernel function of the SVR model, with the optimal penalty parameter determined to be 0.125 and the optimal kernel function parameter set as 2 using the grid search method. The retrieval results of oil films of different thicknesses based on thermal infrared images are shown in Figure 6b. Overall, the RMSE of oil films of different thicknesses based on thermal infrared images is 116.59 μm, with an MRE of 0.27, indicating better retrieval results compared with those based on hyperspectral images. At the same time, it can also be found that the discrepancies between the inversion values and the measured values were smaller for thicker oil films compared with thinner ones.
The thermal infrared imager and the hyperspectral imager are installed on different airborne platforms, and their imaging angles cannot be completely consistent during the measurement process. Based on the circular regions in the hyperspectral data, the registered and cropped thermal infrared image contains some edges of the rings; therefore, there is some information about the rings in Figure 6b.
3.3. The Suitable OT Range for Retrieval Using Hyperspectral and Thermal Infrared Data
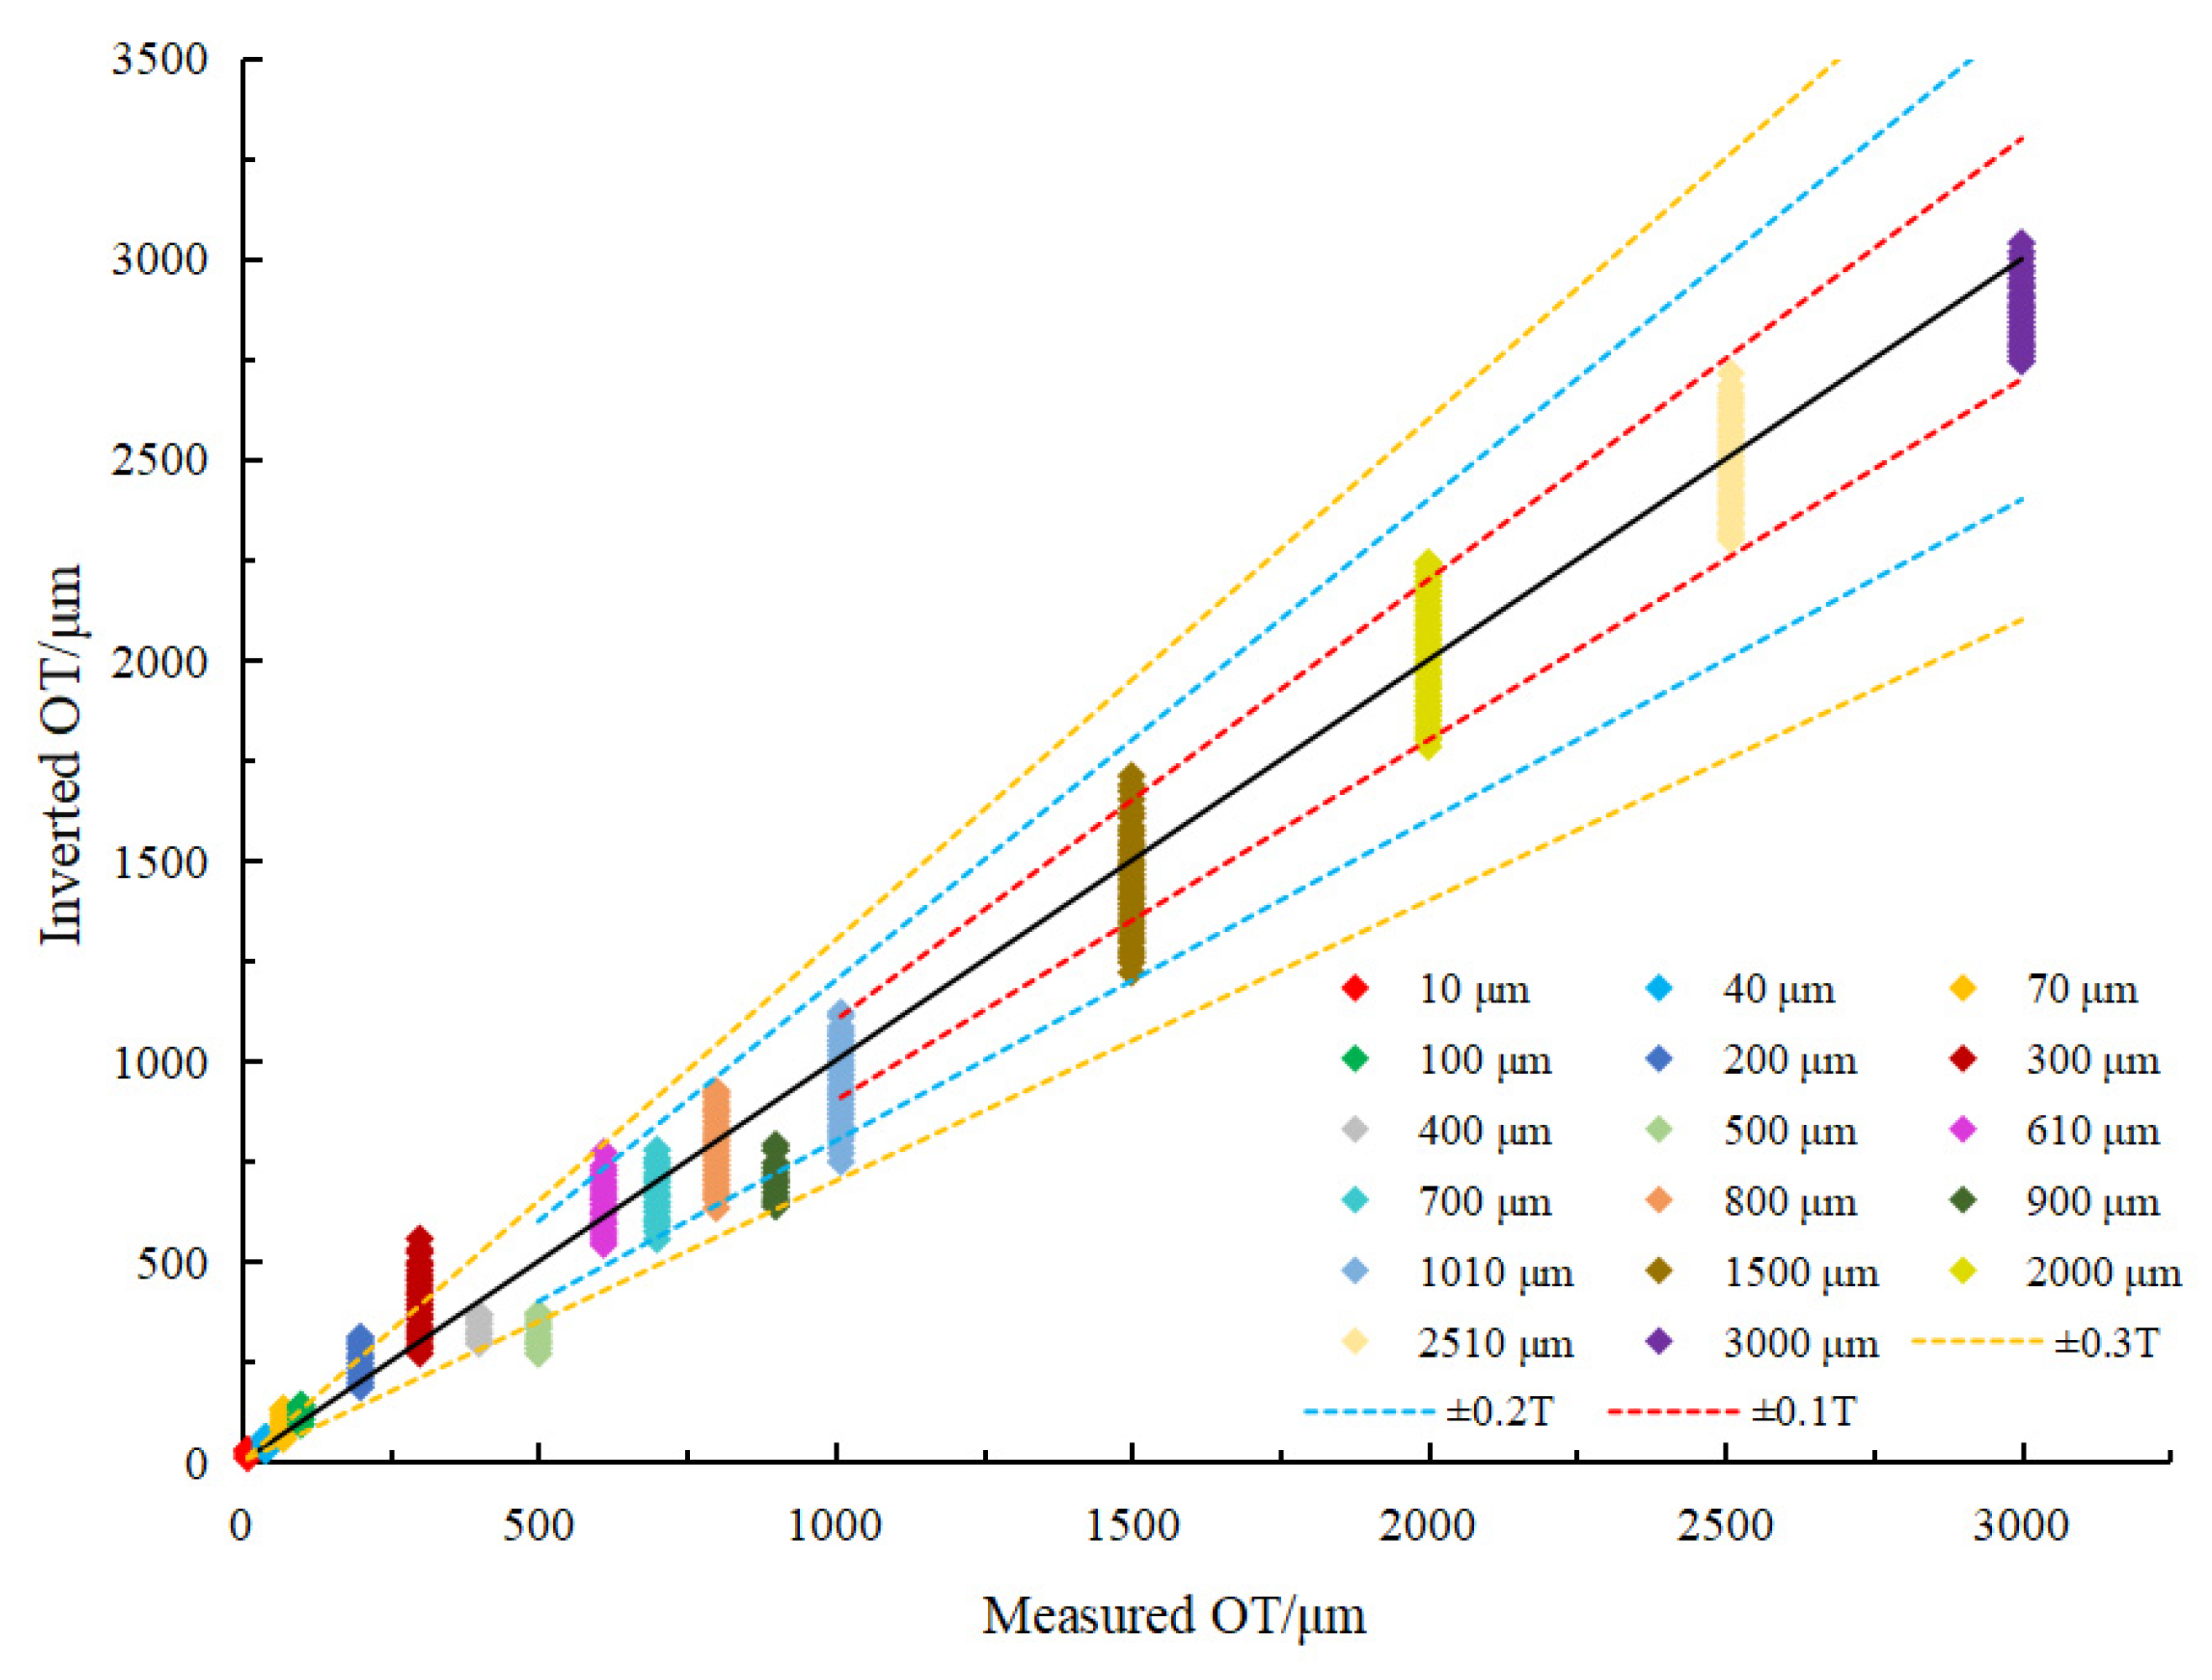
To investigate the suitable range of OT retrieval using hyperspectral and thermal infrared data, the SVR model was used for OT retrieval. The retrieved OT values were compared with the measured OT values. The retrieval error ranges were set for different OTs in the figures. If the retrieval error satisfies Formula (5), it indicates that the hyperspectral or thermal infrared data are suitable for the retrieval of that OT.
where represents reverted OT values (μm), and represents measured OT values (μm).
3.3.1. The Suitable OT Range for Retrieval Using Hyperspectral Data
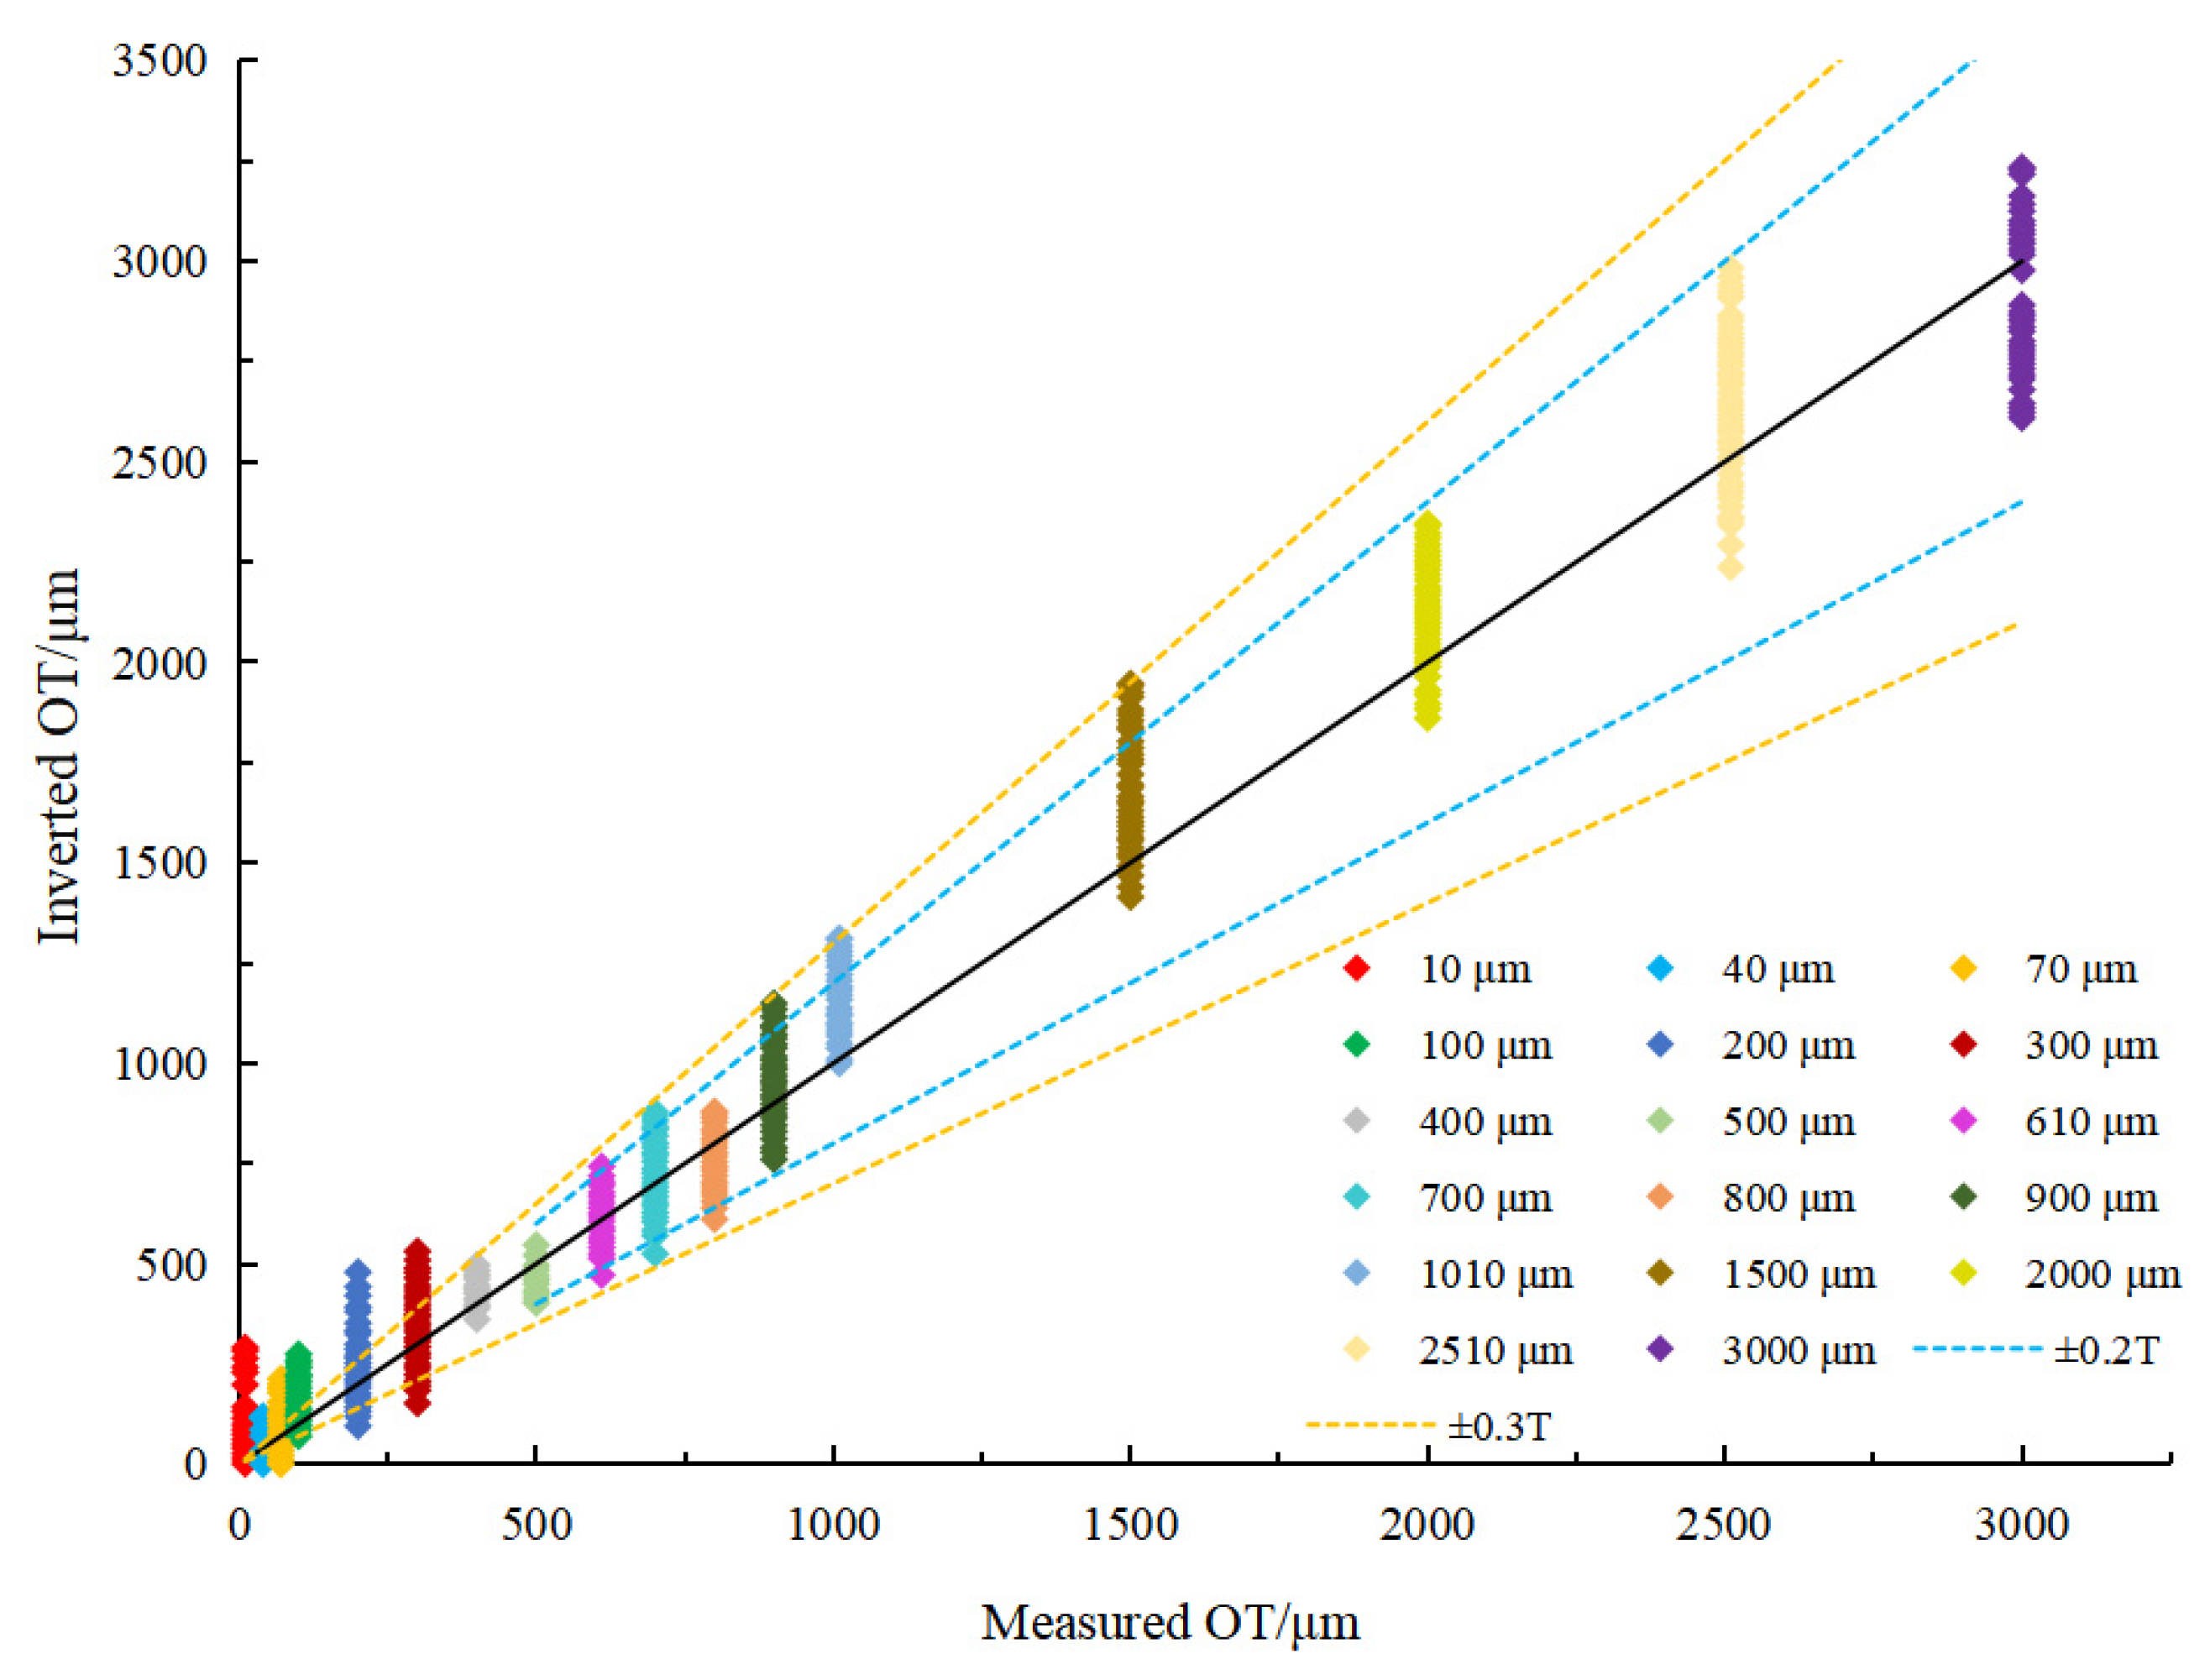
It can be intuitively seen from Figure 7 that the retrieval results of the OTs that are greater than or equal to 400 μm using hyperspectral data are all distributed in the error range of ±0.3T. For example, the retrieval results of an OT of 500 μm are all distributed in the range of between 350 μm (−0.3T) and 650 μm (+0.3T). However, the retrieval results of an OT that is less than 400 μm are mainly distributed outside the error range of ±0.3T. For example, 50% of the retrieval results of an OT of 300 μm are distributed outside the error range between 210 μm (−0.3T) and 390 μm (+0.3T).
According to Figure 7, the retrieval results of the Ots that are greater than or equal to 2000 μm using hyperspectral data are all distributed in the error range of ±0.2T. For example, the retrieval results of an OT of 2000 μm are all distributed in the range of between 1200 μm (−0.2T) and 1800 μm (+0.2T). In summary, it can be considered that the Cubert S185 airborne hyperspectral data (with a spectral range of 450–950 nm) are suitable for retrieving OTs greater than or equal to 400 μm.
3.3.2. The Suitable OT Range for Retrieval Using Thermal Infrared Data
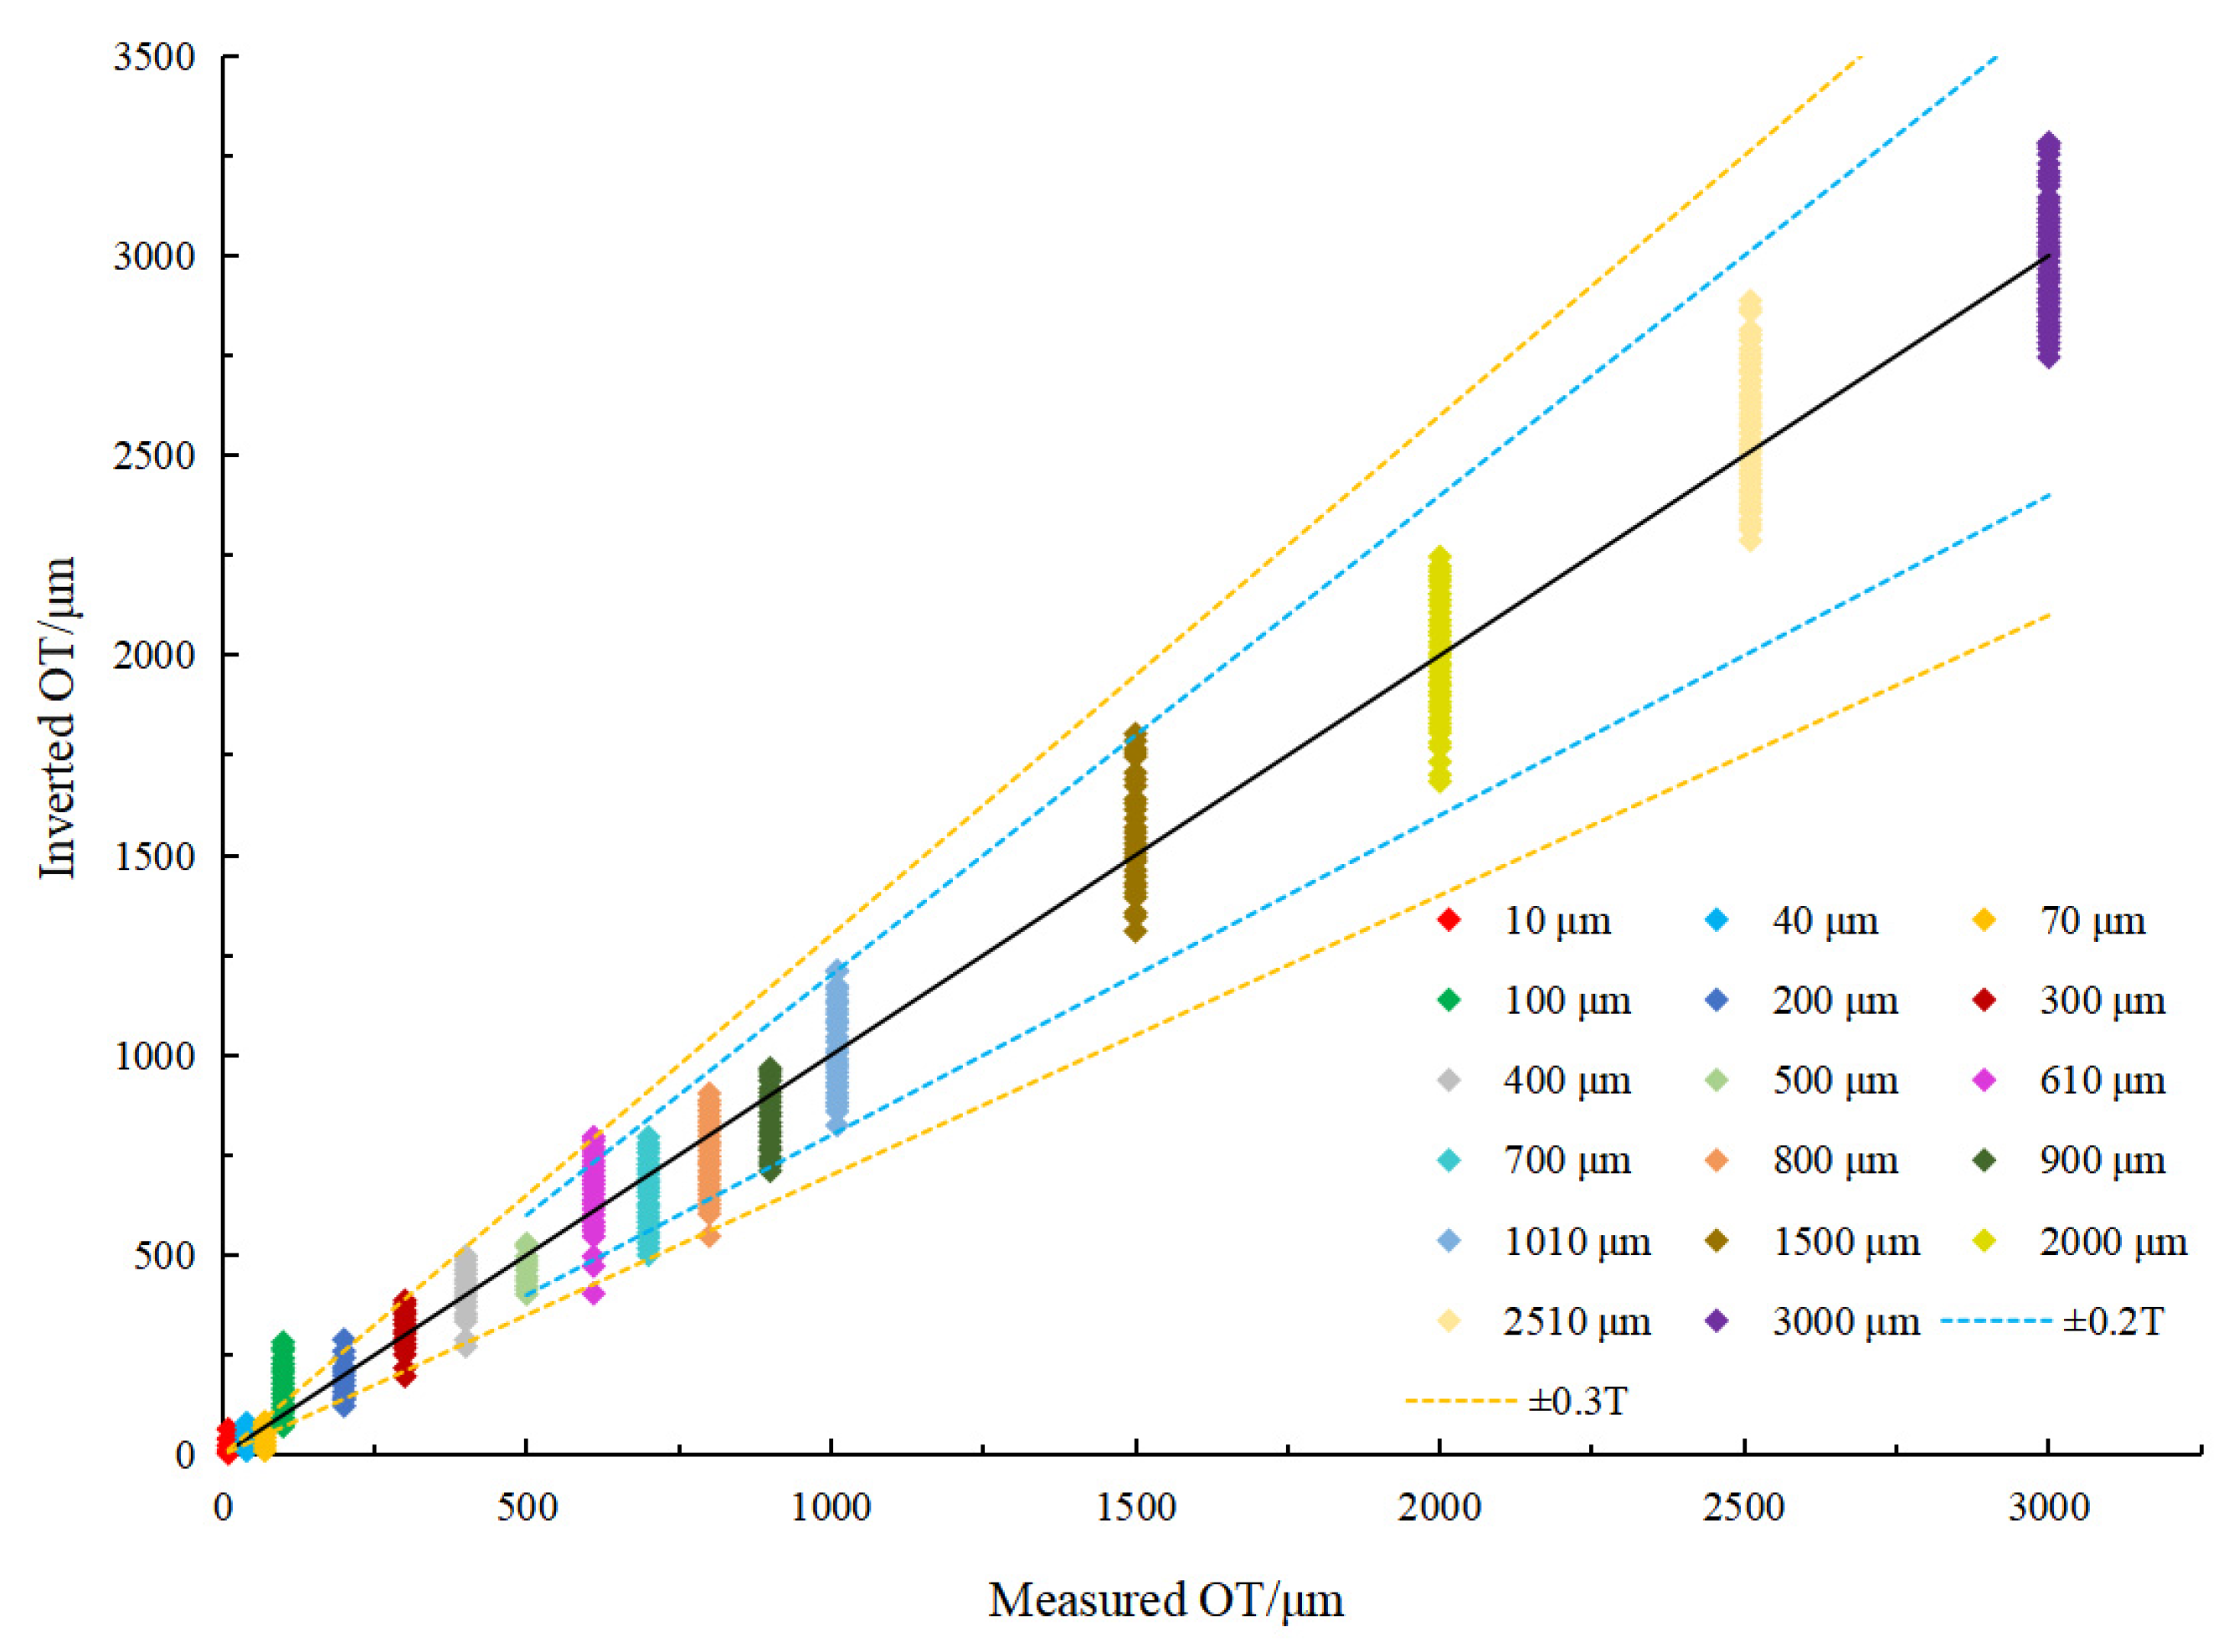
It can be intuitively seen from Figure 8 that the retrieval results of the Ots that are less than or equal to 500 μm using thermal infrared data are mainly distributed outside the error range of ±0.3T. For example, the retrieval results of the OT of 300 μm are not all distributed within the range between 210 μm and 390 μm. The retrieval results of OTs greater than 500 μm are all distributed in the range of ±0.3T. For example, the retrieval results of an OT of 700 μm are all distributed in the range between 490 μm (−0.3T) and 910 μm (+0.3T). In summary, it can be considered that Zenmuse H20T airborne thermal infrared data (NETD ≤ 50 mK) are suitable for retrieving OTs greater than 500 μm.
According to Figure 8, the retrieval results of an OT greater than 1000 μm using thermal infrared data are all distributed in the error range of ±0.2T. The retrieval results of an OT greater than 1500 μm using thermal infrared data are all distributed in the error range of ±0.1T. This reflects that thermal infrared remote sensing has better retrieval accuracy for thicker oil films.
3.3.3. OT Derived from Decision-Level Fusion of Hyperspectral and Thermal Infrared Remote Sensing
We used the decision-level fusion algorithm based on the fuzzy membership degree to fuse the OTs retrieved from the airborne hyperspectral data and thermal infrared data. Overall, the RMSE of oil films of different thicknesses in the result of decision-level fusion reaches 104.53 μm, which is an improvement of 49.78 μm and 12.06 μm compared with the retrieval results based on the hyperspectral and thermal infrared data, respectively. The MRE of oil films of different thicknesses in the result of decision-level fusion reaches 0.25, which is an improvement of 0.43 and 0.02 compared with the retrieval results based on the hyperspectral and thermal infrared data, respectively. According to Figure 9, the retrieval results for OTs greater than or equal to 500 μm in the decision-level fusion result are all within an error range of ±0.2T. However, 50% of the retrieval results for OTs smaller than 500 μm are outside the error range of ±0.3T. This indicates that the decision-level fusion algorithm can effectively synergize the two techniques for retrieving the OT. However, it is important to note that the decision-level fusion algorithm cannot improve the results for thicknesses where both techniques perform poorly.
4. Discussion
4.1. The Possibility of Detecting WO emulsions of Different Thicknesses Using Hyperspectral and Thermal Infrared Remote Sensing
WO emulsions refer to the dispersion of seawater in the form of small droplets within a continuous phase of crude oil, whereas OW emulsions refer to the dispersion of crude oil in the form of small droplets within a continuous phase of seawater. WO emulsions represent a transitional state during the conversion of non-emulsified oil into OW emulsions. Once they transform into OW emulsions, the difficulty of handling them increases significantly, making it even more challenging to estimate the amount of spilled oil accurately. Therefore, accurate monitoring of WO emulsions is essential for the protection of the marine environment.
Similarly, hyperspectral and thermal infrared images of WO emulsions of four thicknesses (500 μm, 1500 μm, 2500 μm, 3500 μm) at different concentrations (100%, 90%, 75%, 60%) were synchronously obtained using the Cubert S185 airborne hyperspectral imager and the Zenmuse H20T airborne thermal infrared imager. The WO emulsions were prepared in the laboratory using a high-speed dispersion machine and emulsifier according to the method of Lu et al. [44]. On the basis of analyzing the spectral and thermal responses of WO emulsions of different thicknesses at the same concentration, the possibility of detecting WO emulsions of different thicknesses using hyperspectral and thermal infrared remote sensing is explored in this section.
4.1.1. Spectral Characteristics Analysis of WO Emulsions of Different Thicknesses at the Same Concentration
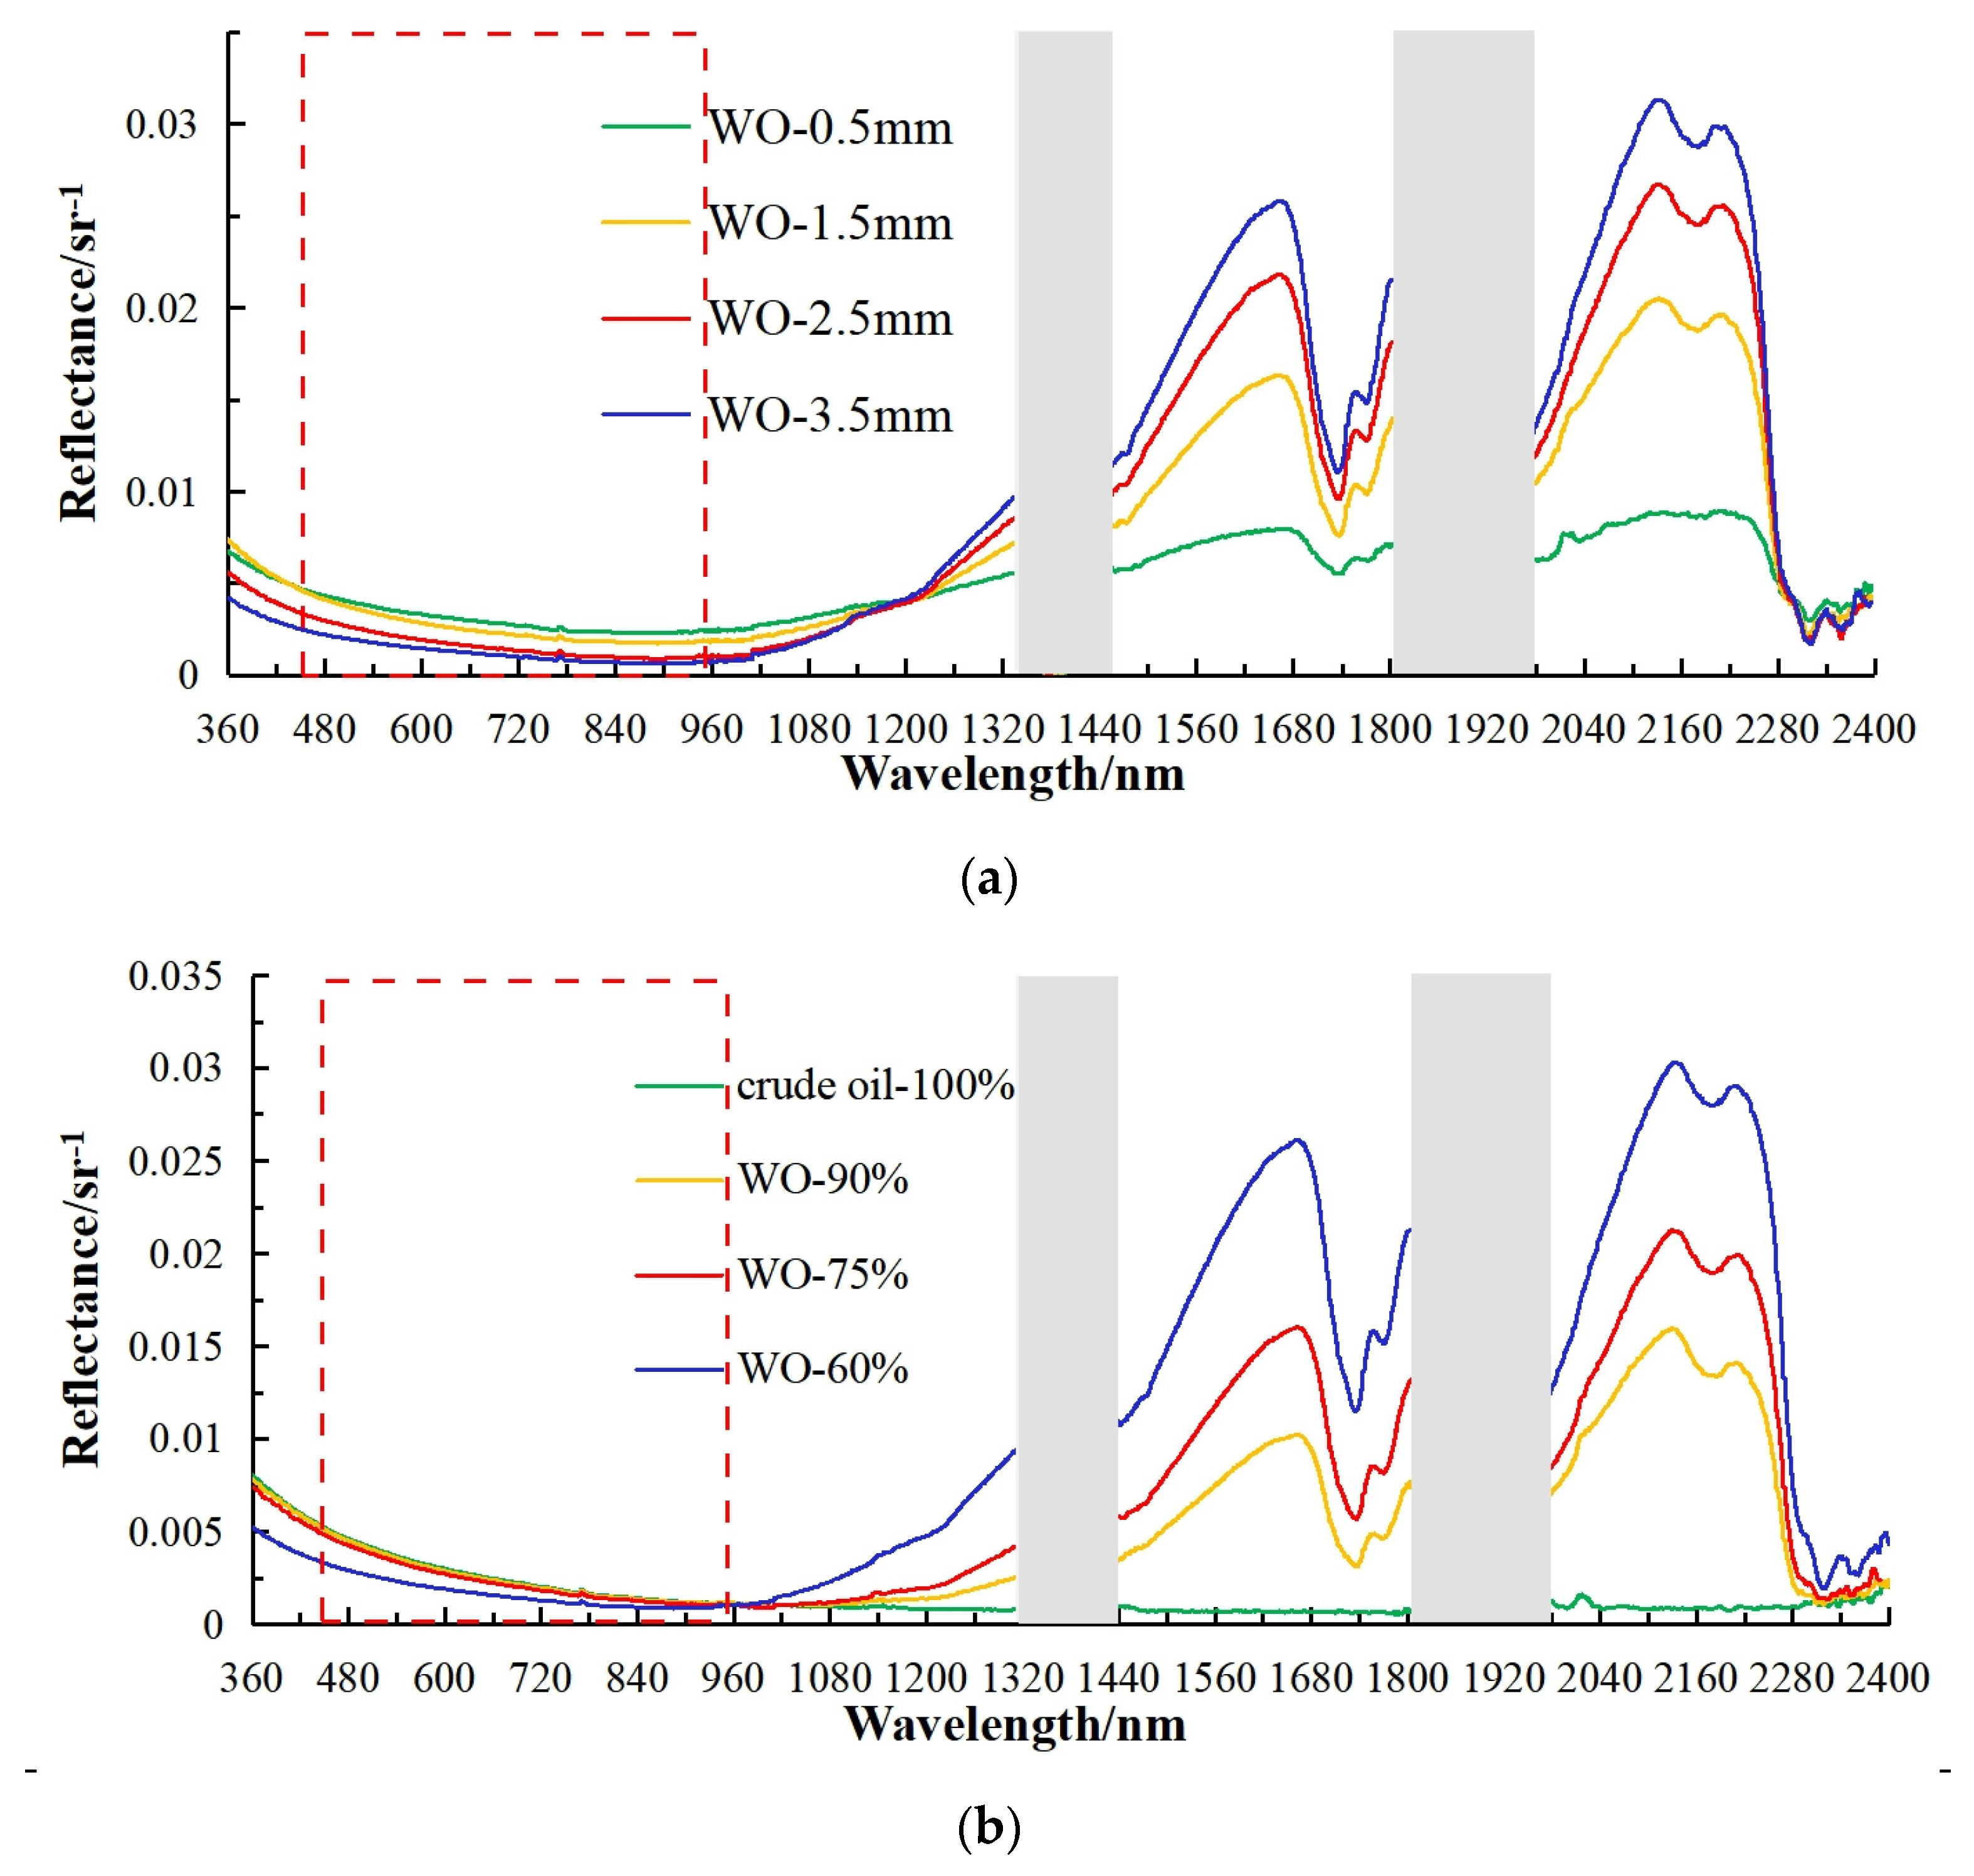
WO emulsions exhibit a strong spectral response in the spectral range of near-infrared and shortwave infrared. Particularly, prominent reflection peaks are observed at ~1650 nm, ~2125 nm, and ~2200 nm, attributed to the absorption of C-H within WO emulsions. The spectral reflectance of WO emulsions at the same concentrations gradually decreases with the increase in thickness in the spectral range under 1200 nm (Figure 10a). However, the spectral reflectance of WO emulsions gradually increases with the increase in thickness in the spectral range greater than 1200 nm [44,53]. For WO emulsions at different concentrations of the same thickness, the spectral reflectance of WO emulsions gradually increases with increasing concentration in the spectral range under 1000 nm. However, the spectral reflectance of WO emulsions gradually decreases with increasing concentration in the spectral range greater than 1000 nm (Figure 10b).
In the spectral range of airborne hyperspectral images (450~950 nm), there are differences in the spectral response of WO emulsions of different thicknesses at the same concentration, as well as in WO emulsions at different concentrations of the same thickness. Therefore, it is theoretically estimated that the retrieval results of WO emulsion thickness using hyperspectral images should be good. However, this is based on the inference of WO emulsions of larger thickness intervals in the experimental design. Further experiments are needed for thickness retrieval of WO emulsions of smaller thickness intervals using hyperspectral data.
4.1.2. Thermal Characteristics Analysis of WO Emulsions of Different Thicknesses at the Same Concentration
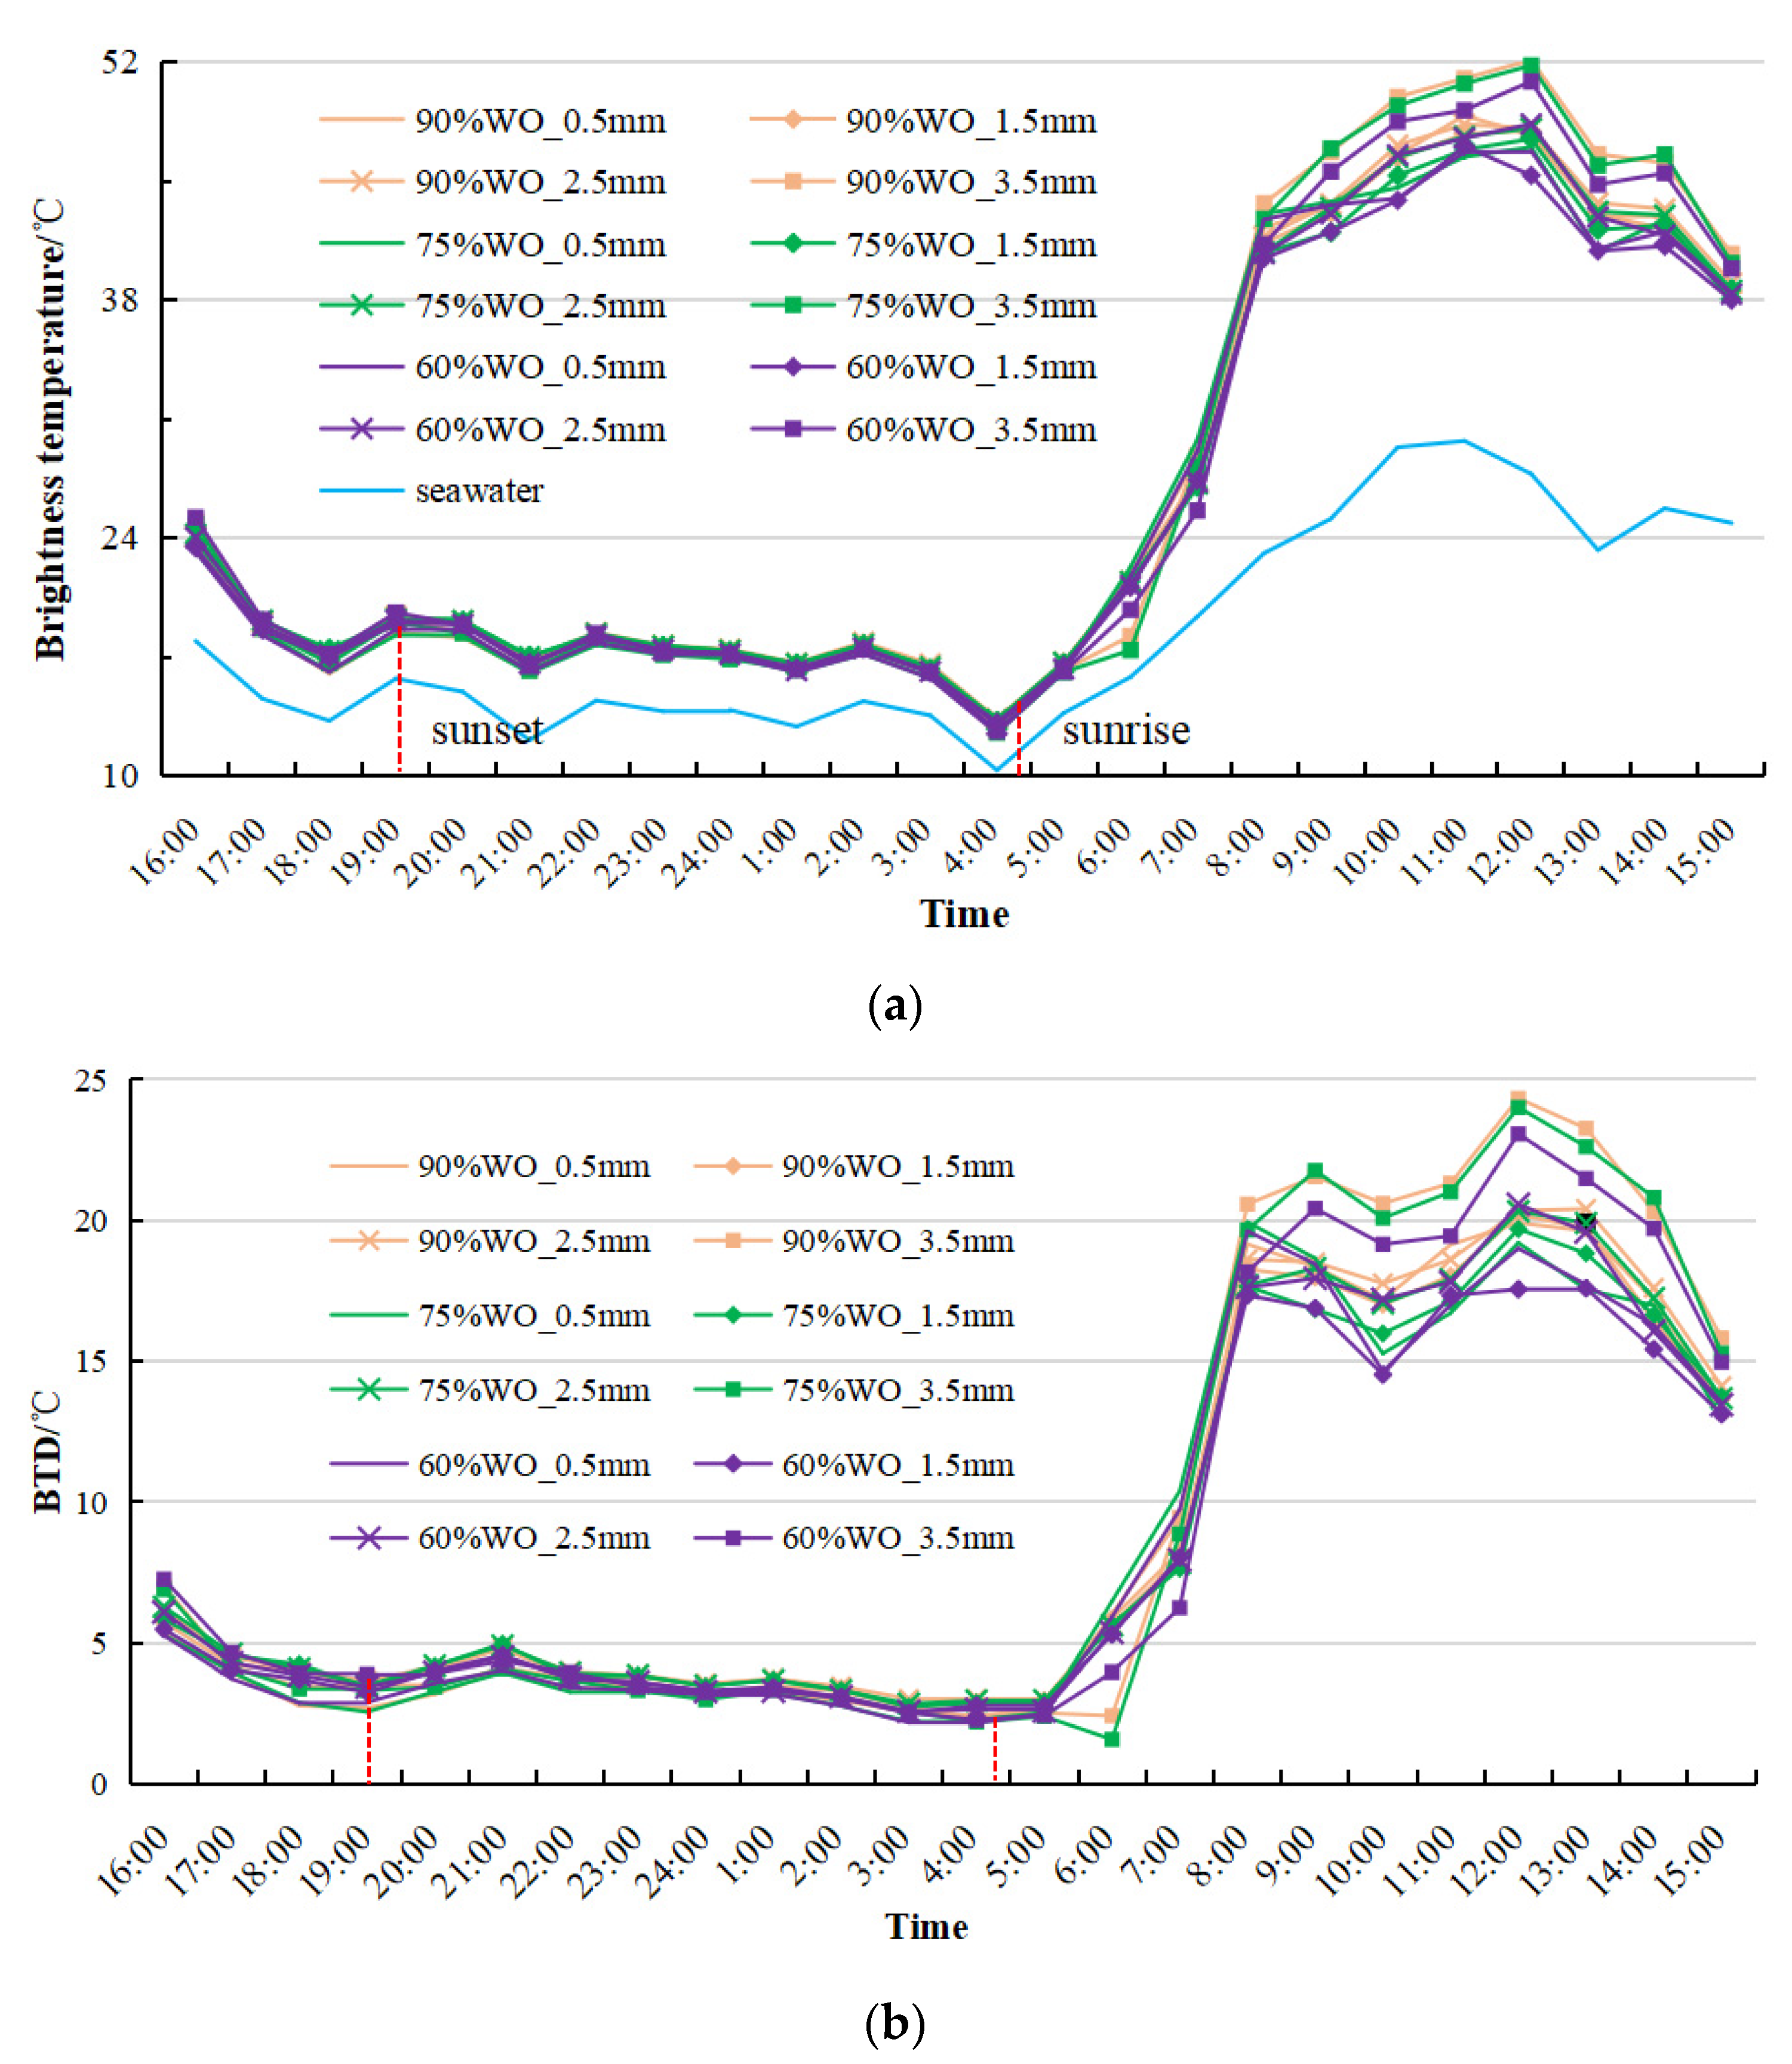
A total of 400 pixels of seawater and WO emulsions of four thicknesses (0.5 μm, 1.5 μm, 2.5 μm, 3.5 μm) at different concentrations (60%, 75%, 90%) were, respectively, selected, and the BT of the 400 pixels was averaged to reduce the influence of accidental factors. The BTs of the WO emulsions of four thicknesses at different concentrations and seawater are shown in Figure 11a. The variation trend of BTs for WO emulsions of four thicknesses at different concentrations over time is similar. After sunrise (4:47), the BTs of the WO emulsions of different thicknesses and seawater increase over time due to solar irradiation, reaching their maximum around noon (11:00–13:00), and then gradually decrease until reaching their minimum before sunrise. At the same time, it can be observed that under solar irradiation, the BTs of the WO emulsions increase faster than that of seawater. After sunset (19:02), due to the lack of solar irradiation, the BTs of the WO emulsions decrease faster than that of seawater, but the BTs of the WO emulsions are always higher than that of seawater.
In contrast to the BTDs of crude oil films of different thicknesses and seawater, the BTDs of WO emulsions of four thicknesses at different concentrations and seawater consistently exceeds 0 for 24 consecutive hours (Figure 11b). The BTDs of the WO emulsions increase with the increase in thickness and concentration, with thickness playing a dominant role, and reach their maximum around noon (12:00). The maximum of the BTDs for a WO emulsion of a thickness of 3500 μm at different concentrations can all reach 23 °C at noon. The BTDs show a correlation with thickness between 10:00 and 14:00, indicating a certain quantification capability for WO emulsions of different thicknesses using thermal infrared data. However, further research is needed for thickness quantification of WO emulsions of smaller thickness intervals using thermal infrared data.
4.2. Factors Affecting Experimental Results and Applicability
The acquisition of relevant data in the experiment was carried out under relatively controllable conditions, but there are still many shortcomings that restrict the generalizability of the above experimental results to other environments. Factors that may affect the experimental results are as follows:
- (1)
- Deviations in crude oil quality measurement: The OT is calculated by dividing the mass of crude oil dropped into the ring with the density of oil and the area of the ring. According to the preset OT, the mass of crude oil that needs to be dropped into the ring is calculated. However, due to the limitations of the dropper, the mass of crude oil in the same ring needs to be weighed repeatedly to reach the desired thickness. The measurement error will directly affect the accuracy of the OT.
- (2)
- Not completely uniform OT: The oil films are placed in small circular rings to ensure a uniform diffusion as much as possible. However, it cannot be guaranteed that the OT of the selected training samples within the same circular ring is completely uniform. This can affect the accuracy of estimating the OT using the model.
- (3)
- Asynchronicity in data acquisition: The experiment uses an airborne hyperspectral imager and an airborne thermal infrared imager to obtain the OT data separately. Although the time interval between the two imaging processes is minimized, the two sensors are not on the same drone, making it impossible to obtain synchronous data at the same imaging angle. This can have a certain impact on estimating the OT.
- (4)
- The effects of solar elevation angle, air temperature, wind speed, and evaporation are not analyzed: The experiment was conducted for 24 consecutive hours. Under certain sensor sensitivity conditions, a different solar elevation angle can directly affect the quality of the spectrum and brightness temperature data. At the same time, the oil film may evaporate with changes in temperature and wind speed, which may affect the estimation of the OT.
- (5)
- Insufficient consideration of substrate type and environmental factors: Different water quality conditions, seawater depths, and marine substrate types have different effects on the reflectance spectra. The size of the plastic tank used in this experiment is limited, and the experimental environment is relatively ideal, which is significantly different from the real ocean boundary conditions. This directly affects the effectiveness of the experimental results in real marine applications.
- (6)
- There is still significant room for improvement in terms of the practical applications of airborne sensors: Although unmanned aerial sensors have the advantage of maneuverability and flexibility, their single strip imaging width is currently limited by the sensor’s field-of-view angle and flight altitude. Furthermore, their endurance and storage capacity can also impact the practical application.
5. Conclusions
This study is a preliminary study on combined retrieval of oil spill thickness using hyperspectral and thermal infrared remote sensing. Based on the airborne hyperspectral and thermal infrared data acquired for oil films of different thicknesses, the spectral response and thermal response of these oil films were analyzed. The SVR model was used to perform OT retrieval based on the airborne hyperspectral and infrared data. On this basis, the suitable range for retrieving the OT using hyperspectral and thermal infrared remote sensing was investigated. Meanwhile, the decision-level fusion algorithm was developed to integrate the retrieval results for the OT of hyperspectral and thermal infrared remote sensing.
The following conclusions can be drawn from this paper: (1) Based on airborne hyperspectral data and thermal infrared data, the retrieval accuracy (RMSE) of oil films of different thicknesses using the classic SVR model reached 154.31 μm and 116.59 μm, respectively. (2) The Cubert S185 airborne hyperspectral data (with a spectral range of 450~950 nm) are beneficial for retrieving thicknesses greater than or equal to 400 μm, and the Zenmuse H20T airborne thermal infrared data (NETD ≤ 50 mK) are beneficial for retrieving thicknesses greater than 500 μm. (3) The result of decision-level fusion based on the fuzzy membership degree is better than those of the single sensors, indicating that it can better integrate the retrieval results for OT using hyperspectral and thermal infrared remote sensing.
Furthermore, factors that may affect the experimental results were discussed, including deviations in the oil quality measurement, not completely uniform OTs, asynchronicity in data acquisition, the failure to analyze the impact of solar elevation angle and wind speed on the estimation of OT, insufficient consideration of substrate type and environmental factors, and the further improvement of airborne sensors in practical applications. In addition, the spectral and thermal responses of WO emulsions of four thicknesses (500 μm, 1500 μm, 2500 μm, 3500 μm) at the different concentrations (100%, 90%, 75%, 60%) were analyzed to explore the possibility of using hyperspectral and thermal infrared remote sensing to detect WO emulsions.
Next, it is necessary to explore the feasibility of applying relevant experimental results to real marine oil spill scenarios and spaceborne hyperspectral and thermal infrared remote sensing, aiming to provide technical support for emergency monitoring of marine oil spills. Additionally, in the future, hyperspectral and thermal infrared coaxial integrated systems can be developed to synchronously obtain oil spill images containing different thicknesses of oil films, and based on this, model applications can be analyzed and carried out.
Author Contributions
Conceptualization, J.Y. and Y.H.; methodology, J.Y., Y.H. and M.W.; software, J.Y., Y.H., M.W. and N.Z.; validation, J.Y., M.W. and N.Z.; formal analysis, J.Y. and Y.H.; data curation, J.Y.; writing—original draft preparation, J.Y.; writing—review and editing, J.Y. and Y.H.; supervision, Y.M., Z.L. and J.Z.; project administration, J.Y. and J.Z.; funding acquisition, J.Y., J.Z. and Y.M. All authors have read and agreed to the published version of the manuscript.
Funding
This research was funded by the National Natural Science Foundation of China (Grant No. 42206177, No. U1906217, No. 61890964), Shandong Provincial Natural Science Foundation (Grant No. ZR2022QD075), Qingdao Postdoctoral Application Research Project (Grant No. qdyy20210082), Fund of Technology Innovation Center for Ocean Telemetry, Ministry of Natural Resources (Grant No. 2022004), and the Fundamental Research Funds for the Central Universities (Grant No. 21CX06057A).
Data Availability Statement
The data used in this study are available on request from the first author.
Acknowledgments
Thanks to the reviewers and editors for their valuable and constructive comments, which have significantly improved the manuscript.
Conflicts of Interest
The authors declare no conflict of interest. The funders had no role in the design of the study; in the collection, analyses, or interpretation of data; in the writing of the manuscript; or in the decision to publish the results.
References
- Shi, J.; Jiao, J.N.; Lu, Y.C.; Zhang, M.W.; Mao, Z.H.; Liu, Y.X. Determining spectral groups to distinguish oil emulsions from Sargassum over the Gulf of Mexico using an airborne imaging spectrometer. ISPRS J. Photog. Remote Sens. 2018, 146, 251–259. [Google Scholar] [CrossRef]
- Lu, Y.C.; Shi, J.; Wen, Y.S.; Hu, C.M.; Zhou, Y.; Sun, S.J.; Zhang, M.W.; Mao, Z.H.; Liu, Y.X. Optical interpretation of oil emulsions in the ocean—Part I: Laboratory measurements and proof-of-concept with AVIRIS observations. Remote Sens. Environ. 2019, 230, 111183. [Google Scholar] [CrossRef]
- National Research Council. Oil in the Sea III-Inputs, Fates and Effects; National Academic Press: Washington, DC, USA, 2003. [Google Scholar]
- Sun, S.J.; Hu, C.M.; Garcia-Pineda, O.; Kourafalou, V.; Le Henaff, M.; Androulidakis, Y. Remote sensing assessment of oil spills near a damaged platform in the Gulf of Mexico. Mar. Pollut. Bull. 2018, 136, 141–151. [Google Scholar] [CrossRef] [PubMed]
- Sun, S.J.; Lu, Y.C.; Liu, Y.X.; Wang, M.Q.; Hu, C.M. Tracking an oil tanker collision and spilled oils in the East China Sea using multisensor day and night satellite imagery. Geophys. Res. Lett. 2018, 45, 3212–3220. [Google Scholar] [CrossRef]
- Yin, L.P.; Zhang, M.; Zhang, Y.L.; Qiao, F.L. The long-term prediction of the oil-contaminated water from the Sanchi collision in the East China Sea. Acta Oceanol. Sin. 2018, 37, 69–72. [Google Scholar] [CrossRef]
- Yang, J.F.; Wan, J.H.; Ma, Y.; Zhang, J.; Hu, Y.B.; Jiang, Z.C. Oil spill hyperspectral remote sensing detection based on DCNN with multi-scale features. J. Coast. Res. 2019, 90, 332–339. [Google Scholar] [CrossRef]
- Rajendran, S.; Vethamony, P.; Sadooni, F.N.; Al-Kuwari, H.A.; Al-Khayat, J.A.; Govil, H.; Nasir, S. Sentinel-2 image transformation methods for mapping oil spill—A case study with Wakashio oil spill in the Indian Ocean, off Mauritius. MethodsX 2021, 8, 101327. [Google Scholar] [CrossRef]
- Moura, N.V.A.; Carvalho, O.L.F.; Gomes, R.A.T.; Guimaraes, R.F.; Junior, O.A.C. Deep-water oil-spill monitoring and recurrence analysis in the Brazilian territory using Sentinel-1 time series and deep learning. Int. J. Appl. Earth Observ. Geoinf. 2022, 107, 102695. [Google Scholar] [CrossRef]
- Yang, J.F.; Ma, Y.; Hu, Y.B.; Jiang, Z.C.; Zhang, J.; Wan, J.H.; Li, Z.W. Decision fusion of deep learning and shallow learning for marine oil spill detection. Remote Sens. 2022, 14, 666. [Google Scholar] [CrossRef]
- Lu, Y.C.; Tian, Q.J.; Qi, X.P.; Wang, J.J.; Wang, X.C. Spectral response analysis of offshore thin oil slicks. J. Spectros. Spect. Anal. 2009, 29, 986–989. [Google Scholar]
- Fan, S.A.; Huang, X.X.; Yin, D.Y.; Xu, C.; Feng, X.; Feng, Q. Research of the ultraviolet reflectivity characteristic of simulative targets of oil spill on the ocean. J. Spectros. Spect. Anal. 2010, 30, 738–742. [Google Scholar]
- Suo, Z.Y.; Lu, Y.C.; Liu, J.Q.; Ding, J.; Yin, D.Y.; Xu, F.F.; Jiao, J.N. Ultraviolet remote sensing of marine oil spills: A new approach of HaiYang-1C satellite. Opt. Exp. 2021, 29, 13486–13495. [Google Scholar] [CrossRef] [PubMed]
- Carolis, G.D.; Adamo, M.; Pasquariello, G. On the estimation of thickness of marine oil slicks from sun-glittered, near-infrared MERIS and MODIS imagery: The Lebanon oil spill case study. IEEE Trans. Geosci. Remote Sens. 2014, 52, 559–573. [Google Scholar] [CrossRef]
- Sun, S.J.; Hu, C.M.; Feng, L.; Swayze, G.A.; Holmes, J.; Graettinger, G.; MacDonald, I.; Garcia, O.; Leifer, I. Oil slick morphology derived from AVIRIS measurements of the Deepwater Horizon oil spill: Implications for spatial resolution requirements of remote sensors. Mar. Pollut. Bull. 2016, 103, 276–285. [Google Scholar] [CrossRef]
- Hu, C.M.; Feng, L.; Holmes, J.; Swayze, G.A.; Leifer, I.; Melton, C.; Garcia, O.; MacDonald, I.; Hess, M.; Muller, F.; et al. Remote sensing estimation of surface oil volume during the 2010 Deepwater Horizon oil blowout in the Gulf of Mexico: Scaling up AVIRIS observations with MODIS measurements. J. Appl. Remote Sens. 2018, 12, 026008. [Google Scholar] [CrossRef]
- Wettle, M.; Daniel, P.J.; Logan, G.A.; Thankappan, M. Assessing the effect of hydrocarbon oil type and thickness on a remote sensing signal: A sensitivity study based on the optical properties of two different oil types and the HYMAP and Quickbird sensors. Remote Sens. Environ. 2009, 113, 2000–2010. [Google Scholar] [CrossRef]
- Yang, J.F.; Wan, J.H.; Ma, Y.; Zhang, J.; Hu, Y.B. Characterization analysis and identification of common marine oil spill types using hyperspectral remote sensing. Int. J. Remote Sens. 2020, 41, 7163–7185. [Google Scholar] [CrossRef]
- Jiang, Z.C.; Zhang, J.; Ma, Y.; Mao, X.P. Hyperspectral remote sensing detection of marine oil spills using an adaptive long-term moment estimation optimizer. Remote Sens. 2021, 141, 157. [Google Scholar] [CrossRef]
- Wang, J.; Li, Z.W.; Yang, J.F.; Liu, S.W.; Zhang, J.; Li, S.B. A multilevel spatial and spectral feature extraction network for marine oil spill monitoring using airborne hyperspectral image. Remote Sens. 2023, 15, 1302. [Google Scholar] [CrossRef]
- Lu, Y.C.; Tian, Q.J.; Wang, X.Y.; Zheng, G.; Li, X. Determining oil slick thickness using hyperspectral remote sensing in the Bohai Sea of China. Int. J. Dig. Earth 2013, 6, 76–93. [Google Scholar] [CrossRef]
- Svejkovsky, J.; Hess, M.; Muskat, J.; Nedwed, T.J.; Mccall, J.; Garcia, O. Characterization of surface oil thickness distribution patterns observed during the Deepwater Horizon (MC-252) oil spill with aerial and satellite remote sensing. Mar. Pollut. Bull. 2016, 110, 162–176. [Google Scholar] [CrossRef] [PubMed]
- Ren, G.B.; Guo, J.; Ma, Y.; Luo, X.D. Oil spill detection and slick thickness measurement via UAV hyperspectral imaging. Haiyang Xuebao 2019, 41, 146–158. [Google Scholar]
- Zhu, X.; Li, Y.; Zhang, Q.; Liu, B. Oil film classification using deep learning-based hyperspectral remote sensing technology. ISPRS Int. J. Geo-Inf. 2019, 8, 181. [Google Scholar] [CrossRef]
- Duan, P.H.; Lai, J.B.; Kang, J.; Kang, X.D.; Ghamisi, P.; Li, S.T. Texture-aware total variation-based removal of sun glint in hyperspectral images. ISPRS J. Photog. Remote Sens. 2020, 166, 359–372. [Google Scholar] [CrossRef]
- Hu, C.M.; Lu, Y.C.; Sun, S.J.; Liu, Y.X. Optical remote sensing of oil spills in the ocean: What is really possible? J. Remote Sens. 2021, 2021, 9141902. [Google Scholar] [CrossRef]
- Fingas, M.; Brown, C. Review of oil spill remote sensing. Mar. Pollut. Bull. 2014, 831, 9–23. [Google Scholar] [CrossRef] [PubMed]
- Xiong, P.; Gu, X.F.; Yu, T.; Meng, Q.Y.; Li, J.G.; Shi, J.X.; Chen, Y.; Wang, L.; Liu, W.S.; Qi, Y.; et al. Thermal infrared emissivity spectrum and its characteristics of crude oil slick covered seawater. J. Spectros. Spect. Anal. 2014, 34, 2953–2960. [Google Scholar]
- Lu, Y.C.; Hu, C.M.; Sun, S.J.; Zhang, M.W.; Zhou, Y.; Shi, J.; Wen, Y.S. Overview of optical remote sensing of marine oil spills and hydrocarbon seepage. J. Remote Sens. 2016, 205, 1259–1269. [Google Scholar]
- Wang, M.Q.; Yang, J.F.; Liu, S.W.; Zhang, J.; Ma, Y.; Wan, J.H. Quantitative inversion ability analysis of oil film thickness using bright temperature difference based on thermal infrared remote sensing: A ground-based simulation experiment of marine oil spill. Remote Sens. 2023, 15, 2018. [Google Scholar] [CrossRef]
- Jiao, J.N.; Lu, Y.C.; Hu, C.M.; Shi, J.; Sun, S.J.; Liu, Y.X. Quantifying ocean surface oil thickness using thermal remote sensing. Remote Sens. Environ. 2021, 261, 112513. [Google Scholar] [CrossRef]
- Yang, J.F.; Hu, Y.B.; Zhang, J.; Ma, Y.; Li, Z.W.; Jiang, Z.C. Identification of marine oil spill pollution using hyperspectral combined with thermal infrared remote sensing. Front. Mar. Sci. 2023, 10, 1135356. [Google Scholar] [CrossRef]
- Hoge, F.E.; Swift, R.N. Oil film thickness measurement using airborne laser-induced water Raman backscatter. Appl. Opt. 1980, 19, 3269–3281. [Google Scholar] [CrossRef]
- Kepkay, P.E.; Bugden, J.B.C.; Lee, K.; Stoffyn, P. Application of ultraviolet fluorescence spectroscopy to monitor oil-mineral aggregate formation. Spill Sci. Technol. Bull. 2002, 8, 101–108. [Google Scholar] [CrossRef]
- Mdakane, L.W.; Kleynhans, W. Feature selection and classification of oil spill from vessels using sentinel-1 wide-swath synthetic aperture radar data. IEEE Geosci. Remote Sens. Lett. 2020, 19, 4002505. [Google Scholar] [CrossRef]
- Yekeen, S.T.; Balogun, A.L.; Yusof, K. A novel deep learning instance segmentation model for automated marine oil spill detection. ISPRS J. Photogram. Remote Sens. 2020, 167, 190–200. [Google Scholar] [CrossRef]
- Chen, F.; Zhang, A.H.; Balzter, H.; Ren, P.; Zhou, H.Y. Oil spill SAR image segmentation via probability distribution modeling. IEEE J. Sel. Top. Appl. Earth Obs. Remote Sens. 2021, 15, 533–554. [Google Scholar] [CrossRef]
- Zhu, Q.Q.; Zhang, Y.N.; Li, Z.Q.; Yan, X.; Guan, Q.; Zhong, Y.; Zhang, L.; Li, D. Oil spill contextual and boundary-supervised detection network based on marine SAR images. IEEE Trans. Geosci. Remote Sens. 2021, 60, 5213910. [Google Scholar] [CrossRef]
- Leifer, I.; Lehr, W.J.; Simecek-Beatty, D.; Bradley, E.; Clark, R.; Dennison, P.; Hu, Y.X.; Matheson, S.; Jones, C.E.; Holt, B.; et al. State of the art satellite and airborne marine oil spill remote sensing: Application to the BP deepwater horizon oil spill. Remote Sens. Environ. 2012, 1249, 185–209. [Google Scholar] [CrossRef]
- Fingas, M. The challenges of remotely measuring oil slick thickness. Remote Sens. 2018, 10, 319. [Google Scholar] [CrossRef]
- Sun, S.J.; Hu, C.M. The challenges of interpreting oil-water spatial and spectral contrasts for the estimation of oil thickness: Examples from satellite and airborne measurements of the deep water horizon oil spill. IEEE Trans. Geosci. Remote Sens. 2019, 57, 2643–2658. [Google Scholar] [CrossRef]
- Bonn Agreement. Bonn Agreement Aerial Operations Handbook. 2009, p. 61. Available online: https://dokumen.tips/documents/aerial-surveillance-handbook.html?page=1 (accessed on 15 November 2023).
- Lu, Y.C.; Li, X.; Tian, Q.J.; Zheng, G.; Sun, S.J.; Liu, Y.X.; Yang, Q. Progress in marine oil spill optical remote sensing: Detected targets, spectral response characteristics, and theories. Mar. Geod. 2013, 36, 334–346. [Google Scholar] [CrossRef]
- Lu, Y.C.; Tian, Q.J.; Li, X. The remote sensing inversion theory of offshore oil slick thickness based on a two-beam interference model. Sci. China Earth Sci. 2011, 54, 678–685. [Google Scholar] [CrossRef]
- Jiang, Z.C.; Ma, Y.; Yang, J.F. Inversion of the thickness of crude oil film based on an OG-CNN model. J. Mar. Sci. Eng. 2020, 89, 653. [Google Scholar] [CrossRef]
- Yin, H.T.; Chen, S.H.; Huang, R.L.; Chang, H.; Liu, J.Y.; Qi, W.; He, Z.M.; Su, R.X. Real-time thickness measurement of marine oil spill by fiber-optic surface plasmon resonance sensors. Front. Mar. Sci. 2022, 8, 764970. [Google Scholar] [CrossRef]
- Lu, Y.C.; Zhan, W.; Hu, C.M. Detecting and quantifying oil slick thickness by thermal remote sensing: A ground-based experiment. Remote Sens. Environ. 2016, 181, 207–217. [Google Scholar] [CrossRef]
- Guo, G.; Liu, B.X.; Liu, C.Y. Thermal infrared spectral characteristics of bunker fuel oil to determine oil-film thickness and API. J. Mar. Sci. Eng. 2020, 82, 135. [Google Scholar] [CrossRef]
- Clark, R.N.; Swayze, G.A.; Leifer, I.; Livo, K.E.; Kokaly, R.F.; Hoefen, T.; Lundeen, S.; Eastwood, M.L.; Green, R.O.; Pearson, N.; et al. A method for quantitative mapping of thick oil spills using imaging spectroscopy. US Geol. Surv. Open-File Rep. 2010, 1167, 1–51. [Google Scholar]
- Lu, Y.C.; Shi, J.; Hu, C.M.; Zhang, M.W.; Sun, S.J.; Liu, Y.X. Optical interpretation of oil emulsions in the ocean—Part II: Applications to multi-band coarse-resolution imagery. Remote Sens. Environ. 2020, 242, 111778. [Google Scholar] [CrossRef]
- Lu, Y.C.; Liu, J.Q.; Ding, J.; Shi, J.; Chen, J.; Ye, X. Optical remote identification of spilled oils from the SANCHI oil tanker collision in the East China Sea. China Sci. Bull. 2019, 6431, 3213–3222. [Google Scholar]
- Wang, G.C.; Gao, C. Airborne ocean oil spill detection mission system. Indust. Technol. Innov. 2020, 7, 97–101. [Google Scholar]
- Mohammadi, M.; Sharifi, A.; Hosseingholizadeh, M.; Tariq, A. Detection of oil pollution using SAR and optical remote sensing imagery: A case study of the Persian Gulf. J. Indian Soc. Remote Sens. 2021, 49, 2377–2385. [Google Scholar] [CrossRef]
- Rajendran, S.; Vethamony, P.; Sadooni, F.N.; Al-Kuwari, H.A.; Al-Khayat, J.A.; Seegobin, V.O.; Govil, H.; Nasir, S. Detection of Wakashio oil spill off Mauritius using Sentinel-1 and 2 data: Capability of sensors, image transformation methods and mapping. Environ. Pollut. 2021, 274, 116618. [Google Scholar] [CrossRef] [PubMed]
- Wang, L.F.; Xin, L.P.; Yu, B.; Ju, L.; Wei, L. A novel method for determination of the oil slick area based on visible and thermal infrared image fusion. Infrared Phys. Technol. 2021, 119, 103915. [Google Scholar] [CrossRef]
- Brereton, R.G.; Lloyd, G.R. Support Vector Machines for classification and regression. Analyst 2010, 135, 230–267. [Google Scholar] [CrossRef]
- Chang, C.C.; Lin, C.J. LIBSVM: A library for support vector machines. ACM Trans. Intell. Syst. Technol. 2001, 2, 1–27. [Google Scholar] [CrossRef]
Figure 1.
Experimental setup: (a) black PVC circular rings in the plastic box; (b) sample distribution; (c) spectral reflectance measurement using ASD.
Figure 1.
Experimental setup: (a) black PVC circular rings in the plastic box; (b) sample distribution; (c) spectral reflectance measurement using ASD.

Figure 2.
Experimental instruments: (a) Cubert S185 airborne hyperspectral imager; (b) Zenmuse H20T airborne thermal infrared imager.
Figure 2.
Experimental instruments: (a) Cubert S185 airborne hyperspectral imager; (b) Zenmuse H20T airborne thermal infrared imager.

Figure 3.
Hyperspectral and thermal infrared images of crude oil at different thickness: (a) hyperspectral image; (b) thermal infrared image.
Figure 3.
Hyperspectral and thermal infrared images of crude oil at different thickness: (a) hyperspectral image; (b) thermal infrared image.

Figure 4.
Spectral reflectance of crude oil films of different thicknesses (the gray area is a non-atmospheric window, and the red rectangular area represents the spectral range of airborne hyperspectral image).
Figure 4.
Spectral reflectance of crude oil films of different thicknesses (the gray area is a non-atmospheric window, and the red rectangular area represents the spectral range of airborne hyperspectral image).

Figure 5.
Changes in thermal response of oil films of different thicknesses over time: (a) BT; (b) BTD.
Figure 5.
Changes in thermal response of oil films of different thicknesses over time: (a) BT; (b) BTD.

Figure 6.
Retrieval results of oil films of different thicknesses based on hyperspectral and thermal infrared images: (a) hyperspectral result; (b) thermal infrared result.
Figure 6.
Retrieval results of oil films of different thicknesses based on hyperspectral and thermal infrared images: (a) hyperspectral result; (b) thermal infrared result.

Figure 7.
Comparison between OTs retrieved from hyperspectral data and measured OTs (blue dashed area represents an error range of ±0.2T, and orange dashed area represents an error range of ±0.3T).
Figure 7.
Comparison between OTs retrieved from hyperspectral data and measured OTs (blue dashed area represents an error range of ±0.2T, and orange dashed area represents an error range of ±0.3T).

Figure 8.
Comparison between OTs retrieved from thermal infrared data and measured OTs (red dashed area represents an error range of ±0.1T, blue dashed area represents an error range of ±0.2T, and orange dashed area represents an error range of ±0.3T).
Figure 8.
Comparison between OTs retrieved from thermal infrared data and measured OTs (red dashed area represents an error range of ±0.1T, blue dashed area represents an error range of ±0.2T, and orange dashed area represents an error range of ±0.3T).

Figure 9.
Comparison between OT retrieved from fused data and measured OT (blue dashed area represents an error range of ±0.2T, and orange dashed area represents an error range of ±0.3T).
Figure 9.
Comparison between OT retrieved from fused data and measured OT (blue dashed area represents an error range of ±0.2T, and orange dashed area represents an error range of ±0.3T).

Figure 10.
Spectral reflectance of WO emulsions: (a) WO emulsions of different thicknesses at the same concentration; (b) WO emulsions at different concentrations of the same thickness. (The gray area is a non-atmospheric window, and the red rectangular area represents the spectral range of airborne hyperspectral image).

Figure 11.
Changes in thermal response of WO emulsions of four thicknesses at different concentrations over time: (a) BT; (b) BTD.
Figure 11.
Changes in thermal response of WO emulsions of four thicknesses at different concentrations over time: (a) BT; (b) BTD.


Table 1.
Oil film thickness setting.
| Sample Number | Thickness/μm | Sample Number | Thickness/μm | Sample Number | Thickness/μm |
|---|---|---|---|---|---|
| 1 | 0 | 7 | 300 | 13 | 900 |
| 2 | 10 | 8 | 400 | 14 | 1010 |
| 3 | 40 | 9 | 500 | 15 | 1500 |
| 4 | 70 | 10 | 610 | 16 | 2000 |
| 5 | 100 | 11 | 700 | 17 | 2510 |
| 6 | 200 | 12 | 800 | 18 | 3000 |
Table 2.
The main parameters of Cubert S185 hyperspectral imager and Zenmuse H20T thermal infrared imager.
Table 2.
The main parameters of Cubert S185 hyperspectral imager and Zenmuse H20T thermal infrared imager.
| Cubert S185 Hyperspectral Imager | Zenmuse H20T Thermal Infrared Imager | ||
|---|---|---|---|
| Parameter | Index | Parameter | Index |
| spectral range/nm | 450~950 | spectral range/μm | 8~14 |
| spectral resolution/nm | 8 | resolution | 640 × 512 |
| spatial resolution/cm | 2.7@10,000 | sensitivity (NETD)/mK | ≤50 @ f/1.0 |
| field of view angle/° | 20.6 | display field of view angle/° | 40.6 |
| specification/px2 | 1000 × 1000 | measuring range/°C | −20~+60 |
| sampling interval/nm | 4 | pixel spacing/μm | 12 |
| number of channels | 125 | aperture | f/1.0 |
| focal length/mm | 16 | focal length/mm | 13.5 |
| flight altitude in the experiment/m | 6 | flight altitude in the experiment/m | 3 |
Disclaimer/Publisher’s Note: The statements, opinions and data contained in all publications are solely those of the individual author(s) and contributor(s) and not of MDPI and/or the editor(s). MDPI and/or the editor(s) disclaim responsibility for any injury to people or property resulting from any ideas, methods, instructions or products referred to in the content. |
© 2023 by the authors. Licensee MDPI, Basel, Switzerland. This article is an open access article distributed under the terms and conditions of the Creative Commons Attribution (CC BY) license (https://creativecommons.org/licenses/by/4.0/).
Share and Cite
MDPI and ACS Style
Yang, J.; Hu, Y.; Ma, Y.; Wang, M.; Zhang, N.; Li, Z.; Zhang, J. Combined Retrieval of Oil Film Thickness Using Hyperspectral and Thermal Infrared Remote Sensing. Remote Sens. 2023, 15, 5415. https://doi.org/10.3390/rs15225415
AMA Style
Yang J, Hu Y, Ma Y, Wang M, Zhang N, Li Z, Zhang J. Combined Retrieval of Oil Film Thickness Using Hyperspectral and Thermal Infrared Remote Sensing. Remote Sensing. 2023; 15(22):5415. https://doi.org/10.3390/rs15225415
Chicago/Turabian StyleYang, Junfang, Yabin Hu, Yi Ma, Meiqi Wang, Ning Zhang, Zhongwei Li, and Jie Zhang. 2023. "Combined Retrieval of Oil Film Thickness Using Hyperspectral and Thermal Infrared Remote Sensing" Remote Sensing 15, no. 22: 5415. https://doi.org/10.3390/rs15225415
Note that from the first issue of 2016, this journal uses article numbers instead of page numbers. See further details here.