Article

Combination of UAV Photogrammetry and Field Inventories Enables Description of Height–Diameter Relationship within Semi-Arid Silvopastoral Systems

1
Department of Photogrammetry and Remote Sensing, Faculty of Geodesy and Geomatics Engineering, K.N. Toosi University of Technology, Tehran 19967-15433, Iran
2
Department of Remote Sensing, Institute of Geography and Geology, University of Wuerzburg, 97074 Wuerzburg, Germany
3
Department of Forestry, Faculty of Natural Resources, University of Kurdistan, Sanandaj 66177-15175, Iran
4
Center for Research and Development of Northern Zagros Forestry, Baneh 66919-14919, Iran
5
Northern Forestry Centre, Canadian Forest Service, Natural Resources Canada, 5320-122nd St. NW, Edmonton, AB T6H 3S5, Canada
6
Faculty of Natural Resources, Lorestan University, Khorramabad 68151-44316, Iran
7
Department of Remote Sensing and Geoinformation, Institute of Geographic Sciences, Freie Universität Berlin, 12249 Berlin, Germany
*
Author to whom correspondence should be addressed.
Remote Sens. 2023, 15(21), 5261; https://doi.org/10.3390/rs15215261
Submission received: 14 August 2023 / Revised: 4 October 2023 / Accepted: 5 November 2023 / Published: 6 November 2023
(This article belongs to the Special Issue Remote Sensing of Arid/Semiarid Lands II)

Abstract

:
Pollarding oak trees is a traditional silvopastoral technique practiced across wide areas of the northern Zagros mountains, a unique and vast semi-arid forest area with a strong cultural and ecological significance. So far, the effects of pollarding on tree structure in terms of DBH (diameter at breast height)~H (height) relationships within the typical pollarding cycle, which often lasts 4 years, has not been scientifically described. Here, we combine field inventories of DBH with H obtained from photogrammetric UAV flights for the first time to assess DBH~H relationships within this system. We conducted the research at six pollarded forest sites throughout the Northern Zagros. The sampling encompassed all three main species of coppice oak trees. In the case of multi-stem trees, we used the maximum DBH of each tree that formed a unique crown. A linear relationship between UAV and extracted H and the maximum DBH of pollarded trees explained a notable part of the variation in maximum DBH (R2 = 0.56), and more complex and well-known nonlinear allometries were also evaluated, for which the accuracies were in the same range as the linear model. This relationship proved to be stable across oak species, and the pollarding stage had a notable effect on the DBH~H relationship. This finding is relevant for future attempts to inventory biomass using remote sensing approaches across larger areas in northern Zagros, as well as for general DBH estimations within stands dominated by pollarded, multi-stem coppice structures.

1. Introduction

Forests cover around 30% of the Earth’s land area [1], including semi-arid areas. Iran is climatically diverse and encompasses a considerable portion of the world’s climate zones [2]. However, the country is known to be dominated by semi-arid, arid, and fragile vegetation ecosystems [3]. The Zagros mountains are home to a significant portion of Iran’s semi-arid forests and woodlands, which encompass > 40% of Iran’s forests, accounting for ca. six million ha [4,5]. These forests are particularly important from the socioeconomic, soil conservation, and water-quality perspectives, as well as for providing considerable non-market ecosystem services [6]. However, their quantity and quality have been almost constantly deteriorating over the last few decades due to a variety of natural and human-induced factors [7,8,9,10,11], including, in particular, the high level of dependency of local livelihood on these forests [12,13].
This close connection between people and nature in northern Zagros (located in the West Azerbaijan and Kurdistan provinces, Iran) [14] has led to significant alterations in the vegetative composition [15] and the primary structure of both trees and forest stands [16]. Historically, the high dependence of local forest dwellers on natural resources has made inventive utilization of the forest to supply both human and livestock inevitable [17]. Most forest dwellers practice some sort of silvopastoralism and highly depend on oak forests to produce forage for their livestock throughout the year [18]. In particular, traditional animal husbandry in northern Zagros faces a lack of pastures and fodder in the cold seasons. To adapt their livelihoods to such limitations, the locals have developed a traditional silvopastoral method called pollarding (Kurdish: Galazani) [6,19]. Pollarding is a generic name for pruning tree branches to provide both fodder (for domestic animals) and fuelwood [20]. Pollarding has been reported to be practiced in parts of Europe, Asia, Africa, and America, especially for the benefit of using leaves and branches as animal fodder. Pollarding is hence an important factor in livestock management and relates to this important source of income in the farming economy [21,22,23,24,25]. Oak pollards are a part of traditional forest management in many ecosystems and have a very long history of about 4000 years [26]. In Iran, and as a part of the traditional management system in the northern Zagros, each rural family traditionally owns, i.e., tenures, a part of the forest (Kurdish: Galajar) [27]. Each Galajar is divided into three or four parcels with equal fodder productivity, termed Shanegala (in Kurdish) [28]. This is due to the fact that a given Shanegala is used to perform pollarding for winter fodder each year. Each Shanegala is pollarded in a three or four year pollarding cycle [4,28], which annually occurs from mid-September to early October (pre-fall). However, pollarding is not carried out in this way everywhere and is carried out irregularly [29]. During pollarding, forest dwellers cut leafy branches (Kurdish: Bakhe) of oak trees, mostly Quercus libani Olivier and Q. infectoria Olivier., and store them on large trees (Kurdish: Dargala), on the ground, or on rock fragments in a cone-shaped formation known as a Gala or a Loya Gala (in Kurdish). In winter, dried leafy Loya Gala branches are used to feed livestock (especially Markhoz goats and sheep) [
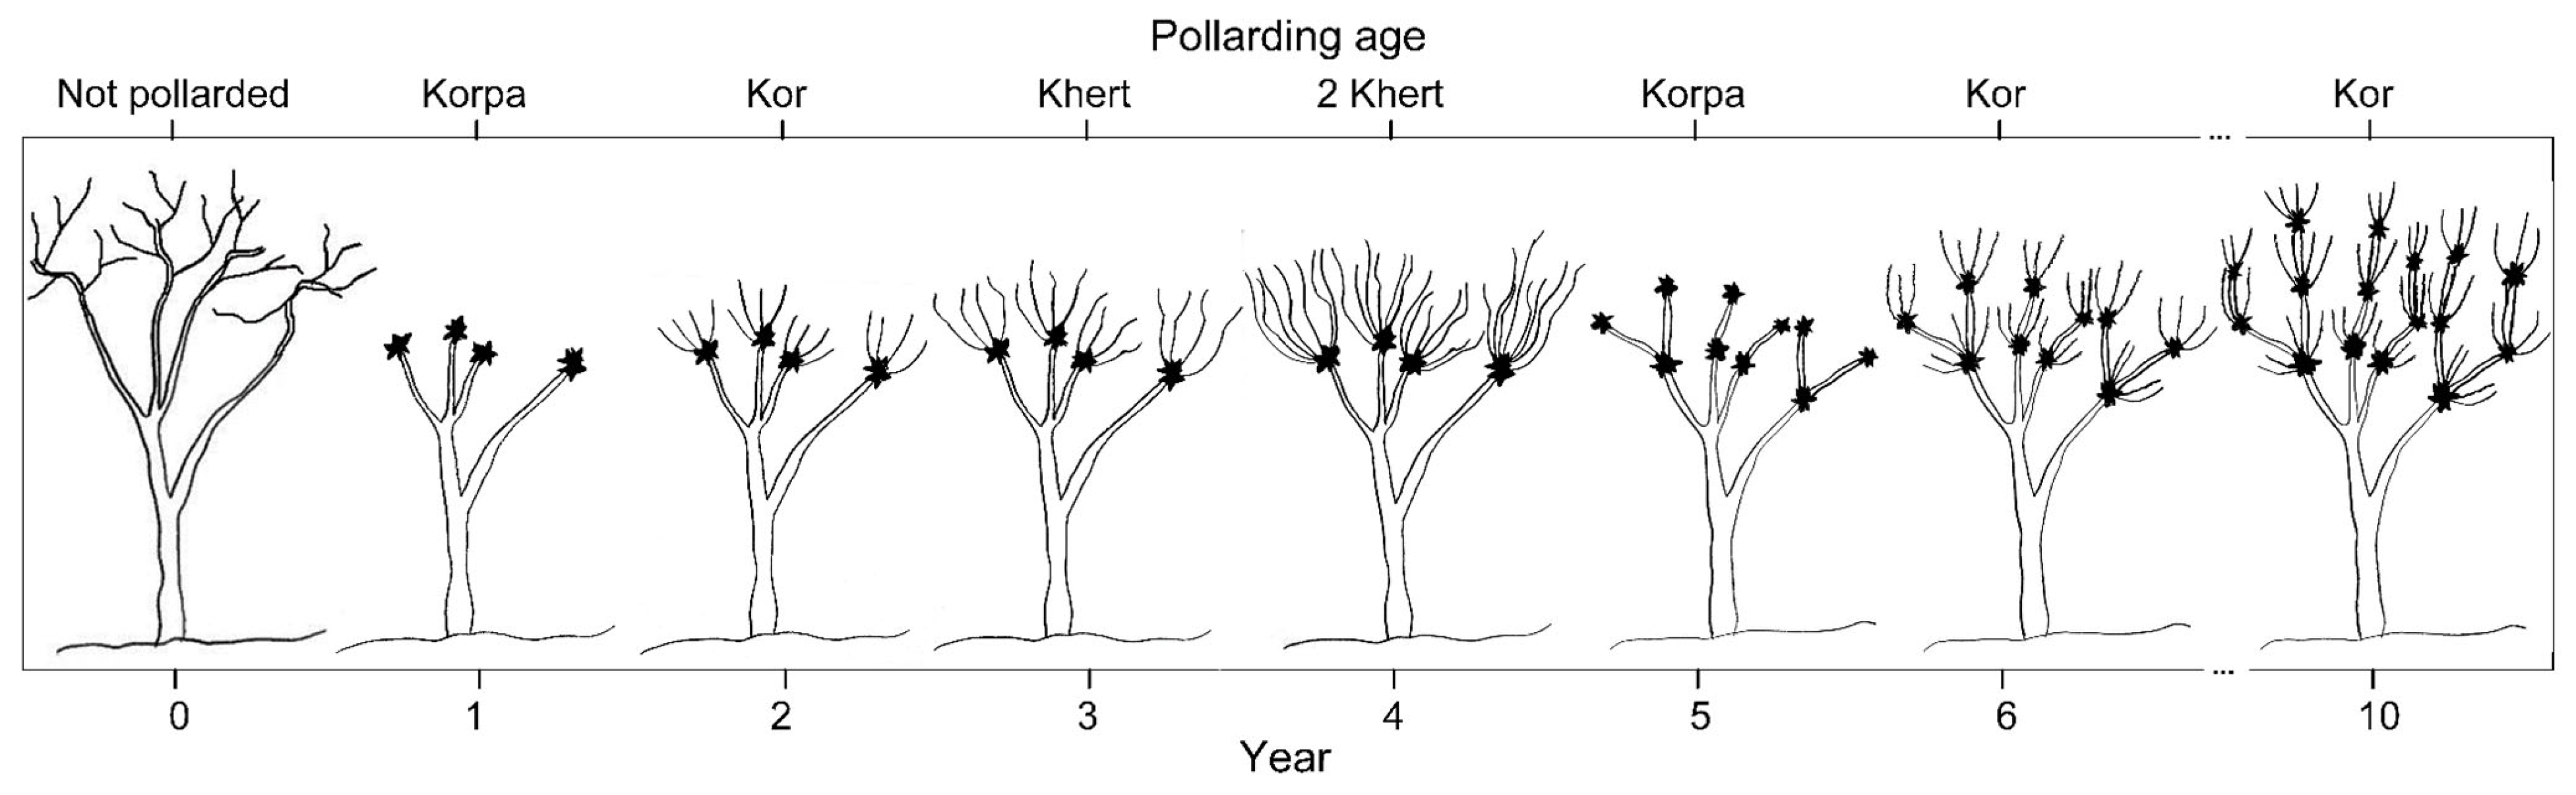
16]. The locals estimate pollarding ages to conduct the above-mentioned pollarding cycle. Whereas a freshly pollarded tree is called Korpa, the tree is termed Kor, Khert, and 2 Khert following one, two, and three years from the time of its pollarding, respectively [30] (Figure 1).
One of the initial consequences of pollarding is reducing the tree canopy, which causes stress on the tree and changes the typical pattern of tree growth [31,32]. However, some studies [6,16,32,33,34] have shown that pollarding may result in a decrease in height, trunk, crown area, canopy vigor, health, seed and coppice regeneration, and density.
However, scientific knowledge on this traditional silvicultural approach is very sparse, and the exact effects of pollarding on tree structure and vitality are not yet fully understood (an overview of earlier studies focusing on this topic is summarized in Table 1). The first step to thoroughly examining the pollarding approach and its temporal trajectories is to adequately capture the tree structure of pollarded trees [35,36]. Field inventories typically involve measuring the diameter at breast height (DBH), tree height, and the tree crown diameter [37,38] but without considering the intrinsic features of pollarded trees, like their distorted DBH~height and DBH~crown area relationships. With respect to potential monitoring approaches, timely field measurements are challenging, as pollarding typically takes place on mountain slopes [16,30,39], a problem that is exacerbated not only by the subjectivity and required logistics for conducting field measurements (particularly for attributes like tree height) but also by the fact that measurements might be prevented or opposed by the local dwellers that assert a customary right to forest tenure over Galajars.
As an alternative or complement, remote sensing- and photogrammetry-based approaches may partly replace or amend field measurements [40]. Remote sensing has been historically used in a variety of fields related to vegetation monitoring [41,42]. Well-known pattern recognition algorithms in combination with space-borne active [43,44,45] and passive [46,47,48] data have been largely employed yet face difficulties in small-scale applications. Estimating the structural variables of single trees can be accomplished using very-high-resolution (VHR) space-borne data [49], which are, however, often prohibitive due to their high price and the lack of accessibility for politically sensitive areas like Iran. As an alternative, three-dimensional ground sensors (e.g., terrestrial laser scanners) [50] or aerial sensors (e.g., aerial laser scanners) [51] can be used. However, these tools are often either unavailable, costly, or practically infeasible for large-area assessments or subsequent spatial upscaling to larger domains [52]. Consumer-grade unmanned aerial vehicles (UAVs) may offer an intermediate solution [53] at an affordable cost [54]. Compared with very-high-resolution spaceborne data, their application is associated with fewer limitations regarding atmospheric correction and cloud cover because of their relatively low flight altitudes [55]. Additionally, 3D point clouds can be created from raw UAV data by using stereo image-matching techniques [56]. This enhances the level of structural analysis from a planar space to a vertical space [57] and allows tree heights to be obtain with reasonable accuracy, particularly in open forest environments. UAV photogrammetry is not limited to forests when it comes to tree attribute estimation. Several studies have successfully employed UAV photogrammetry to estimate the height and diameter of orchard trees as well [58,59,60].
The overall workflow of UAV photogrammetry in structural tree attribute estimation involves mission planning, acquisition of aerial images using a UAV, preprocessing of the images to correct distortions, image matching to determine position and orientation, generation of a point cloud and digital surface model, subtraction of the digital surface model to create a canopy height model, and estimation of tree heights using the canopy height model [53,61]. The accuracy of the estimated tree heights depends on the quality of the images, the image-matching accuracy, and the effectiveness of segmentation and measurement algorithms.
Despite all of these benefits, it is important to also mention the limitations of UAV data. The very small coverage of most UAVs is the primary obstacle, which is a consequence of several factors, including (1) limited battery power/flight time, (2) limited flight area that can be used for stereo analysis, and (3) the significant data volumes needed for creating digital orthomosaics and digital terrain/surface models [62,63]. Despite these limitations, a few earlier studies applied UAVs in the Zagros region to assess various forest attributes (Table 1).
Table 1. The results of a systematic search on Web of Science® on relevant UAV-based studies within Zagros. AB in the “Search Query” column stands for abstract.
Search QueryResult
ReferenceYearDescriptionRegion
AB = (UAV OR UAS) AND AB = (Zagros)[61]2022Edge detection-based method for delineating overlapped crowns of coppice trees using UAV photogrammetry to monitor tree declineMiddle and South Zagros
[53]2021Structural variable extraction of Zagros single treesMiddle and South Zagros
[64]2021Intra- and interspecific interaction investigation and their contribution to growth inhibition in the patches of Pistacia trees and Amygdalus shrubsSouth Zagros
[65]2017Mapping part of a wild pistachio nature reserve in Zagros open woodlandsSouth Zagros
[66]2017Challenges and quality of landslide assessment based on
remotely sensed data
Zagros Mountains
AB = (pollarded) AND AB = (Zagros)[25]2018Quantitative description of the pollarding process in the northern Zagros, with a focus on foliage stacks resulting from pollardingNorth Zagros
[67]2018Structural analysis of pollarded trees to evaluate the effect of aspect on biometric indices of oak treesNorth Zagros
[16]2017Investigation of the effect of pollarding on the increment in diameter of Lebanon oak trees by comparing them to less disturbed standsNorth Zagros
[6]2014Investigating the tree-pollarding process in GalajarsNorth Zagros
[18]2012Allometric relationship introduction for estimating the crown and leaf biomass of Q. libani using the DBH, tree height, crown length, and crown widthNorth Zagros
[27]2010Evaluation of the capability of IRS-P6 data to separate the pollarding areasNorth Zagros
However, the utility of UAVs as practical and affordable tools for structural assessments of pollarded trees has not yet been examined and was set as the main objective of this research. We were particularly interested in exploring the relationship between UAV-derived tree heights and DBHs of the trees. This is particularly interesting for potential future use cases to conduct simplified forest inventories exclusively based on UAV flights to estimate wood volume and biomass.
Therefore, the specific objectives of this research are:
  • To test the feasibility of consumer-grade UAV data to estimate the height of pollarded trees and to use these heights to estimate the DBH of the trees;
  • To understand how the essential DBH~H relationship is affected by the oak species and the stage of pollarding and whether there is a difference between multi- and mono-stemmed trees.

2. Materials and Methods

2.1. Subsection

The Zagros forests comprise 20% of Iran’s total vegetation cover and are a habitat to multiple and endemic woody species, in particular, three oak species, including Q. brantii Lindl., Q. infectoria Olivier, and Q. libani Olivier in both coppice and standard forms. The forests play a critical role in the water supply and the economic and social welfare of the local population [4]. The Zagros forests are biogeographically divided into northern, central, and southern zones [68], with all three oak species jointly occurring only in the northern part [4,68].
We analyzed the structural attributes of pollarded stands across 6 sites near Baneh county in Kurdistan province (Figure 2), one of the richest and most structurally diverse ecosystems in Zagros [18]. We considered the presence of Galajars of various pollarding ages when selecting the sites.

2.2. Materials

UAV photogrammetric products were applied to derive tree heights [37,38]. The derived heights were then used to estimate the field-measured DBH of the trees. Furthermore, the link between height and DBH was examined with respect to tree age, location, and species groups. Tree crown area was originally considered an additional variable [69], but we considered it to be less relevant since it is subject to continuous change during the pollarding process [16,70].

2.2.1. Field Measurements

The field-collected data included a general plot description (general morphology, aspect, presence of regeneration, and average slope), tree species, DBH (full callipering), and pollarding age (Table 2). In addition, we selected 4 reference trees in each site with uniform distribution throughout the site and measured their height using a clinometer. Finally, we checked whether the trees were growing from seeds or from coppice. The precise UTM coordinates of each tree were recorded using a Raymand® iRo-3 multi-frequency differential GNSS (Makanpardaz Raymand Inc., Tehran, Iran). The inventories were completed at the 6 study sites during July–September 2021, the closest possible date to the UAV flights (June 2021) and well before the start of the annual pollarding season (Section 2.2.2).
The fieldwork revealed that none of the trees in the 6 sites were of seed origin and were therefore all considered coppice trees. Many trees had multiple stems, for which we measured multiple DBH values. Figure 3 represents the structural variations to be expected in our site based on the field observations and according to an experienced local ecologist. We did not examine whether the root networks of individual trees were connected in the field.
The maximum DBH value within an individual coppice tree was considered the DBH to be estimated for each tree [53]. A visual representation of the DBH distribution at each study site can be seen in Figure S1, while Table 3 shows the quantitative summary of DBH measurements.

2.2.2. UAV Imaging

We used a consumer-grade DJI Phantom 4 pro multi-rotor UAV (DJI, 2016) for aerial imaging. The device comprised a three-axis stabilization gimbal, a 1” CMOS sensor camera, and an 8.8 mm/24 mm lens with a field of view of 84° (https://www.dji.com/phantom-4-pro/info/, accessed on 14 August 2023). The flights for different sites were designed according to site-specific topographic conditions and tree cover and were designed with an iOS version of Pix4DCapture installed on an iPad 2018 tablet (accessible at https://support.pix4d.com/hc/en-us/articles/204010419-iOS-Pix4Dcapture-Manual-and-Settings, accessed on 14 August 2023). The flights were conducted for all six sites between 14 and 16 June 2021 (Table 4). Photogrammetric 3D modelling in forests is generally challenging [71]. To partially overcome the challenge, we additionally designed an oblique cross-flight in addition to the nadir cross-flights based on our previous experiences as well as suggestions by former studies [72,73]. The choice of a 60° oblique flight angle was based on preliminary tests and following the recommendations of earlier studies [56]. The nadir and oblique flights were conducted one minute apart.
Two approaches for processing the photogrammetric data were tested: (1) dense point cloud production for oblique and nadir flights as two separate projects, followed by merging the two models, and (2) merging the images of both flights and producing a 3D model using all of the images. Our visual and quantitative checks on the results of both scenarios showed that the first scenario added considerable noise during the merging of the two models despite being more efficient from a processing cost point of view. The second approach was more time-consuming due to the simultaneous processing of more images but resulted in denser and more accurate models. Therefore, we applied the second option for all sites.

2.3. Methodology

The applied methodology primarily involved extracting tree heights from the crown height model (CHM) [74], followed by examining DBH~H relationships using ordinary least squares (OLS) models as well as a set of common, more complex, nonlinear approaches tested and suggested by the literature (see Section 2.3.2).

2.3.1. Tree Height Estimation

Production of 3D models from overlapping UAV imagery [75] is highly dependent on the surface color texture [63,71,76]. Due to the significant loss of leaved tree canopy within pollarded sites, trees exhibit a relatively poor texture, which results in technical obstacles during the image-matching process. Here, we produced optimal models by modifying the key parameters of 3D model production. We performed an exhaustive search for the optimal Agisoft Metashape 1.8 (https://www.agisoft.com, accessed on 14 August 2023) hyperparameters [77]. Then, we automatically filtered the key points according to a strategy that was based on an iterative process as follows: [78,79].
  • Removing all points that are seen in three images or fewer;
  • Removing the key points in such a way that the reprojection error is halved, followed by optimizing the camera parameters;
  • Removing the points in such a way that the reconstruction uncertainty is halved, followed by optimizing the camera parameters;
  • Removing points in such a way that the projection accuracy is halved, followed by optimizing the camera parameters;
  • Returning to step 2 and repeating the steps until the stopping condition is reached.
It should be noted that our stop condition was reprojection error = 0.3 px, reconstruction uncertainty = 5 px, and projection accuracy = 3 px. Then, we created the digital surface model (DSM), filtered the trees, and interpolated the area of the tree locations to create the digital terrain model (DTM) [80] and created the CHM by subtracting the DTM from the DSM. The tree heights could then be extracted from the CHM [81]. To do so, the trees must first be segmented. Since the trees were generally sparse, we segmented the tree crowns using the straightforward and efficient marker-controlled watershed segmentation (MCWS) [82,83]. Using the maximum operator to extract the tree heights was infeasible due to the presence of noise in the UAV-based canopy height models [84]. To avoid a strong influence of corresponding outlier pixels, we assumed a normal distribution of the CHM values in each tree segment and identified the largest value as the tree height at a 95% confidence level. Thus, we considered heights that were >2SD (2 × standard deviation, the 95th percentile of all pixels in the tree crown segment) from the average. Figure S2 and Table 5 show the visual and quantitative description of the tree height extraction results. To validate the UAV-derived tree heights, we compared them with the field-measured heights. The agreement with field-measured heights was reasonable, with an average difference of 0.3 m to 1.2 m (Figure S3).

2.3.2. DBH Estimation

Despite the inherent correlation of DBH and tree height [85,86,87], pollarded trees are not comparable to undisturbed (unpollarded) oak trees due to significant changes in the crown area during the pollarding cycle (Figure 1). Thus, the DBH~height relationship might also be influenced by other variables. We hypothesized that the link between tree height and DBH differs across (1) single- and multi-stemmed trees, (2) trees of different pollarding ages, (3) the number of trunks, (4) tree species, and (5) their interactions. Items 1, 3, 4, and 5 necessitate direct measurement of all individual trees and quantitative and qualitative measurements by an ecologist. Conversely, item 2 can be obtained exclusively through experience or by asking the Galajar’s local owner, thus negating the need for an examination of the individual trees. Thus, we examined all of these variables, along with the UAV-derived tree heights, to estimate the DBH to answer the question of whether field inventories for all single trees (items 1, 3, 4, and 5) are needed to estimate the DBH from the height obtained by the UAV. To identify the most important predictors, we applied a backward stepwise selection until the stopping condition was met. Then, the most effective independent variables were included in the final model [88]. Most ideally, we were interested in finding a linear relationship between H and DBH, which is the least dependent on additional field inventories and is easier to understand because of its linearity. However, we were also interested in examining the nonlinear relationship between these two variables. To consider possible nonlinear DBH~H relationships, we also used three well-known nonlinear relationships that were suggested by the relevant literature (Table 6). We used the Levenberg–Marquardt algorithm [89] to solve these models, i.e., to find the optimal values of the model parameters. Also, since we required initial values to find the optimal parameters, 500 initial values were randomly considered for each model to ensure the global optimum was found. We chose the optimal value according to the evaluation criteria of root mean square error (RMSE) and R2adj.
In OLS fits, one expects the model to improve as more variables are added but at the cost of overfitting. We used ANOVA (analysis of variance) to determine whether a relationship existed between two or more independent variables and a dependent variable. ANOVA can be used to determine whether the coefficients of the regression model are statistically significant and whether the differences among the independent variables are significant. It is also used to evaluate the overall effect of the independent variables on the dependent variable and to compare the relative importance of each of the independent variables on the dependent variable [93]. We used both the Akaike information criterion (AIC) and the Bayesian information criterion (BIC) to select variables [94]. Moreover, S, which is defined as SSE DF , denotes the variance of errors around the regression line, where SSE and DF are the sum of the squared residuals and the degree of freedom, respectively [95]. The R2 from 1 SSE SST   demonstrates the regression model’s overall performance, where SST is the treatment sum of squares [96]. It is crucial to take a penalty for adding a variable to the model into account. Hence, we used the R2adj and R2pred coefficient and 10-fold R2 and S to evaluate how well each step performed. The coefficient R2adj is derived from 1-MSE/MST and R2pred is derived from 1 PRESS SST , where PRESS is a measure of the difference between the predicted and observed values. To calculate PRESS, each observation is systematically removed from the data set, the regression equation is estimated, and the accuracy of the model in predicting the removed observation is determined. The 10-fold S measures the average difference between the actual values and the predicted values in the test data set. It provides an indication of how well the model fits the data. The 10-fold R2 measures the proportion of variability in the response variable that is explained by the model. It indicates the strength of the relationship between the predictors and the response variable. The degree of freedom, which is a function of n (number of samples) and p (number of parameters), is included in the denominator of MSE and MST; thus, it is easy to see whether adding a variable to the model has a negative impact [95]. Therefore, it is necessary to use this coefficient in regression equations that have more than one variable [96]. Also, if there is a small difference between R2adj and R2, R2 can be trusted, with a high probability that this difference is small in all stages.

2.3.3. Outlier Detection for OLS Models

We developed regressions with the independent variable H (height) for various Galajar ages. It was vital to identify and eliminate outliers prior to model evaluation, as noise is a constant companion of UAV-based photogrammetric products. The difference in fit (DFFITS) is an effective metric for detecting outlier data [94]; it is a mixture of the leverage and R-Student metrics and evaluates the effect of each observation on the fitted values of the regression model [97,98]. The ith data enters the model twice, once as test data and once as training data, followed by comparison of the predicted values for the two variants. Although this is somewhat time-consuming in practice, it was proven that DFFITS may be calculated using only the diagonal values of the hat matrix without re-modelling each data point [94,99]. Here, we identified outliers as data with DFFITS 2 × p n . The p and n represent the number of regression terms and samples, respectively, which were 6 and 796, respectively. Therefore, the data with DFFITS 0.1736 were discarded. Cook’s distance criterion [97,100] was the second strategy that was employed to filter outliers. The Cook’s distance criterion functions similarly to the DFITS criterion, with the exception that it evaluates the changes in the regression coefficients. Here, we calculated the aforementioned criterion for all of the data and identified outlier data as those with a Cook s   distance 1 .

3. Results

3.1. DBH Estimation

3.1.1. Finding Effective Variables in DBH Estimation

We used the backward stepwise selection to eliminate redundant or ineffective variables, with the p-value used as the selection criterion, i.e., the variable with the greatest p was eliminated in each phase. The applied termination condition was alpha-to-remove value = 0.1. The results are summarized in Table 7.
Tree species and pollarding age were the most influential variables for OLS fitting, along with height (H) (Table 7). Furthermore, observing the effect of each of these two variables on the R2 and R2adj coefficients revealed that eliminating the species variable had a negligible impact on the model accuracy. Therefore, only the pollarding age variable was included in the final model. We also evaluated other nonlinear models (Table 6) to ensure that our linear model was the appropriate choice (Table 8).
As shown in Table 8, the accuracies for different models were generally in the same range despite the model complexities applied. Therefore, we used the DBH~H linear model, which, in addition to its simplicity and comprehensibility, provides better interpretability than nonlinear models.

3.1.2. Outlier Detection/OLS Model

Figure 4 shows the outlier samples and residual errors identified by the criteria that were described in Section 2.3.3.
The final OLS was re-fitted after eliminating 35 trees (almost 4.4% of all trees) as outlier data. The comparison of residual errors to the fitted values is shown in Figure 5.
The estimated coefficients for this equation are listed in Table 9, while Figure 6 illustrates the relationship between the tree height and DBH by age. A 95% confidence interval for the coefficients was calculated to estimate whether the model might also be valid across other regions beyond the parametrization domain of the six test sites.
The general equation was:
DBHMax = α 0 + α 1 x 1 +   α 2 x 2 + α 3 H + α 4 x 1 H + α 5 x 2 H .  
The corresponding values for the variables of x 1 and x 2 are presented in Table 10.
Table 11 provides a summary of the model evaluation based on multiple criteria, while Table 12 summarizes the analysis of variance (ANOVA).
Table 12 shows the analysis of variance of the model. The model included five parameters, in which high values of F and very low values of p emphasized their significance. The lack-of-fit error (indicated by the high value of p) increased due to the discrete nature of the DBH values (due to the cm measurement accuracy) and the continuous nature of the H values.

4. Discussion

The general objective of our study was to examine whether height derived from UAV photogrammetry can predict the DBH of pollarded oak trees, which is challenging due to the strongly altered canopy structures [27,67]. In the following, we first discuss the technical aspects of UAV-based tree height determination and then reflect on the identified DBH~H relationships.
Earlier studies discussed the challenges of producing realistic 3D models in forests using UAV photogrammetry [101,102]. One challenge may be that tree crowns are observed only with a limited number of pixels in UAV images. This complicates solving the collinearity equations of automatic image-matching techniques [102]. Increasing the number of sampled pixels has been suggested in such conditions [102]. Tu et al., (2021) showed that the combined use of oblique and nadir flights (as compared to a nadir flight alone) can improve 3D photogrammetry models by 35% [103]. However, this approach might also be associated with image-matching issues such as changes in wind speed/direction and the sun exposure that may occur due to the time lag between flights, hence complicating the image-matching procedure. Here, we coped with these two issues by taking images using continuous imaging under constant and calm wind conditions. One may also note that pollarded trees are less sensitive to wind because of the generally sparser canopy foliage compared with unpollarded trees. Additionally, we conducted the flights with the shortest possible time lag of approximately one minute between the two flights, due to which changes in sun exposure could be regarded as negligible. In order to overcome many common image-matching problems in forests, we processed images of two oblique (60°) and vertical flights simultaneously to increase the number of candidate pixels in the image-matching process [56].
All in all, our analysis returned accurate estimates of the tree height using UAV photogrammetric models, with an average difference of 0.3 m to 1.2 m compared to the values extracted from the CHM and the field measurement. This was in the range reported by other studies, which obtained differences of between 0.3 m to 2.9 m [104] and 0.1 m to 0.5 m [57] when estimating tree height from UAV data. The average heights of pollarded trees in our study were in the range of 3.5–6.7 m, which can be considered at the lower end of the height values reported in the literature for these silvopastoral systems [6,18,32]. The tree height of pollarded trees is strongly influenced by the local inhabitants who practice pollarding. The traditional owners of Galajars do not allow the crown of the tree to be out of their reach due to the increase in height [30]. Furthermore, another reason for the low height of these trees may be the low canopy cover of the stands. As a result, there is less competition between trees to receive light (a factor influencing height growth) in pollarded stands, and thus the trees tend to expand their crown horizontally rather than vertically (height growth) [105].
In terms of height–DBH relationships, previous studies on other forest types generally showed that DBH is correlated with height [106,107]. Ref. [29] showed that the DBHs and heights of pollarded trees of the species Quercus cerris L. were linearly correlated (correlation coefficient = 0.464). Furthermore, Niemczyk and Bruchwald (2017) presented relationships for estimating the DBH of Populus spp. trees and hybrids in coppice stands using height and the form factor [108]. Finally, Ref. [109] investigated and compared the relationship between the DBH and the height of Populus spp. in short rotations in northern Poland in two cycles of 5 and 6 years.
In field inventories, height measurement is generally more difficult than DBH measurement [110], often with lower accuracy of measured height than that of DBH [38,111]. Thus, allometries are often used to estimate height using the DBH in classical inventories of standard forests (see 
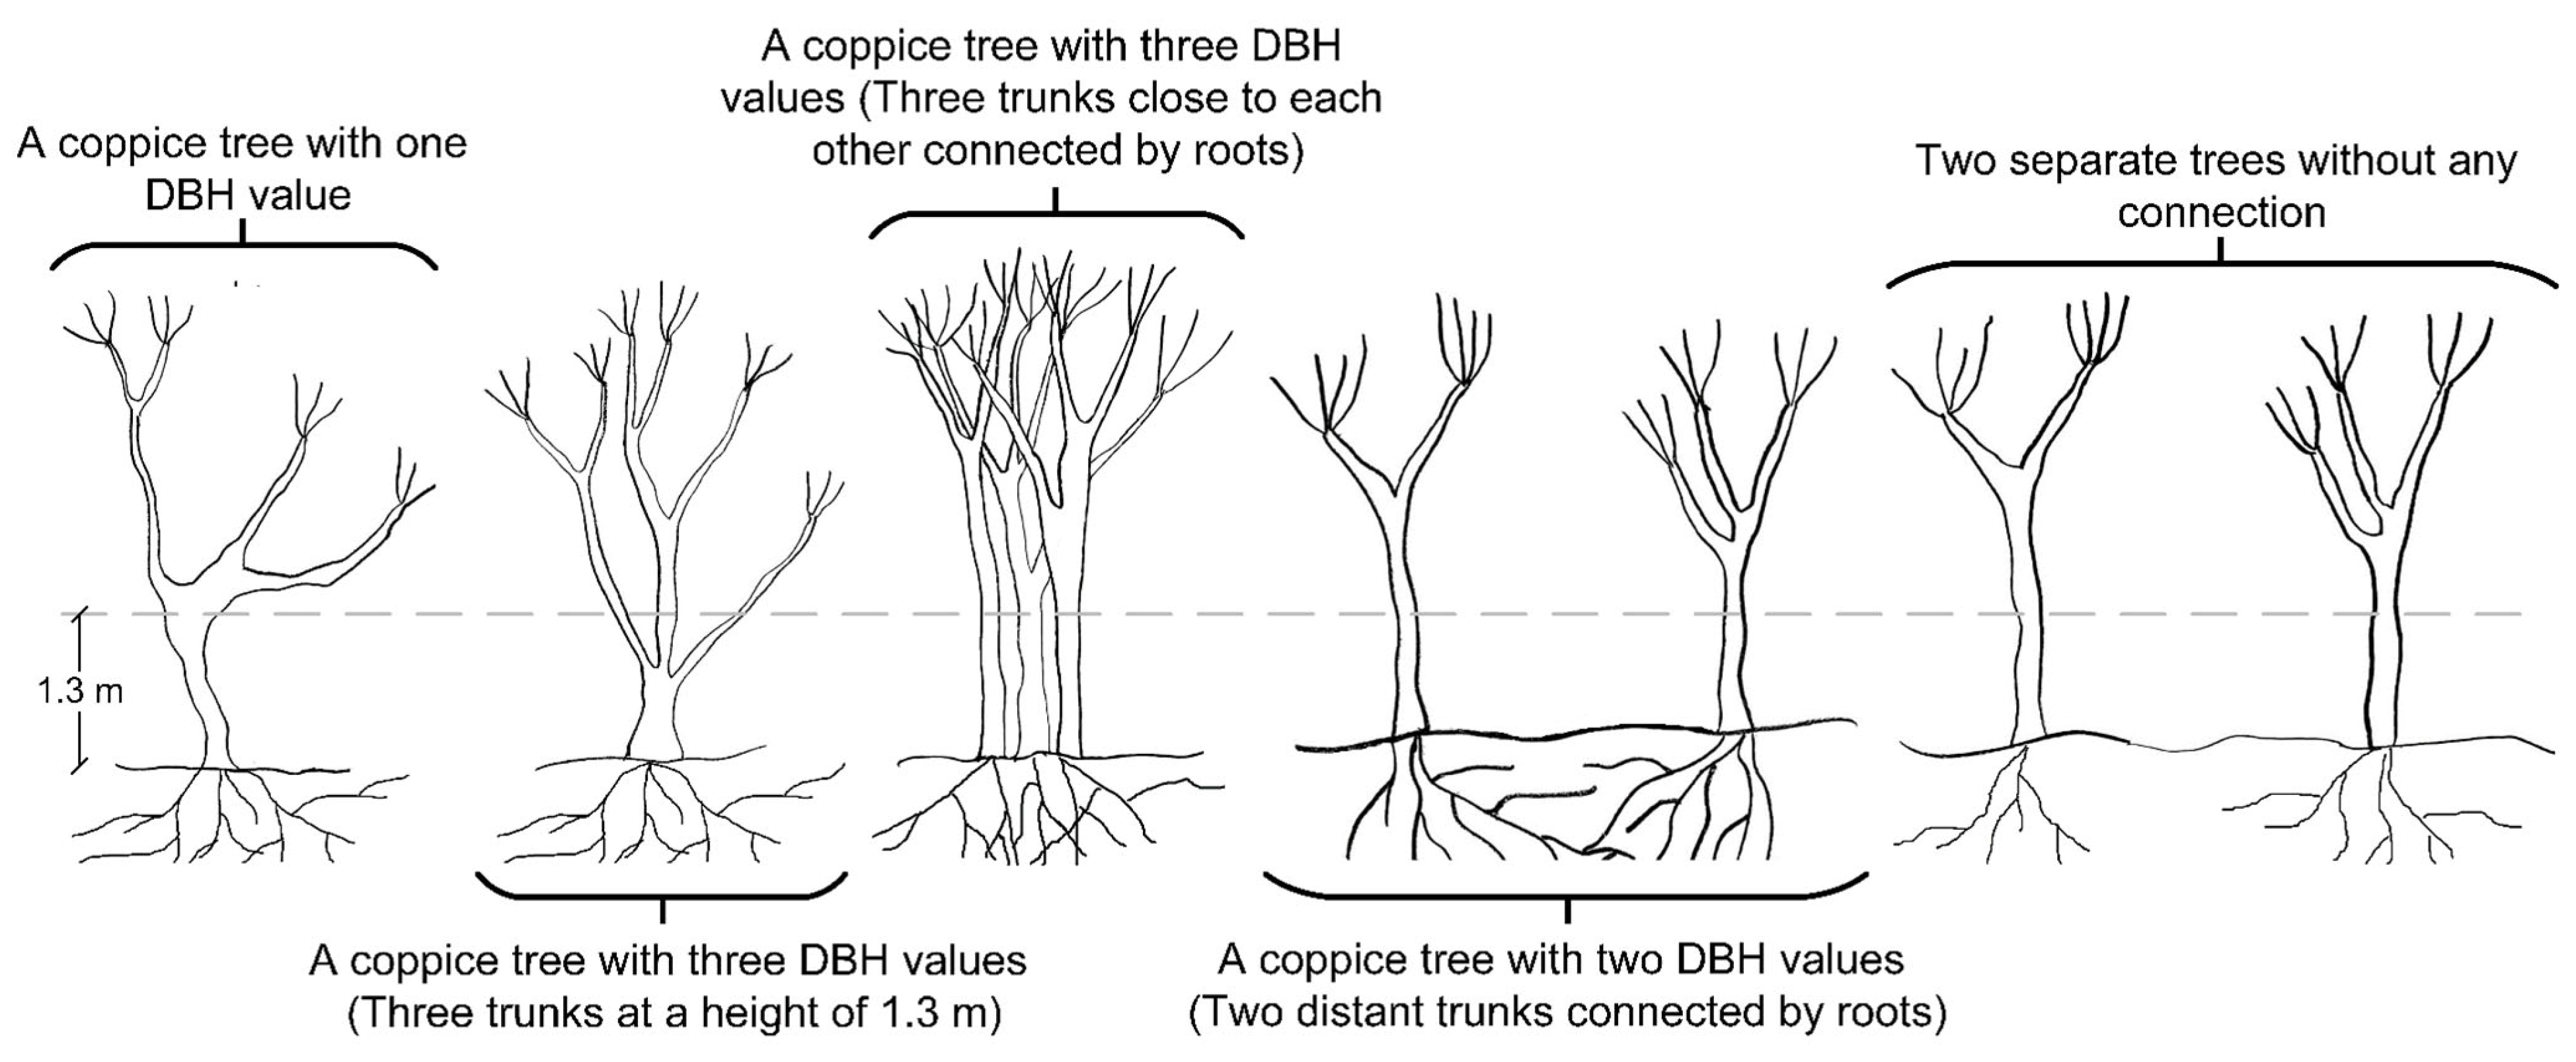
Table 6). We argue that the contrary is true in our case and other comparable cases in stands comprising both single- and multi-stem coppice structures. The use of photogrammetric UAV allows for the estimation of tree heights with reasonable accuracies, whereas DBH measurements may be more time-consuming or prohibited. Therefore, we estimated DBH using the UAV-derived tree heights for single- and multi-stem individuals in this study. In our special case, we used the maximum DBH of pollarded coppice groups (where trees are generally associated with more than one stem) as previously indicated in Section 2.2. We first checked whether distinguishing between single- and multi-stem trees (categorical variable of Tr in Table 7) improved the model quality. The high p-value for the Tr variable throughout the variable selection suggested that this categorization was not helping the model. As a result, we adopted the idea of using the maximum DBH.
The maximum DBH may also be suitable from an ecological perspective. In multi-stemmed coppice oak clumps, dominant stems benefit more from the well-developed parent-tree root system. Therefore, the dominant stem with maximum DBH typically grows faster both in diameter and height. Although multiple stems often persist within a clump for decades [112], as coppice stems grow larger, competition within the clump increases and reduces the diameter and height growth of stems. Finally, only one or two stems within each clump usually maintain their dominance in the crown position, and other stems are oppressed or excluded due to natural thinning or traditional silvicultural treatments [113]. Thus, we focused on establishing an allometry between the maximum DBH of the coppice oak trees and our UAV-derived H measurements.
In one of the few other studies focusing on DBH~H relationships in coppice stands, Niemczyk et al., (2016) used the allometric relationship suggested by [114] to estimate height from DBH. This relationship was nonlinear and included two fitted coefficients that were obtained by the samples measured in short rotations in northern Poland [
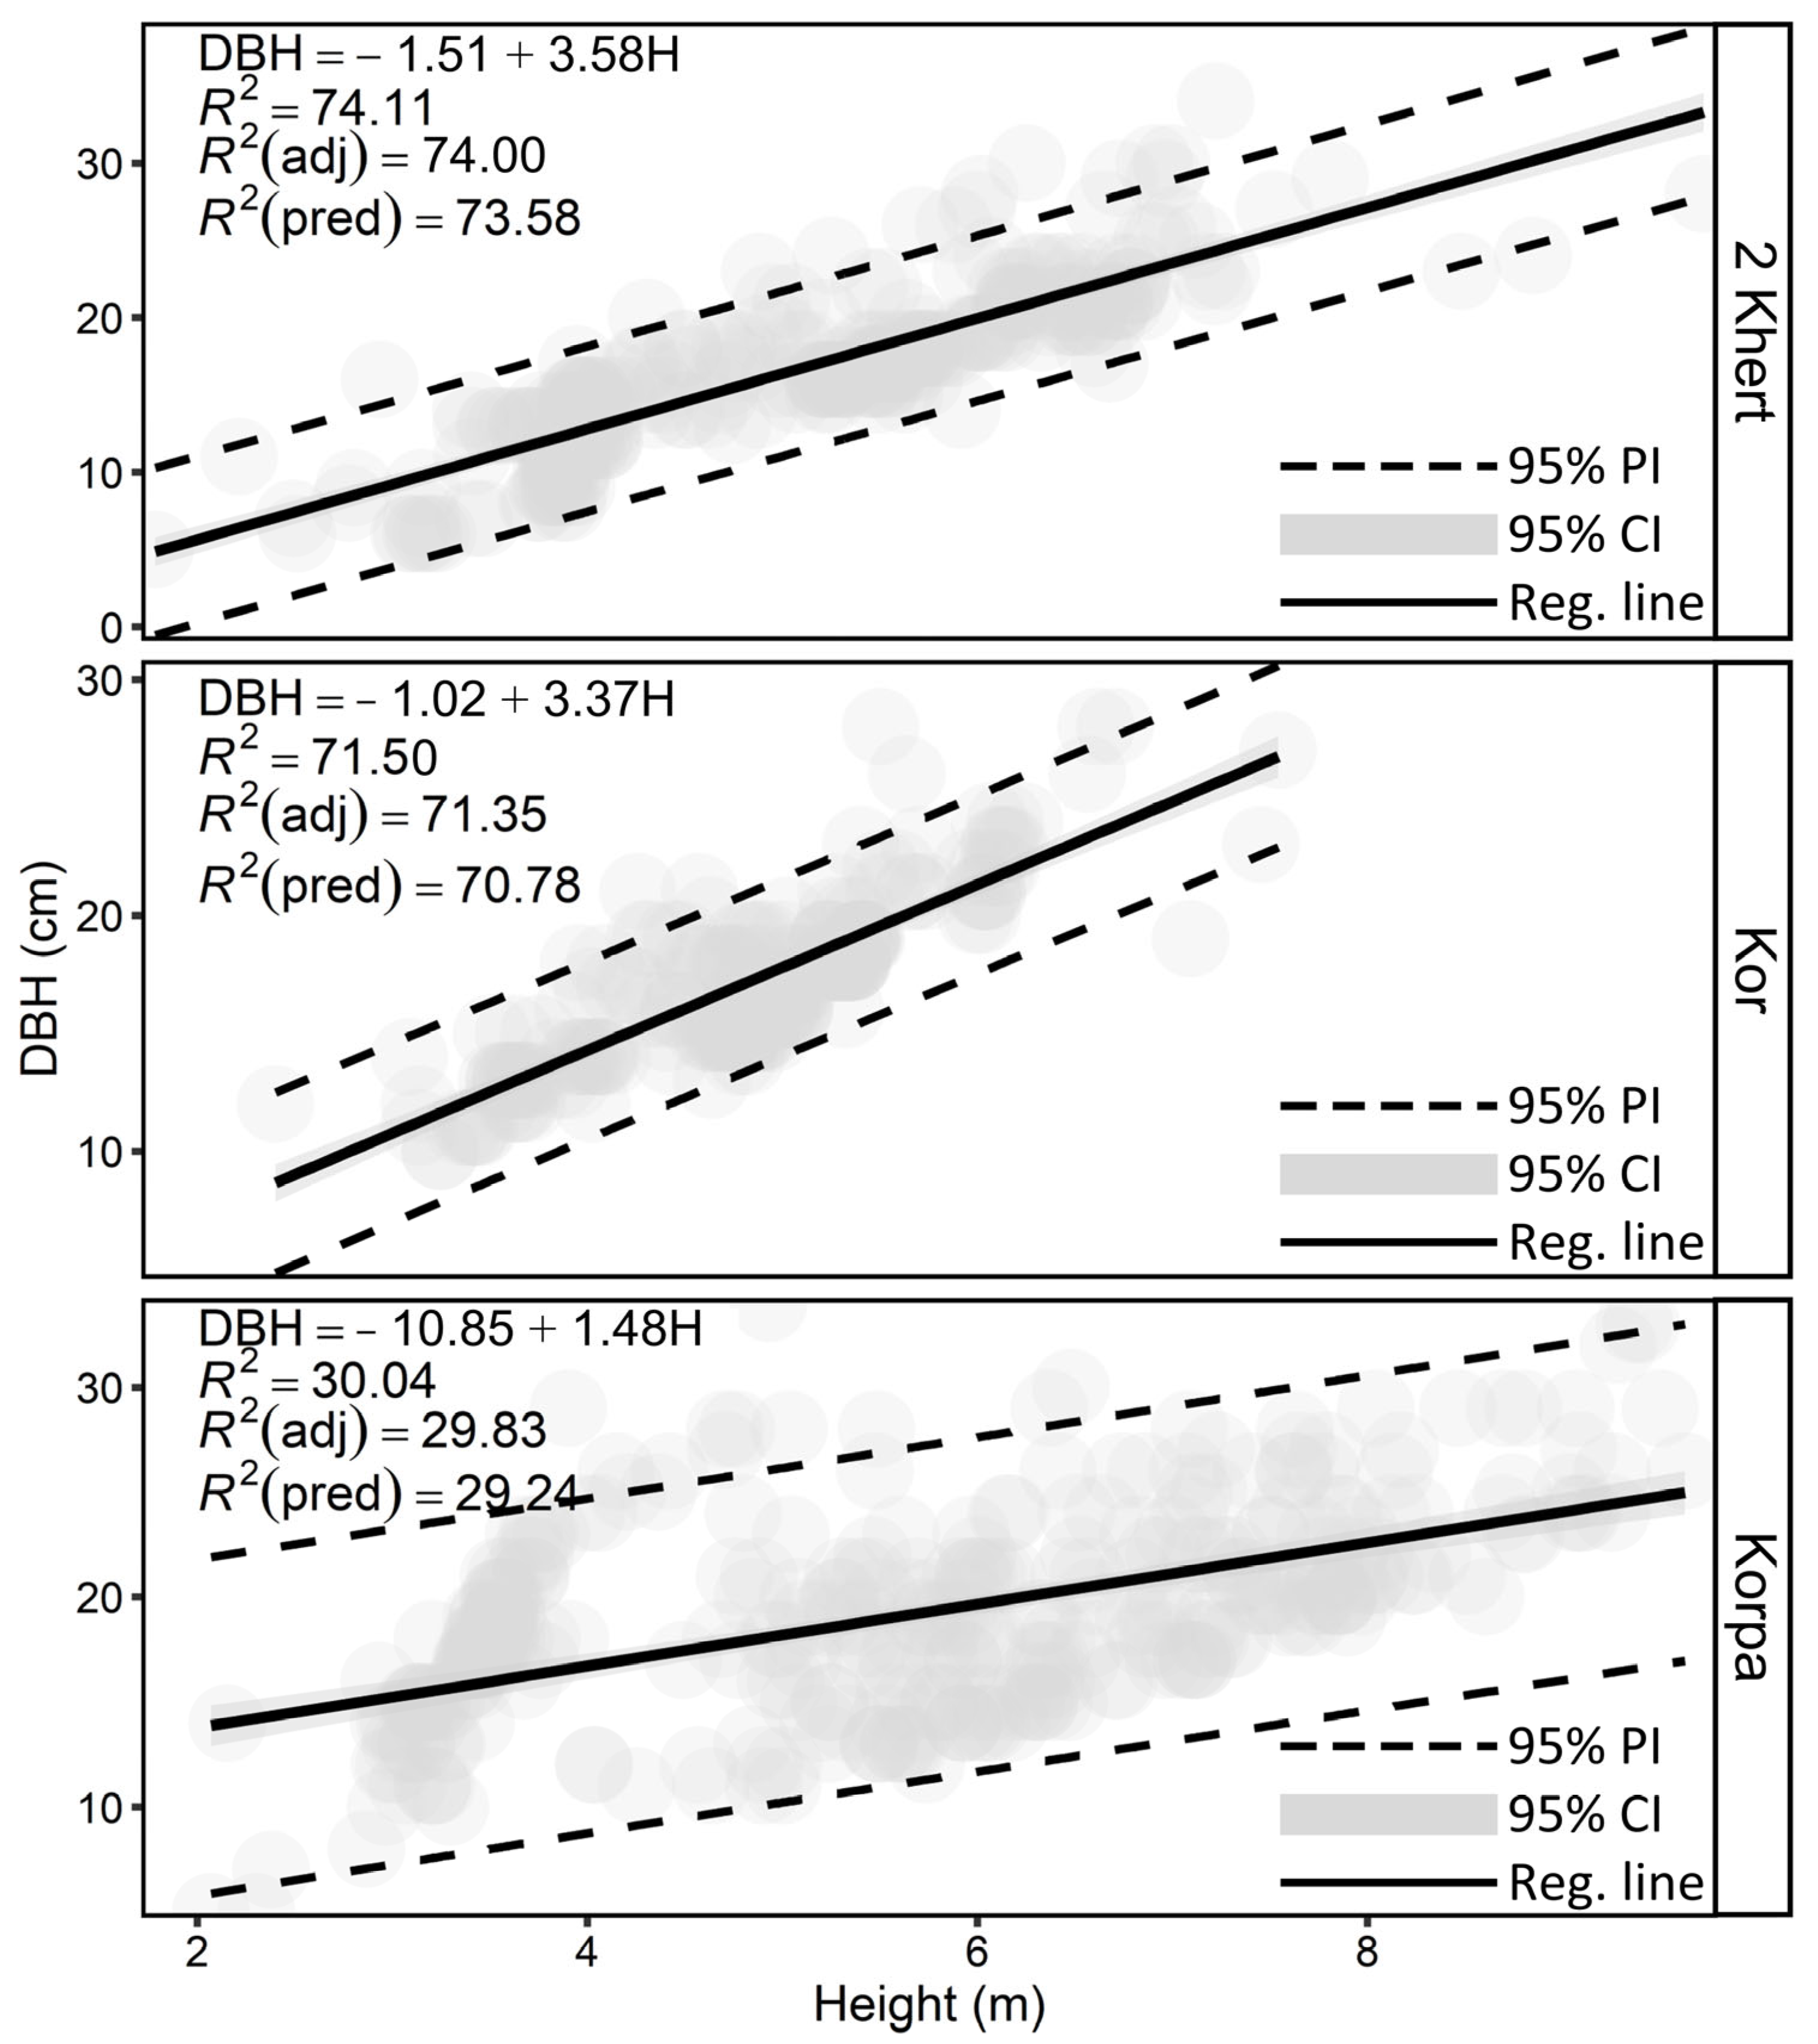
109]. In northern Zagros, such allometric equations do not exist, especially not for different stages of pollarding. Therefore, we applied a linear model to explore the link between DBH and height (Figure 5), in which we used the SE coefficient, T-value, and VIF to evaluate the model coefficients (Table 9). The SE coefficient explains how using different sampling techniques might lead to changes in the estimated coefficients [95]. Here, we observed a higher SE coefficient for the pollarding age (Age) class 2 Khert, i.e., Galajar’s DBH at the 2 Khert age was estimated more accurately. These linear models are not ecologically realistic because the increase in tree height decreases with time, especially when the tree reaches the forest canopy [115]. But this is only true if the forests are minimally disturbed, whereas our studied forests are regularly changed by humans (see Figure 1). However, we additionally tested nonlinear allometries (Table 6). Although the findings demonstrated that nonlinear models exhibited slightly better accuracy than linear models, we chose to utilize the linear model. This decision was based on the simplicity, comprehensibility, and superior interpretability of linear models compared to nonlinear models.
In our study sites, pollarding results in the complete debranching of oak trees. Therefore, one year later, pollarding trees have almost no crown and their height decreases by 1 to 1.5 m. With time, the tree crown recovers by producing new twigs and branches both apically and laterally [33]. Just 4 years after pollarding (2 Khert class), the tree crown and height reach their typical shape and condition. Thus, the relationship between DBH and height is more reliable in such stands.
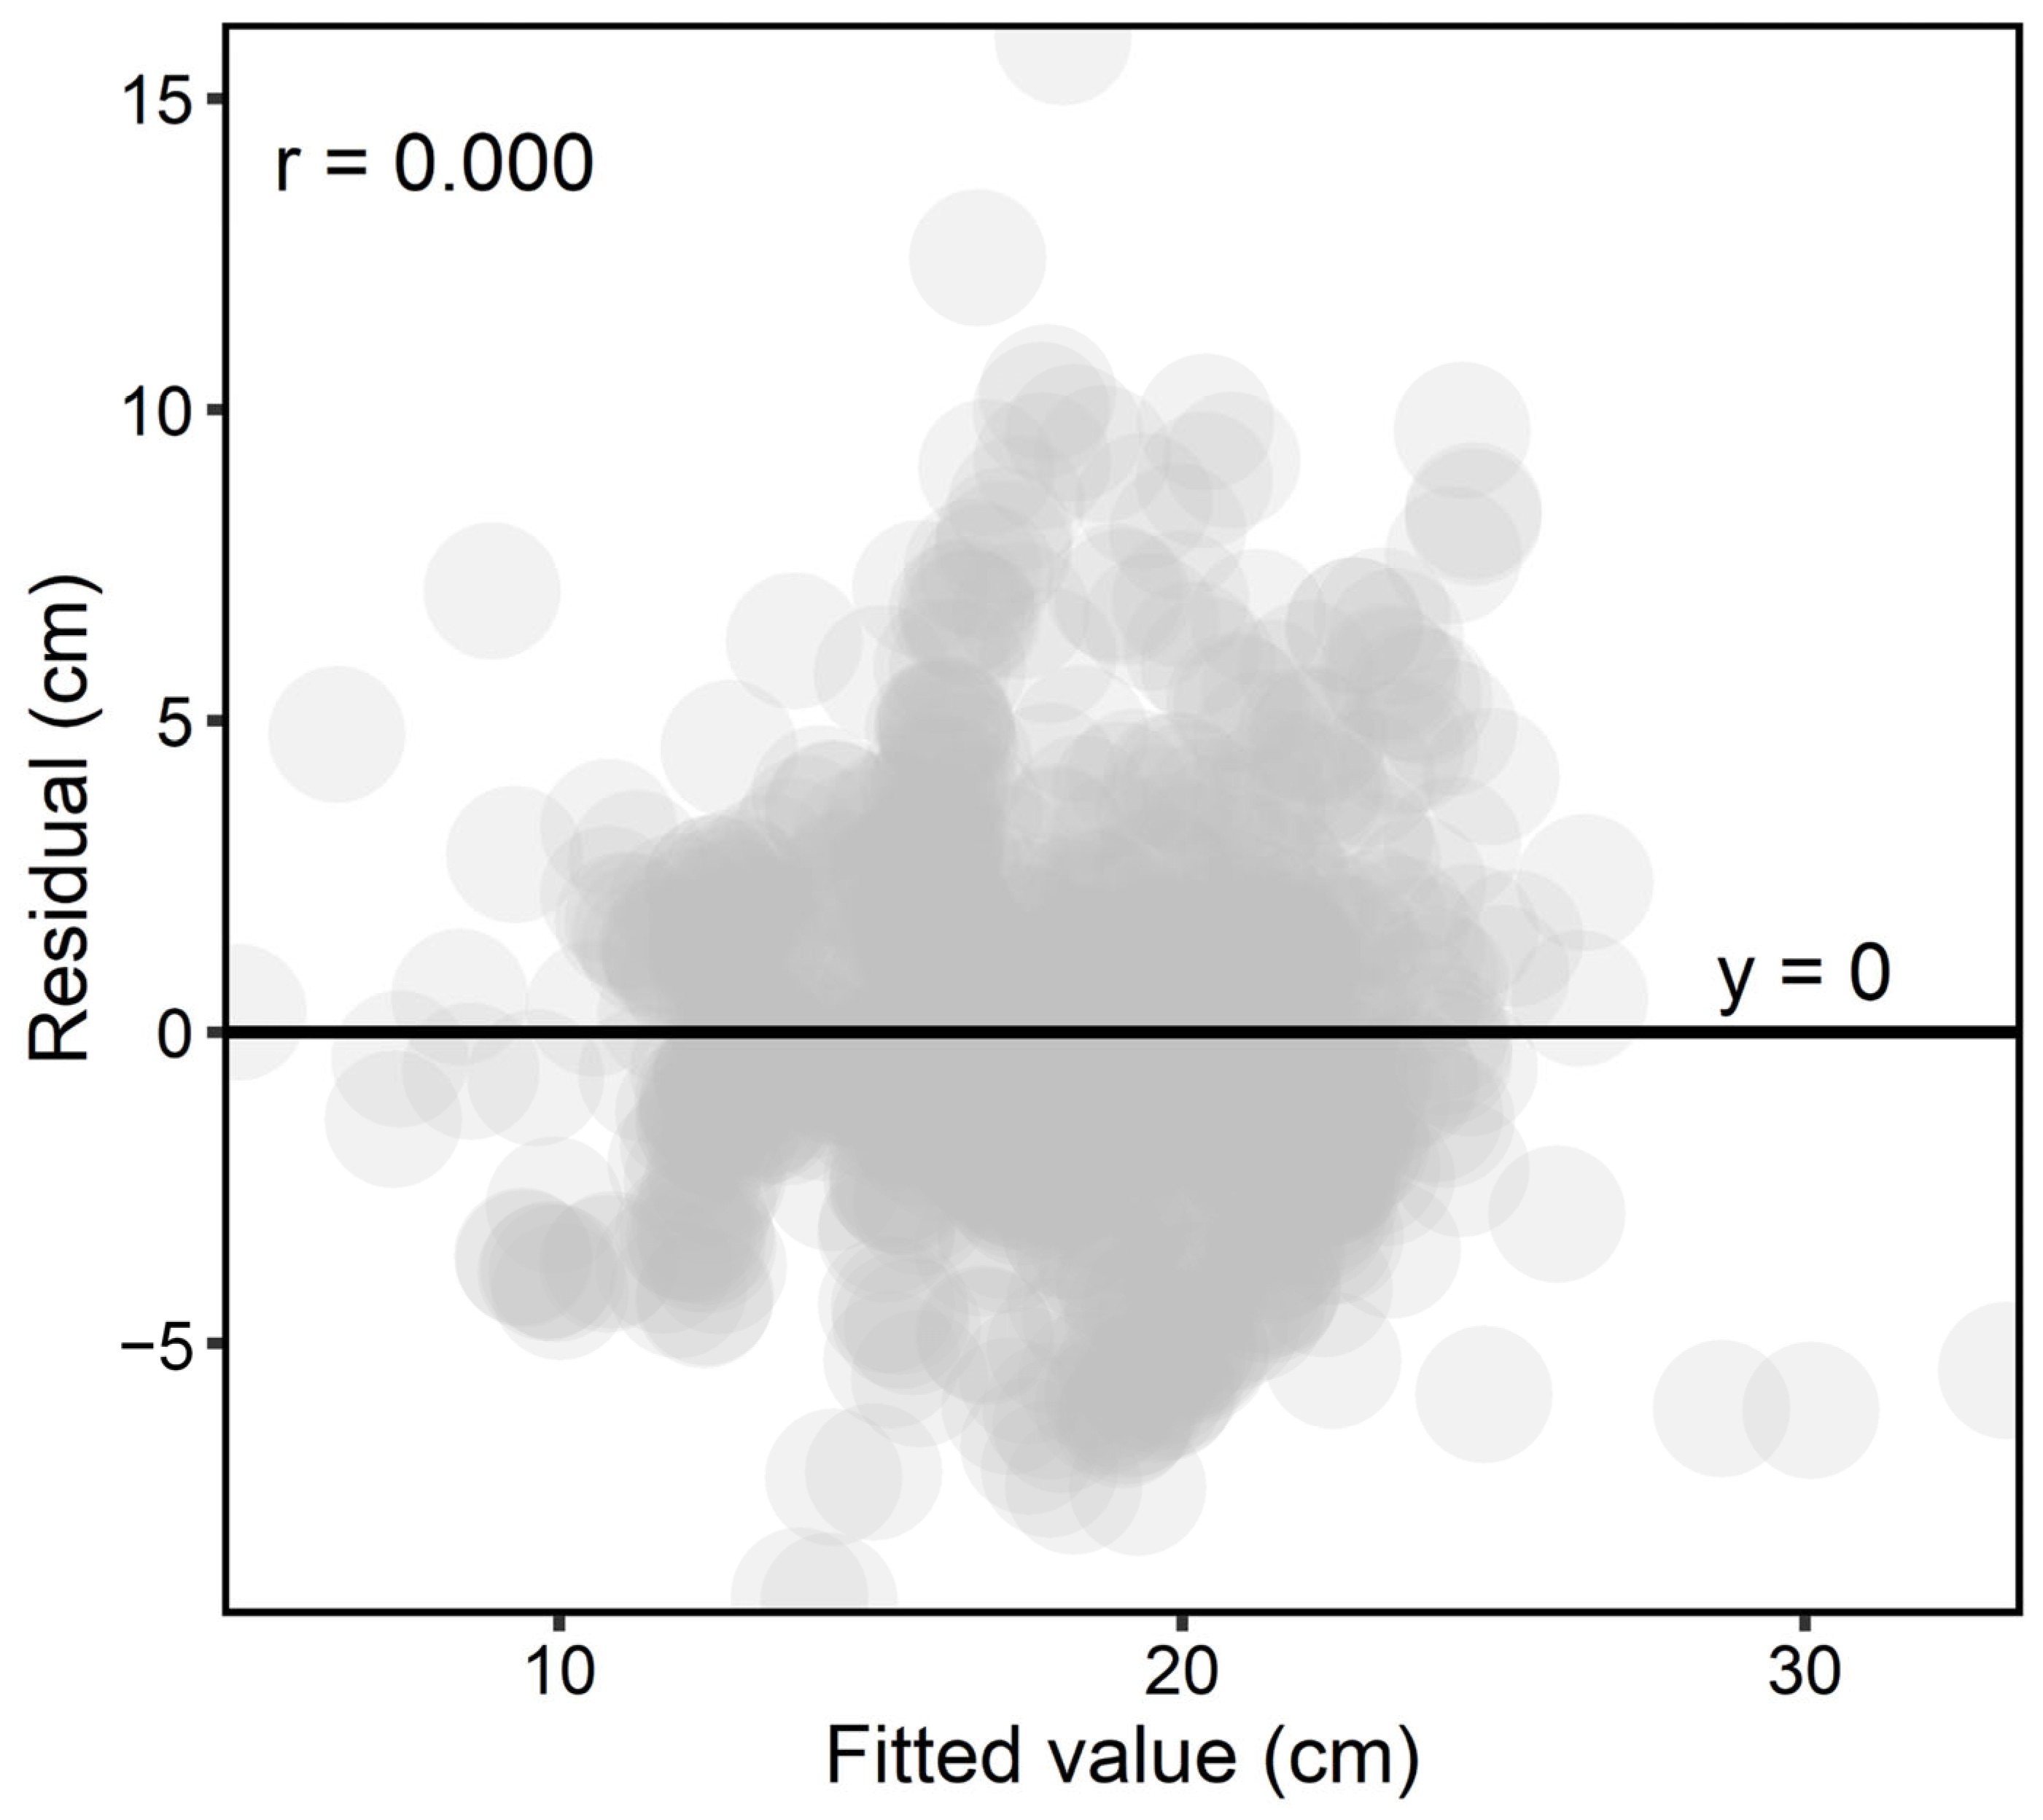
The linear model (Table 11) showed a reliable R2 in the overall assessment due to the small difference between R2 and R2adj. The R2pred is essentially a validation that denotes the degree of model reliability [116]. Furthermore, comparing k-fold S and k-fold R2 with S and R2, respectively, can warn of overfitting. We set k to 10, for which the small difference between the values rejected the hypothesis of model overfitting. In addition, the ANOVA (Table 12) showed relatively high SSError, i.e., changes in DBHMax that cannot be explained by the model. Since we chose DBHMax as the DBH value of the tree (except that the tree was multi-stem), it added an error to the model, which can be seen in SSError. We instead used DBHMax due to the fact that, in oak clumps, the dominant trees are significantly taller than the oppressed trees and stay dominant until all others are thinned or die.
The linear model suggested in this study allows for the prediction of DBH with reasonable accuracies in coppice stands at the age of Kor and 2 Khert, but the accuracy for stands in the Korpa age class is notably worse. Given that the models are also nearly unbiased, there seems to be a certain potential to inventory the DBH and hence also the biomass of oak coppice stands in Northern Zagros. Given the large areas covered by these coppice stands and given the frequently underestimated forest cover of semi-arid forests in global forest maps [117], this may be a relevant contribution to improve our understanding of global biomass distribution patterns and the corresponding carbon stocks. In future studies, it may be worthwhile to think about developing automated approaches to identify the pollarding age of coppice stands from remote sensing data. This may be possible with very-high-resolution UAV data but could also examined for other VHR data (if available).

5. Conclusions

In our research across silvopastoral systems (pollarded stands or Galajars) in Iran, we demonstrated that tree height can be effectively estimated at the scale of individual pollarded trees using UAV data. However, UAV photogrammetry is unable to directly derive DBH, which led us to demonstrate how DBH for Galajars of various ages may be estimated by tree height. We tested well-known nonlinear and linear allometries to model DBH~H and compared their performance, which suggested that DBH can be estimated with practically sufficient accuracy by solely using OLS with the independent variables of height and oak species across Galajar ages. We showed that removing species from the models was only associated with a marginal effect on the model accuracy; thus, we did not use species as a variable in the models. That is, we suggest eliminating species information when conducting pollarding-related field measurements, which would lead to significant savings in expert and logistics costs. We also suggest conducting a comparative analysis on pollarded and less-disturbed stands. Last but not least, one may note that we missed the Khert age group in our six inventoried sites, which calls for additional surveys on this age group to complement our results.

Supplementary Materials

The following supporting information can be downloaded at: https://www.mdpi.com/2072-4292/15/21/5261/s1, Figure S1: Distribution and histogram of maximum DBH by species and total trees; Figure S2: Distribution and histogram of tree height by species and total trees; Figure S3: Comparing the tree height obtained from the field method and the tree height extracted by UAV photogrammetry.

Author Contributions

Conceptualization, A.F. and H.L.; methodology, A.F., H.L. and F.E.F.; software, A.F.; validation, A.F.; formal analysis, A.F., H.L., F.E.F., K.M.S. and Z.S.; investigation, A.F. and H.L.; resources, A.F., H.L. and K.M.S.; data curation, A.F., H.L. and K.M.S.; writing—original draft preparation, A.F. and H.L.; writing—review and editing, A.F., H.L., F.E.F., K.M.S., H.N. and Z.S.; visualization, A.F.; supervision, H.L. and F.E.F.; project administration, H.L. and K.M.S.; funding acquisition, H.L. All authors have read and agreed to the published version of the manuscript.

Funding

This research was funded by the Iran National Science Foundation (project No. 99031132).

Data Availability Statement

Not applicable.

Acknowledgments

The authors thank the warm residents of Baneh, Kurdistan province, who generously hosted us during several months of field campaigns. We are particularly grateful to Mohammad Bahari for helping us with our field measurements. The authors also thank Sanaz Karimiazar for her help with drawing Figure 1 and Figure 3. This research was supported by the Iran National Science Foundation (INSF) (project No. 99031132) within the project “Spatial documentation and structural analysis of old-growth trees in traditionally-managed and unmanaged forests in northern Zagros by means of Unmanned Aerial Vehicle (UAV)-based photogrammetry.” This research was conducted within the “Remote Sensing for Ecology and Ecosystem Conservation (RSEEC)” research lab of the KNTU (https://www.researchgate.net/lab/Research-Lab-Remote-Sensing-for-Ecology-and-Ecosystem-Conservation-RSEEC-Hooman-Latifi) (accessed on 14 August 2023).

Conflicts of Interest

The authors declare no conflict of interest.

References

  1. FAO; UNEP. The State of the World’s Forests 2020. In Forests, Biodiversity and People; FAO: Rome, Italy, 2020. [Google Scholar]
  2. Nourani, V.; Sharghi, E.; Behfar, N.; Zhang, Y. Multi-Step-Ahead Solar Irradiance Modeling Employing Multi-Frequency Deep Learning Models and Climatic Data. Appl. Energy 2022, 315, 119069. [Google Scholar] [CrossRef]
  3. Sagheb-Talebi, K.; Pourhashemi, M.; Sajedi, T. Forests of Iran: A Treasure from the Past, a Hope for the Future; Springer: Berlin/Heidelberg, Germany, 2014; ISBN 9-40-077370-6. [Google Scholar]
  4. Jazirehi, M.; Ebrahimi Rostaghi, M. Silviculture in Zagros; Tehran University Press: Tehran, Iran, 2003; 560p. [Google Scholar]
  5. Marvie Mohajer, M.R. Silviculture and Forest Tending; Tehran University Press: Tehran, Iran, 2006; 325p. [Google Scholar]
  6. Valipour, A.; Plieninger, T.; Shakeri, Z.; Ghazanfari, H.; Namiranian, M.; Lexer, M. Traditional Silvopastoral Management and Its Effects on Forest Stand Structure in Northern Zagros, Iran. For. Ecol. Manag. 2014, 327, 221–230. [Google Scholar] [CrossRef]
  7. Khalyani, A.H.; Mayer, A.L.; Falkowski, M.J.; Muralidharan, D. Deforestation and Landscape Structure Changes Related to Socioeconomic Dynamics and Climate Change in Zagros Forests. J. Land Use Sci. 2013, 8, 321–340. [Google Scholar] [CrossRef]
  8. Henareh Khalyani, A.; Mayer, A.L. Spatial and Temporal Deforestation Dynamics of Zagros Forests (Iran) from 1972 to 2009. Landsc. Urban Plan. 2013, 117, 1–12. [Google Scholar] [CrossRef]
  9. Keenan, R.J.; Reams, G.A.; Achard, F.; de Freitas, J.V.; Grainger, A.; Lindquist, E. Dynamics of Global Forest Area: Results from the FAO Global Forest Resources Assessment 2015. For. Ecol. Manag. 2015, 352, 9–20. [Google Scholar] [CrossRef]
  10. Qaderian, A.; Ahmadi Sani, N. Land Use Changes Predicition in Zagros Forest Areas Based on Markov Chain Model. J. Environ. Sci. Technol. 2020. [Google Scholar]
  11. Heidarlou, H.B.; Shafiei, A.B.; Erfanian, M.; Tayyebi, A.; Alijanpour, A. Land Cover Changes in Northern Zagros Forests (Nw Iran) Before and During Implementation of Energy Policies. J. Sustain. For. 2021, 40, 234–248. [Google Scholar] [CrossRef]
  12. Salehi, A.; Karltun, L.C.; Soderberg, U.; Erikson, L.O. Livelihood Dependency on Woodland Resources in Southern Zagros, Iran. Casp. J. Environ. Sci. 2010, 8, 181–194. [Google Scholar]
  13. Mahdavi, A.; Wunder, S.; Mirzaeizadeh, V.; Omidi, M. A Hidden Harvest from Semi-Arid Forests: Landscape-Level Livelihood Contributions in Zagros, Iran. For. Trees Livelihoods 2019, 28, 108–125. [Google Scholar] [CrossRef]
  14. Plieninger, T.; Shamohamadi, S.; García-Martín, M.; Quintas-Soriano, C.; Shakeri, Z.; Valipour, A. Community, Pastoralism, Landscape: Eliciting Values and Human-Nature Connectedness of Forest-Related people. Landsc. Urban Plan 2023, 233, 104706, (in press). [Google Scholar] [CrossRef]
  15. Shakeri, Z.; Mohammadi-Samani, K.; Bergmeier, E.; Plieninger, T. Spiritual Values Shape Taxonomic Diversity, Vegetation Composition, and Conservation Status in Woodlands of the Northern Zagros, Iran. Ecol. Soc. 2021, 26, 260130. [Google Scholar] [CrossRef]
  16. Ghahramany, L.; Shakeri, Z.; Ghalavand, E.; Ghazanfari, H. Does Diameter Increment of Lebanon Oak Trees (Quercus libani Oliv.) Affected by Pollarding in Northern Zagros, Iran? Agrofor. Syst. 2017, 91, 741–748. [Google Scholar] [CrossRef]
  17. Ghazanfari, H.; Namiranian, M.; Sobhani, H.; Mohajer, R. Traditional Forest Management and Its Application to Encourage Public Participation for Sustainable Forest Management in the Northern Zagros Mountains of Kurdistan Province, Iran. Scand. J. For. Res. 2004, 19, 65–71. [Google Scholar] [CrossRef]
  18. Khosravi, S.; Namiranian, M.; Ghazanfari, H.; Shirvani, A. Crown Biomass Relationships of Lebanon Oak in Northern Zagros Forests of Iran. Croat. J. For. Eng. 2012, 33, 239–247. Available online: https://hrcak.srce.hr/file/172740 (accessed on 3 November 2023).
  19. Fattahi, M. Study of Western Iranian Oak Forests and Their Main Degradation Causes; Forest Research Division, Research Institute of Forest and Rangelands: Tehran, Iran, 1994; Volume 63. (In Persian) [Google Scholar]
  20. Turnbull, C. Cass Turnbull’s Guide to Pruning: What, When, Where, and How to Prune for a More Beautiful Garden; Sasquatch Books: Seattle, DC, USA, 2012; ISBN 1-57-061794-5. [Google Scholar]
  21. Geta, T.; Gebreyes, L.; Animut, G. Evaluation of Potential Yield and Chemical Composition of Selected Indigenous Multi-Purpose Fodder Trees in Three Districts of Wolayta Zone, Southern Ethiopia Takele Geta, Lisanework Nigatu and Getachew Animut. World Appl. Sci. J. 2014, 31, 399–405. [Google Scholar]
  22. Guyassa, E.; Raj, A.J.; Giday, K.; Tadesse, A. Domestication of Indigenous Fruit and Fodder Trees/Shrubs in Dryland Agroforestry and Its Implication on Food Security. Int. J. Ecosyst. 2014, 4, 83–88. [Google Scholar]
  23. Franzel, S.; Carsan, S.; Lukuyu, B.; Sinja, J.; Wambugu, C. Fodder Trees for Improving Livestock Productivity and Smallholder Livelihoods in Africa. Curr. Opin. Environ. Sustain. 2014, 6, 98–103. [Google Scholar] [CrossRef]
  24. Lang, P.; Jeschke, M.; Wommelsdorf, T.; Backes, T.M.; Lv, C.; Zhang, X.; Thomas, F.M. Wood Harvest by Pollarding Exerts Long-Term Effects on Populus Euphratica Stands in Riparian Forests at the Tarim River, NW China. For. Ecol. Manag. 2015, 353, 87–96. [Google Scholar] [CrossRef]
  25. Khedri, L.; Ghahramany, L.; Ghazanfari, H.; Pulido, F. A Quantitative Study of Pollarding Process in Silvopastoral Systems of Northern Zagros, Iran. For. Syst. 2017, 26, e018. [Google Scholar] [CrossRef]
  26. Rozas, V. Dendrochronology of Pedunculate Oak (Quercus robur L.) in an Old-Growth Pollarded Woodland in Northern Spain: Establishment Patterns and the Management History. Ann. For. Sci. 2005, 62, 13–22. [Google Scholar] [CrossRef]
  27. Moradi, A.; Oladi, J.; Fallah, A.; Fatehi, P. An Evaluation of the Capability of IRS-P6 Data for Monitoring Pollarding Forest Areas of Northern Zagros (Case Study: Kurdistan, Pollarded Forests of Baneh). J. Agric. Sci. Technol. 2010, 12, 299–308. [Google Scholar]
  28. Ghazanfari, H.; Namiranian, M.; Sobhani, H.; Marvi, M.M.R.; Pourtahmasi, K. An estimation of tree diameter growth of Lebanon oak (Quercus libani) in northern Zagros forests (Case study: Havareh Khole). Iran. J. Nat. Resour. 2005, 57, 649–662. [Google Scholar]
  29. Saglam, S.; Ozdemir, E.; Ozkan, U.Y.; Demirel, T.; Makineci, E. Estimation of Fresh Sprout Biomass Based on Tree Variables of Pollarding Turkey Oak (Quercus cerris L.). Environ. Monit. Assess. 2021, 193, 83. [Google Scholar] [CrossRef]
  30. Valipour, A. Development of a Management Model for Improving Oak Forest Structure (The Case of Armardeh, Northern Zagros of Iran). Ph.D. Dissertation, University of Tehran, Tehran, Iran, 2013; 130p. (In Persian). [Google Scholar]
  31. Pinkard, E.A.; Battaglia, M.; Beadle, C.L.; Sands, P.J. Modeling the Effect of Physiological Responses to Green Pruning on Net Biomass Production of Eucalyptus Nitens. Tree Physiol. 1999, 19, 1–12. [Google Scholar] [CrossRef] [PubMed]
  32. Ranjbar, A.; Ghahramany, L.; Pourhashemi, M. Impact assessment of pollarding on biometrical indices of Lebanon oak (Quercus libani Oliv.) in Belake Forests, Baneh. Iran. J. For. Poplar Res. 2012, 20, 578–594, (In Persian, Abstract in English). [Google Scholar]
  33. Abbasi, L.; Shakeri, Z.; Shabanian, N.; Moreno, G. Branch and leaf biomass of Lebanon oak (Quercus libani Oliv.) and gall oak (Q. infectoria Oliv.) trees in different years after pollarding. Iran. J. For. Poplar Res. 2017, 25, 46–55, (In Persian, Abstract in English). [Google Scholar]
  34. Khosravi, S.; Namiranian, M.; Ghazanfari, H.; Shirvani, A. Estimation of Leaf Area Index and Assessment of Its Allometric Equations in Oak Forests: Northern Zagros, Iran. J. For. Sci. 2012, 58, 116–122. [Google Scholar] [CrossRef]
  35. Kint, V.; Robert, D.W.; Noël, L. Evaluation of Sampling Methods for the Estimation of Structural Indices in Forest Stands. Ecol. Model. 2004, 180, 461–476. [Google Scholar] [CrossRef]
  36. Nowak, D.J.; Crane, D.E.; Stevens, J.C.; Hoehn, R.E.; Walton, J.T.; Bond, J. A Ground-Based Method of Assessing Urban Forest Structure and Ecosystem Services. Aboriculture Urban For. 2008, 34, 347–358. [Google Scholar] [CrossRef]
  37. Goodbody, T.R.; Coops, N.C.; Marshall, P.L.; Tompalski, P.; Crawford, P. Unmanned Aerial Systems for Precision Forest Inventory Purposes: A Review and Case Study. For. Chron. 2017, 93, 71–81. [Google Scholar] [CrossRef]
  38. Ganz, S.; Käber, Y.; Adler, P. Measuring Tree Height with Remote Sensing—A Comparison of Photogrammetric and LiDAR Data with Different Field Measurements. Forests 2019, 10, 694. [Google Scholar] [CrossRef]
  39. Chung, C.-H.; Wang, C.-H.; Hsieh, H.-C.; Huang, C.-Y. Comparison of Forest Canopy Height Profiles in a Mountainous Region of Taiwan Derived from Airborne Lidar and Unmanned Aerial Vehicle Imagery. GISci. Remote Sens. 2019, 56, 1289–1304. [Google Scholar] [CrossRef]
  40. Lechner, A.M.; Foody, G.M.; Boyd, D.S. Applications in Remote Sensing to Forest Ecology and Management. One Earth 2020, 2, 405–412. [Google Scholar] [CrossRef]
  41. Nilsson, M. Estimation of Tree Heights and Stand Volume Using an Airborne Lidar System. Remote Sens. Environ. 1996, 56, 1–7. [Google Scholar] [CrossRef]
  42. Camarretta, N.; Harrison, P.A.; Bailey, T.; Potts, B.; Lucieer, A.; Davidson, N.; Hunt, M. Monitoring Forest Structure to Guide Adaptive Management of Forest Restoration: A Review of Remote Sensing Approaches. New For. 2020, 51, 573–596. [Google Scholar] [CrossRef]
  43. Andersen, H.-E.; Reutebuch, S.E.; McGaughey, R.J. A Rigorous Assessment of Tree Height Measurements Obtained Using Airborne Lidar and Conventional Field Methods. Can. J. Remote Sens. 2006, 32, 355–366. [Google Scholar] [CrossRef]
  44. Luo, H.; Chen, E.; Cheng, J.; Li, X. Forest Height Estimation Methods Using Polarimetric SAR Interferometry. J. Remote Sens. 2010, 14, 806–821. [Google Scholar]
  45. Maltamo, M.; Næsset, E.; Vauhkonen, J. Forestry Applications of Airborne Laser Scanning: Concepts and Case Studies; Managing Forest Ecosystems; Springer: Dordrecht, The Netherlands, 2014; Volume 27. [Google Scholar]
  46. Ozdemir, I.; Karnieli, A. Predicting Forest Structural Parameters Using the Image Texture Derived from WorldView-2 Multispectral Imagery in a Dryland Forest, Israel. Int. J. Appl. Earth Obs. Geoinf. 2011, 13, 701–710. [Google Scholar] [CrossRef]
  47. Zhao, Y.; Ma, Y.; Quackenbush, L.J.; Zhen, Z. Estimation of Individual Tree Biomass in Natural Secondary Forests Based on ALS Data and WorldView-3 Imagery. Remote Sens. 2022, 14, 271. [Google Scholar] [CrossRef]
  48. Fakhri, S.A.; Sayadi, S.; Naghavi, H.; Latifi, H. A Novel Vegetation Index-Based Workflow for Semi-Arid, Sparse Woody Cover Mapping. J. Arid Environ. 2022, 201, 104748. [Google Scholar] [CrossRef]
  49. Lassalle, G.; Ferreira, M.P.; La Rosa, L.E.C.; de Souza Filho, C.R. Deep Learning-Based Individual Tree Crown Delineation in Mangrove Forests Using Very-High-Resolution Satellite Imagery. ISPRS J. Photogramm. Remote Sens. 2022, 189, 220–235. [Google Scholar] [CrossRef]
  50. Liu, G.; Wang, J.; Dong, P.; Chen, Y.; Liu, Z. Estimating Individual Tree Height and Diameter at Breast Height (DBH) from Terrestrial Laser Scanning (TLS) Data at Plot Level. Forests 2018, 9, 398. [Google Scholar] [CrossRef]
  51. Dorren, L.K.A.; Maier, B.; Berger, F. Assessing protection forest structure with airborne laser scanning in steep mountainous terrain. In Proceedings of the International Workshop 3D Remote Sensing in Forestry, EARSeL, Vienna, Austria, 13–15 February 2006; pp. 238–242. [Google Scholar]
  52. Ullah, S.; Dees, M.; Datta, P.; Adler, P.; Saeed, T.; Khan, M.S.; Koch, B. Comparing the Potential of Stereo Aerial Photographs, Stereo Very High-Resolution Satellite Images, and TanDEM-X for Estimating Forest Height. Int. J. Remote Sens. 2020, 41, 6976–6992. [Google Scholar] [CrossRef]
  53. Fakhri, S.A.; Latifi, H. A Consumer Grade UAV-Based Framework to Estimate Structural Attributes of Coppice and High Oak Forest Stands in Semi-Arid Regions. Remote Sens. 2021, 13, 4367. [Google Scholar] [CrossRef]
  54. Puliti, S.; Solberg, S.; Granhus, A. Use of UAV Photogrammetric Data for Estimation of Biophysical Properties in Forest Stands under Regeneration. Remote Sens. 2019, 11, 233. [Google Scholar] [CrossRef]
  55. Iizuka, K.; Itoh, M.; Shiodera, S.; Matsubara, T.; Dohar, M.; Watanabe, K. Advantages of Unmanned Aerial Vehicle (UAV) Photogrammetry for Landscape Analysis Compared with Satellite Data: A Case Study of Postmining Sites in Indonesia. Cogent Geosci. 2018, 4, 1498180. [Google Scholar] [CrossRef]
  56. Pessacg, F.; Gómez-Fernández, F.; Nitsche, M.; Chamo, N.; Torrella, S.; Ginzburg, R.; De Cristóforis, P. Simplifying UAV-Based Photogrammetry in Forestry: How to Generate Accurate Digital Terrain Model and Assess Flight Mission Settings. Forests 2022, 13, 173. [Google Scholar] [CrossRef]
  57. Krause, S.; Sanders, T.G.; Mund, J.-P.; Greve, K. UAV-Based Photogrammetric Tree Height Measurement for Intensive Forest Monitoring. Remote Sens. 2019, 11, 758. [Google Scholar] [CrossRef]
  58. Mahmud, M.S.; He, L.; Heinemann, P.; Choi, D.; Zhu, H. Unmanned Aerial Vehicle Based Tree Canopy Characteristics Measurement for Precision Spray Applications. Smart Agric. Technol. 2023, 4, 100153. [Google Scholar] [CrossRef]
  59. Hobart, M.; Pflanz, M.; Weltzien, C.; Schirrmann, M. Growth Height Determination of Tree Walls for Precise Monitoring in Apple Fruit Production Using UAV Photogrammetry. Remote Sens. 2020, 12, 1656. [Google Scholar] [CrossRef]
  60. Johansen, K.; Raharjo, T.; McCabe, M.F. Using Multi-Spectral UAV Imagery to Extract Tree Crop Structural Properties and Assess Pruning Effects. Remote Sens. 2018, 10, 854. [Google Scholar] [CrossRef]
  61. Ghasemi, M.; Latifi, H.; Pourhashemi, M. A Novel Method for Detecting and Delineating Coppice Trees in UAV Images to Monitor Tree Decline. Remote Sens. 2022, 14, 5910. [Google Scholar] [CrossRef]
  62. Pádua, L.; Vanko, J.; Hruška, J.; Adão, T.; Sousa, J.J.; Peres, E.; Morais, R. UAS, Sensors, and Data Processing in Agroforestry: A Review towards Practical Applications. Int. J. Remote Sens. 2017, 38, 2349–2391. [Google Scholar] [CrossRef]
  63. Manfreda, S.; McCabe, M.F.; Miller, P.E.; Lucas, R.; Pajuelo Madrigal, V.; Mallinis, G.; Ben Dor, E.; Helman, D.; Estes, L.; Ciraolo, G.; et al. On the Use of Unmanned Aerial Systems for Environmental Monitoring. Remote Sens. 2018, 10, 641. [Google Scholar] [CrossRef]
  64. Erfanifard, Y.; Kraszewski, B.; Sterenczak, K. Integration of Remote Sensing in Spatial Ecology: Assessing the Interspecific Interactions of Two Plant Species in a Semi-Arid Woodland Using Unmanned Aerial Vehicle (UAV) Photogrammetric Data. Oecologia 2021, 196, 115–130. [Google Scholar] [CrossRef]
  65. Chenari, A.; Erfanifard, Y.; Dehghani, M.; Pourghasemi, H.R. Woodland Mapping at Single-Tree Levels Using Object-Oriented Classification of Unmanned Aerial Vehicle (Uav) Images. ISPRS-Int. Arch. Photogramm. Remote Sens. Spat. Inf. Sci. 2017, 42W4, 43–49. [Google Scholar] [CrossRef]
  66. Pirasteh, S.; Li, J. Landslides Investigations from Geoinformatics Perspective: Quality, Challenges, and Recommendations. Geomat. Nat. Hazards Risk 2017, 8, 448–465. [Google Scholar] [CrossRef]
  67. Ghahramany, L.; Ghazanfari, H.; Fatehi, P.; Valipour, A. Structure of Pollarded Oak Forest in Relation to Aspect in Northern Zagros, Iran. Agrofor. Syst. 2018, 92, 1567–1577. [Google Scholar] [CrossRef]
  68. Valipour, A.; Namiraninan, M.; Etemad, V.; Ghazanfari, H. Relationships between Diameter, Height and Geographical Aspects with Bark Thickness of Lebanon Oak Tree (Quercus libani Oliv.) in Armardeh, Baneh (Northern Zagros of Iran). Res. J. For. 2009, 3, 1–7. [Google Scholar] [CrossRef]
  69. Panagiotidis, D.; Abdollahnejad, A.; Surový, P.; Chiteculo, V. Determining Tree Height and Crown Diameter from High-Resolution UAV Imagery. Int. J. Remote Sens. 2017, 38, 2392–2410. [Google Scholar] [CrossRef]
  70. Ferrini, F.F. Pollarding and Its Effects on Tree Physiology: A Look to Mature and Senescent Tree Management in Italy. In Les Trognes en Europe: Rencontres Autour des Arbres Têtards et D’émonde; Dumont, E., Jacquin, F.X., Lizet, B., Mansion, D., Eds.; Actes du 1er Colloque Européen Sur les Trognes; Lycée Agricole d’Areine, Maison Botanique de Boursay: Vendôme, France, 2006; 8p. [Google Scholar]
  71. Iglhaut, J.; Cabo, C.; Puliti, S.; Piermattei, L.; O’Connor, J.; Rosette, J. Structure from Motion Photogrammetry in Forestry: A Review. Curr. For. Rep. 2019, 5, 155–168. [Google Scholar] [CrossRef]
  72. Wackrow, R.; Chandler, J.H. Minimising Systematic Error Surfaces in Digital Elevation Models Using Oblique Convergent Imagery. Photogramm. Rec. 2011, 26, 16–31. [Google Scholar] [CrossRef]
  73. Lin, J.; Wang, M.; Ma, M.; Lin, Y. Aboveground Tree Biomass Estimation of Sparse Subalpine Coniferous Forest with UAV Oblique Photography. Remote Sens. 2018, 10, 1849. [Google Scholar] [CrossRef]
  74. Nasiri, V.; Darvishsefat, A.A.; Arefi, H.; Pierrot-Deseilligny, M.; Namiranian, M.; Le Bris, A. UAV-Based Canopy Height Modeling under Leaf-on and Leaf-off Conditions for Determining Tree Height and Crown Diameter (Case Study: Hyrcanian Mixed Forest). Can. J. For. Res. 2021, 51, 962–971. [Google Scholar] [CrossRef]
  75. Li, D.; Guo, H.; Wang, C.; Li, W.; Chen, H.; Zuo, Z. Individual Tree Delineation in Windbreaks Using Airborne-Laser-Scanning Data and Unmanned Aerial Vehicle Stereo Images. IEEE Geosci. Remote Sens. Lett. 2016, 13, 1330–1334. [Google Scholar] [CrossRef]
  76. Whitehead, K.; Hugenholtz, C.H. Remote Sensing of the Environment with Small Unmanned Aircraft Systems (UASs), Part 1: A Review of Progress and Challenges. J. Unmanned Veh. Syst. 2014, 2, 69–85. [Google Scholar] [CrossRef]
  77. Tinkham, W.T.; Swayze, N.C. Influence of Agisoft Metashape Parameters on UAS Structure from Motion Individual Tree Detection from Canopy Height Models. Forests 2021, 12, 250. [Google Scholar] [CrossRef]
  78. Mousavi, V.; Varshosaz, M.; Remondino, F. Using Information Content to Select Keypoints for UAV Image Matching. Remote Sens. 2021, 13, 1302. [Google Scholar] [CrossRef]
  79. Mousavi, V.; Varshosaz, M.; Rashidi, M.; Li, W. A New Multi-Criteria Tie Point Filtering Approach to Increase the Accuracy of UAV Photogrammetry Models. Drones 2022, 6, 413. [Google Scholar] [CrossRef]
  80. Jurjević, L.; Gašparović, M.; Liang, X.; Balenović, I. Assessment of Close-Range Remote Sensing Methods for DTM Estimation in a Lowland Deciduous Forest. Remote Sens. 2021, 13, 2063. [Google Scholar] [CrossRef]
  81. Hematang, F.; Murdjoko, A.; Hendri, H.; Tokede, M. Application of Unmanned Aerial Vehicle (UAV) Remote Sensing Technology for Estimation of Tree Height in Heterogeneous Forest. Biosaintifika J. Biol. Biol. Educ. 2022, 14, 35637. [Google Scholar] [CrossRef]
  82. Meyer, F.; Beucher, S. Morphological Segmentation. J. Vis. Commun. Image Represent. 1990, 1, 21–46. [Google Scholar] [CrossRef]
  83. Gomes, M.F.; Maillard, P. Detection of Tree Crowns in Very High Spatial Resolution Images. Environ. Appl. Remote Sens. 2016, 41–71. [Google Scholar]
  84. Barba, S.; Barbarella, M.; Di Benedetto, A.; Fiani, M.; Gujski, L.; Limongiello, M. Accuracy Assessment of 3D Photogrammetric Models from an Unmanned Aerial Vehicle. Drones 2019, 3, 79. [Google Scholar] [CrossRef]
  85. Black, K.; Tobin, B.; Saiz, G.; Byme, K.; Osborne, B. Improved Estimates of Biomass Expansion Factors for Sitka Spruce. Ir. For. 2004, 61, 50–65. [Google Scholar]
  86. Siipilehto, J. Methods and Applications for Improving Parameter Prediction Models for Stand Structures in Finland. Ph.D. Thesis, University of Helsinki, Helsinki, Finland, 2011; 56p. Available online: https://helda.helsinki.fi/items/cd1ebbf0-808d-45cb-bfad-f984450cb96f (accessed on 3 November 2023).
  87. Cukor, J.; Vacek, Z.; Linda, R.; Sharma, R.; Vacek, S. Afforested Farmland vs. Forestland: Effects of Bark Stripping by Cervus Elaphus and Climate on Production Potential and Structure of Picea Abies Forests. PLoS ONE 2019, 14, e0221082. [Google Scholar] [CrossRef] [PubMed]
  88. Ciaburro, G. Regression Analysis with R: Design and Develop Statistical Nodes to Identify Unique Relationships within Data at Scale; Packt Publishing Ltd.: Birmingham, UK, 2018; ISBN 1-78-862270-7. [Google Scholar]
  89. Ranganathan, A. The Levenberg-Marquardt Algorithm. Tutoral LM Algorithm 2004, 11, 101–110. [Google Scholar]
  90. Richards, F.J. A Flexible Growth Function for Empirical Use. J. Exp. Bot. 1959, 10, 290–301. [Google Scholar] [CrossRef]
  91. Winsor, C.P. The Gompertz Curve as a Growth Curve. Proc. Natl. Acad. Sci. USA 1932, 18, 1–8. [Google Scholar] [CrossRef]
  92. Pearl, R.; Reed, L.J. On the Rate of Growth of the Population of the United States since 1790 and Its Mathematical Representation. Proc. Natl. Acad. Sci. USA 1920, 6, 275–288. [Google Scholar] [CrossRef] [PubMed]
  93. St, L.; Wold, S. Analysis of Variance (ANOVA). Chemom. Intell. Lab. Syst. 1989, 6, 259–272. [Google Scholar]
  94. Montgomery, D.C.; Peck, E.A.; Vining, G.G. Introduction to Linear Regression Analysis; John Wiley & Sons: Hoboken, NJ, USA, 2021; ISBN 1-11-957875-2. [Google Scholar]
  95. Judd, C.M.; McClelland, G.H.; Ryan, C.S. Data Analysis: A Model Comparison Approach to Regression, ANOVA, and Beyond; Routledge: London, UK, 2017; ISBN 1-31-574413-9. [Google Scholar]
  96. Aiken, L.S.; West, S.G.; Pitts, S.C.; Baraldi, A.N.; Wurpts, I.C. Multiple Linear Regression. In Handbook of Psychology, Second Edition; American Cancer Society: Hoboken, NJ, USA, 2012; ISBN 978-1-11813-388-0. [Google Scholar]
  97. Cook, R.D. Detection of Influential Observation in Linear Regression. Technometrics 1977, 19, 15–18. [Google Scholar] [CrossRef]
  98. Koh, P.W.; Liang, P. Understanding Black-Box Predictions via Influence Functions. Proc. Int. Conf. Mach. Learn. 2017, 70, 1885–1894. [Google Scholar]
  99. Field, A.; Miles, J.; Field, Z. Discovering Statistics Using R; Sage Publications: New York, NY, USA, 2012; ISBN 1-44-620046-9. [Google Scholar]
  100. Cook, R.D. Influential Observations in Linear Regression. J. Am. Stat. Assoc. 1979, 74, 169–174. [Google Scholar] [CrossRef]
  101. Rosnell, T.; Honkavaara, E. Point Cloud Generation from Aerial Image Data Acquired by a Quadrocopter Type Micro Unmanned Aerial Vehicle and a Digital Still Camera. Sensors 2012, 12, 453–480. [Google Scholar] [CrossRef]
  102. Fritz, A.; Kattenborn, T.; Koch, B. UAV-Based Photogrammetric Point Clouds-Tree Stem Mapping in Open Stands in Comparison to Terrestrial Laser Scanner Point Clouds; International Society of Photogrammetry and Remote Sensing: Bethesda, MA, USA, 2013; Volume XL-1/W2. [Google Scholar]
  103. Tu, Y.H.; Johansen, K.; Aragon, B.; Stutsel, B.M.; Ángel, Y.; Camargo, O.A.L.; Al-Mashharawi, S.K.M.; Jiang, J.; Ziliani, M.G.; McCabe, M.F. Combining Nadir, Oblique, and Façade Imagery Enhances Reconstruction of Rock Formations Using Unmanned Aerial Vehicles. IEEE Trans. Geosci. Remote Sens. 2021, 59, 9987–9999. [Google Scholar] [CrossRef]
  104. Huang, H.; He, S.; Chen, C. Leaf Abundance Affects Tree Height Estimation Derived from UAV Images. Forests 2019, 10, 931. [Google Scholar] [CrossRef]
  105. Ghalavand, E.; Ghahramani, L.; Ghazanfari, H.; Shakeri, Z.; Naderi, A. Compare of Biometrical Indices of Lebanon Oak (Quercus libani Oliv.) in Pollarded and Less-Disturbed Stands. In Proceedings of the 4th International Conference on Environmental Challenges and Dendrochornology, Gorgan, Iran, 14 May 2014. [Google Scholar]
  106. Mandal, R.; Khadka, G.; Shrestha, M.; Sah, S.; Lamichhane, A. Modeling the Diameter at Breast Height (DBH) with Height and Volume of Shorea Robusta Using Destructive Method: A Study from Banke District, Nepal. Discov. Innov. 2020, 56, 239–253. [Google Scholar]
  107. Dey, T.; Ahmed, S.; Islam, M. Relationships of Tree Height-Diameter at Breast Height (DBH) and Crown Diameter-DBH of Acacia Auriculiformis Plantation. Asian J. For. 2021, 5, 71–75. [Google Scholar] [CrossRef]
  108. Niemczyk, M.; Bruchwald, A. Equations for Diameter at the Breast Height Form Factor of Poplar and Its Hybrids. Sylwan 2017, 161, 413–421. [Google Scholar]
  109. Niemczyk, M.; Wojda, T.; Kaliszewski, A. Biomass Productivity of Selected Poplar (Populus spp.) Cultivars in Short Rotations in Northern Poland. N. Z. J. For. Sci. 2016, 46, 22. [Google Scholar] [CrossRef]
  110. Song, C.; Yang, B.; Zhang, L.; Wu, D. A Handheld Device for Measuring the Diameter at Breast Height of Individual Trees Using Laser Ranging and Deep-Learning Based Image Recognition. Plant Methods 2021, 17, 67. [Google Scholar] [CrossRef]
  111. Ucar, Z.; Değermenci, A.; Zengin, H.; Bettinger, P. Evaluating the Accuracy of Remote Dendrometers in Tree Diameter Measurements at Breast Height. Croat. J. For. Eng. 2022, 43, 185–197. [Google Scholar] [CrossRef]
  112. Shakeri, Z. Ecological and Silvicultural Effects of Pollarding on Oak Forests of Baneh. 2006. Available online: https://noordoc.ir/thesis/83566 (accessed on 3 November 2023).
  113. Johnson, P.S.; Shifley, S.R.; Rogers, R.; Dey, D.C.; Kabrick, J.M. The Ecology and Silviculture of Oaks; Cabi: Wallingford, UK, 2019; ISBN 1-78-064708-5. [Google Scholar]
  114. Näslund, M.; Skogsförsöksanstaltens Gallringsförsök i Tallskog. Meddelande Från Statens Skogsförsöksanstalt 29. In Swedish with English Summary 1936; 169p. Available online: https://pub.epsilon.slu.se/10159/1/medd_statens_skogsforskningsanst_029_01.pdf (accessed on 3 November 2023).
  115. Koch, G.W.; Sillett, S.C.; Jennings, G.M.; Davis, S.D. The Limits to Tree Height. Nature 2004, 428, 851–854. [Google Scholar] [CrossRef] [PubMed]
  116. Colton, J.A.; Bower, K.M. Some Misconceptions about R2. Int. Soc. Six Sigma Prof. EXTRAOrdinary Sense 2002, 3, 20–22. [Google Scholar]
  117. Shafeian, E.; Fassnacht, F.E.; Latifi, H. Mapping Fractional Woody Cover in an Extensive Semi-Arid Woodland Area at Different Spatial Grains with Sentinel-2 and Very High-Resolution Data. Int. J. Appl. Earth Obs. Geoinf. 2021, 105, 102621. [Google Scholar] [CrossRef]
Figure 1. Schematic representation of a pollarded tree at different pollarding stages. This figure schematically shows how the shape and height of the tree changes following each year from an un-pollarded tree (year 0) to the state after 10 years of pollarding.
Remotesensing 15 05261 g001
Figure 2. Location and orthophotos of the study sites. Due to the proximity of each site to a village, they were geographically subdivided into two distinct regions (Region 1 and Region 2). The study areas consist of three sites with pollarded trees of Korpa age (S1, S3, and S6), one site of Kor age (S2), and two sites of 2 Khert age (S4 and S5).
Remotesensing 15 05261 g002
Figure 3. Structural differences of the coppice trees based on field observations and according to personal communication with a local ecologist. Please note that all of the inventoried trees were associated with one or a combination of these 5 states. The solid line drawn over the roots shows the forest floor, while the dashed grey line represents the breast height.
Remotesensing 15 05261 g003
Figure 4. Outlier data in the regression models. The left panel shows the standard residual for data that are >3 and <−3, considered outlier data. On the right panel, outlier data are shown in two categories: large residuals and unusual X.
Remotesensing 15 05261 g004
Figure 5. The relationship between the residual values and the fitted values, where Pearson’s correlation coefficient = 0 indicates no linear relationship.
Remotesensing 15 05261 g005
Figure 6. Relationship between height and DBH.
Remotesensing 15 05261 g006
Table 2. Summary of field-collected information.
SiteArea (m2)AgeAverage Slope (%)Frequency of Tree Species
Q. brantiiQ. libaniQ. infectoria
Site 16360Korpa371452165
Site 22850Kor30012281
Site 33050Korpa1024017
Site 453602 Khert10513025
Site 549202 Khert12313629
Site 61400Korpa2519226
Table 3. Quantitative description of maximum DBHs measured at each site. N: number of trees, SD: standard deviation, Q1/Q3: 1st and 3rd quartiles.
VariableSiteNMeanSDMinimumQ1MedianQ3Maximum
DBHSite 123120.04.51117202333
Site 220317.23.51015171928
Site 35918.94.61016182134
Site 416018.74.41115182134
Site 59613.65.159131727
Site 64715.85.1513151929
Table 4. UAV imaging technical specifications.
GroupParameterValue
FlightAltitude (m)80
Overlap (%)80
Side overlap (%)80
SpeedMedium
AspectNadir, oblique (60°)
Georeferencing3D control points5 accurate 3D points were measured using PPK GNSS for each site
ImagesResolution (px)5472 × 3648
ProductsModelsDSM, DTM, CHM, orthomosaic
Resolution (cm)5
Table 5. Quantitative description of tree heights extracted from the CHM. H: height.
VariableSiteNMeanStDevMinimumQ1MedianQ3Maximum
HSite 12316.71.23.45.76.57.69.6
Site 22034.80.92.44.14.95.37.5
Site 3593.70.52.93.43.53.75.7
Site 41605.51.22.24.55.66.39.7
Site 5964.51.21.73.84.05.56.9
Site 6473.50.72.13.13.43.65.7
Table 6. List of well-known H~DBH nonlinear allometries used in this study.
ModelEquationSource
1 1.3 + a 1 e b × DBH c [90]
2 1.3 + a   e b × exp c × DBH [91]
3 a 1 + b ×   e c × DBH [92]
Table 7. The results of variable screening in the backward stepwise selection for inlier data. Height (H), number of trunks (nTr), trunk (Tr), species (Sp), and pollarding age (Age) were the candidate terms. nTr denotes the number of tree trunks, while the categorical variable Tr distinguishes between the single-stem and multi-stem trees.
Parameterp-Value
Step 1Step 2Step 3Step 4Step 5Step 6Step 7Step 8Step 9
Constant
H0.0000.0000.0000.0000.0000.0000.0000.0000.000
nTr0.3050.3960.1660.2660.204----------------
Sp0.0280.0130.0000.0000.0000.0000.0000.0000.000
Age0.0000.0000.0000.0000.0000.0000.0000.0000.000
Tr0.2850.3460.0670.1020.0780.1550.1770.887----
H × nTr0.1700.2000.1700.393--------------------
H × Sp0.0000.0000.0000.0000.0000.0000.0000.0000.000
H × Age0.0000.0000.0000.0000.0000.0000.0000.0000.000
H × Tr0.0490.0560.0390.0790.0450.0400.174--------
nTr × Sp0.3480.4080.309------------------------
nTr × Age0.829--------------------------------
Sp × Tr0.4700.433----------------------------
Age × Tr0.7690.0120.0110.0230.0280.041------------
S3.13833.13503.13443.13513.13463.13583.14463.14633.1443
R2 (%)58.958.958.858.658.658.558.258.158.1
R2adj (%)57.857.857.957.857.957.857.657.557.6
AICc410441004098409640954094409740974095
BIC421141984186417541694164415741524146
Table 8. Comparing the performance of nonlinear allometries with linear models for inlier data.
ModelPollarding StageEstimated ParameterEvaluation Criteria
abcDFSSERMSER2adj
1 Korpa9.2670.0501.512334759.1721.5080.300
Kor6.2340.0992.70119839.2240.4450.729
2 Khert9.6590.0431.356253104.4860.6430.747
2 Korpa7.9722.8720.084334759.0041.5070.300
Kor5.9584.0120.12119839.2940.4450.728
2 Khert7.7242.8420.084253101.3950.6330.754
3 Korpa8.8204.3350.110334758.7471.5070.301
Kor7.0825.4930.14619839.3560.4460.728
2 Khert8.4974.2550.113253100.7500.6310.756
a   +
b × DBH
Korpa1.7640.205 335763.5901.5100.300
Kor1.3280.203 19941.6460.4570.715
2 Khert1.6370.207 254107.7100.6510.741
Table 9. The results of the analysis of the coefficients of the linear model.
TermSymbolCoefSE Coef.95% CIT-Valuep-ValueVIF
Constant α 0 10.8520.581(9.712, 11.992)18.690.000
Age2 Khert α 1 −12.361.01(−14.35, −10.37)−12.210.00017.28
Kor α 2 −9.831.40(−12.57, −7.08)−7.020.00028.71
H α 3 1.46770.0972(1.2769, 1.6585)15.100.0001.62
H × Age2 Khert α 4 2.1110.185(1.748, 2.474)11.410.00016.46
Kor α 5 1.8960.278(1.350, 2.442)6.820.00027.36
Table 10. The x1 and x2 coding and the final equation of linear regression for various pollarding ages.
Age x 1 x 2 Equation (DBHMax=)
Korpa00−10.85 + 1.48 H
Kor011.02 + 3.37 H
2 Khert10−1.51+ 3.58 H
Table 11. Summary of linear regression model evaluation.
SR2R2adjPRESSR2predAICcBIC10-Fold S10-Fold R2
3.2109556.06%55.78%8267.2655.40%4124.244156.863.2283855.25%
Table 12. Results of the ANOVA.
SourceDFSeq SSContributionAdj SSAdj MSF-Valuep-Value
Regression510,393.0056.06%10,393.02078.60201.610.000
H18594.6046.36%2351.32351.28228.050.000
Age2217.801.18%1721.6860.8083.490.000
H × Age21580.508.53%1580.5790.2676.650.000
Error7908145.0043.94%8145.010.31
Lack of fit7858110.0043.75%8110.010.331.480.359
Pure error535.000.19%35.07.00
Total79518,538.00100.00%
Disclaimer/Publisher’s Note: The statements, opinions and data contained in all publications are solely those of the individual author(s) and contributor(s) and not of MDPI and/or the editor(s). MDPI and/or the editor(s) disclaim responsibility for any injury to people or property resulting from any ideas, methods, instructions or products referred to in the content.

