Article

Simulating the Land Use and Carbon Storage for Nature-Based Solutions (NbS) under Multi-Scenarios in the Three Gorges Reservoir Area: Integration of Remote Sensing Data and the RF–Markov–CA–InVEST Model

1
School of Civil Engineering, Architecture and Environment, Hubei University of Technology, Wuhan 430068, China
2
Key Laboratory of Health Intelligent Perception and Ecological Restoration of River and Lake, Ministry of Education, Hubei University of Technology, Wuhan 430068, China
3
Service Office for Retired, China University of Geosciences, Wuhan 430074, China
4
Hubei Academy of Agricultural Sciences, Wuhan 430064, China
*
Author to whom correspondence should be addressed.
Remote Sens. 2023, 15(21), 5100; https://doi.org/10.3390/rs15215100
Submission received: 31 August 2023 / Revised: 20 October 2023 / Accepted: 23 October 2023 / Published: 25 October 2023

Abstract

:
Rapid industrialisation and urbanisation have moved contemporary civilization ahead but also deepened clashes with nature. Human society’s long-term evolution faces a number of serious problems, including the climate issue and frequent natural disasters. This research analyses the spatiotemporal evolution features of land use remote sensing data from 2005, 2010, 2015, and 2020. Under the Nature-based Solutions (NbS) idea, four scenarios are established: Business as Usual (BAU), Woodland Conservation (WLC), Arable Land Conservation (ALC), and Urban Transformation and Development (UTD). The RF–Markov–CA model is used to simulate the spatiotemporal patterns of land use for the years 2025 and 2030. Furthermore, the InVEST model is utilised to assess and forecast the spatiotemporal evolution features of carbon storage. The findings show that (1) the primary land use categories in the Three Gorges Reservoir Area (TGRA) from 2005 to 2020 are arable land and woodland. Arable land has a declining tendency, whereas woodland has an increasing–decreasing trend. (2) The WLC scenario exhibits the greatest growth in woodland and the lowest drop in grassland from 2020 to 2030, indicating a more stable ecosystem. (3) The TGRA demonstrates substantial geographic variation in carbon storage from 2005 to 2030, with a broad distribution pattern of “higher in the north, lower in the south, higher in the east, lower in the west, with the reservoir head > reservoir centre > reservoir tail”. (4) In comparison to the other three scenarios, the WLC scenario sees a slower development of construction and arable land from 2020 to 2030, whereas the ecological land area rises the highest and carbon storage increases. As a result, the WLC scenario is the TGRA’s recommended development choice. The study’s findings have substantial implications for the TGRA’s ecological preservation and management, as well as for the optimisation of ecosystem carbon cycling and the promotion of regional sustainable development.

1. Introduction

The evolution of human society’s economy in the twenty-first century has been dual in character, with simultaneous instances of tremendous progress and large upheavals. Humanity’s excessive exploitation of the Earth’s resources and complex interference with the global environment have become increasingly severe, guided by the core principle of economic building. This has resulted in a slew of undeniably bad consequences. These implications include more regular occurrences of extreme weather events, the biodiversity problem, and possible dangers to human health. The Intergovernmental Panel on Climate Change (IPCC) report of “Global Warming of 1.5 °C” [1], indicates categorically that human activities have resulted in a 1.0 °C increase in the global temperature over the pre-industrial period. According to predictions, this warming will accelerate to 1.5 °C between 2030 and 2052, putting both human civilisation and the natural world in jeopardy.
As the conflict between human progress and ecological safety has grown more intense, researcher Benyus [2] developed the notion of Nature-based Solutions (NbS) for the first time in 1997, building on biomimicry principles. Following that, the concept and substance of NbS were methodically elaborated in a paper issued by the World Bank in 2008 [3,4], elucidating that this novel approach can mitigate and adapt to the impacts of climate change, while conserving biodiversity and enhancing sustainable livelihoods. Taking into account practical social factors, the IUCN produced global guidelines for NbS in 2020, detailing its essential principles and accompanying indicators, therefore supporting worldwide research and practise [5]. In comparison to traditional engineering techniques, NbS focuses a greater emphasis on system integrity and complexity, resulting in more sustainable solutions and better adaptability in the face of uncertainty. NbS has increasingly found applications in fields like climate change [6], land use management [7,8], urban planning [9], and ecological restoration [10] in recent years. For example, in studies focusing on climate change and the connection between land use and carbon cycling, the implementation of NbS involving protective, restorative, and sustainable land management practices aids in lowering terrestrial greenhouse gas emissions and improving land carbon storage. This strategy significantly contributes to combating climate change and enhancing ecosystem resilience.
Research has demonstrated that regional land use change is the primary driver of variations in ecosystem carbon storage. Land use change directly alters ecosystem types, subsequently affecting the net primary productivity (NPP) of ecosystems and the corresponding input of soil organic carbon [11,12]. The analysis and monitoring simulation of land use change and spatiotemporal variations in carbon storage are of great significance for the management of ecosystem carbon sinks.
The existing land use prediction models mainly include quantity prediction models as well as spatial distribution prediction models. Quantity prediction models employ mathematical models to forecast future changes in various land use types, such as the grey prediction model [13], multiple regression analysis model [14,15], Markov model [16,17], and Artificial Neural Networks (ANN) [18,19,20], among others. Geographical prediction models can simulate the geographical distribution of various land use categories based on input transformation rules. Cellular Automata (CA) models are commonly used in research to simulate complicated spatial patterns [21,22], the CLUE-S model for modelling short-term land use spatial allocation in small-scale areas [23,24,25], and the GEOMOD model for simulating changes in two major land classes [26,27]. Scholars are efficiently using remote sensing data in research and practise to model and anticipate spatiotemporal changes in land use in order to improve simulation accuracy. They are constantly refining and improving related models. The CA–Markov model [28,29,30] is now recognised as an excellent spatiotemporal simulation tool for land use change among these models.
With the development of technologies such as RS, GIS, and GPS, an increasing number of scholars are utilising modelling for carbon storage estimation and simulation. These models primarily include the Carnegie–Ames–Stanford approach (CASA) [31,32], the CEVSA model [33,34], the InVEST model [35,36], the Vector Autoregression model (VAR) [37], and High Accuracy Surface Modelling (HASM) [38]. Among them, the InVEST model is known for its high simulation accuracy, operational feasibility, and visualised assessment results, making it widely used in the evaluation of ecosystem carbon storage.
In summary, current research has mostly centred on how past land use changes affect carbon storage, with relatively limited attention given to the spatiotemporal variations in future ecosystem carbon storage [39,40]. Considering the time required for policies to take effect, relying solely on historical data for assessing regional land use changes might not fully meet the practical demands of ecological conservation and management. Therefore, in order to better address these needs, it is crucial to adopt a forward-looking perspective to simulate the ecological changes. This would provide a more comprehensive understanding of the dynamic relationship between land use changes in ecosystem carbon storage. Meanwhile, most of the previous models fail to account for the multifactor impacts on land use change and has limitations in examining land use transition rules [41]. To solve this shortcoming, a method that integrates different modelling approaches and uses relevant driving factors to extract efficient transition rules is proposed. The Logistic–CA–Markov model [42,43], the ANN–CA–Markov model [44,45], and the MCE–CA–Markov model [46,47] are examples of such a technique. Therefore, compared to previous modelling approaches, the RF–Markov–CA–InVEST model used in this study integrates the innovative random forest (RF) algorithm [48,49] into the CA–Markov model, overcoming the limitations of traditional regression models in correcting driving factors. This integration facilitates the calculation of land transition probabilities throughout the simulation process. Furthermore, this integration eliminates the possibility of increased computational complexity associated with overfitting.
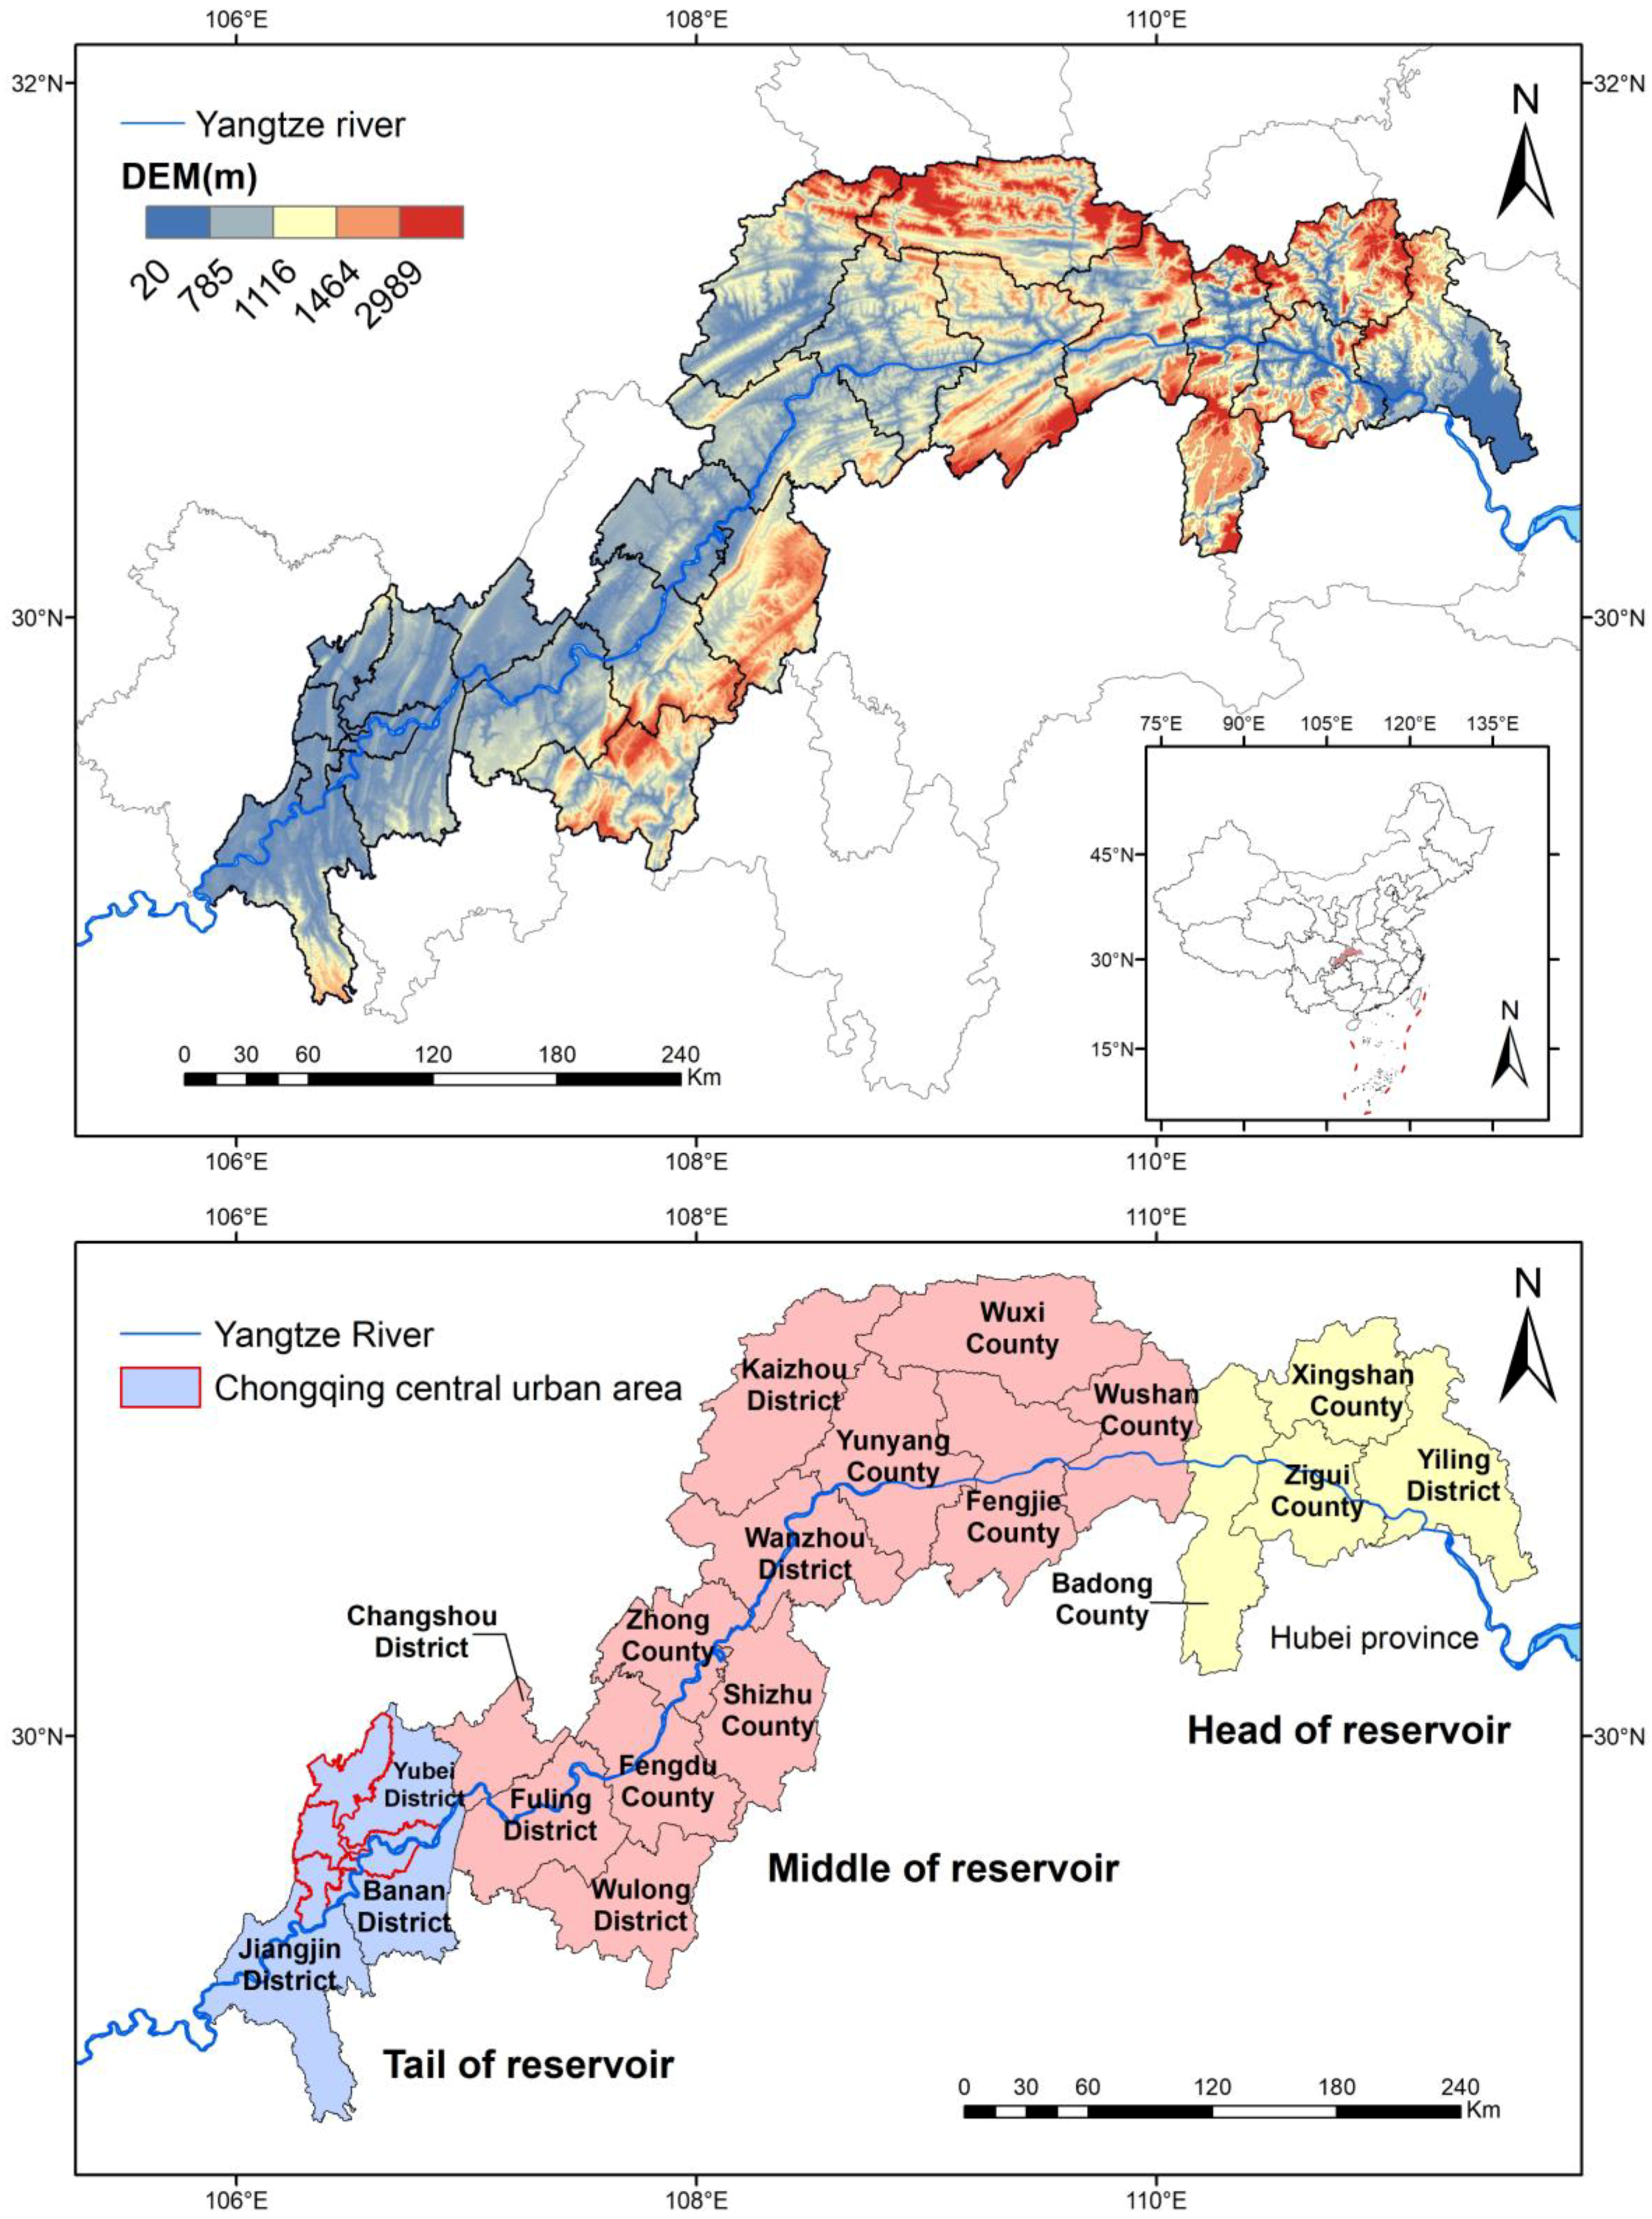
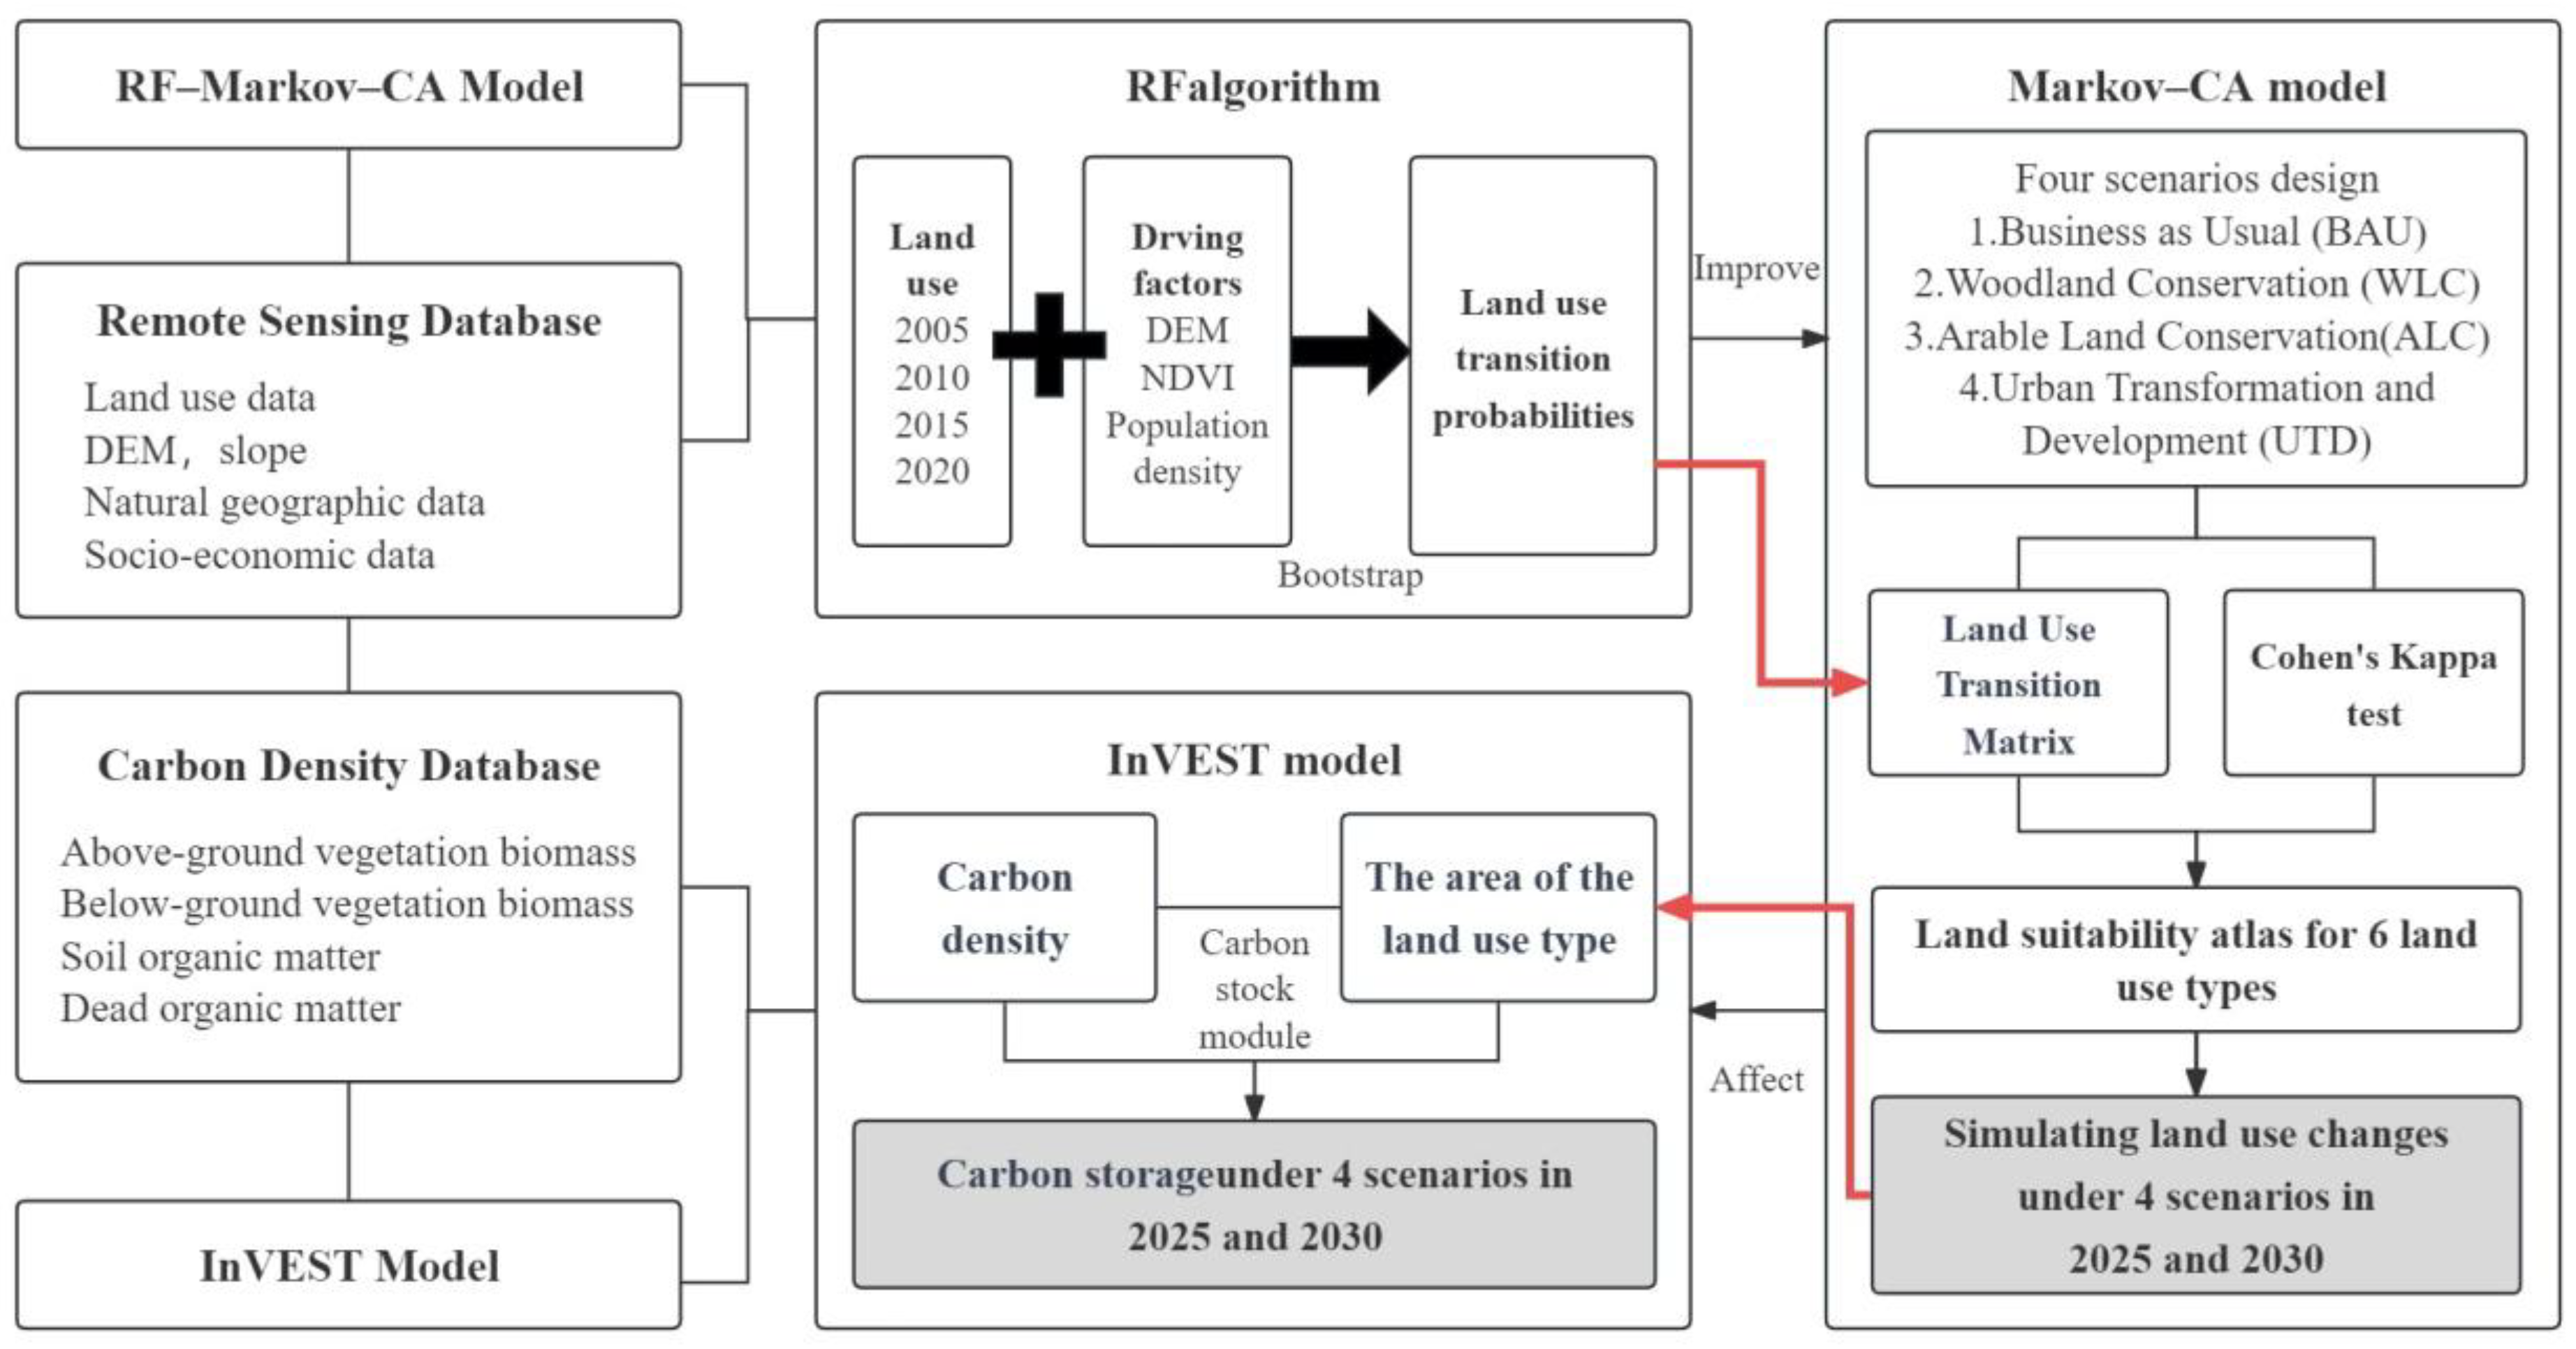
TGRA, as a key ecological functional area in China, is located in the Yangtze River Basin, the largest freshwater basin in the country, and is a key area for implementing the dual carbon target. Considering the complexity of climate change in the reservoir area and the integrity of the ecosystem, this study is based on the remote sensing data and NbS concept to develop an RF–Markov–CA–InVEST integrated model. The RF algorithm is used to pick nine driving elements from both natural and social viewpoints, obtaining land use transition probabilities that are utilised to build land suitability maps. The Markov–CA model is used to predict spatial land use patterns in the TGRA for the years 2025 and 2030 under four scenarios: Business as Usual (BAU), Woodland Conservation (WLC), Arable Land Conservation (ALC), and Urban Transformation and Development (UTD), based on land use data from 2005, 2010, 2015, and 2020. Concurrently, the InVEST model is being used to analyse and anticipate the influence of land use changes on carbon storage from 2005 to 2030 under various scenarios. Through the prospective simulation and predictive research on the ecological changes of TGRA, this study provides robust scientific evidence and decision-making support for the formulation of more targeted and sustainable ecological conservation policies. Meanwhile, the findings of this study will be used to guide the implementation and progress of sustainable land use planning and dual-carbon targets in the Yangtze River Basin.

2. Study Area and Data

2.1. Overview of the Study Area

With an area of 64,000 km2, the TGRA (28°52′–31°75′N, 105°82′–111°66′E) is located in the upper and middle reaches of the Yangtze River and serves as an important ecological functioning zone within the Yangtze Economic Belt [50]. The TGRA is divided into sections: the head of the TGRA covers four counties and districts in Hubei Province, namely Yiling District, Zigui County, Xingshan County, and Badong County. The middle reservoir region includes twelve counties and districts in Chongqing Municipality, including Wushan County, Fengjie County, Yunyang County, and Wanzhou District. The tail of the TGRA includes eleven counties and districts in Chongqing’s main metropolitan zone (Figure 1).
After the Three Gorges Dam was completed in 2006, the new resettlement communities in the TGRA began to take development. Since 2011, the TGRA has been classified as a critical ecological functioning zone within the Yangtze River Basin, merging socioeconomic development with environmental conservation and restoration, establishing it as a key developmental goal for the region. The United Nations’ Sustainable Development Goals (SDGs), set in 2015, as well as China’s dual carbon target announced in 2020, have offered clear advice for optimising land use patterns and improving the carbon cycle of ecosystems inside the TGRA.

2.2. Data Sources

2.2.1. Remote Sensing Datasets

Land use change is primarily influenced by natural geographical and socioeconomic causes. Generally, diverse catalysts drive changes in land use at varying scales. Selecting appropriate driving factors and establishing a remote sensing dataset are of significant importance for simulating and predicting future land use changes and their impacts on carbon storage.
The remote sensing dataset in this study is presented in Table 1. Within this, the land use data utilised consist of remote sensing products including land use and Normalized Difference Vegetation Index (NDVI). These data are derived from the TGRA for the years 2005, 2010, 2015, and 2020, with a spatial resolution of 30 m. These figures were obtained from the Resource and Environment Science and Data Centre (RESDC), Chinese Academy of Sciences (http://www.resdc.cn, accessed on 10 July 2023). The land use data were classified into six classes following China’s land use status classification standard (GB/T 21010-2017 [51]). This classification took into account the spatial patterns of mountains, waters, forests, farmlands, lakes, and grasslands, guided by practical remote sensing monitoring operations. The identified categories are as follows: arable land, woodland, grassland, water, construction land, and unused land (Table 2).

2.2.2. Carbon Density Data

The carbon density data in this article primarily originate from the land ecosystem carbon density dataset for the 2010s in China, established by Xu et al. [54]. We selected actual measured carbon density data from sampling points covering various land types within the latitude and longitude range of TGRA. Simultaneously, we conducted data adjustments based on existing relevant research, removing outliers and calculating the mean carbon density for the same land types. In the process of literature selection, priority is given to locally relevant measured data in the TGRA, followed by research findings from neighbouring regions, such as the Chengdu-Chongqing city cluster, the middle and lower reaches of the Yangtze River city cluster. The TGRA’s adjusted carbon density database for several land types is supplied (Table 3).

3. Methodology

The construction process of the RF–Markov–CA–InVEST model in this study is illustrated in Figure 2.

3.1. The Design of the Multi-Scenarios

With carbon neutrality as the long-term goal, the role of NbS in addressing climate change is increasingly prominent, given the growing severity of the climate crisis. To better estimate land use change patterns and carbon storage in the TGRA, the SDGs, dual-carbon programmes, and policy guidelines such as the “Outline of the Yangtze River Economic Belt Development Plan”, were referenced. Based on the concept of NbS and the specific conditions of the TGRA, four different scenarios were formulated for this study. In the scenario design, we focus on the restoration capacity of ecosystems to address the potential impact of land use changes on regional carbon storage.
(1)
BAU Scenario. Only the land use change parameters in the TGRA from 2005 to 2020 are utilised in this scenario to anticipate the spatial distribution of land use in 2025 and 2030. There are no policies that have an influence on land use changes.
(2)
WLC Scenario. NbS emphasises that ecological spaces should primarily aim to enhance ecosystem functionality and promote its stability. Through restoration measures, NbS is committed to restoring the integrity and resilience of natural ecosystems, thus facilitating sustainable development. In this scenario, ecological conservation limits are determined based on ecological functions, ensuring that these functions are systemic and integrative. Simultaneously, the land structure of various land use types and the carrying capacity of various resources are fully considered. The conversion of arable land and unused land to woodland and grassland is increasing, whereas the conversion of woodland and grassland to other land use categories is decreasing.
(3)
ALC Scenario. The Natural Resources Defense Council (NRDC) proposed that ensuring food security is the bottom line for carrying out emissions reduction and carbon sequestration. In this scenario, NbS serves as a cost-effective key solution for agricultural emissions reduction and carbon sequestration. These solutions not only mitigate climate change but also enhance agricultural resilience to climate change, thereby ensuring food security and sustainable environmental development. The redlines for arable land conservation are specified in this scenario. The conversion of woodland, grassland, and unused land to arable land rises. Simultaneously, arable land is classified as limited conversion zones, resulting in a decrease in the extent of arable land converted into these types of land.
(4)
UTD Scenario. The TGRA, as a key national ecological functional area, requires the control of Urban Growth Boundaries (UGB) in the development of the national territory, limiting large-scale industrial and urban development. NbS aims to promote sustainable land use management, encouraging cities to make rational use of existing land resources, and avoid excessive development and irrational encroachment on ecological land. In this scenario, the probability of woodland, arable land, grassland, and water bodies being converted into construction land is reduced.

3.2. Simulation of Land Use Change

3.2.1. Markov–CA Model

A Markov chain is a model of state transitions based on probabilistic analysis [64,65]. This model is frequently used to forecast patterns and trends in land use changes. Its distinguishing characteristic is that the land use state at the next instant only depends on the land use state at the previous instant, which provides advantages in simulating temporal dynamics [66]. The land uses distribution status for the TGRA for the years 2025 and 2030 is forecasted in this study by computing the land use transition probability matrix. The following are the key computational formulas:
S t + 1 = S t × P i j
P i j = [ P 11 P 1 n P n 1 P n n ] , ( 0 P i j 1 , i , j = 1 n P i j = 1 )
St and St+1 are the land use statuses at time t and t + 1, respectively; Pij is the probability of transitioning from land category i to land category j.
The CA is a complex dynamical system model with discrete states that characterises both time and space [67]. A conventional CA is made up of four components: cells, cell states, neighbourhoods, and state update rules. The cell is the fundamental unit, and the cell space depicts the spatial distribution of the cells. The CA works by enforcing rules that control local interactions between cells, resulting in global changes and maximising the benefits of spatial simulation [68,69].
The Markov–CA model combines the Markov model’s benefits in forecasting time series with CA’s capacity to simulate spatial changes in complicated systems [70]. Its purpose is to forecast the features and patterns of land use changes in the TGRA. The Markov–CA model was built in this research using the Geospatial Monitoring and Modelling System of the IDRISI Selva 17.0 software. The software’s Land Change Modeller module was used for the spatiotemporal simulation of land use changes in complicated settings.

3.2.2. RF–Markov–CA Model

The RF algorithm, developed by Ho and Breiman [71], is a non-linear ensemble learning approach used for applications such as classification and regression [72,73]. RF is a hybrid algorithm comprises a large number of decision trees. It is recognised as an excellent machine learning technique because it produces distinct training subsets by picking feature variables inside each sample. The Classification and Regression Tree (CART) method [74] is the most extensively used in decision trees, and it is recognised for its benefits, such as its high data accuracy and quick calculation speed. Its building technique entails determining the best solution using the Gini coefficient [75] with the following computational formula:
G I N I ( P ) = 1 i = 1 M P i 2
G I N I ( D ) = 1 i M ( | C i | | D | ) 2
G I N I ( D , A ) = | D 1 | | D | G I N I ( D 1 ) + | D 2 | | D | G I N I ( D 2 )
G I N I = G I N I ( D , A ) G I N I ( D )
Among them, M represents the number of sample categories, Pi represents the probability of each category, Ci represents the number of samples in each category, D represents the total number of samples, and GINI (D, A) represents the Gini coefficient after segmentation.
In this study, the RF–CA–Markov model established optimises the Markov–CA model by introducing the RF algorithm to determine transition rules in the CA model. Finally, the land use transition probabilities were calculated and used to create a land suitability map. Compared to the Logistic–Markov–CA model used in previous studies, the RF algorithm overcomes the limitations of the conventional logistic regression model in correcting driving factors. It is suitable for quantitative research involving multiple influencing factors. Furthermore, the RF algorithm presents fewer computational challenges and is less prone to overfitting. This approach is used to anticipate the spatial layout of land use changes and optimise land use structure.

3.3. Valuation of the Carbon Storage

Stanford University, the Nature Conservancy (TNC), and the World Wildlife Fund (WWF) [35] collaborated to create the Integrated Valuation of Ecosystem Services and Trade-offs (InVEST) model. Its goal is to help scientists and policymakers make more informed judgements on environmental sustainability. This approach combines GIS technology with ecological concepts and may be used to evaluate the numerous ecosystem services offered by natural capital, such as water supplies [76,77], habitat quality [78], and carbon storage [79,80], among other things.
The InVEST model’s carbon stock module is primarily used to examine the influence of land use changes on carbon storage [36,81]. The aboveground vegetation biomass carbon pool, belowground vegetation biomass carbon pool, soil organic carbon pool, and dead organic matter carbon pool are the four major carbon pools studied in this work. The organic matter content buried 20–100 cm below the soil surface is referred to as the soil organic carbon pool. The following is the formula for determining carbon stock:
C i = C i a b o v e + C i b e l o w + C i s o i l + C i d e a d
C t o t a l = i = 1 n A i × C i ,   ( i = 1 , 2 , , n )
In the equations, C i represents the total carbon density (Mg C/hm2). C i a b o v e represents the aboveground vegetation biomass carbon density of land type i. C i b e l o w is the belowground vegetation biomass carbon density of land type i. C i s o i l is the soil organic carbon density of land type i. C i d e a d is the dead organic carbon density of land type i. C t o t a l represents the total carbon stock, and A i represents the area of land type i.

4. Results

4.1. Model Accuracy Comparison and Validation

The Crosstab module in the IDRISI software was used in this study to analyse the consistency between the observed data and simulated findings using the Kappa coefficient. A Kappa value greater than 0.75 indicates a strong simulation accuracy.
To contrast and test the accuracy of the Logistic–Markov–CA and RF–Markov–CA models, 2010 and 2015 were chosen as the base data for land use, and the RF–Markov–CA model was employed to simulate the land use situation in 2020. Based on this, the Kappa coefficient was used to compare the simulated 2020 land use map to the actual 2020 land use map (Table 4). The validation results demonstrate that, except for the sparsely distributed unused land, the error values of each land cover calculated by the RF–Markov–CA model are all less than 5%, indicating a small model error. According to the Kappa coefficient, the RF–Markov–CA model is more accurate compared to the Markov–CA and Logistic–Markov–CA models, achieving a high level of simulation accuracy. As a result, the RF–Markov–CA model demonstrates better applicability in predicting and simulating the spatial patterns of land use in the TGRA. This lays the groundwork for the multi-scenario simulations in 2025 and 2030.

4.2. Spatiotemporal Evolution Characteristics of Land Use from 2005 to 2020

4.2.1. Analysis of Spatiotemporal Evolution Characteristics of Land Use

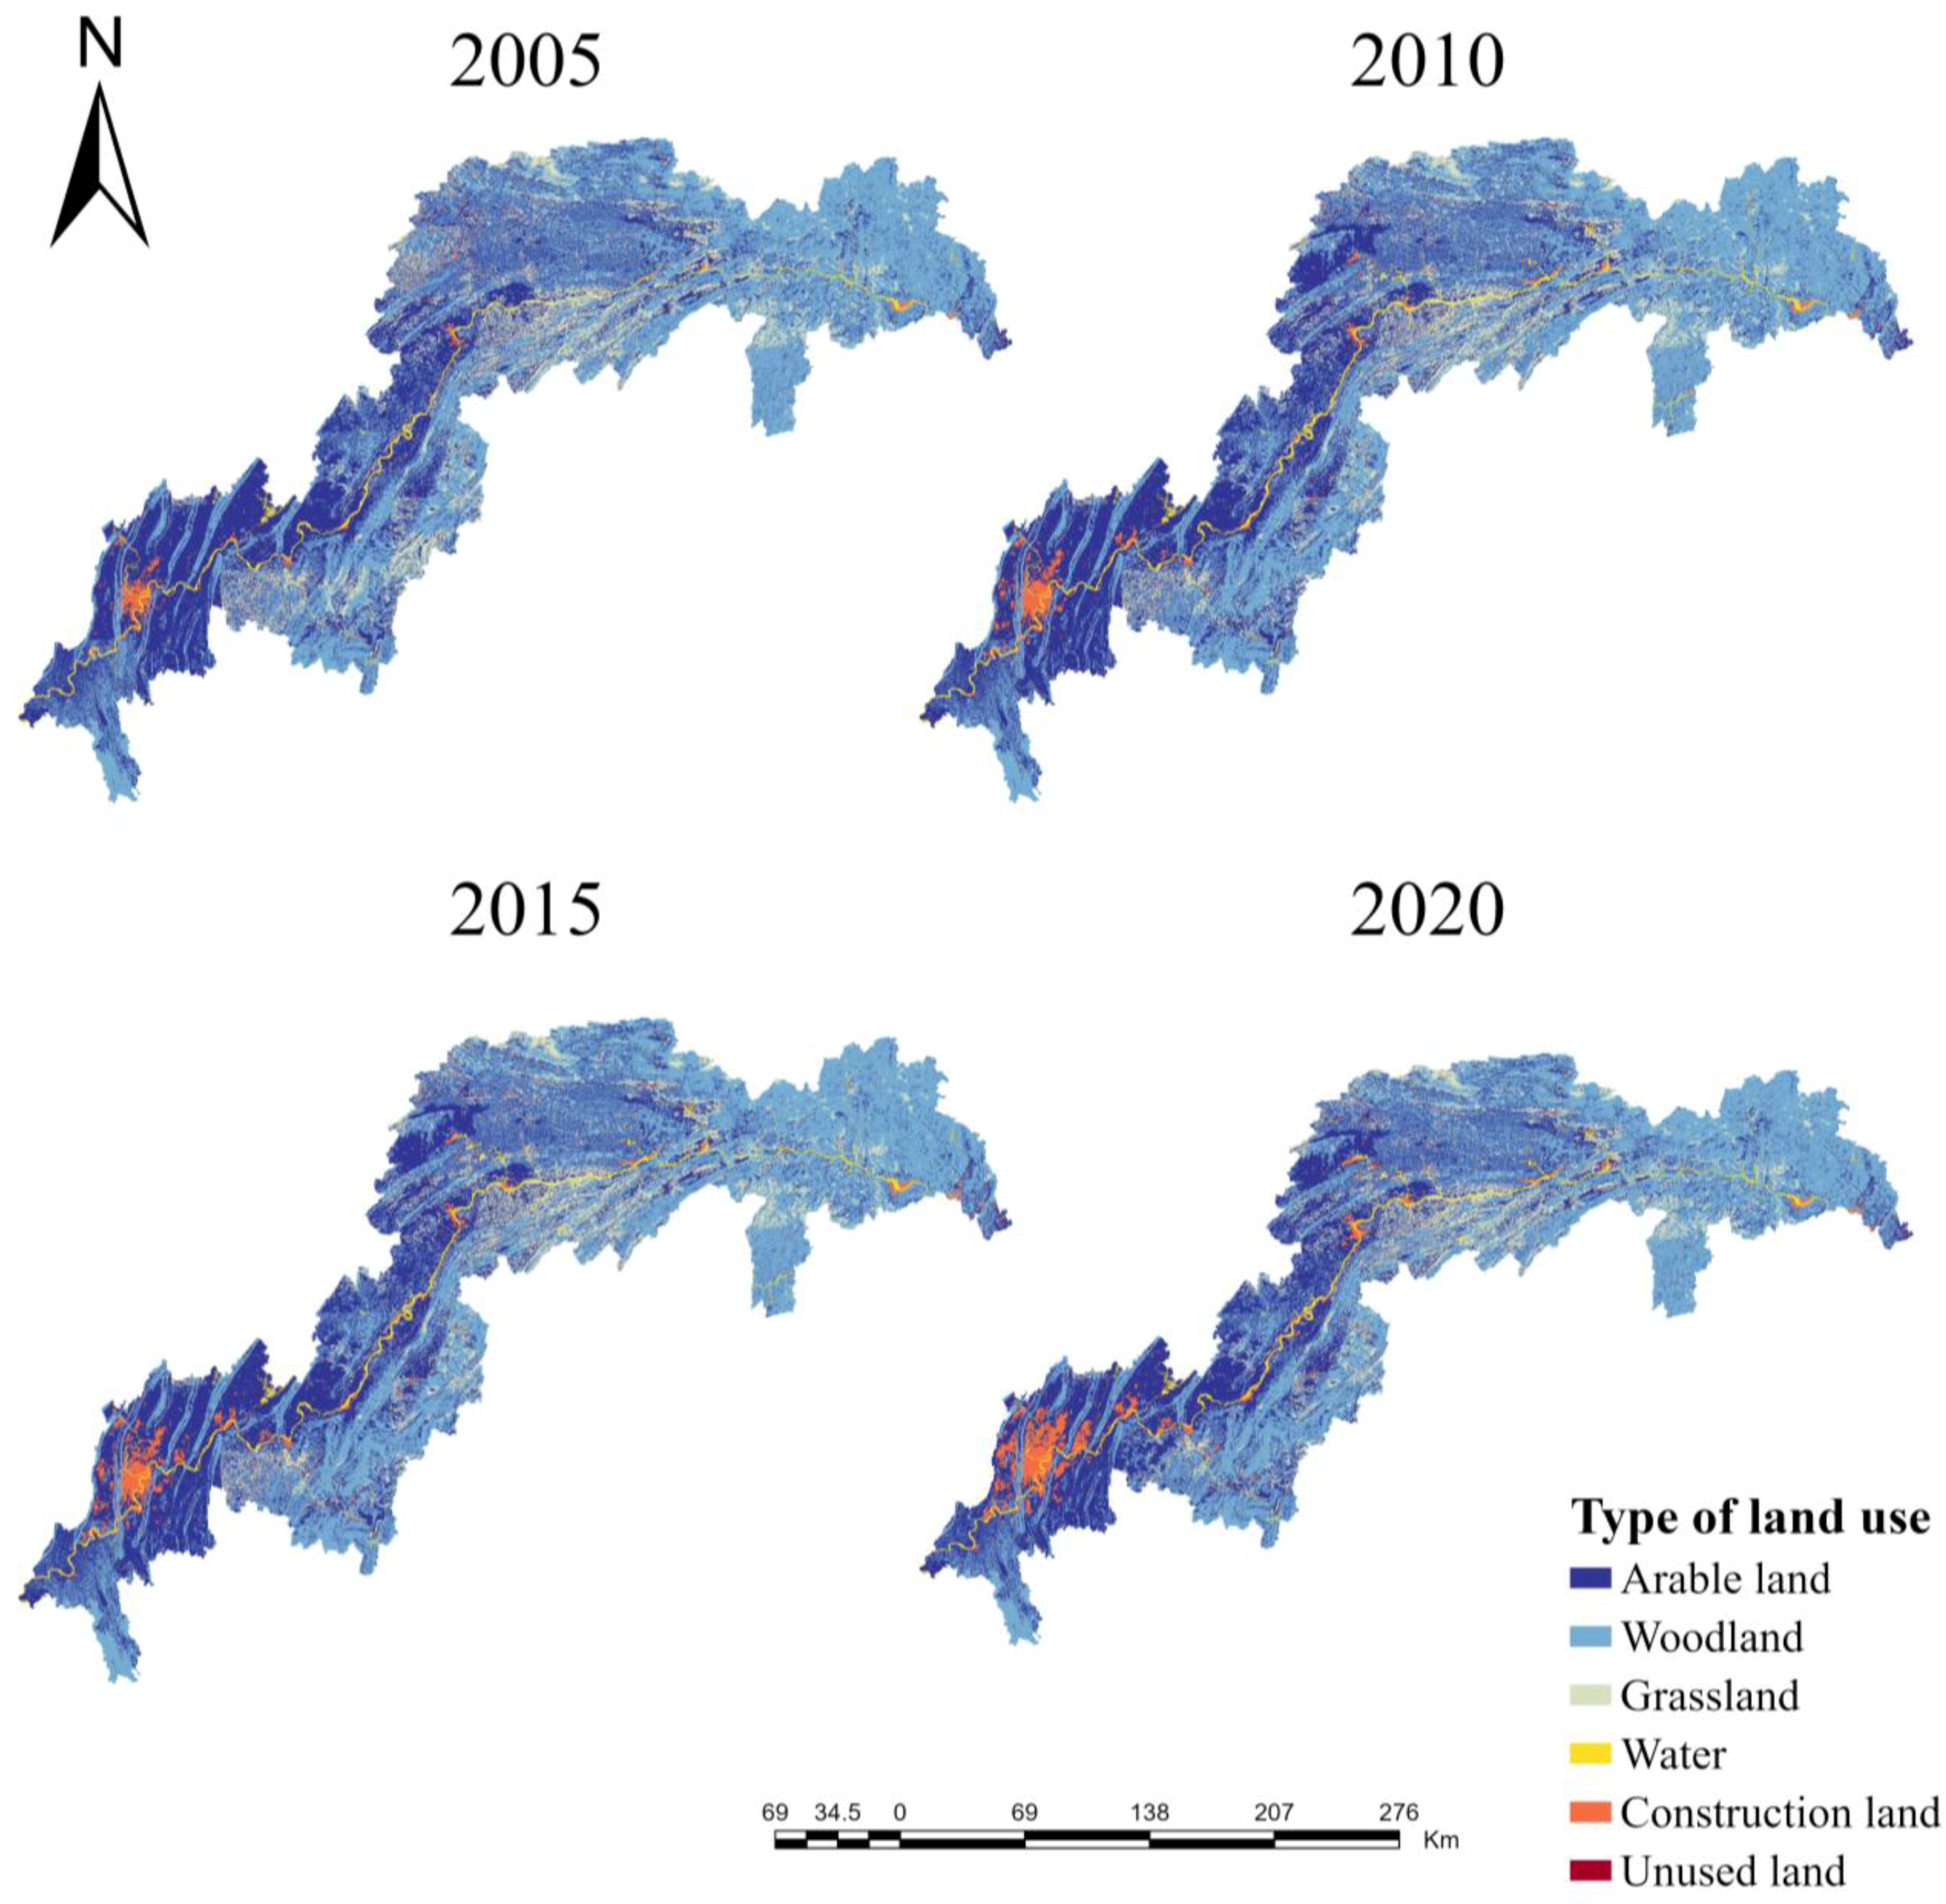
In terms of geographical distribution, arable land is predominantly concentrated in low-lying locations, such as Chongqing’s core urban area at the tail of the TGRA, the western region at the middle portion, and the Yiling District at the head of the TGRA. Woodland is mostly found in middle- to high-altitude places, such as the southern half of the middle section and the Badong, Zigui, and Xingshan counties at the head of TGRA. Grassland is sporadically spread along the margins of water bodies, especially in the centre area of Yunyang and Fengjie County. Water is mostly dispersed along the Yangtze River’s main channel and tributaries, which traverse the whole TGRA. Construction land is heavily concentrated in the downstream sector of Chongqing’s core metropolitan region, with a limited amount spread across towns along the Yangtze River. Unused land is sparse across the reservoir region, with a tiny concentration near the junction of Kaizhou District and Yunyang County (Figure 3).
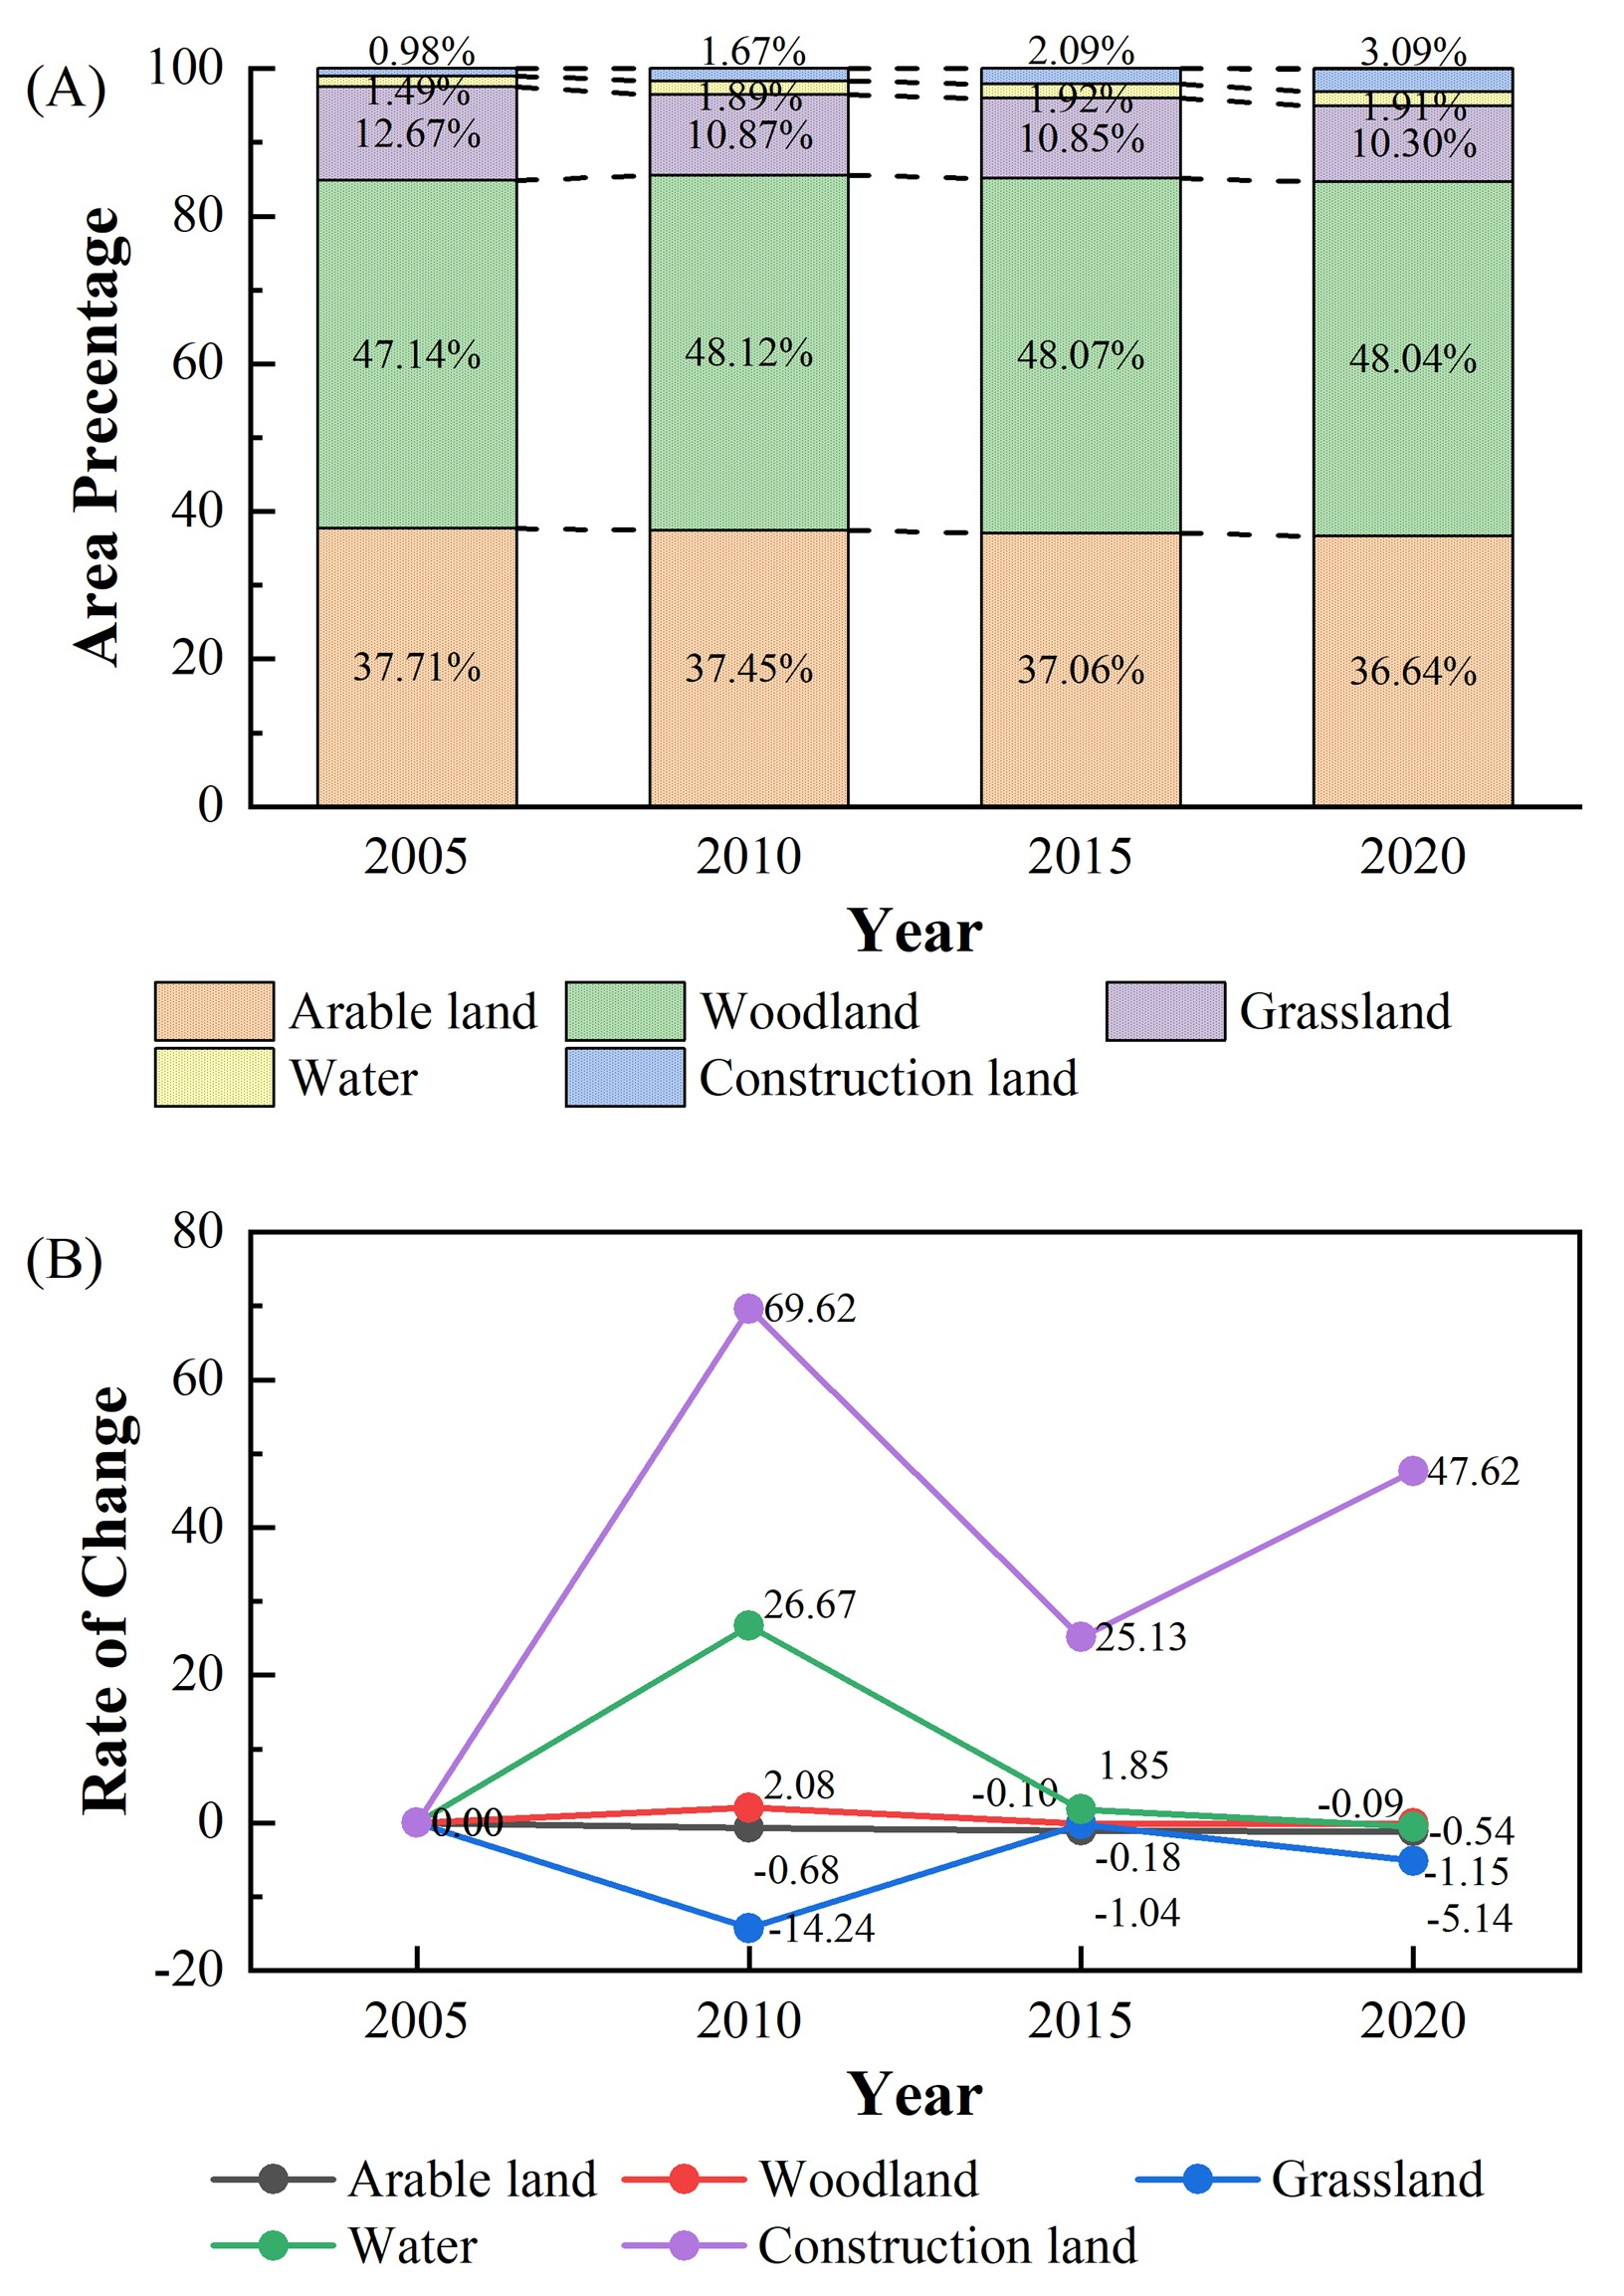
In terms of temporal characteristics, the TGRA’s principal land use categories from 2005 to 2020 were arable land and woodland, accounting for around 38% and 47%, respectively. The fraction of arable land steadily dropped, while the proportion of woodland increased from 2005 to 2010 and then fell from 2010 to 2020. The proportions of construction land and water progressively rose, with the former rising from 0.98% in 2005 to 3.09% in 2020 and the latter from 1.49% in 2005 to 1.91% in 2020. The year 2010 saw the highest rate of increase in construction land, at 69.92%. From 12.67% in 2005 to 10.30% in 2020, the proportion of grassland has dropped. Notably, the year 2010 saw the greatest decrease in grassland, at −14.24% (Figure 4).

4.2.2. Analysis of Land Use Transition Matrix

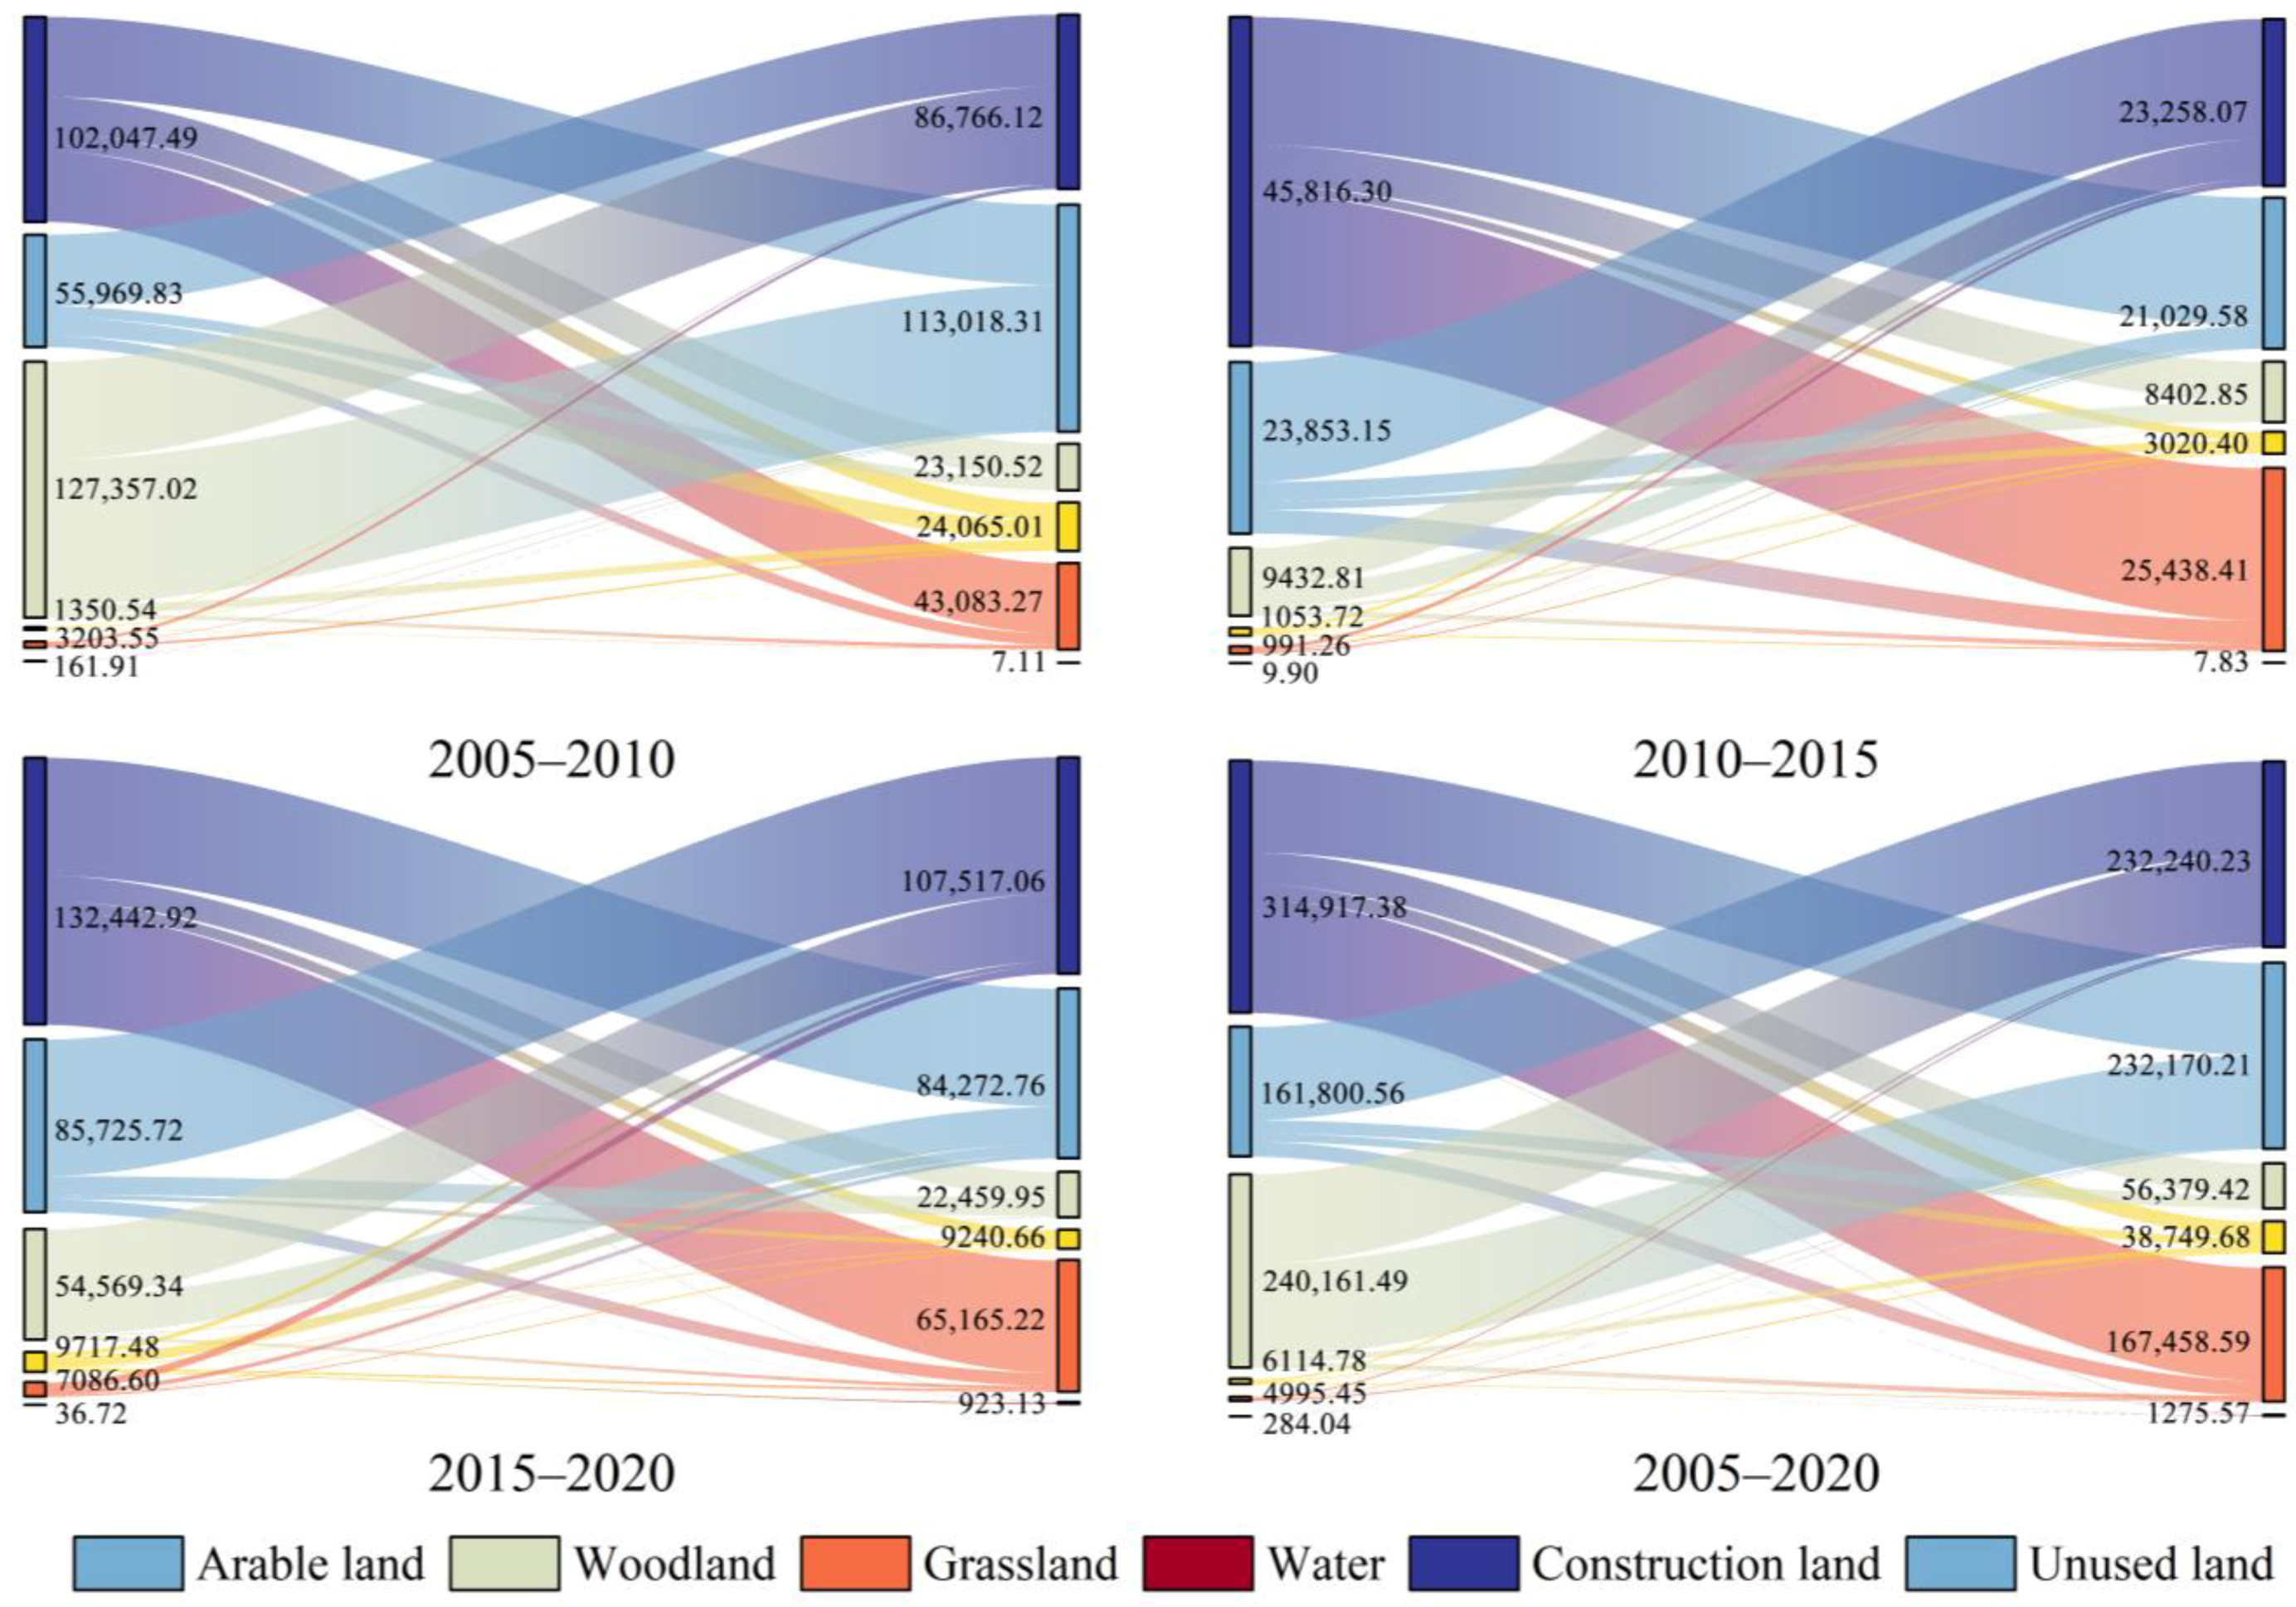
The land use transition matrix displays the initial area transfer and the final area influx of various land types. The ArcGIS 10.8 platform was used in this study to calculate the land use transition matrix findings for three time intervals: 2005–2010, 2010–2015, and 2015–2020. The Origin platform was also used to build a Sankey diagram showing land use transitions (Figure 5).
From 2005 to 2010, grassland saw the greatest amount of conversion, reaching 127,357.02 hectares (1273.57 km2), largely shifting into woodland. Concurrently, woodland received the most incoming conversion area, totalling 113,018.31 hectares (1130.18 km2), primarily from arable land and grassland. Between 2010 and 2015, the greatest significant conversion was in arable land, with 45,816.3 hectares (458.16 km2) transferring out, mostly to construction land. Simultaneously, construction land experienced the largest incoming conversion area, totalling 25,438.41 hectares (254.38 km2), mostly from arable land and woodland. Between 2015 and 2020, arable land had the highest outgoing conversion area, reaching 132,442.92 hectares (1324.43 km2), mostly converting to woodland and construction land. At the same time, arable land had the highest incoming conversion area, totalling 107,517.06 hectares (1075.17 km2), primarily from woodland and grassland.
In summary, the consequences of the “returning farmland to forests and grasslands” policy were more prominent between 2005 and 2010. However, beginning in 2010, with the enactment of policies fostering high-quality development in the Yangtze River Economic Belt and the construction of new urbanisation, the area of construction land increased significantly. Furthermore, following the execution of the major functional zone planning, the proportion of converted land areas in the respective land types remained reasonably consistent between 2010 and 2015 and 2015 and 2020. This demonstrates a coordinated and harmonious development between urbanisation and the ecological environment.

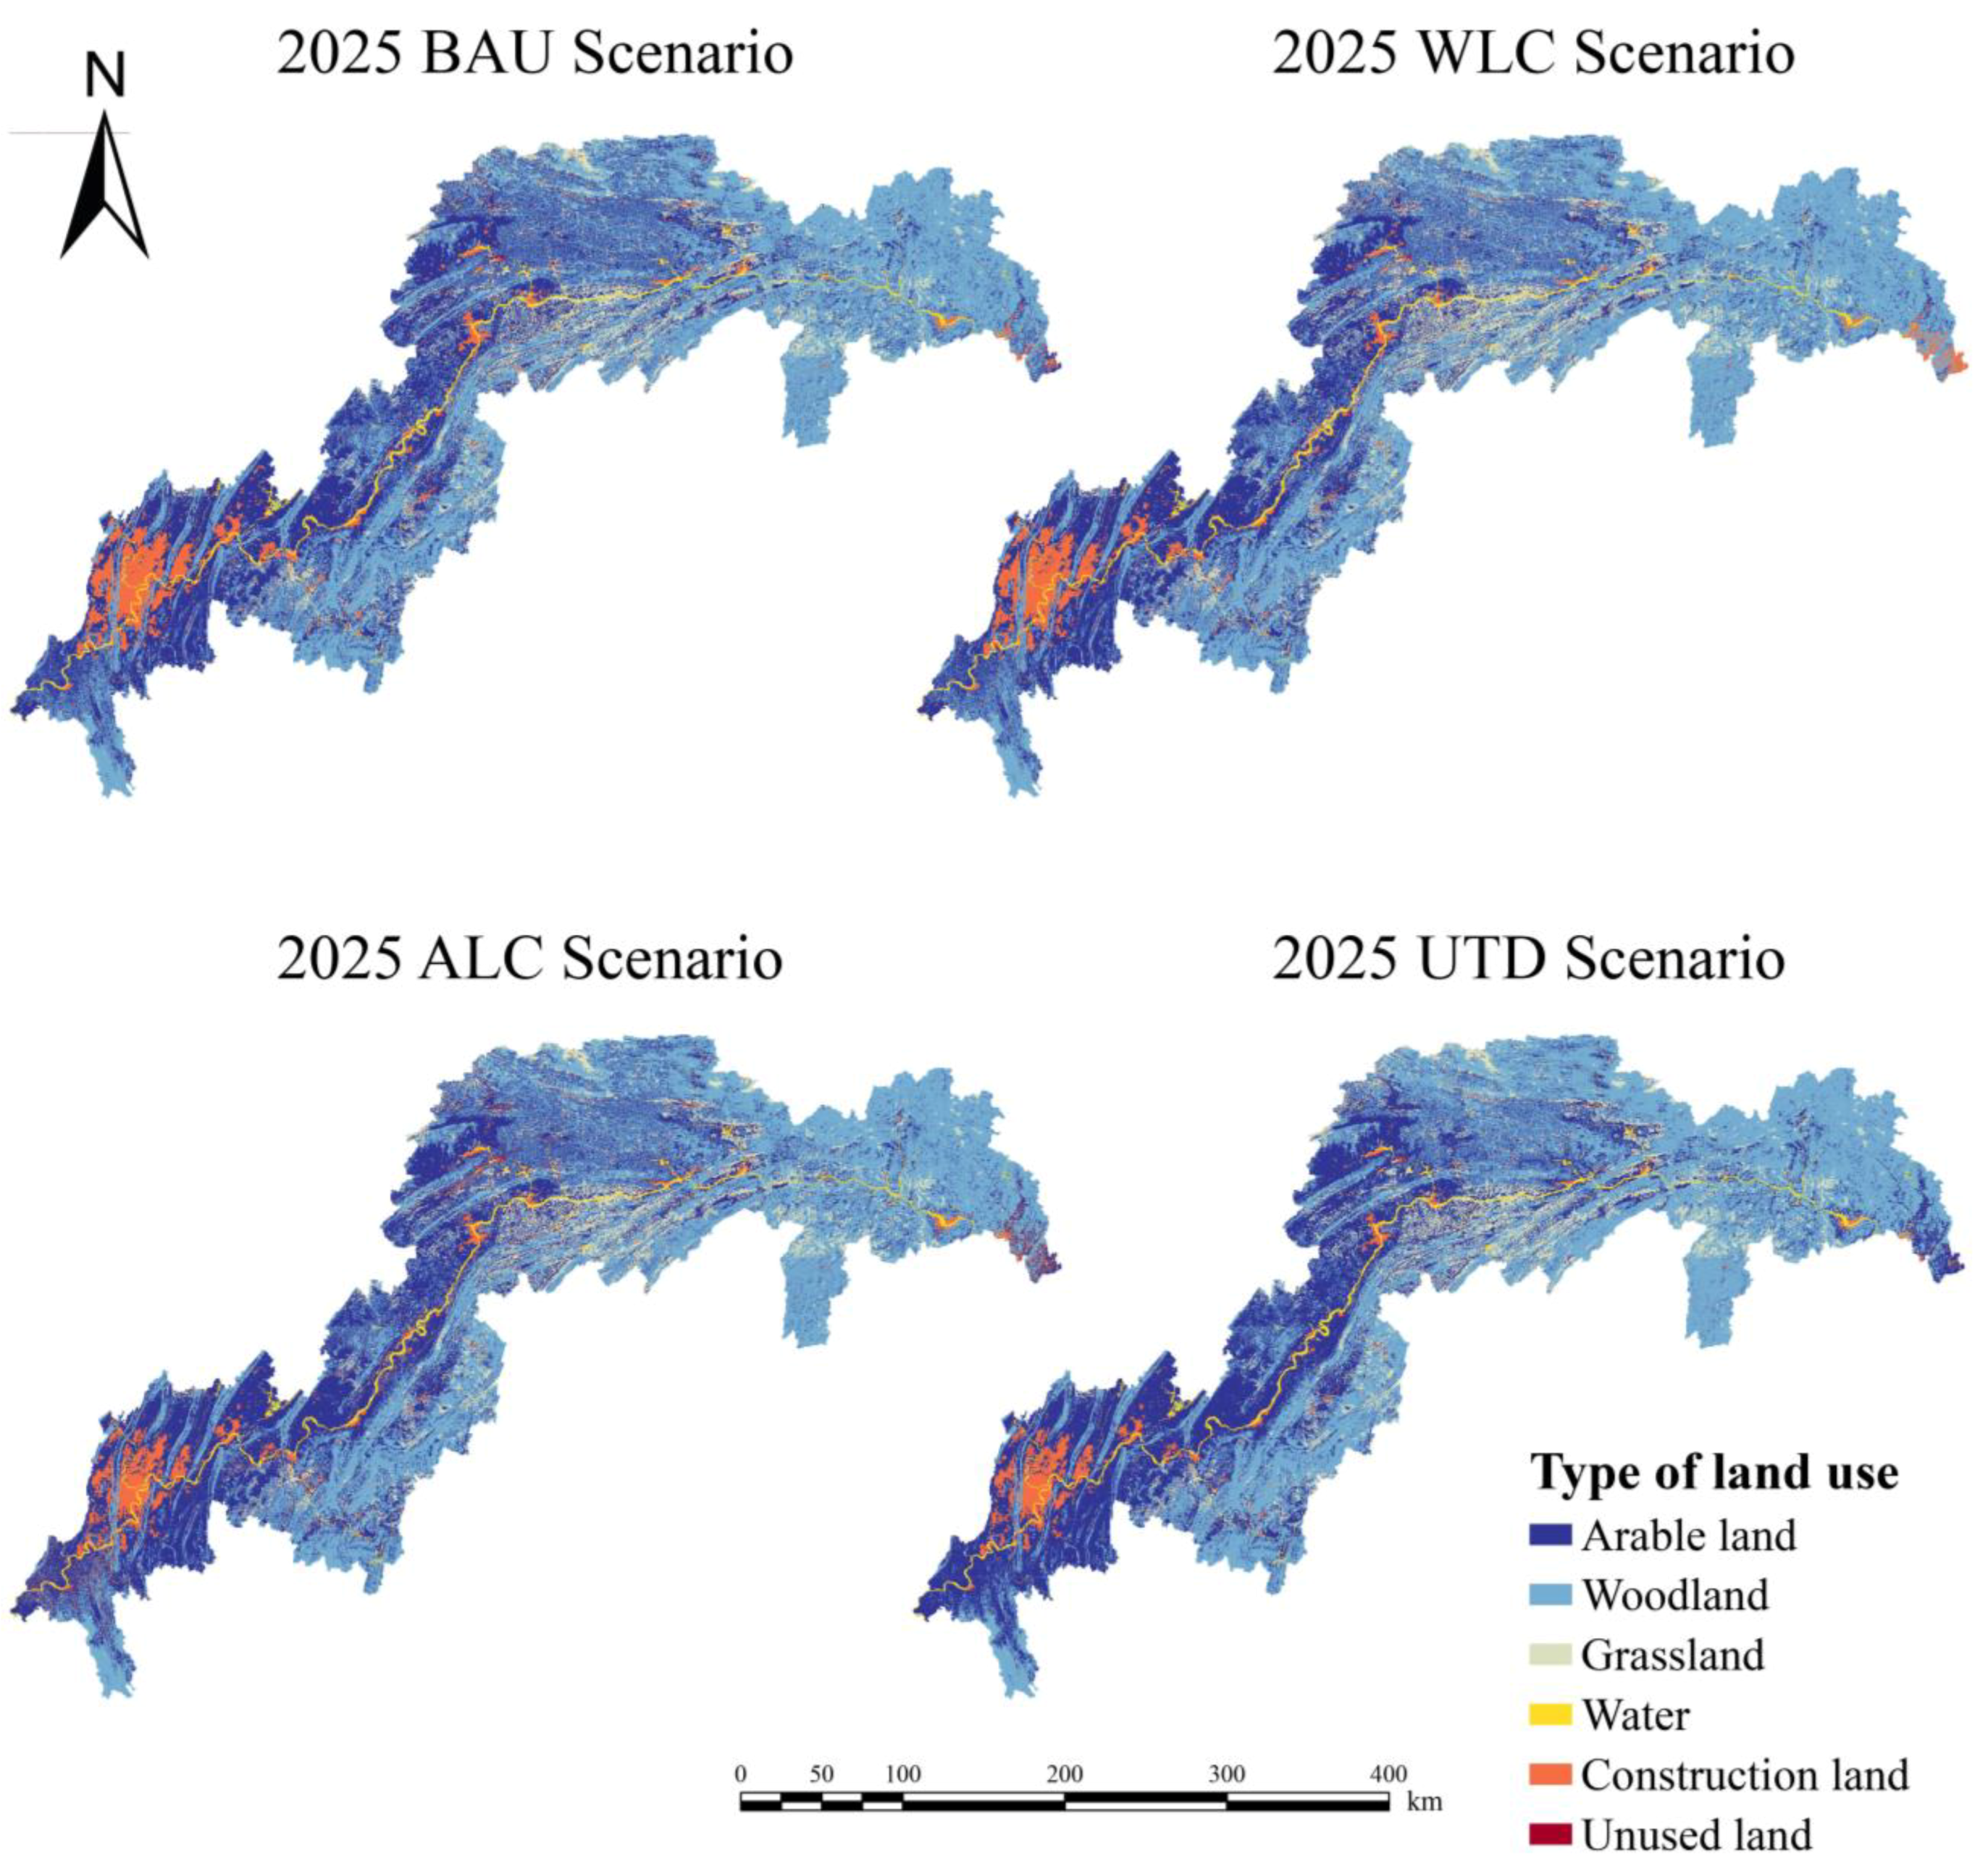
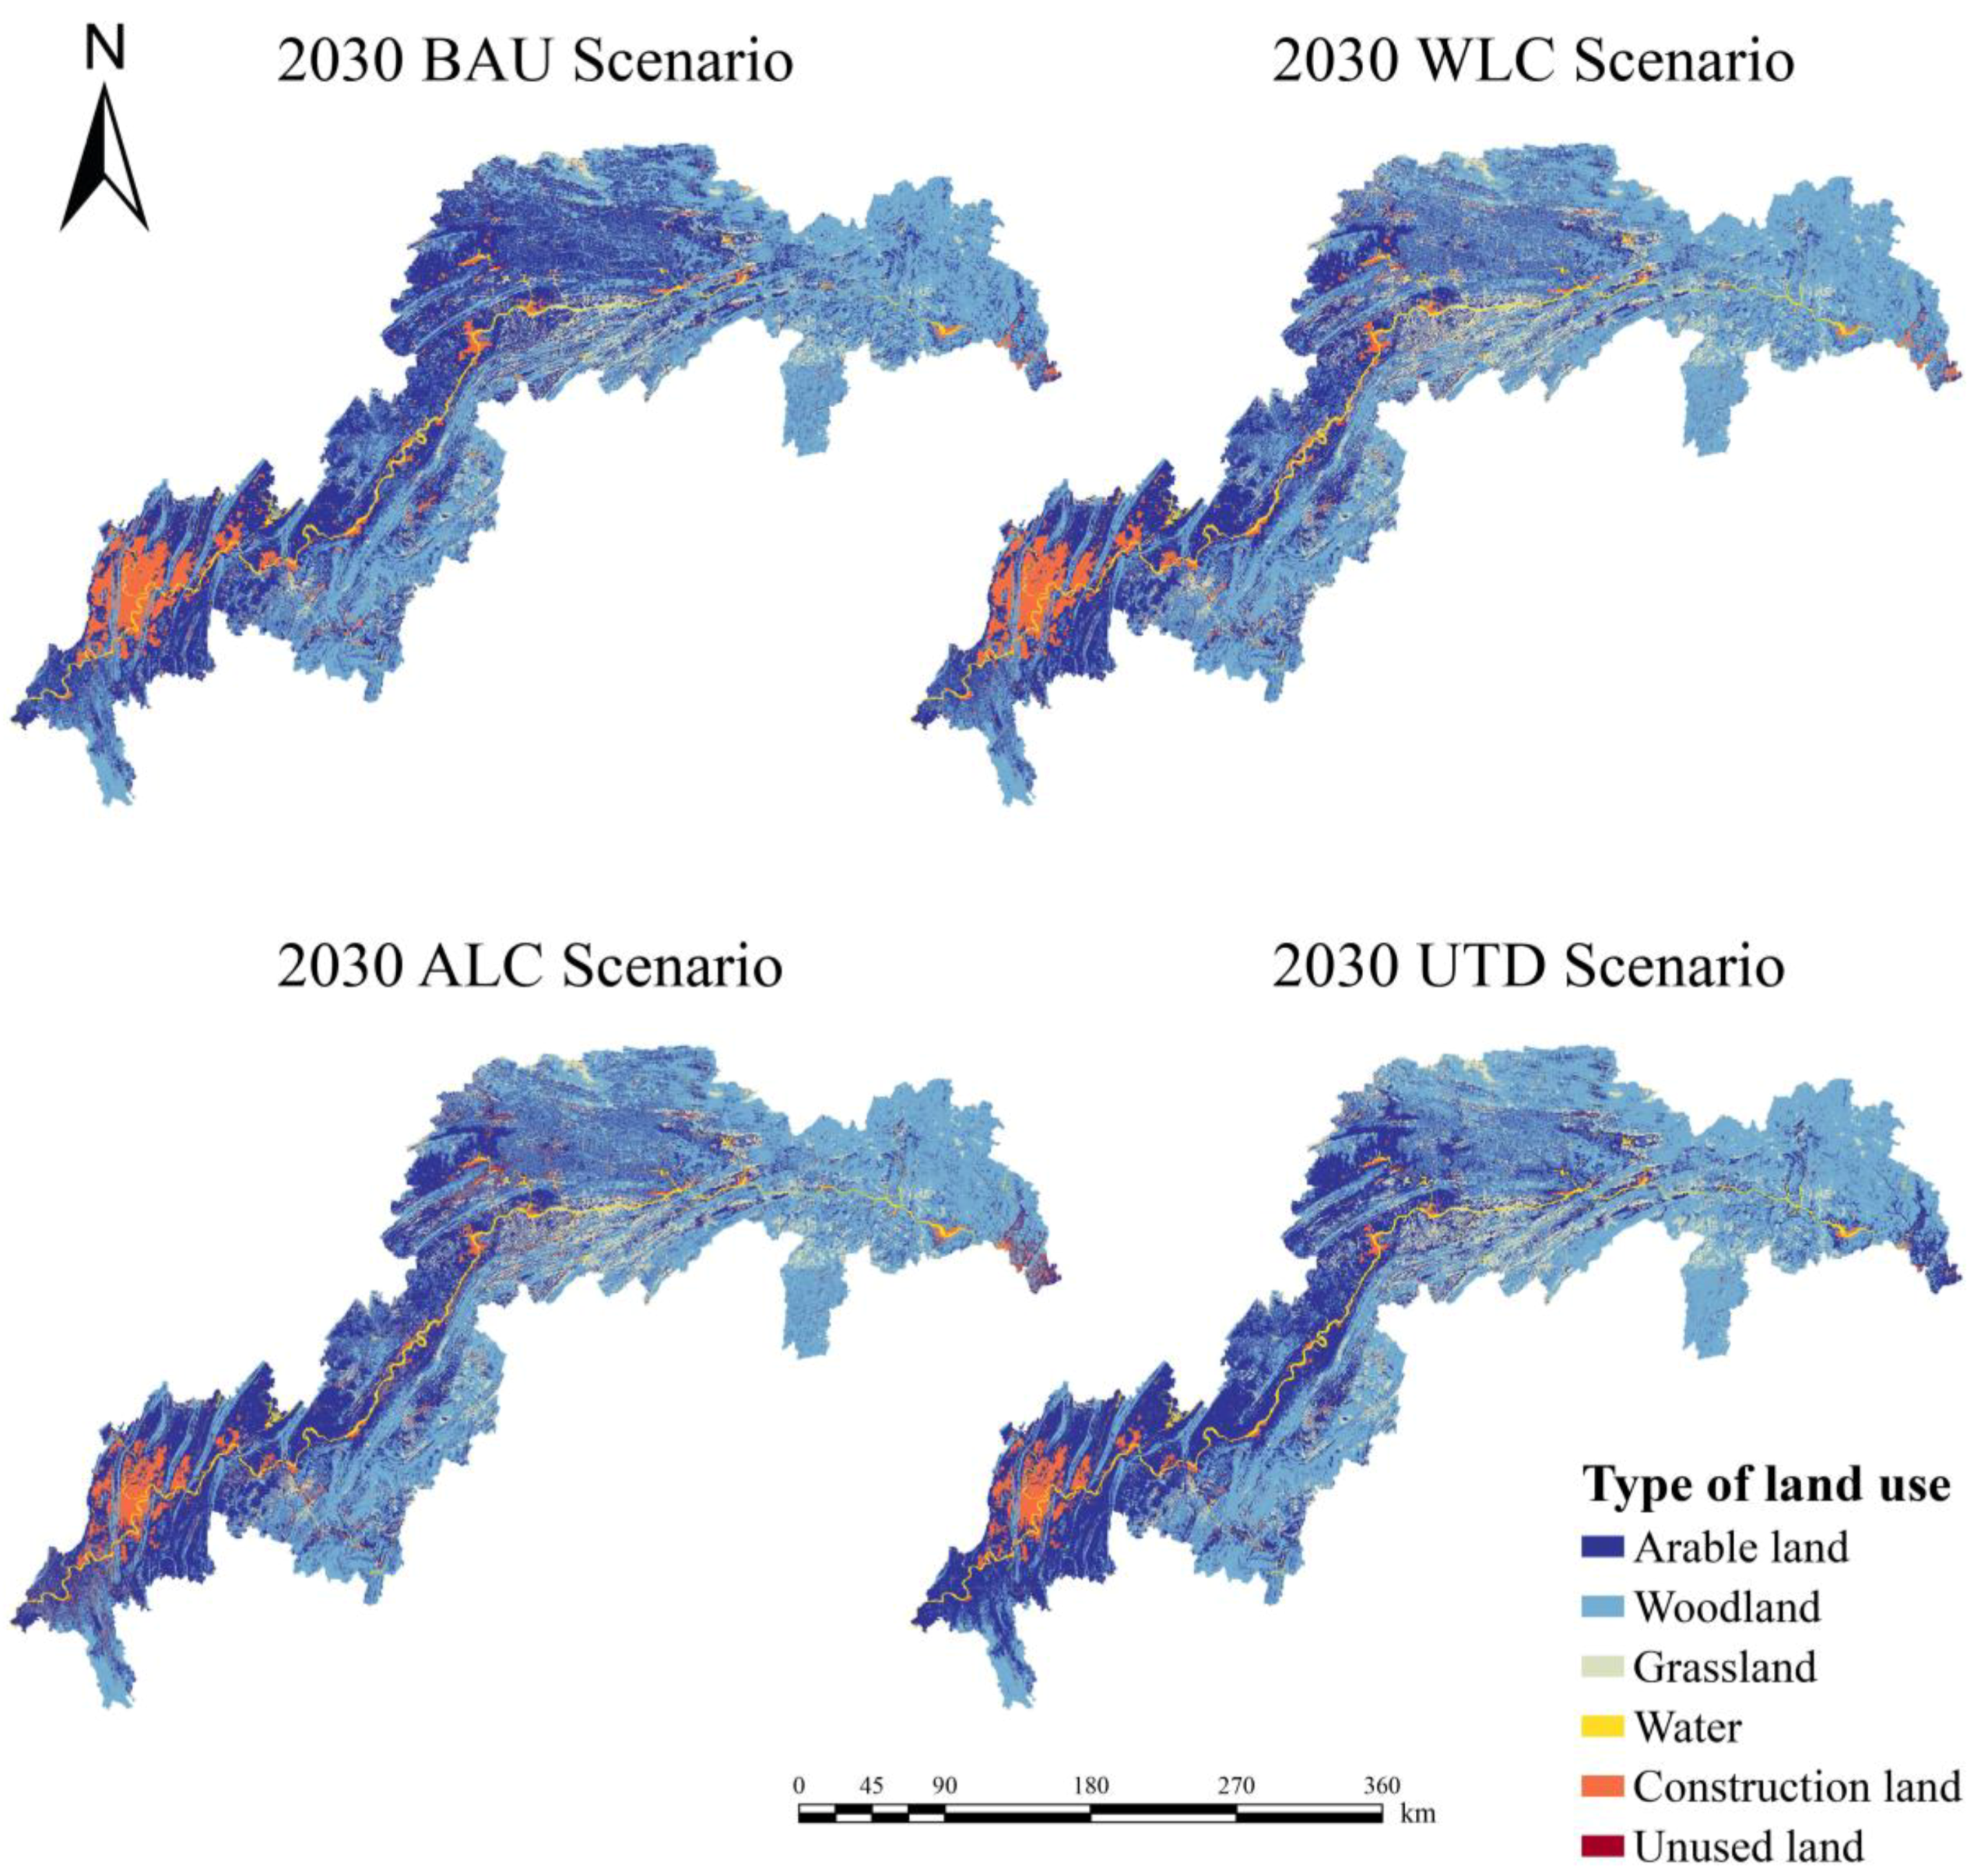
4.3. Simulation of Land Use Changes in the TGRA under Various Scenarios

This study simulated land use in the TGRA for the years 2025 and 2030 using the Markov–CA model. Figure 6 and Figure 7 show the simulated results for the scenarios in 2025 and 2030, respectively. Table 5 and Table 6 show the changes in the land use area from 2020 to 2025 and 2030, respectively.
According to the projections, a consistent tendency in all four scenarios by 2025 is a decrease in grassland and an increase in construction land. The BAU scenario predicts that arable land will expand by 205.08 km2, construction land will increase by 1356.08 km2, and woodland and grassland will decline by 673.36 km2 and 926.06 km2, respectively.
In comparison to the BAU scenario, the trends in the arable land and woodland area changes in the WLC scenario are inverse. The arable land area drops by 1315 km2, whereas the woodland area grows by 738.61 km2. At the same time, the loss of grassland is lower, totalling just 115.05 km2. Other land types’ areas remain consistent with the BAU scenario. This suggests that strong encouragement of afforestation and grassland restoration under the WLC scenario, without constraining urban expansion, considerably improves ecosystem quality. The arable land, water, and construction land all show a growing tendency in the ALC and UTD scenarios, whereas the woodland and grassland show a declining trend. The ALC scenario has the most gain in arable land, totalling 1059 km2, with a growth rate of 3.74%. The highest reductions are shown in woodland and grassland, which shrink by 781.23 and 936.17 km2, respectively. Furthermore, because of the control over urban development borders, the UTD scenario has the smallest growth in construction land, totalling 605.98 km2.
In 2030, construction land continues to increase, while grassland continues to shrink, similar to the expected situation in 2025. In the BAU scenario, arable land is forecast to expand from 28,533.21 km2 in 2025 to 32,223.96 km2 in 2030, while construction land is expected to rise from 3742.24 km2 in 2025 to 4434.47 km2 in 2030, indicating 12.93% and 18.50% growth rates, respectively. With growth rates of −5.99% and −24.08%, respectively, the woodland is forecast to decline from 36,465.23 km2 in 2025 to 34,281.20 km2 in 2030, while the grassland is expected to shrink from 7033.15 km2 in 2025 to 5339.61 km2 in 2030. Combining the simulation results for the BAU scenarios in 2025 and 2030 demonstrates that human activities result in the rapid development of arable and construction land, encroaching on existing ecological lands such as forests and grasslands, eventually disturbing the ecosystem stability. As a result, appropriate steps must be taken to establish protective borders and optimise the land use structure of “mountains, rivers, forests, farmlands, lakes, and grasslands”.
In the WLC scenario, woodland rises from 37,877.20 km2 in 2025 to 38,226.36 km2 in 2030, compared to the BAU scenario, due to woodland conservation and a complete assessment of the resource carrying capacity. This expansion prevents further conversion of productive farmland and construction land to woodland. As a result of defining protected arable land borders in the ALC scenario, arable land rises by 2.89% from 29,387.13 km2 in 2025 to 30,236.80 km2 in 2030. However, woodland and grassland are declining. Under the UTD scenario, the development of UGB results in a moderate increase in construction land of 114.94 km2, with a growth rate of 4.41%. Despite this, due to the fast increase in arable land, woodland and grassland are still being encroached upon, resulting in decreases of 675.24 km2 and 534.98 km2 respectively.

4.4. Simulation of Carbon Storage in the TGRA under Various Scenarios

The carbon stock module of the InVEST model was used in this study to calculate the total carbon stock for the years 2005–2020 and to simulate scenarios for 2025 and 2030. Table 7 shows that the TGRA’s carbon stock increased from 687.81 Tg in 2005 to 689.78 Tg in 2010, and subsequently declined to 685.60 Tg in 2020. The carbon density increased from 88.94 Mg/ha in 2005 to 89.20 Mg/ha in 2010, then declined to 88.66 Mg/ha in 2020.
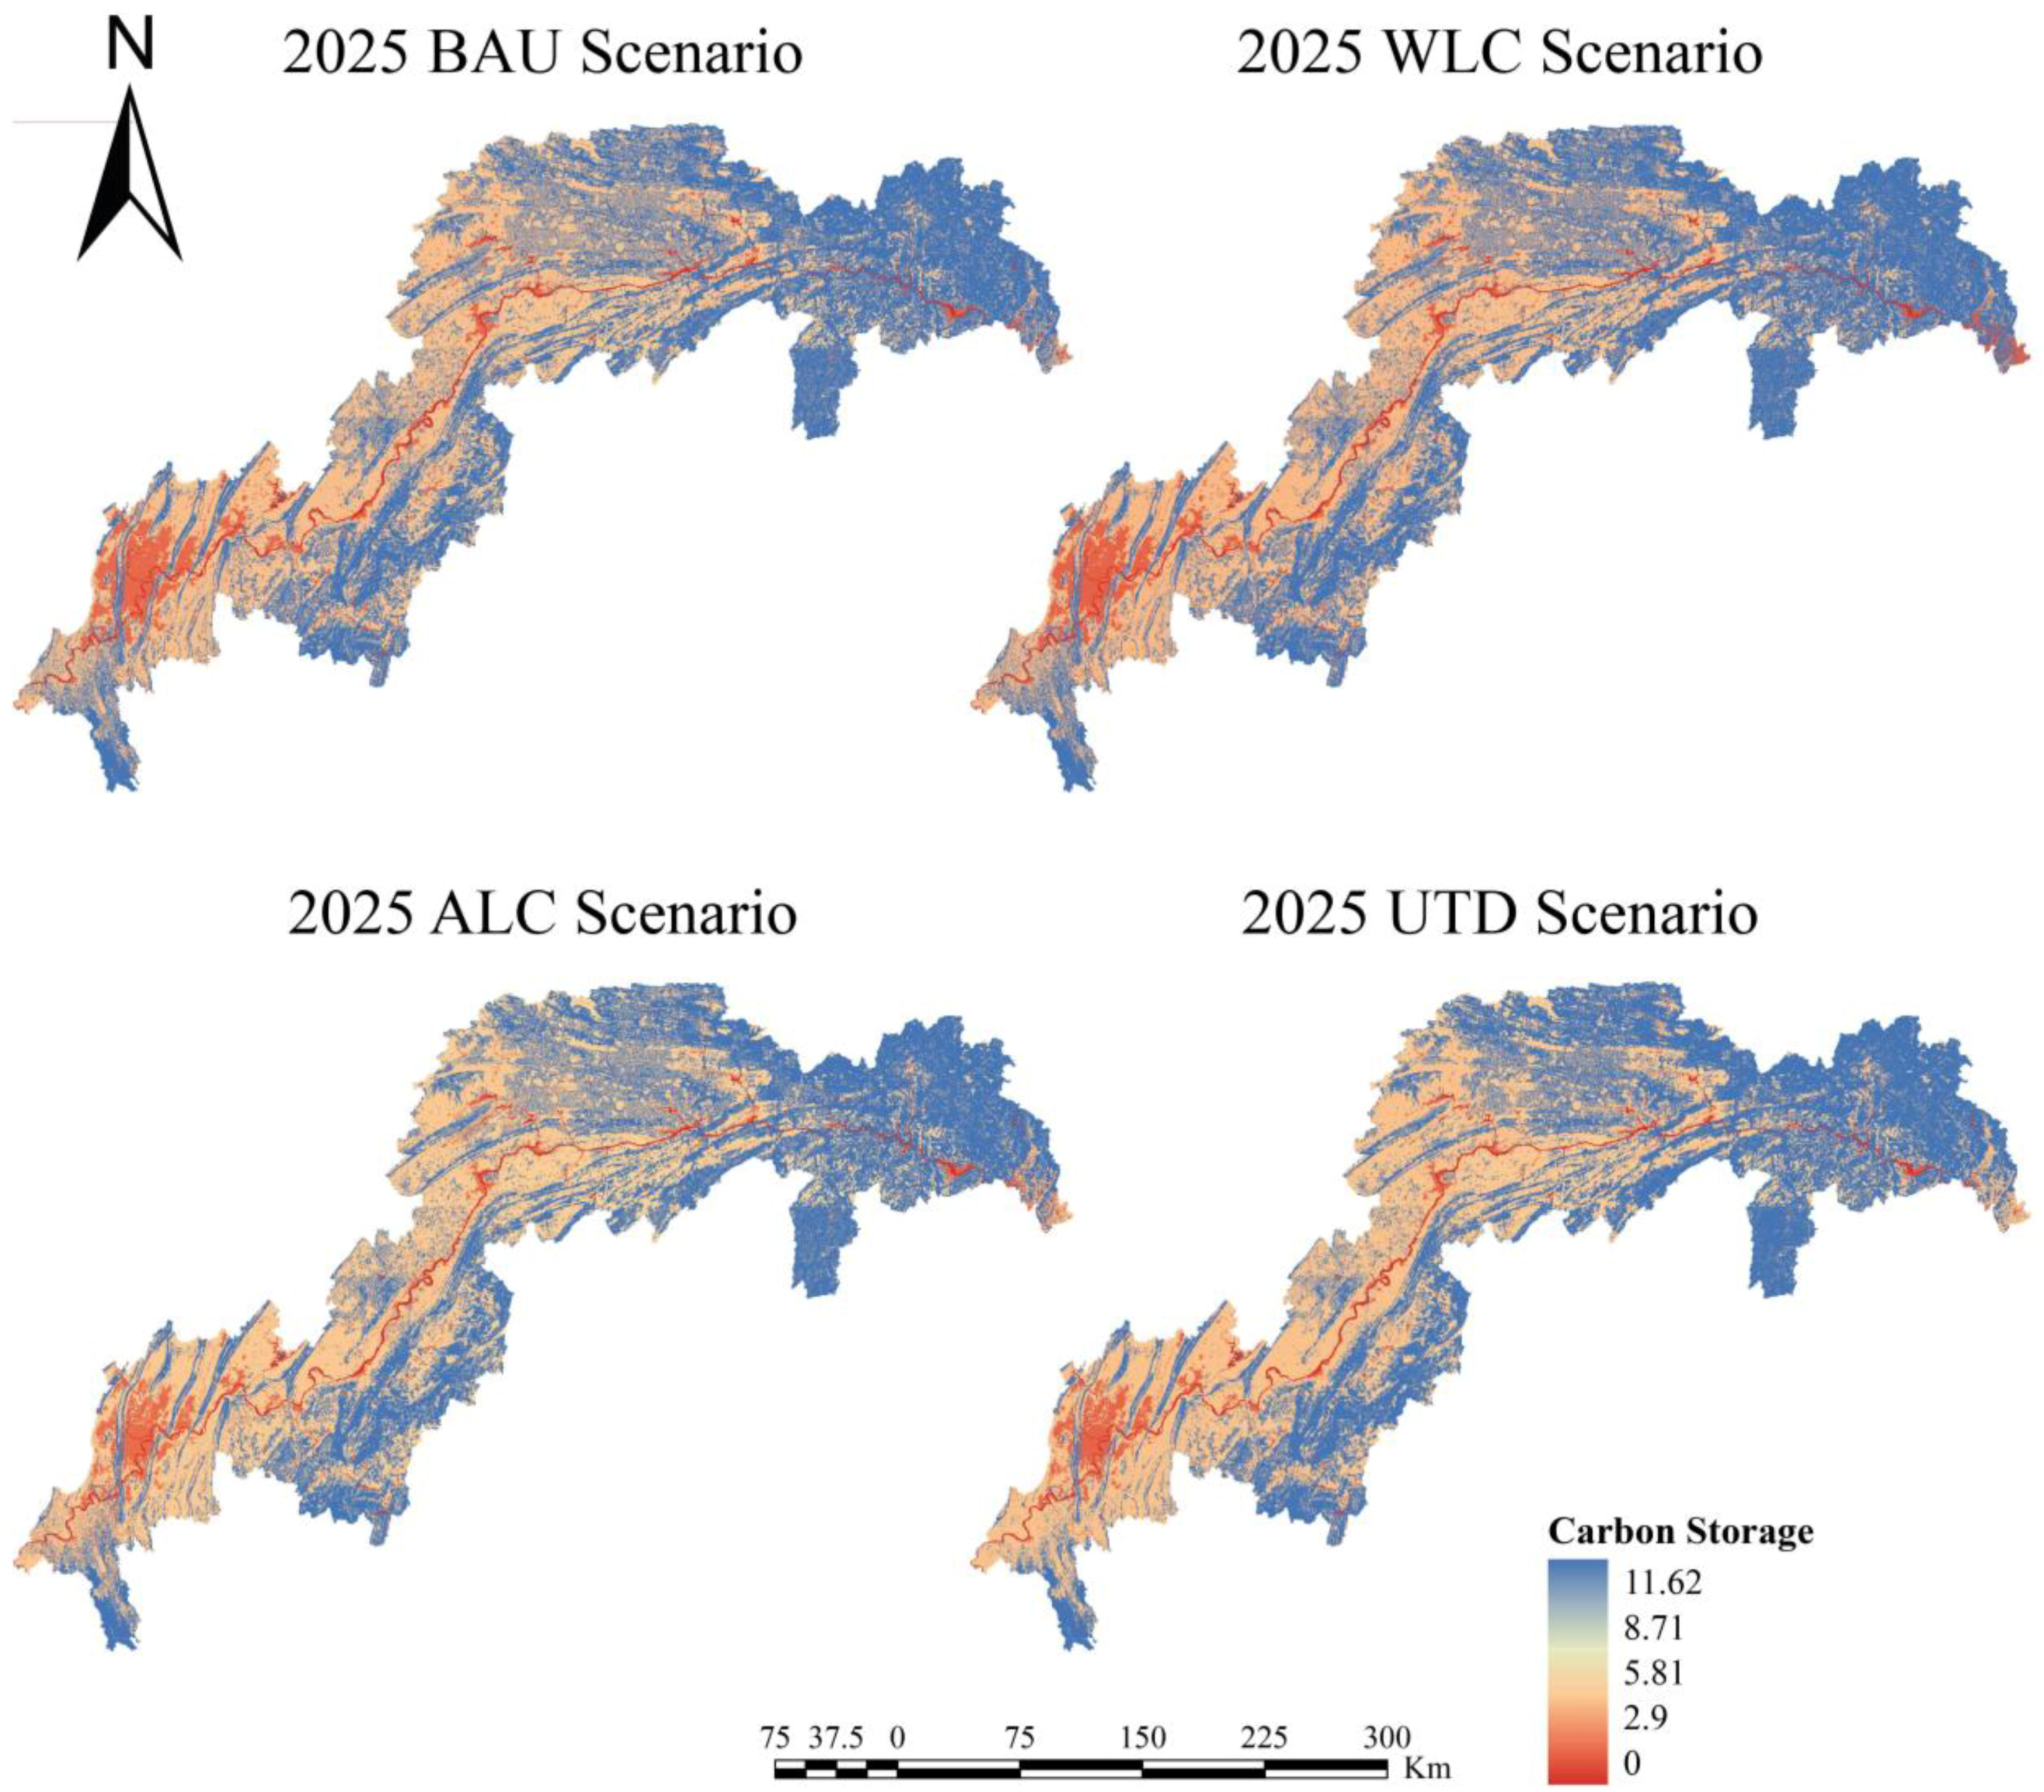
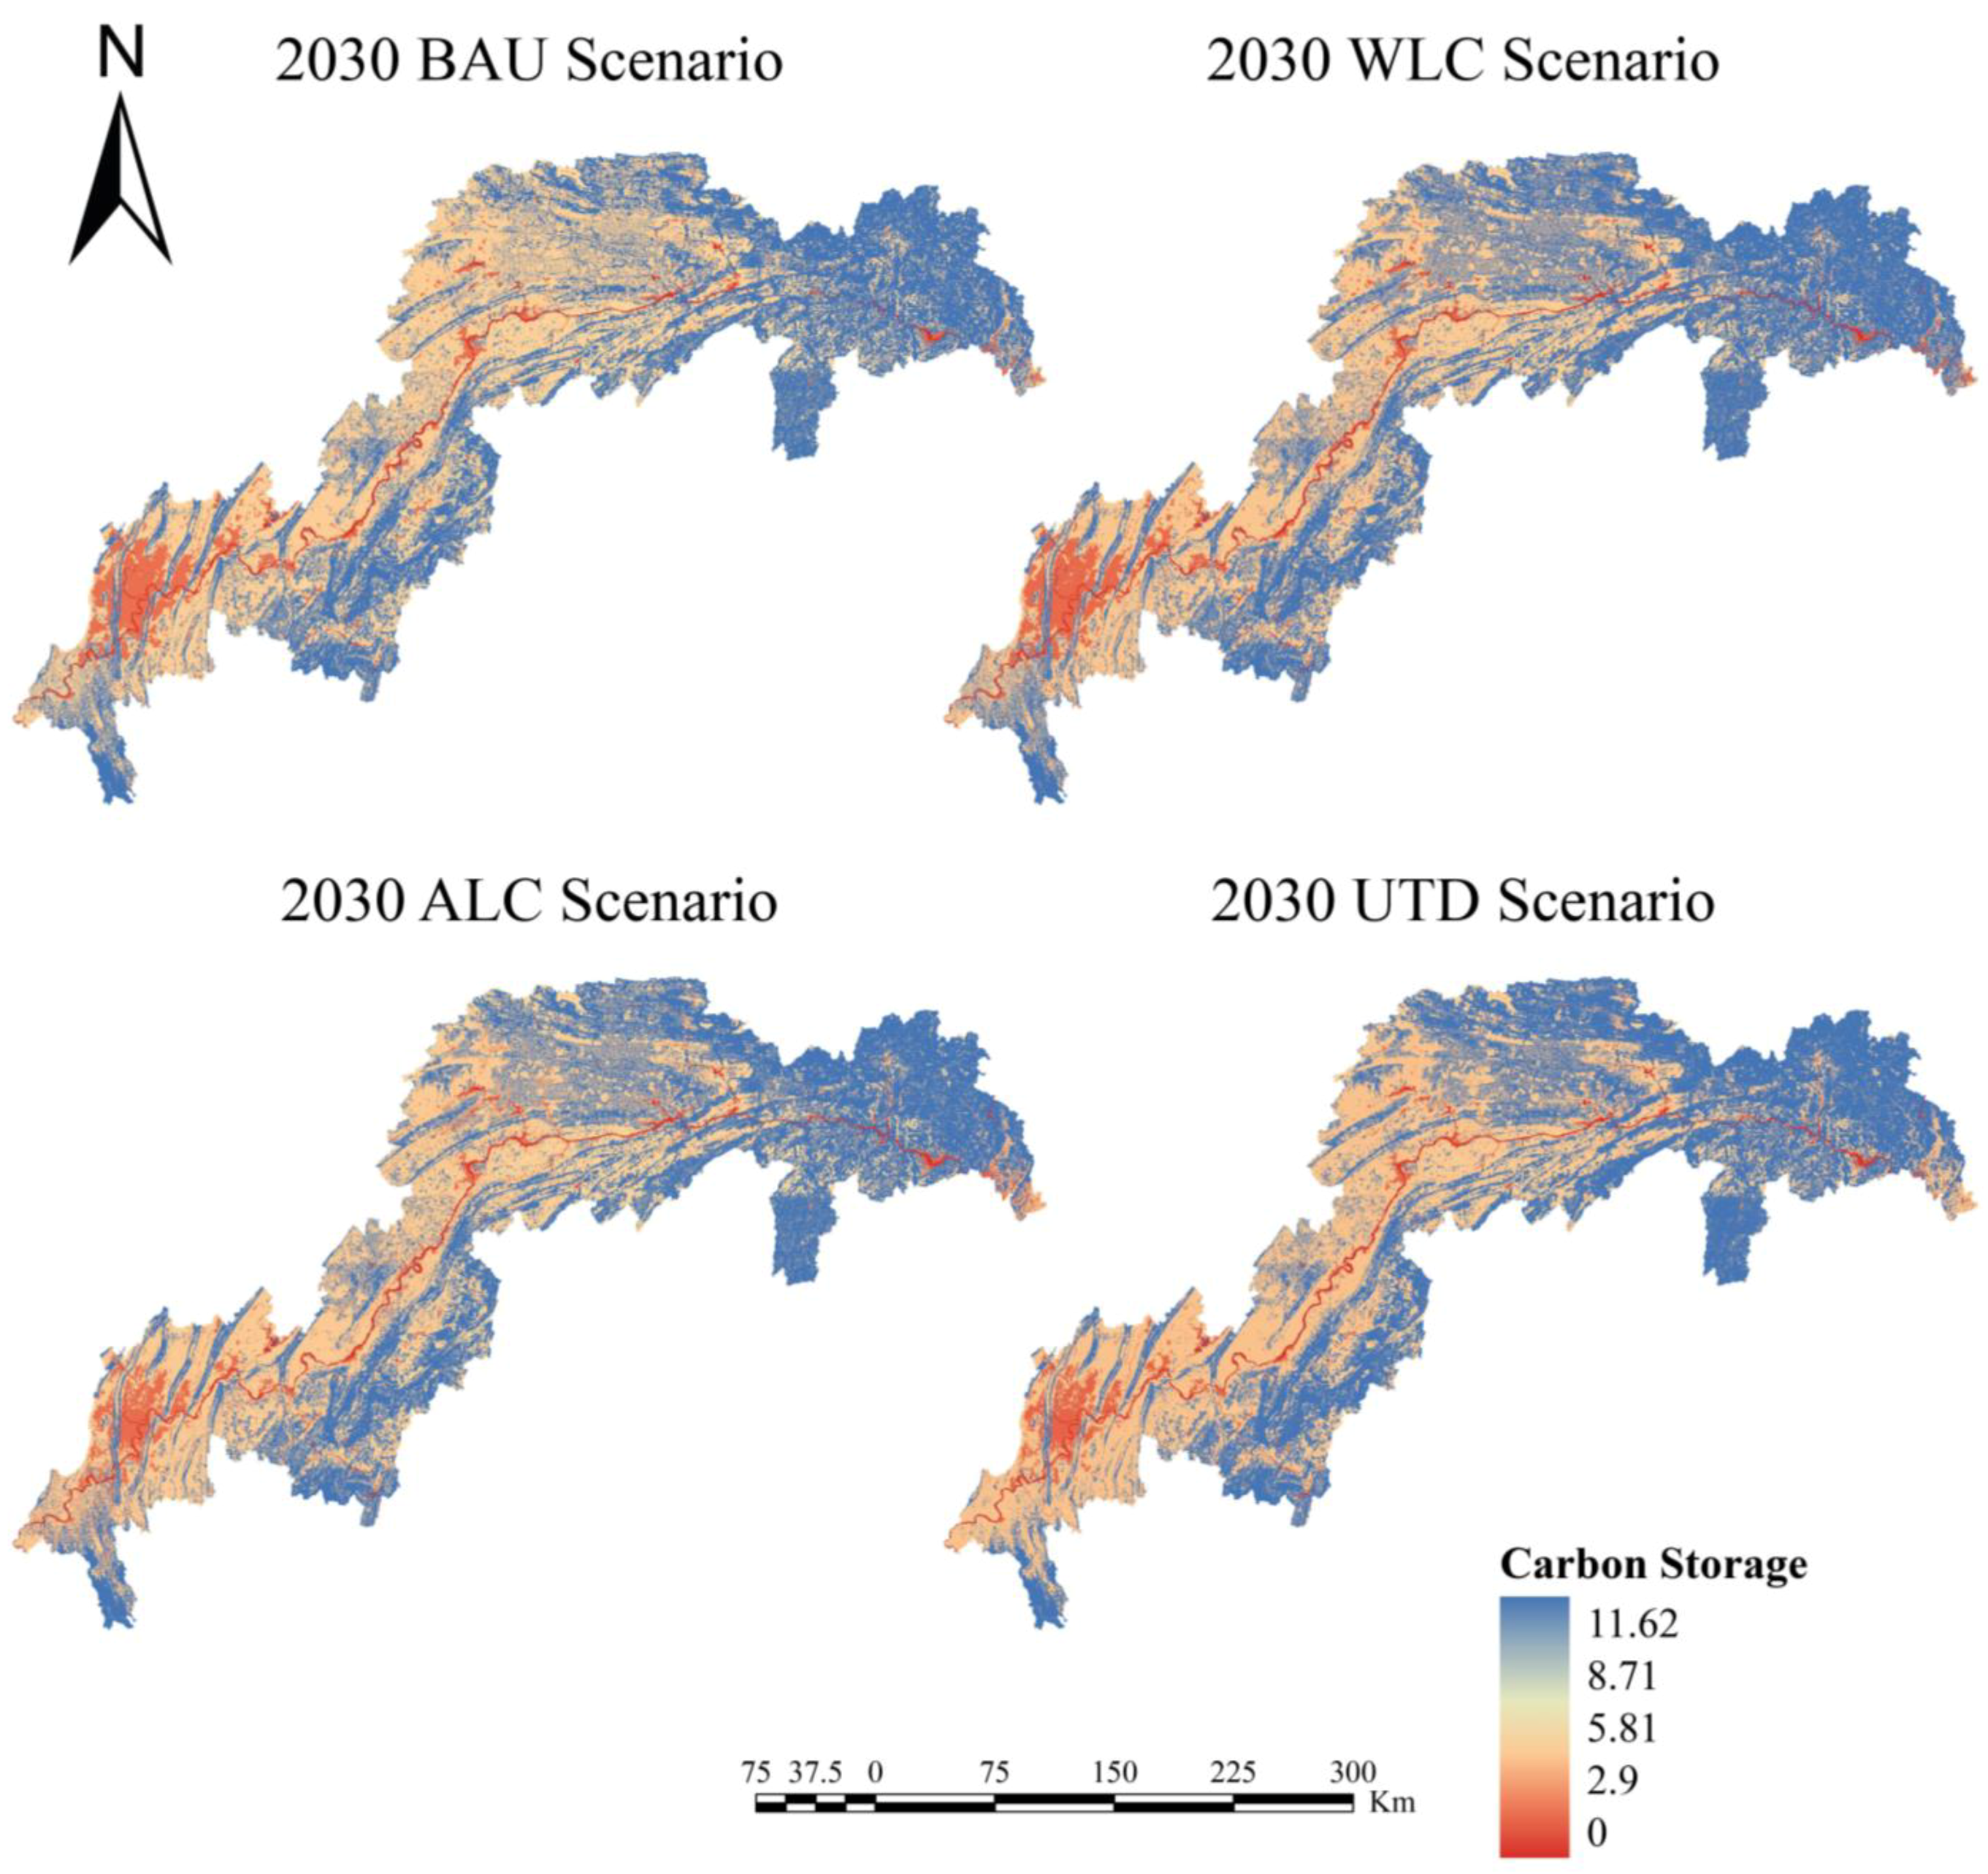
According to the forecasts, all four scenarios show a downward trend in carbon storage from 2020 to 2030 due to the fast changes in land use driven by human activities and rising urbanisation (Table 8). Under many scenarios, there is substantial spatial heterogeneity in carbon storage within the TGRA. Overall, the distribution pattern shows that the eastern and northern areas have more carbon storage, whereas the western and southern areas have lesser carbon storage. Furthermore, carbon storage in the head of the TGRA is greater than that in the middle section, and carbon storage in the middle section is greater than that in the tail of the TGRA.
The carbon stock declines the most in the BAU scenario, with a decrease of 25.72 Tg. When the simulated land use changes indicated above are considered, it is discovered that the primary reason of the loss in carbon stock is the constant drop in woodland and grassland. The ALC and UTD scenarios result in carbon stock reductions of 10.19 Tg and 5.35 Tg respectively, as compared to the BAU scenario, demonstrating that restraining the rapid development of arable and construction land may effectively mitigate carbon losses. According to the WLC scenario, the carbon stock rises from 685.60 Tg in 2020 to 690.73 Tg in 2025 before falling to 685.67 Tg in 2030. The WLC scenario differs from the other three in that the ecological protection border imposed assures that woodland and grassland do not suffer significant decreases. As a result, a significant portion of the carbon stock is concentrated within ecological land, with a particular emphasis on the head of the TGRA, the northern section of the middle reaches, and the southern section of the tail of the TGRA (Figure 8 and Figure 9).
In comparison to the BAU, ALC, and UTD scenarios, the simulation results show that the WLC scenario strives to protect ecological lands such as woodlands and grasslands from being encroached upon by extensive urban construction and arable land. This scenario effectively encourages an increase in the carbon stock within the TGRA, contributing to the ecosystem balance and playing a role in achieving carbon neutrality goals.

5. Discussion

5.1. The Uniqueness of the Study Area

With the release of the “National Main Functional Area Planning” in 2010, TGRA was designated as an ecological functional area for soil and water conservation. This implies that large-scale, high-intensity industrial and urban development needs to be restricted in national land use planning to maintain the integrity and stability of the ecosystem. Within its boundaries, there exists both the economically and socially developed main urban area of Chongqing, as well as the economically and socially underdeveloped and ecologically vulnerable hinterland of the reservoir area. Faced with the challenges posed by uncertain climate change, the region as a whole presents the complexity of its ecosystem.
Addressing the climate crisis is a comprehensive, systematic, and complex endeavour. In response, China launched the Dual Carbon Plan in 2020, aiming to control carbon emissions and enhance carbon storage. NbS seek to mitigate climate change by bolstering the carbon sequestration capacity of ecosystems, thereby enhancing ecosystem resilience and human society’s adaptability. Therefore, based on the NbS concept, simulating the land use and carbon storage variations in the TGRA under multiple scenarios will lay the foundation for the future comprehensive implementation of the Dual Carbon Plan in the Yangtze River Basin, contributing to the achievement of sustainable development goals.

5.2. Comparative Analysis of Multi-Scenario Simulation Results

Based on the ecosystem’s sustainable development requirements of NbS, this study simulated the spatiotemporal patterns of land use and the evolution characteristics of carbon storage under four scenarios: BAU, WLC, ALC, and UTD, for the year 2030.
According to the BAU scenario, the growth of construction and arable land leads to the invasion and compression of ecological land, resulting in a steep fall in the area of ecological land, which in turn causes a considerable loss in carbon storage. In the ALC scenario, the installation of protective borders for arable land leads to a steady expansion in the extent of productive land. This is the result of the scenario. On the other hand, the region contains a considerable amount of sloping farmland as well as land that is farmed with an eye towards economic development. In comparison to grassland and woodland, the potential of certain types of arable land to store carbon is significantly lower. As a result, the amount of carbon that can be stored would gradually decrease if this scenario plays out. According to the UTD scenario, the constraints on UGD slow down the speed of urban expansion, which provides a balanced development space for both ecological land and area that may be productively utilised. As a consequence of this, the pattern of dwindling carbon storage is halted and brought under control. According to the WLC scenario, the pace of expansion for both arable land and construction land is slowed down as a result of the tight enforcement of ecological protection borders. This results in a consistent expansion in biological land such as woodland and grassland, which leads to a small increase in carbon storage while preserving stability.
In general, the findings of this study emphasise the positive effects of the WLC scenario in balancing land use and carbon storage under the development concept of NbS, providing important policy references for adopting sustainable natural solutions.

5.3. Impact of Land Use on Carbon Stock

Under different development scenarios, diverse land use changes have yielded significant impacts on ecosystem carbon storage. For instance, urban expansion has led to carbon storage losses in ecosystems, while the “Grain for Green” project contributes to increased carbon storage.
In this study, regarding the changes in land use and carbon storage in TGRA, the area of water and construction land saw a significant increase from 2005 to 2020. This expansion led to the encroachment on the existing woodland and grassland, resulting in a loss of carbon storage in the ecosystem. This finding aligns with the research by Fan et al. [57], which estimated the carbon storage changes in different land use types in the TGRA from 1990 to 2015.
Building on the existing research, there is evidence to suggest that the adoption of various measures through NbS can effectively enhance the carbon sequestration capacity and increase carbon storage. Taking the example of restoring forest ecosystems and enhancing their carbon uptake capacity, previous studies have confirmed the effectiveness of this approach [59,82]. Similarly, strengthening grassland and wetland conservation to enhance carbon sequestration capability is also an effective strategy [83,84]. These measures not only alleviate the impacts of climate change but also promote the sustainable development of ecosystems, providing strong support for achieving the dual carbon goals. In the WLC scenario set in this study, the minimum amount of ecosystem carbon loss is observed. From the perspective of ensuring the stability of the ecosystem and the carrying capacity of natural resources, the government needs to strictly demarcate ecological conservation boundaries. It is necessary to strengthen ecological environment monitoring and governance, and enhance the resilience and recovery capacity of the ecosystem. Meanwhile, it is crucial to avoid excessive urban development, protect and reasonably utilise land types with high carbon storage, thereby enhancing the carbon sequestration capacity of the regional ecosystem.

5.4. Limitations and Improvements

In comparison to frequently used single models such as CLUE-S and PLUS [85,86], this study combines the benefits of quantitative and spatial prediction to build the RF–Markov–CA coupled model. The Markov–CA model in this model combines the RF algorithm’s high-precision screening mechanism, considerably minimising the effect of subjective elements and more correctly simulating complicated land transformation situations, hence enhancing the simulation accuracy. Meanwhile, the InVEST model can estimate the influence of various types of land use changes on carbon storage intuitively.
This study does, however, have drawbacks. On the one hand, the RF–Markov–CA model predicts future land use using historical land use data, but it does not account for changes in future population and economic structure, which may result in discrepancies between simulation findings and real evolutions. As a result, in future studies, socioeconomic elements must be introduced to improve the model’s forecast accuracy. The carbon density values in this work, on the other hand, are based on modified results from prior research and lack complete support from field measurements. This might lead to inaccuracies in analysing the spatiotemporal patterns of carbon storage changes. As a result, future studies should use a mix of field sampling surveys to completely analyse the effect of plant growth and internal land use structure on carbon storage, therefore improving the accuracy of carbon density measurements.

6. Conclusions

Taking the Three Gorges Reservoir Area (TGRA) as an example, to explore the potential impact of land use on carbon storage, this study innovatively proposes a comprehensive approach combining the random forest algorithm, Markov–CA model, and InVEST model. Based on the concept of Nature-Based Solutions (NbS), we set up four different scenarios: Business as Usual (BAU), Woodland Conservation (WLC), Arable Land Conservation (ALC), and Urban Transformation and Development (UTD). Using the RF–Markov–CA model, we simulated the spatial patterns of land use for 2025 and 2030. Simultaneously, the InVEST model was employed to evaluate carbon storage from 2005 to 2025. Finally, the optimal scenario for sustainable land use development was determined.
The rapid expansion of urban and arable land has led to a loss of ecosystem carbon storage in the TGRA. Between 2005 and 2020, the area of construction land in the TGRA increased by 1748.88 km2, resulting in a carbon storage loss of 2.21 Tg. From 2020 to 2030, under the BAU scenario, both arable land and construction land saw the largest increases, with increments of 3895.83 km2 and 2048.30 km2, respectively. In this scenario, the projected carbon loss is estimated to reach 19.21 Tg. Therefore, to enhance the carbon absorption capacity in the TGRA and effectively mitigate carbon storage loss, the government needs to implement corresponding ecological restoration policies, such as forest protection, grassland restoration, and wetland rehabilitation.
In a comprehensive comparison of four scenarios, the carbon stock increases the most in the WLC scenario from 2020 to 2030, with a gain of 0.07 Tg, while the carbon stocks in the other scenarios all experience losses. Meanwhile, the area of ecological land, such as woodland and grassland, increases the most, showing a progressive decrease in the human exploitation of natural space. This scenario consistently improves the capacity for ecological carbon sequestration, successfully fostering an increase in the TGRA’s carbon storage and playing a significant role in mitigating catastrophic climate change and achieving carbon neutrality goals.

Author Contributions

Conceptualization, G.L. (Guiyuan Li), G.C. and G.L. (Guohua Liu); methodology, G.L. (Guiyuan Li), G.C., G.L. (Guohua Liu) and Y.H.; software, G.C.; investigation, G.C. and C.C.; data curation, G.C. and C.C.; writing—original draft preparation, G.L. (Guiyuan Li), G.C. and G.L. (Guohua Liu); writing—review and editing, G.L. (Guiyuan Li), G.L. (Guohua Liu) and Y.H.; visualization, G.C.; supervision, G.L. (Guiyuan Li); funding acquisition, G.L. (Guiyuan Li). All authors have read and agreed to the published version of the manuscript.

Funding

This research was funded by the National Natural Science Foundation of China: “Research on Multidimensional Coupling Enhancement of the Resilience of the ‘City-Rural’ Space Complex Giant System in the Three Gorges Reservoir Area” (52078193) and the Doctoral Fund of Hubei University of Technology: “Study on the vulnerability multi-dimensional coupling coercion of the complex system of ‘city-town’ space in the Three Gorges reservoir area” (BSQD2020047).

Data Availability Statement

The case analysis data used to support the findings of this study are available from the corresponding author upon request.

Acknowledgments

Special thanks to the municipal and county-level government departments in the Hubei and Chongqing Sections of the Three Gorges Reservoir Area for providing statistical data.

Conflicts of Interest

The authors declare no conflict of interest.

References

  1. IPCC. Global Warming of 1.5 °C: IPCC Special Report on Impacts of Global Warming of 1.5 °C above Pre-Industrial Levels in Context of Strengthening Response to Climate Change, Sustainable Development, and Efforts to Eradicate Poverty; Cambridge University Press: Cambridge, UK, 2022; ISBN 978-1-00-915794-0. [Google Scholar]
  2. Benyus, J.M. Biomimicry: Innovation Inspired by Nature; Morrow: New York, NY, USA, 1997. [Google Scholar]
  3. MacKinnon, K.; Sobrevila, C.; Hickey, V. Biodiversity, Climate Change, and Adaptation: Nature-Based Solutions from the World Bank Portfolio; The World Bank: Washington, DC, USA, 2008. [Google Scholar]
  4. Mittermeier, R.A.; Totten, M.; Ledwith Pennypacker, L.; Boltz, F.; Prickett, G.; Midgley, G.F.; Mittermeier, C.G.; Rodríguez, C.M.; Brooks, T.; Hannah, L.; et al. A Climate for Life: Meeting the Global Challenge; Conservation International: Arlington, VA, USA, 2008. [Google Scholar]
  5. Viti, M.; Löwe, R.; Sørup, H.J.D.; Rasmussen, M.; Arnbjerg-Nielsen, K.; McKnight, U.S. Knowledge Gaps and Future Research Needs for Assessing the Non-Market Benefits of Nature-Based Solutions and Nature-Based Solution-like Strategies. Sci. Total Environ. 2022, 841, 156636. [Google Scholar] [CrossRef]
  6. Seddon, N.; Smith, A.; Smith, P.; Key, I.; Chausson, A.; Girardin, C.; House, J.; Srivastava, S.; Turner, B. Getting the Message Right on Nature-Based Solutions to Climate Change. Glob. Chang. Biol. 2021, 27, 1518–1546. [Google Scholar] [CrossRef] [PubMed]
  7. Keesstra, S.; Nunes, J.; Novara, A.; Finger, D.; Avelar, D.; Kalantari, Z.; Cerdà, A. The Superior Effect of Nature Based Solutions in Land Management for Enhancing Ecosystem Services. Sci. Total Environ. 2018, 610–611, 997–1009. [Google Scholar] [CrossRef]
  8. Fernandes, J.P.; Guiomar, N. Nature-Based Solutions: The Need to Increase the Knowledge on Their Potentialities and Limits. Land Degrad. Dev. 2018, 29, 1925–1939. [Google Scholar] [CrossRef]
  9. Bush, J.; Doyon, A. Building Urban Resilience with Nature-Based Solutions: How Can Urban Planning Contribute? Cities 2019, 95, 102483. [Google Scholar] [CrossRef]
  10. Cohen-Shacham, E.; Andrade, A.; Dalton, J.; Dudley, N.; Jones, M.; Kumar, C.; Maginnis, S.; Maynard, S.; Nelson, C.R.; Renaud, F.G.; et al. Core Principles for Successfully Implementing and Upscaling Nature-Based Solutions. Environ. Sci. Policy 2019, 98, 20–29. [Google Scholar] [CrossRef]
  11. Scott, N.A.; Tate, K.R.; Ford-Robertson, J.; Giltrap, D.J.; Smith, C.T. Soil Carbon Storage in Plantation Forests and Pastures: Land-Use Change Implications. Tellus B Chem. Phys. Meteorol. 1999, 51, 326–335. [Google Scholar] [CrossRef]
  12. Liu, J.; Yan, Q.; Zhang, M. Ecosystem Carbon Storage Considering Combined Environmental and Land-Use Changes in the Future and Pathways to Carbon Neutrality in Developed Regions. Sci. Total Environ. 2023, 903, 166204. [Google Scholar] [CrossRef] [PubMed]
  13. Wang, X.J.; Chen, Y.; Qi, P.; Zhang, R.Z. Study on land use structure in Zhangye city base on information entropy and grey prediction. Ganhanqu Yanjiu Arid Zone Res. 2011, 28, 92–97. [Google Scholar] [CrossRef]
  14. Weichenthal, S.; Ryswyk, K.V.; Goldstein, A.; Bagg, S.; Shekkarizfard, M.; Hatzopoulou, M. A Land Use Regression Model for Ambient Ultrafine Particles in Montreal, Canada: A Comparison of Linear Regression and a Machine Learning Approach. Environ. Res. 2016, 146, 65–72. [Google Scholar] [CrossRef]
  15. Guo, X.; Ye, J.; Hu, Y. Analysis of Land Use Change and Driving Mechanisms in Vietnam during the Period 2000–2020. Remote Sens. 2022, 14, 1600. [Google Scholar] [CrossRef]
  16. Singh, V.G.; Singh, S.K.; Kumar, N.; Singh, R.P. Simulation of Land Use/Land Cover Change at a Basin Scale Using Satellite Data and Markov Chain Model. Geocarto Int. 2022, 37, 11339–11364. [Google Scholar] [CrossRef]
  17. Thiam, S.; Salas, E.A.L.; Hounguè, N.R.; Almoradie, A.D.S.; Verleysdonk, S.; Adounkpe, J.G.; Komi, K. Modelling Land Use and Land Cover in the Transboundary Mono River Catchment of Togo and Benin Using Markov Chain and Stakeholder’s Perspectives. Sustainability 2022, 14, 4160. [Google Scholar] [CrossRef]
  18. Talukdar, S.; Singha, P.; Mahato, S.; Shahfahad; Pal, S.; Liou, Y.-A.; Rahman, A. Land-Use Land-Cover Classification by Machine Learning Classifiers for Satellite Observations—A Review. Remote Sens. 2020, 12, 1135. [Google Scholar] [CrossRef]
  19. Gharaibeh, A.; Shaamala, A.; Obeidat, R.; Al-Kofahi, S. Improving Land-Use Change Modeling by Integrating ANN with Cellular Automata-Markov Chain Model. Heliyon 2020, 6, e05092. [Google Scholar] [CrossRef] [PubMed]
  20. Karadeniz, E.; Sunbul, F. Land Use and Land Cover Change in Duzce Region Following the Major Earthquake: Implications for ANN and Markov Chain Analysis. Environ. Earth Sci 2023, 82, 243. [Google Scholar] [CrossRef]
  21. Mansour, S.; Al-Belushi, M.; Al-Awadhi, T. Monitoring Land Use and Land Cover Changes in the Mountainous Cities of Oman Using GIS and CA-Markov Modelling Techniques. Land Use Policy 2020, 91, 104414. [Google Scholar] [CrossRef]
  22. Rahnama, M.R. Forecasting Land-Use Changes in Mashhad Metropolitan Area Using Cellular Automata and Markov Chain Model for 2016–2030. Sustain. Cities Soc. 2021, 64, 102548. [Google Scholar] [CrossRef]
  23. Islam, S.; Li, Y.; Ma, M.; Chen, A.; Ge, Z. Simulation and Prediction of the Spatial Dynamics of Land Use Changes Modelling Through CLUE-S in the Southeastern Region of Bangladesh. J. Indian Soc. Remote Sens. 2021, 49, 2755–2777. [Google Scholar] [CrossRef]
  24. Liao, G.; He, P.; Gao, X.; Lin, Z.; Huang, C.; Zhou, W.; Deng, O.; Xu, C.; Deng, L. Land Use Optimization of Rural Production–Living–Ecological Space at Different Scales Based on the BP–ANN and CLUE–S Models. Ecol. Indic. 2022, 137, 108710. [Google Scholar] [CrossRef]
  25. Nasiakou, S.; Vrahnakis, M.; Chouvardas, D.; Mamanis, G.; Kleftoyanni, V. Land Use Changes for Investments in Silvoarable Agriculture Projected by the CLUE-S Spatio-Temporal Model. Land 2022, 11, 598. [Google Scholar] [CrossRef]
  26. Regmi, R.R.; Saha, S.K.; Subedi, D.S. Geospatial Analysis of Land Use Land Cover Change Modeling in Phewa Lake Watershed of Nepal by Using GEOMOD Model. Himal. Phys. 2017, 65–72. [Google Scholar] [CrossRef]
  27. Naseri Rad, S.; Naghavi, H.; Soosani, J.; Nouredini, S.A.; Vafaei, S. Investigating the Transmission Potential of Land Use and Land Cover Using Similarity Weighted Instance Based Learning, Logistic Regression and Geomod Methods (Case Study: Bastam Basin, Selseleh City). J. Environ. Sci. Technol. 2021, 22, 121–133. [Google Scholar]
  28. Aliani, H.; Malmir, M.; Sourodi, M.; Kafaky, S.B. Change Detection and Prediction of Urban Land Use Changes by CA–Markov Model (Case Study: Talesh County). Environ. Earth Sci. 2019, 78, 546. [Google Scholar] [CrossRef]
  29. Nasehi, S.; Namin, A.I.; Salehi, E. Simulation of Land Cover Changes in Urban Area Using CA-MARKOV Model (Case Study: Zone 2 in Tehran, Iran). Model. Earth Syst. Environ. 2019, 5, 193–202. [Google Scholar] [CrossRef]
  30. Wang, Q.; Liu, D.; Gao, F.; Zheng, X.; Shang, Y. A Partitioned and Heterogeneous Land-Use Simulation Model by Integrating CA and Markov Model. Land 2023, 12, 409. [Google Scholar] [CrossRef]
  31. Xu, F.; Wang, X.; Li, L. NPP and Vegetation Carbon Sink Capacity Estimation of Urban Green Space Using the Optimized CASA Model: A Case Study of Five Chinese Cities. Atmosphere 2023, 14, 1161. [Google Scholar] [CrossRef]
  32. Song, J.; Zhang, R.; Wang, Y.; Huang, J. Evolution Characteristics of Wetland Landscape Pattern and Its Impact on Carbon Sequestration in Wuhan from 2000 to 2020. Land 2023, 12, 582. [Google Scholar] [CrossRef]
  33. Wang, Z. Estimating of Terrestrial Carbon Storage and Its Internal Carbon Exchange under Equilibrium State. Ecol. Model. 2019, 401, 94–110. [Google Scholar] [CrossRef]
  34. Niu, Z.; He, H.; Peng, S.; Ren, X.; Zhang, L.; Gu, F.; Zhu, G.; Peng, C.; Li, P.; Wang, J.; et al. A Process-Based Model Integrating Remote Sensing Data for Evaluating Ecosystem Services. J. Adv. Model. Earth Syst. 2021, 13, e2020MS002451. [Google Scholar] [CrossRef]
  35. Babbar, D.; Areendran, G.; Sahana, M.; Sarma, K.; Raj, K.; Sivadas, A. Assessment and Prediction of Carbon Sequestration Using Markov Chain and InVEST Model in Sariska Tiger Reserve, India. J. Clean. Prod. 2021, 278, 123333. [Google Scholar] [CrossRef]
  36. Wang, Z.; Li, X.; Mao, Y.; Li, L.; Wang, X.; Lin, Q. Dynamic Simulation of Land Use Change and Assessment of Carbon Storage Based on Climate Change Scenarios at the City Level: A Case Study of Bortala, China. Ecol. Indic. 2022, 134, 108499. [Google Scholar] [CrossRef]
  37. Wu, S.; Li, J.; Zhou, W.; Lewis, B.J.; Yu, D.; Zhou, L.; Jiang, L.; Dai, L. A Statistical Analysis of Spatiotemporal Variations and Determinant Factors of Forest Carbon Storage under China’s Natural Forest Protection Program. J. For. Res. 2018, 29, 415–424. [Google Scholar] [CrossRef]
  38. Zhao, M.; Yue, T.; Zhao, N.; Sun, X.; Zhang, X. Combining LPJ-GUESS and HASM to Simulate the Spatial Distribution of Forest Vegetation Carbon Stock in China. J. Geogr. Sci. 2014, 24, 249–268. [Google Scholar] [CrossRef]
  39. Peng, K.; Jiang, W.; Deng, Y.; Liu, Y.; Wu, Z.; Chen, Z. Simulating Wetland Changes under Different Scenarios Based on Integrating the Random Forest and CLUE-S Models: A Case Study of Wuhan Urban Agglomeration. Ecol. Indic. 2020, 117, 106671. [Google Scholar] [CrossRef]
  40. Peng, K.; Jiang, W.; Ling, Z.; Hou, P.; Deng, Y. Evaluating the Potential Impacts of Land Use Changes on Ecosystem Service Value under Multiple Scenarios in Support of SDG Reporting: A Case Study of the Wuhan Urban Agglomeration. J. Clean. Prod. 2021, 307, 127321. [Google Scholar] [CrossRef]
  41. Wang, J.N.; Zhang, Z. Land Use Change and Simulation Analysis in the Northern Margin of the Qaidam Basin Based on Markov-PLUS Model. J. Northwest For. Univ 2022, 37, 139–148. [Google Scholar]
  42. Wu, L.; Zhu, M.; Zhang, G.; Yang, R. Simulation of Land Use Changes in Jiaodong Peninsular Based on the Logistic-CA-Markov Model. J. Phys. Conf. Ser. 2020, 1622, 012092. [Google Scholar] [CrossRef]
  43. Xie, H.; He, Y.; Choi, Y.; Chen, Q.; Cheng, H. Warning of Negative Effects of Land-Use Changes on Ecological Security Based on GIS. Sci. Total Environ. 2020, 704, 135427. [Google Scholar] [CrossRef]
  44. Zhang, X.; Zhou, J.; Song, W. Simulating Urban Sprawl in China Based on the Artificial Neural Network-Cellular Automata-Markov Model. Sustainability 2020, 12, 4341. [Google Scholar] [CrossRef]
  45. Gong, L.; Zhang, X.; Pan, G.; Zhao, J.; Zhao, Y. Hydrological Responses to Co-Impacts of Climate Change and Land Use/Cover Change Based on CMIP6 in the Ganjiang River, Poyang Lake Basin. Anthropocene 2023, 41, 100368. [Google Scholar] [CrossRef]
  46. Zhang, X.; Zhou, Q.; Wang, Z.; Wang, F. Simulation and Prediction of Land Use Change in Three Gorges Reservoir Area Based on MCE-CA-Markov. Trans. Chin. Soc. Agric. Eng. 2017, 33, 268–277. [Google Scholar]
  47. Wang, Q.; Wang, H. An Integrated Approach of Logistic-MCE-CA-Markov to Predict the Land Use Structure and Their Micro-Spatial Characteristics Analysis in Wuhan Metropolitan Area, Central China. Environ. Sci. Pollut. Res. 2022, 29, 30030–30053. [Google Scholar] [CrossRef]
  48. Schoppa, L.; Disse, M.; Bachmair, S. Evaluating the Performance of Random Forest for Large-Scale Flood Discharge Simulation. J. Hydrol. 2020, 590, 125531. [Google Scholar] [CrossRef]
  49. Chen, C.-C.; Wang, Y.-R.; Yeh, H.-Y.; Lin, T.-H.; Huang, C.-S.; Wu, C.-F. Estimating Monthly PM2.5 Concentrations from Satellite Remote Sensing Data, Meteorological Variables, and Land Use Data Using Ensemble Statistical Modeling and a Random Forest Approach. Environ. Pollut. 2021, 291, 118159. [Google Scholar] [CrossRef] [PubMed]
  50. Li, G.; Cheng, G.; Wu, Z.; Liu, X. Coupling Coordination Research on Disaster-Adapted Resilience of Modern Infrastructure System in the Middle and Lower Section of the Three Gorges Reservoir Area. Sustainability 2022, 14, 14514. [Google Scholar] [CrossRef]
  51. GB/T 21010-2017; Current Land Use Classification. Standardization Administration of China: Beijing, China, 2017.
  52. Liu, J.; Liu, M.; Deng, X.; Zhuang, D.; Zhang, Z.; Luo, D. The Land Use and Land Cover Change Database and Its Relative Studies in China. J. Geogr. Sci. 2002, 12, 275–282. [Google Scholar] [CrossRef]
  53. Xu, X.L.; Liu, J.; Zhuang, D. Remote Sensing Monitoring Methods of Land Use/Cover Change in National Scale. J. Anhui Agric. Sci 2012, 40, 2365–2369. [Google Scholar]
  54. Xu, L.; He, N.; Yu, G. A Dataset of Carbon Density in Chinese Terrestrial Ecosystems (2010s). China Sci. Data 2019, 4, 90–96. [Google Scholar]
  55. Wang, P.C.; Xing, L.J.; Xiao, W.F.; Huang, Z.L.; Pan, L.; Zeng, L. Organic Carbon Density and Storage of Forest Ecosystems in Three Gorges Reservoir Area. Acta Ecol. Sin. 2009, 29, 97–107. [Google Scholar]
  56. Chen, J. Study on Storage and Evolution Trend of Soil Organic Carbon in Cropland in Chongqing City. Ph.D. Thesis, South West University, Chongqing, China, 2013. (In Chinese). [Google Scholar]
  57. Fan, L.; Zhu, J.; Li, Q.; Feng, Y.; Xiao, W. Effects of Changes in Land Use and Cover on Carbon Storage in the Three Gorges Reservoir Area. J. Nanjing For. Univ. 2018, 61, 53. [Google Scholar] [CrossRef]
  58. Mao, Y.; Zhou, Q.; Wang, T.; Luo, H.; Wu, L. Spatial–Temporal Variation of Carbon Storage and Its Quantitative Attribution in the Three Gorges Reservoir Area Coupled with PLUS—InVEST Geodector Model. Resour. Environ. Yangtze Basin 2023, 32, 1042–1057. [Google Scholar]
  59. Wang, J.; Zhang, Q.; Gou, T.; Mo, J.; Wang, Z.; Gao, M. Spatial-Temporal Changes of Urban Areas and Terrestrial Carbon Storage in the Three Gorges Reservoir in China. Ecol. Indic. 2018, 95, 343–352. [Google Scholar] [CrossRef]
  60. Huang, C.D. Characteristics of Carbon Stock and Its Spatial Differentiation in the Forest Ecosystem of Sichuan. Ph.D. Thesis, Sichuan Agricultural University, Ya’an, China, 2008. (In Chinese). [Google Scholar]
  61. Wang, C.; Li, T.; Guo, X.; Xia, L.; Lu, C.; Wang, C. Plus-InVEST Study of the Chengdu-Chongqing Urban Agglomeration’s Land-Use Change and Carbon Storage. Land 2022, 11, 1617. [Google Scholar] [CrossRef]
  62. Wan, Q.; Shao, J. Land Use and Carbon Storage Estimation in Chongqing Section of the Three Gorges Reservoir Area from 2000 to 2020. J. Chongqing Norm. Univ. Nat. Sci. 2023, 1–11. [Google Scholar]
  63. Li, K.; Wang, S.; Cao, M. Vegetation and Soil Carbon Storage in China. Sci. China Ser. D Earth Sci. 2004, 47, 49–57. [Google Scholar] [CrossRef]
  64. Mathewos, M.; Lencha, S.M.; Tsegaye, M. Land Use and Land Cover Change Assessment and Future Predictions in the Matenchose Watershed, Rift Valley Basin, Using CA-Markov Simulation. Land 2022, 11, 1632. [Google Scholar] [CrossRef]
  65. Fu, F.; Deng, S.; Wu, D.; Liu, W.; Bai, Z. Research on the Spatiotemporal Evolution of Land Use Landscape Pattern in a County Area Based on CA-Markov Model. Sustain. Cities Soc. 2022, 80, 103760. [Google Scholar] [CrossRef]
  66. da Cunha, E.R.; Santos, C.A.G.; da Silva, R.M.; Bacani, V.M.; Pott, A. Future Scenarios Based on a CA-Markov Land Use and Land Cover Simulation Model for a Tropical Humid Basin in the Cerrado/Atlantic Forest Ecotone of Brazil. Land Use Policy 2021, 101, 105141. [Google Scholar] [CrossRef]
  67. Liang, X.; Liu, X.; Li, D.; Zhao, H.; Chen, G. Urban Growth Simulation by Incorporating Planning Policies into a CA-Based Future Land-Use Simulation Model. Int. J. Geogr. Inf. Sci. 2018, 32, 2294–2316. [Google Scholar] [CrossRef]
  68. Jiao, M.; Hu, M.; Xia, B. Spatiotemporal Dynamic Simulation of Land-Use and Landscape-Pattern in the Pearl River Delta, China. Sustain. Cities Soc. 2019, 49, 101581. [Google Scholar] [CrossRef]
  69. Liu, D.; Zheng, X.; Wang, H. Land-Use Simulation and Decision-Support System (LandSDS): Seamlessly Integrating System Dynamics, Agent-Based Model, and Cellular Automata. Ecol. Model. 2020, 417, 108924. [Google Scholar] [CrossRef]
  70. Guan, D.; Zhao, Z.; Tan, J. Dynamic Simulation of Land Use Change Based on Logistic-CA-Markov and WLC-CA-Markov Models: A Case Study in Three Gorges Reservoir Area of Chongqing, China. Environ. Sci Pollut Res 2019, 26, 20669–20688. [Google Scholar] [CrossRef] [PubMed]
  71. Breiman, L. Random Forests. Mach. Learn. 2001, 45, 5–32. [Google Scholar] [CrossRef]
  72. Talukdar, S.; Eibek, K.U.; Akhter, S.; Ziaul, S.; Towfiqul Islam, A.R.M.; Mallick, J. Modeling Fragmentation Probability of Land-Use and Land-Cover Using the Bagging, Random Forest and Random Subspace in the Teesta River Basin, Bangladesh. Ecol. Indic. 2021, 126, 107612. [Google Scholar] [CrossRef]
  73. Oukawa, G.Y.; Krecl, P.; Targino, A.C. Fine-Scale Modeling of the Urban Heat Island: A Comparison of Multiple Linear Regression and Random Forest Approaches. Sci. Total Environ. 2022, 815, 152836. [Google Scholar] [CrossRef]
  74. Kulithalai Shiyam Sundar, P.; Deka, P.C. Spatio-Temporal Classification and Prediction of Land Use and Land Cover Change for the Vembanad Lake System, Kerala: A Machine Learning Approach. Environ. Sci Pollut Res 2022, 29, 86220–86236. [Google Scholar] [CrossRef]
  75. Svoboda, J.; Štych, P.; Laštovička, J.; Paluba, D.; Kobliuk, N. Random Forest Classification of Land Use, Land-Use Change and Forestry (LULUCF) Using Sentinel-2 Data—A Case Study of Czechia. Remote Sens. 2022, 14, 1189. [Google Scholar] [CrossRef]
  76. Yang, D.; Liu, W.; Tang, L.; Chen, L.; Li, X.; Xu, X. Estimation of Water Provision Service for Monsoon Catchments of South China: Applicability of the InVEST Model. Landsc. Urban Plan. 2019, 182, 133–143. [Google Scholar] [CrossRef]
  77. Yin, G.; Wang, X.; Zhang, X.; Fu, Y.; Hao, F.; Hu, Q. InVEST Model-Based Estimation of Water Yield in North China and Its Sensitivities to Climate Variables. Water 2020, 12, 1692. [Google Scholar] [CrossRef]
  78. Zhong, L.; Wang, J. Evaluation on Effect of Land Consolidation on Habitat Quality Based on InVEST Model. Trans. Chin. Soc. Agric. Eng. 2017, 33, 250–255. [Google Scholar]
  79. Zhao, M.; He, Z.; Du, J.; Chen, L.; Lin, P.; Fang, S. Assessing the Effects of Ecological Engineering on Carbon Storage by Linking the CA-Markov and InVEST Models. Ecol. Indic. 2019, 98, 29–38. [Google Scholar] [CrossRef]
  80. Li, Y.; Liu, Z.; Li, S.; Li, X. Multi-Scenario Simulation Analysis of Land Use and Carbon Storage Changes in Changchun City Based on FLUS and InVEST Model. Land 2022, 11, 647. [Google Scholar] [CrossRef]
  81. He, C.; Zhang, D.; Huang, Q.; Zhao, Y. Assessing the Potential Impacts of Urban Expansion on Regional Carbon Storage by Linking the LUSD-Urban and InVEST Models. Environ. Model. Softw. 2016, 75, 44–58. [Google Scholar] [CrossRef]
  82. Xi, F.; Lin, G.; Zhao, Y.; Li, X.; Chen, Z.; Cao, C. Land Use Optimization and Carbon Storage Estimation in the Yellow River Basin, China. Sustainability 2023, 15, 11278. [Google Scholar] [CrossRef]
  83. Ji, H.; Han, J.; Xue, J.; Hatten, J.A.; Wang, M.; Guo, Y.; Li, P. Soil Organic Carbon Pool and Chemical Composition under Different Types of Land Use in Wetland: Implication for Carbon Sequestration in Wetlands. Sci. Total Environ. 2020, 716, 136996. [Google Scholar] [CrossRef] [PubMed]
  84. Liang, Y.; Hashimoto, S.; Liu, L. Integrated Assessment of Land-Use/Land-Cover Dynamics on Carbon Storage Services in the Loess Plateau of China from 1995 to 2050. Ecol. Indic. 2021, 120, 106939. [Google Scholar] [CrossRef]
  85. Mamanis, G.; Vrahnakis, M.; Chouvardas, D.; Nasiakou, S.; Kleftoyanni, V. Land Use Demands for the CLUE-S Spatiotemporal Model in an Agroforestry Perspective. Land 2021, 10, 1097. [Google Scholar] [CrossRef]
  86. He, N.; Guo, W.; Wang, H.; Yu, L.; Cheng, S.; Huang, L.; Jiao, X.; Chen, W.; Zhou, H. Temporal and Spatial Variations in Landscape Habitat Quality under Multiple Land-Use/Land-Cover Scenarios Based on the PLUS-InVEST Model in the Yangtze River Basin, China. Land 2023, 12, 1338. [Google Scholar] [CrossRef]
Figure 1. Location, topography, and main provinces of TGRA.
Remotesensing 15 05100 g001
Figure 2. The analytical framework of the study.
Remotesensing 15 05100 g002
Figure 3. Land use distribution pattern in the TGRA (2005–2020).
Remotesensing 15 05100 g003
Figure 4. Land use proportion (A) and change trend (B) from 2005 to 2020.
Remotesensing 15 05100 g004
Figure 5. Sankey diagram of land use transition in the TGRA.
Remotesensing 15 05100 g005
Figure 6. Simulated land use results for the TGRA in 2025 under four scenarios.
Remotesensing 15 05100 g006
Figure 7. Simulated land use results for the TGRA in 2030 under four scenarios.
Remotesensing 15 05100 g007
Figure 8. Spatial distribution of carbon stock under different scenarios in 2025.
Remotesensing 15 05100 g008
Figure 9. Spatial distribution of carbon stock under different scenarios in 2030.
Remotesensing 15 05100 g009
Table 1. Remote sensing datasets of land use and driving factors.
CategoriesFactorsResolutionData SourcesTime (Year)
Land use dataLand use remote sensing monitoring data30 mRESDC2005, 2010, 2015, 2020
Natural geographic dataDEM30 mSRTM V32015
Elevation30 mCalculated from DEM data
Slope direction30 mCalculated from DEM data
NDVI30 mRESDC2020
Annual precipitation1 kmRESDC2020
Average annual temperature1 kmRESDC2020
Annual sunshine hours1 kmRESDC2020
Socioeconomic dataPopulation density100 mWorldPop2020
Nighttime lighting100 mNational Oceanic and Atmospheric Administration (NOAA), USA2020
Table 2. Classification of land use.
Land Use TypesDescriptionSources and References
Arable landPaddy field, drylandRESDC [52,53]
WoodlandForested land, shrubbery, sparse woodland
GrasslandGrasslands of various types with coverage rates exceeding 5%
WaterRiver, pond, lake, wetland
Construction landBuilt up areas, rural residential areas, large industrial zones
Unused landSandy areas, marshes, bare land, rocky areas, etc.
Table 3. Carbon density of different land types in the TGRA.
Type of Land UseCarbon Density of Above-Ground Vegetation BiomassCarbon Density of Below-Ground Vegetation BiomassCarbon Density of Soil Organic MatterCarbon Density of Dead Organic MatterReferences
Arable land3.390.6750.170.12[55,56,57,58,59]
Woodland28.475.8892.022.73[57,58,59,60,61,62]
Grassland1.414.1352.280.15[57,58,59,61,62,63]
Water0.000.000.000.00[57,58,59,61,62]
Construction land0.000.0025.250.00[57,58,59,61,62]
Unused land0.000.008.250.00[57,58,59,61,62]
Table 4. The model validation results of the Markov–CA, Logistic–Markov–CA and RF–Markov–CA models.
Land Use TypesArable LandWoodlandGrasslandWaterConstruction LandUnused Land
Actual area (km2)28,328.1337,138.587959.201477.132386.1619.15
Logistic–Markov–CAPredicted area (km2)30,282.7935,286.207644.851720.322344.8830.67
Error range (%)6.90−4.98−3.9516.46−1.7360.16
Kappa index0.8836
RF–Markov–CAPredicted area (km2)28,607.2536,556.038134.51502.422462.6628.05
Error range (%)0.99−1.572.201.713.2146.48
Kappa index0.9184
Table 5. Changes in land use types in the TGRA in 2025 under four scenarios.
Type of Land UseParameterBAU ScenarioWLC ScenarioALC ScenarioUTD Scenario
Arable landArea (km2)28,533.2127,013.1229,387.1329,124.68
Percentage of total area (%)36.9334.6737.6237.69
Rate of change (%)0.72−4.643.742.81
WoodlandArea (km2)36,465.2337,877.2036,357.3536,533.29
Percentage of total area (%)47.1948.6146.5447.28
Rate of change (%)−1.811.99−2.10−1.63
GrasslandArea (km2)7033.157844.157023.037059.26
Percentage of total area (%)9.1010.078.999.14
Rate of change (%)−11.64−1.45−14.27−11.31
WaterArea (km2)1463.381429.331547.761546.92
Percentage of total area (%)1.891.831.982.00
Rate of change (%)−0.93−3.244.784.72
Construction landArea (km2)3742.243735.113775.552992.14
Percentage of total area (%)4.844.794.833.87
Rate of change (%)56.8356.5358.238.63
Unused landArea (km2)34.3522.9827.4718.55
Percentage of total area (%)0.040.030.040.02
Rate of change (%)79.4220.0043.49−3.13
Table 6. Changes in land use types in the TGRA in 2030 under four scenarios.
Type of Land UseParameterBAU ScenarioWLC ScenarioALC ScenarioUTD Scenario
Arable landArea (km2)32,223.9626,023.4630,236.8030,800.52
Percentage of total area (%)41.5233.5839.0639.76
Rate of change (%)12.93−3.662.893.27
WoodlandArea (km2)34,281.2038,226.3635,414.0535,858.06
Percentage of total area (%)44.1749.3245.7446.29
Rate of change (%)−5.990.92−2.59−1.85
GrasslandArea (km2)5339.617584.306173.186524.28
Percentage of total area (%)6.889.797.978.42
Rate of change (%)−24.08−3.31−12.10−7.58
WaterArea (km2)1300.871442.901542.251550.51
Percentage of total area (%)1.681.861.992.00
Rate of change (%)−11.110.95−0.360.23
Construction landArea (km2)4434.474205.134031.462707.08
Percentage of total area (%)5.715.435.213.49
Rate of change (%)18.5012.586.784.43
Unused landArea (km2)31.2120.4920.6019.37
Percentage of total area (%)0.040.030.030.03
Rate of change (%)−9.14−10.82−25.024.41
Table 7. Changes in comprehensive carbon density and carbon storage in the TGRA from 2000 to 2020.
YearCarbon Density (Mg C/hm2)Total (Tg C)
200588.94687.81
201089.20689.78
201589.02688.38
202088.66685.60
Table 8. Simulation of comprehensive carbon density and carbon storage in the TGRA in 2025 and 2030.
ScenarioCarbon Density (Mg C/hm2)Total (Tg C)ScenarioCarbon Density (Mg C/hm2)Total (Tg C)
2025 BAU87.43676.092030 BAU85.33659.88
2025 WLC89.32690.732030 WLC88.67685.67
2025 ALC87.85679.362030 ALC87.34675.41
2025 UTD88.09681.222030 UTD87.97680.25
Disclaimer/Publisher’s Note: The statements, opinions and data contained in all publications are solely those of the individual author(s) and contributor(s) and not of MDPI and/or the editor(s). MDPI and/or the editor(s) disclaim responsibility for any injury to people or property resulting from any ideas, methods, instructions or products referred to in the content.

