
Evolution Characteristics of Wetland Landscape Pattern and Its Impact on Carbon Sequestration in Wuhan from 2000 to 2020
1
School of Urban Design, Wuhan University, Wuhan 430072, China
2
Hubei Habitat Environment Research Center of Engineering and Technology, Wuhan 430072, China
3
School of Art and Design, Wuhan University of Technology, Wuhan 430070, China
*
Author to whom correspondence should be addressed.
Land 2023, 12(3), 582; https://doi.org/10.3390/land12030582
Submission received: 27 January 2023
/
Revised: 22 February 2023
/
Accepted: 26 February 2023
/
Published: 28 February 2023
Abstract
:The wetland ecosystem is an important organic carbon pool on earth, and rich carbon storage and high carbon density are present in wetland vegetation and soil. However, large areas of wetlands have been drained, the area of wetlands has shrunk, and the degree of fragmentation has intensified due to rapid urbanization in the past 20 years. Enhancing ecological carbon sequestration capacity is a key task of carbon peaking and neutrality, and studying the carbon sequestration function of urban wetland is urgently needed. In this work, the wetland in Wuhan was taken as the main research object. The landscape pattern index of Wuhan wetland was calculated and the evolution characteristics of landscape pattern were analyzed using the remote sensing image interpretation data from 2000 to 2020. CASA model was used to estimate the carbon sequestration of wetlands and explore the spatial and temporal distribution pattern of carbon sequestration. Spearman correlation was used to study the effects of different landscape pattern parameters on carbon sequestration. Results indicate the following: (1) From 2000 to 2020, the total wetland area in Wuhan has been reduced by 158.99 km2, among which the area of lakes, reservoirs and marshes decreased by 60.65 km2, 55.51 km2 and 41.77 km2, respectively. The density of wetland patches and the degree of fragmentation and irregularity increased, and the LPI, aggregation degree and diversity decreased. (2) In the past 20 years, the total carbon sequestration amount of wetland in Wuhan first decreased and then increased, among which the carbon sequestration in wetland was the lowest in 2010 (571,900 t). The amount of carbon sequestration in 2020 was the same as that in 2000, reaching 800,000 t. (3) A larger wetland area means more concentrated and denser distribution, more complex shape, more diverse type, and stronger carbon sequestration capacity for Wuhan wetland. On the contrary, the distribution of wetlands becomes more fragmented and regular, and the disordered planning leads to the reduction in wetland types in a unit area, which will decrease the carbon sink capacity of urban wetlands.
1. Introduction
Wetland is a natural complex formed by the interaction of a land system and a water system [1]. This ecological system has the highest ecological service value and the strongest carbon sequestration capacity per unit area on the earth, and it is known as the “kidney of the Earth” [2]. Although wetlands cover only 5%–8% of the global land area, they store about 525 Gt of carbon; this amount accounts for about 35% of the global terrestrial carbon pool, which is important for responding and adapting to climate change. The low decomposition characteristics of wetland ecosystems make them the most efficient carbon sinks on Earth with the highest carbon storage per unit area among all terrestrial ecosystems [3]. However, human activities in the process of urbanization have seriously affected the wetland landscape pattern [4] and interfered with the carbon cycling process of wetland ecosystem [5]. As an increasing number of wetlands are drained, the decomposition rate of organic carbon in the soil is accelerated, the emission of greenhouse gases is increased, and the carbon sequestration function of wetlands is reduced.
In the current study on landscape pattern of urban wetland, Festus et al. [6] took the main watersheds and wetlands in the metropolitan area of Kansas City as the research object and used different indexes to reveal the fine-scale landscape structure of urban wetland at patch and landscape level. Rashid et al. [7] used multisource data to assess the changes in urban wetland landscape in the Himalayan region of Indian Kashmir in the past 50 years. Chinese scholars Gong [8] and Yi [9], respectively, analyzed the evolution characteristics and driving mechanism of wetland landscape pattern in Beijing and Shanghai based on years of historical remote sensing data. Studies on the carbon sequestration capacity of wetland can be mainly divided into field biomass investigation combined with remote sensing data estimation [10] and multi-source data estimation through models (such as CASA model [11], growth dynamics model [12], etc.). The CASA model is considered to be one of the most effective and widely used methods based on meteorological data and the light utilization rate of different vegetation [13]. Zhang et al. [14] estimated the NPP of Dongting Lake wetland using the CASA model and verified that there was a significant linear relationship with the measured NPP (). Yuan et al. [15] compared the characteristics of wetland NPP in different seasons based on the CASA model, and analyzed the influence of climate factors on carbon sequestration by wetland vegetation.
The research on influencing factors of wetland change mainly uses wetland ecological risk assessment methods [16], statistical and mechanical models (such as correlation analysis [17], boosted regression tree (BRT) [18], structural equation model(SEM) [19], etc.) to explore the driving forces of wetland area, distribution and landscape pattern change. The results show that socio-economic, biophysical, climatic and hydrological factors all have significant effects on wetland change. However, limited studies have been conducted on the influencing factors of wetland carbon sequestration function, and most research has focused on the influence of climate and environmental factors. For example, Jia et al. [20] used partial least squares (PLS) regression to analyze the influence of meteorological and hydrological factors on the carbon sequestration capacity of reed wetland, and the results showed that there was a significant correlation between temperature, precipitation, groundwater level and carbon absorption. Yang et al. [21] used correlation analysis to conclude that wetland degradation changed the environmental factors of Alpine wetland and thus weakened its carbon sequestration ability.
Wuhan is one of the megacities with the most abundant wetland resources in China, but the wetland is still facing pressure from degradation and fragmentation with the development of urbanization. Zheng [22], Chen [23] and other scholars analyzed the dynamic change characteristics of Wuhan wetland landscape in multiple periods based on remote sensing data, and concluded that rapid urbanization caused Wuhan wetland atrophy. Ma et al. [24] used the land carbon emission measurement model to analyze the change in lake land use and the indirect impact of carbon source and sink from 2005 to 2015. Chen et al. [25] selected relevant indexes representing wetland landscape fragmentation to discuss the impact of various wetland types on ecosystem service value in Wuhan from 2000 to 2015. However, the research on the carbon sequestration capacity of urban wetland landscape is far from sufficient in this critical period of the “double carbon” goal. This study aims to reveal the dynamic change characteristics and its rules for wetland landscape in the rapidly developing city by analyzing the key landscape pattern index of Wuhan wetland in recent 20 years. The optimized CASA model was used to more accurately estimate the annual carbon sequestration amount of wetland and explore the influencing factors of carbon sequestration from the perspective of landscape pattern. Accordingly, data support is provided for the evaluation of Wuhan wetland carbon sequestration ability and more scientific wetland restoration work.
2. Study Area
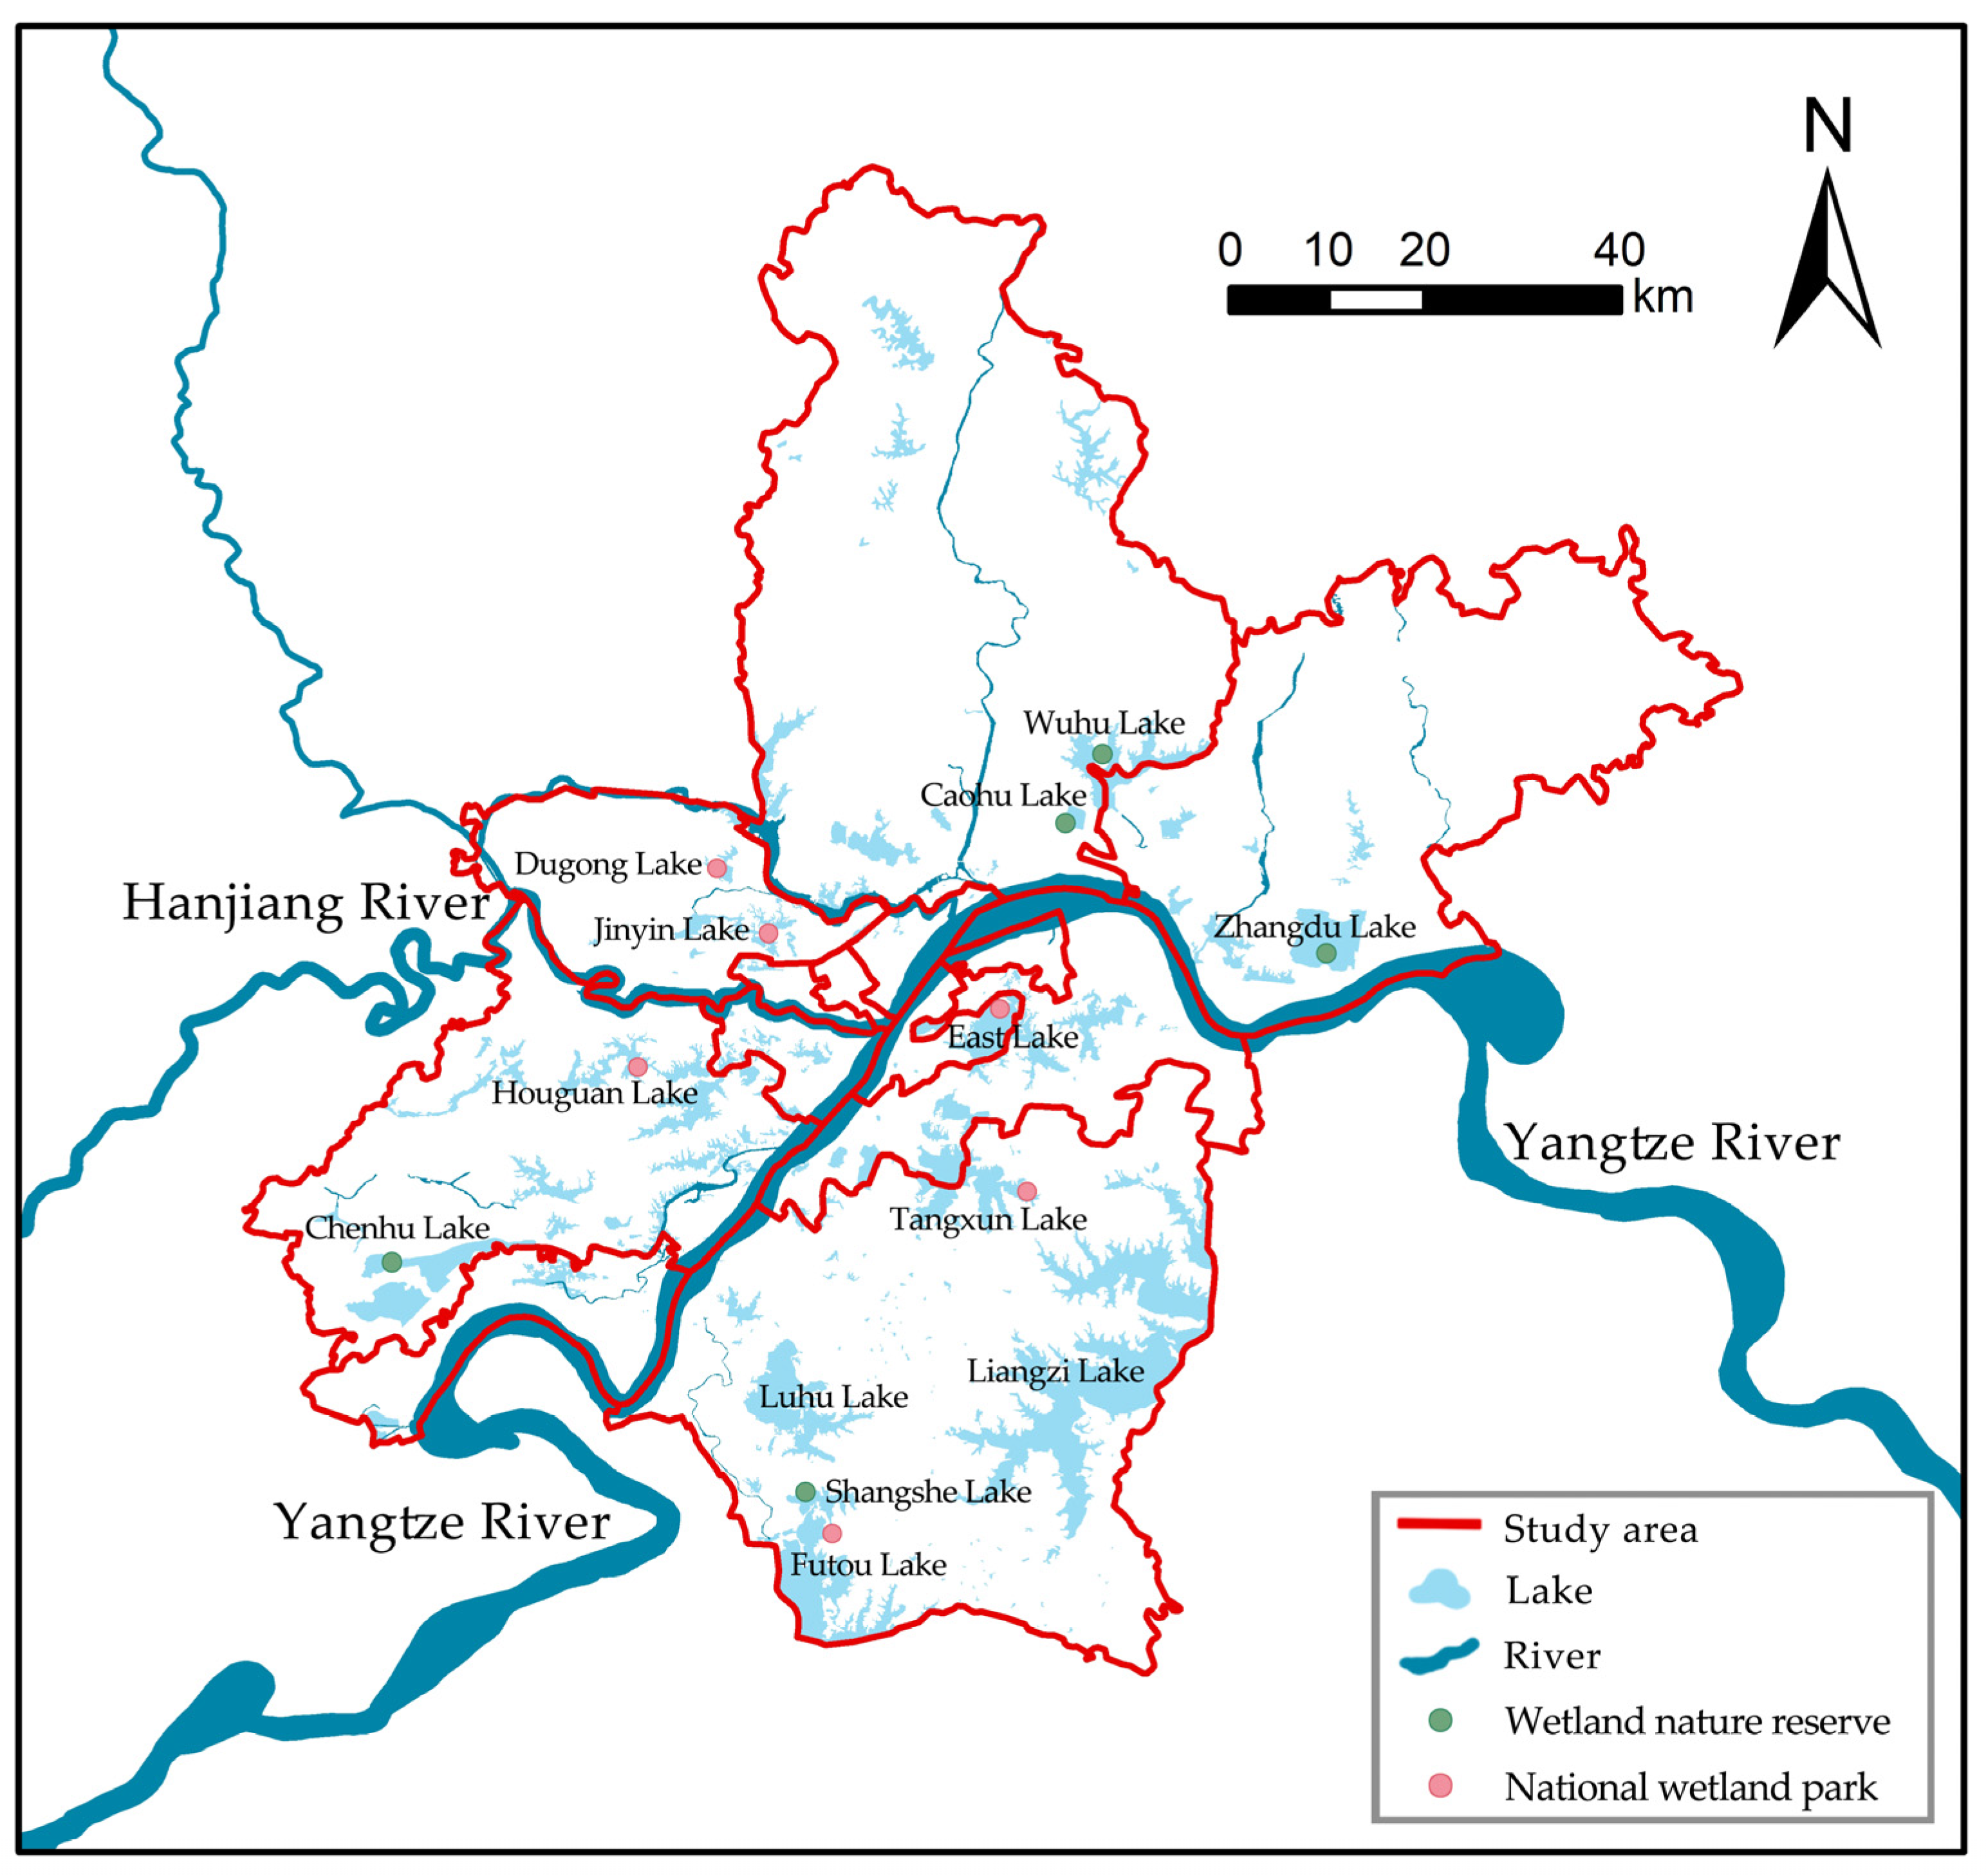
The study area is Wuhan City, and the geographical location is 25°59′ N–31°22′ N and 113°41′ E–115°05′ E (Figure 1). Wuhan, which is located in the east of Hubei Province, is a megacity on the middle reaches of the Yangtze River. The Yangtze River and its largest tributary, the Han River, meet in Wuhan. The city is interwoven with rivers, ports, and canals, and it is dotted with lakes, reservoirs, and ponds. The water area accounts for about a quarter of the total area of the city. Wuhan has built 5 wetland nature reserves (Chenhu Lake, Zhangdu Lake, Caohu Lake, Wuhu Lake, and Shangshe Lake), 6 national wetland parks (East Lake, Jinyin Lake, Anshan, Houguan Lake, Dugong Lake, and Canglong Island), and 4 provincial wetland parks (Suozihe River, Tonghu Lake, Zhuyanghai, and Mulan Huaxi). It has been rated as one of the three cities with the richest inland wetland resources in the world by National Geographic magazine [25]. In June 2022, Wuhan passed the certification as an “International Wetland City”. The 14th Conference of the Parties to the Convention on Wetlands was held in Wuhan in November 2022, and it was the first time that China had hosted such an international meeting.
As the core city of the Yangtze River Economic Belt, the resident population of Wuhan was 8.05 million by the end of 2000, which increased to 12.45 million by the end of 2020. In the rapid process of urbanization, human behavior such as construction and adjustment of land use layout have had a great impact on the wetland ecosystem [26]. Since the enactment of the “Wuhan Lake Protection Regulations” in 2001, the government began to pay more attention to the protection of wetlands in urban development. The newly released Wuhan Territorial Space Ecological Restoration Plan (2021–2035) aims to make Wuhan become the world’s most famous waterfront ecological city and realize full coverage for wetland protection. The study focuses on wetland landscape pattern and carbon sequestration in Wuhan in the past 20 years, which will be helpful in developing wetland ecological restoration strategies and exploring the symbiosis and coexistence mode of human, city and wetland in a rapidly developing city with a population of 10 million.
3. Materials and Methods
3.1. Materials
The basic data of this study are raster data of land use types in Wuhan for every 5 years from 2000 to 2020. The data with a spatial resolution of 30 m are obtained from the Data Center for Resources and Environmental Sciences, Chinese Academy of Sciences (http://www.resdc.cn/, accessed on 20 January 2023). These data are generated by visual interpretation based on remote sensing images, and the Kappa coefficient of interpretation accuracy is more than 80%, which meets the requirements of cartography. According to the principle of the same dominant function, wetland types are merged into five types: river wetland, lake wetland, reservoir and pond wetland, beach wetland, and marsh wetland.
The NDVI data used in the CASA model were calculated using Landsat8 TM/OLI images as the data source with a spatial resolution of 30 m. The meteorological data, including the monthly mean temperature, monthly mean precipitation, and the monthly total solar radiation of the meteorological station (a total of 46 stations), in and around the study area, were acquired from the China Meteorological Data Sharing Service System (http://cdc.nmic.cn, accessed on 20 January 2023). Combined with the elevation model of the study area with a spatial resolution of 30 m, the spatialized meteorological data were obtained by multiple linear regression method. After testing, the annual average relative error between the meteorological station observation data and spatial meteorological data was less than 0.05, which meets the requirements of this study. The annual net primary productivity (NPP) data of MOD17A3H product with a spatial resolution of 500 m were used for verification.
3.2. Methods
3.2.1. Landscape Pattern Index
On the basis of the previous research results [27,28] and in consideration of the characteristics of Wuhan wetland landscape, the wetland landscape pattern index was selected from the landscape scale level (Table 1). According to the interpretation results of wetland images in different years, FRAGSTATS4.2 software was used for comprehensive calculation.
This study used landscape indices from four dimensions, quantitative, structural, shape, and diversity characteristics, to comprehensively measure the landscape pattern of wetlands. At the level of wetland quantity, the total landscape area of wetland patch (TA) was utilized to reflect the area of wetland. The larger TA corresponds to larger wetland area. At the level of internal structure of wetland, the patch density (PD) and the aggregation index (AI) of wetland were applied to measure the relationship between the distribution of wetland and patches. At the wetland shape level, landscape shape index (LSI) and large patch index (LPI) were employed to reflect the regularity of wetland patches and the size of patch shape, respectively. At the level of wetland diversity, Shannon’s diversity index (SHDI) was used to represent landscape richness.
3.2.2. CASA Model
The carbon sequestration process in wetland vegetation is actually the process of transforming inorganic matter into organic matter through photosynthesis; thus, biomass is the core parameter for measuring the carbon sequestration and oxygen release capacity of wetland [29]. Plants need to absorb and fix 1.63 g of carbon dioxide per 1 g of dry matter (biomass). NPP refers to the total amount of organic matter produced by photosynthesis per unit area of green vegetation per unit time minus the remaining part of autotrophic respiration [30]. NPP in a certain period can be approximated as the increase in aboveground biomass in the inland during that period. The annual aboveground biomass of Wuhan wetland ecosystem can be obtained according to the monthly NPP accumulation.
The CASA model proposed by Potter et al. (1993) was used for NPP calculation. NPP (gC/(m2·month)) is the photosynthetic active radiation (APAR) (MJ/(m2·month)) and the light energy utilization epsilon (gC/MJ) of the product:
In the expression, t stands for time and x stands for spatial position.
In the expression, represents the total solar radiation at x for t month, MJ/(m2·month); is the APAR absorption ratio of vegetation layer, and a constant of 0.5 is the proportion of solar effective radiation that vegetation can use. and are independent parameters, is the normalized vegetation index, is the 5% percentile of all NDVI values, and is the 95% percentile of all NDVI values.
In the expression, and are temperature stress coefficients, and is the limiting effect on light energy utilization at low and high temperatures. When the average temperature for the month is less than or equal to −10 °C, . indicates that the accumulation of NPP will have a certain stress effect when the ambient temperature changes from the optimum temperature for vegetation growth to high or low temperature. When the difference between the average temperature and the optimum temperature is greater than 10 °C or less than −13 °C, . is the water stress coefficient, which reflects the effect of available water conditions on the utilization of light energy. and represent the actual and potential evaporation (mm) at x position in t month, respectively. is the maximum light energy utilization rate of vegetation under ideal conditions, and the value of in the traditional CASA model is 0.389 gC/MJ. In this study, model parameters of highly urbanized areas in China are optimized according to Zhang et al. [31].
3.2.3. Spearman Correlation
The correlation between wetland landscape pattern index and carbon sequestration was established to further explore the effect of landscape pattern change on wetland carbon sequestration capacity. A vector grid of 3 km × 3 km was established by the fishnet creation tool of ARCGIS10.5 (Figure 2) to ensure the sample size and better reflect the spatial complexity of urban landscape, and in consideration of the scale effect of the urban landscape pattern index [32]. After the grid intersecting with the research area was extracted, 948 research subareas were obtained. The total carbon sequestration and landscape pattern index of subregions in five different periods from 2000 to 2020 was calculated, and the grids containing outliers were removed to ensure the scientific nature of the study. The total carbon sequestration of each sub-study area and the corresponding landscape pattern index were imported into SPSS26 software for two-tailed Spearman correlation analysis, considering that the data followed non-normal distribution.
4. Results
4.1. Wetland Landscape Pattern
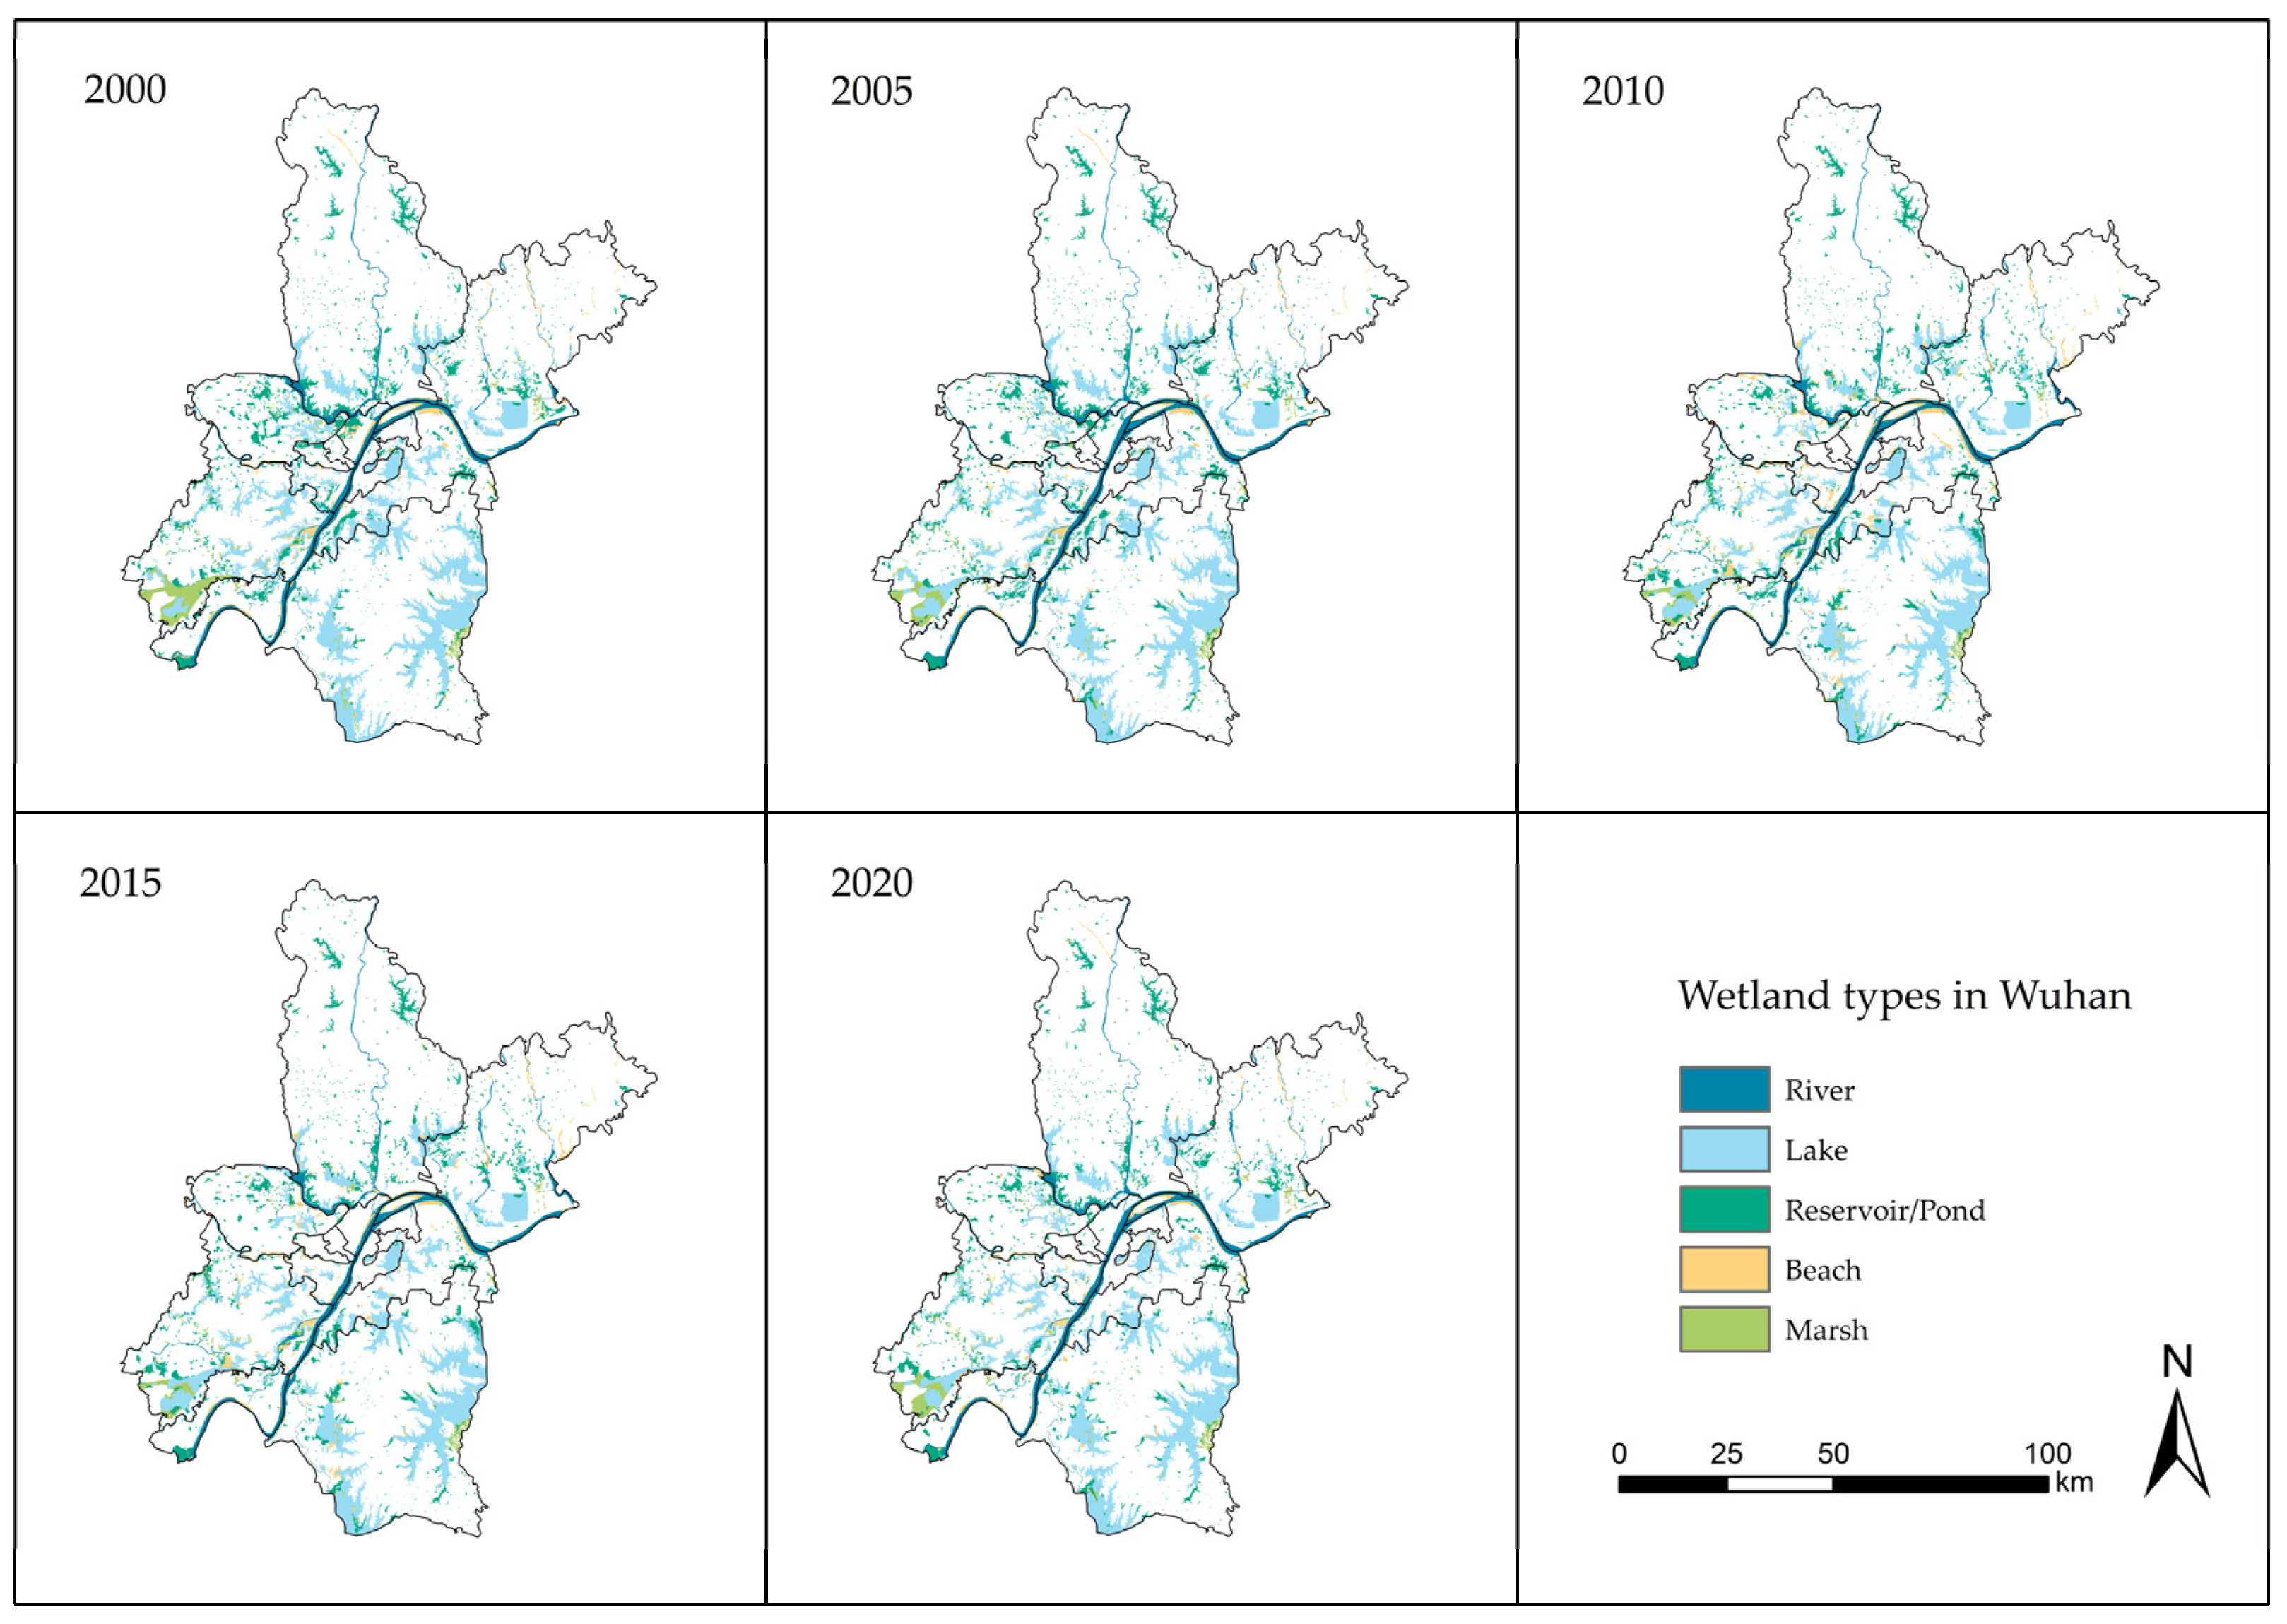
This study obtained the spatial distribution of urban wetlands in Wuhan in 2000, 2005, 2010, 2015, and 2020 through remote sensing image interpretation (Figure 3). Frastats 4.2 software was used to analyze the landscape pattern of Wuhan wetland in different periods (Table 2), and ArcGIS10.5 software was used to obtain the area transfer matrix of the periods of 2000–2010 and 2010–2020 (Table 3 and Table 4).
Figure 3 shows that wetlands in Wuhan are widely distributed, among which lake wetlands are mainly located in the central and southern parts of the city, lakes are mainly distributed in the middle of the city, reservoir and pond wetlands are in the western and northern parts of Wuhan, beach wetlands are distributed along rivers, and marsh wetlands are located at the southwest corner of the Chenhu Lake wetland and around many lakes. During the period from 2000 to 2020, the wetland area in the central city of Wuhan greatly decreased by 70.73 , in which lakes and reservoirs decreased by 27.84 and 36.70 , respectively. At the same time, the wetlands in the west of Wuhan (Dongxihu district) were also severely reduced, with rivers, lakes and reservoirs decreasing by 5.74 , 7.34 and 21.47 , respectively. In the south of Wuhan (including Caidian, Hannan and Jiangxia districts), reservoir and beach wetlands increased slightly by 10.53 and 7.82 , respectively, while lakes and marshes significantly decreased by 20.20 and 38.08 , respectively. The number and location of wetlands in the north of Wuhan (including Huangpi and Xinzhou districts) remained unchanged.
As shown in Table 2, the total amount of wetlands in Wuhan declined by 158.99 and the PD increased during the period of 2000–2020. In terms of wetland structure, the fragmentation degree of wetland landscape increased significantly, the proportion of the largest patch reduced by 0.215%, and the diversity index and the aggregation degree of wetlands decreased. In terms of wetland shape, the LSI rose from 60.869 to 63.310, with an increase of 4%. The irregularity degree of wetland also rose. Analysis of the change in wetland landscape pattern from 2000 to 2005 showed that the wetland area decreased by 3%, the landscape fragmentation degree and the largest patch ratio increased, and the diversity of wetland types tended to be stable. From 2005 to 2010, the decrease rate of wetland area slowed down, with a decrease of 1.2%. Meanwhile, the fragmentation degree increased, the large patch area reduced, and the diversity of wetland types rose. From 2010 to 2015, wetland area decreased by 2.8%, landscape fragmentation rose significantly, and diversity increased. From 2015 to 2020, wetland area decreased by 2%, and its shape became more irregular.
From the perspective of wetland transfer matrix, during the period of 2000–2010, the areas of non-wetlands and beach wetlands in Wuhan increased by 76.94 and 54.67 , respectively. On the contrary, lakes and marshes were greatly reduced by 81.66 and 48.44 , respectively. The most increased wetland type was beach, while the most decreased wetland type was lake. From 2010 to 2020, the areas of reservoirs and beach wetlands in Wuhan decreased by 52.64 and 52.62 , respectively. The areas of non-wetlands, lakes and marshes increased by 82.05, 21.01 and 6.68 , respectively. The area of river wetlands was stable for 20 years.
4.2. Spatial and Temporal Patterns of Carbon Sequestration in Wetlands
4.2.1. Verification and Accuracy of NPP Estimation Results
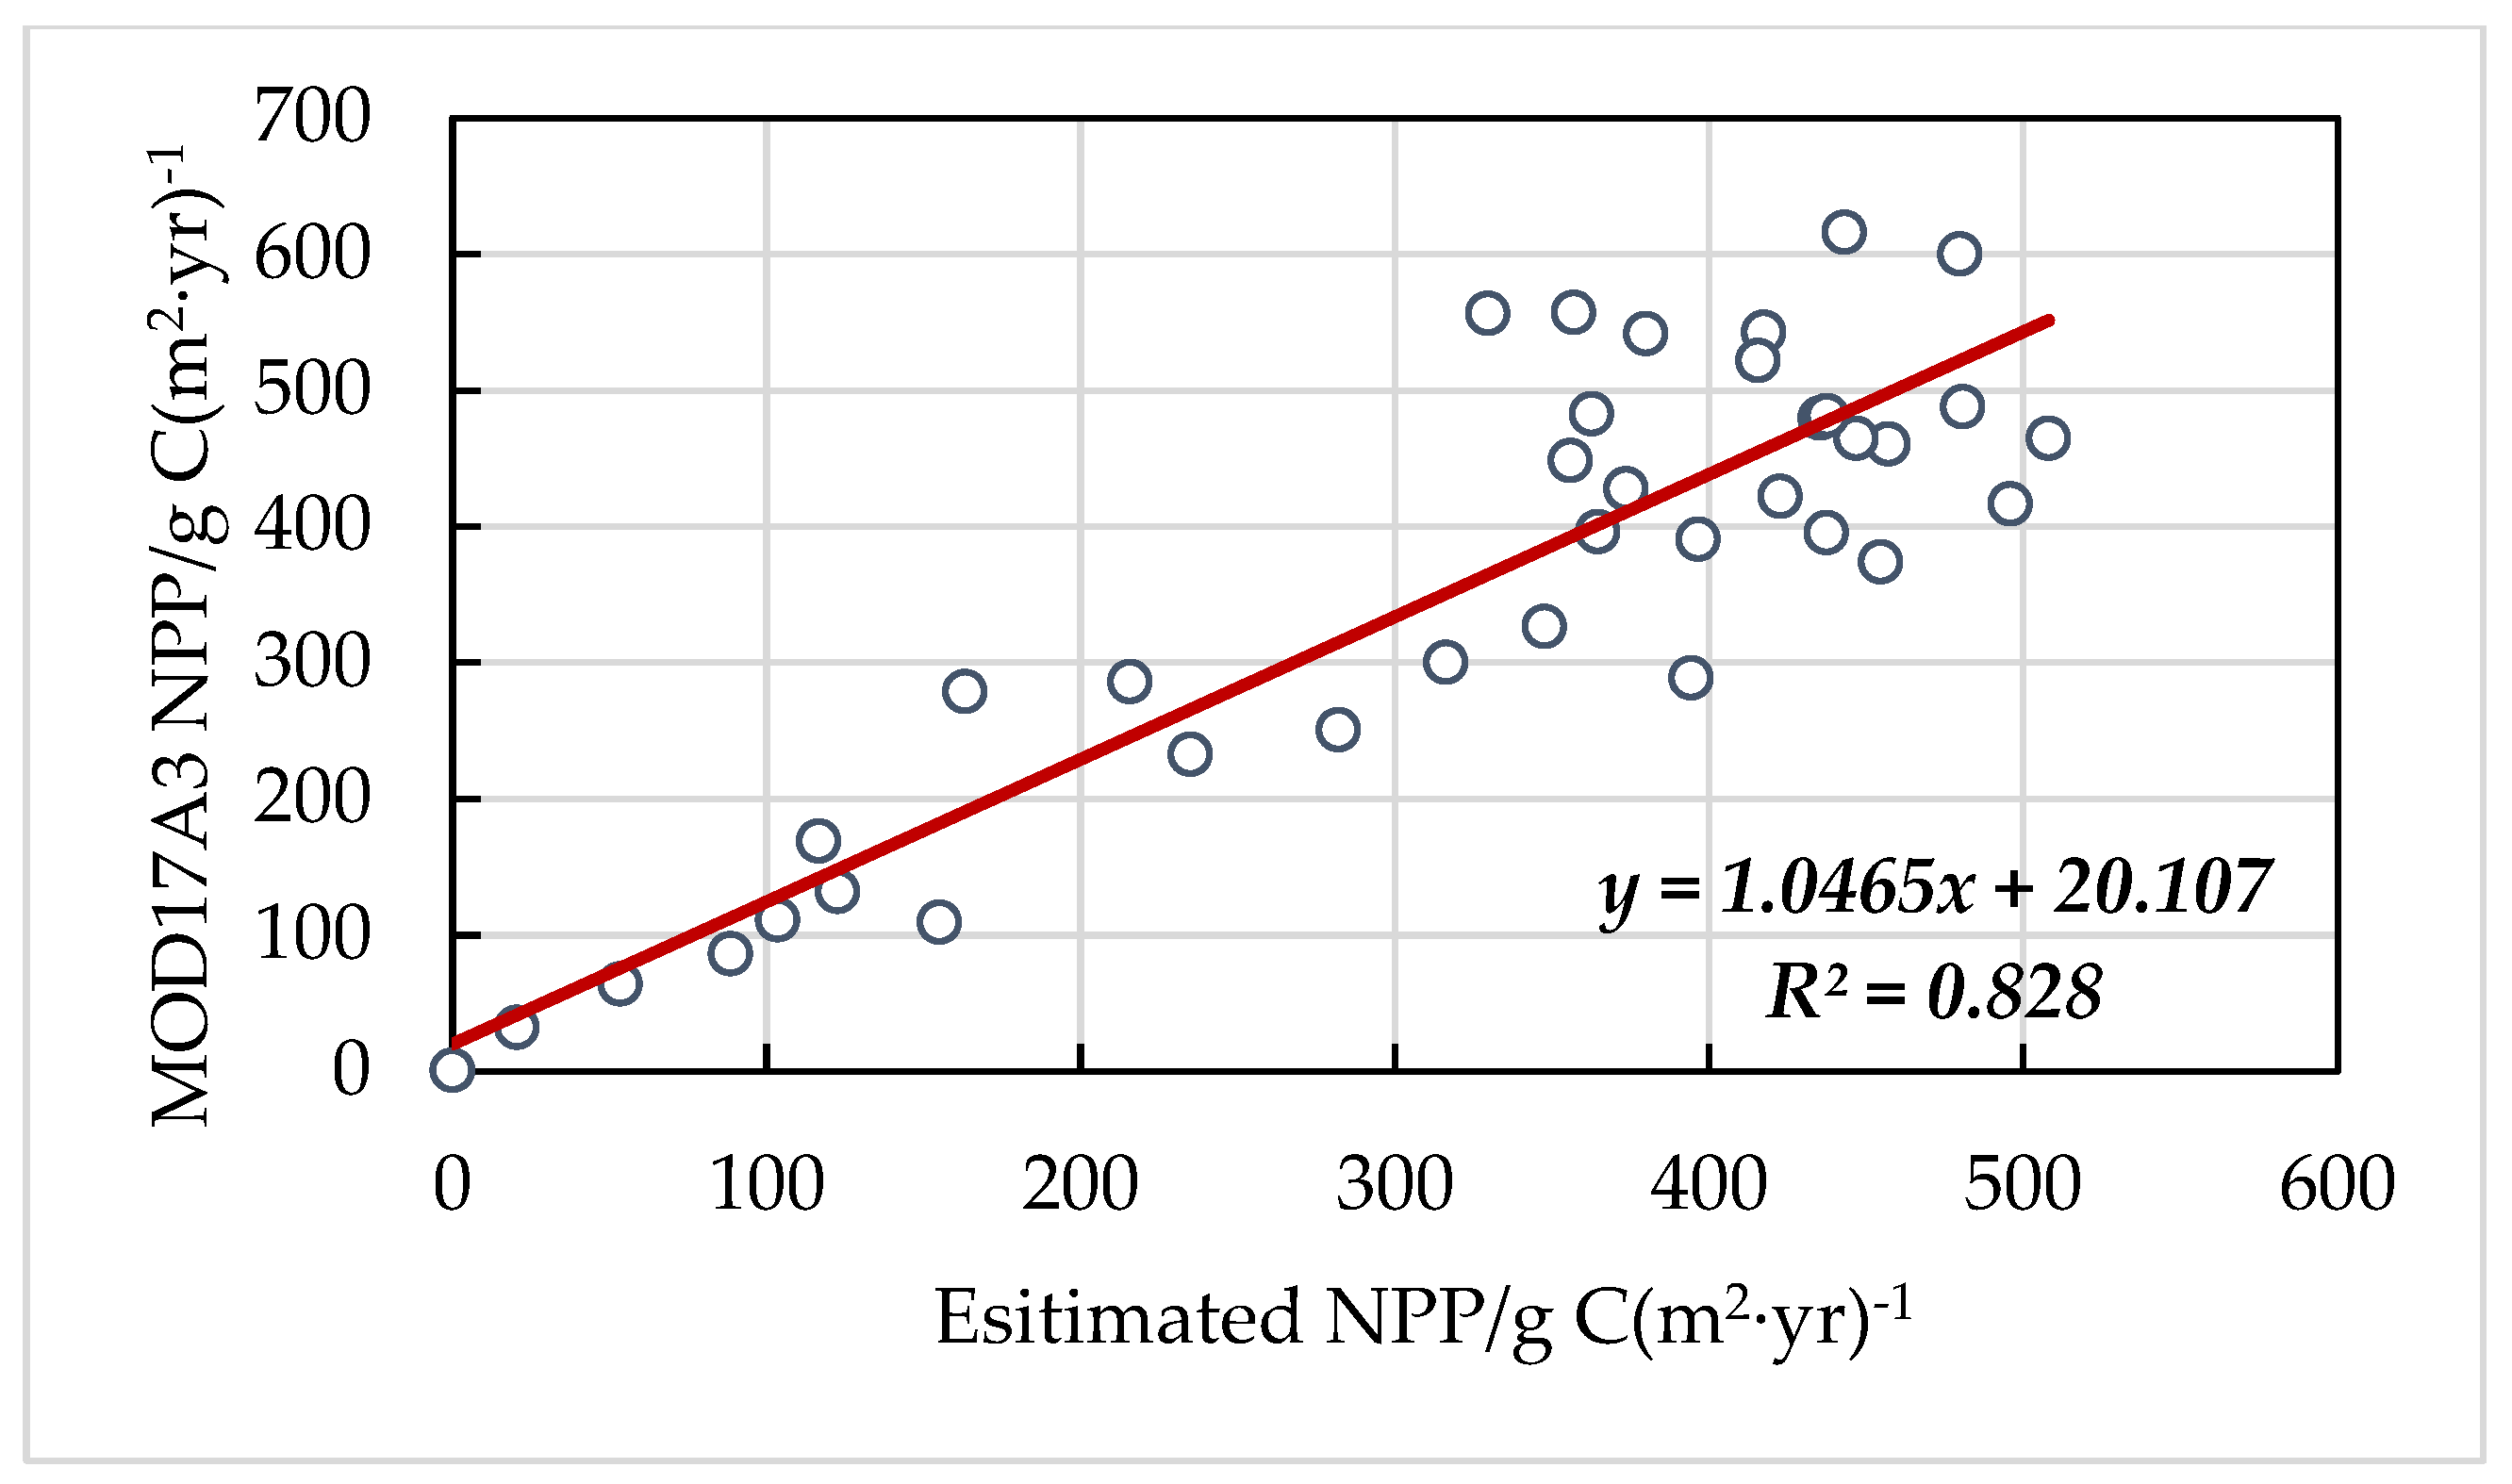
The MOD17A3H data were used to verify the accuracy of NPP results based on CASA model. In 2000, for example, the NPP derived from MOD17A3H product (Figure 4a) had a low spatial resolution and obscure expression in small areas, while NPP estimated from the CASA model (Figure 4b) had a higher spatial resolution and detailed spatial information, showing the clear boundaries of different wetland types.
Resampling NPP results to 500 m to be consistent with MOD17A3H product, and linear regression fitting, NPP estimation results obtained by the CASA model have obvious linear relationship with MOD17A3H product (Figure 5), and the fitting result , indicating that the improved CASA model has a high level of accuracy.
4.2.2. Results Analysis
Wetland carbon sequestration in Wuhan was classified into five levels according to the method of equally spaced breakpoints: the lowest carbon sequestration area (0,0.2] t C/yr, low carbon sequestration area (0.2,0.4] t C/yr, medium carbon sequestration (0.4,0.6] t C/yr, high carbon sequestration area (0.6,0.8] t C/yr and the highest carbon sequestration area (0.8,1.2) t C/yr. On the whole, wetland carbon sequestration in Wuhan showed strong spatial heterogeneity from 2000 to 2020 (Figure 6).
The areas with low carbon sequestration were mainly distributed in the central and southeastern parts of Wuhan, and the types of wetlands consisted mainly of the water body of rivers and lakes. The areas of low and medium carbon sequestration were mainly located in reservoirs and the edges of rivers, while the areas of high carbon sequestration were mainly the lake edges and marshes in the northeast and southwest of the city. From 2000 to 2020, the areas with significant reduction in wetland carbon sequestration were beach and marsh wetlands in Dongxihu District and Caidian District. With the advance of urbanization in Wuhan, wetlands in these areas were destroyed, vegetation coverage decreased, vegetation per unit area declined, and carbon sequestration reduced significantly. At the same time, the areas with significant increase in carbon sequestration in the past 20 years were the lake edges and marshes in Xinzhou District and Jiangxia District. Several wetland protection and restoration measures have been launched in these areas, such as the removal of “three nets,” sewage purification, and tourist numbers control. As a result, aquatic vegetation recovered and carbon sequestration increased. On the whole, the regions with high carbon sequestration were marsh and lakeside wetlands. These regions have diverse landscape types, rich biodiversity, vigorous plant growth, and high productivity, which resulted in the highest carbon sequestration value per unit area. The type with low carbon sequestration was the water part of rivers and lakes, which has less vegetation and a weak carbon sequestration ability. The carbon sequestration capacity of other wetland types was at an equilibrium level.
The changes in total carbon sequestration and the mean value of carbon sequestration in Wuhan from 2000 to 2020 are shown in Figure 7. The total carbon sequestration in wetland showed a trend, first decreasing and then increasing. The total carbon sequestration in 2020 and 2000 was 800,000 t annually. Therefore, although the area of wetland decreased in the past 20 years, the carbon sequestration per unit area increased and the total carbon sequestration in wetland recovered. From 2000 to 2010, the total carbon sequestration of wetlands significantly decreased by 235,800 t, and the mean carbon sequestration declined from 438.53 to 324.06 . This situation was mainly due to the rapid expansion of urban construction land, the sharp decrease in urban wetland area, and the decline in vegetation coverage during this period. From 2010 to 2020, the total carbon sequestration of wetlands showed a continuous rising trend, and the annual carbon sequestration increased by 190,000 t from 2015 to 2020. The average carbon sequestration in 2020 was the highest, which reached 475.63 . Therefore, the Regulations of Wuhan Wetland Nature Reserve, the Implementation Plan of Wuhan Wetland Protection and Restoration System, the Action Plan of Yangtze River Protection and Restoration, and other wetland protection policies have played a certain role in improving the carbon sequestration capacity of wetlands in the past 10 years. Meanwhile, the period of 2010–2020 was the warmest decade since 1850, while 2020 was the warmest year since the beginning of the 20th century [33]. Climate warming was also one of the driving forces for increasing carbon sequestration by vegetation.
4.3. Correlation Analysis of Wetland Landscape Pattern and Carbon Sequestration
The results of Spearman’s correlation analysis between landscape pattern index and wetland carbon sequestration in Wuhan are shown in Table 5. In terms of significance, TA, PD, LSI, SHDI, and AI showed significant correlation in the past 20 years, and LPI showed significant correlation only in 2010 and 2015. In terms of correlation degree, TA, LSI, SHDI, and AI showed a positive correlation with the carbon sequestration of Wuhan wetland, and the correlation coefficients were all greater than 0.3. However, PD and LPI were negatively correlated with carbon sequestration in the study area. In terms of time series changes, in the dimension of wetland quantity the Spearman correlation number between wetland total area and carbon sequestration always maintained a high positive correlation, and the average correlation coefficient was 0.811, which passed the test of significance level (p < 0.01). In the dimension of wetland shape, LSI was in moderate positive correlation with the amount of carbon sequestration, and the correlation coefficient was the highest in 2015. Therefore, the carbon sequestration of wetland was positively correlated with the shape complexity of wetland. The amount of carbon sequestration of wetland was higher when the shape of wetland was more complex. In the dimension of wetland structure, a significant negative correlation was observed between PD and regional carbon sequestration, while the SHIDI maintained a moderate positive correlation. Therefore, the carbon sequestration was lower when the diversity of wetland types was lower and the degree of fragmentation was higher. A moderate positive correlation existed between AI and the amount of carbon sequestration, while LPI showed a significant negative correlation in 2010 and 2015. Therefore, the carbon sequestration ability was stronger when the wetland area was larger and the distribution was more concentrated.
5. Discussion
5.1. Causes of Wetland Changes
Wuhan’s demand for construction land continues to increase with the continuous acceleration of Wuhan’s urbanization process and the continuous influx of migrants. The expansion of construction land will compress other land use types and lead to a reduction in wetland area [34]. From 2000 to 2010, the main expansion mode of construction land in Wuhan was spread expansion with a fast expansion rate [35]. The upsurge of real estate development and sporadic distribution of construction land damaged the integrity of wetland, increased the fragmentation of wetland landscape [36], and decreased the carbon sequestration capacity of wetland. From 2010 to 2020, the urban development of Wuhan mainly focused on urban renewal and reconstruction, and the slowing down of urban expansion made the wetland area tend to be stable. At the same time, wetland management and restoration measures were gradually perfected [37], wetland water quality improved [38], wetland maximum patch area increased, and the carbon sequestration level recovered.
The Wuhan Lake Protection Regulations were formulated in 2001 and the Detailed Rules of Wuhan Lake Protection Regulations were implemented in 2005. Although the formulation of these regulations alleviated the degradation of wetlands, the policy did not effectively inhibit the reduction of lake area in the early stage of implementation due to the lack of public awareness of protection. In 2009, the Wuhan Dadonghu ecological water network project started, and the importance of water system connectivity began to be paid attention to. In 2010, Wuhan officially implemented the Regulations of Wuhan Wetland Nature Reserve. The Implementation Plan of Wuhan Wetland Protection and Restoration System was promulgated in 2018, which further clarified the wetland protection system and measures. In the same year, the work plan of the Co-management of Four Types of Water in Wuhan was issued to build a region-wide ecological water network. In 2021, the government promulgated the Ecological Compensation Measures of Wuhan Wetland Nature Reserve and the Implementation Plan for the Construction of Wuhan Wetland Flower City, further reducing and limiting the production and management activities that have an impact on wetland resources, and striving to become an international wetland city.
On the whole, urban development from 2000 to 2020 resulted in a large reduction in the area of lakes and marshes and an increase in the degree of wetland fragmentation. Nevertheless, ecological restoration policies such as returning farmland to wetland, returning fishponds to lakes, and water network projects had significant effects over the past 10 years.
5.2. Urban Planning Proposals for Wetland Management
(1) The spatial pattern of urban wetlands should be optimized. From the perspective of territorial space planning, the ecological protection red line of the city should be strictly controlled, the development of construction land should be orderly and rationally planned, the existing urban space should be used as much as possible, stock renewal should be encouraged, the incremental expansion should be avoided, and the fragmentation of large wetland patches should be prevented. The aggregation degree of wetland landscape should be maintained to increase the carbon sequestration capacity of the urban wetland ecosystem in Wuhan. The current fragmented wetland patches should also be integrated through territorial space planning to increase the ecological connectivity of river–lake–marsh wetland, strengthen hydrological and biological connectivity, and reduce the fragmentation of wetland and the emergence of “ecological islands.”
(2) The comprehensive management of urban water resources should be strengthened. We should coordinate the relationship between agricultural development and wetland protection, improve the discourse power of wetland ecological water use, ensure the supply of the minimum ecological water demand of wetlands, conduct joint management of wetland surface water–groundwater and wetland–farmland water resources, and develop ecological agriculture. Artificial water replenishment can be considered to optimize wetland water quality when natural restoration cannot meet the needs of wetland reserves for promoting the restoration of wetland water quality. This can ensure an intact wetland area and vegetation resources and enhance the carbon sequestration capacity of wetlands.
(3) The regulation and management plan for urban wetland resources should be improved. A complete and effective implementation plan for returning farmland to wetland and an implementation plan for returning fishing ponds to wetland should be established. The balance of wetland occupation and replenishment should also be implemented. In the process of urban development, the wetland should be “replenished first, then occupied, and finally occupied in balance” to control its area and strictly control the conversion of wetland into construction land. Landscape leisure projects should be reasonably developed in the wetland area, and the landscape and economic values of the wetland should be enhanced without affecting its carbon sequestration function.
5.3. Limitations and Future Research Directions
Although the CASA model has advantages of high accuracy of estimation results and saves a lot of field observation work, the growth state and carbon sequestration capacity of deep-water wetland vegetation, such as plankton-algae, have been underestimated due to the difference between the electromagnetic radiation characteristics of water surface and terrestrial vegetation [39]. In addition, there are some seasonal errors in wetland area and NDVI values obtained by remote sensing image interpretation. The estimation results of wetland carbon sequestration using only remote sensing data for model inversion are not accurate enough and have the limitation of lack of measured data.
The carbon sequestration capacity of wetland is affected by a variety of climatic and environmental factors, such as dominant species [40], precipitation [41], water table level and soil temperature [20], etc. This study only tries to find the correlation with carbon sequestration function from the perspective of landscape pattern, and there is still room for improvement in future research. Moreover, only the landscape pattern index at the landscape level is used to reflect the changes in urban landscape and ecological environment. Future studies can be combined with class level to reveal the change pattern at a more detailed level, thus revealing the impact of landscape pattern on carbon sequestration services.
In subsequent studies, the accuracy of model estimation can be improved to further analyze the driving factors of wetland carbon sequestration ability, so as to provide data support for relevant departments, accurately evaluate wetland status indicators and carry out wetland restoration and protection in a targeted, scientific and orderly way.
6. Conclusions
(1) From 2000 to 2020, the total wetland area in Wuhan has been reduced by 158.99 , including 70.73 in the central urban area. The density of wetland patches and the degree of fragmentation and irregularity increased, and the LPI, aggregation degree, and diversity decreased. Over the past 20 years, the areas of lakes reservoirs and marshes dramatically decreased by 60.65 , 55.51 and 41.77 , respectively, while the areas of rivers and beaches tended to be stable.
(2) The carbon sequestration capacity of the water body was low, while the carbon sequestration capacity of beach and marsh wetlands was high. From 2000 to 2020, the total carbon sequestration in Wuhan first decreased and then increased, among which the carbon sequestration in wetland was the lowest in 2010 (571,900 t). In 2020, the amount of carbon sequestration in wetlands was the same as that in 2000, reaching 800,000 t.
(3) Larger wetland area, wider coverage of large-scale wetland, more concentrated and denser distribution, and more irregular and diverse wetland will increase the carbon sequestration amount of Wuhan wetland and will thus improve the carbon sink function of the urban wetland system. On the contrary, the distribution of wetland will be more broken due to the disorderly expansion and compression of construction land. This situation will reduce the carbon sequestration capacity and delay the time to achieve the urban double carbon target.
The results confirm that human intervention implemented by planning policies can affect wetland landscape pattern and thus affect wetland carbon sink level. When formulating wetland policy, more attention should be paid to coordinating the relationship between production demand and ecological carrying capacity, balancing economic benefits and ecological benefits. Landscape pattern index and NPP estimation are of special value in wetland dynamic assessment and can be included in wetland resource investigation and monitoring. In order to restore the ecological function of urban wetland, corresponding measures should be taken from the aspects of urban planning and urban governance. At the planning level, it is necessary to prevent the fragmentation of wetland patches caused by the expansion of construction land and strengthen the ecological connectivity of the water system. At the same time, attention should be paid to the comprehensive management of water resources and the policy of returning farmland and fishing ponds to wetland should be continued. While investing funds and technologies, the publicity concerning wetland ecological protection should also be strengthened to improve the environmental awareness of local residents.
Author Contributions
Conceptualization, J.S. and R.Z.; methodology, R.Z.; software, R.Z.; validation, J.S., R.Z. and Y.W.; formal analysis, R.Z.; investigation, Y.W.; resources, J.S. and Y.W.; data curation, R.Z.; writing—original draft preparation, R.Z.; writing—review and editing, J.S. and R.Z.; visualization, R.Z.; supervision, J.S. and J.H.; project administration, J.S.; funding acquisition, J.H. All authors have read and agreed to the published version of the manuscript.
Funding
This research was funded by the Project of National Social Science Foundation of China, grant number 21BGL252.
Institutional Review Board Statement
Not applicable.
Data Availability Statement
The data presented in this study are available on request from the corresponding author.
Conflicts of Interest
The authors declare no conflict of interest.
References
- Chen, Y.-Y.; Lu, X.-G. The Wetland Function and Research Tendency of Wetland Science. Wetl. Sci. 2003, 1, 7–11. [Google Scholar]
- Costanza, R.; D’arge, R.C.; Groot, R.d.; Farber, S.B.; Grasso, M.; Hannon, B.M.; Limburg, K.E.; Naeem, S.; O’Neill, R.V.; Paruelo, J.M.; et al. The value of the world’s ecosystem services and natural capital. Nature 1997, 387, 253–260. [Google Scholar] [CrossRef]
- Liu, Z.G.; Zhang, K.M. Wetland soils carbon stock in the Sanjiang plain. J. Tsinghua Univ. Sci. Technol. 2005, 45, 788–791. [Google Scholar]
- Balmford, A.; Bruner, A.; Cooper, P.; Costanza, R.; Farber, S.; Green, R.E.; Jenkins, M.; Jefferiss, P.; Jessamy, V.; Madden, J.; et al. Ecology—Economic reasons for conserving wild nature. Science 2002, 297, 950–953. [Google Scholar] [CrossRef] [Green Version]
- Hu, Q.; Wu, Q.; Liu, Y.; Li, X.; Yao, B.; Zhong, G.; Lu, W. A review of carbon cycle in wetlands. Ecol. Environ. Sci. 2009, 18, 2381–2386. [Google Scholar]
- Festus, O.O.; Ji, W.; Zubair, O.A. Characterizing the Landscape Structure of Urban Wetlands Using Terrain and Landscape Indices. Land 2020, 9, 29. [Google Scholar] [CrossRef] [Green Version]
- Rashid, I.; Aneaus, S. Landscape transformation of an urban wetland in Kashmir Himalaya, India using high-resolution remote sensing data, geospatial modeling, and ground observations over the last 5 decades (1965–2018). Environ. Monit. Assess. 2020, 192, 635. [Google Scholar] [CrossRef] [PubMed]
- Gong, Z.; Zhang, Y.; Gong, L.; Zhao, W. Evolution of Wetland Landscape Pattern and Its Driving Factors in Beijing. Acta Geogr. Sin. 2011, 66, 77–88. [Google Scholar]
- Alan, Y.; Jun, W. Quantitative study on spatio-temporal evolution and mechanisms of wetland landscape patterns in Shanghai. Acta Ecol. Sin. 2021, 41, 2622–2631. [Google Scholar]
- Ma, Q.; Yan, H.; Li, W.; Zhao, X.; Chen, L.; Zhang, C.; Li, J. Evaluation of Carbon Sequestration and Oxygen Release Function of Wetland Ecosystem in Jilin Province. Ecol. Environ. Sci. 2021, 30, 2351–2359. [Google Scholar]
- Bian, J.H.; Li, A.N.; Deng, W. In Proceedings of the Estimation and analysis of net primary Productivity of Ruoergai wetland in China for the recent 10 years based on remote sensing, Biennial International Conference on Ecological Informatics and Ecosystem Conservation (ISEIS), Beijing, China, 27–29 August 2010; pp 288–301.
- Wang, S.; Li, S.Z.; Zheng, S.; Gao, W.; Zhang, Y.; Cao, B.; Cui, B.; Shao, D. Estimating Biomass and Carbon Sequestration Capacity of Phragmites australis Using Remote Sensing and Growth Dynamics Modeling: A Case Study in Beijing Hanshiqiao Wetland Nature Reserve, China. Sensors 2022, 22, 3141. [Google Scholar] [CrossRef]
- Li, C.; Cao, H.; Fan, Y.; Han, H.; Sun, H.; Wang, Y. Remote sensing estimation and analysis of net primary productivity (NPP) based on corrected CASA model: A case study of Hexi Corridor. Acta Ecol. Sin. 2019, 39, 1616–1626. [Google Scholar]
- Zhang, M. Modeling net primary productivity of wetland with a satellite-based light use efficiency model. Geocarto Int. 2022, 37, 4028–4052. [Google Scholar] [CrossRef]
- Yuan, Y.; Xue, L.; Li, X. Net primary productivity and carbon sequestration potential of salt marsh vegetation in Chongming Dongtan of the Yangtze Estuary based on CASA model. Chin. J. Ecol. 2022, 41, 334–342. [Google Scholar]
- Li, Z.; Jiang, W.G.; Wang, W.J.; Chen, Z.; Ling, Z.Y.; Lv, J.X. Ecological risk assessment of the wetlands in Beijing-Tianjin-Hebei urban agglomeration. Ecol. Indic. 2020, 117, 106677. [Google Scholar] [CrossRef]
- Lin, W.P.; Cen, J.W.; Xu, D.; Du, S.Q.; Gao, J. Wetland landscape pattern changes over a period of rapid development (1985–2015) in the ZhouShan Islands of Zhejiang province, China. Estuar. Coast. Shelf Sci. 2018, 213, 148–159. [Google Scholar] [CrossRef]
- Li, Z.; Liu, M.; Hu, Y.M.; Xue, Z.S.; Sui, J.L. The spatiotemporal changes of marshland and the driving forces in the Sanjiang Plain, Northeast China from 1980 to 2016. Ecol. Process. 2020, 9, 358–389. [Google Scholar] [CrossRef]
- Wang, C.; Ma, L.; Zhang, Y.; Chen, N.C.; Wang, W. Spatiotemporal dynamics of wetlands and their driving factors based on PLS-SEM: A case study in Wuhan. Sci. Total Environ. 2021, 806, 151310. [Google Scholar] [CrossRef]
- Jia, Q.Y.; Yu, W.Y.; Zhou, L.; Liang, C.H. Atmospheric and Surface-Condition Effects on CO2 Exchange in the Liaohe Delta Wetland, China. Water 2017, 9, 806. [Google Scholar] [CrossRef] [Green Version]
- Yang, A.; Kang, X.M.; Li, Y.; Zhang, X.D.; Zhang, K.R.; Kang, E.Z.; Yan, Z.Q.; Li, M.; Wang, X.D.; Niu, Y.C.; et al. Alpine wetland degradation reduces carbon sequestration in the Zoige Plateau, China. Front. Ecol. Evol. 2022, 10, 980441. [Google Scholar] [CrossRef]
- Zheng, Z.; Li, H.; Zhou, Z.; Xu, Y.; Teng, M. Landscape changes of Wuhan wetlands in 1978–2007 with the process of urbanization. Chin. J. Ecol. 2009, 28, 1619–1623. [Google Scholar]
- Chen, Y.; Ke, X.; Liu, F.; Min, M. Area, Distribution and Variation of Wetlands in Wuhan for 4 Periods since 1987. Wetl. Sci. 2019, 17, 553–558. [Google Scholar]
- Ma, H.; Ding, Y.; Pang, Q. Utilization Change of Lake and Its Carbon Emission in Wuhan City. Resour. Environ. Yangtze Basin 2020, 29, 369–375. [Google Scholar]
- Chen, Y.; Zheng, J. Study on the impact of Wetland Fragmentation on Ecosystem Service Value in Wuhan. Resour. Dev. Mark. 2021, 37, 257–265. [Google Scholar]
- Cui, X.Y.; Li, H.B.; Wang, T. Structural Evolution and Stability Simulation of Wetland Ecological Network: A Case Study of Wuhan City, China. Wetlands 2022, 42, 73. [Google Scholar] [CrossRef]
- Liu, H.; Lu, X.; Zhang, G. Progress on the Study of Process of Wetland Landscape Changes and Cumulative Environmental Effects. Prog. Geogr. 2003, 22, 60–70. [Google Scholar]
- Bai, J.; Ouyang, H.; Yang, Z.; Cui, B.; Wang, Q. Changes in Wetland Landscape Patterns: A Review. Prog. Geogr. 2005, 24, 36–45. [Google Scholar]
- Yang, Y.; Cao, G.; Hou, P.; Jiang, W.; Chen, Y.; Li, J. Monitoring and evaluation for climate regulation service of urban wetlands with remote sensing. Geogr. Res. 2013, 32, 73–80. [Google Scholar]
- Song, G.H.; Li, L.Q.; Pan, G.X.; Zhang, Q. Topsoil organic carbon storage of China and its loss by cultivation. Biogeochemistry 2005, 74, 47–62. [Google Scholar] [CrossRef]
- Zhang, M.; Zeng, Y.N. Net primary production estimation by using fusion remote sensing data with high spatial and temporal resolution. J. Remote Sens. 2018, 22, 143–152. [Google Scholar] [CrossRef]
- Wang, Y.; Shen, Y.; Chen, S.; De Li, W. Range effect of the correlations among landscape metrics. Chin. J. Ecol. 2012, 31, 2091–2097. [Google Scholar]
- CMA Climate Change Centre. Blue Book on Climate Change in China (2021); Science Press: Beijing, China, 2021. [Google Scholar]
- Wang, Z.; Zeng, J.; Chen, W. Impact of urban expansion on carbon storage under multi-scenario simulations in Wuhan, China. Environ. Sci. Pollut. Res. 2022, 29, 45507–45526. [Google Scholar] [CrossRef] [PubMed]
- Liu, Y.L.; Luo, T.; Liu, Z.Q.; Kong, X.S.; Li, J.W.; Tan, R.H. A comparative analysis of urban and rural construction land use change and driving forces: Implications for urban-rural coordination development in Wuhan, Central China. Habitat Int. 2015, 47, 113–125. [Google Scholar] [CrossRef]
- Wu, J.; Luo, J.Q.; Tang, L. Coupling Relationship between Urban Expansion and Lake Change—A Case Study of Wuhan. Water 2019, 11, 1215. [Google Scholar] [CrossRef] [Green Version]
- Han, Z. Study on the Model of Public Participation in Lakes Protection in Wuhan City, China—An Example of “Love Our 100 Lakes” Volunteer Action. Adv. Environ. Prot. 2018, 08, 1–12. [Google Scholar] [CrossRef]
- Dai, X.; Xu, D.; Wu, J.; Feng, J.; Zhou, S.; Yin, H. Spatiotemporal variations of water quality of lakes in Wuhan from 2015 to 2019. J. Lake Sci. 2021, 33, 1415–1424. [Google Scholar]
- Zhan, C.; Wu, J. Estimation of net primary productivity, carbon fixation, and oxygen release in a wetland of Ezhou, Hubei Province. Bull. Soil Water Conserv. 2022, 42, 321–328. [Google Scholar]
- Yu, H.Y.; Kim, S.H.; Kim, J.G. Carbon sequestration potential in montane wetlands of Korea. Glob. Ecol. Conserv. 2022, 37, e02166. [Google Scholar] [CrossRef]
- Yu, C.L.; Liu, D.; Zhao, H.Y. Evaluation of the carbon sequestration of Zhalong Wetland under climate change. J. Geogr. Sci. 2021, 31, 938–964. [Google Scholar] [CrossRef]
Figure 1.
Sketch map of study area.

Figure 2.
Study area grid (3 km × 3 km).

Figure 3.
Spatial distribution of carbon sequestration in Wuhan wetland from 2000 to 2020.

Figure 4.
NPP estimations based on (a) MOD17A3H product; (b) CASA model.

Figure 5.
Linear fitting relationship between estimated NPP results and MOD17A3H NPP.

Figure 6.
Spatial distribution of carbon sequestration in Wuhan wetland from 2000 to 2020.

Figure 7.
Change in carbon sequestration in Wuhan from 2000 to 2020.


Table 1.
Landscape pattern index and ecological implication in the study area.
| Landscape Pattern Index | Abbreviations | Description | Formula |
|---|---|---|---|
| Total Landscape Area | TA | Refers to the size of the landscape. | |
| Patch Density | PD | Refers to the number of patches per unit area of all heterogeneous landscapes in the region. The higher index means higher degree of landscape fragmentation. | |
| Large Patch Index | LPI | Refers to the proportion of the largest patch occupying the entire landscape area. The lower value means higher fragmentation degree of this type of landscape. | |
| Landscape Shape Index | LSI | Represents the complexity of landscape patch shape. The value is 1 when the shape is square, and the value is larger when the patch is more irregular. | |
| Aggregation Index | AI | Represents the degree of agglomeration of the patch. The larger index means higher overall aggregation degree. | |
| Shannon’s Diversity Index | SHDI | Reflects the richness of various types in a landscape system. The value is higher when the diversity of wetland types is higher. |
Table 2.
Wetland landscape pattern index of Wuhan from 2000 to 2020.
| Year | TA/km2 | PD/(n/km2) | LPI(%) | LSI | SHDI | AI |
|---|---|---|---|---|---|---|
| 2000 | 1841.744 | 0.968 | 13.739 | 60.869 | 1.299 | 95.426 |
| 2005 | 1785.813 | 1.030 | 14.027 | 61.827 | 1.265 | 95.274 |
| 2010 | 1764.808 | 1.050 | 12.905 | 61.672 | 1.326 | 95.180 |
| 2015 | 1715.531 | 1.050 | 13.280 | 58.943 | 1.302 | 95.338 |
| 2020 | 1682.753 | 1.146 | 13.524 | 63.310 | 1.276 | 95.073 |
| Difference | −158.990 | 0.178 | −0.215 | 2.441 | −0.023 | −0.353 |
| Average | 1758.130 | 1.049 | 13.495 | 61.324 | 1.294 | 95.258 |
Table 3.
Area transfer matrix of different types of wetlands in Wuhan from 2000 to 2010 (Unit: km2).
Table 3.
Area transfer matrix of different types of wetlands in Wuhan from 2000 to 2010 (Unit: km2).
| River | Lake | Reservoir | Beach | Marsh | Non-Wetland | 2000 | |
|---|---|---|---|---|---|---|---|
| River | 256.99 | 5.08 | 2.63 | 9.95 | 0.01 | 13.54 | 288.21 |
| Lake | 3.62 | 760.9789 | 68.02 | 30.65 | 3.44 | 67.38 | 934.08 |
| Reservoir | 3.49 | 23.55 | 242.68 | 18.34 | 3.52 | 111.80 | 403.38 |
| Beach | 10.19 | 2.05 | 4.04 | 49.89 | 2.35 | 24.09 | 92.61 |
| Marsh | 0.03 | 40.97 | 5.76 | 1.33 | 60.29 | 15.08 | 123.46 |
| Non-wetland | 15.26 | 19.80 | 77.39 | 37.11 | 5.41 | 6581.21 | 6736.17 |
| 2010 | 289.58 | 852.42 | 400.52 | 147.28 | 75.02 | 6813.11 | 8577.91 |
Table 4.
Area transfer matrix of different types of wetlands in Wuhan from 2010 to 2020 (Unit: km2).
Table 4.
Area transfer matrix of different types of wetlands in Wuhan from 2010 to 2020 (Unit: km2).
| River | Lake | Reservoir | Beach | Marsh | Non-Wetland | 2010 | |
|---|---|---|---|---|---|---|---|
| River | 256.53 | 4.54 | 3.23 | 7.89 | 0.09 | 17.30 | 289.58 |
| Lake | 1.31 | 765.62 | 24.74 | 6.39 | 12.23 | 42.13 | 852.42 |
| Reservoir | 2.72 | 40.15 | 246.41 | 4.22 | 3.98 | 103.04 | 400.52 |
| Beach | 12.02 | 19.21 | 11.62 | 53.32 | 1.17 | 49.93 | 147.28 |
| Marsh | 0.03 | 3.86 | 2.34 | 6.56 | 51.40 | 10.83 | 75.02 |
| Non-wetland | 12.49 | 40.04 | 59.54 | 16.27 | 12.83 | 6671.93 | 6813.11 |
| 2020 | 285.10 | 873.43 | 347.88 | 94.65 | 81.70 | 6895.16 | 8577.91 |
Table 5.
Spearman correlation between wetland carbon sequestration and wetland landscape pattern in Wuhan from 2000 to 2020.
Table 5.
Spearman correlation between wetland carbon sequestration and wetland landscape pattern in Wuhan from 2000 to 2020.
| Year. | TA | PD | LPI | LSI | SHDI | AI |
|---|---|---|---|---|---|---|
| 2000 | 0.827 ** | −0.625 ** | −0.019 | 0.383 ** | 0.337 ** | 0.441 ** |
| 2005 | 0.865 ** | −0.623 ** | −0.022 | 0.325 ** | 0.358 ** | 0.452 ** |
| 2010 | 0.793 ** | −0.571 ** | −0.146 ** | 0.450 ** | 0.441 ** | 0.351 ** |
| 2015 | 0.757 ** | −0.525 ** | −0.186 ** | 0.518 ** | 0.486 ** | 0.304 ** |
| 2020 | 0.811 ** | −0.604 ** | −0.085 * | 0.493 ** | 0.392 ** | 0.349 ** |
| Average | 0.811 | −0.590 | −0.092 | 0.434 | 0.403 | 0.379 |
Note: ** Significant correlation at 0.01 level (two-tailed). * Significant association at 0.05 level (two-tailed).
Disclaimer/Publisher’s Note: The statements, opinions and data contained in all publications are solely those of the individual author(s) and contributor(s) and not of MDPI and/or the editor(s). MDPI and/or the editor(s) disclaim responsibility for any injury to people or property resulting from any ideas, methods, instructions or products referred to in the content. |
© 2023 by the authors. Licensee MDPI, Basel, Switzerland. This article is an open access article distributed under the terms and conditions of the Creative Commons Attribution (CC BY) license (https://creativecommons.org/licenses/by/4.0/).
Share and Cite
MDPI and ACS Style
Song, J.; Zhang, R.; Wang, Y.; Huang, J. Evolution Characteristics of Wetland Landscape Pattern and Its Impact on Carbon Sequestration in Wuhan from 2000 to 2020. Land 2023, 12, 582. https://doi.org/10.3390/land12030582
AMA Style
Song J, Zhang R, Wang Y, Huang J. Evolution Characteristics of Wetland Landscape Pattern and Its Impact on Carbon Sequestration in Wuhan from 2000 to 2020. Land. 2023; 12(3):582. https://doi.org/10.3390/land12030582
Chicago/Turabian StyleSong, Jufang, Ruidong Zhang, Yiran Wang, and Jingnan Huang. 2023. "Evolution Characteristics of Wetland Landscape Pattern and Its Impact on Carbon Sequestration in Wuhan from 2000 to 2020" Land 12, no. 3: 582. https://doi.org/10.3390/land12030582
Note that from the first issue of 2016, this journal uses article numbers instead of page numbers. See further details here.