
The Frinco Castle: From an Integrated Survey to 3D Modelling and a Stratigraphic Analysis for Helping Knowledge and Reconstruction


1
Department of Architecture and Design (DAD), Polytechnic of Turin, Viale P.A. Mattioli 39, 10125 Turin, Italy
2
Historical Studies Department, University of Turin, Via Sant’Ottavio 20, 10124 Turin, Italy
*
Author to whom correspondence should be addressed.
Remote Sens. 2023, 15(19), 4874; https://doi.org/10.3390/rs15194874
Submission received: 30 August 2023
/
Revised: 2 October 2023
/
Accepted: 6 October 2023
/
Published: 8 October 2023
(This article belongs to the Special Issue Applications of Laser Scanning and Photogrammetry in Civil Engineering and Architecture: Beyond 3D Modeling II)
Abstract
:The Frinco Castle (AT-Italy) was the focus of a critical requalification and restoration project and historical knowledge. The initial medieval nucleus was modified and enriched by other architectural parts giving the current shape over the centuries. These additions gave the castle its actual internal and external complexity and an extreme structural fragility: in 2014, a significant portion collapsed. The main objective of this work was to obtain 3D metric documentation and a historical interpretation of the castle for reconstruction and fruition purposes. The local administration has planned knowledge processes from 2021: an integrated 3D geodetic survey of the entire castle and stratigraphic investigations of masonries. Both surveys were essential for understanding the architectural composition as well as the historical evolution of the court. NURBS modelling and a stratigraphic analysis of masonries allowed for the implementation of 3D immersion related to the historical interpretation. Furthermore, this modelling choice was essential for virtually reconstructing the collapsed area and helping the restoration phase.
1. Introduction
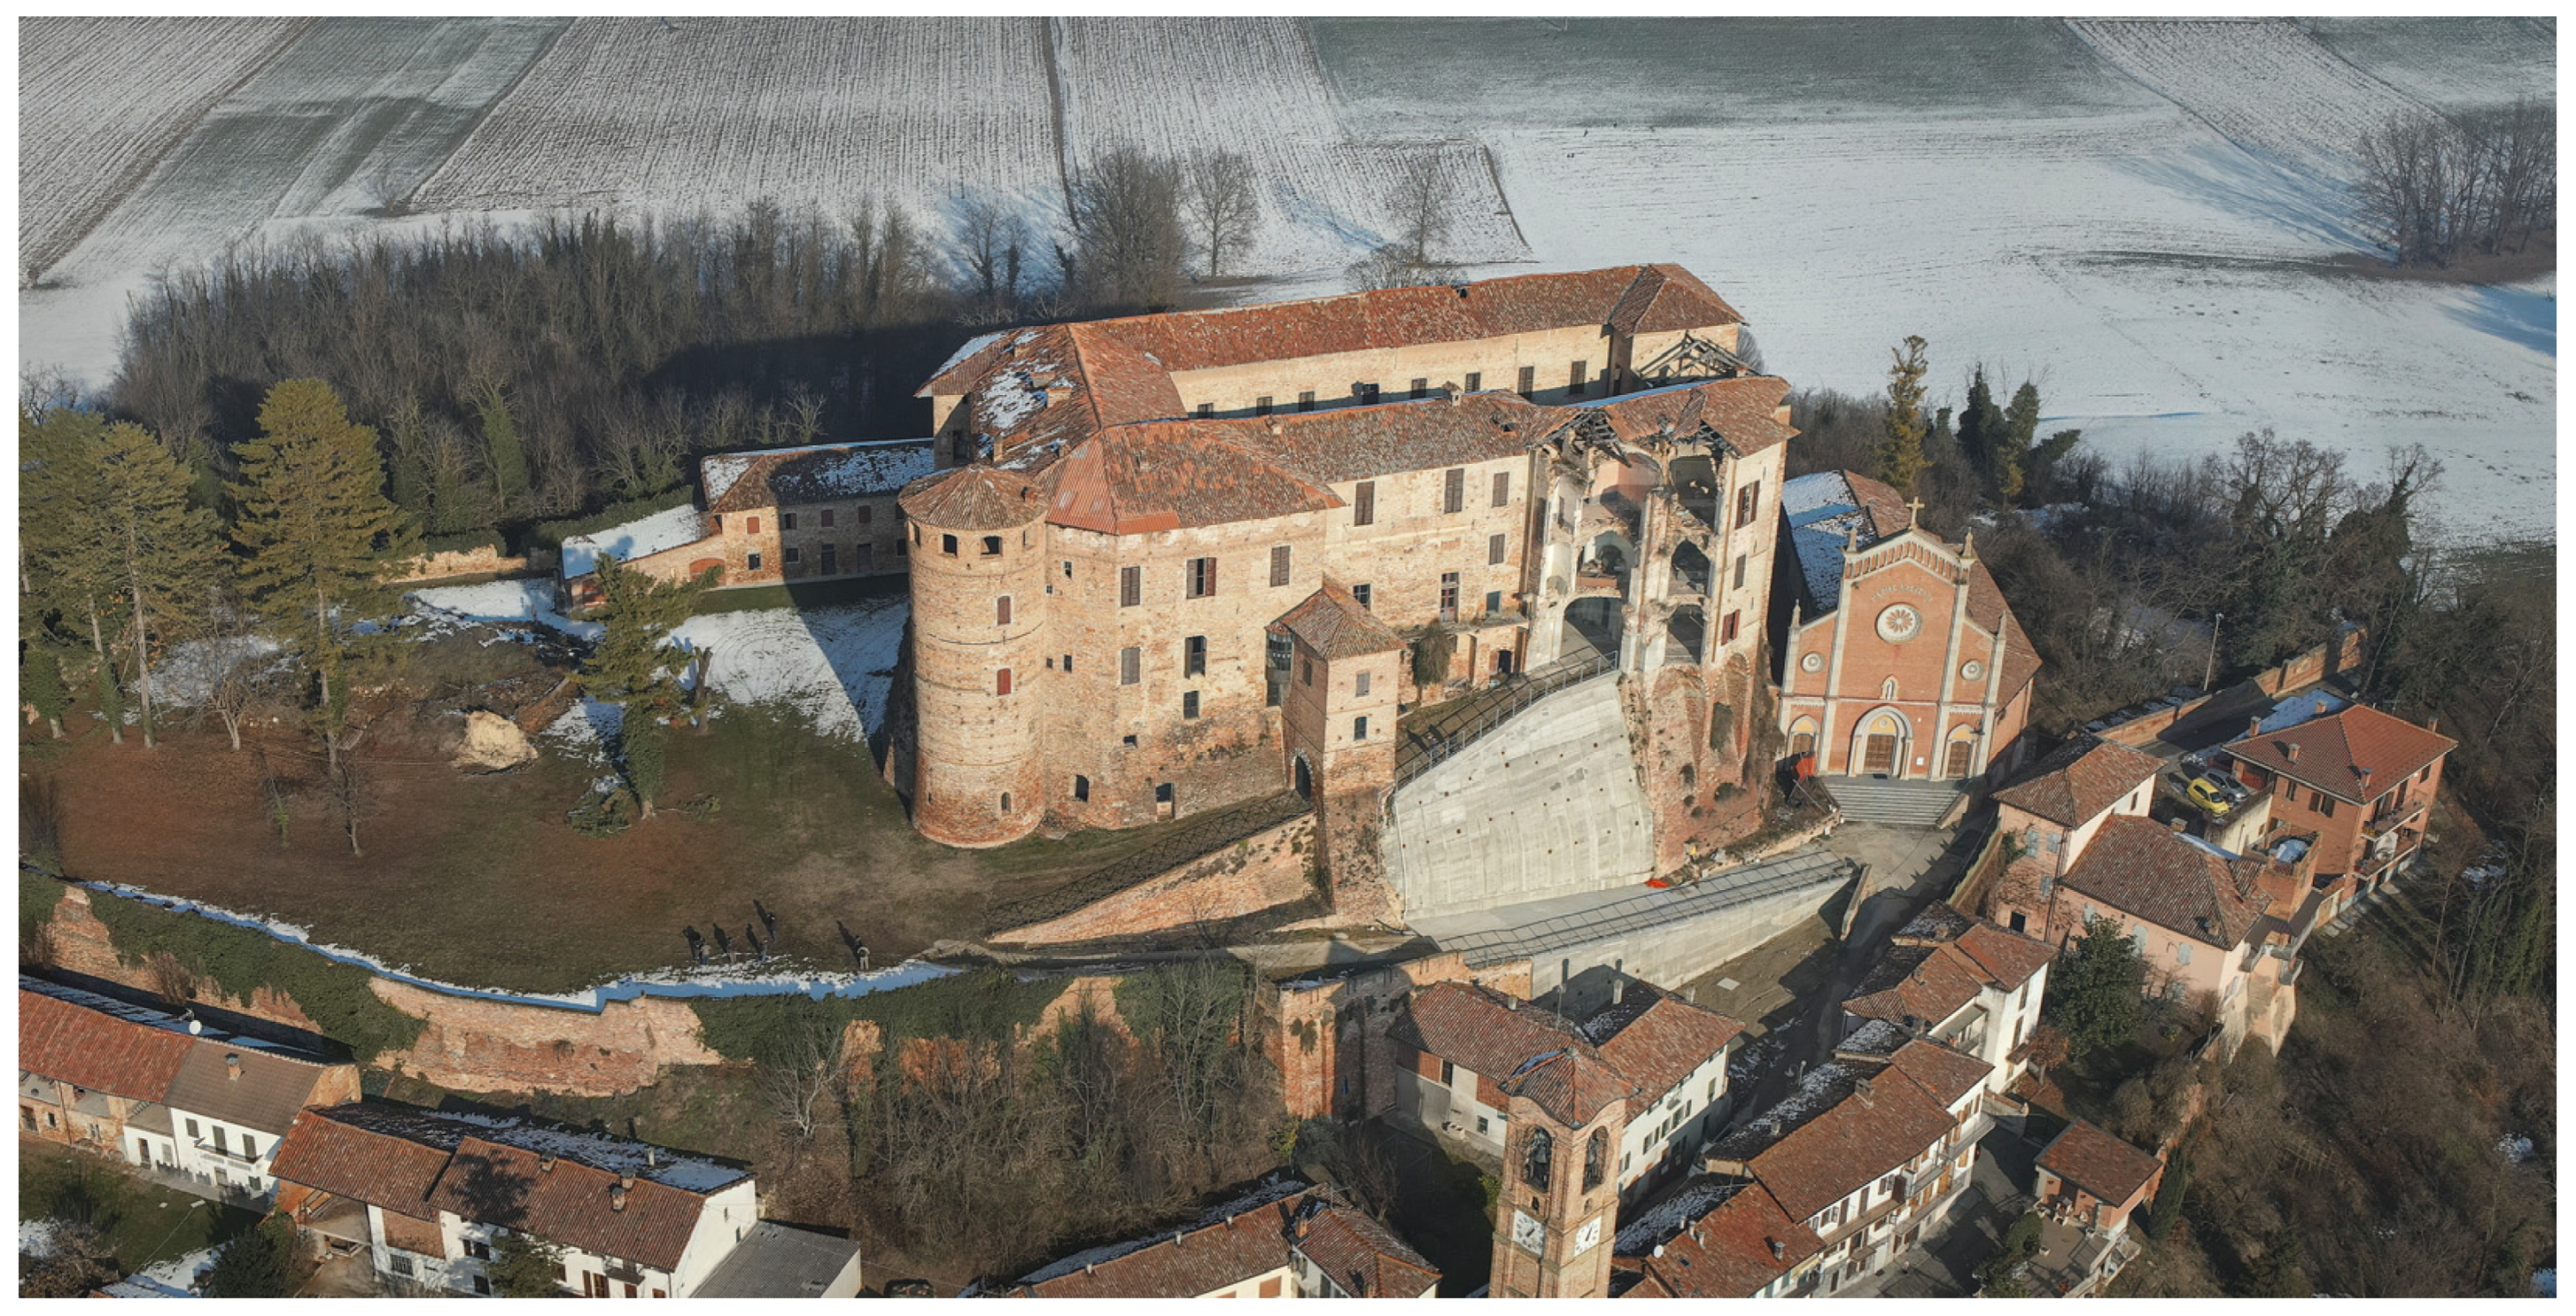
Frinco is a municipality in the Province of Asti in the Italian region of Piedmont, located about 40 km east of Turin and about 11 km north of Asti. The castle, consisting of a medieval nucleus documented as starting from 1288 with various extensions and alterations, dominates the village with its imposing size. In 2011, a collapse put the safety of the castle and the houses below at risk.
The Frinco Castle has been at the centre of a vital requalification and restoration project since 5 February 2014, when a significant portion of the south side experienced a structural collapse falling in the direction of the built-up area, lapping the houses and overwhelming the church square and the municipal road. In 2019 the municipality purchased it, and in 2020, began the restoration work.
The main objective of this work was to obtain 3D metric documentation and a historical interpretation of the castle for reconstruction and fruition purposes. These knowledge procedures were commissioned by the municipality of Frinco (and carried out by the Turin Polytechnic and local architects) precisely to achieve a complete picture for the consolidation and restoration phases. The primary structural collapse on the south front, the lack of previous surveys and drawings, and the lack of archival sources related to the evolution of the construction site constituted the state of the art on which the essential geodetic and semantic surveys were planned. However, this sudden event, fortunately not tragic, opened up many future possibilities for the castle: obtaining complete 3D documentation and a proper utilization and enhancement.
The Frinco municipality commissioned the architectural and topographical surveys of the pertinent land in 2021. Topographic and geodetic surveys were carried out to document the current state and acquire the data necessary to formulate requalification and restoration proposals. At the same time, the castle requires an immersive analysis of its constructive evolution since it is composed of a highly complex morphology due to modifications that occurred over the centuries. Changes and additions to masonries (internal and external) have made the castle very fragile, putting an architectural heritage at risk.
The stratigraphic investigation of masonries is fundamental for comprehending the evolution of the building during the time, information that is not available in archives. Applying the archaeological documentation method for historical architecture is a well-known and precise procedure for reading stratigraphic layers of masonries (from construction patterns to plaster analyses).
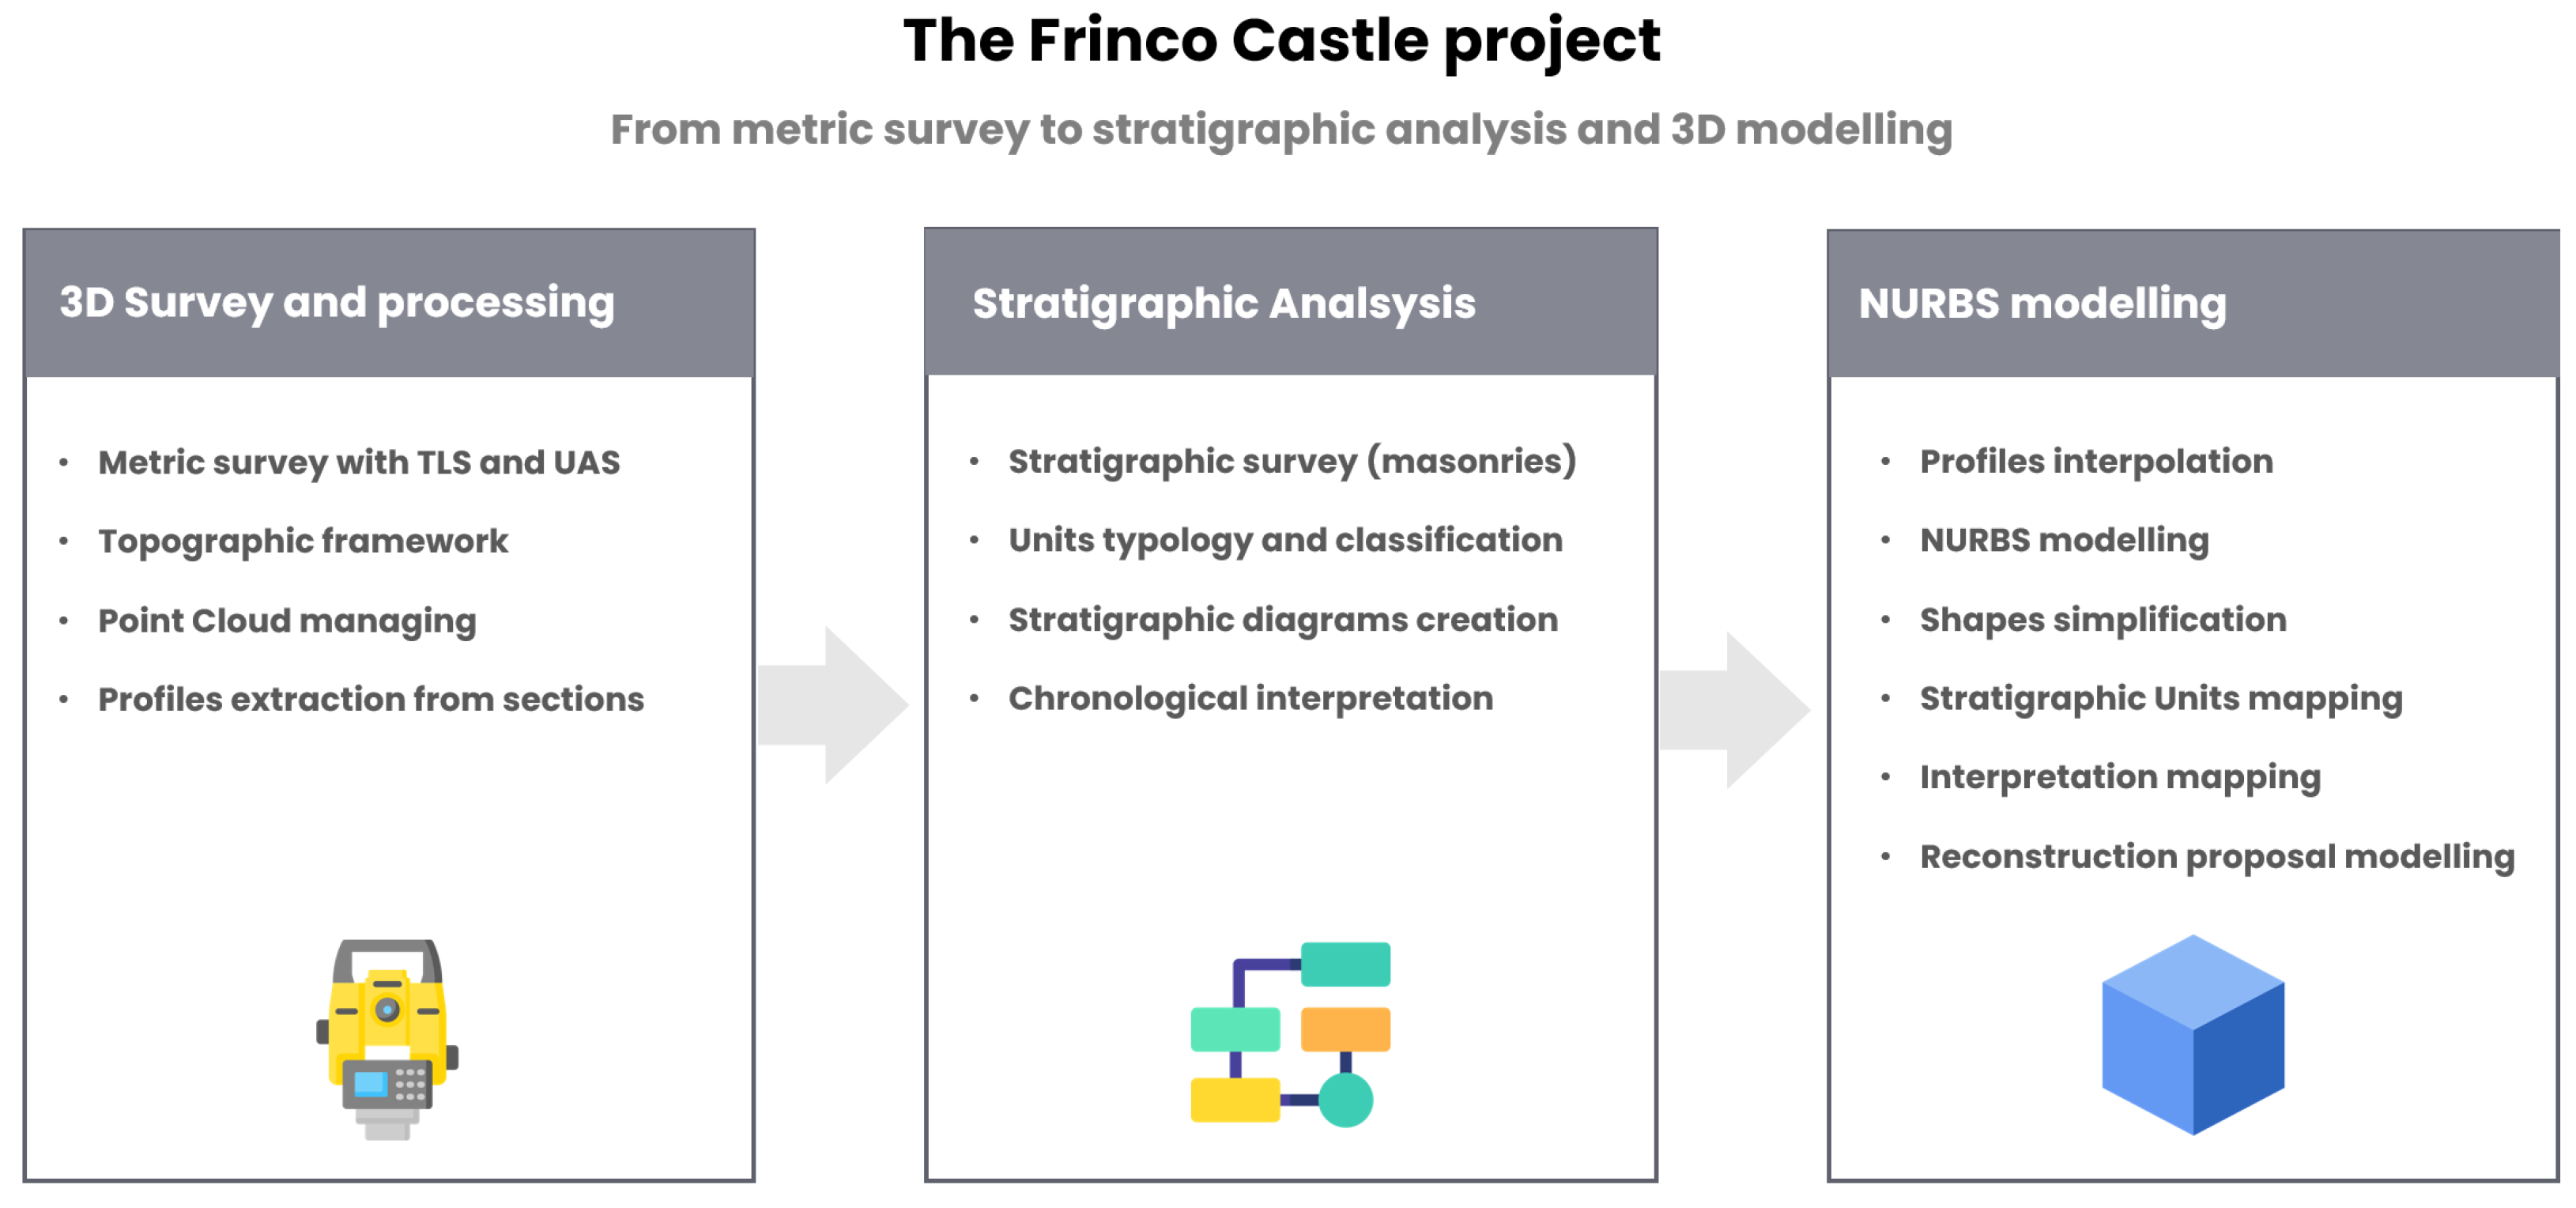
A geodetic survey was the backbone for the entire workflow of the project (Figure 1), as well as for a NURBS (Non-Uniform Rational Basis-Splines) representation. The building, around 70 per 40 m large and 30 m high, from the basement to the roof, consists of four main and various mezzanine floors. Due to the complexity and size of the building, by choosing to acquire the survey with the Trimble SX10 scanning station [1], we took advantage of the direct orientation of the point clouds through traverse adjustments, which can connect the indoor to the outdoor survey.
Using free-form modelling, the Frinco Castle was reconstructed for having a dynamic and lightweight 3D model: the current state of the building and the proposed reconstruction of the collapsed portion. Furthermore, the NURBS model has been used for the 3D mapping of the stratigraphic situation and for having an overall view of the architectural evolution of the defensive building. At the same time, this dynamic model was handled to obtain photorealistic renders of the proposed restoration of the collapsed area.
1.1. The Frinco Castle
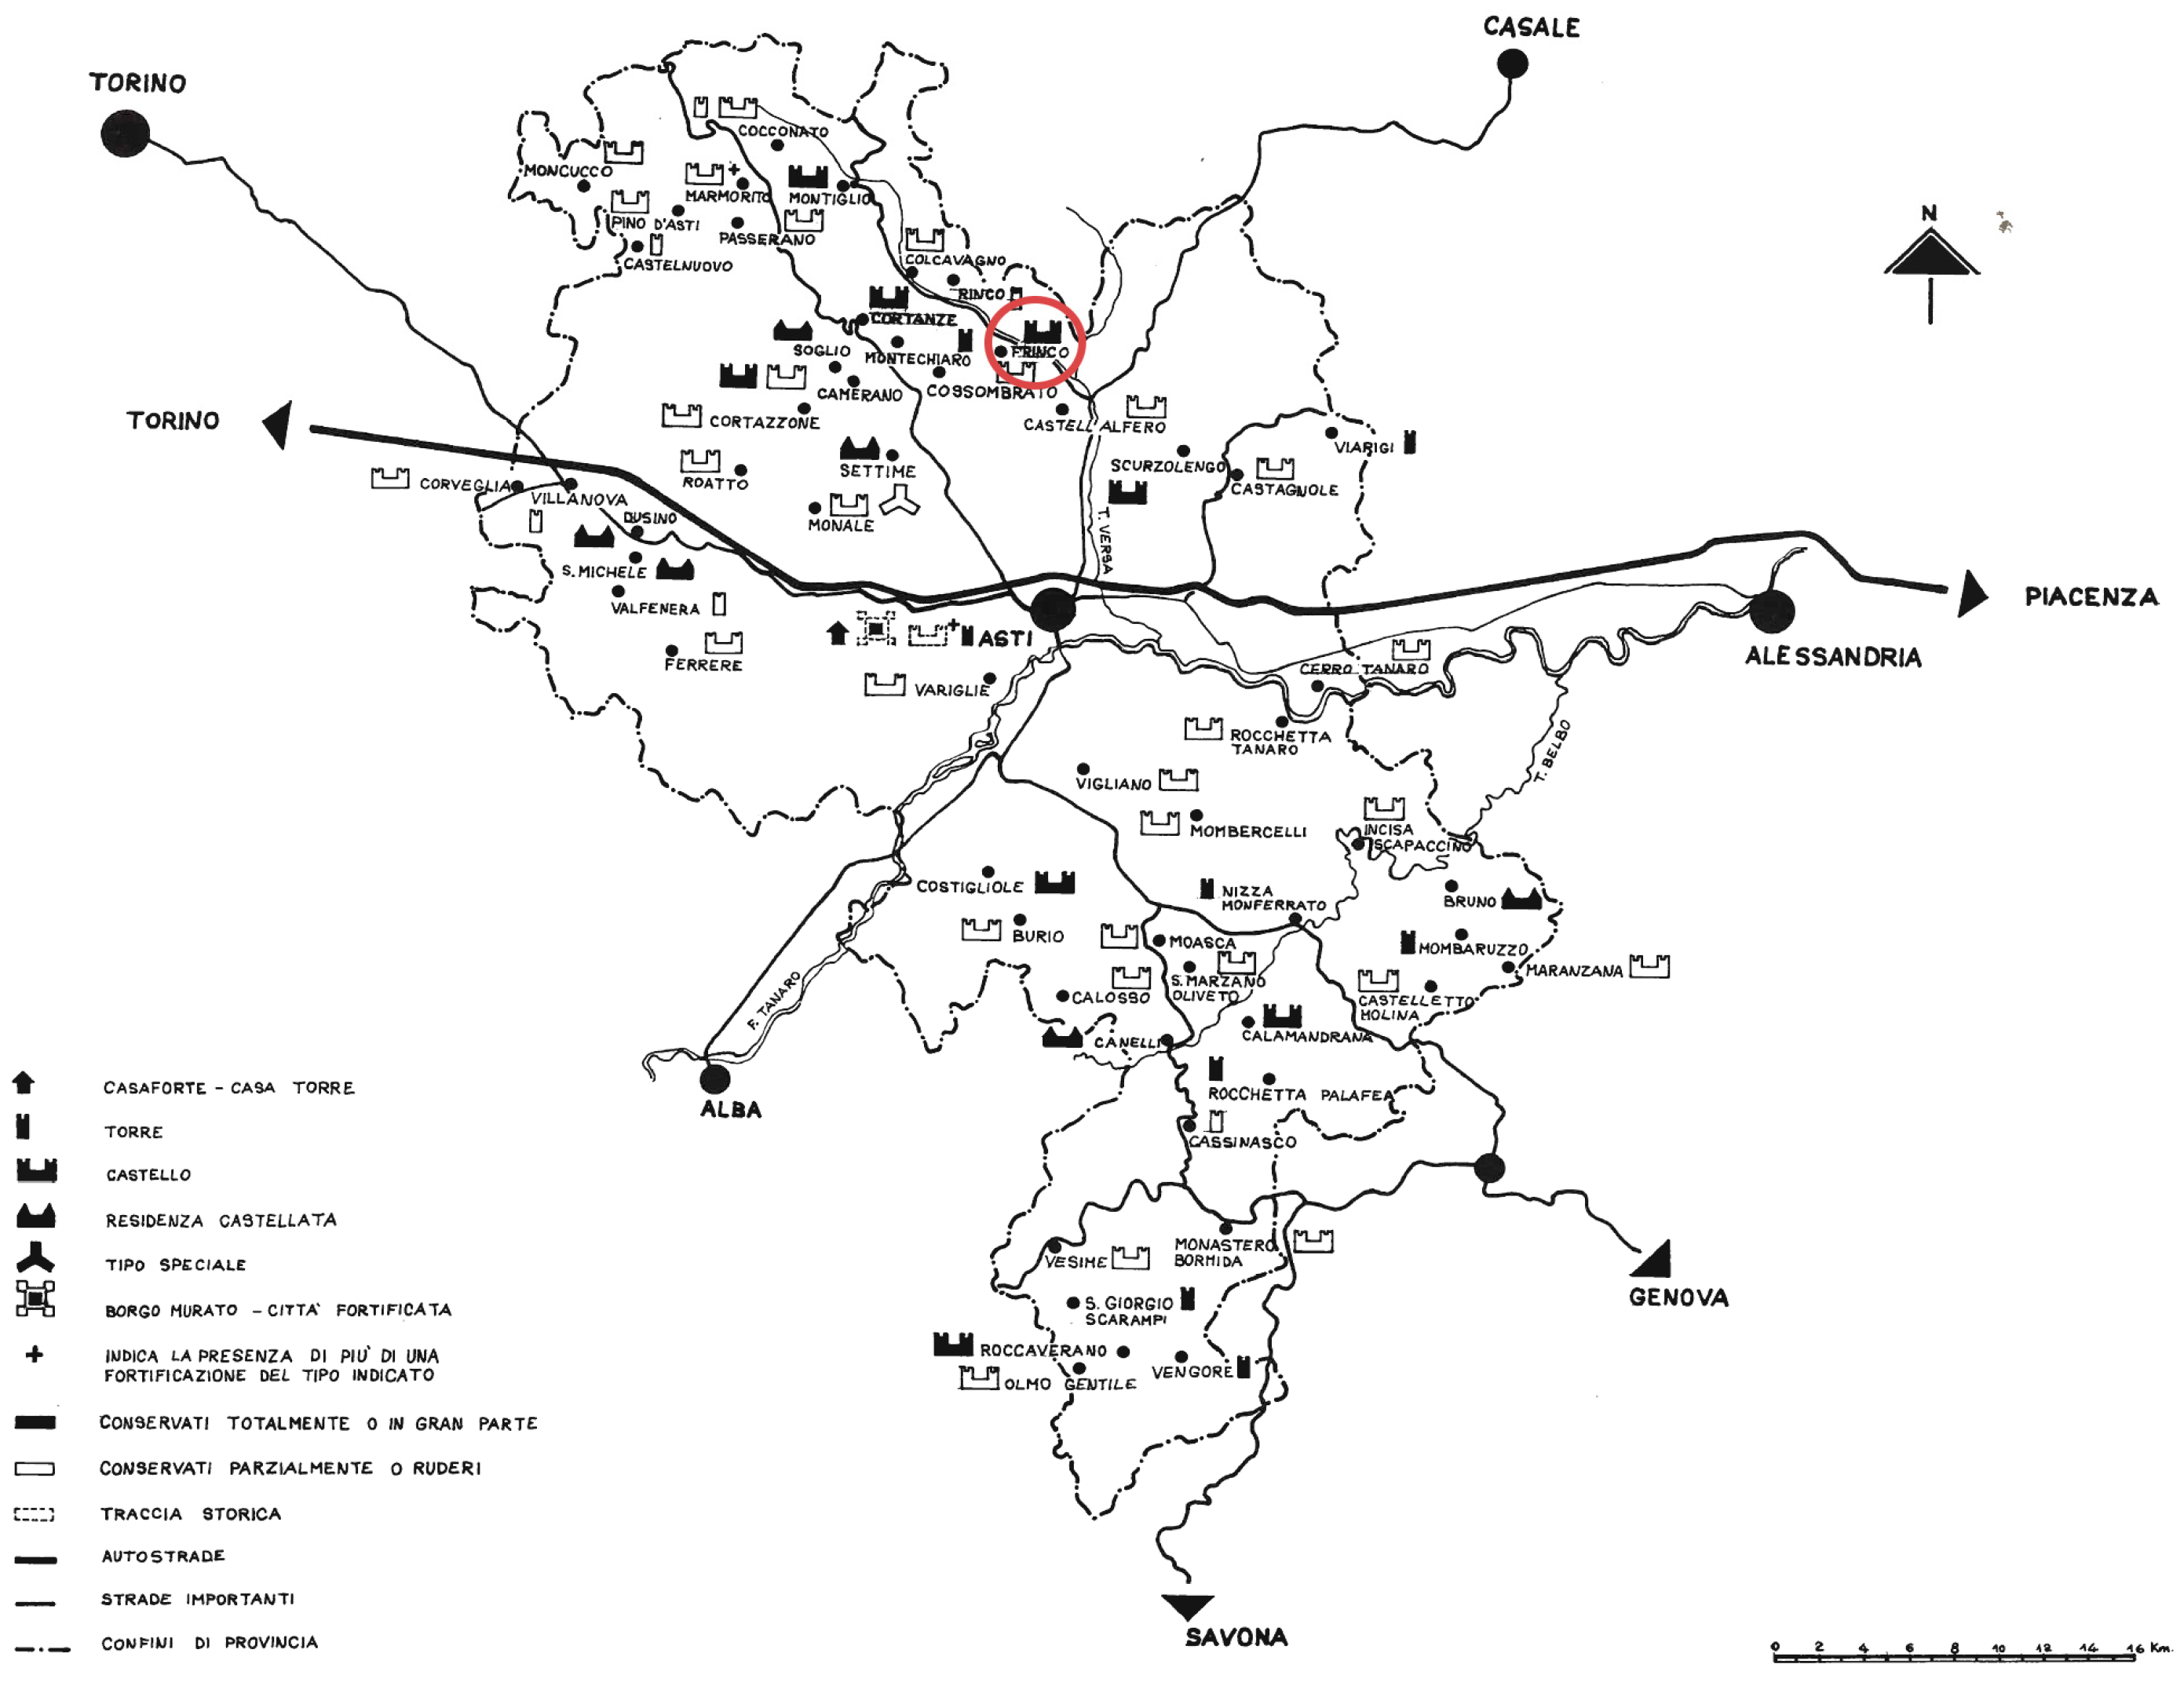
The Frinco Castle (AT-Italy), located northward from Asti (Figure 2) on the hilltop, dominates the panorama of the namesake municipality. It is a complex and severe defensive building with several morphological and structural changes from the Middle Ages (Figure 3). The union of multiple buildings especially gives this architectural complexity during the time.
The name Frinco has Germanic origins, attesting to a transalpine population starting from the VIII–IX centuries, probably organized into multiple early buildings [3]. However, the first written introduction of the fortified structure in historical archives occurred in 1117 [4]. These certificates are related to papers for the bishop of Asti, and the castle is reported as a castrum of the De Freengo noble family [4,5]. At present, the available historical documents report in detail only the owners of the castle over the centuries: noble families related to secular and religious power. Nevertheless, these archives do not report notices about the evolution of internal and external architectures.
However, the architectural composition experienced different modifications in the XIV century, when the castle became a Ghibelline structure (under the Turco Family) against the Solaro Guelf family [6,7]. The fortified complex shows clear evidence of Ghibelline decorations and components, especially on the west.
Between the XVI and XVII centuries, the Frinco Castle assisted in the succession wars related to the Monferrato territory and, around 1630, experienced a partial destruction of the north side caused by French troops (evidence still visible on the north front) [4,6]. In these centuries, the castle was the site for coin mintage [6,8]. In 1585, Carlo Emanuele I, the Duke of Savoy, gave the right to mint to the Mazzetti family (Ercole and Domenico). However, this particular permission was officially suspended due to irregularities in the minting process (counterfeit activities) [8,9]. In the XVIII century, the Mazzetti family was also consulted for the architectural renovation of the castle, interventions visible especially on the south and east sides of the structure as well as in the internal courtyard [6].
In the XIX century, the Frinco Castle was under the property of Jarls of Incisa di Camerana and Roero di Settime [4,6]. In this period, the defensive structure faced other architectural and stylistic modifications.
In modern times, the castle experienced other owners, as well as usage changes: between 1915 and 1919, it was exploited as a fortified prison for Austro-Hungarian prisoners; around 1950 and 1960, the castle was ceded by the Oblati religious congregation to the Morlini family for chicken farming [5]. After other complex ownership changes, in 2014, a significant portion of the castle’s south side, related to a forepart and gateway, collapsed near the houses. In 2019, the municipality of Frinco became the owner of the court. For this reason, the integrated survey of the castle was fundamental for reaching a complete acquisition coverage related to complex and inaccessible areas of the building (internal and external).
1.2. Geodetic Survey and Data Processing
A geodetic survey was acquired in 2021 by a team from the Polytechnic of Turin that included the authors. These acquisitions have been the initial and fundamental phase for the requalification and restoration project promoted by the Polytechnic of Turin and the municipality of Frinco.
The external morphology’s complexity required different instruments’ intervention. The survey started setting up the topographic network. Then, the terrestrial laser scanner (TLS) survey (operated by Trimble SX10) was supported by UAV (Unmanned Aerial Vehicle)/UAS (Uncrewed Aerial System) flights. In particular, the aerial survey was operated using DJI Zenmuse L1 and P1 LiDAR and photogrammetric systems [10]. The choice of these instruments was taken to acquire the entire morphology of the castle in the smartest, precise, and most complete way. In particular, similar analyses have demonstrated the reliability and accuracy of the used UAS systems and the scanning station [11,12,13]. Furthermore, a detailed comparison between terrestrial and aerial point clouds related to the Frinco Castle can be found in a previous work [14].
The first task was to set up and survey a closed traverse established conveniently around the building area, consisting of eight GNSS points connected to a high-accuracy topographic network. We materialized a redundant number of control points by stainless steel studs in anticipation of future restoration works that could lead to removing some of them. The GNSS control points coordinates, measured by the Trimble R10 GNSS antenna, were first determined in the field in Network RTK mode using the SPIN3 positioning network service (www.spingnss.it, accessed on 23 September 2023), which was provided by Regione Piemonte, Regione Lombardia, and Regione Valle d’Aosta, obtaining a mean horizontal accuracy of 25 mm and a vertical one of 45 mm. Observation post-processing was performed by the Trimble Business Center, connecting, by fast static observations, the GNSS local network to the nearest continuous operating stations: Alessandria (ALSN, 36.5 km), Crescentino (CRSN, 22.1 km), and Canelli (CANL, 34.3 km), obtaining a horizontal accuracy of 9 mm and a vertical one of 30 mm. The two most accurate GNSS points were selected as the origin and orientation of the local topographic network, which were measured using high-accuracy procedures by the Trimble SX10 total station and then used throughout the project for referencing subsequent survey work.
Due to the average size of the rooms in the castle, the expected scan density indoor in standard mode is one point every 2–6 mm, which is adequate for the deliverables of the architectural survey. The full-dome scan time in coarse mode plus panorama capture time is around 15 min per scan station. Each scan station requires about 20–30 min, considering landmark materializations, equipment movements along a traverse, and the station set-up. When connecting an indoor traverse to the outdoor control network, the survey requires more time due to the long walk path to move the equipment from indoors to outdoors and vice versa. Reaching some rooms, particularly in the basement and garret, was sometimes difficult. Because it was necessary to capture more than 300 scans, the survey campaign took 32 days to be completed, among which it took 25 days to capture the scans, with a mean of 12 scan stations per day. It took seven additional days for other tasks: the air photogrammetric and LIDAR survey, the manual verification and photographic documentation of openings, doors, windows, and floors, and the photographic survey of the fronts to produce high-resolution orthophoto deliverables.
As we carried out the survey work over a 32-day campaign, the control network and the various indoor traverses had to be compensated sequentially, following this general workflow:
- Survey and collect data by Trimble AccessTM (TA);
- Export *.job file and import to Trimble Business CenterTM (TBC);
- Fix control points and perform network adjustments;
- Export scans to Trimble RealworksTM (optional);
- Go back to point 1 until the survey is finished.
This procedure leads to a final accuracy of the local reference network that strongly depends on the surveying conditions. While outdoors, we obtained a mean horizontal RMS of 5 mm and a vertical one of 2 mm. Indoors, we had optimal conditions in surveying the most easily accessible levels of the castle (levels 1 and 2), where the mean horizontal RMS is 8 mm and the vertical one is 3 mm. We found more challenging conditions in the basement and the garret due to obstacles, needing consistently stable ground, and difficulties connecting the indoor network to the outdoor reference points. In these two areas, we set up closed traverses with a mean horizontal RMS of 10 mm and a vertical one of 3 mm. However, to survey an underground icebox and part of the garret, it was also necessary to set up two open traverses with a horizontal mean RMS of 15 mm and a vertical one of 4 mm.
The scan point clouds acquired by Trimble SX10 are oriented directly using the topographic orientation of the scan station to the local reference network without the need to place targets. Targets can, however, be used to check the scan alignment, and adhesive targets simplify the alignment of images on the point clouds in orthophoto production. While cloud-to-cloud alignment results include residual errors and overlap percentages, which we can check against specified tolerances, we do not have such a tool in direct topographic scan orientation. We can cut the project cloud into slices and control the scan alignment by a slice visual check that, combined with a control-network adjustment accuracy check, is enough for ordinary purposes.
A second tool to evaluate mismatches is the cloud-to-cloud analysis, which almost always applies outdoors when there is a good overlap between scans. This instrument is implemented in CloudCompare [15]. The outdoor survey consists of 20 scans, and we analysed ten couples of good overlapping clouds before and after an ICP refined alignment [14].
Before the alignment refinement, 65% of the cloud-to-cloud distances were under 4 mm, which increased after to 78%, while 95% were under 10 mm. The misalignment mean error is under 3 mm, which, from a practical point of view, is negligible and, among other things, cannot be noticed in a visual inspection.
In most cases of indoor surveying, a scan-to-scan registration is impossible due to limited or no overlapping areas. Scan stations are placed approximately in the centre of the rooms and are connected through a topographic station, usually positioned in the connecting passage. The presence of frames, doors, and windows complicates the problem because, if left open, they obstruct the view of portions of the walls; if left closed, they prevent the scanning of the adjacent rooms entirely.
Another frequent occurrence is the survey of overlapping floors. In this case, we survey the intrados and extrados of the vaults to determine their thickness. Only topographic measurements can connect the scans, sometimes with very long traverses to connect to the external control network. From a logistical point of view, the connection of the indoor survey to the external control network can be quite time-consuming and requires more people to move tripods and prisms outside.
Indoors, we checked the scan alignment by using common features and patches when there were any and checked the control network adjustment in the other cases. In our case study, we detected mean misalignments around 2 ÷ 4 mm, and we could also avoid ICP refinement.
As expected, the Trimble SX10 surveying solution has demonstrated reliability and accuracy in all tested conditions for outdoor and indoor architectural surveys. A robust and accurate control network ensures the direct alignment of scans with an accuracy that is adequate for producing architectural drawings and other deliverables that are usually required in the architectural survey. Its primary limit is the scan rate. However, the longer time it takes to scan is partially compensated because the system avoids post-survey scan registration. We also appreciate the advantage of its very low noise in scanned point clouds. The main advantage of direct scan referencing by SX10 is the indoor scan alignment when common features or targets may be challenging to find or place [13,14].
Two UAS flights, performed by the HighPix company [16], integrate the TLS ground scans to survey the upper parts of the castle and its surroundings. Both flights were planned using the DJI Matrice 300 RTK drone, which supports the Zenmuse L1 and P1 sensors [14].
The L1 survey generated a LiDAR point cloud that was directly georeferenced using the RTK sensor of Matrice 300. These 3D data results were sparse on vertical surfaces (walls) and were denser on horizontal planes (ground and roof), but the main task of the L1 survey was to map the ground under vegetation-covered areas.
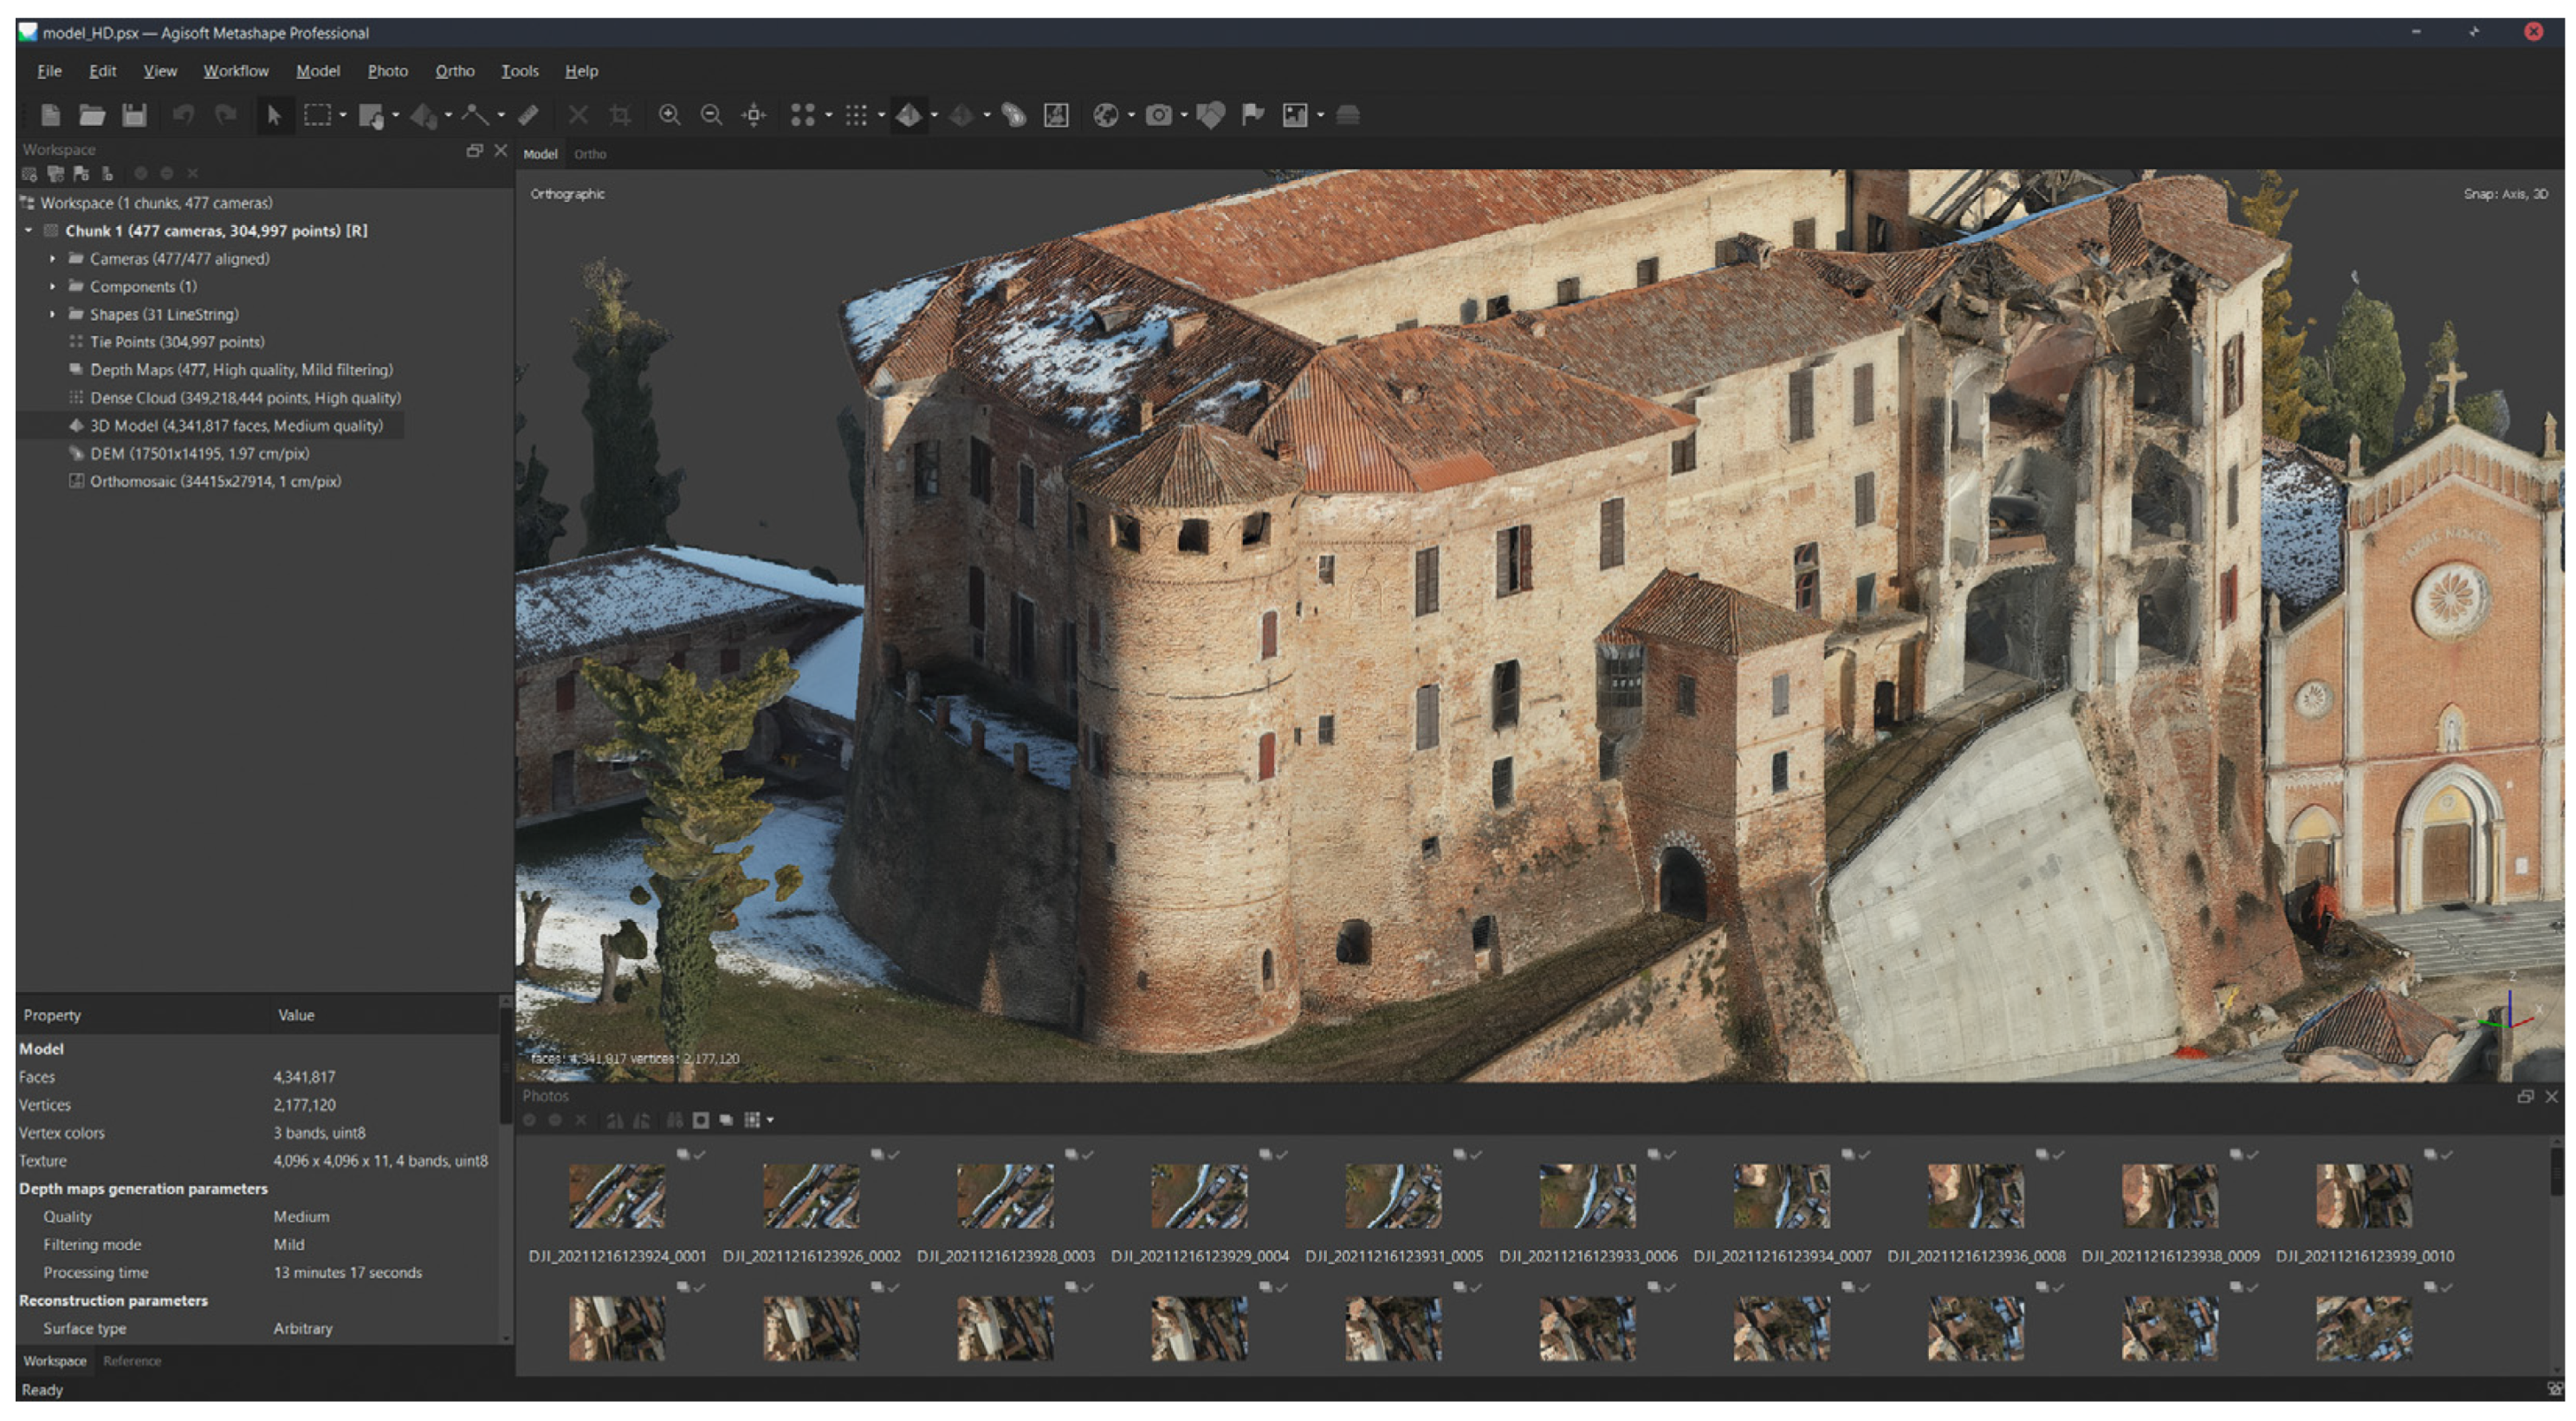
The aerial survey also revealed to be essential for acquiring detailed metric data referring to the collapsed part of the castle. As expected, and as demonstrated in other similar works [17], for this task, the P1 sensor revealed reliability and stability during the survey, allowing for extremely precise outputs. The UAS survey with the P1 payload sensor produced 477 total images, 141 nadiral and 336 obliques, acquired from flight heights ranging from 50 to 200 m to model both horizontal and vertical surfaces. The photogrammetric data were processed and managed via the Agisoft Metashape software (version 1.8.0) [18], referencing the camera through 25 × 25 cm ground targets and obtaining a high-quality photogrammetric dense cloud related to the entire castle area (about 350 million points).
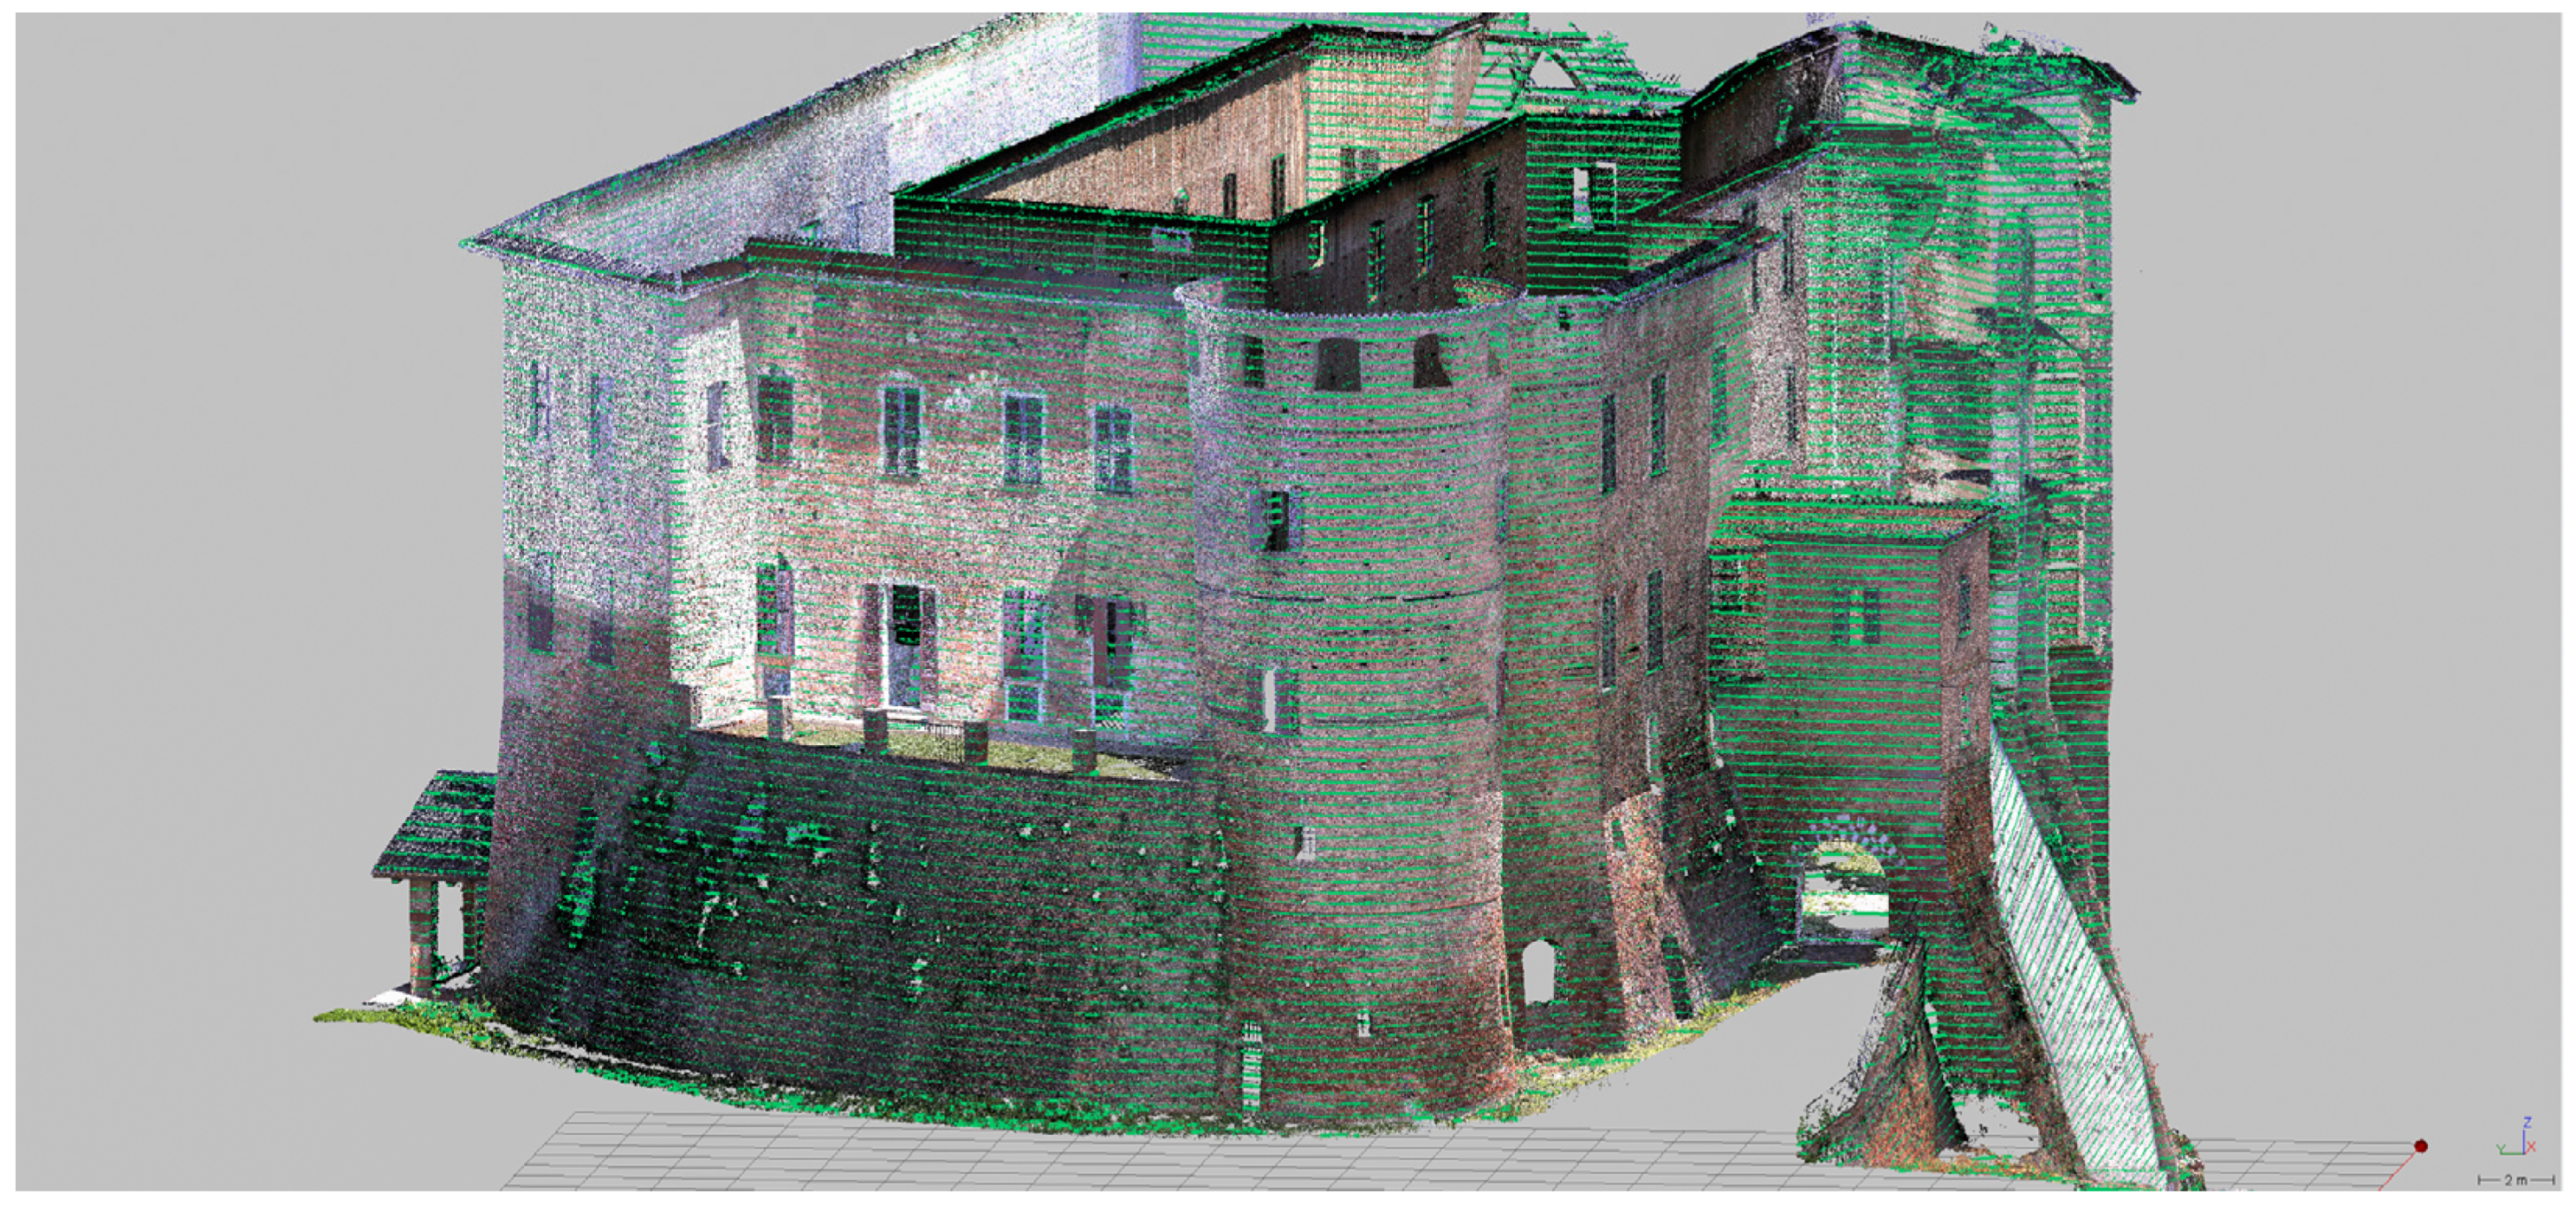
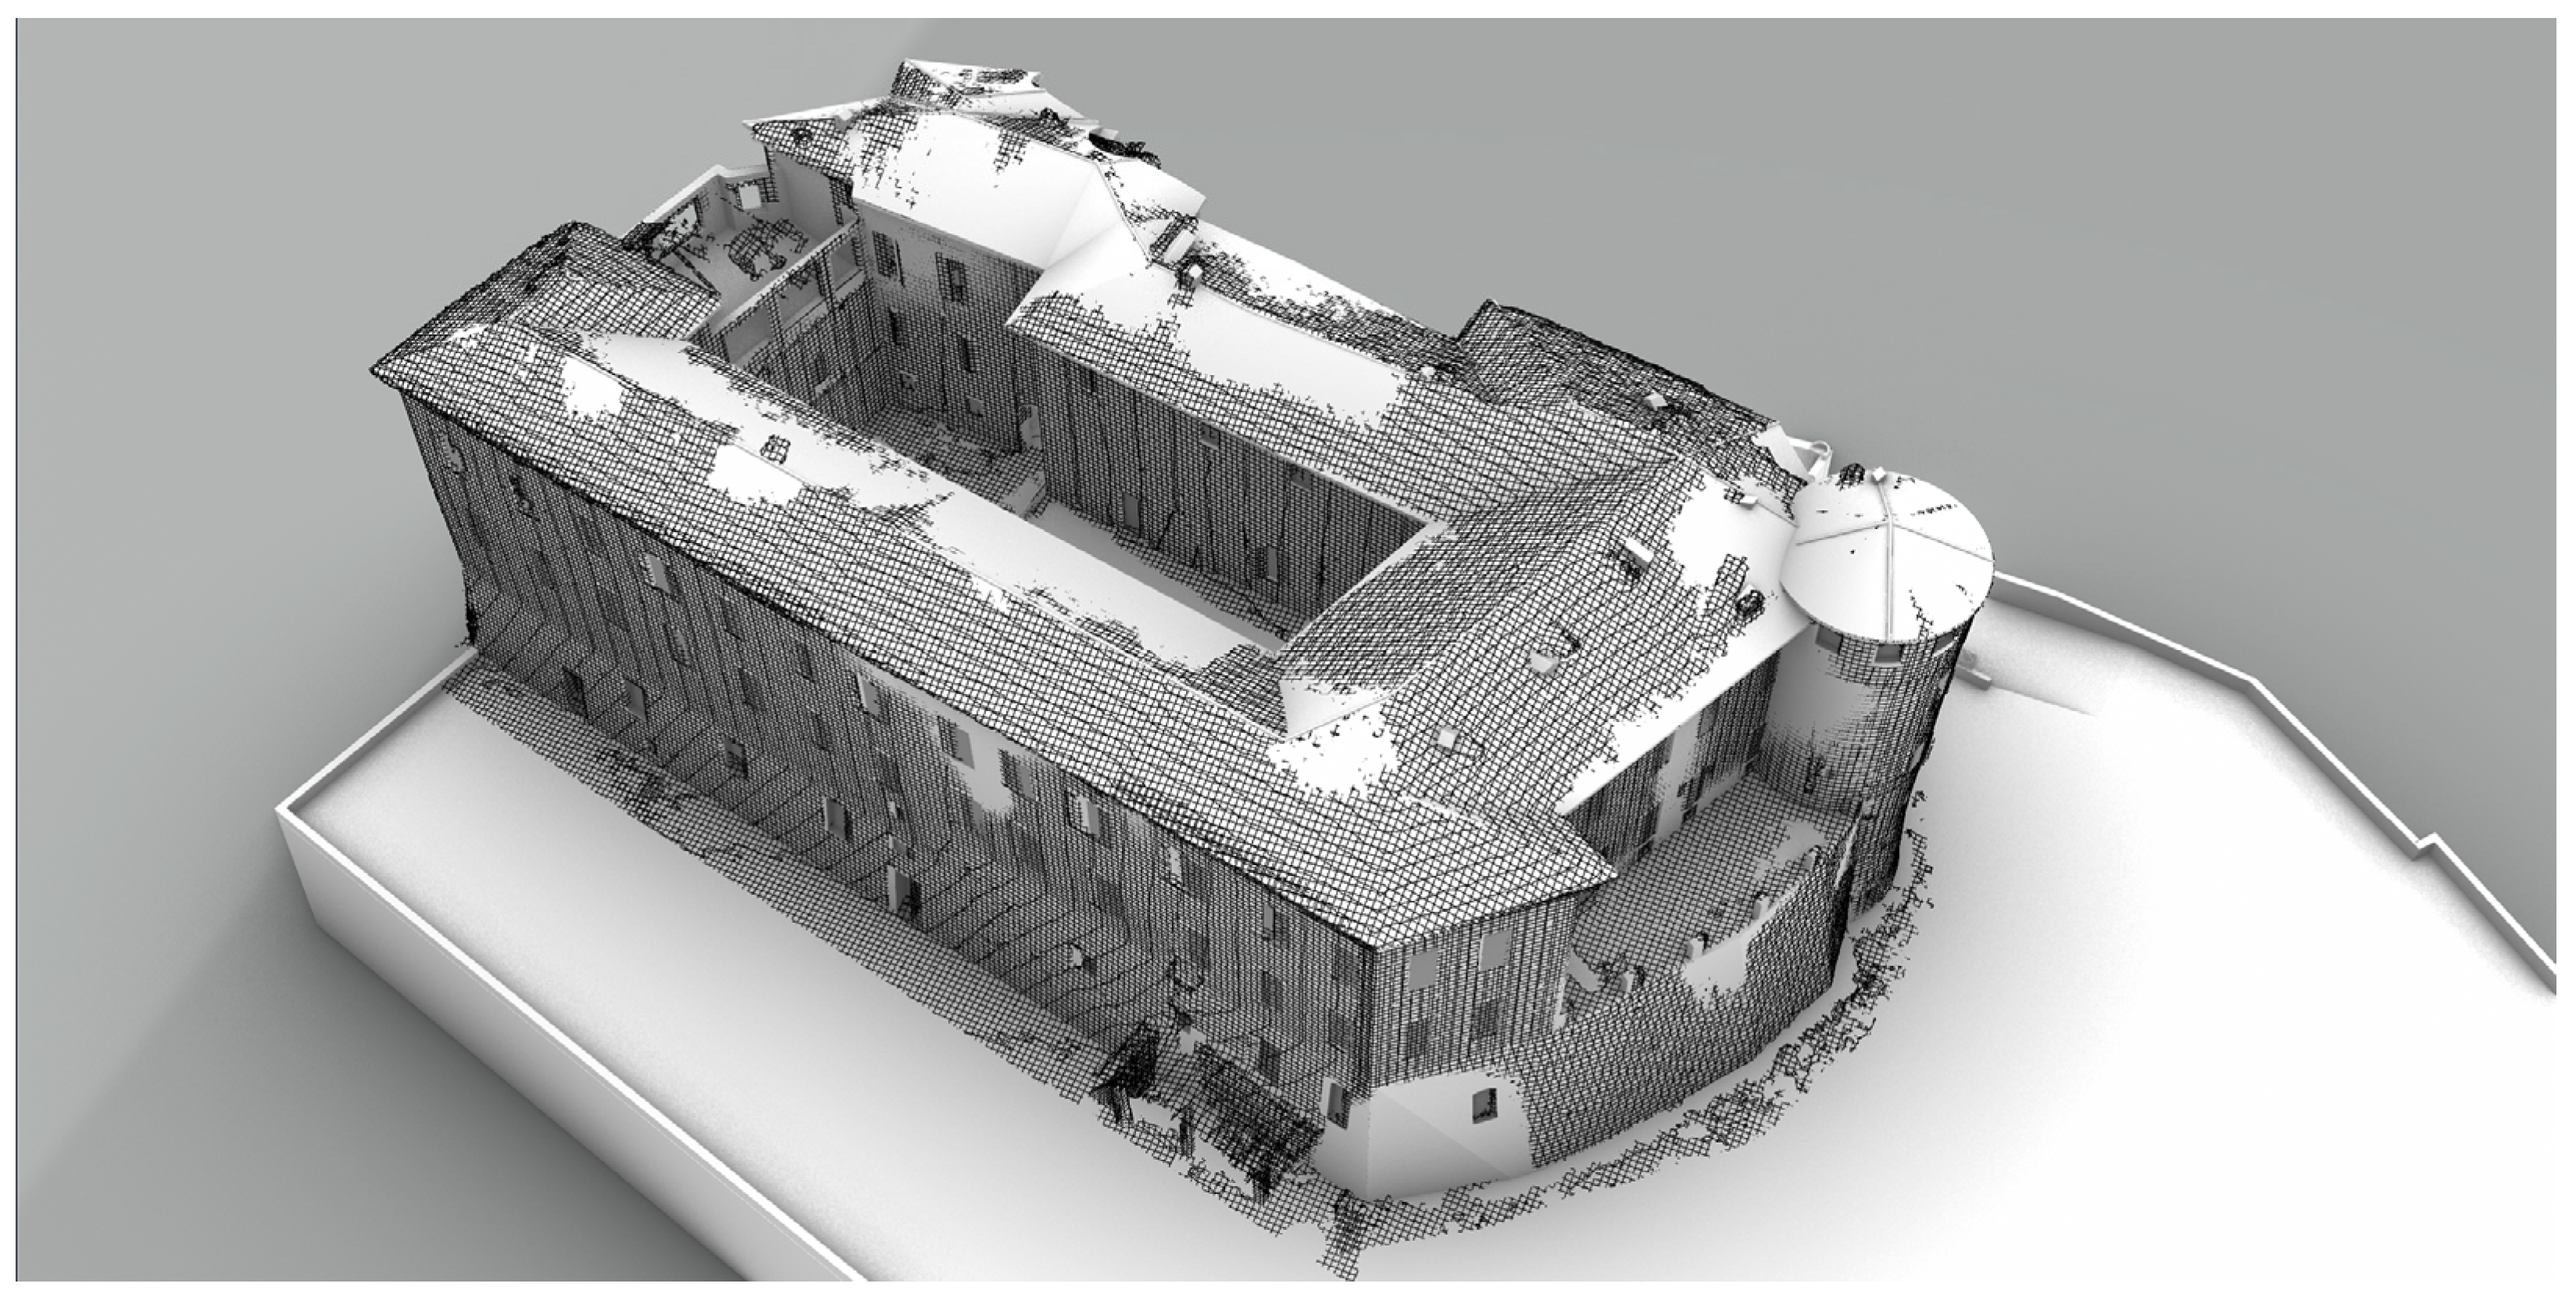
We aligned and integrated ground TLS and airborne UAS data in the Trimble Business Center suite. In the same software environment, we segmented and classified the point clouds to obtain a single integrated complete point cloud. Point cloud alignments were verified in CloudCompare as described in [14]. Polygonal meshes were generated to have complete reality-based 3D data (Figure 4) and for performing specific metric analyses [14].
The integration of different sensors and methodologies proved to be the best choice for the entire acquisition of the castle [14,19].
The 3D LiDAR data and photogrammetric acquisition were also essential for generating ortho-images of each castle elevation to draw and map stratigraphic units in a CAD environment. Regarding the circular tower, the orthophoto was obtained from a cylindric unrolling of the geometry.
At the end of the post-processing operations, photogrammetric and TLS data were the basis for the wired profiles’ extrapolation. We generated planar sections by interpolating 3D point clouds with X, Y, and Z planes (Figure 5). This intersection creates orthogonal profiles that can be exported as CAD elements. These elements’ ease of handling and metric accuracy favoured the NURBS modelling phase.
2. Knowledge Processes
The Frinco Castle was at the centre of a stratigraphic survey and analysis to acquire and understand its architectural complexity, trying to establish a relative chronology of the construction site. For this reason, the stratigraphic method (geological and archaeological origins) was applied to analyse masonries and architectural components.
2.1. Stratification and Architecture Stratigraphy
Although the stratigraphic analysis is primarily a documentation process that refers to geological and archaeological layers, it is widely applied to other stratified contexts such as historic architecture. Stratifications refer to specific positive or negative actions: material deposits, erosions, destructions, or transportations. These kinds of activities can also occur in buildings, especially in historic architecture, and they are related to the evolution of the construction site and, in particular, to modifications that happened on masonries and architectural elements from the early installation to the present time. The first applications of an archaeological analysis on buildings derived from medieval excavations, and during that time, became a proper discipline in Italy known as building archaeology [20,21].
Historical buildings are generally referred to in different construction steps. Architectural elements and building parts have often experienced additions, modifications, and usages during the centuries [22,23]. The precise evolution of construction sites and masonry is hardly described in historical archives [23,24]. In these documents are often reported workers, payments, and a few generic descriptions of construction steps. For this reason, the stratigraphic analysis of historic architecture reveals fundamentals for understanding the evolution of the context and for updating or denying written documentation.
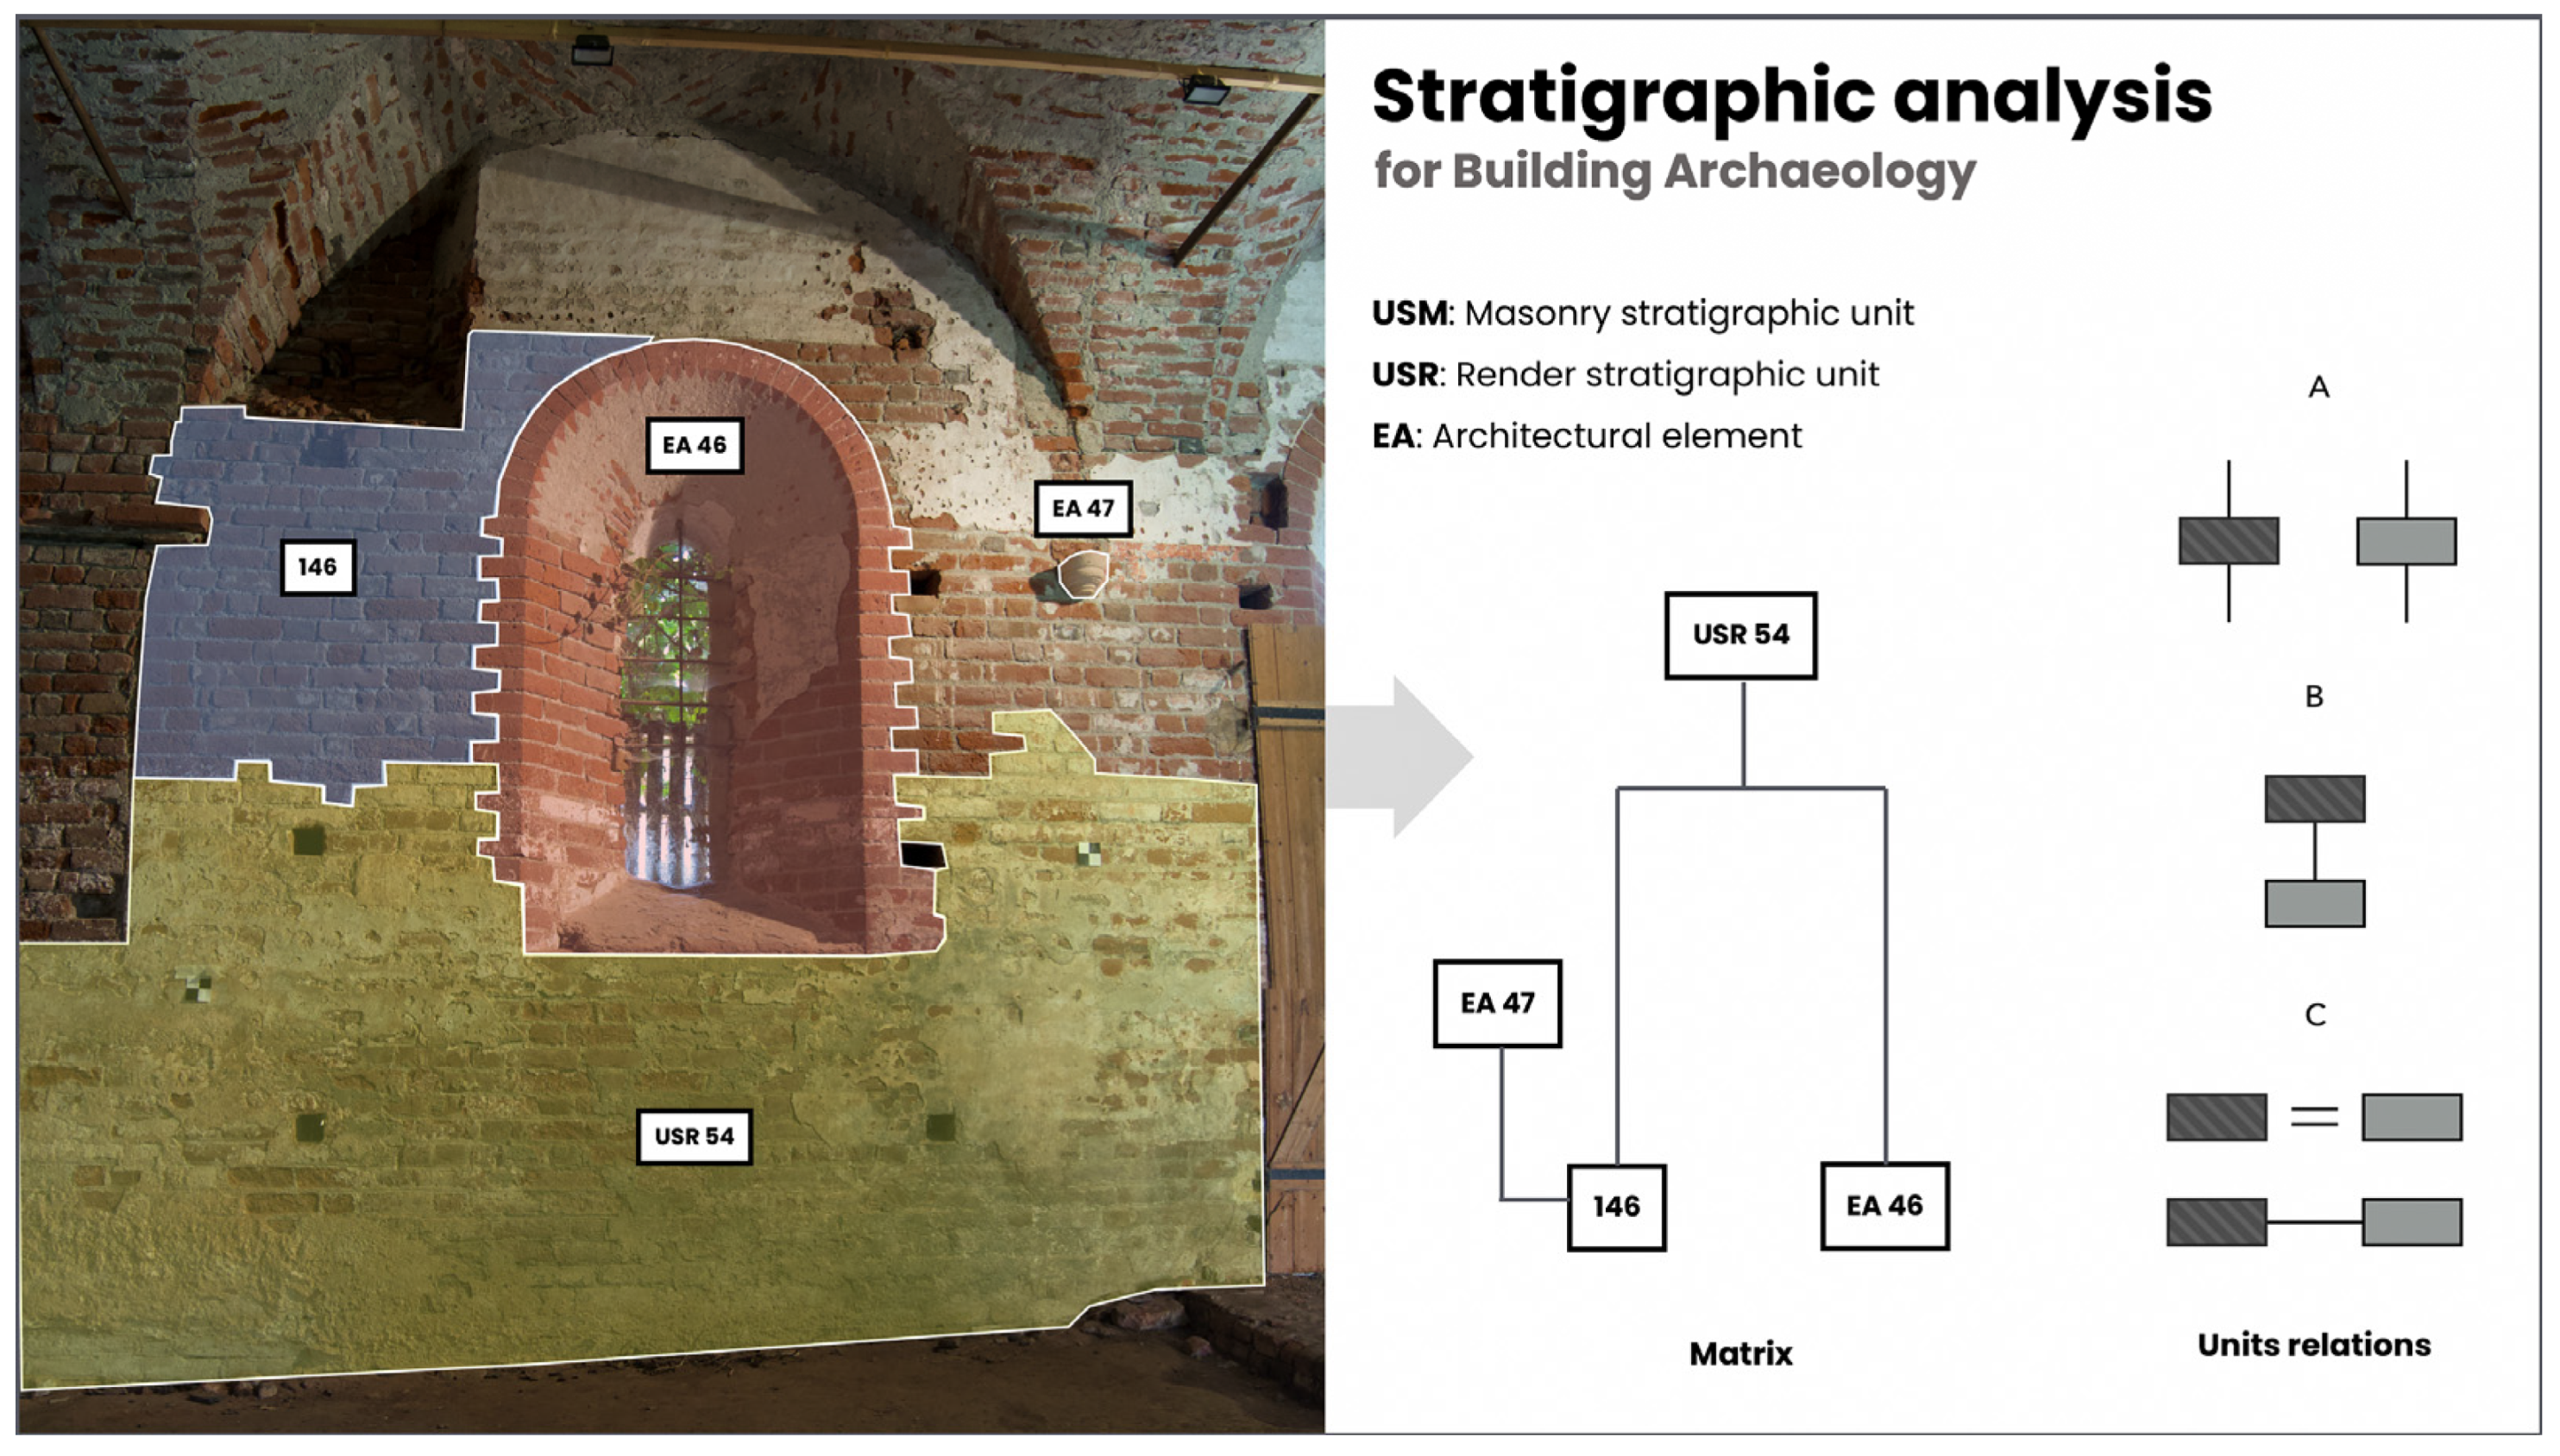
The documentation of stratigraphy is based on the collection of graphical and alphanumerical data related to stratigraphic units: layers on masonries have to be surveyed depending on their position, materials, and connections with other layers. These data can be collected using metric and photographic surveys to acquire masonry complexity. The drawing phase is essential, and it is executed mainly by using AutoCAD software (version 2020) for retracing the boundaries’ delimitation of units on orthoimages (Figure 6).
According to the archaeological method, the detected units must be linked by establishing three types of physical relations: overlapping, equality, and no connection (Figure 5). These relations must be set and graphically represented using the stratigraphic diagram: the Harris’ Matrix [25]. Through this schematic diagram, archaeological and architectural layers can be sequenced to establish a relative chronology (based on physical relations). A more accurate interpretation can be reached by validating the relative chronology with other external resources (historical archives) or precise analyses (archaeometry or chemical investigations of materials).
2.2. Stratigraphic Analysis of the Frinco Castle
The stratigraphic investigation of the Frinco Castle, through the archaeological method, was planned to document and analyse stratigraphic units of construction evidence of external masonries, including the courtyard. A stratigraphic survey concerning the internal spaces was impossible due to many rooms’ complex disrepair and dangerousness. At the same time, most rooms still retain interior cluttering furniture (it was quickly abandoned), so masonries cannot be inspected.
This analysis was conducted directly on the field with a notepad and by taking photos, and then the main analysis was performed on high-detailed orthophotos (by drawing stratigraphic unit boundaries in a CAD environment), double checking the early annotations (Figure 7). In particular, orthophotos of architectural fronts were generated by using the Agisoft Metashape software, achieving 1 cm/pixel of an average ground sample distance (GSD).
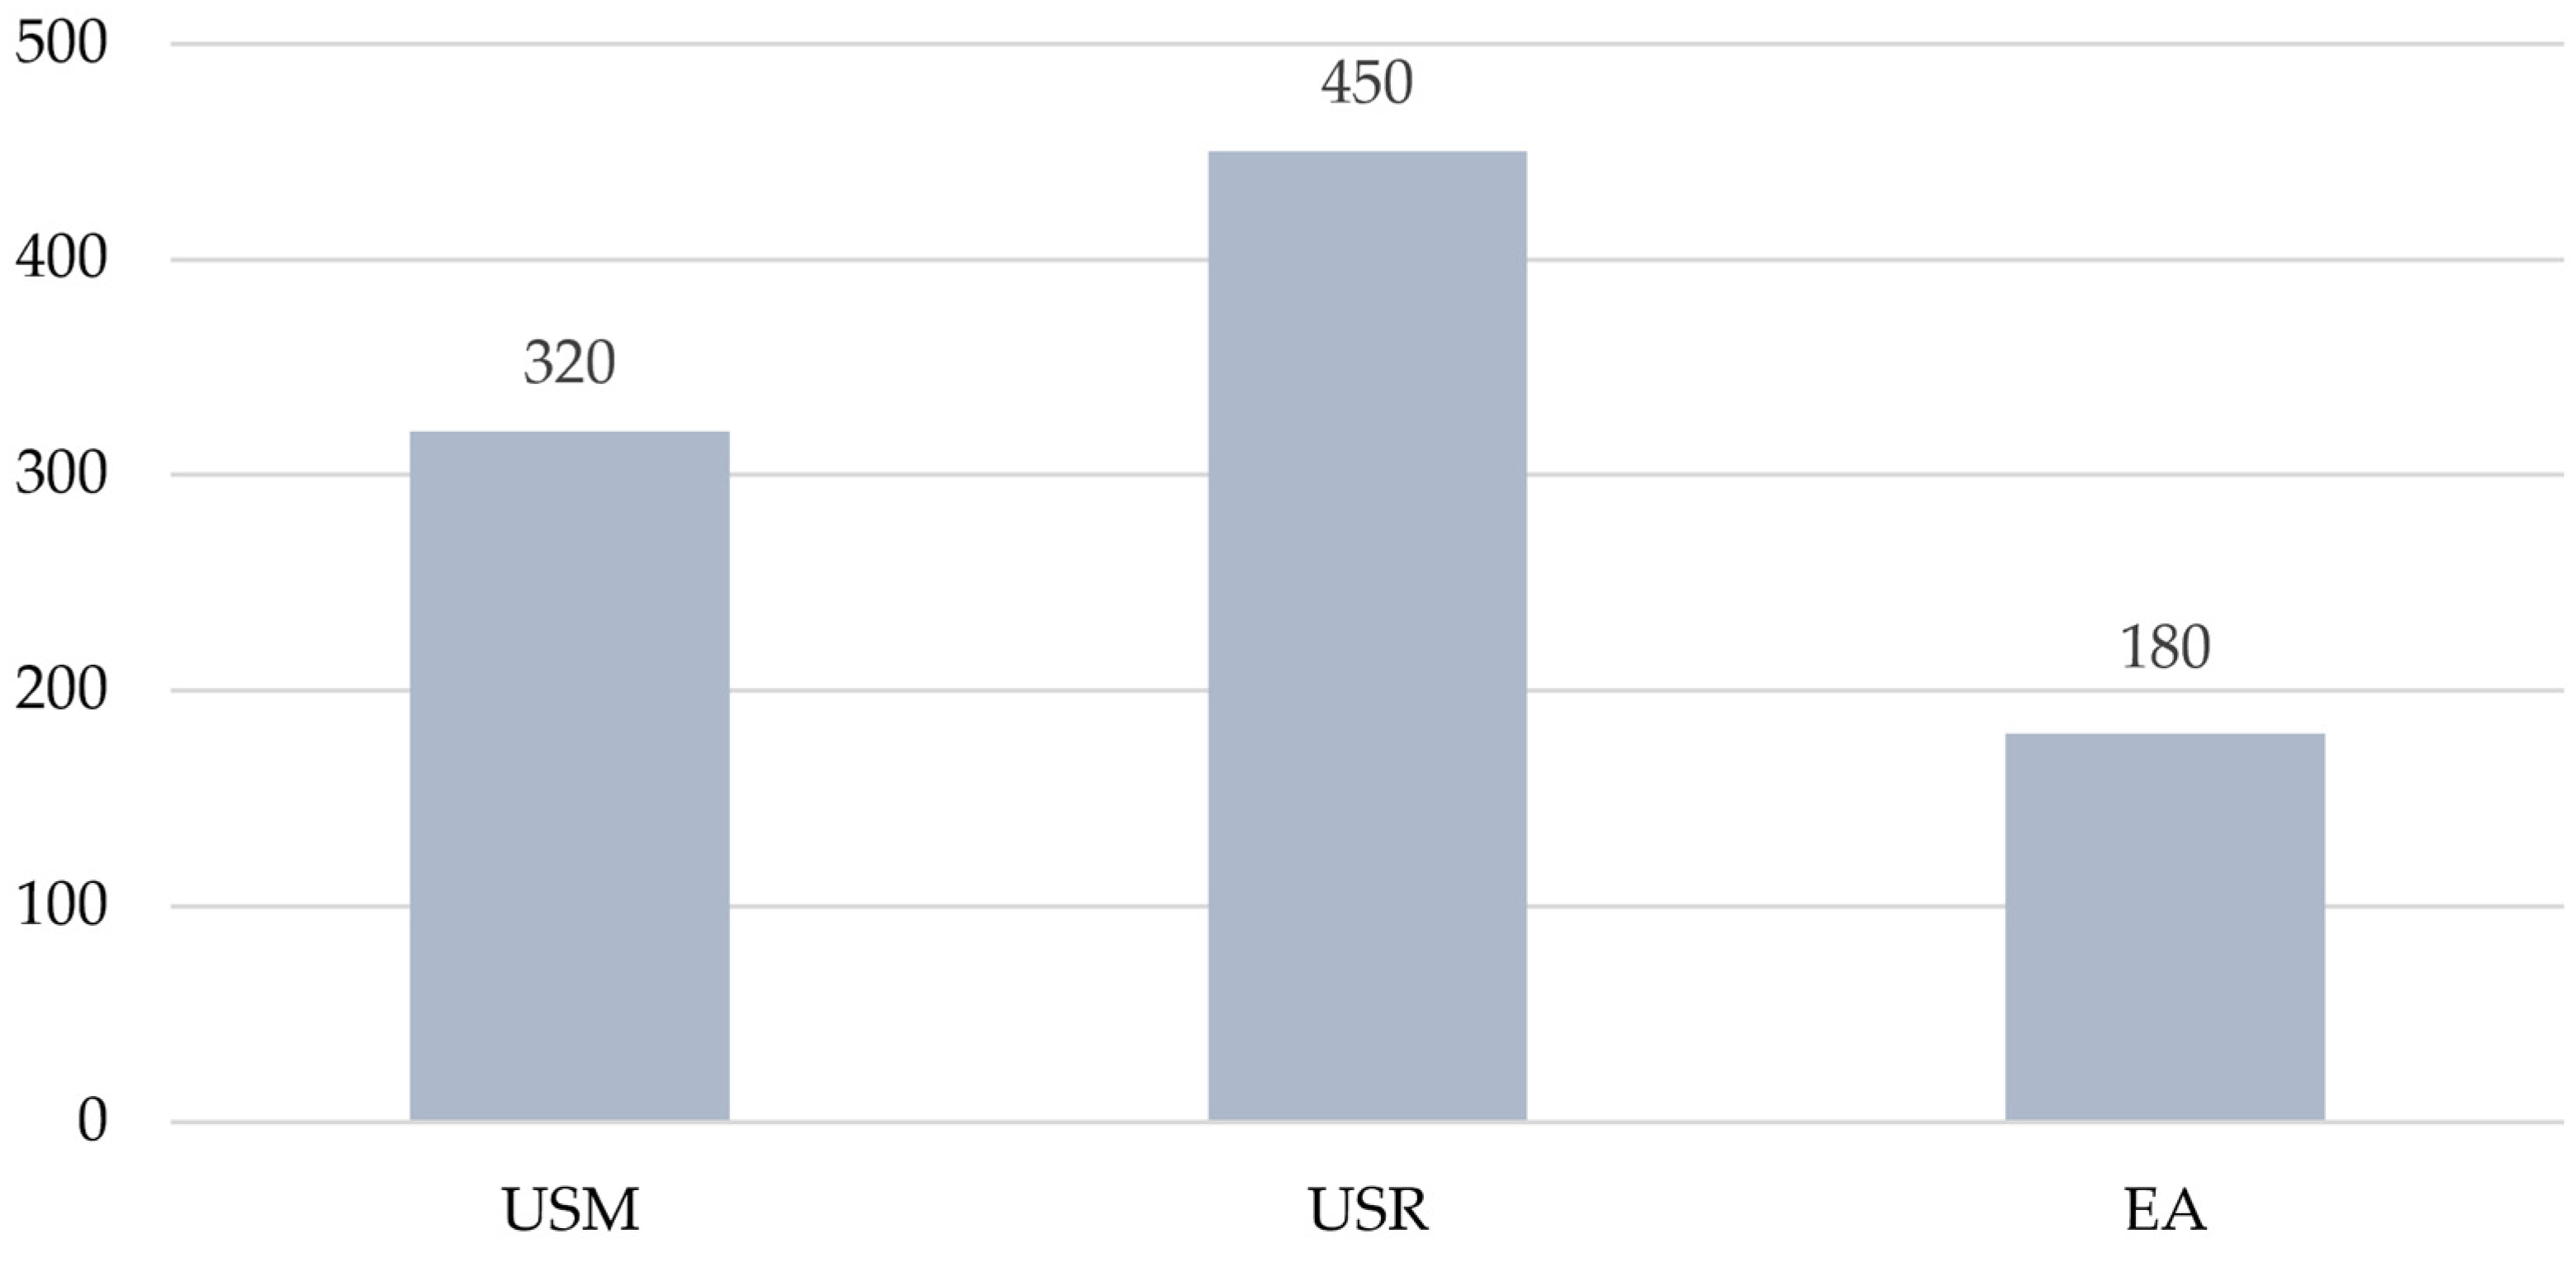
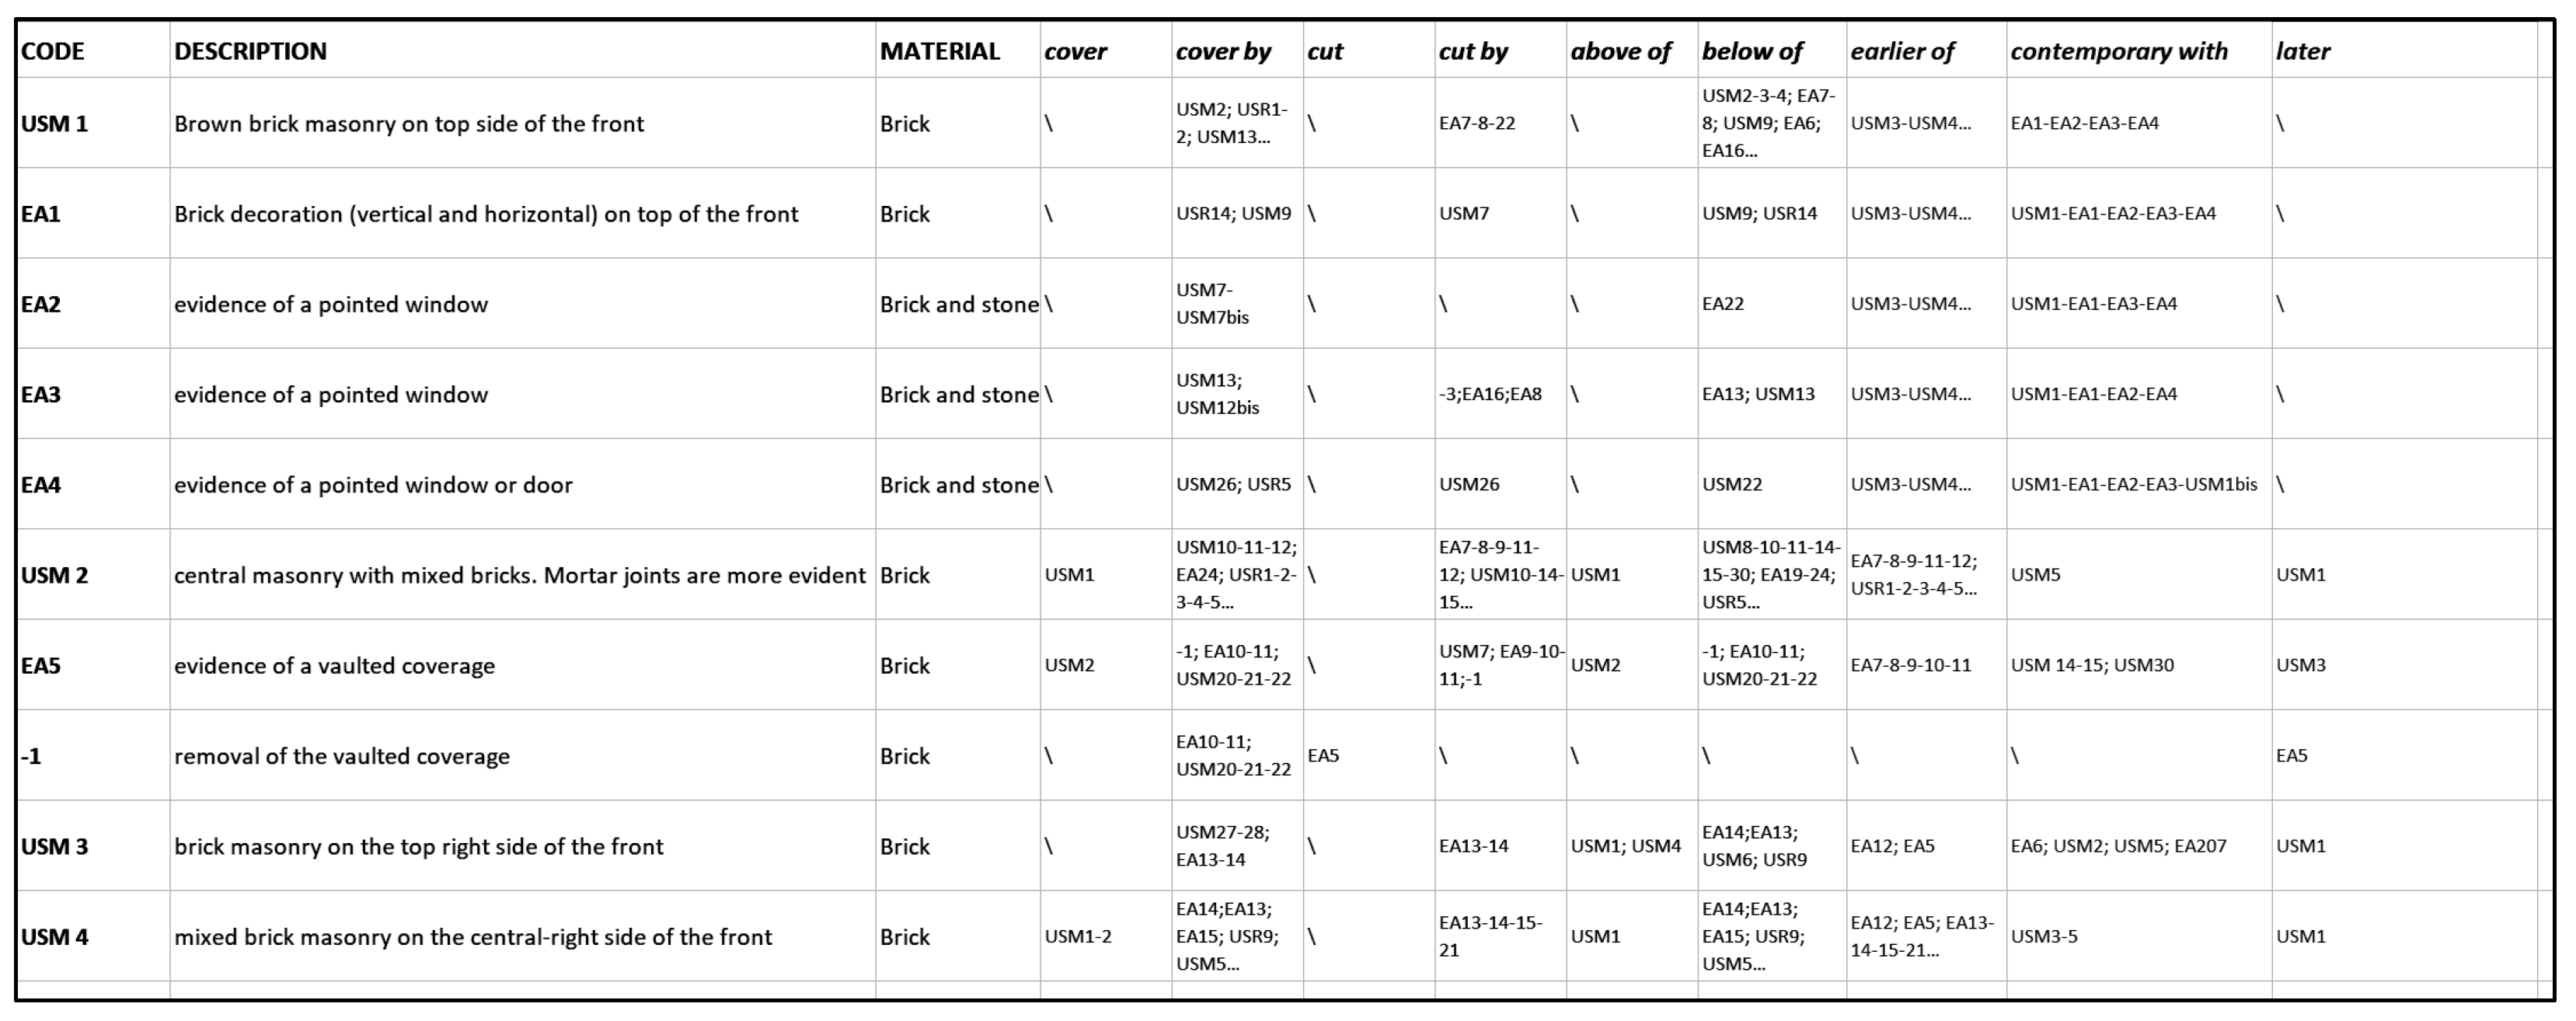
Reference acronyms related to the building archaeology domain were used for classifying the masonry stratification [20,26,27]: architectural element (EA), masonry stratigraphic units (USM), and render stratigraphic units (USR). The analysis of external fronts led to identifying 950 units: 320 USM, 450 USR, and 180 EA (Figure 8). These elements were catalogued inside a database for documenting descriptions, typology, materials, and physical relations (Figure 9).
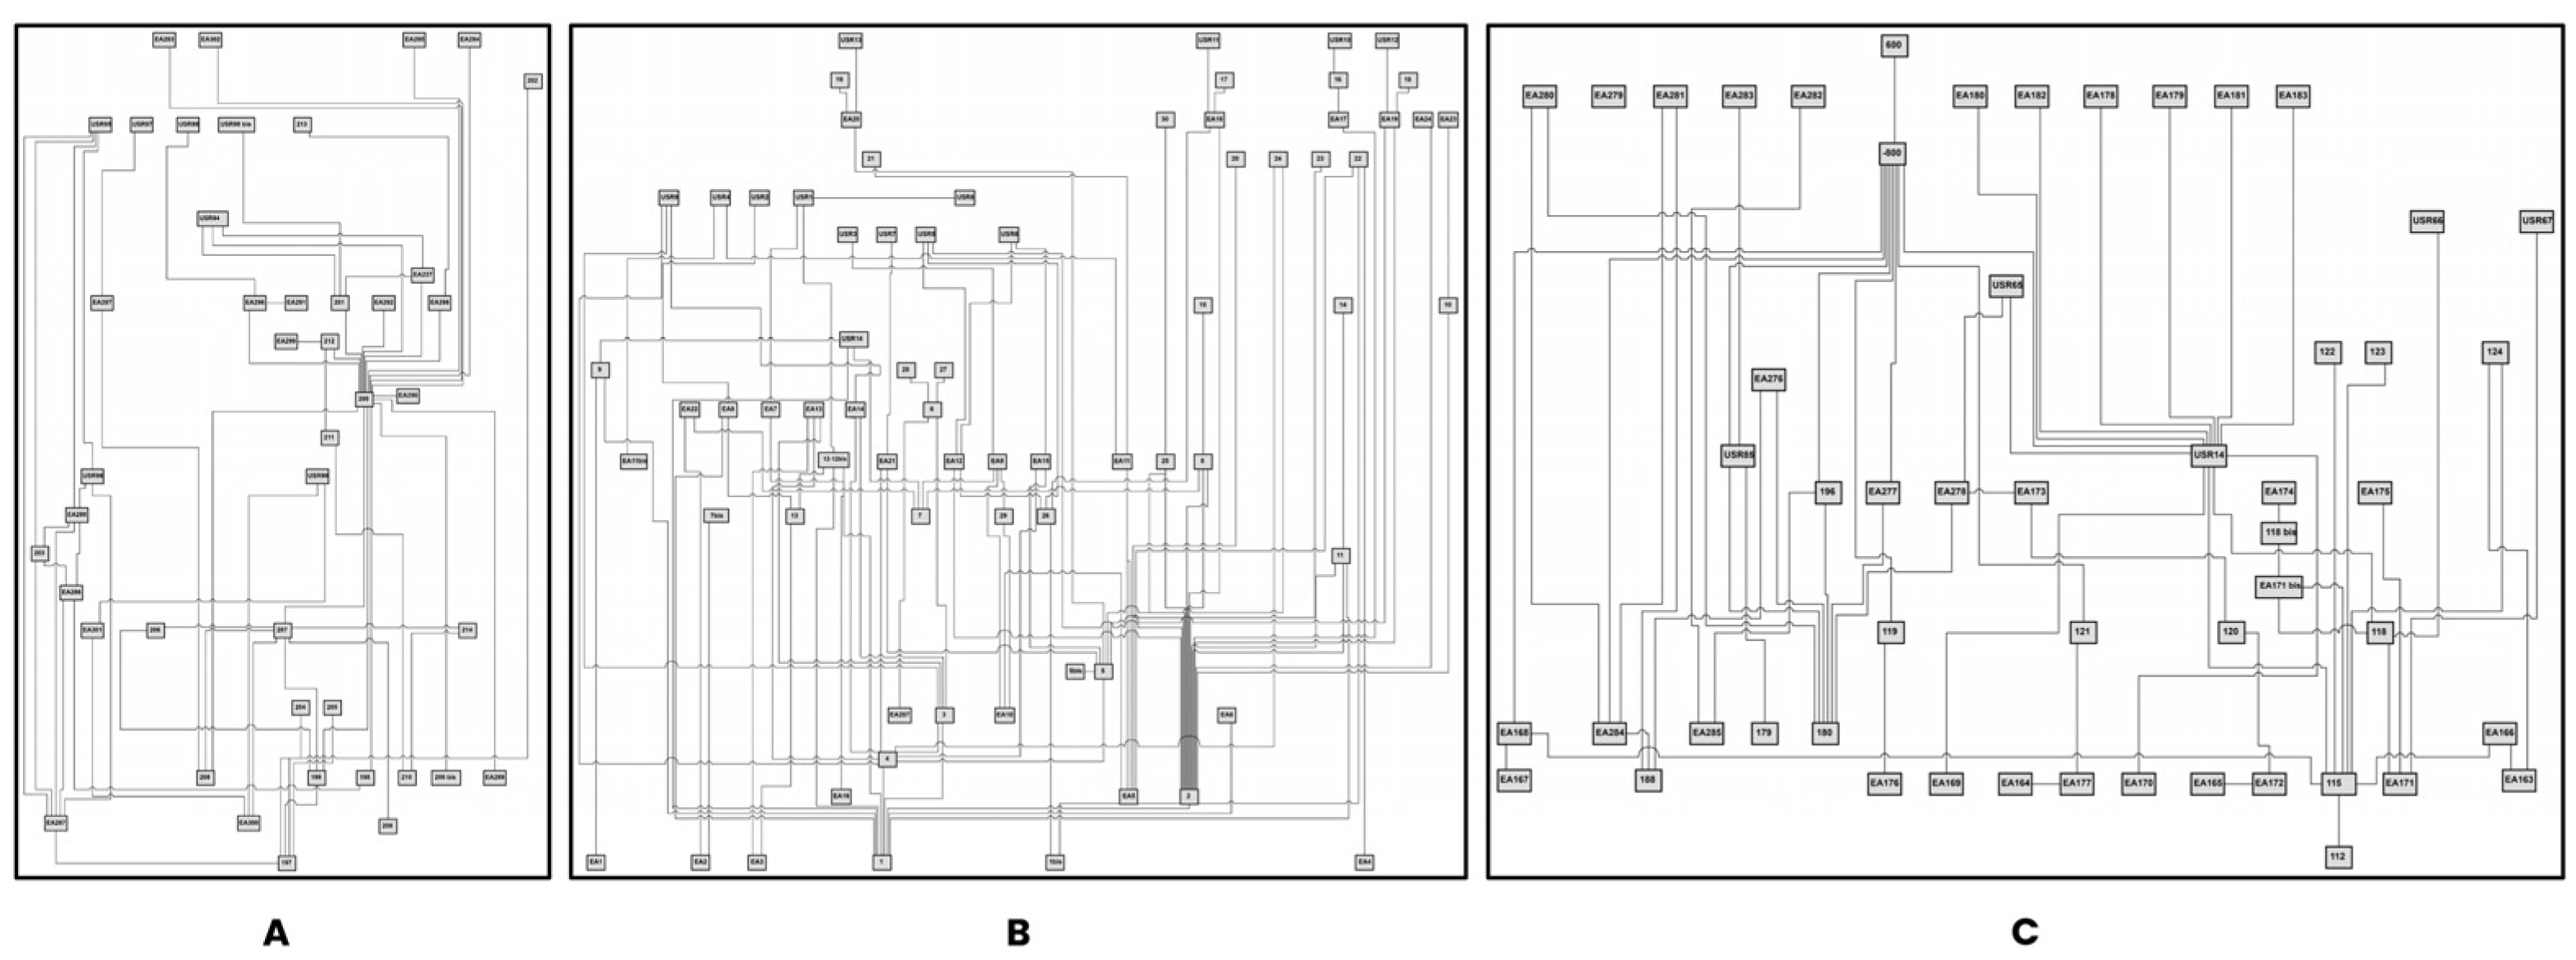
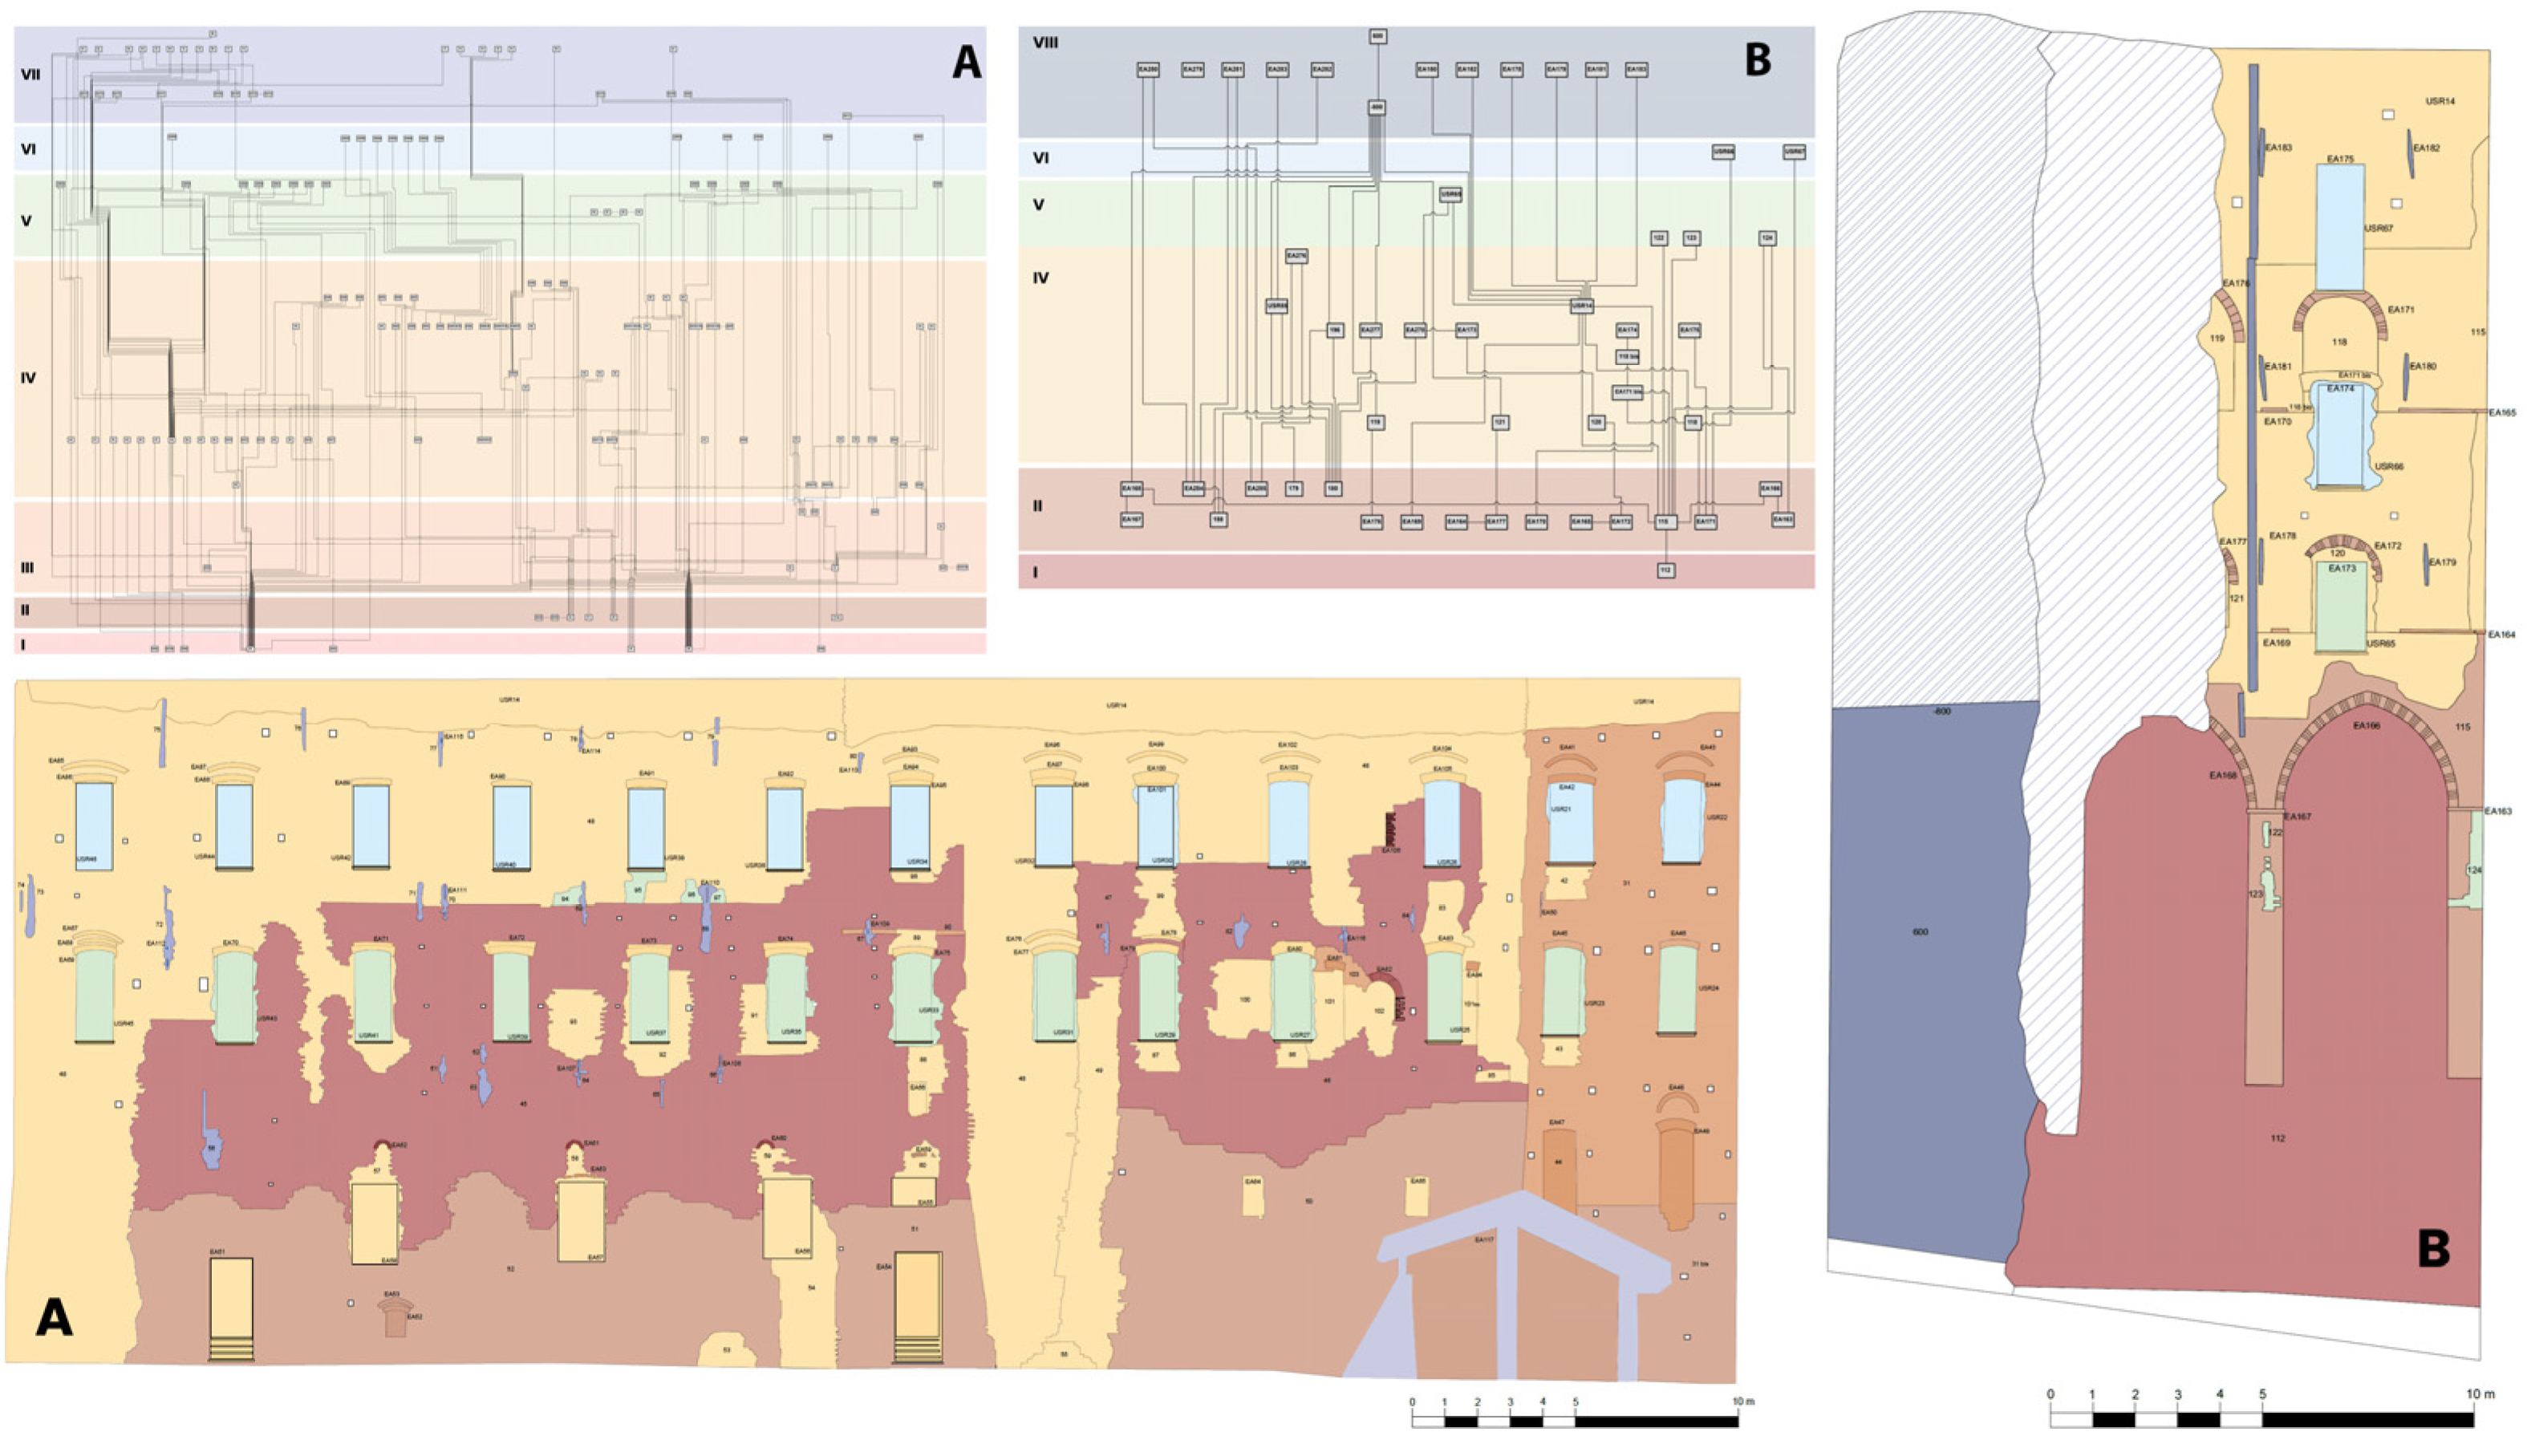
The interpretation phase started by using the Harris’ Matrix, or stratigraphic diagram. As mentioned in the introductory chapter on stratigraphy, this is a fundamental instrument for establishing physical relations among units and sequencing them in a hierarchical scheme. Depending on each architectural front, including the internal courtyard, 19 stratigraphic diagrams were compiled (Figure 10): physical relations and continuity–discontinuity relations were included as parameters during the matrix generations.
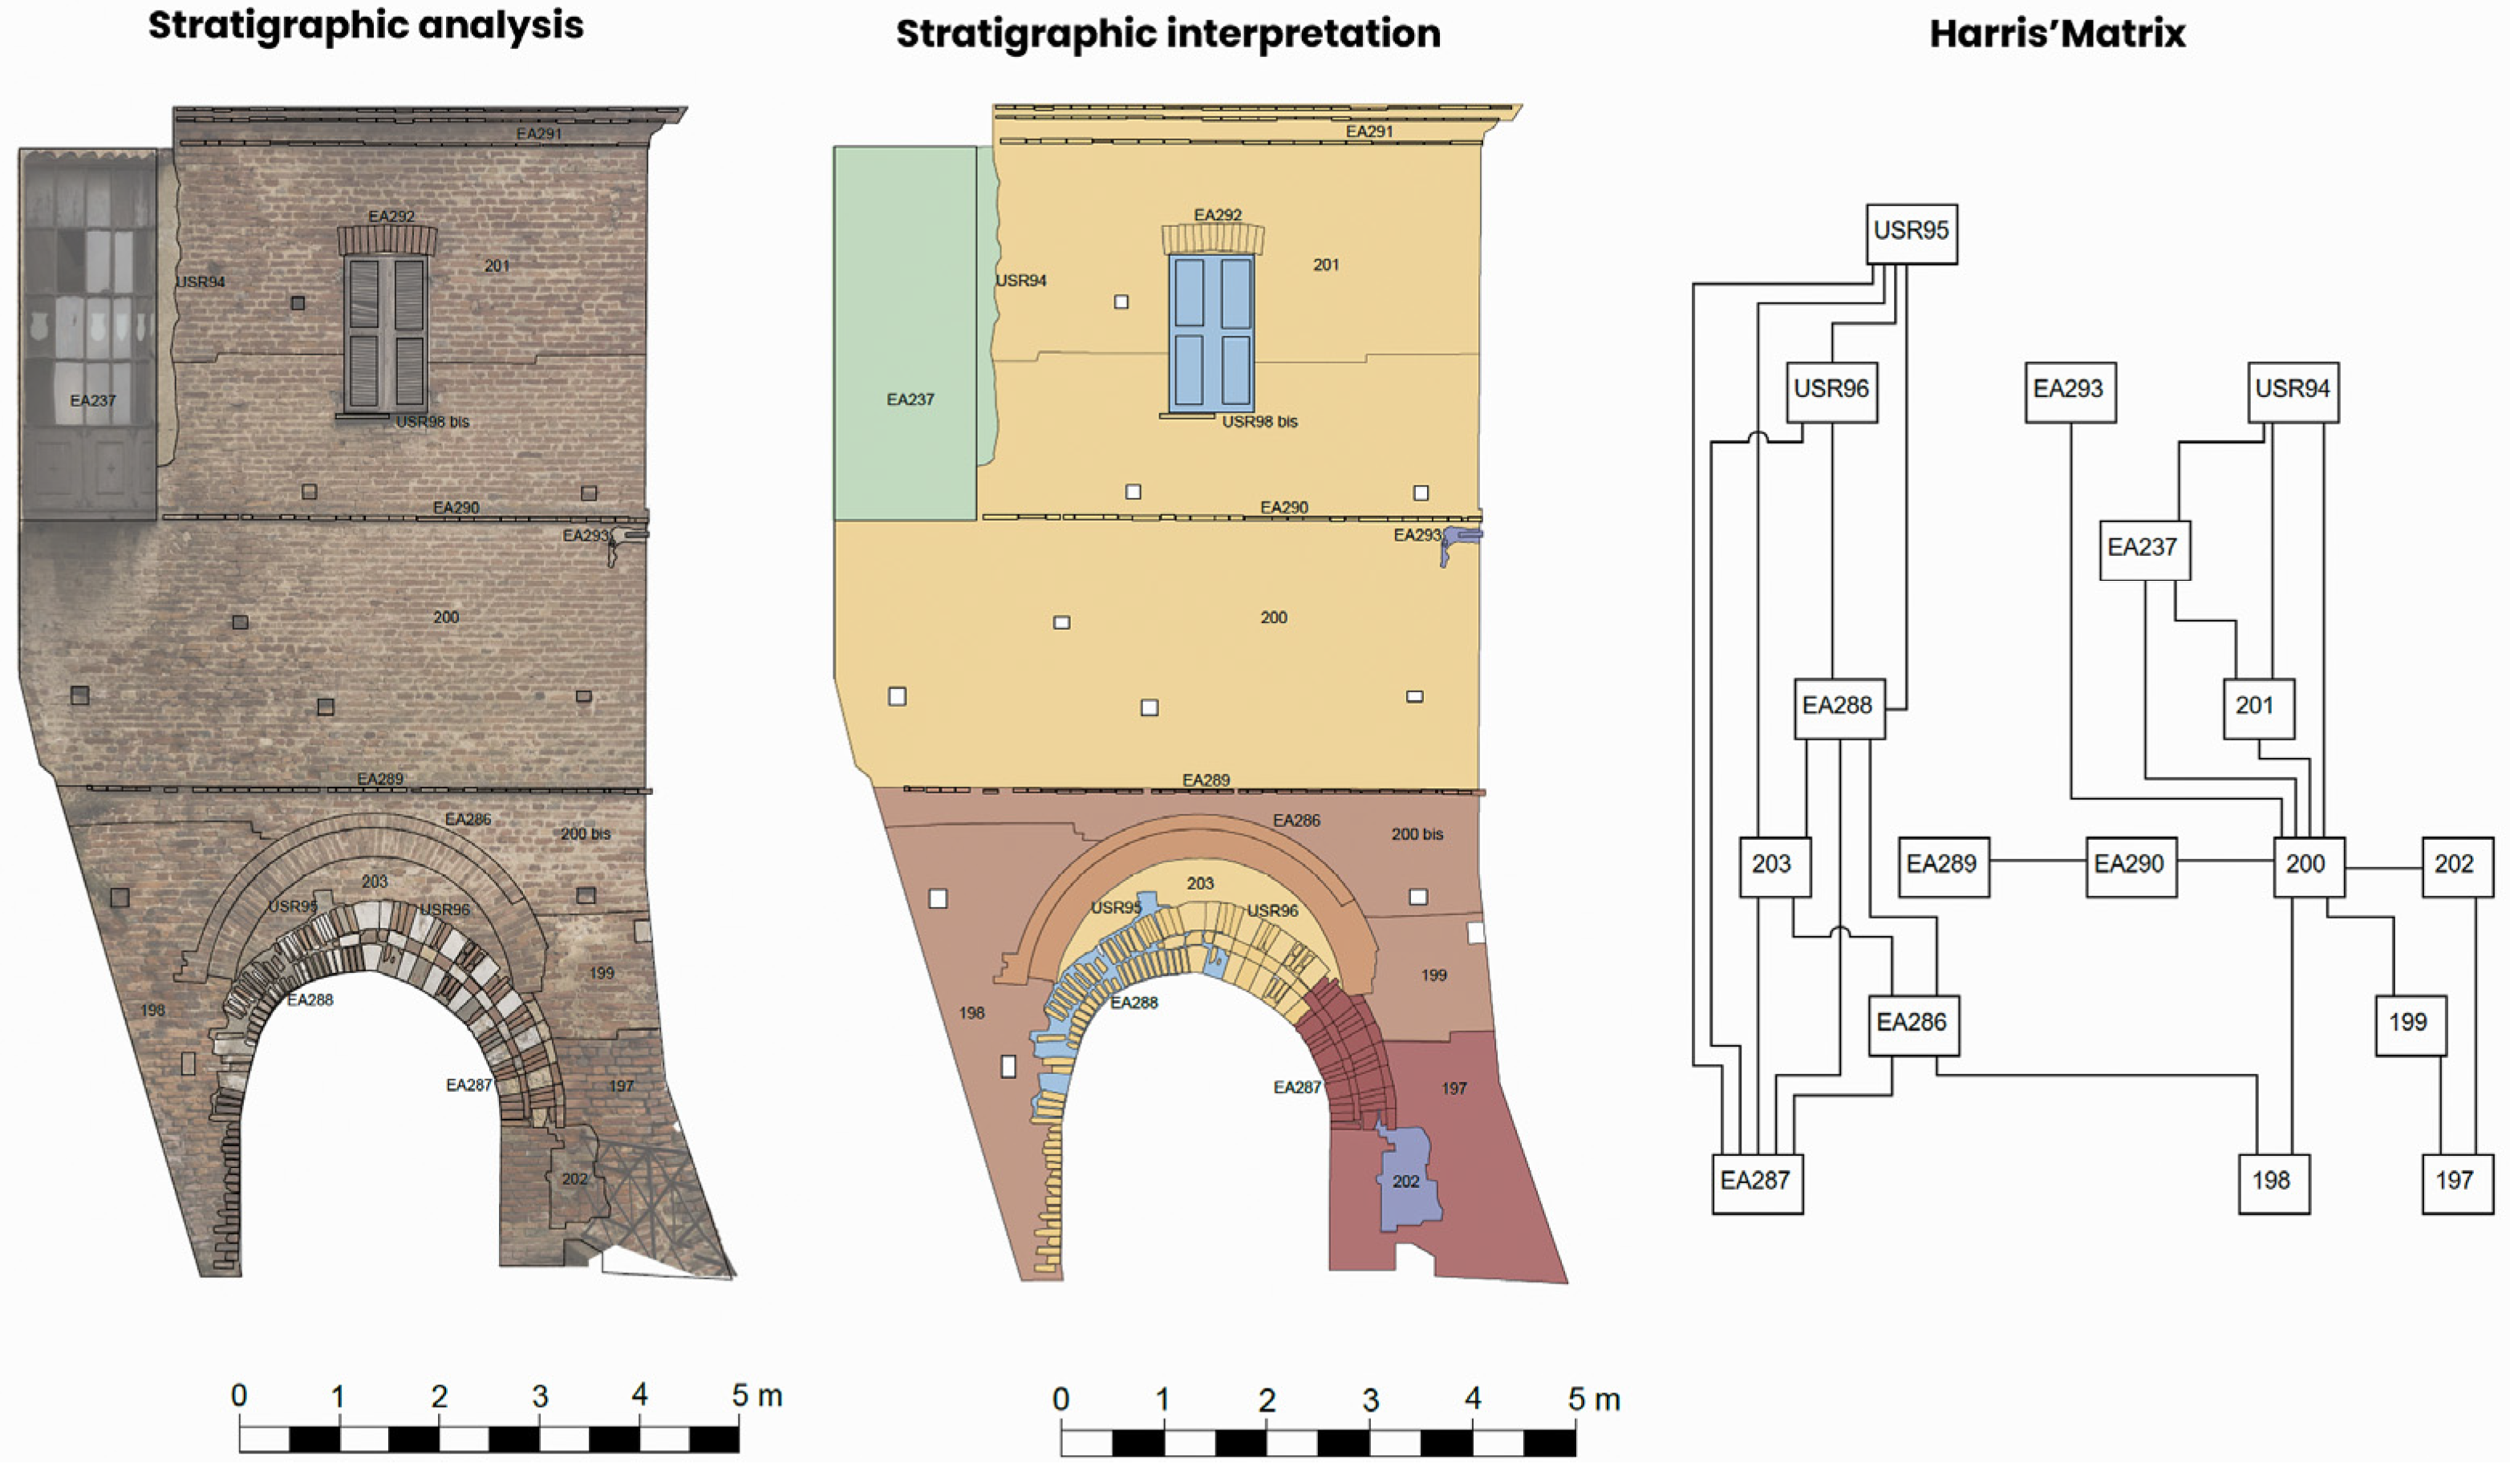
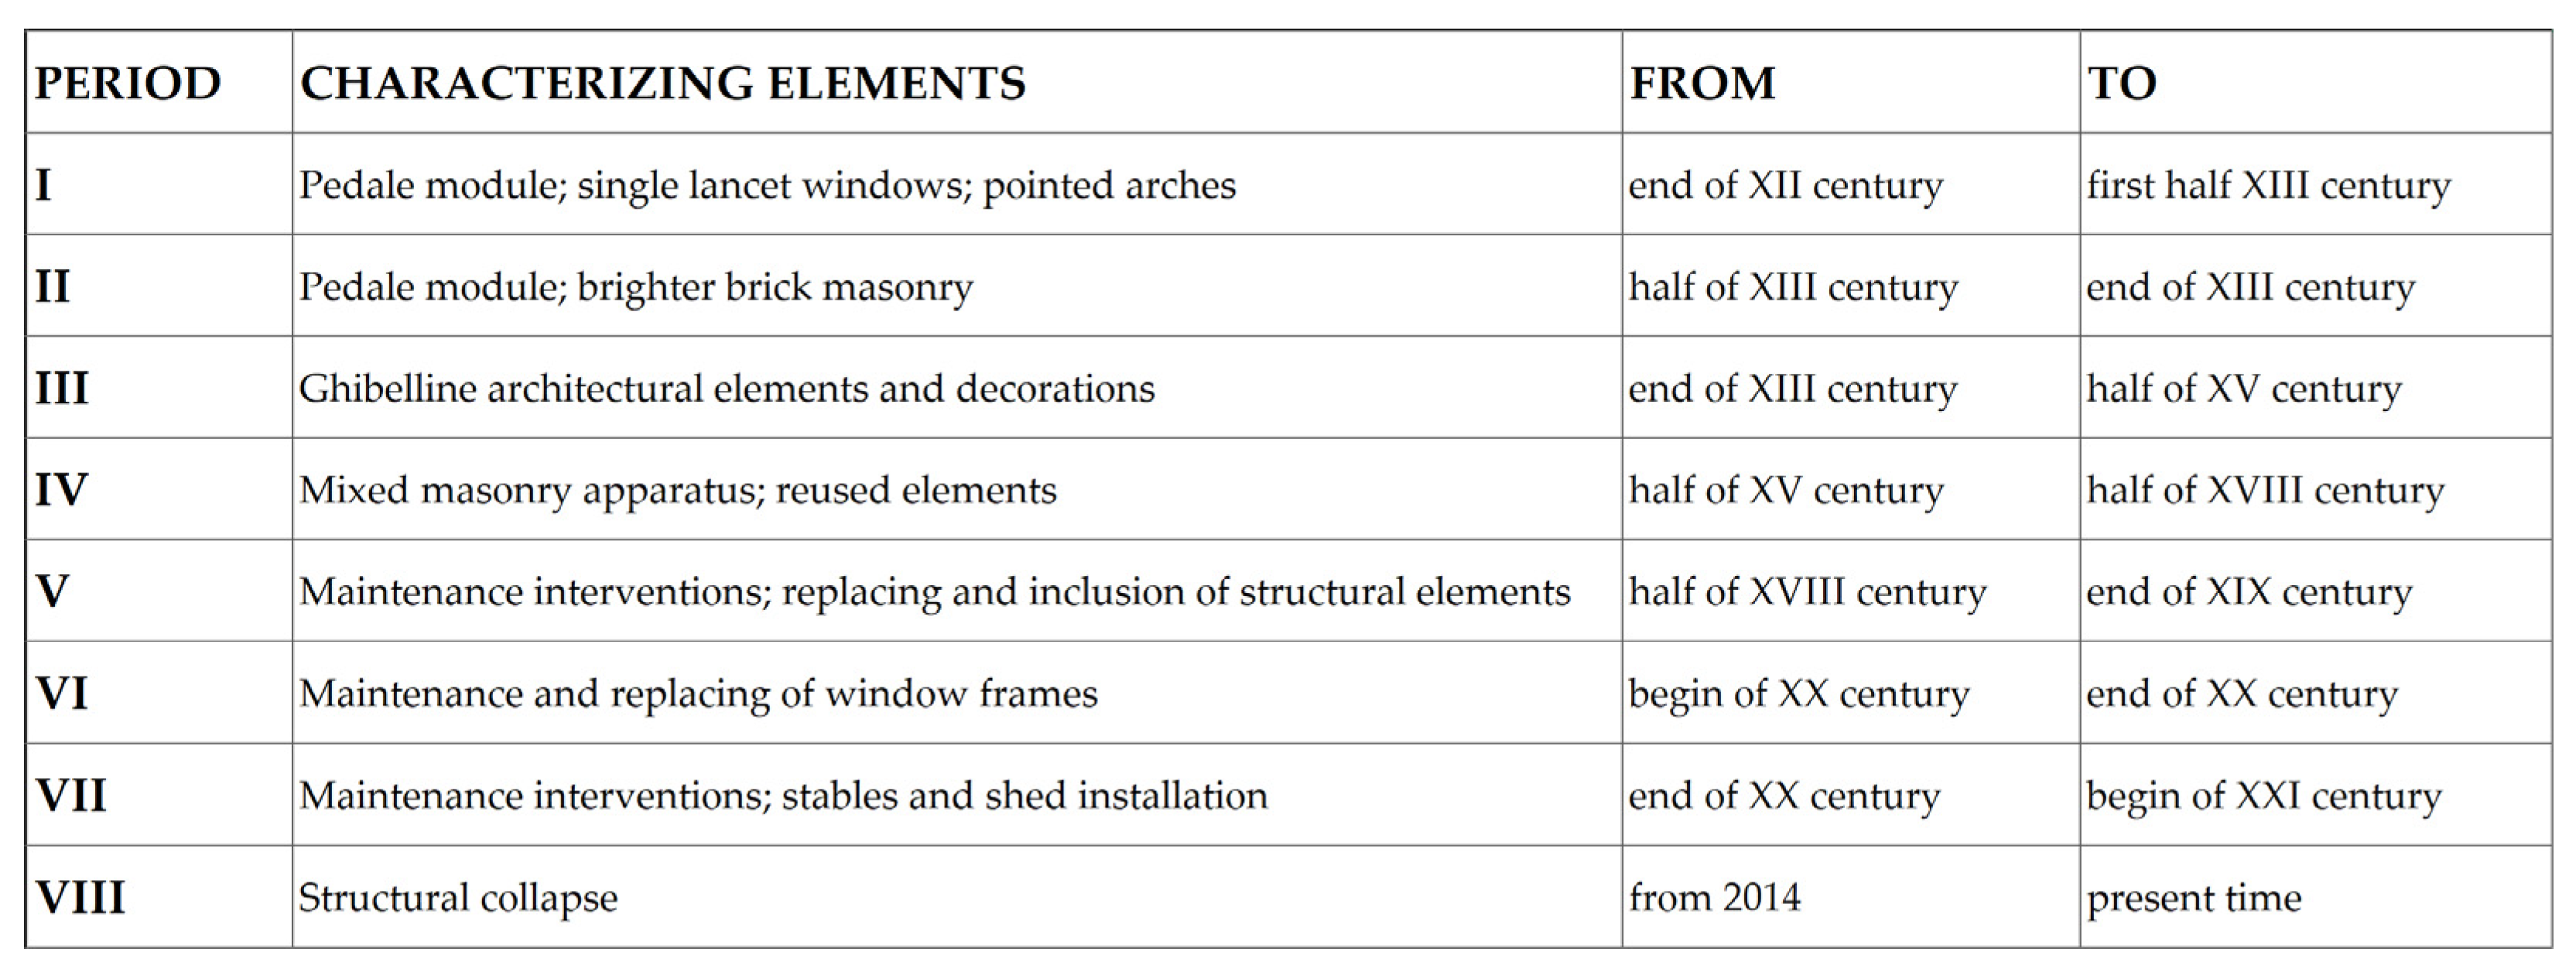
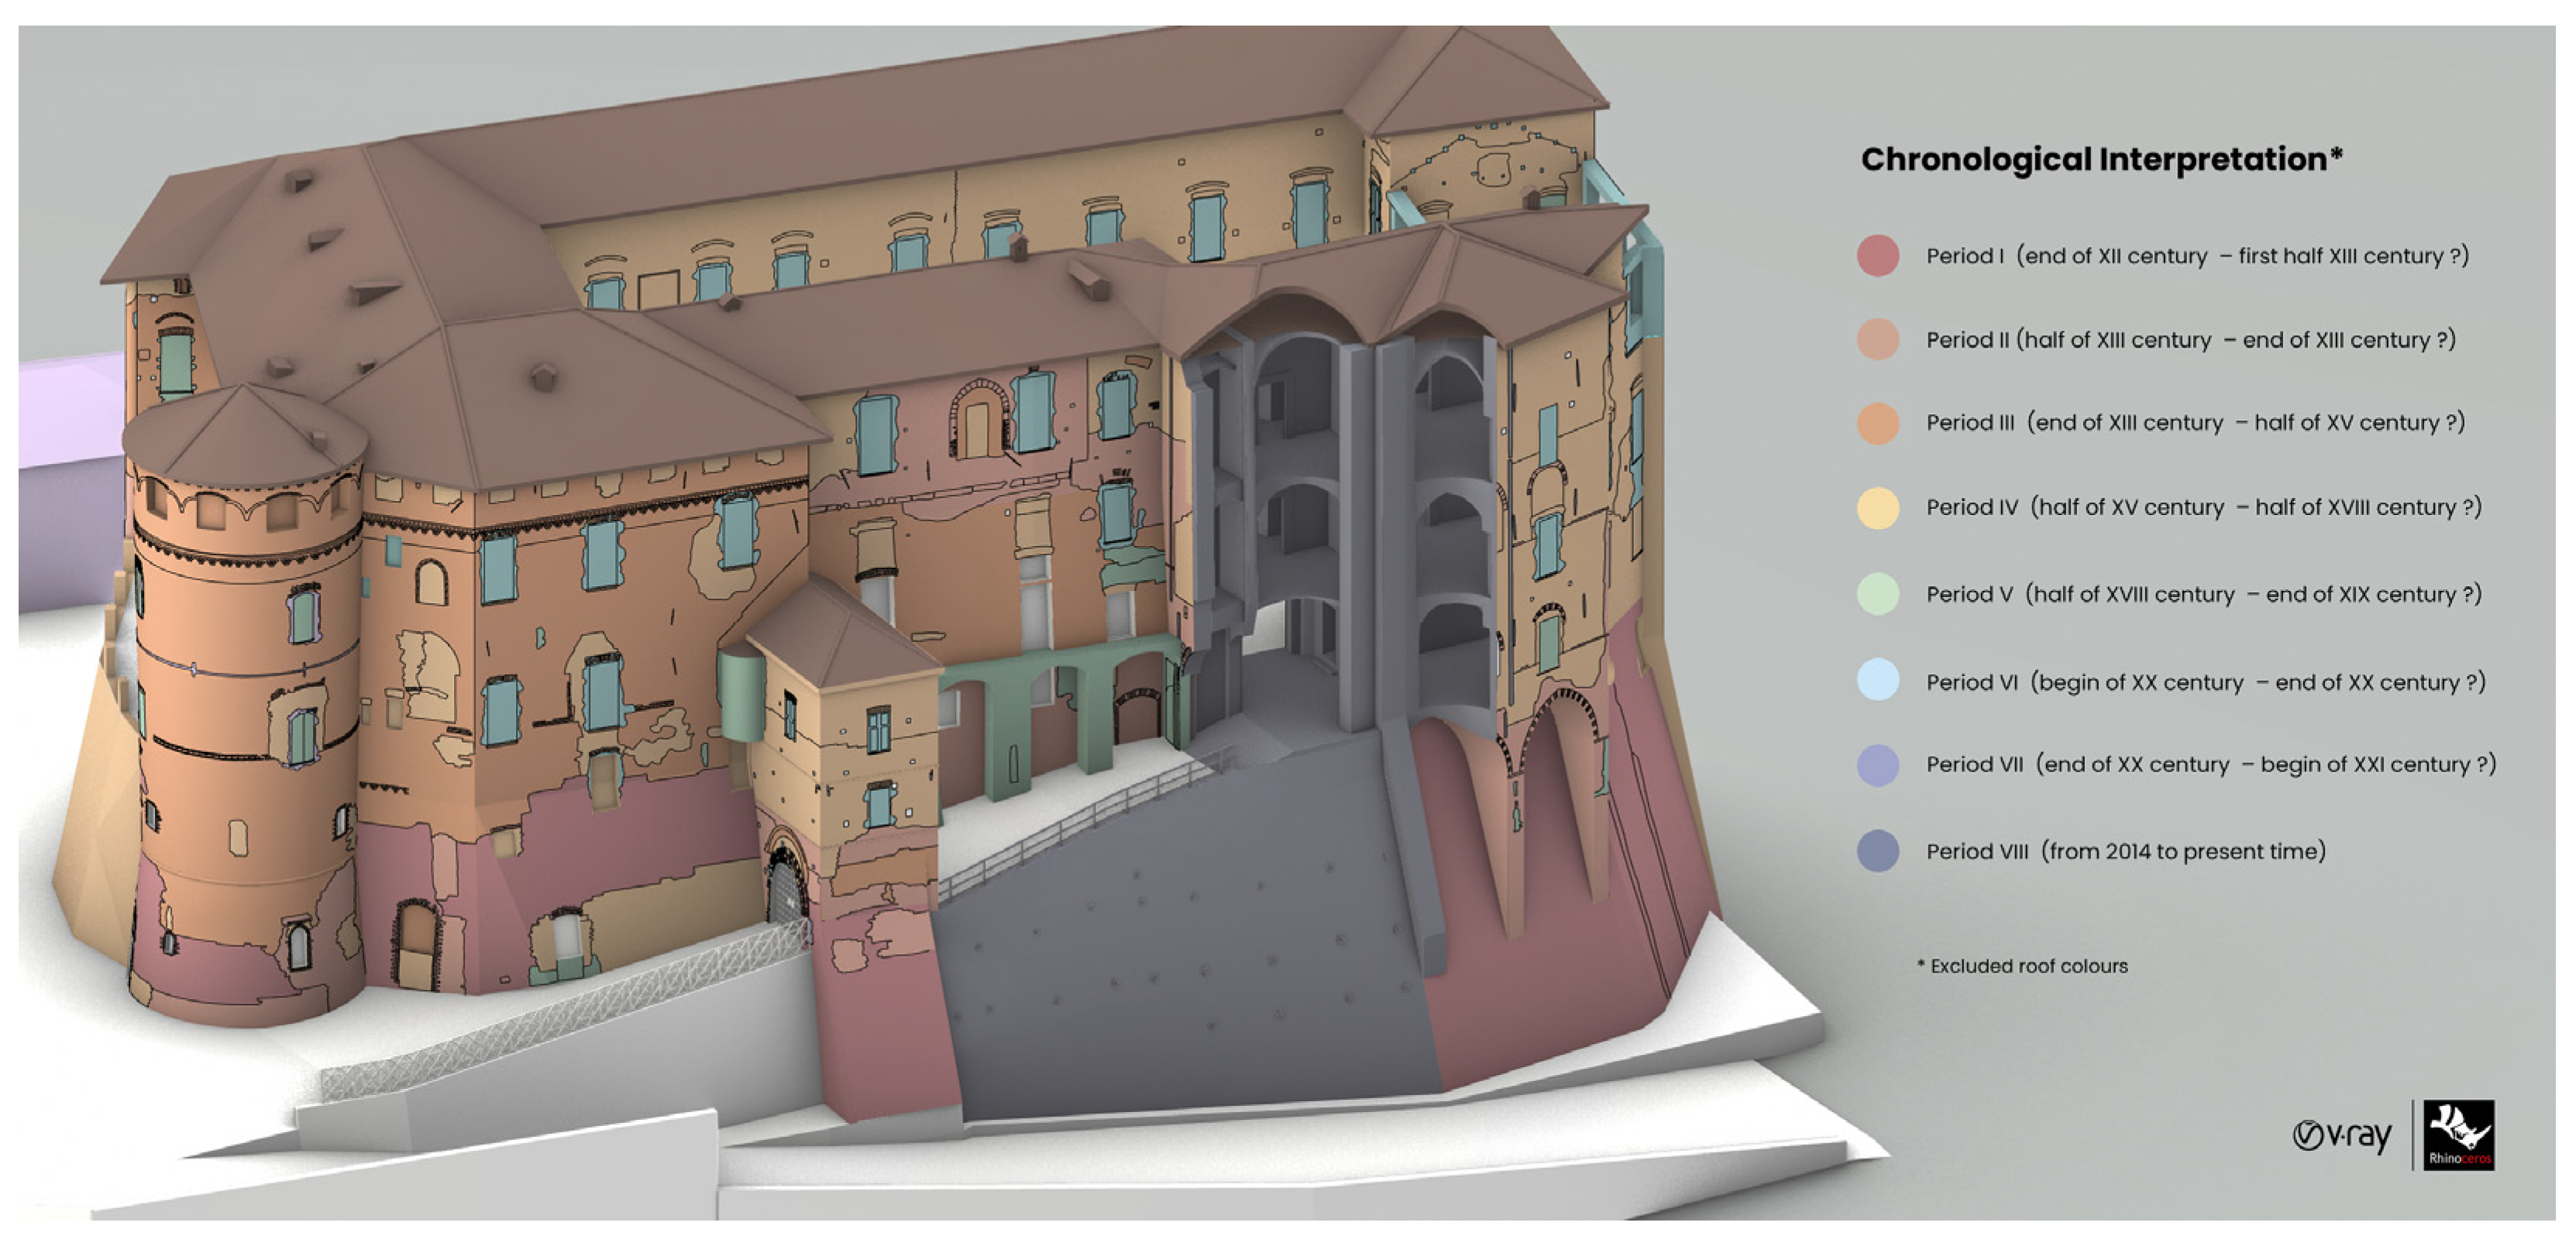
Once physical relations were established, stratigraphic units were collected into macro phases and periods to achieve a relative chronology for external masonries. The final analysis returned eight chronological periods, from the early construction site to the structural collapse period. The chronological sequence was graphically rendered on the orthophotos by setting false colours (Figure 11).
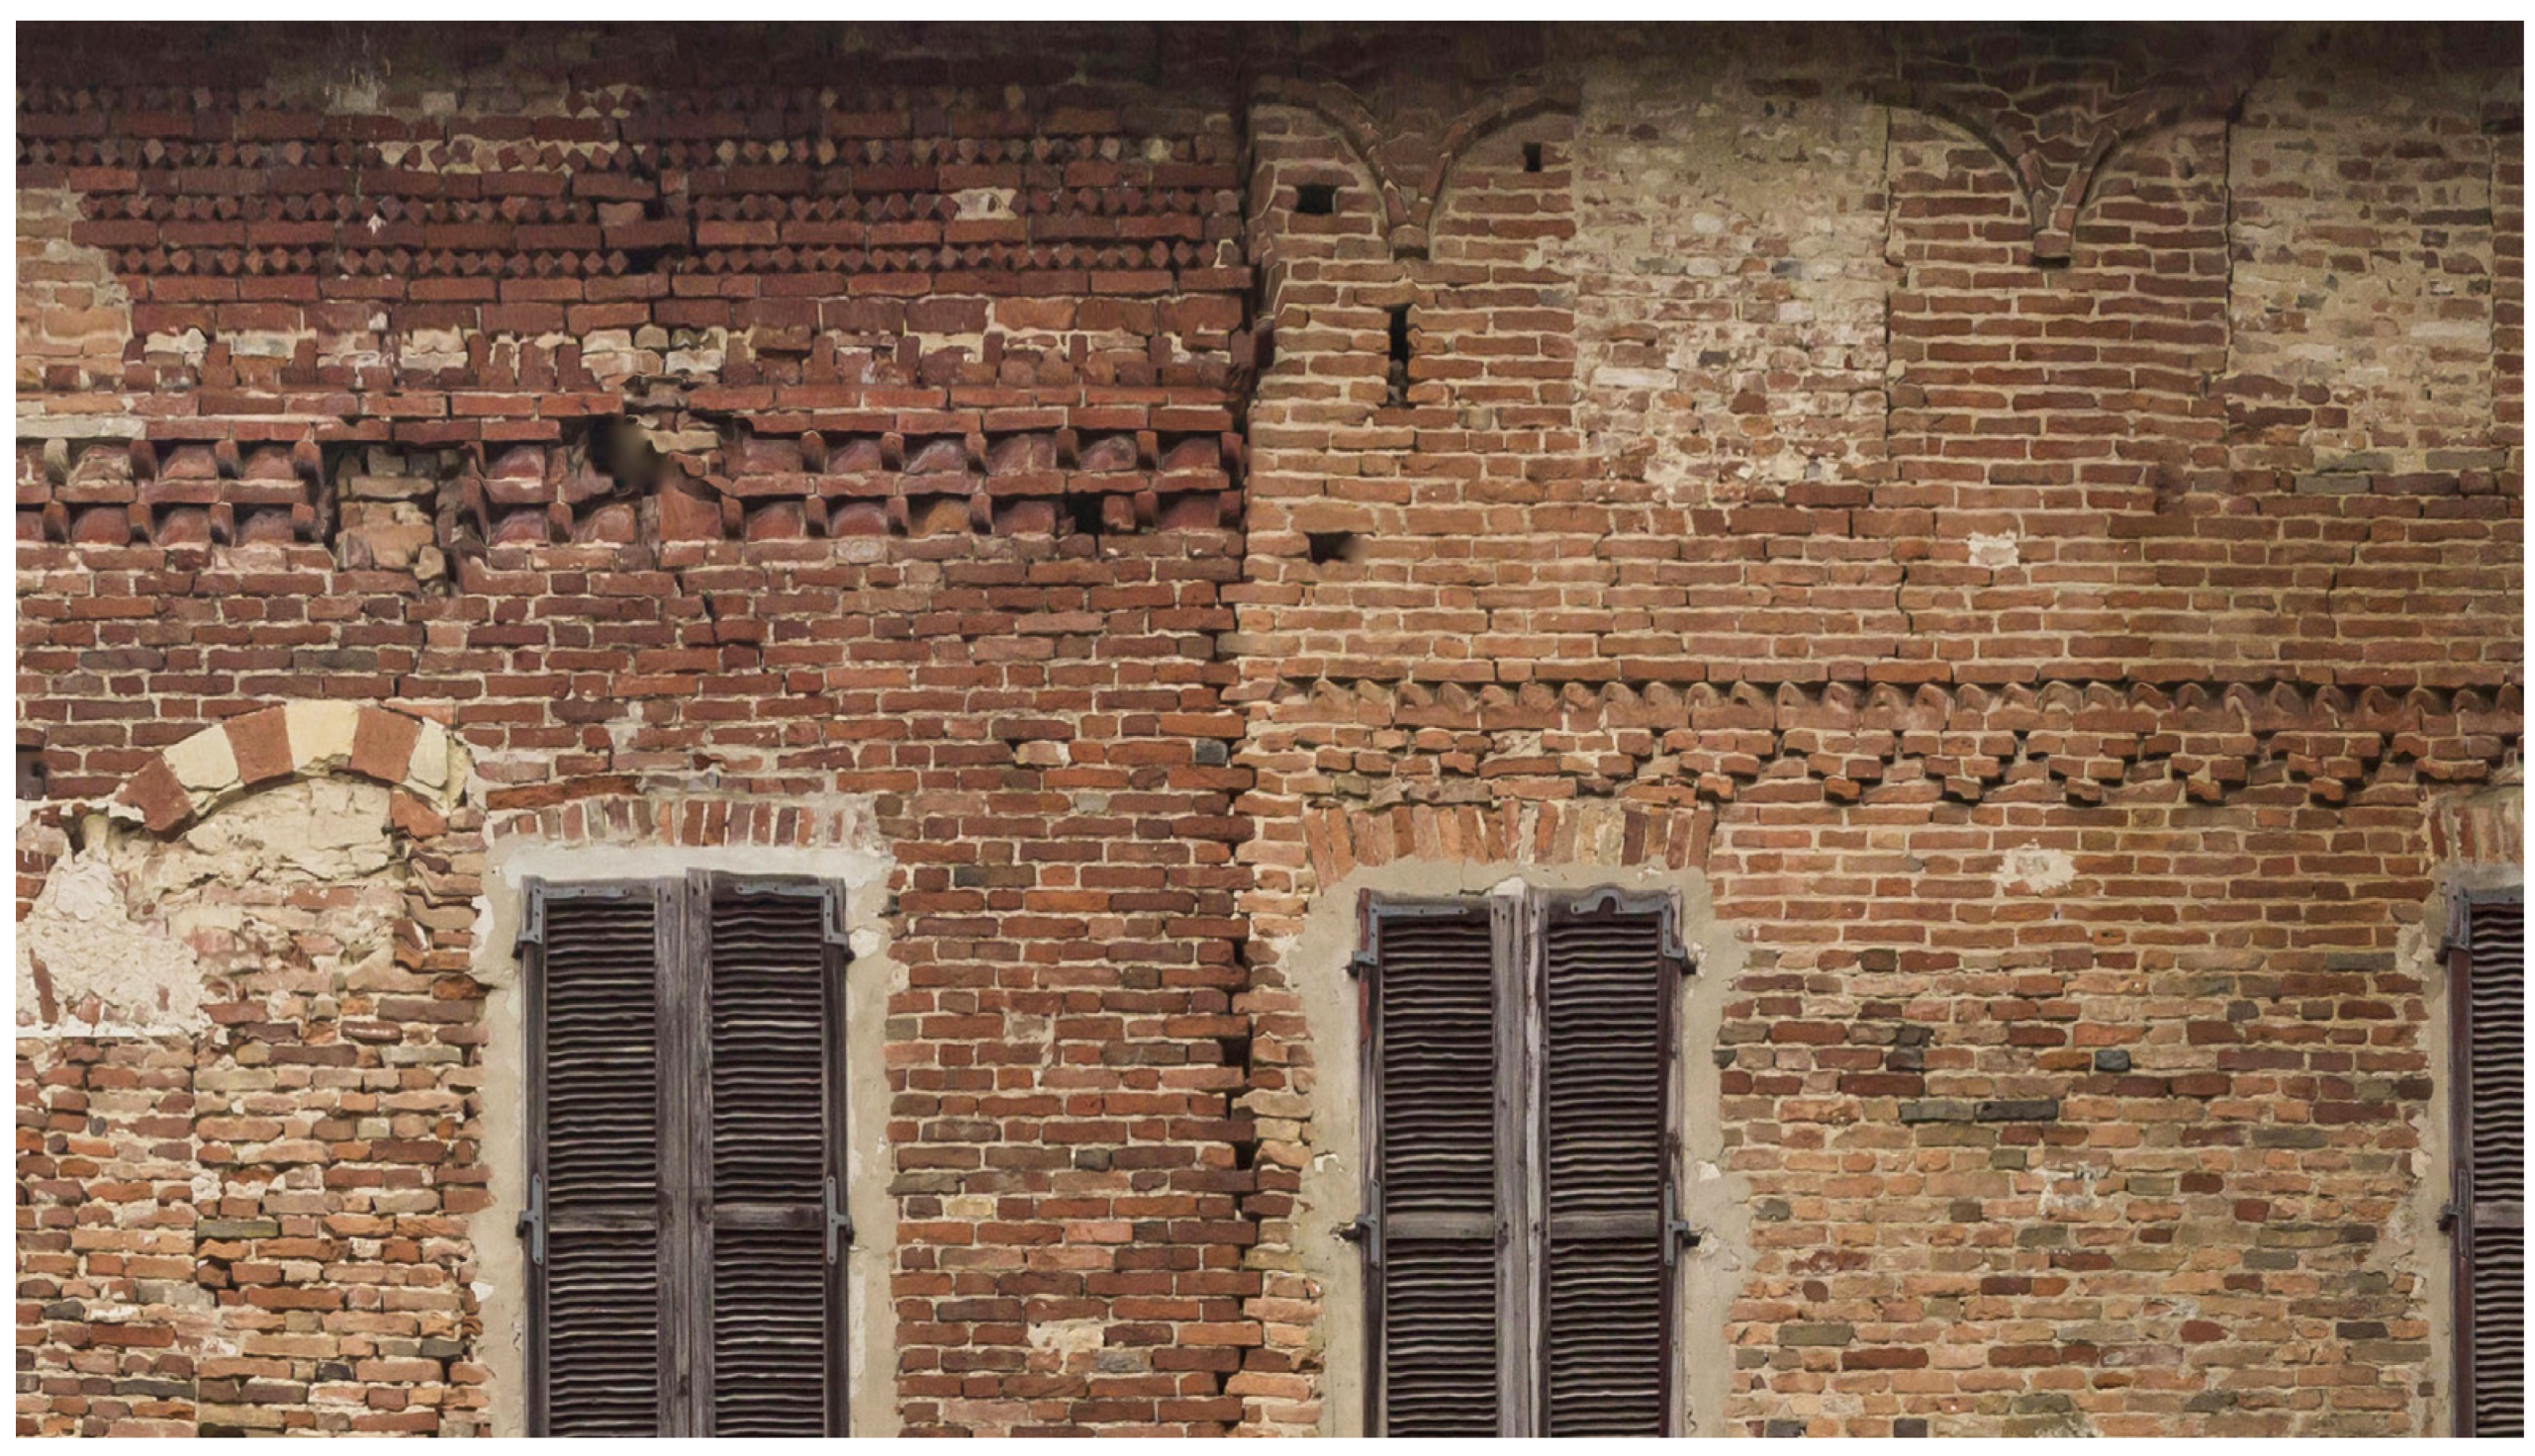
The earlier chronological phase (I) is related to a masonry composed of red/brown bricks, which still have the original mortar joints in certain areas. This masonry apparatus also shows some dark bricks and signs of overcooking but is used for composing the general texture of the masonry. The detected brick measures approximately 37 cm × 14.5 cm, and it may be referred to as the Pedale module (cm 30–35 × 14–16 × 6.5–7) that was widely used in medieval contexts in the XI–XII centuries [20,27,28]. This initial constructive phase can be detected on the north front (USM45-46 on the central area), on the west front (USM1 on the central-upper area), on the lower part of the towers (USM125 on the circular tower and USM197 on the square access tower on the south side), and on the south side of the internal courtyard. Furthermore, this constructive site is characterised by brick and stone (bichrome) openings: single lancet windows (EA2-3), pointed arches related to the primary access (EA287), and pointed arches on the courtyard (EA352). Particular rhomboid decorations on the west side are ascribed to this period (Figure 12). These can be located at the end of the XII century and the first half of the XIII century.
The second detected period (II) can be considered as an intermediate phase between the first and the third. It comprises brighter brick masonry, even though the brick dimension is approximately 37 cm × 14.5 cm as the first phase (USM2). It can be found on the north side, on the west front, and on the south and north sides of the internal courtyard (USM234). This masonry can be located between the first half of the XIII century and the end of the same century [28].
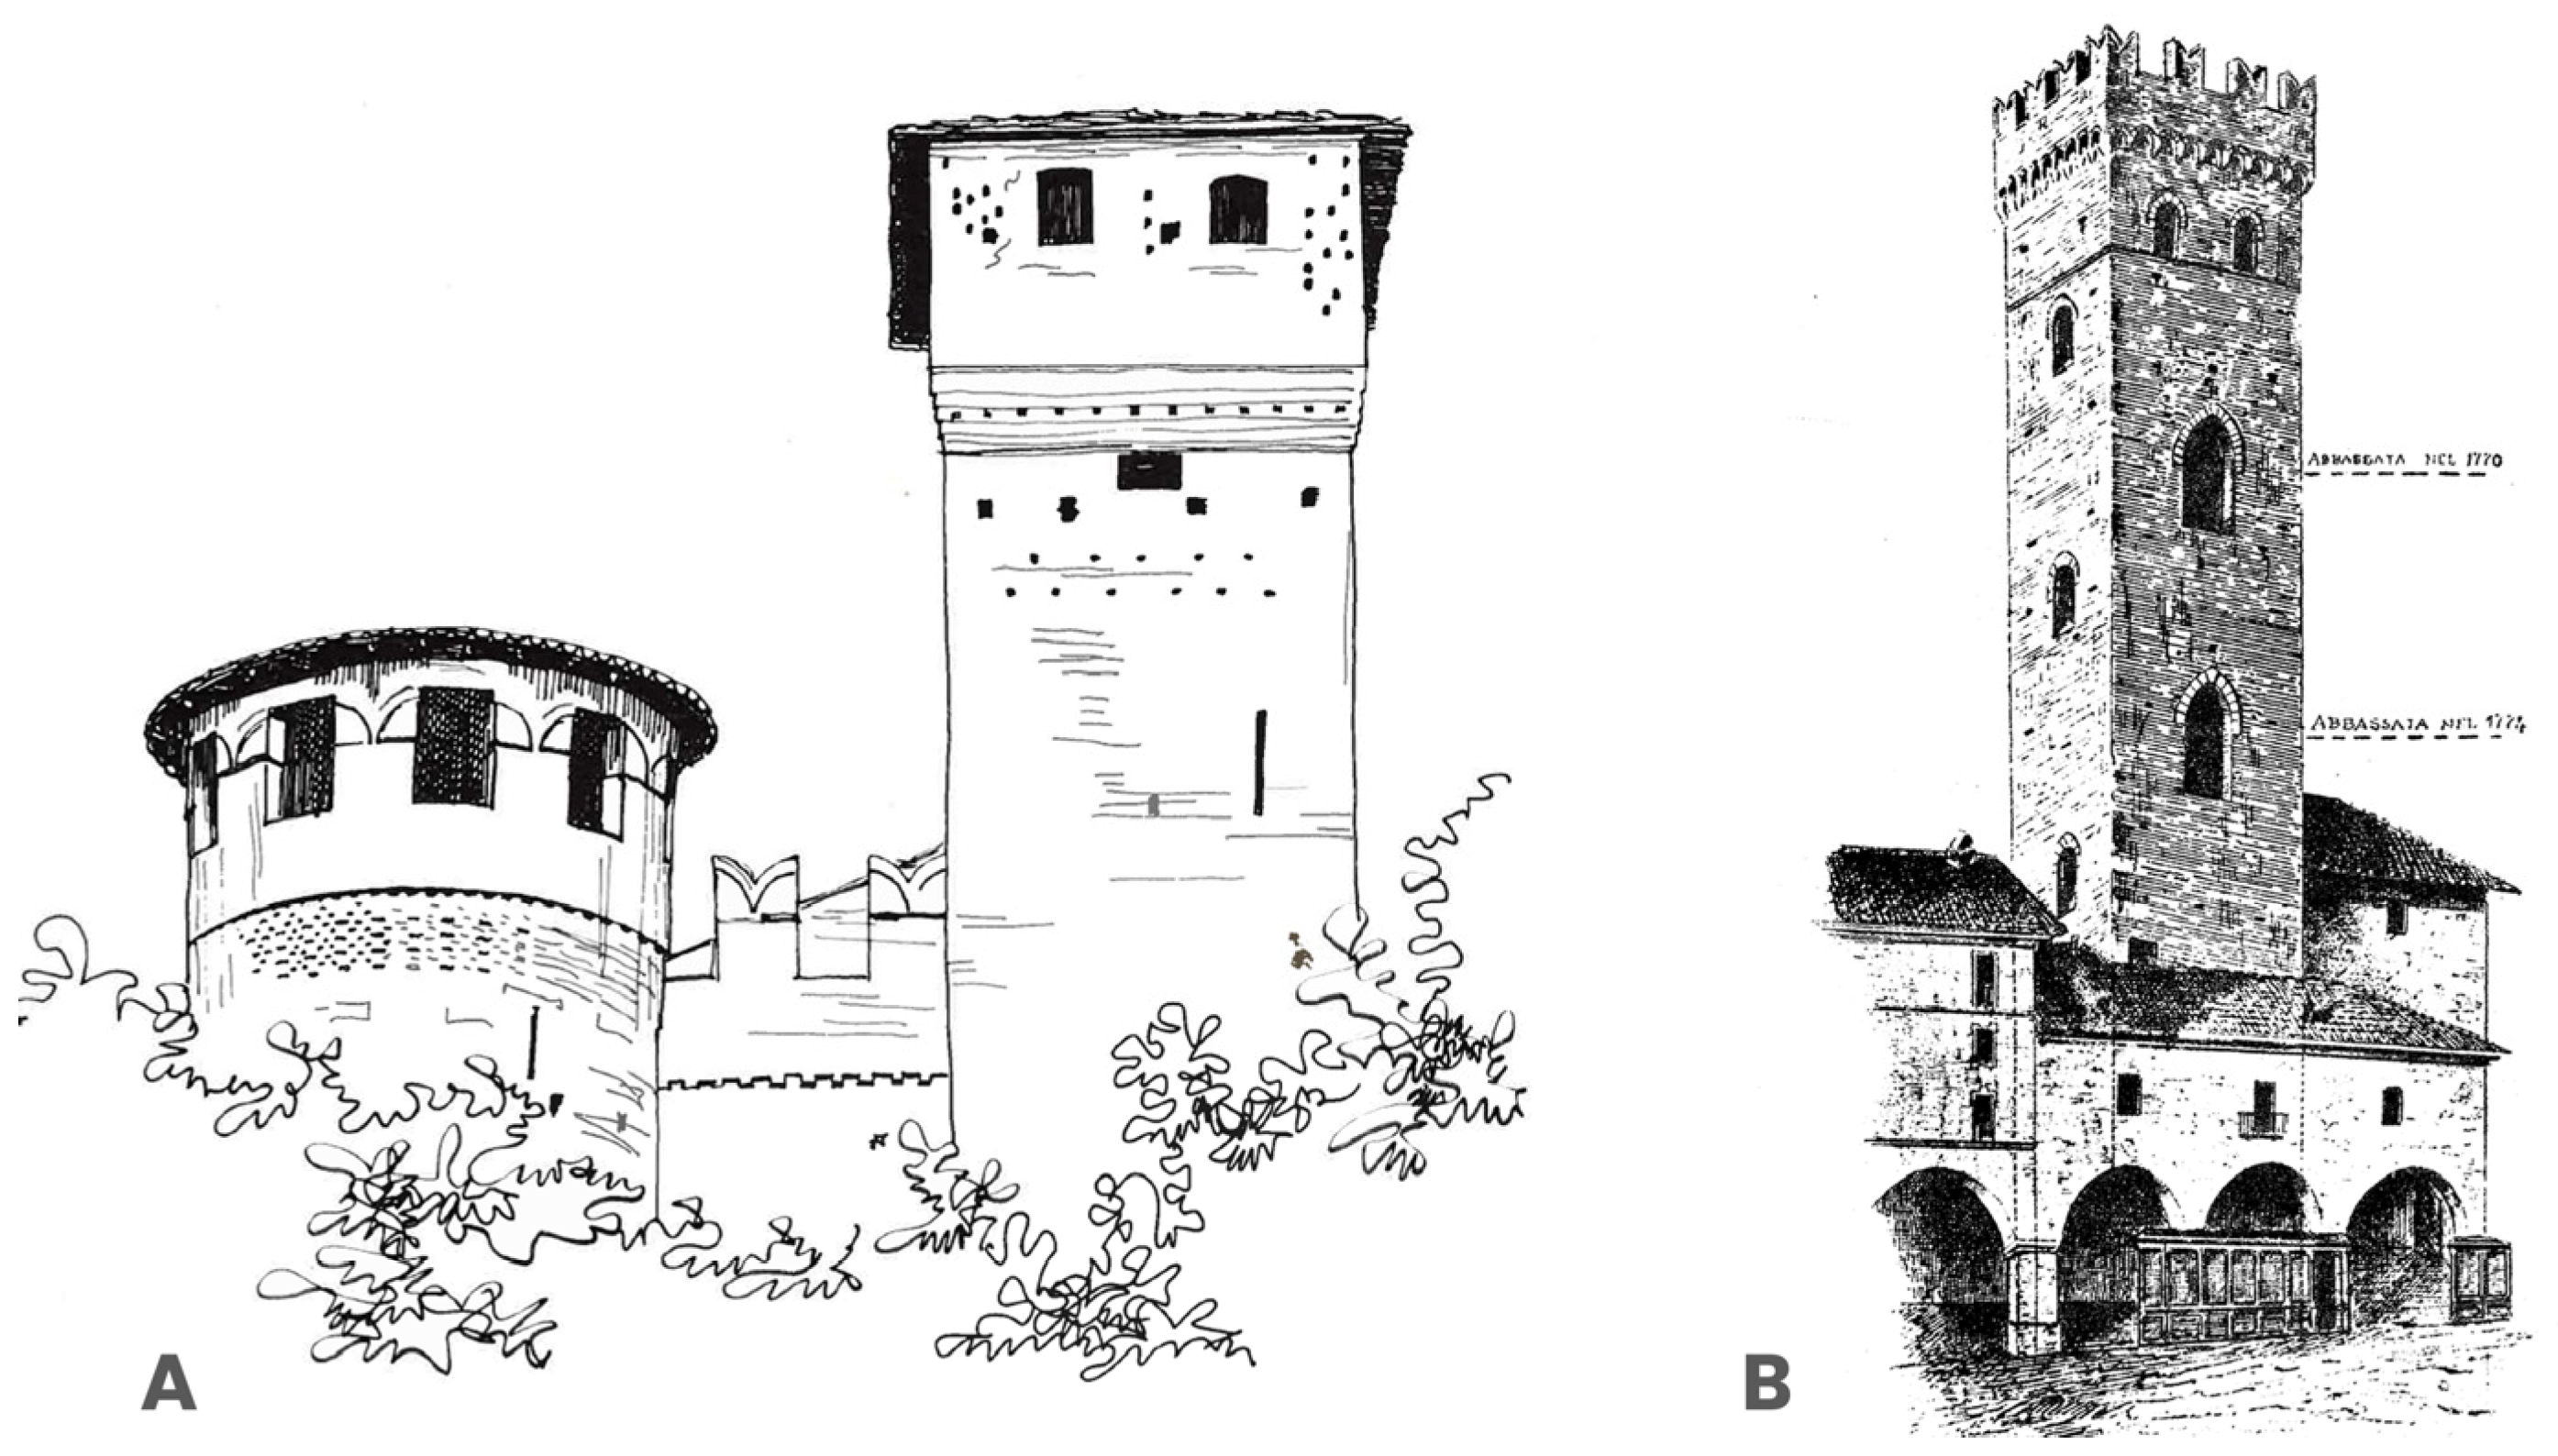
The following period (III) is probably the most evident concerning the medieval phase, especially for the constructive innovations introduced: it is located on the west and south side of the castle and is referred to as brown/orange brick masonry. The physical connection between this masonry (USM2-3-4) and the former (USM1-2) is clearly evident in the west front (Figure 10). Furthermore, particular decorations are now introduced and can be visible on the upper part of the fronts. These architectural components are related to Ghibelline decorations (EA207 related to dovetail battlements). In this regard, the castle became a Ghibelline defensive building by the Turco Family against the Solaro Guelf family [5,6]. For this reason, this period can be placed between the end of the XIII century and the first half of the XV century. This interpretation is validated by several chrono-typological elements located inside the city of Asti and the surrounding area: dovetail decorations dated to the second half of the XIII century can be found on the Comentina Tower (AT), Torre Troyana (AT) Torre Scarampa-Bertamenga (AT), and Castello Molare (AL) (Figure 13) [2,6].
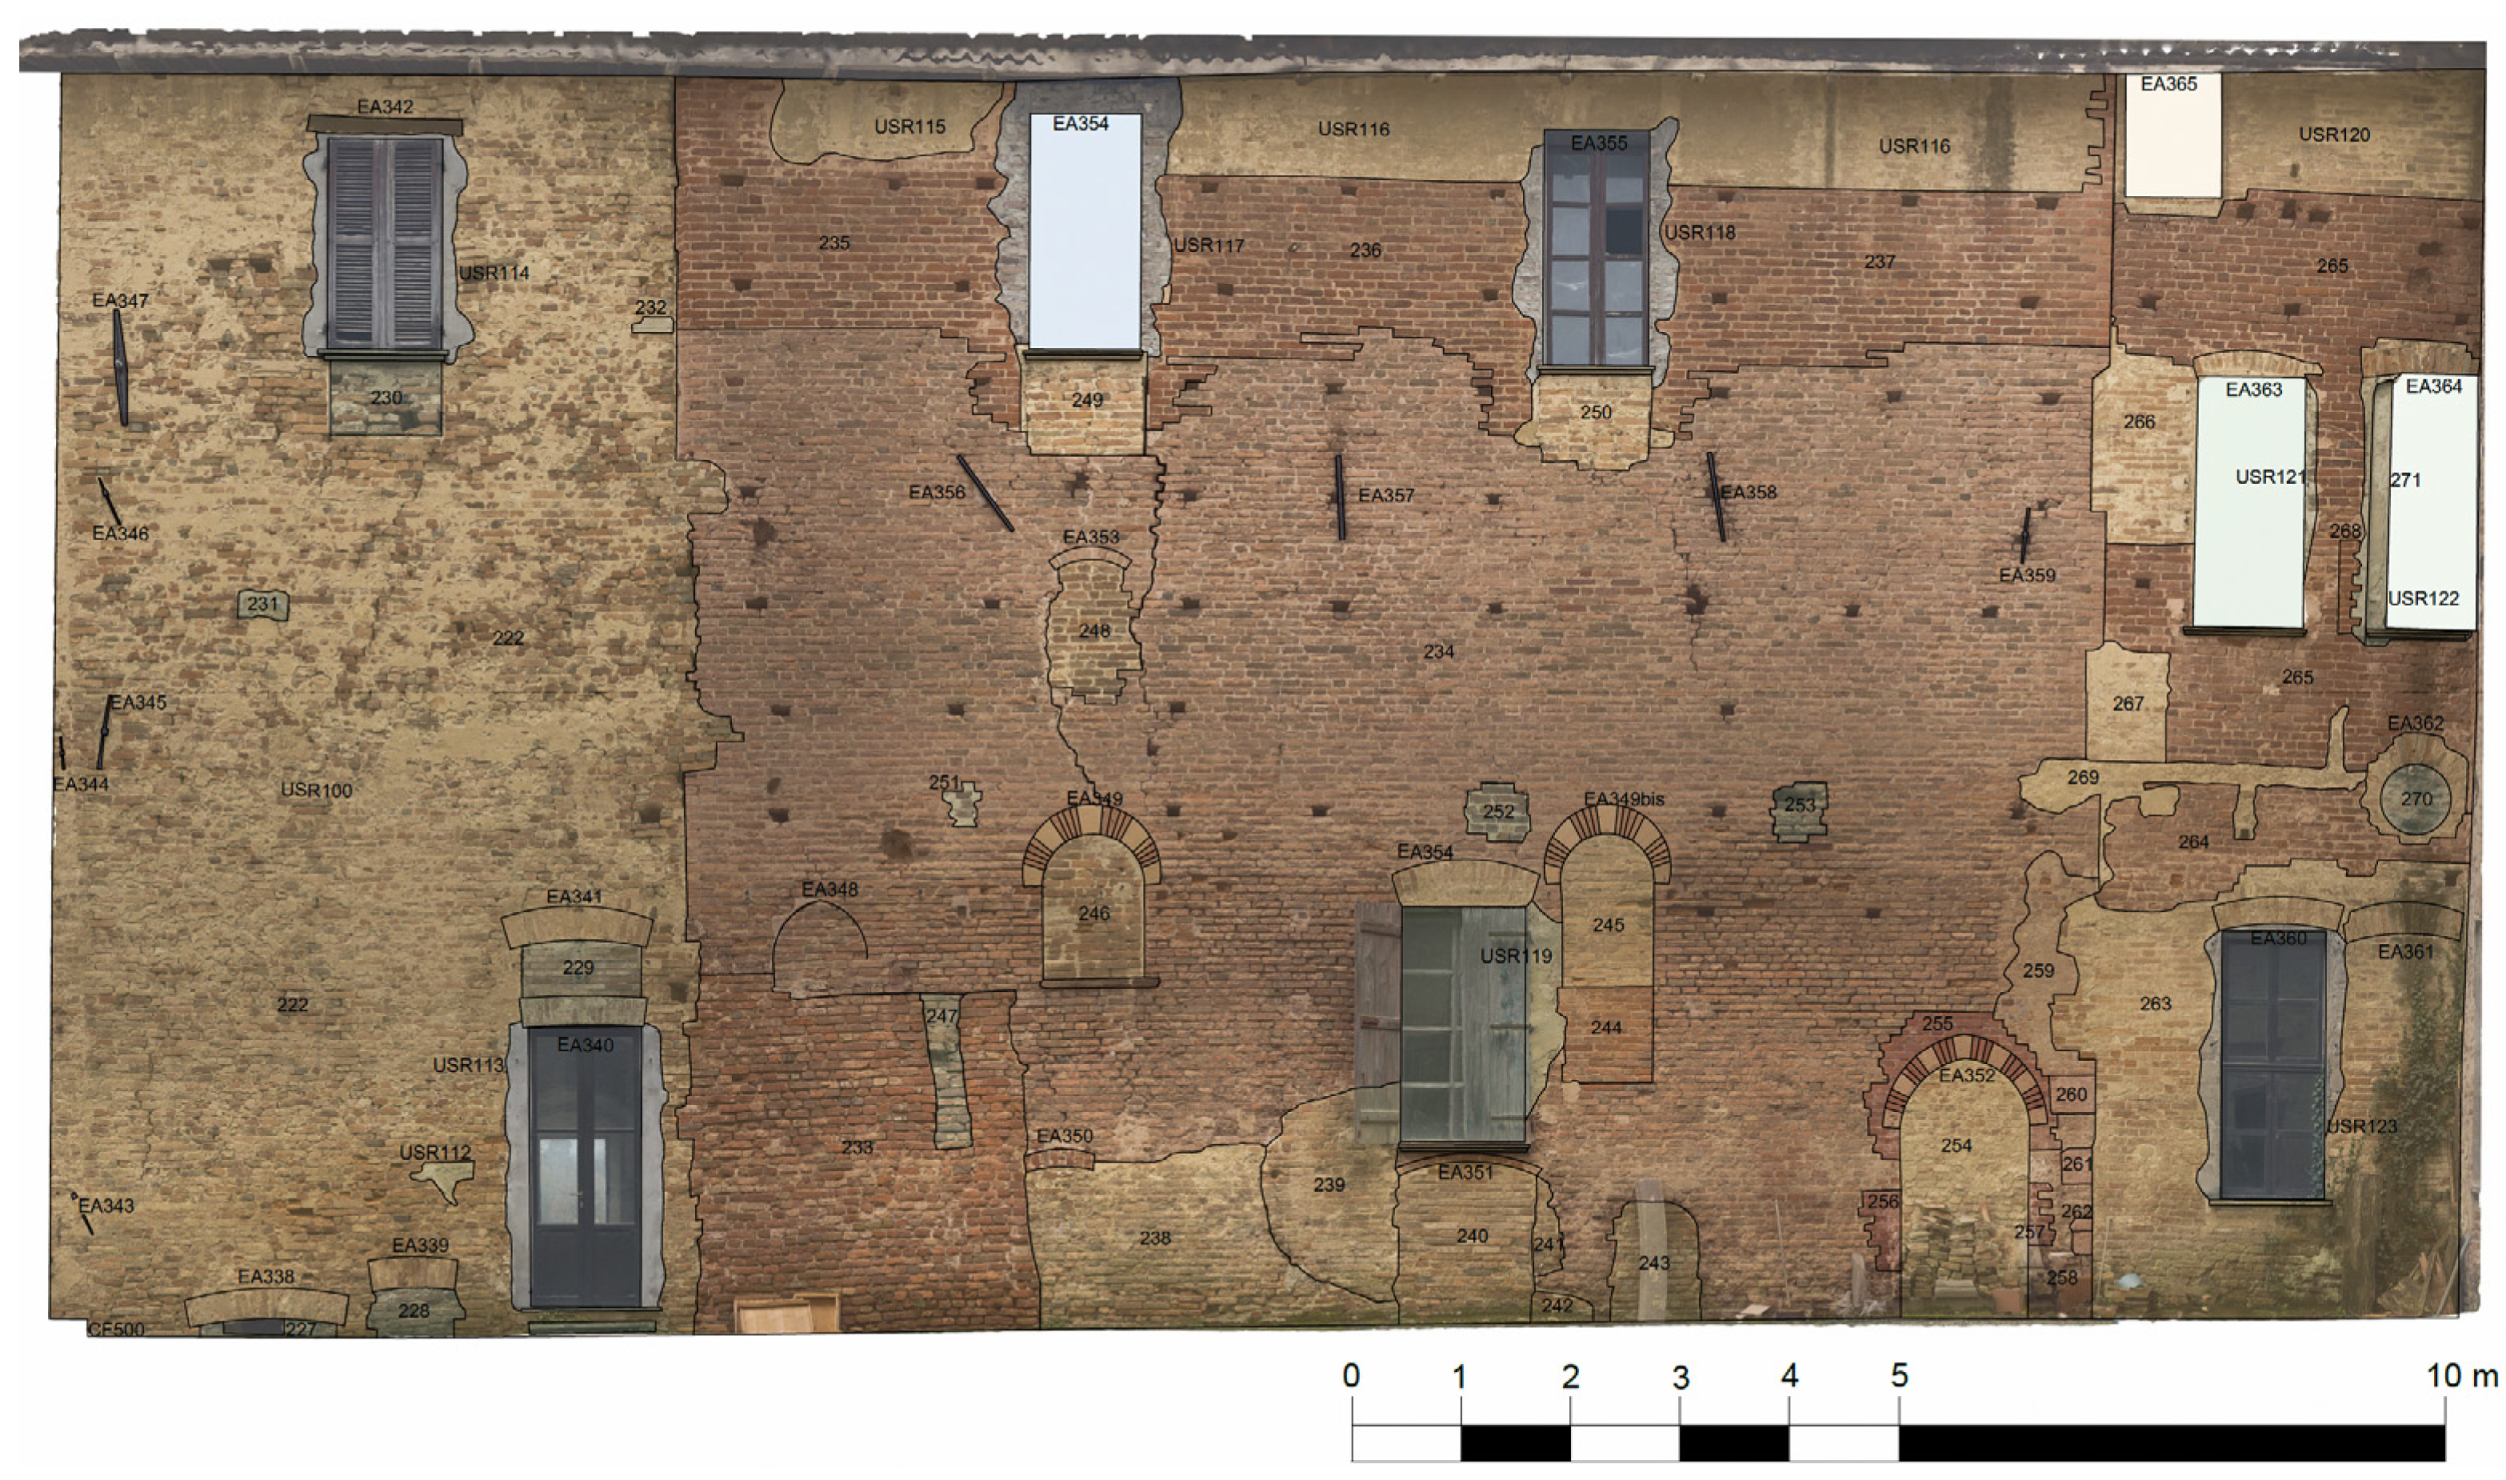
The detected fourth period (IV) is the most widespread in the castle (USR14-USR100-USM222-USM48). It relates to post-medieval constructive evidence and modifications (for example, covered/closed windows). It dominates the entire east side, the internal courtyard, and the north side, and it is visible as spotted interventions on the south and west sides of the castle. The north front shows further destruction evidence, and in post-medieval times, it experienced reconstructions and modifications. The masonry apparatus comprises mixed bricks (also reused materials) installed regularly, concerning the east, the north side, and the courtyard. In this regard, one of the most evident stratigraphic units is related to USR14: a render/plaster layer covering almost every front of the castle. Other important layers are USR100 and USM222 located on the southern front of the internal courtyard (Figure 12) and USM48 located on the northern front of the castle (Figure 13). However, structural alterations in the other castle areas show a varied and occasionally chaotic settle. This period can be included between first the half of the XVIII century and the end of the XIX century.
The following fifth period (V) could be placed between the second half of the XVIII century and the end of the XIX century. It is characterised by maintenance interventions and by replacing the late medieval window frames (now with a coat of arms). These modifications could have been inscribed during the Jarls Incisa di Camerana and Roero di Settime period [6]. At the same time, the angular window (EA237) and the forepart with arches and pillars were included. In the internal courtyard, part of the terrain was covered by another space, and the level of the rest of the area was raised.
The following chronological period (VI) was attributed to replacing the upper window frames with modern and wooden ones. Samples include the following: USR113-114-118-123 on the northern front of the courtyard (Figure 14) and USR21-22-26-28-30-32-34-36-38-40-42-44 on the northern front (Figure 15). These are dated to the beginning of the XX century and the end of the same century. These interventions are visible in the entire castle, especially on the east and north sides and the internal courtyard. Furthermore, this period includes modifications on masonries on the terrace area on the east side.
The seventh period (VII) is related to the end of the XX century and the beginning of the XXI century. It is detected on the north side and concerns installing the stables and shed leaning on the north masonry: EA117 visible in Figure 15. For this reason, this period refers to new breeding farms and facilities (also documented in archives). Moreover, this period includes structural maintenances (mainly referred to as reinforcing anchors) in the entire castle.
The last detected period (VIII) is related to the structural collapse and maintenance and consolidation processes after 2014. For this reason, this phase is visible only on the south side of the castle, and it is mainly composed of two units (Figure 15): the negative unit refers to the collapse (−800) and the concrete wall (USM600). The concrete consolidation/reinforcing wall was installed to block the rockfall collapse and to stabilize the area.
Although precise historical information about the construction site is very poor, this interpretation has been refined and crossed with external historical information (textual and archives) and the typological chronology of architectural elements.
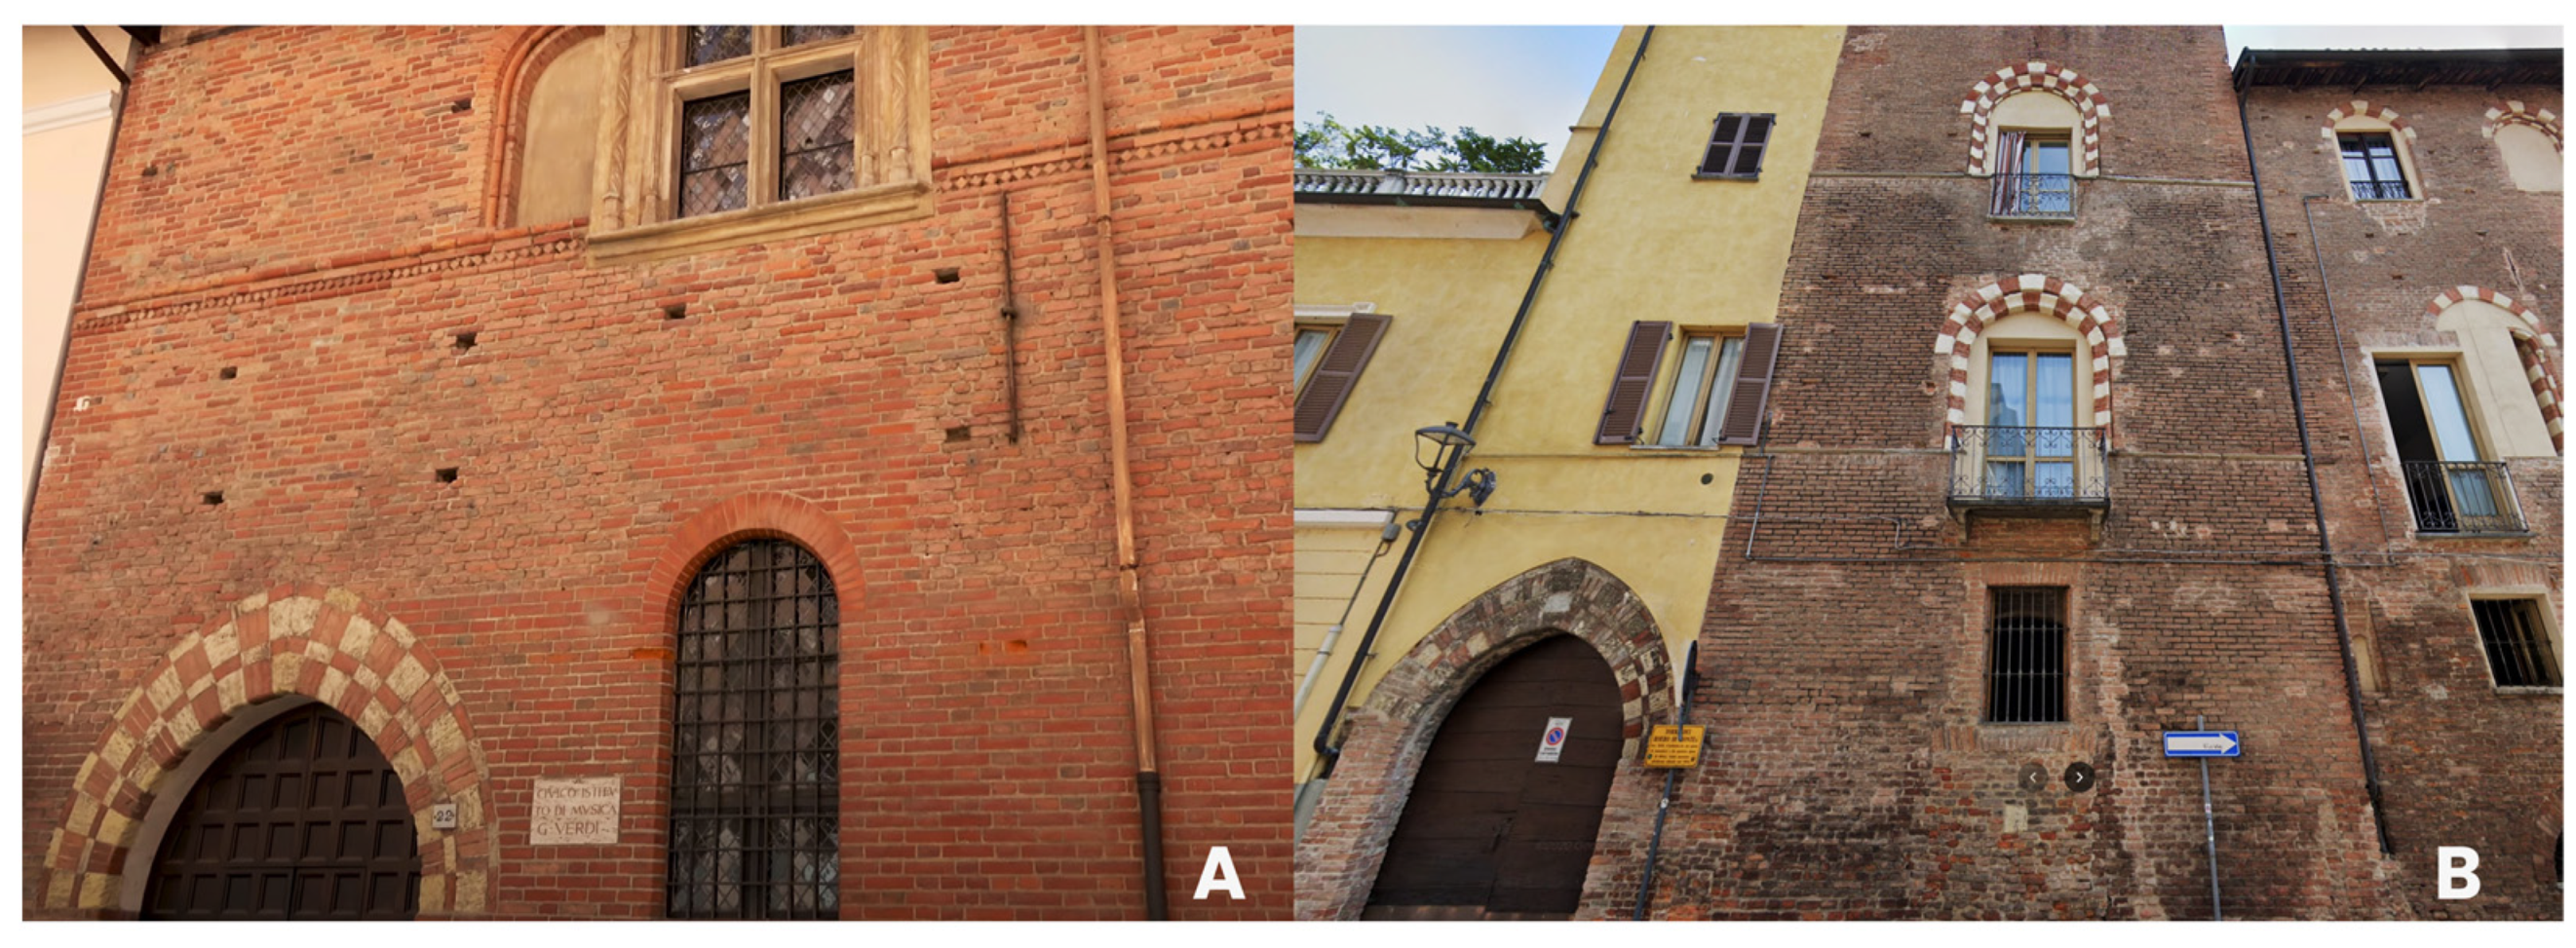
This analysis confirmed that the most evident chronological phase is inscribed into the first half of the XVIII century and the end of the XIX century. Architectural interventions referred to this phase can be detected in the entire area of the castle, especially on the east side and in the internal courtyard. By contrast, the Ghibelline period (III period) is detectable especially on the west side and on the circular tower. Other important medieval evidence is related to bichrome pointed arches (I period) used on the south side of the castle, on the defensive entrance tower (squared plan), and on the single lancet windows. In this regard, the chronological interpretation was supported by several chrono-typological comparisons: bichrome (also double) pointed arches (doors and windows) belonging to the same type can be observed in the Solara Tower, the Verasis-Asinari Palace (which also has the same rhomboidal decorations as the western facade), and in the Roero Monteu Tower located in Asti (Figure 16).
These examples belong to the XIII century [2]. Furthermore, ogival openings (single lancet windows) can be matched and compared to a significant example related to the XIII century in Asti [6]: the Montafia Tower.
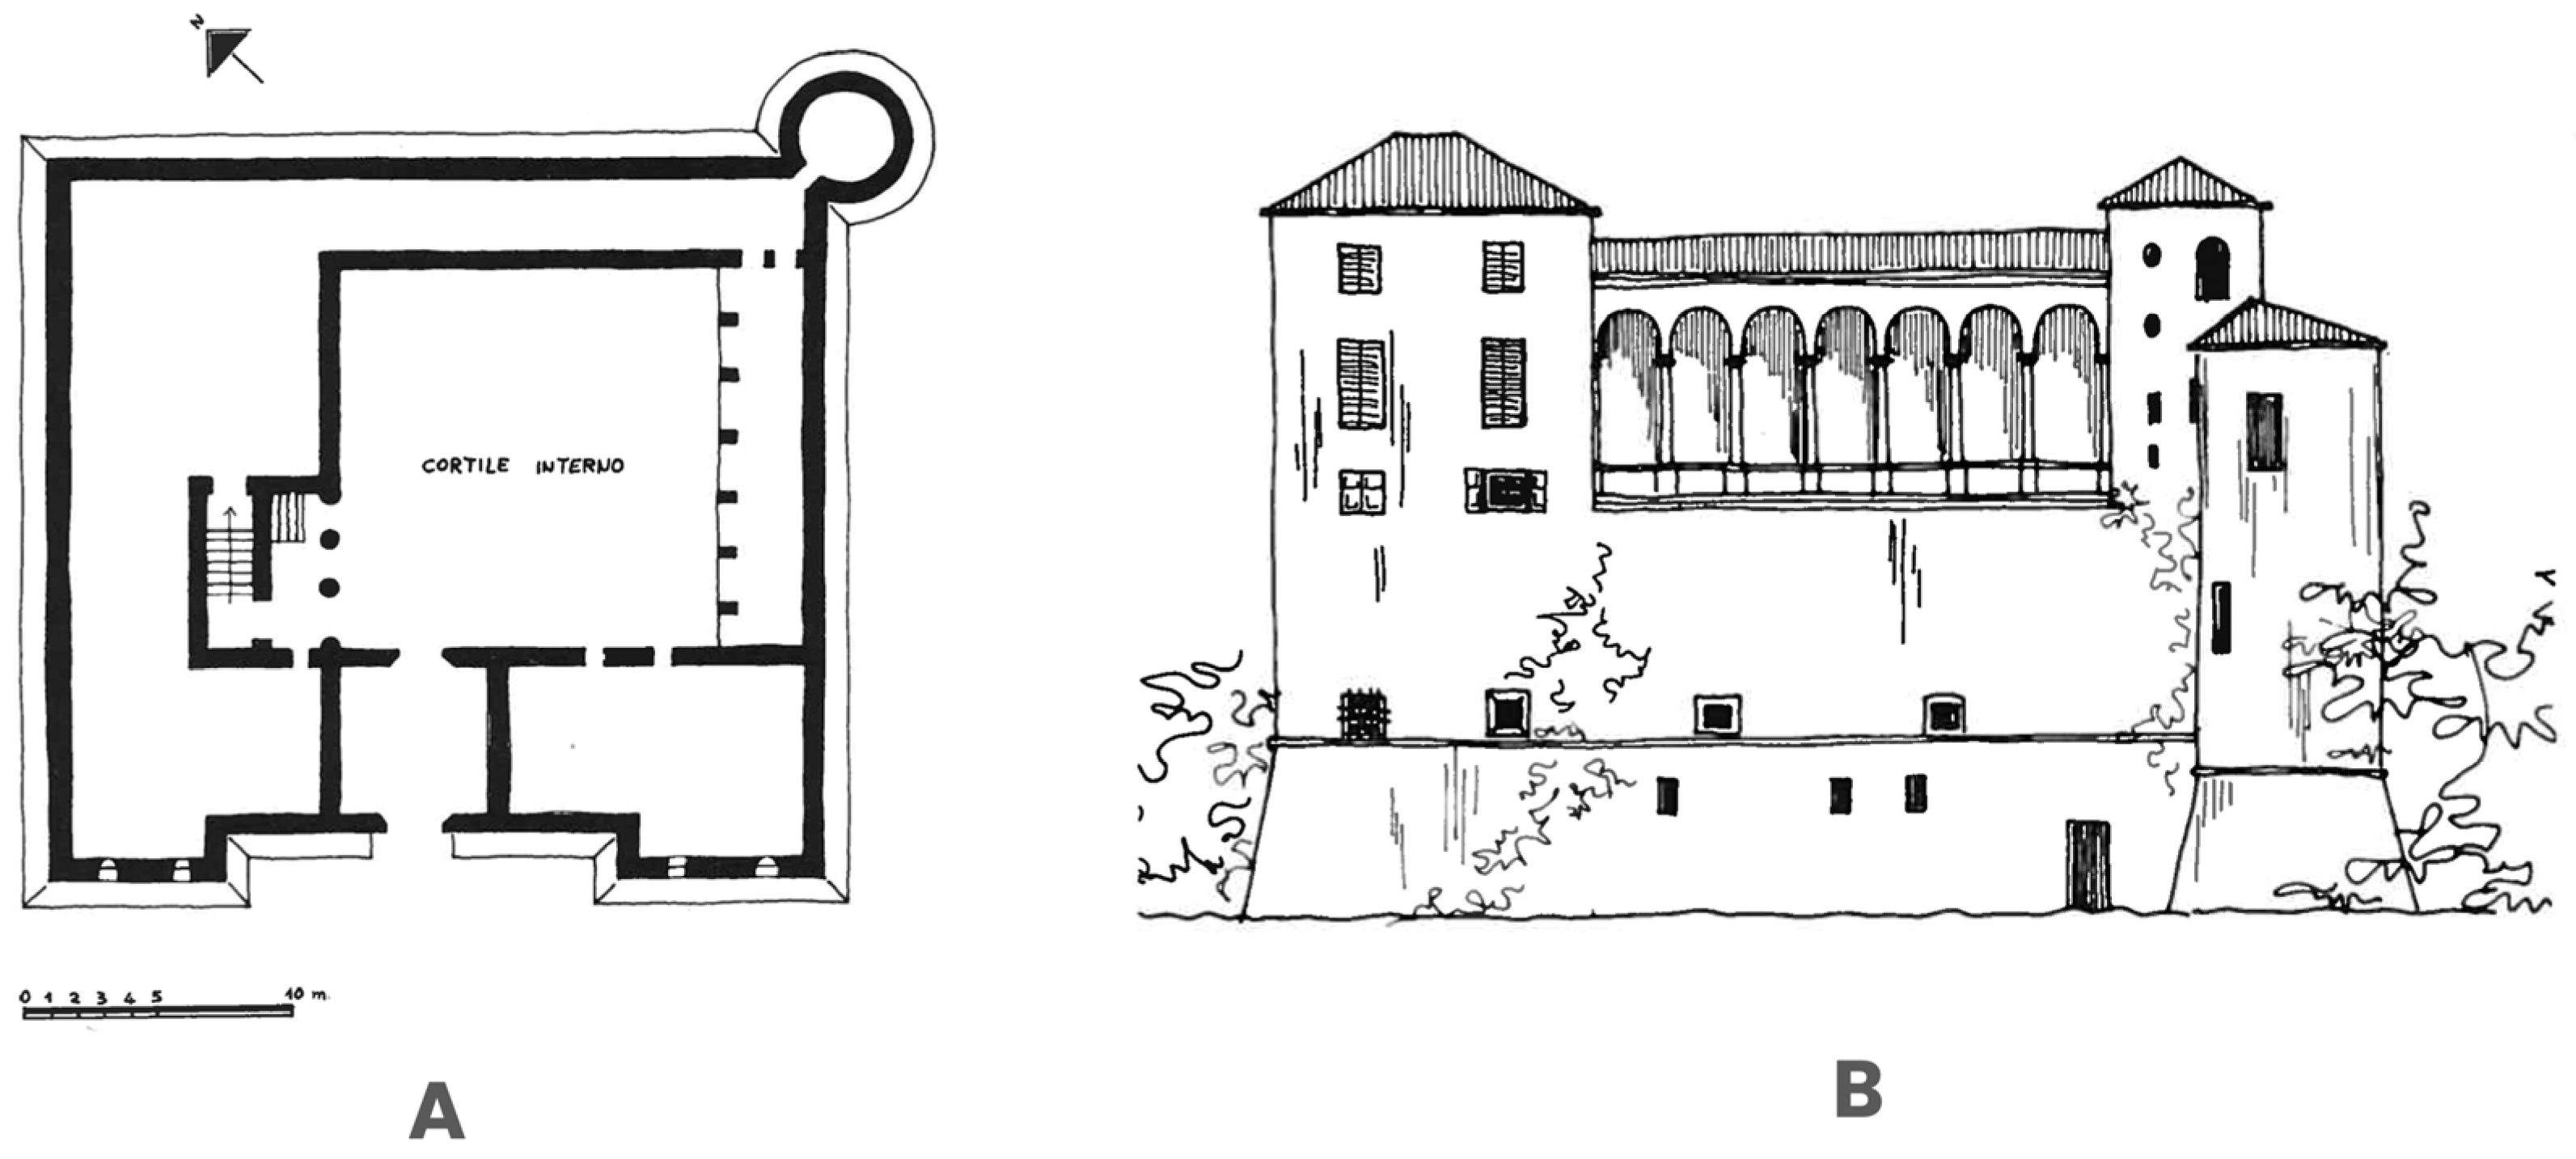
As for comparison with other medieval castles, as reported by Conti F. [2], the architectonic choice of placing a squared defensive tower along the entrance path can be noticed in other medieval castles in Piedmont: Barengo (NO) and Valdengo (VC). Furthermore, the architectural apparatus related to the west front and inner courtyard can be compared with another castle located in Tessarolo (AL): in fact, the castle, documented in the 12th century [2], has a circular tower, a loggia, and a square corner tower on the same front (southeast). At the same time, the loggia faces a courtyard internally (Figure 17). The same architectural choice is present on the west front of the Castle of Frinco.
The stratigraphic investigation and the sequenced diagrams were fundamental for understanding the dynamic evolution of the castle. By analysing the stratigraphy, the early setup of the castle could be referred to the I and II period areas, following the tower houses’ typology [29,30]. During this time, other building parts were joined to early towers/constructions, achieving a complex and unique building. At the same time, modifications and damages due to battles caused several internal and external architectural changes. This evolution was the weakness of the castle, since more joined building parts caused structural issues that were both internal and external. The collapse of 2014 is probably the consequence of this particular evolution. A synthetic schema of the detected periods can be found in Figure 18.
3. The NURBS Modelling Phase
NURBS (Non-Uniform Rational Basis-Splines) modelling was used for recreating the entire morphology of the castle in a free-form way. Free-form curves and surfaces represent the most suitable and versatile modelling choice for complex architectural contexts. In this scenario, Rhinoceros [31] is a well-known and reliable 3D NURBS modeller; for this reason, it was used to reconstruct the entire Frinco Castle.
Modelling the Castle: NURBS Geometries and Analysis
The castle’s modelling process comprised four phases: the current state modelling (including the collapsed area), a metric analysis on the NURBS model, the stratigraphic units’ mapping and modelling, and the reconstruction of the proposed hypothesis for the restoration of the castle.
The first modelling phase started by importing wired profiles extracted from point clouds inside the Rhinoceros software (version 7.0), and then these geometries were the basis for NURBS curves and surface interpolations (Figure 19). Although this software allows for direct modelling on point clouds, wired profiles derived from planar sections were used primarily for having simple CAD profiles of the castle without the complexity and noisy elements related to point clouds.
Wired profiles were the backbone for the surface modelling. Using commands such as extrusions, loft, sweep, and patch, NURBS surfaces and solids were reconstructed. In particular, non-planar surfaces derived from the patch command were used for different architectural parts of the castle, especially for the concrete containment wall (collapsed side) and the stratigraphic units. The internal subdivisions and rooms were modelled only for the open area of the castle referred to the structural collapse of the south side (living area with bedrooms). However, the architectural components of the castle were modelled by simplifying their geometries and complexities (Figure 20).
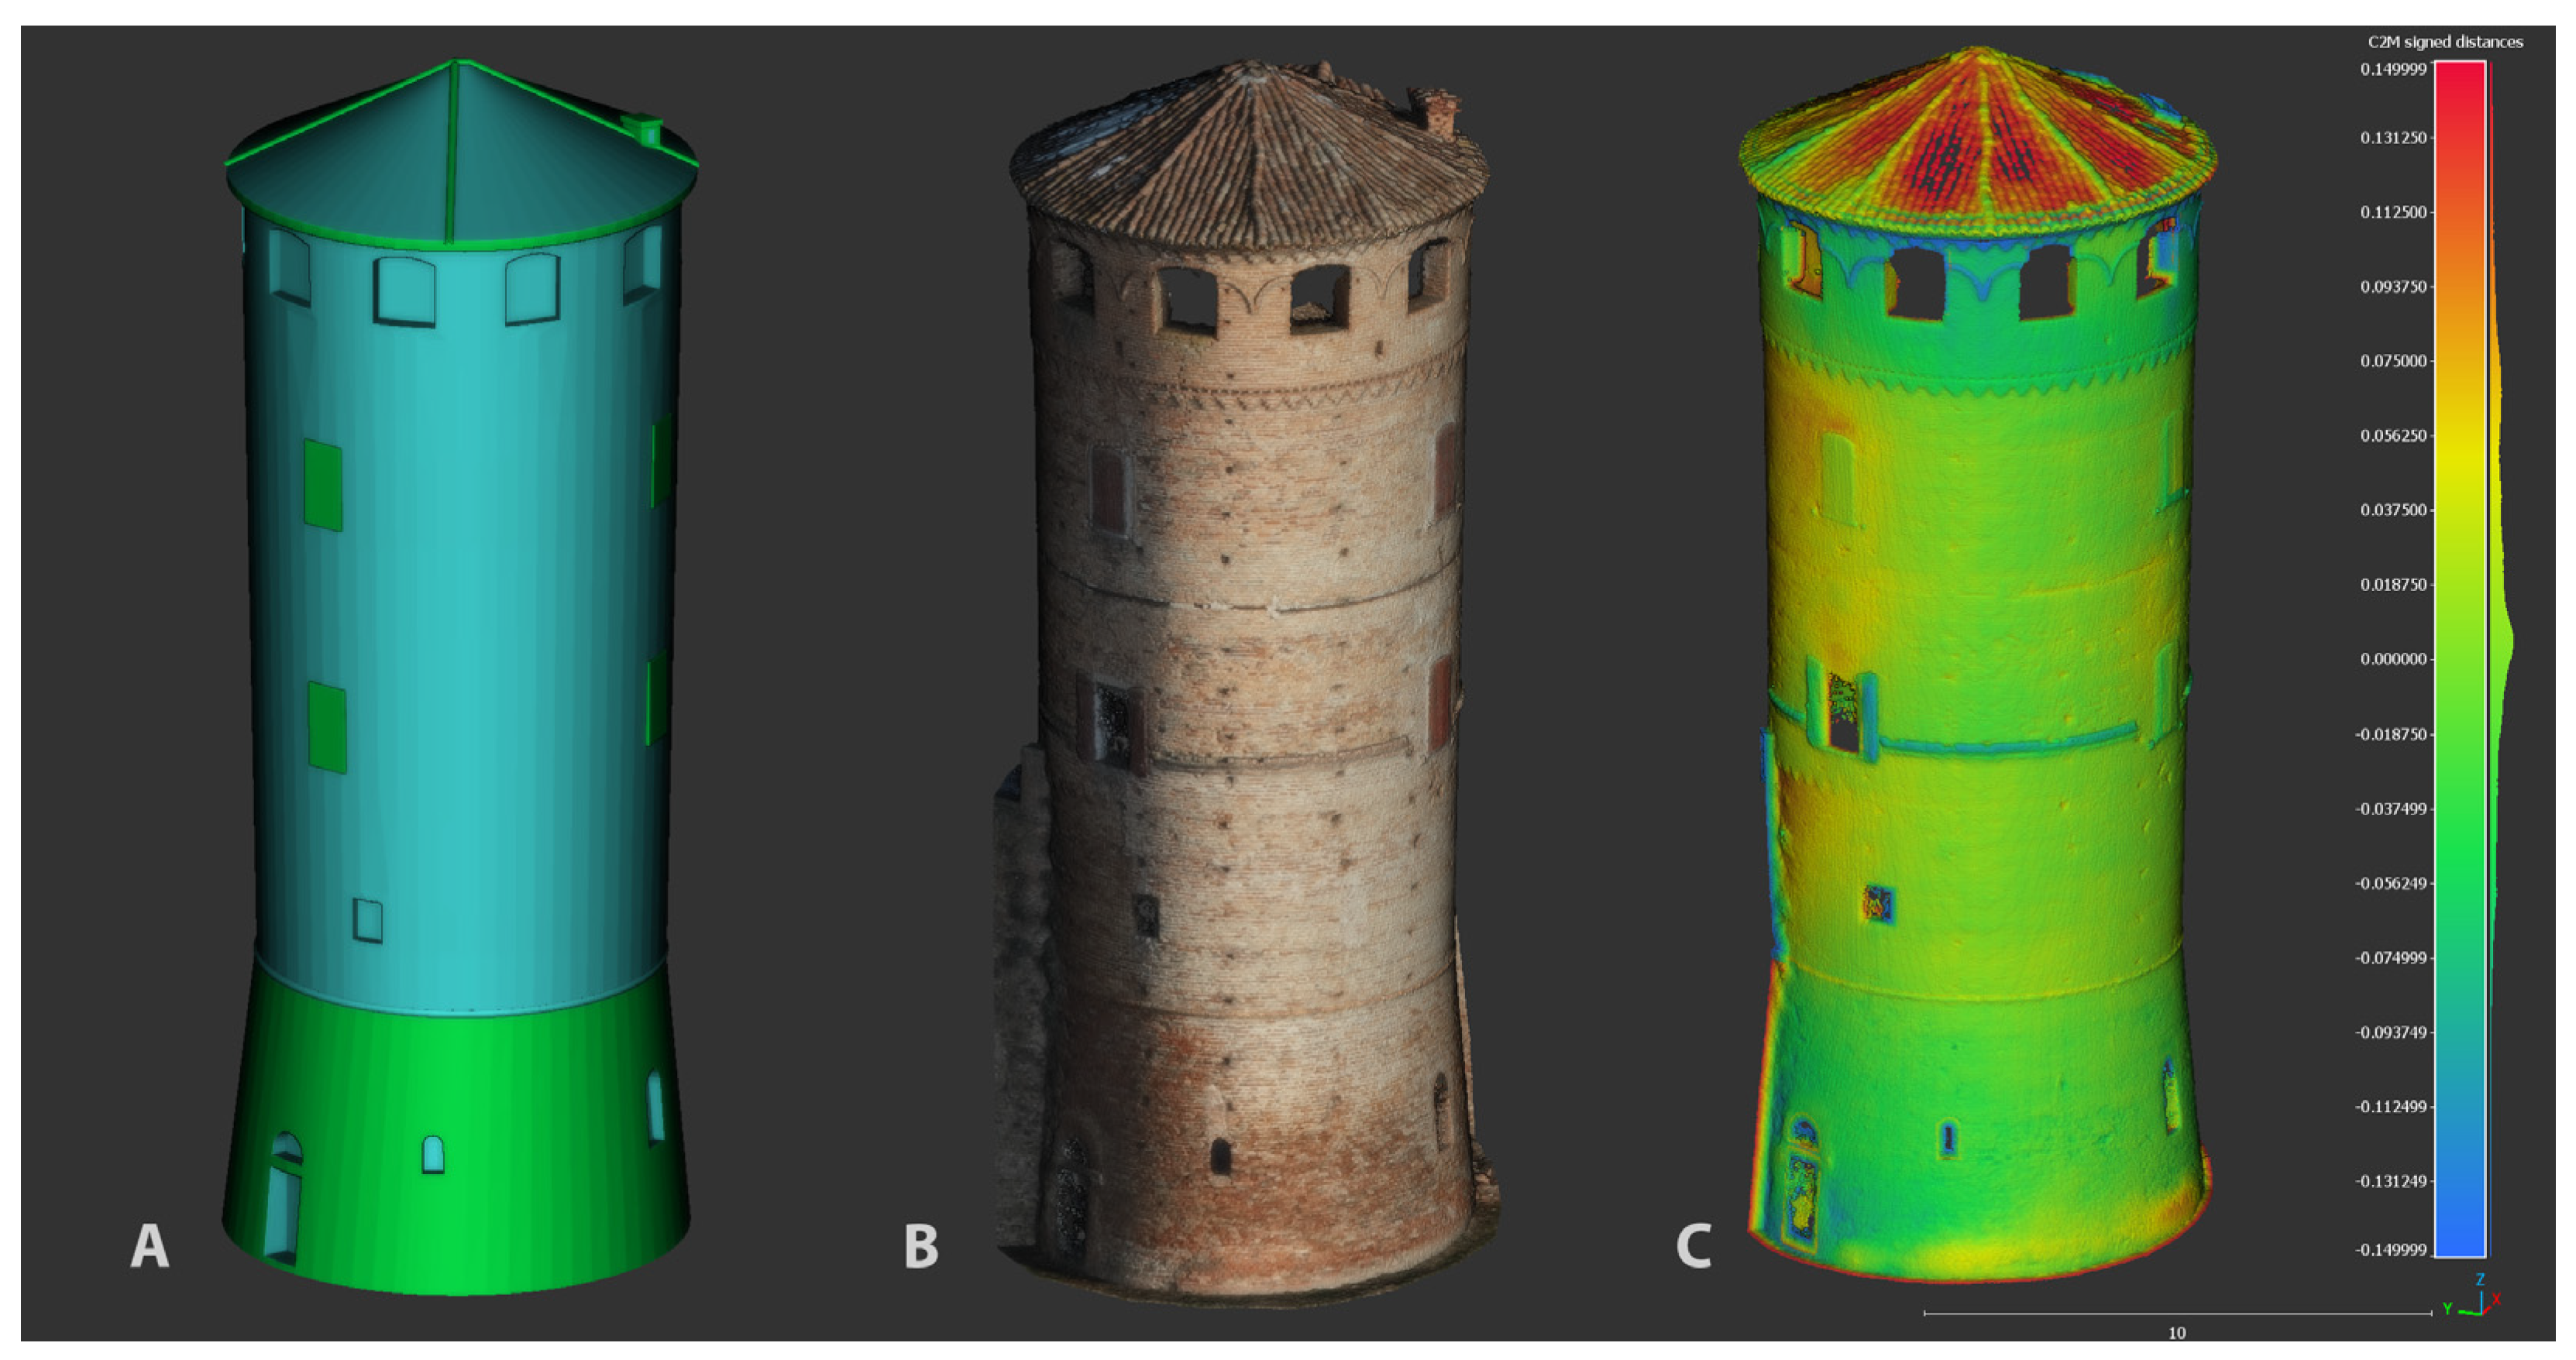
The second phase consisted of metric analyses of what had been modelled. The NURBS geometries and surfaces were compared with point cloud data. In particular, the circular tower was at the centre of this distance calculation. Using the CloudCompare software (version 2.4), the NURBS model of the tower was processed with the point clouds obtained from the DJI Zenmuse P1 photogrammetric acquisition (homogenous metric data). The cloud-to-mesh distance was computed using a measured range between 0.00 and 0.15 m. The obtained standard deviation was 0.056 m, and the RMSe (root-mean-square error) was 0.059 m. The point coverage related to the initial metric range and scalar field was estimated here: between 0.00 m and 0.05 m, the coverage is 63%; between 0.05 m and 0.10 m, the coverage is 25%; and between 0.10 m and 0.15 m, the coverage is 12%. The most evident metric distances (read areas in the scalar fields) referred to the roof and wall bulging, primarily since these parts were modelled by simplifying geometries (Figure 21).
The third phase started by mapping on the model highly detailed orthophotos and textures related to architectural fronts. Textures were applied on curved surfaces (the circular tower, angles, and angular windows on the south side) by using custom UV mapping. This operation involved, for each surface, the custom position and rotation on the X, Y, and Z axes of the photographic textures imported into Rhinoceros. Orthophotos, obtained from the photogrammetric process with 1 cm of GSD, were mapped as plane surfaces directly on the modelled walls, adjusting the X, Y, and Z placements of Gumball (real-time object editor via Cartesian axes). Finally, the stratigraphic layers were imported as CAD elements by using the same local coordinate system. In this way, lines and polylines referred to stratigraphic units were automatically mapped onto the walls. The planar surfaces were created from stratigraphic layers.
The orthophotos and textures were fundamental for achieving a high-detailed photographic immersion for the NURBS model and for having a low polygons lightweight digital twin of the castle (Figure 22).
This phase was also crucial for orienting stratigraphic units (imported as CAD profiles). These elements were mapped on the walls’ surfaces, and the non-planar surfaces (patches) of the stratigraphic layers were modelled on them using an offset of 1 millimetre. Surfaces referred to stratigraphic pieces of evidence were coloured using the same false-colour attributions used for the chronological interpretations. In this way, an immersive 3D classification of the chronological periods referred to the construction steps of the castle was obtained (Figure 23, Figure 24 and Figure 25).
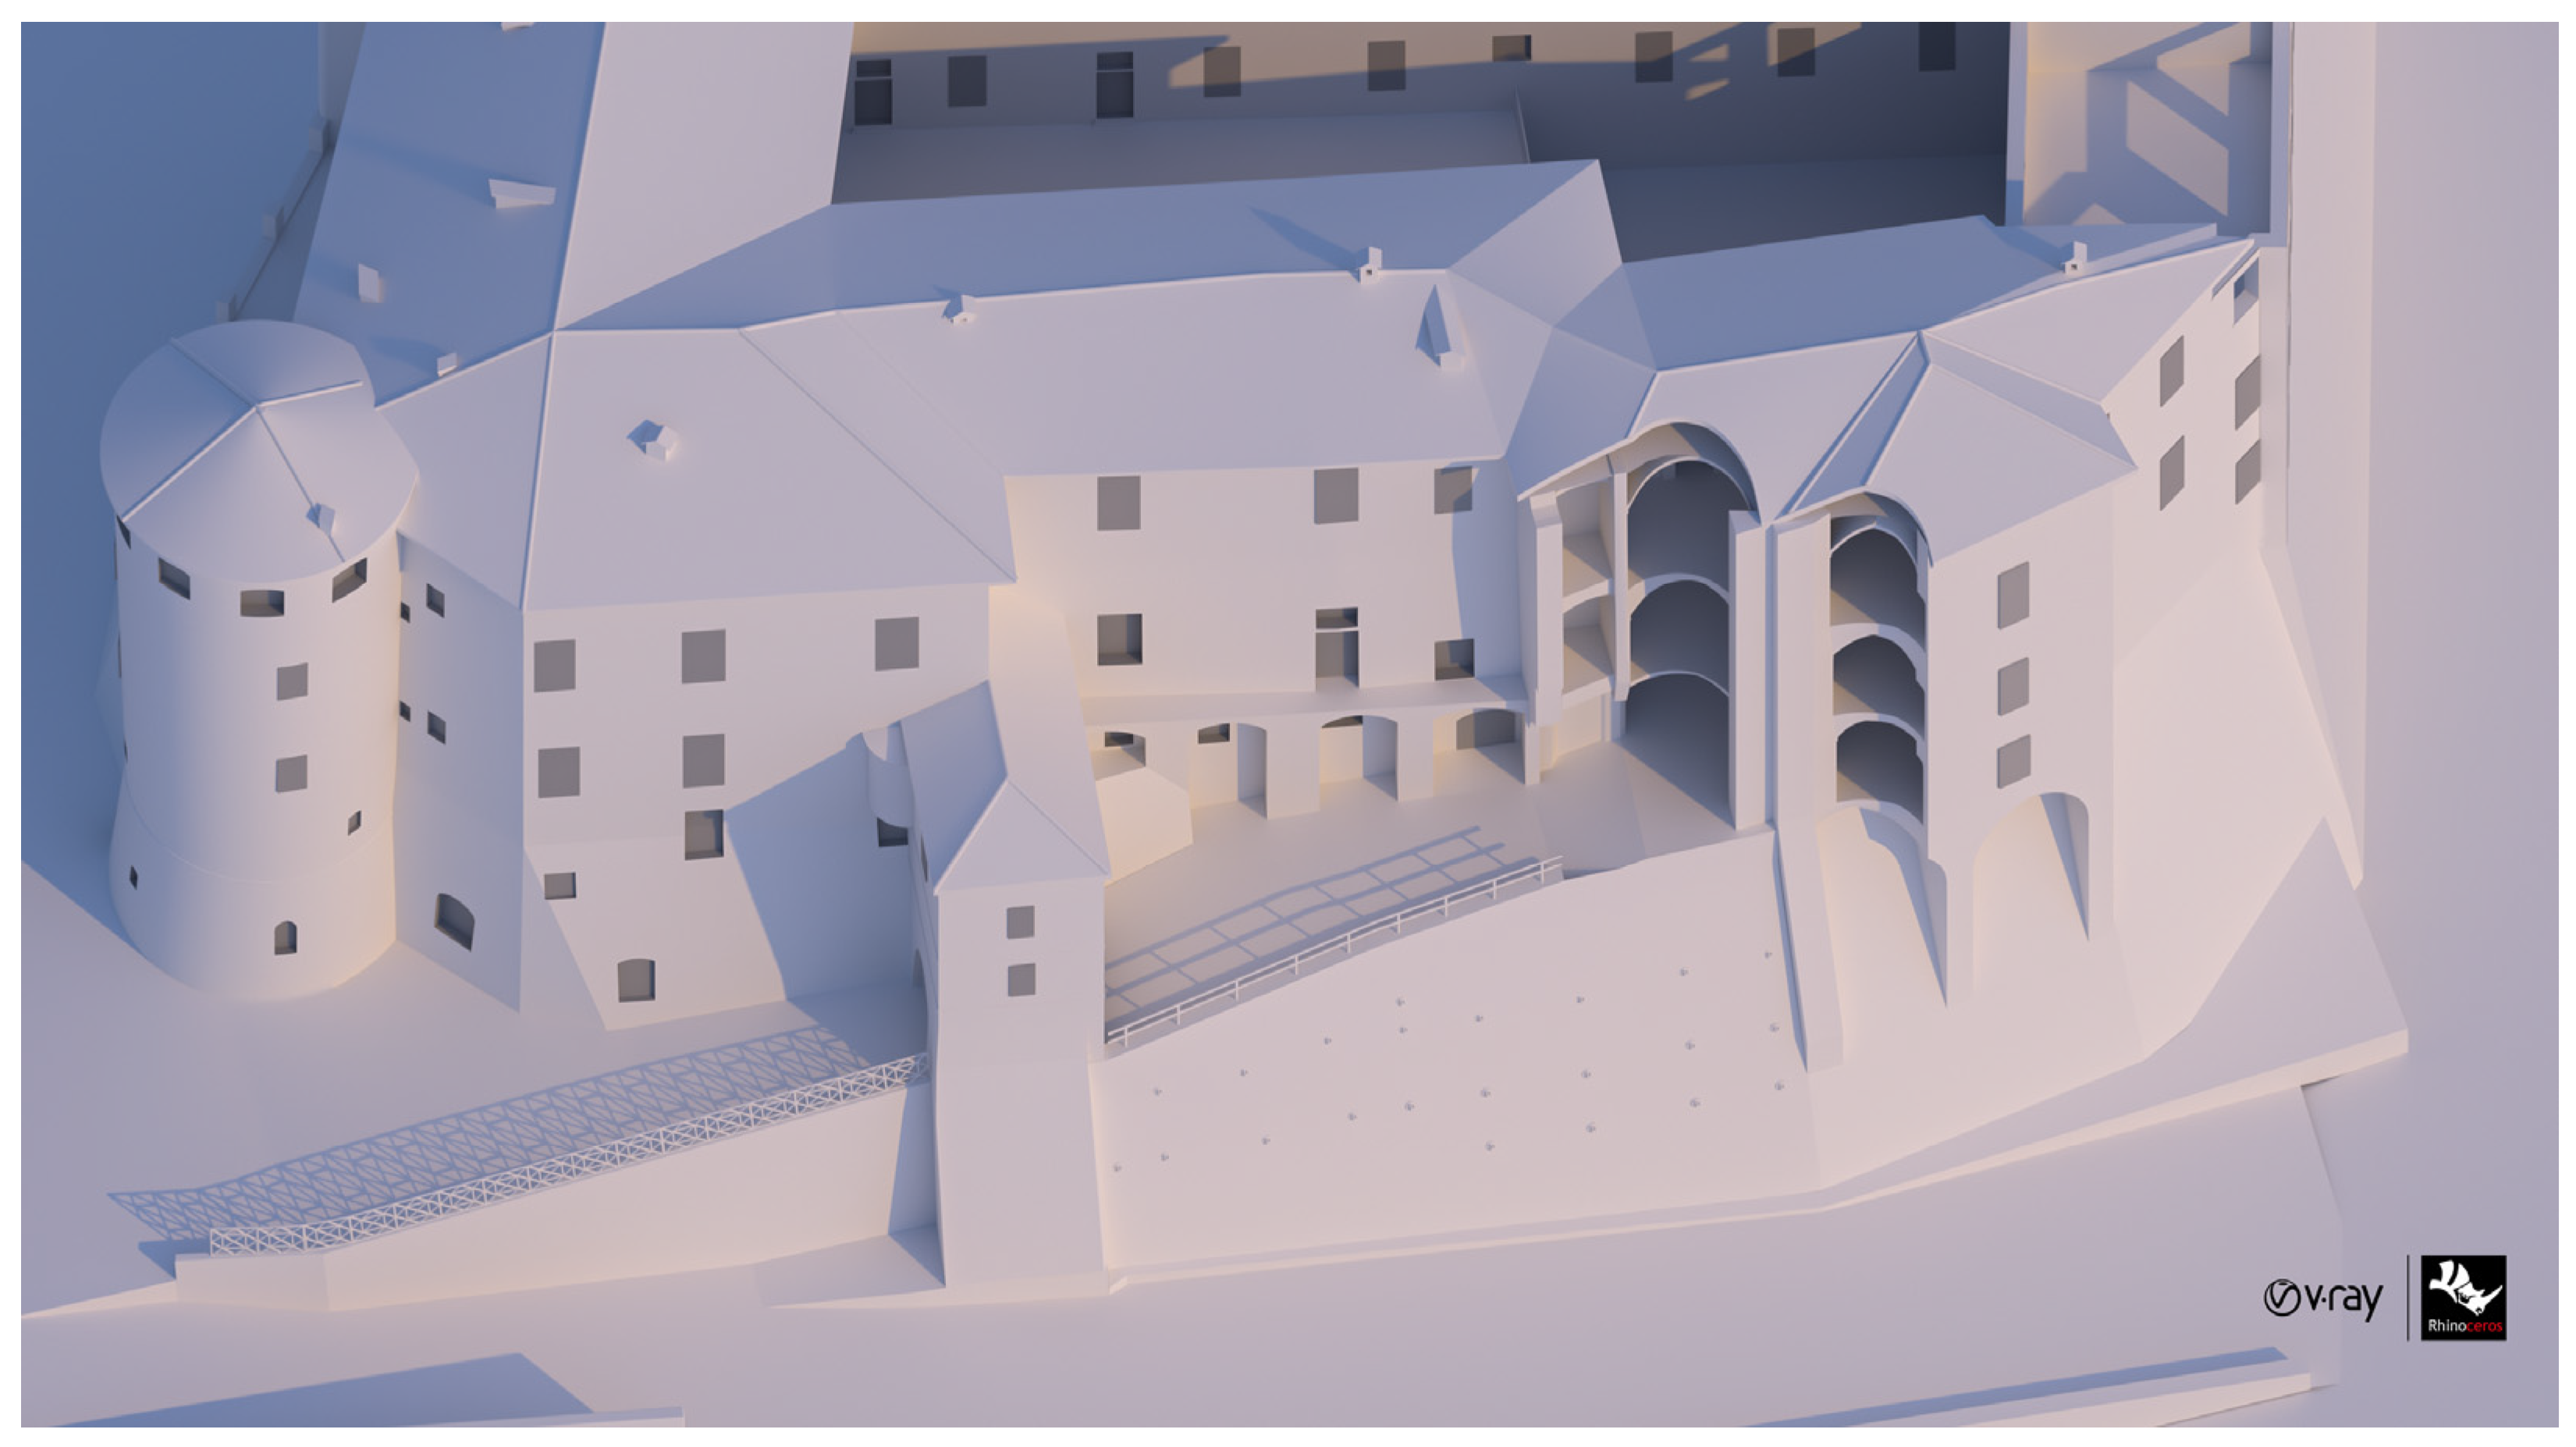
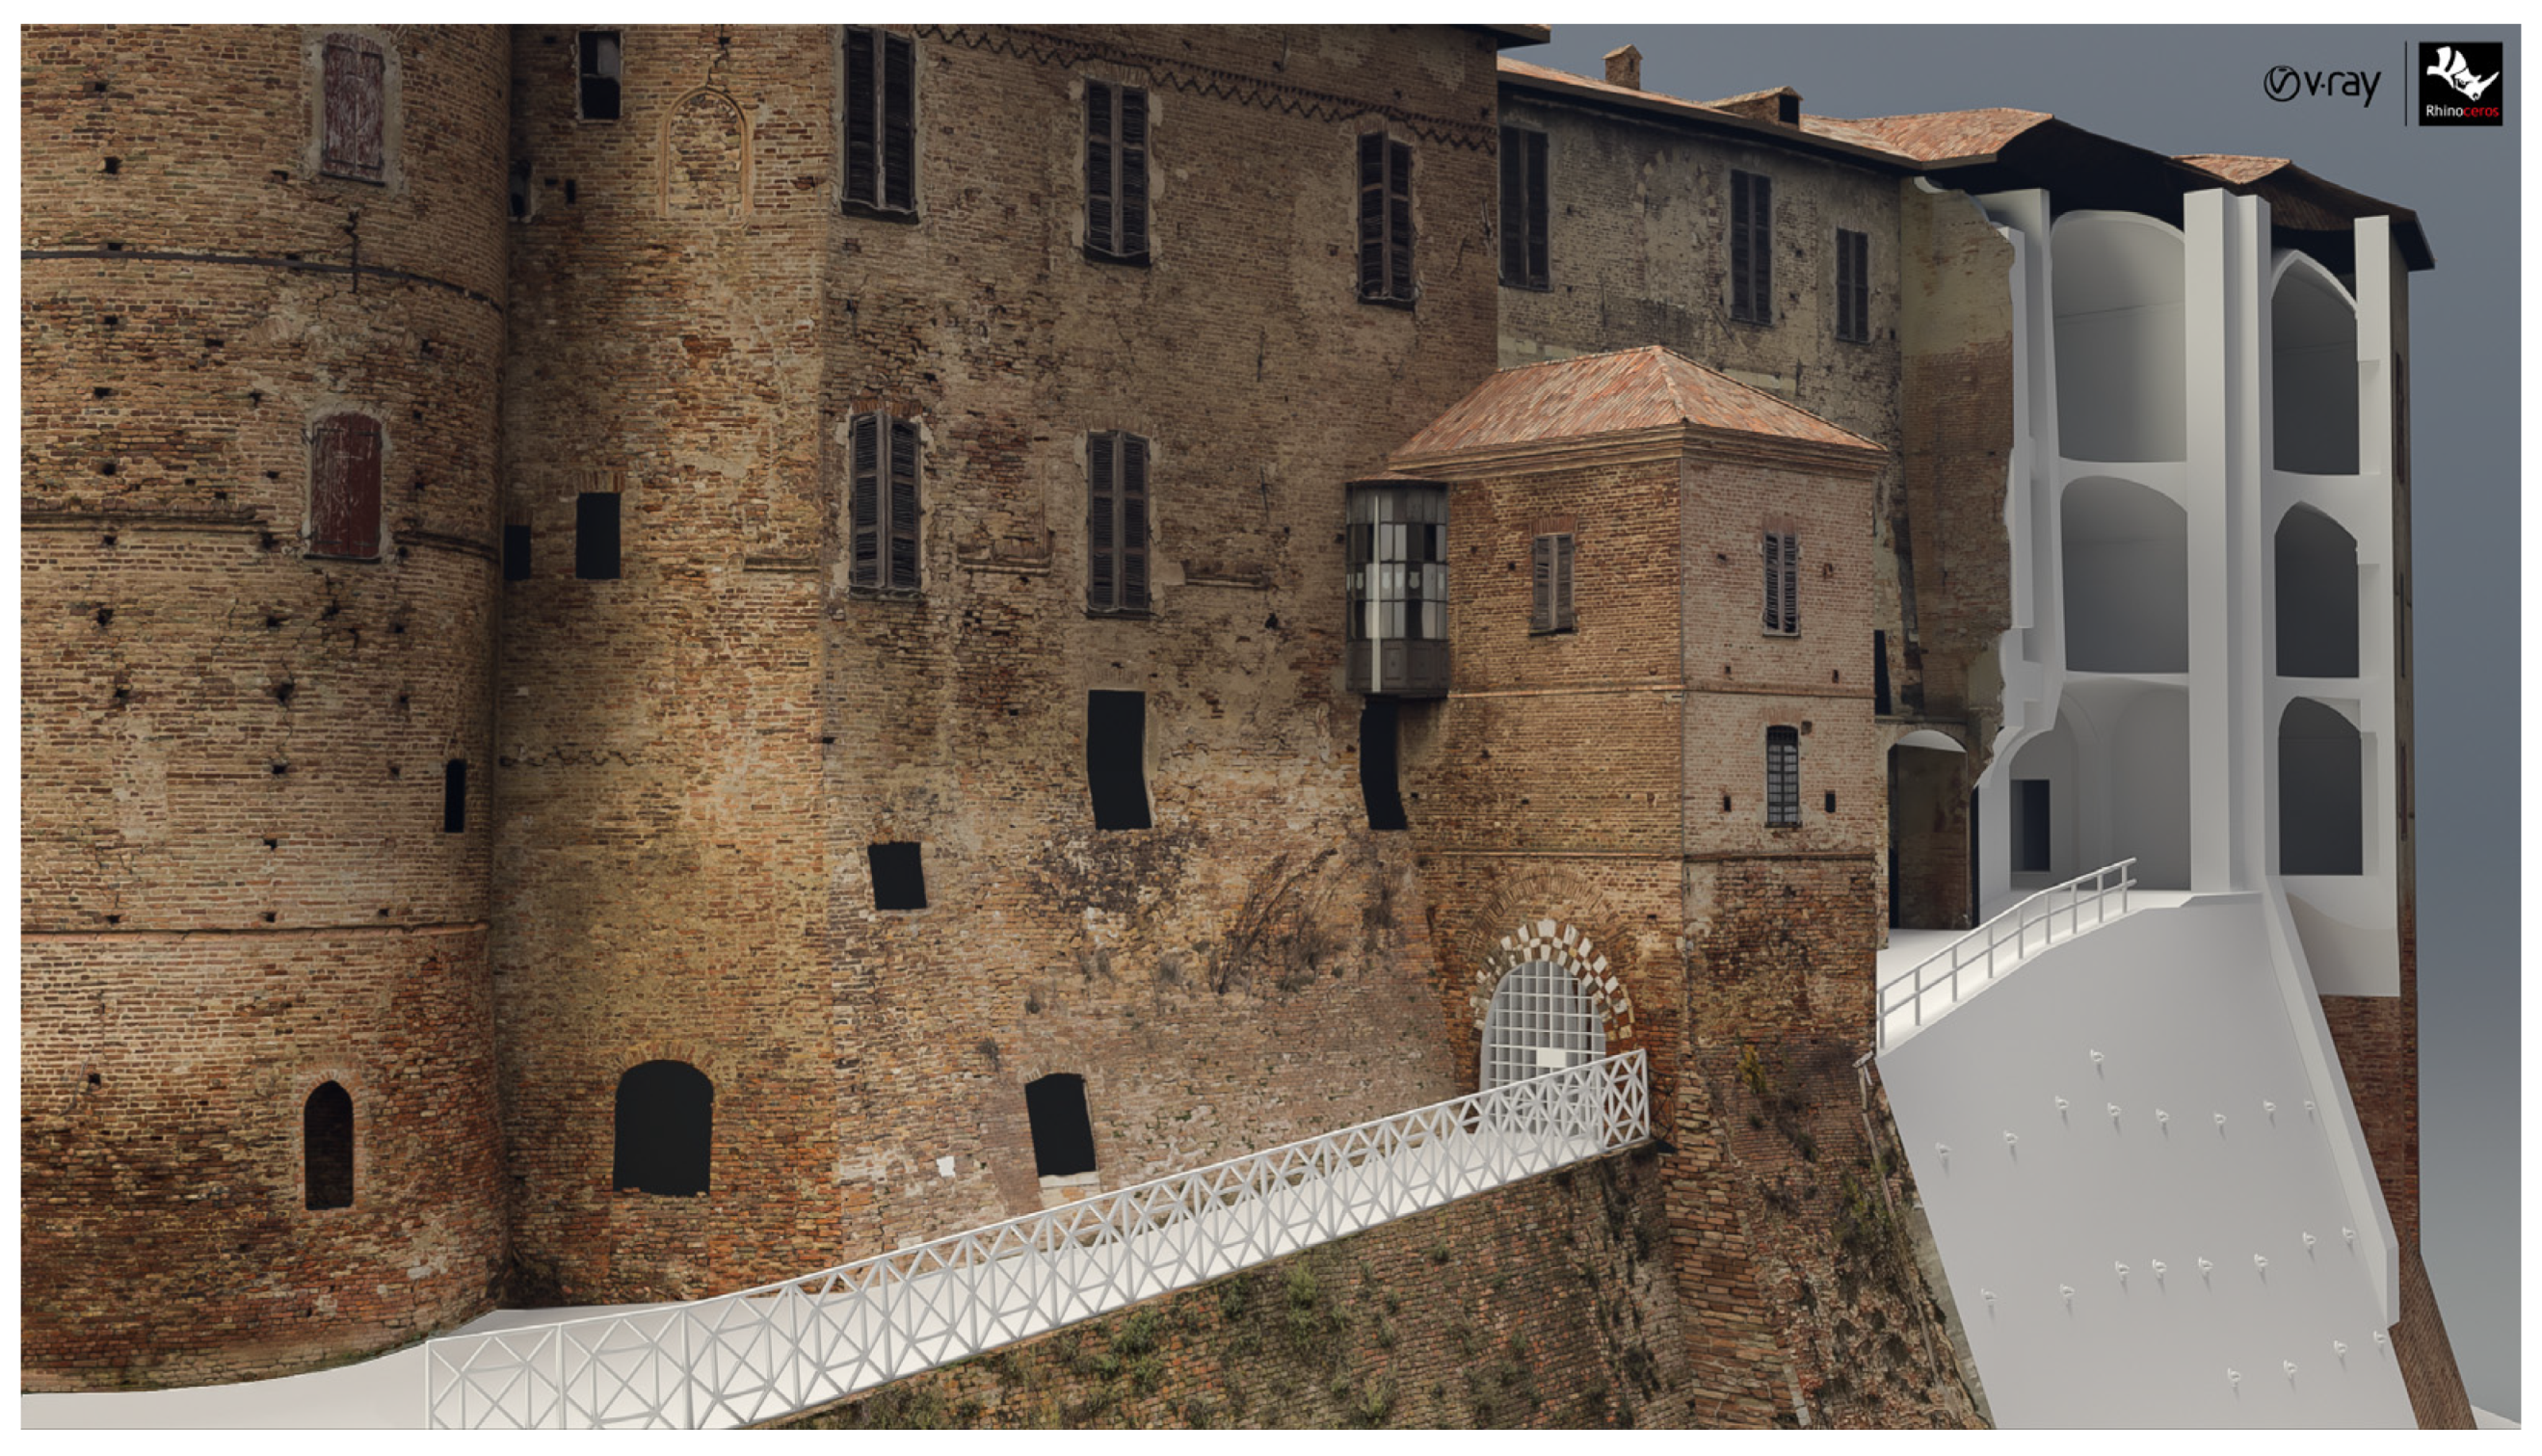
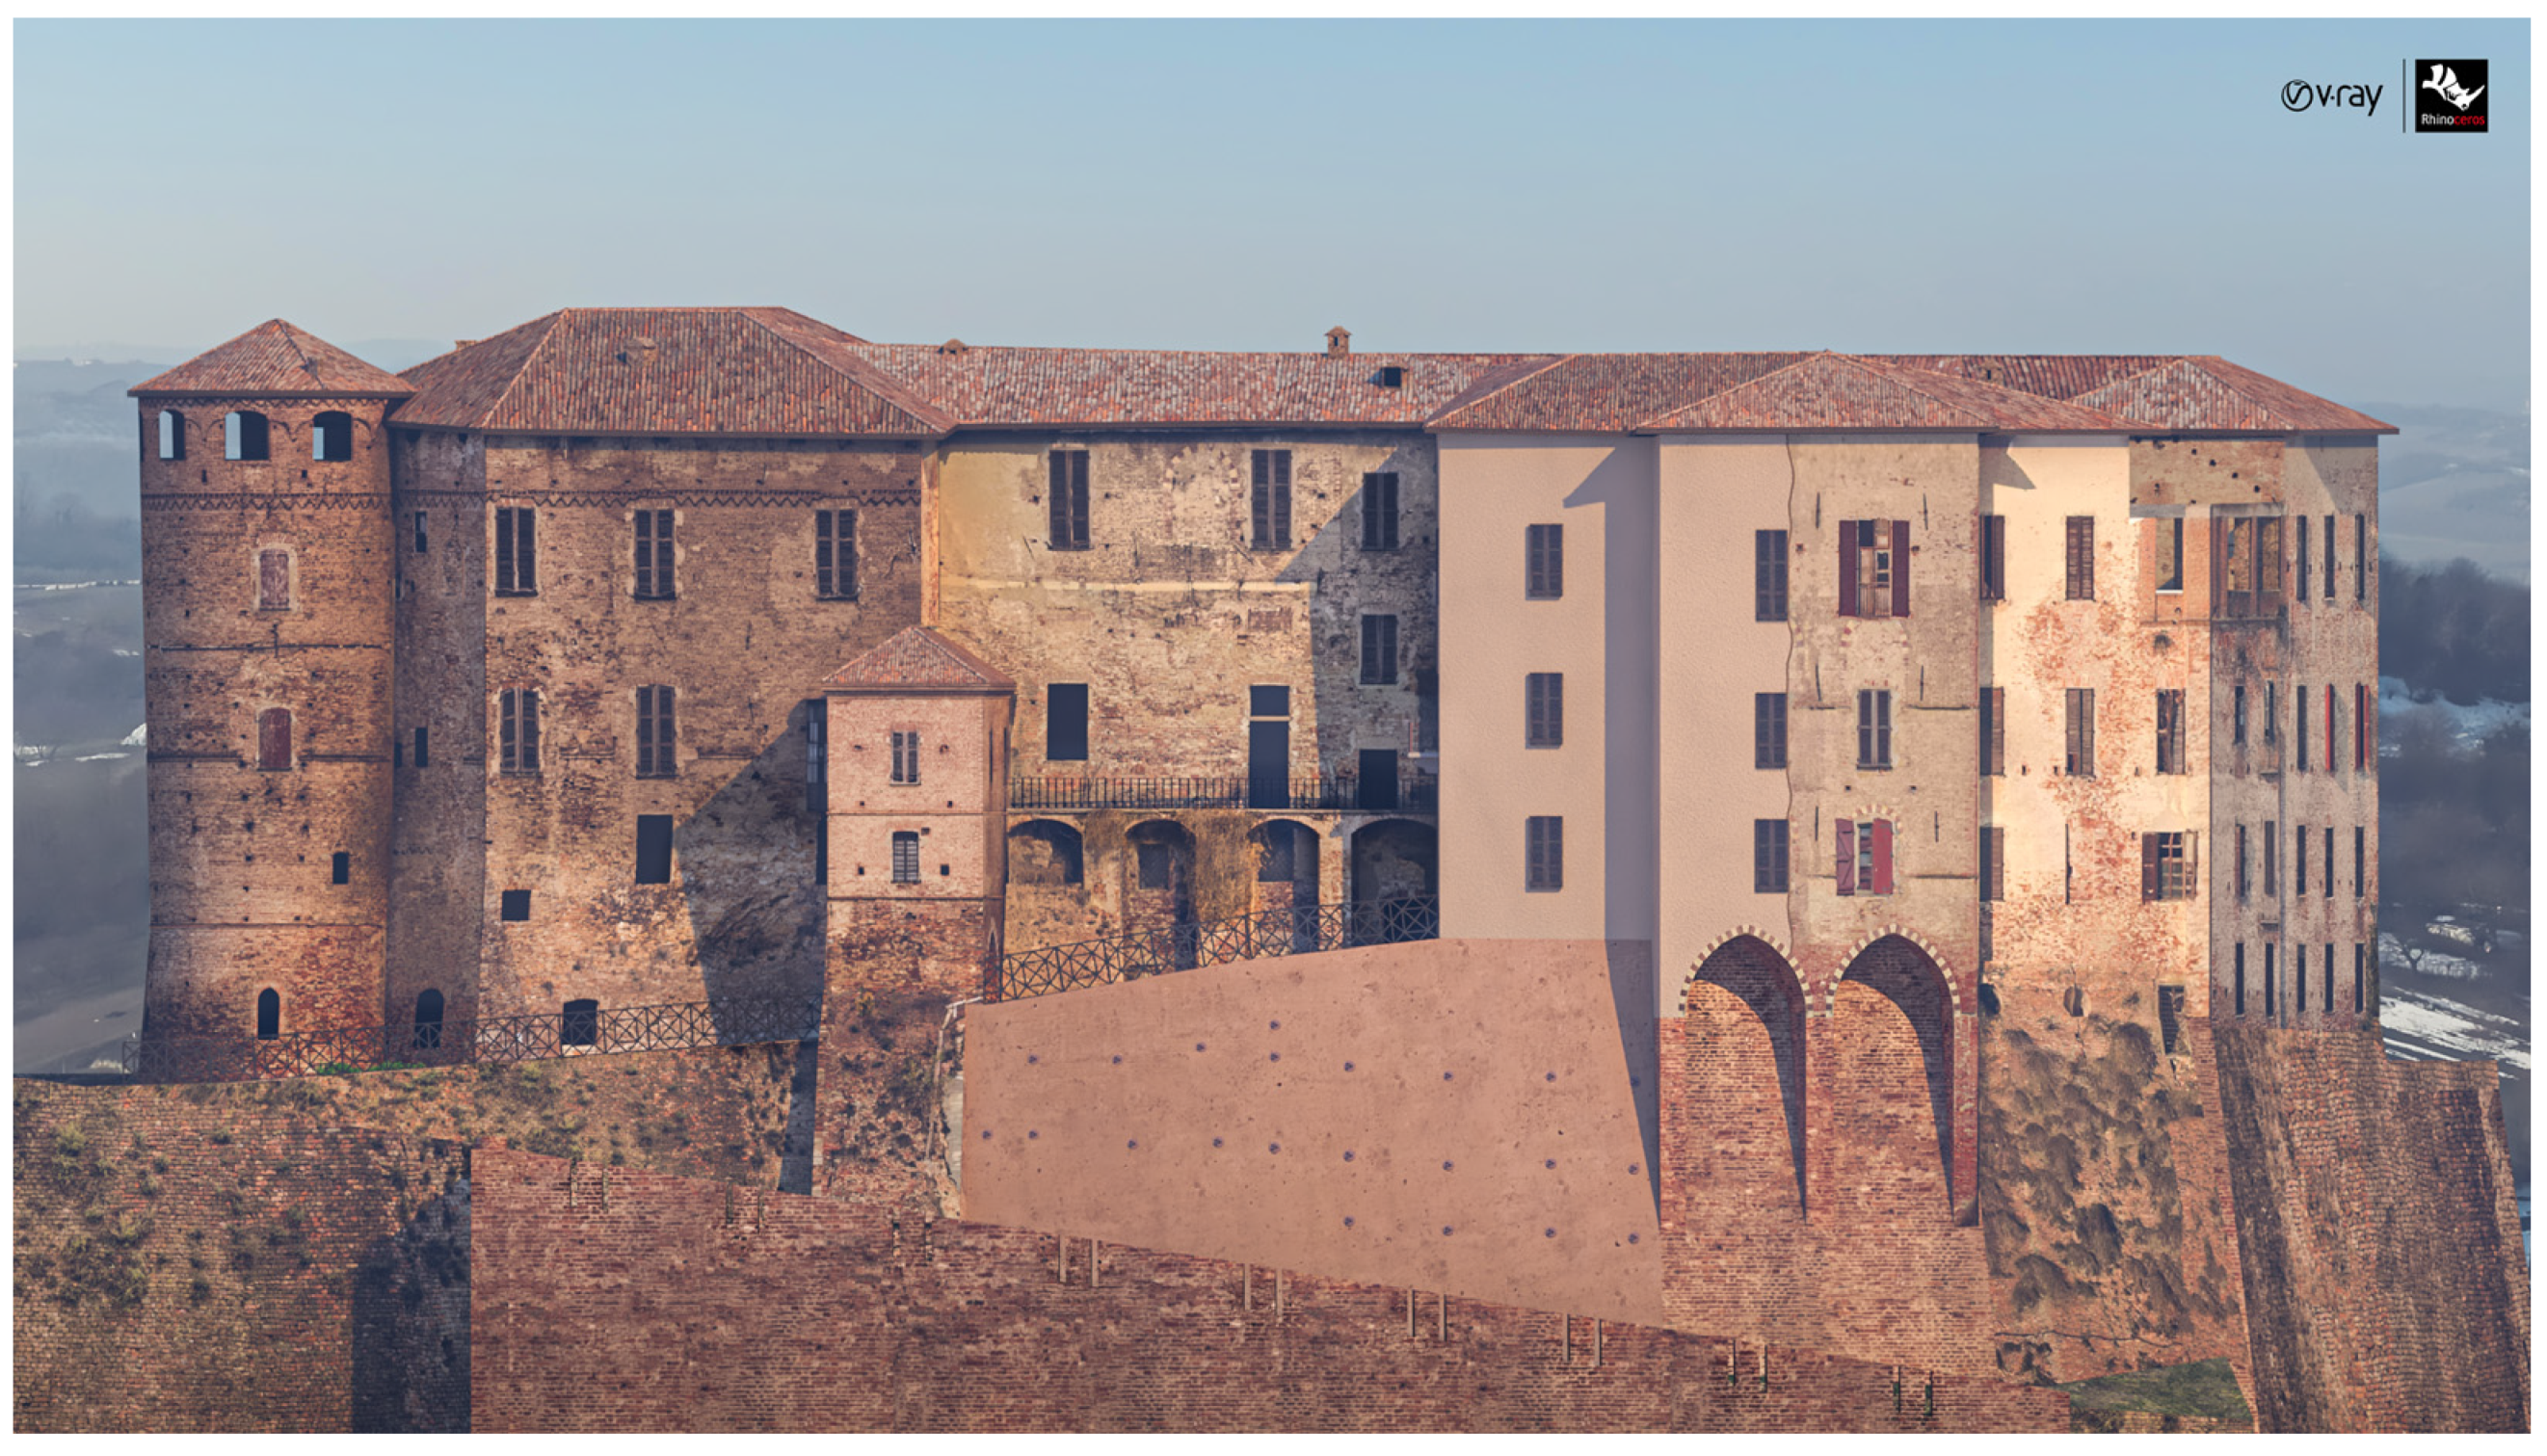
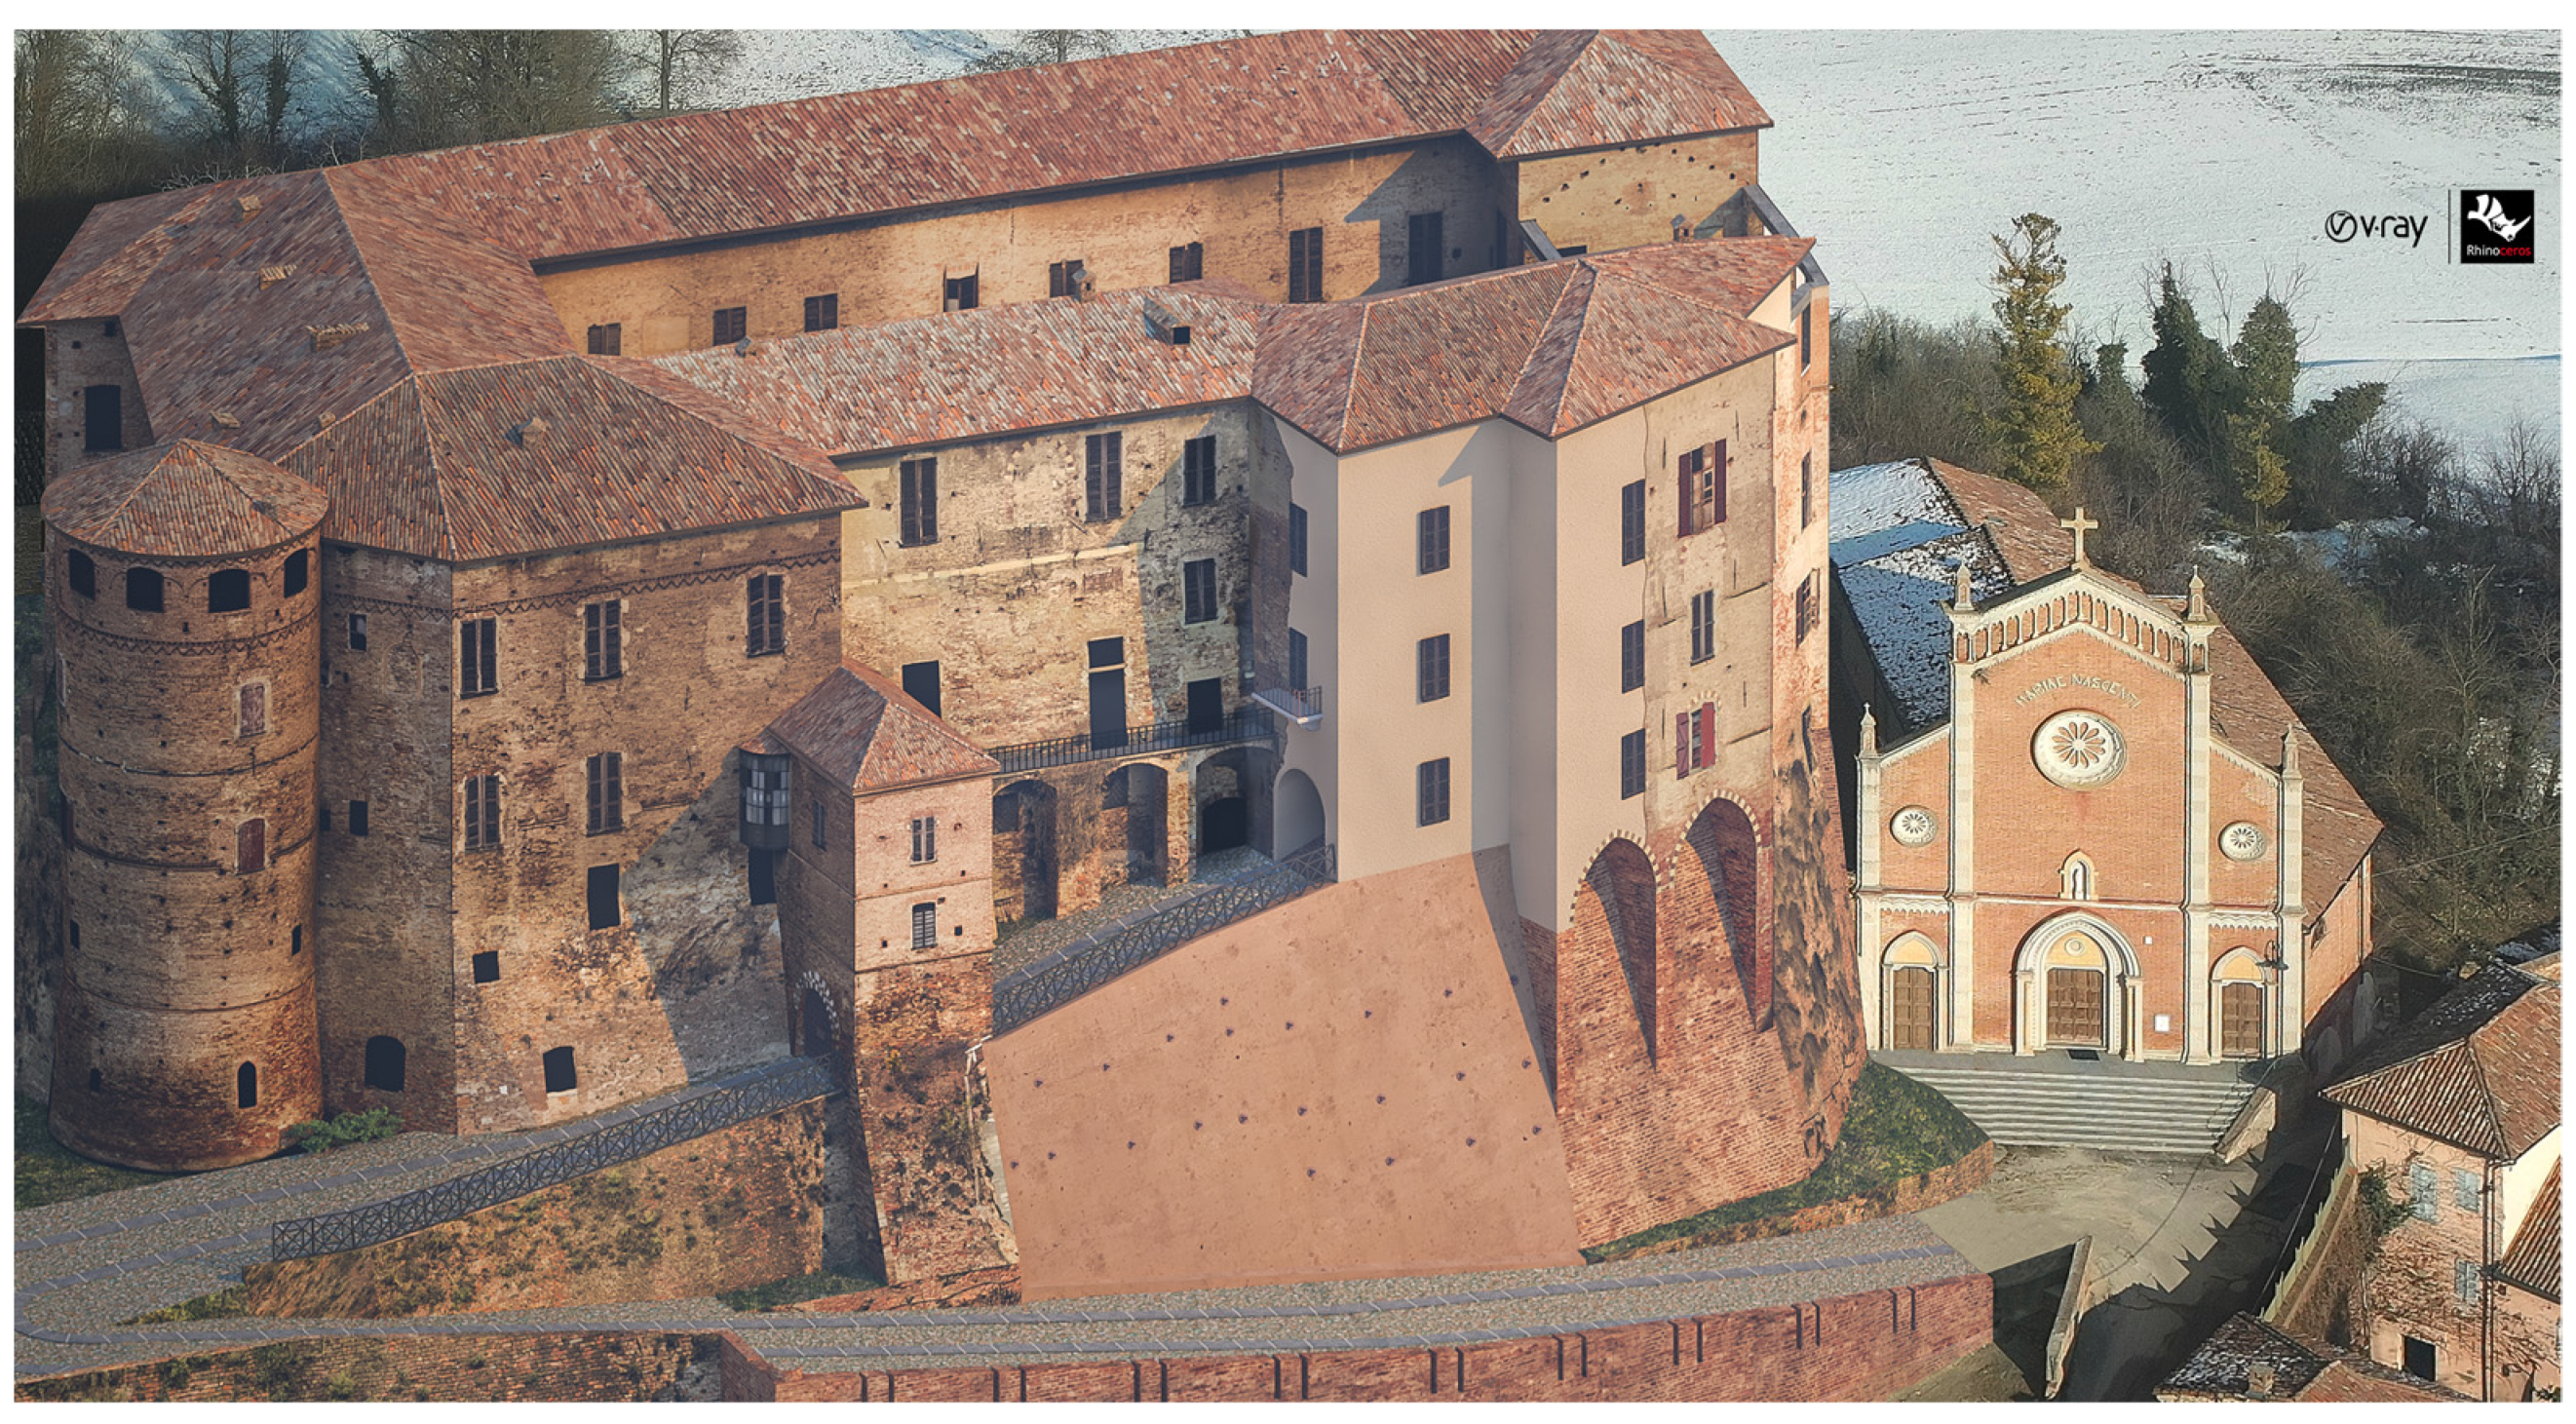
The fourth and last phase of the NURBS modelling is the proposed hypothetical reconstruction of the collapsed area on the south side. The collapsed parts concern the main entrance, including the first and second floors and the pointed arches that support half of the forepart. These parts were remodelled starting from the previous model. The walls, the openings, the original balcony, and the forepart with the pointed arch were modelled using NURBS surfaces following photographic references related to the pre-2014 situation. Textural and material information were then applied to the model. The final result of the proposed reconstruction was rendered using the V-Ray engine [32] to support the restoration project carried out by the municipality of Frinco, local engineering studies, and cultural heritage authorities (Figure 26 and Figure 27). The municipality jointly decided on the proposed solution for reconstructing the collapsed area and the Superintendence (local authority).
4. Discussion
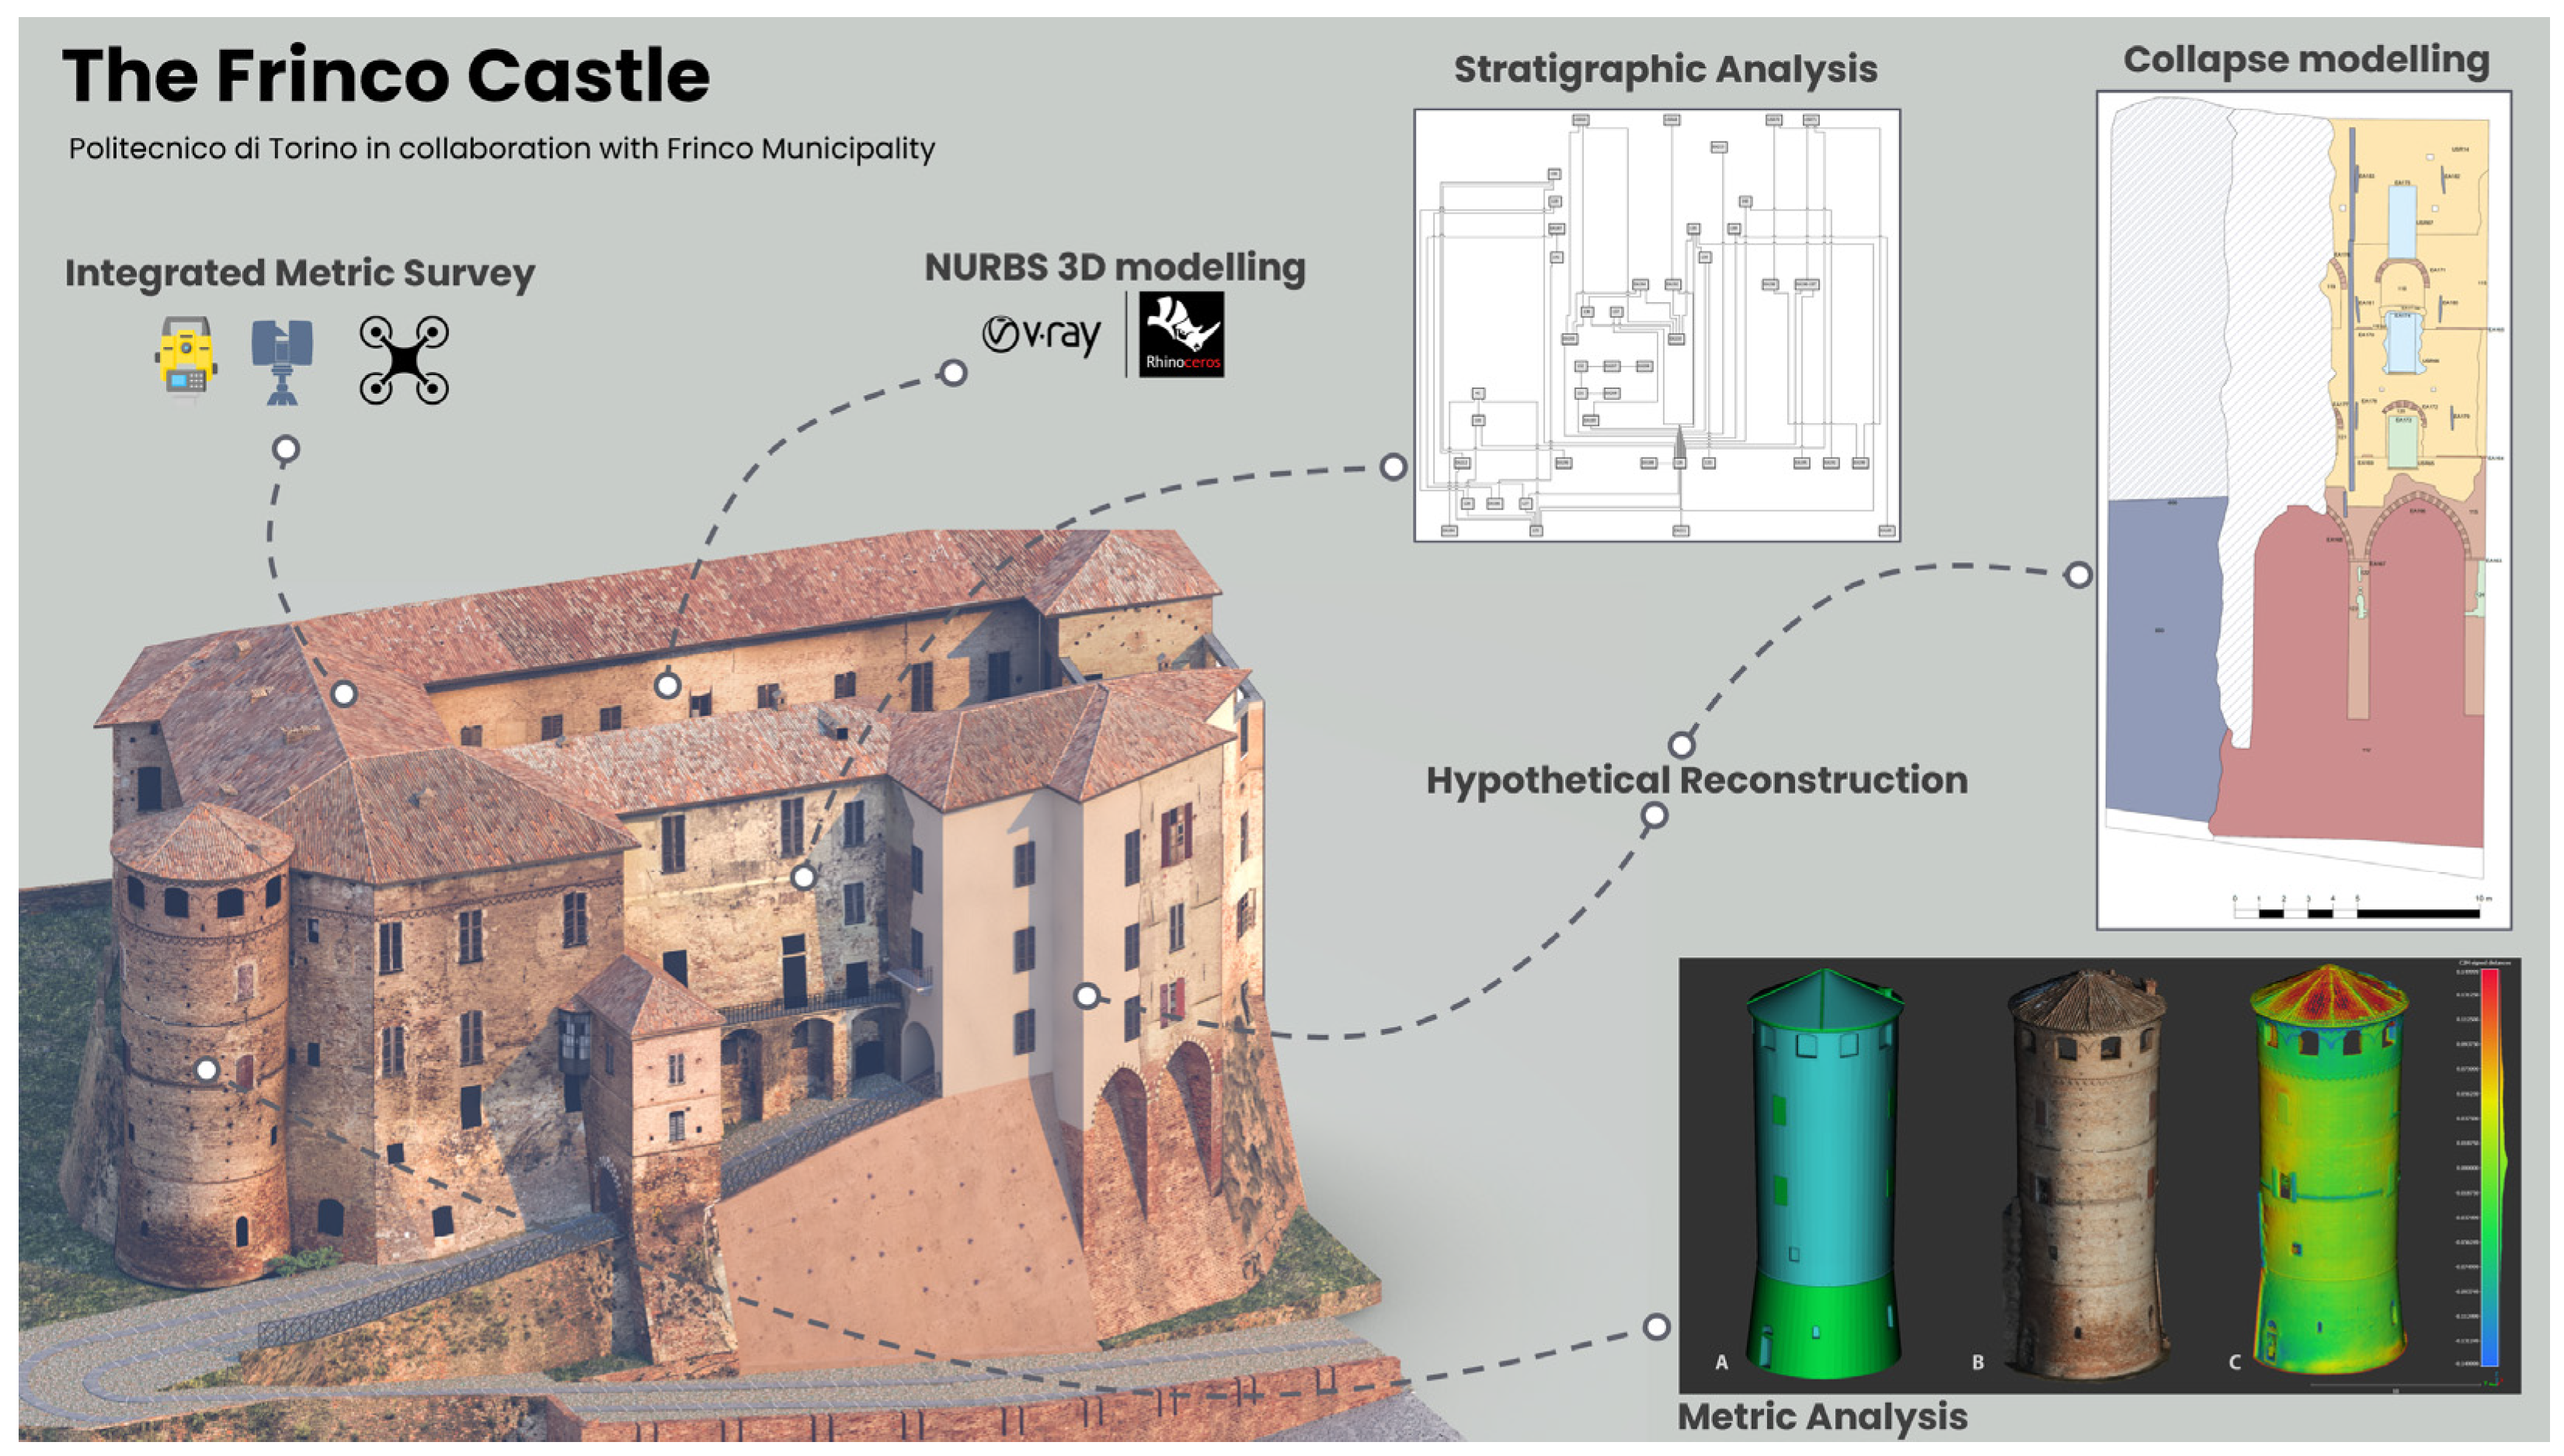
This project and the chosen workflow (Figure 28) were essential in different aspects. The geodetic survey returned a complete, highly accurate control network and 3D documentation. In this regard, integrating different instruments and techniques (from the Trimble Station to the aerial survey) permitted the acquisition of the castle’s entire morphology (also hidden areas). For restoration purposes, the performed survey was essential for having metric support (and digital backup) to reconstruct the collapsed area.
Furthermore, significant results arrived from the analysis of the stratigraphic complexity. This study revealed that it is essential to comprehend masonry from the medieval age to modern times. Although the performed analysis did not cover the entire volume of the castle, the stratigraphic interpretation helped to understand the evolution of the construction site.
The present study fits into the broader context referring to the dissemination of the holistic knowledge of this castle. The analyses conducted on the stratigraphy and the supporting geodetic survey are the starting points for more in-depth studies on the physical characterization and analysis of the elements of degradation and cracking, especially to prevent subsequent collapses on other fronts of the castle. The collaboration between the Polytechnic of Turin, architects, and local authorities (involved in the reconstruction operations) aims to, above all, the total consolidation of the castle and the securing of the entire building to be carried out in parallel with the reconstruction. In this case, the stratigraphic knowledge of the building contributes greatly to the knowledge of the evolution of the masonry and its vulnerabilities. At the same time, an in-depth analysis of building materials and their reuse would make the architectural and structural documentation more complete and would help draw a more definite picture about the workers who worked there. For this reason, an HBIM project could greatly increase the possibilities of semantic and 3D documentation of the castle, going on to form a dynamic database into which all the necessary information would flow.
Moreover, the stratigraphic analysis is a data type that must be constantly monitored and updated, especially since it is primarily subjective. As soon as possible, once inner spaces are secured, the stratigraphic analysis has to be performed for the internal spaces and rooms of the castle, reaching a global interpretation of the entire masonry and construction elements.
From a critical point of view, as expected, the entire workflow of the project was characterized by highly time-consuming operations, from several days of surveys to post-processing elaborations and 3D modelling. At the same time, the stratigraphic survey, analysis, and the (preliminary) interpretation of the entire external area of the castle were conducted in about eight months.
5. Conclusions
The main goal of this work focused on achieving an overall metric and semantic documentation of the Frinco Castle for restoration and fruition purposes. This fragile and important cultural heritage at risk needs to be preserved for its particular history and for returning this architectural landmark to the local community. The collapse episode has caused as much stir as sensitivity among local authorities such as academic entities. In fact—thanks to the action of academia and professors—this project was inscribed into the Restoration Atelier related to the Architectural Course of the Polytechnic of Turin. This activity was an excellent opportunity for students to collect substantial and innovative ideas for the requalification and restoration processes planned with the supervision of the municipality of Frinco and local authorities.
The modelled castle, both the actual situation and the proposed hypothetical reconstruction, could be considered a digital twin and a digital backup for performing updated analyses on the morphology and regarding the stratigraphic semantic data [33]. The presented model and semantic dataset could be considered a digital twin of the Frinco Castle for two reasons: the performed surveys helped the completed reconstruction and metric analysis of the building, enabling a detailed reality-based, as well as NURBS and rendered quality, models. At the same time, the NURBS model was enriched with stratigraphic layers based on the archaeological semantic analysis. These data constitute a complete dataset both from a geometric and historical point of view, especially since the castle has no other surveys or historical archives.
In the same way, the stratigraphic analysis and interpretation helped and will help the conservation and subsequent restoration phases. In fact, the 3D and semantic data were mandatory for understanding the architectural conformation and evolution of the castle and for helping the proposed reconstruction of the collapsed area and is fundamental information to be preserved since the historical evolution of the construction site of the castle is not documented in any archive.
From 2021 to the present, the Frinco Castle was enriched by metric information, semantic data, 2D data (plans, sections, and elevations), 3D models (reality-based high-quality modes and NURBS), and photorealistic renders. Virtual and immersive 3D reconstructions of endangered heritages or archaeological sites demonstrate their full potential, especially in relation to the ease of communication and enhancement of complex contexts [34,35]. Complexity is often given by related semantic data and the historical background. All the collected data were used to better understand the castle’s complex morphology, especially for securing different areas at risk and beginning consolidation and restoration operations. This study, like other important similar works in the literature [36,37], revealed the importance of 3D documentation supported by a comprehensive semantic and historical framework for sharing knowledge related to fragile contexts. The metric and semantic data and metadata may constitute an informative and collaborative platform for sharing knowledge and analysis possibilities. In this regard, the NURBS model and stratigraphic information—the relative chronological interpretation of the castle, coupled with 3D immersive modelling—could be at the centre of an HBIM program [38,39]. This phase should be performed after a mandatory parametrization step of geometries and surfaces [40,41]. However, the creation of the HBIM dynamic model could take a long time to process, especially since there are no predefined parametric libraries suitable for the castle and heritage assets in general [42,43], unless ad hoc architectural libraries are created [44,45]. In this way, a dynamic 3D database of the castle could be set up and managed for further analyses and collaborations among professionals.
Author Contributions
Conceptualization, F.D. and M.R.; methodology, F.D. and M.R.; software, F.D.; validation, F.D. and M.R.; formal analysis, F.D. and M.R.; investigation, F.D.; resources, F.D. and M.R.; data curation, F.D. and M.R.; writing—original draft preparation, F.D.; writing—review and editing, F.D. and M.R.; visualisation, F.D. and M.R.; supervision, F.D. and M.R.; project administration, M.R.; funding acquisition, M.R. All authors have read and agreed to the published version of the manuscript.
Funding
This research was funded by the Fondazione Cassa di Risparmio di Asti.
Data Availability Statement
Not applicable.
Acknowledgments
The authors want to acknowledge the Frinco Municipality for supporting the topographic and UAS surveys. In this regard, special thanks go to the Highpix company and Enrico Iuliano for performing and supporting UAS flights for the aerial survey of the Frinco Castle. At the same time, special thanks go to Arch. Eng. Giorgio Viazzo and Arch. Eng. Chiara Viazzo for contributing and supporting the terrestrial acquisition phase as well as for the 2D data production. Finally, the authors would like to thank Carla Bartolozzi (Polytechnic of Turin) for forming and helping with the restoration phase of the project and the historical analysis of the castle.
Conflicts of Interest
The authors declare no conflict of interest.
References
- Trimble Website. Available online: https://www.trimble.com/en (accessed on 23 September 2023).
- Conti, F. Castelli del Piemonte; Istituto Geografico De Agostini: Novara, Italy, 1980; EAN 2570040110895. [Google Scholar]
- Micheletto, E. Castelli in Piemonte: Per un quadro archeologico. In L’incastellamento: Storia e Archeologia. A 40 Anni da Les Structures di Pierre Toubert; Augenti, A., Galetti, P., Eds.; Fondazione Centro Italiano di Studi Sull’Alto Medioevo: Spoleto, Italy, 2018; ISBN 978-88-6809-175-0. [Google Scholar]
- Bordone, R. Andar per Castelli da Asti Tutt’intorno; Milvia: Torino, Italy, 1976; ISBN 2020010144721. [Google Scholar]
- Sorisio, R. Ricerche Storico-Giuridiche su Frinco. Master’s Thesis, University of Turin, Turin, Italy, 1979. [Google Scholar]
- Gabiani, N. Le Torri le Case-Forti ed i Palazzi Nobili Medievali in Asti; A. Forni: Bologna, Italy, 1978. [Google Scholar]
- Malfatto, V. Asti Antiche e Nobili Casate; Il Portichetto: Cuneo, Italy, 1982. [Google Scholar]
- Biaggi, E. Le Antiche Monete Piemontesi; Editrice Tipolito Melli: Borgone di Susa, Italy, 1978. [Google Scholar]
- Biaggi, E. Monete e Zecche del Piemonte e Valle d’Aosta. La Storia Regionale Attraverso le Monete e le Antiche Zecche; Susalibri: Rivoli, Italy, 2015. [Google Scholar]
- DJI Website. Available online: https://www.dji.com (accessed on 23 September 2023).
- Štroner, M.; Urban, R.; Línková, L. A New Method for UAS Lidar Precision Testing Used for the Evaluation of an Affordable DJI Zenmuse L1 Scanner. Remote Sens. 2021, 13, 4811. [Google Scholar] [CrossRef]
- Kersten, T.; Wolf, J.; Lindstaedt, M. Investigations into the accuracy of the UAS system DJI Matrice 300 RTK with the sensors Zenmuse P1 and L1 in the Hamburg test field. Int. Arch. Photogramm. Remote Sens. Spat. Inf. Sci. 2022, XLIII-B1-2022, 339–346. [Google Scholar] [CrossRef]
- Lachat, E.; Landes, T.; Grussenmeyer, P. First experiences with the Trimble SX10 scanning total station for building facade survey. Int. Arch. Photogramm. Remote Sens. Spat. Inf. Sci. 2017, XLII-2/W3, 405–412. [Google Scholar] [CrossRef]
- Diara, F.; Roggero, M. Quality Assessment of DJI Zenmuse L1 and P1 LiDAR and Photogrammetric Systems: Metric and Statistics Analysis with the Integration of Trimble SX10 Data. Geomatics 2022, 2, 254–281. [Google Scholar] [CrossRef]
- CloudCompare Software. Available online: https://www.danielgm.net/cc/ (accessed on 23 September 2023).
- HighPix Company. Available online: https://www.highpix.it (accessed on 23 September 2023).
- Peppa, M.V.; Morelli, L.; Mills, J.P.; Penna, N.T.; Remondino, F. Handcrafted and learning-based tie point features—Comparison using the EuroSDR RPAS benchmark dataset. Int. Arch. Photogramm. Remote Sens. Spat. Inf. Sci. 2022, XLIII-B2-2022, 1183–1190. [Google Scholar] [CrossRef]
- Agisoft Metashape. Available online: https://www.agisoft.com (accessed on 23 September 2023).
- Gaspari, F.; Ioli, F.; Barbieri, F.; Belcore, E.; Pinto, L. Integration of UAS-LiDAR and UAS-photogrammetry for infrastructure monitoring and bridge assessment. Int. Arch. Photogramm. Remote Sens. Spat. Inf. Sci. 2022, XLIII-B2-2022, 995–1002. [Google Scholar] [CrossRef]
- Doglioni, F. La Ricerca sulle strutture edilizie tra archeologia stratigrafica e restauro architettonico. In Archeologia e Restauro dei monumenti; Francovich, R., Parenti, R., Eds.; All’Insegna del Giglio: Firenze, Italy, 1988. [Google Scholar]
- Parenti, R. Archeologia dell’Architettura. In Dizionario di Archeologia. Temi, Concetti, Metodi; Francovich, R., Manacorda, D., Eds.; Laterza: Rome, Italy; Bari, Italy, 2000; pp. 39–43. [Google Scholar]
- Boato, A. L′ Archeologia in Architettura. Misurazioni, Stratigrafie, Datazioni, Restauro; Marsilio Editore: Venice, Italy, 2008. [Google Scholar]
- Brogiolo, G.P.; Cagnana, A. Archeologia Dell’architettura—Metodi e Interpretazioni; Collana Metodi e temi dell’archeologia medioevale; All’insegna del Giglio: Firenze, Italy, 2012. [Google Scholar]
- Augenti, A. Archeologia dell’Italia Medievale; Editori Laterza: Rome, Italy; Bari, Italy, 2016; ISBN 978-88-581-2230-3. [Google Scholar]
- Harris, E.C. Principi di Stratigrafia Archeologia; Carocci Editore: Rome, Italy, 2002. [Google Scholar]
- Mannoni, T. L’esperienza ligure nello studio archeologico dei castelli medievali. In 1. Archeologia dell’Urbanistica; Castelli: Storia e Archeologia, Cuneo, 1984, Mannoni, T.; ESCUM: Genoa, Italy, 1994. [Google Scholar]
- Mannoni, T. Metodi di datazione dell’edilizia storica. In 3. Caratteri Costruttivi Dell’edilizia Storica; Archeologia Medievale, XI, 1984, Mannoni, T.; ESCUM: Genoa, Italy, 1994. [Google Scholar]
- Pittaluga, D. La Mensiocronologia dei Mattoni. Per Datare, per Conoscere e per Comprendere le Strutture Storiche; ECIG: Genova, Italy, 2009; ISBN 88-7544-190-1. [Google Scholar]
- Settia, A. Castelli Medievali; Società Editrice il Mulino, Universale Paperbacks: Bologna, Italy, 2017; ISBN 978-88-1527053-5. [Google Scholar]
- Bergamini, F. Architetture tardomedievali tra Chierese e Monferrato astigiano: Un paesaggio culturale. In Bollettino Storico-Bibliografico Subalpino; CXVI (II), Torino, Palazzo Carignano; Deputazione Subalpina di Storia Patria: Torino, Italy, 2018. [Google Scholar]
- Rhinoceros. Available online: https://www.rhino3d.com (accessed on 23 September 2023).
- V-Ray. Available online: https://www.chaos.com/ (accessed on 23 September 2023).
- Jouan, P.; Hallot, P. Digital twin: A HBIM-based methodology to support preventive conservation of historic assets through heritage significance awareness. Int. Arch. Photogramm. Remote Sens. Spat. Inf. Sci. 2019, XLII-2/W15, 609–615. [Google Scholar] [CrossRef]
- Ozimek, A.; Ozimek, P.; Skabek, K.; Łabędź, P. Digital Modelling and Accuracy Verification of a Complex Architectural Object Based on Photogrammetric Reconstruction. Buildings 2021, 11, 206. [Google Scholar] [CrossRef]
- Cáceres-Criado, I.; García-Molina, D.F.; Mesas-Carrascosa, F.J.; Triviño-Tarradas, P. New approach for optimizing the interpretation and representation of the degree of historical-archaeological evidence in the virtual reconstructions. Virtual Real. 2023, 27, 967–983. [Google Scholar] [CrossRef]
- Valle Abad, P.; Fernández Fernández, A.; Rodríguez Nóvoa, A.A. Lost archaeological heritage: Virtual reconstruction of the medieval castle of San Salvador de Todea. Virtual Archaeol. Rev. 2022, 13, 22–44. [Google Scholar] [CrossRef]
- Özmen, A. Conservation and Adaptation for Medieval Castles: The Case of Messner Mountain Museums. Period. Polytech. Archit. 2022, 53, 245–259. [Google Scholar] [CrossRef]
- Murphy, M.; McGovern, E.; Pavia, S. Historic building information modelling (HBIM). Struct. Surv. 2009, 27, 311–327. [Google Scholar] [CrossRef]
- Murphy, M.; McGovern, E.; Pavia, S. Historic Building Information Modelling—Adding intelligence to laser and image based surveys of European classical architecture. ISPRS J. Photogramm. Remote Sens. 2013, 76, 89–102. [Google Scholar] [CrossRef]
- Diara, F.; Rinaudo, F. Building archaeology documentation and analysis through open source HBIM solutions via NURBS modelling. Int. Arch. Photogramm. Remote Sens. Spat. Inf. Sci. 2020, XLIII-B2-2020, 1381–1388. [Google Scholar] [CrossRef]
- Diara, F.; Rinaudo, F. From reality to parametric models of Cultural Heritage assets for HBIM. Int. Arch. Photogramm. Remote Sens. Spat. Inf. Sci. 2019, XLII-2/W15, 413–419. [Google Scholar] [CrossRef]
- Diara, F. HBIM Open Source: A Review. ISPRS Int. J. Geo-Inf. 2022, 11, 472. [Google Scholar] [CrossRef]
- Murphy, M.; Meegan, E.; Keenaghan, G.; Chenaux, A.; Corns, A.; Fai, S.; Chow, L.; Zheng, Y.; Dore, C.; Scandurra, S.; et al. Shape grammar libraries of european classical architectural elements for historic BIM. Int. Arch. Photogramm. Remote Sens. Spat. Inf. Sci. 2021, XLVI-M-1-2021, 479–486. [Google Scholar] [CrossRef]
- Bianchini, C.; Attenni, M.; Potestà, G. Regenerative Design Tools for the Existing City: HBIM Potentials. In Rethinking Sustainability Towards a Regenerative Economy—Future City; Andreucci, M.B., Marvuglia, A., Baltov, M., Hansen, P., Eds.; Springer: Cham, Switzerland, 2021; Volume 15. [Google Scholar] [CrossRef]
- Banfi, F.; Oreni, D.; Bonini, A.J. The Arch of Peace of Milan and its historic memory: From 3D survey and HBIM to mixed reality (VR-AR). In Connecting. Drawing for Weaving Relationships, Proceedings of the 42th International Conference of Representation Disciplines Teachers, Reggio Calabria, Italy, 16–18 September 2021; FrancoAngeli: Milan, Italy, 2020; pp. 1660–1677. [Google Scholar] [CrossRef]
Figure 1.
The main workflow of the project: from 3D survey to stratigraphic analysis and NURBS modelling of the Frinco Castle.
Figure 1.
The main workflow of the project: from 3D survey to stratigraphic analysis and NURBS modelling of the Frinco Castle.

Figure 2.
Castles, towers, and fortified settlements in the Province of Asti. Frinco is northward from Asti (image from Conti F. 1980 [2]).
Figure 2.
Castles, towers, and fortified settlements in the Province of Asti. Frinco is northward from Asti (image from Conti F. 1980 [2]).

Figure 3.
Aerial image of the Frinco Castle from the south side, from which the collapsed area is visible.
Figure 3.
Aerial image of the Frinco Castle from the south side, from which the collapsed area is visible.

Figure 4.
Photogrammetric process and 3D model inside the Agisoft Metashape software: aerial images acquired by DJI Zenmuse P1.
Figure 4.
Photogrammetric process and 3D model inside the Agisoft Metashape software: aerial images acquired by DJI Zenmuse P1.

Figure 5.
Profiles’ extraction from the intersection between the point clouds and planar sections passing through X, Y, and Z planes.
Figure 5.
Profiles’ extraction from the intersection between the point clouds and planar sections passing through X, Y, and Z planes.

Figure 6.
Stratigraphic analysis for historical architectures: from the unit’s detection and classification (USM-USR-EA) to the unit’s physical sequence by using the Harris Matrix. Units’ relations are related to no connections (A), an overlap (B), and equality (C).
Figure 6.
Stratigraphic analysis for historical architectures: from the unit’s detection and classification (USM-USR-EA) to the unit’s physical sequence by using the Harris Matrix. Units’ relations are related to no connections (A), an overlap (B), and equality (C).

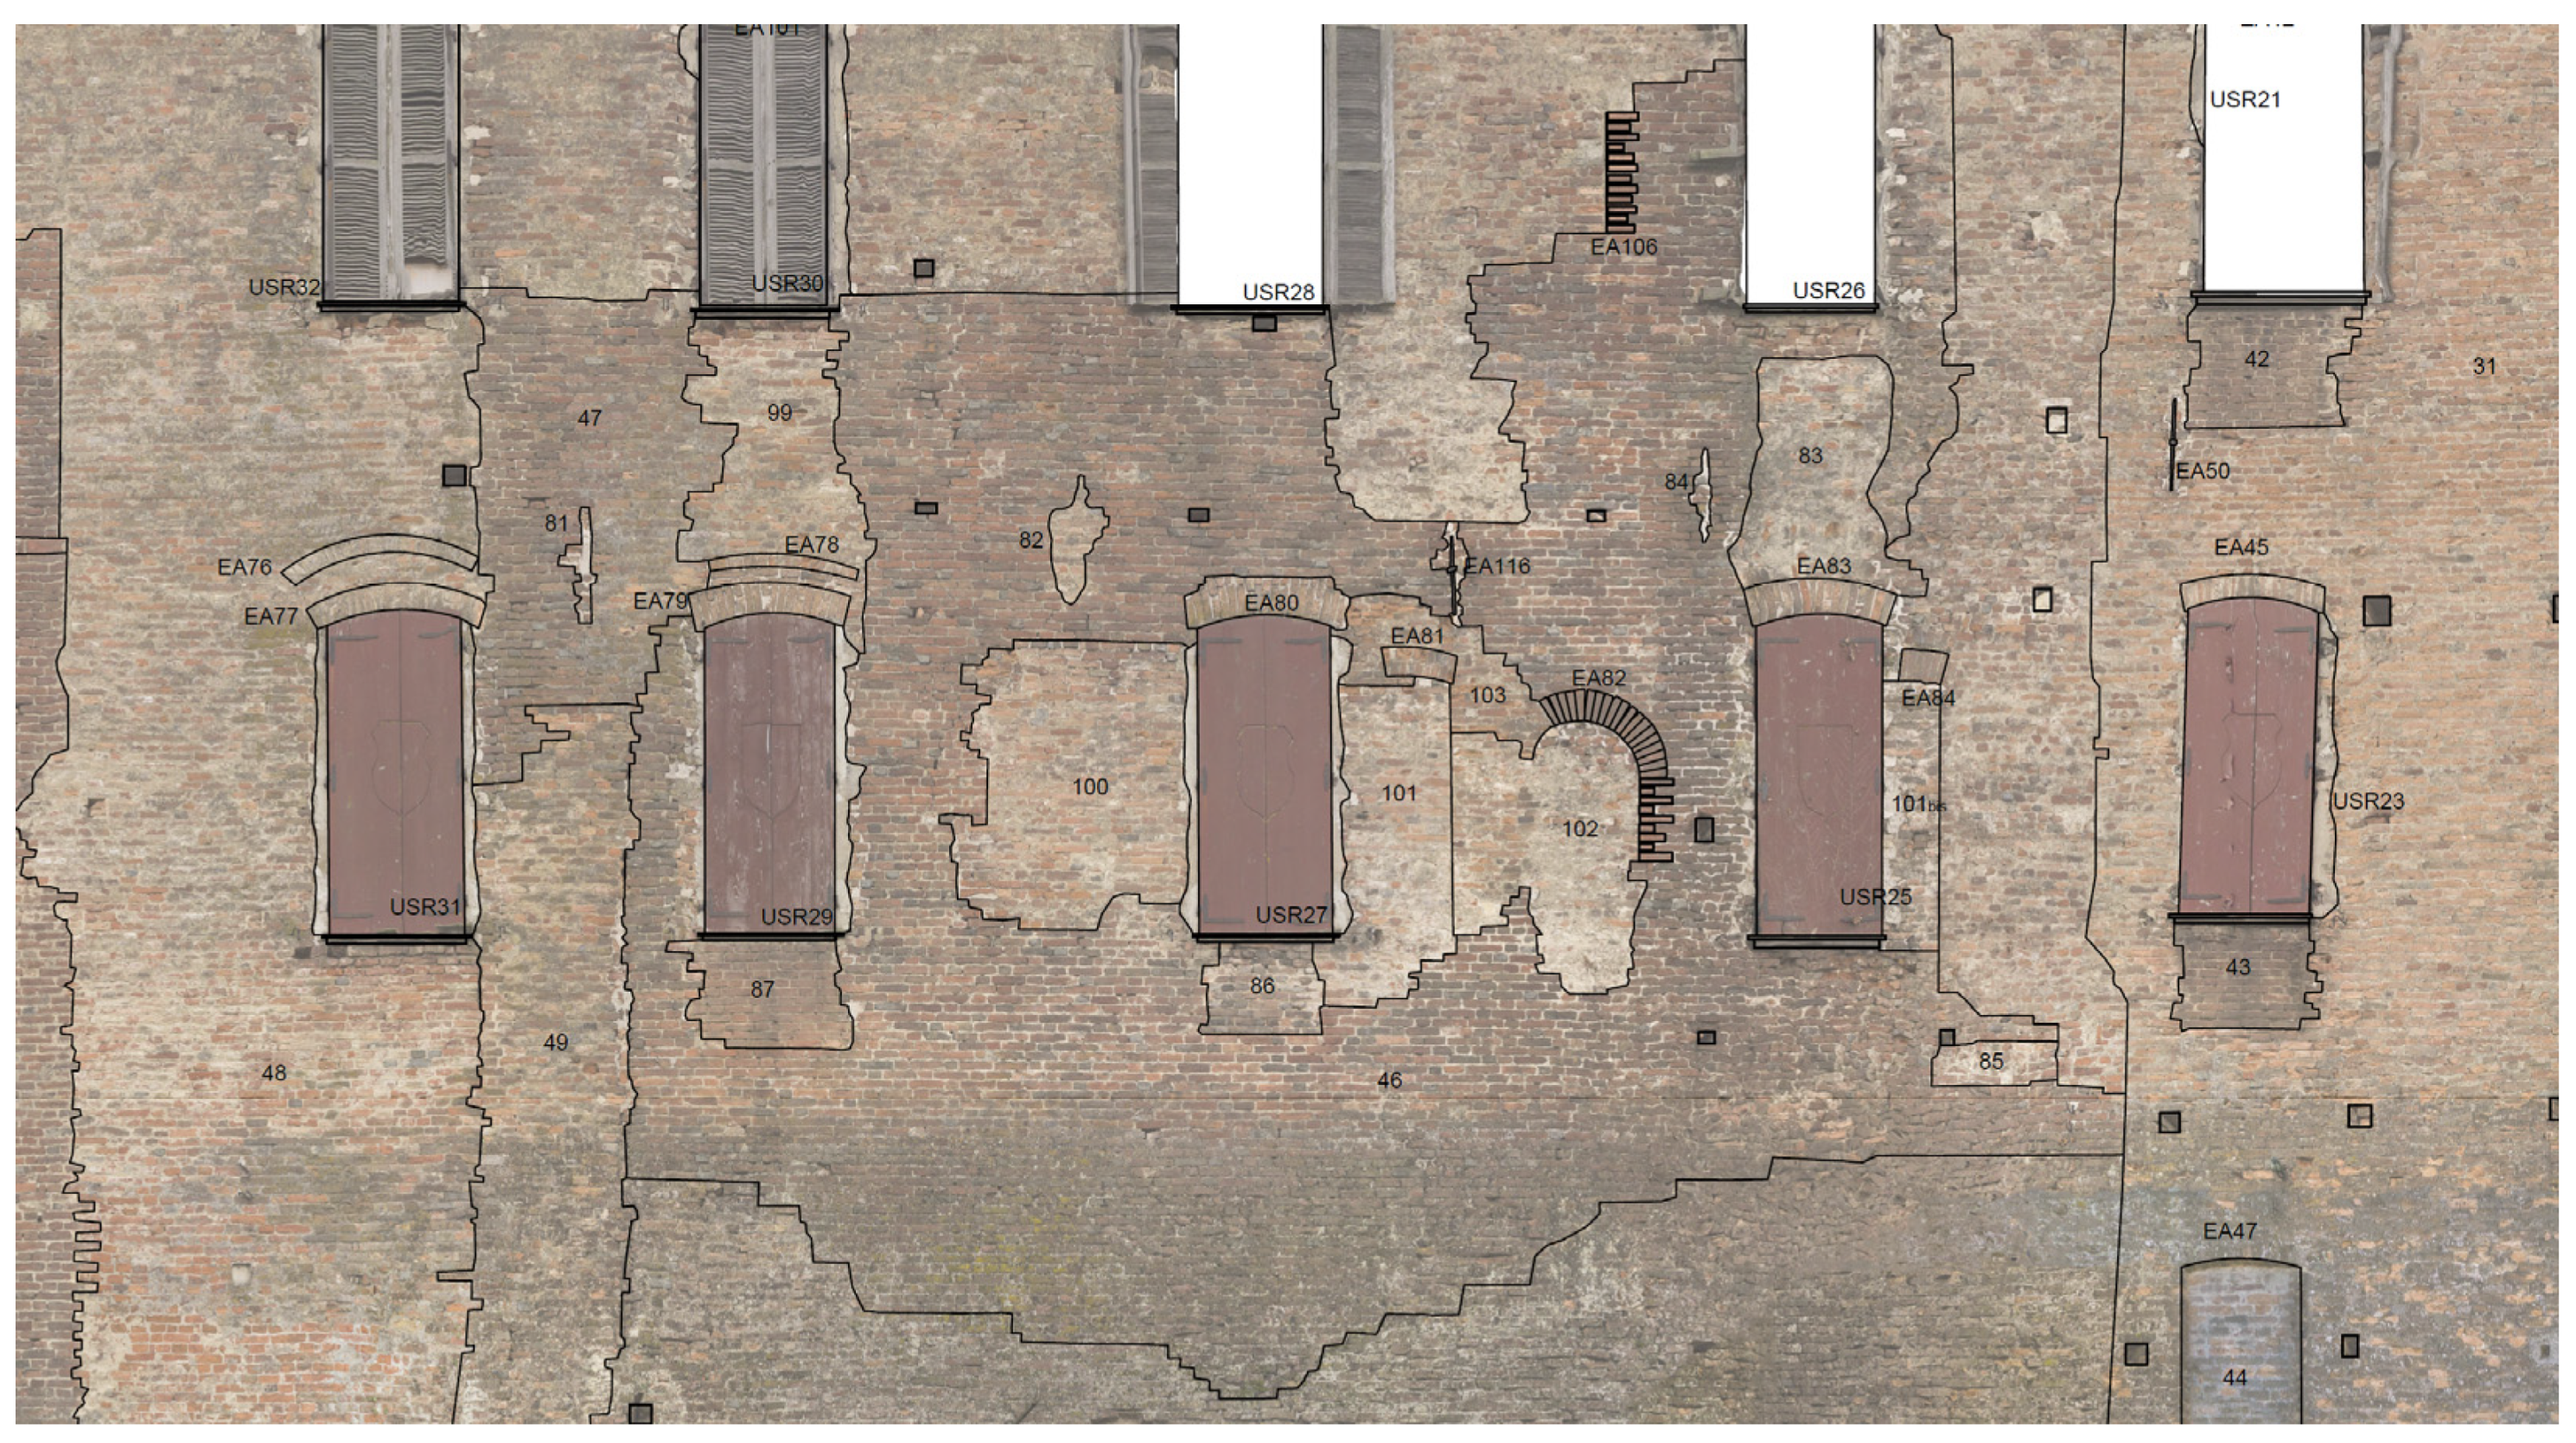
Figure 7.
Stratigraphic units’ detection in the castle’s north front (small portion). Different masonries, openings, and other architectural and structural elements can be noticed.
Figure 7.
Stratigraphic units’ detection in the castle’s north front (small portion). Different masonries, openings, and other architectural and structural elements can be noticed.

Figure 8.
Synthesis of detected stratigraphic units: from masonry (USM) and render/plaster (USR) layers to architectural elements (EA).
Figure 8.
Synthesis of detected stratigraphic units: from masonry (USM) and render/plaster (USR) layers to architectural elements (EA).

Figure 9.
Part of the relational database for stratigraphic units’ classification and description, and the physical relations among them.
Figure 9.
Part of the relational database for stratigraphic units’ classification and description, and the physical relations among them.

Figure 10.
Three of the nineteen stratigraphic diagrams produced for the analysis of the Frinco Castle: square tower—forepart in the south front (A); the central part of the west front (B); the area of the collapse in the south front (C).
Figure 10.
Three of the nineteen stratigraphic diagrams produced for the analysis of the Frinco Castle: square tower—forepart in the south front (A); the central part of the west front (B); the area of the collapse in the south front (C).

Figure 11.
West side of the squared access tower: from the units’ detection to the stratigraphic analysis and interpretation via Harris’ Matrix for understanding the relative chronology of layers on masonries.
Figure 11.
West side of the squared access tower: from the units’ detection to the stratigraphic analysis and interpretation via Harris’ Matrix for understanding the relative chronology of layers on masonries.

Figure 12.
Section of the central part of the west front of the castle: on the left side, the earlier masonry and decorations (Period I), while on the right side, the connected masonry and Ghibelline decorations related to Period III.
Figure 12.
Section of the central part of the west front of the castle: on the left side, the earlier masonry and decorations (Period I), while on the right side, the connected masonry and Ghibelline decorations related to Period III.

Figure 13.
Ghibelline dovetail comparisons: (A) Castello Molare (AL); (B) Torre Scarampa-Bertamenga (AT). Drawings of Fonio M.R., from Conti F., 1980.
Figure 13.
Ghibelline dovetail comparisons: (A) Castello Molare (AL); (B) Torre Scarampa-Bertamenga (AT). Drawings of Fonio M.R., from Conti F., 1980.

Figure 14.
Part of the south front of the internal courtyard: stratigraphic units (USM, USR, and EA), analysis, and interpretation.
Figure 14.
Part of the south front of the internal courtyard: stratigraphic units (USM, USR, and EA), analysis, and interpretation.

Figure 15.
From the stratigraphic analysis and interpretation via Harris’ Matrix to the digital representation on orthophotos: matrix and orthophoto of the north front (A); matrix and orthophoto of the collapsed area (B).
Figure 15.
From the stratigraphic analysis and interpretation via Harris’ Matrix to the digital representation on orthophotos: matrix and orthophoto of the north front (A); matrix and orthophoto of the collapsed area (B).

Figure 16.
Comparisons on bichrome pointed arches related to doors and windows (ogival): (A) Verasis-Asinari Palace; (B) Roero Monteu Tower. From Google Street View.
Figure 16.
Comparisons on bichrome pointed arches related to doors and windows (ogival): (A) Verasis-Asinari Palace; (B) Roero Monteu Tower. From Google Street View.

Figure 17.
Tessarolo castle (AL). The architectural schema (circular tower, loggia, squared tower, and internal courtyard) is similar to the west side of the Frinco castle. From Conti F., 1980.
Figure 17.
Tessarolo castle (AL). The architectural schema (circular tower, loggia, squared tower, and internal courtyard) is similar to the west side of the Frinco castle. From Conti F., 1980.

Figure 18.
Summary of the detected chronological periods with characterizing elements and historical interpretations.
Figure 18.
Summary of the detected chronological periods with characterizing elements and historical interpretations.

Figure 19.
NURBS modelling of the castle: surfaces and geometries modelled on wired profiles generated from planar sections’ extraction.
Figure 19.
NURBS modelling of the castle: surfaces and geometries modelled on wired profiles generated from planar sections’ extraction.

Figure 20.
NURBS model of the castle related to the actual situation: the collapsed area on the south side.
Figure 20.
NURBS model of the castle related to the actual situation: the collapsed area on the south side.

Figure 21.
Standard deviation analysis between point clouds and NURBS concerning the circular tower of the castle: (A) NURBS simplified model; (B) point clouds; (C) scalar fields.
Figure 21.
Standard deviation analysis between point clouds and NURBS concerning the circular tower of the castle: (A) NURBS simplified model; (B) point clouds; (C) scalar fields.

Figure 22.
Textures and orthophotos mapped on the NURBS model of the castle related to the actual situation: the collapsed area on the south side.
Figure 22.
Textures and orthophotos mapped on the NURBS model of the castle related to the actual situation: the collapsed area on the south side.

Figure 23.
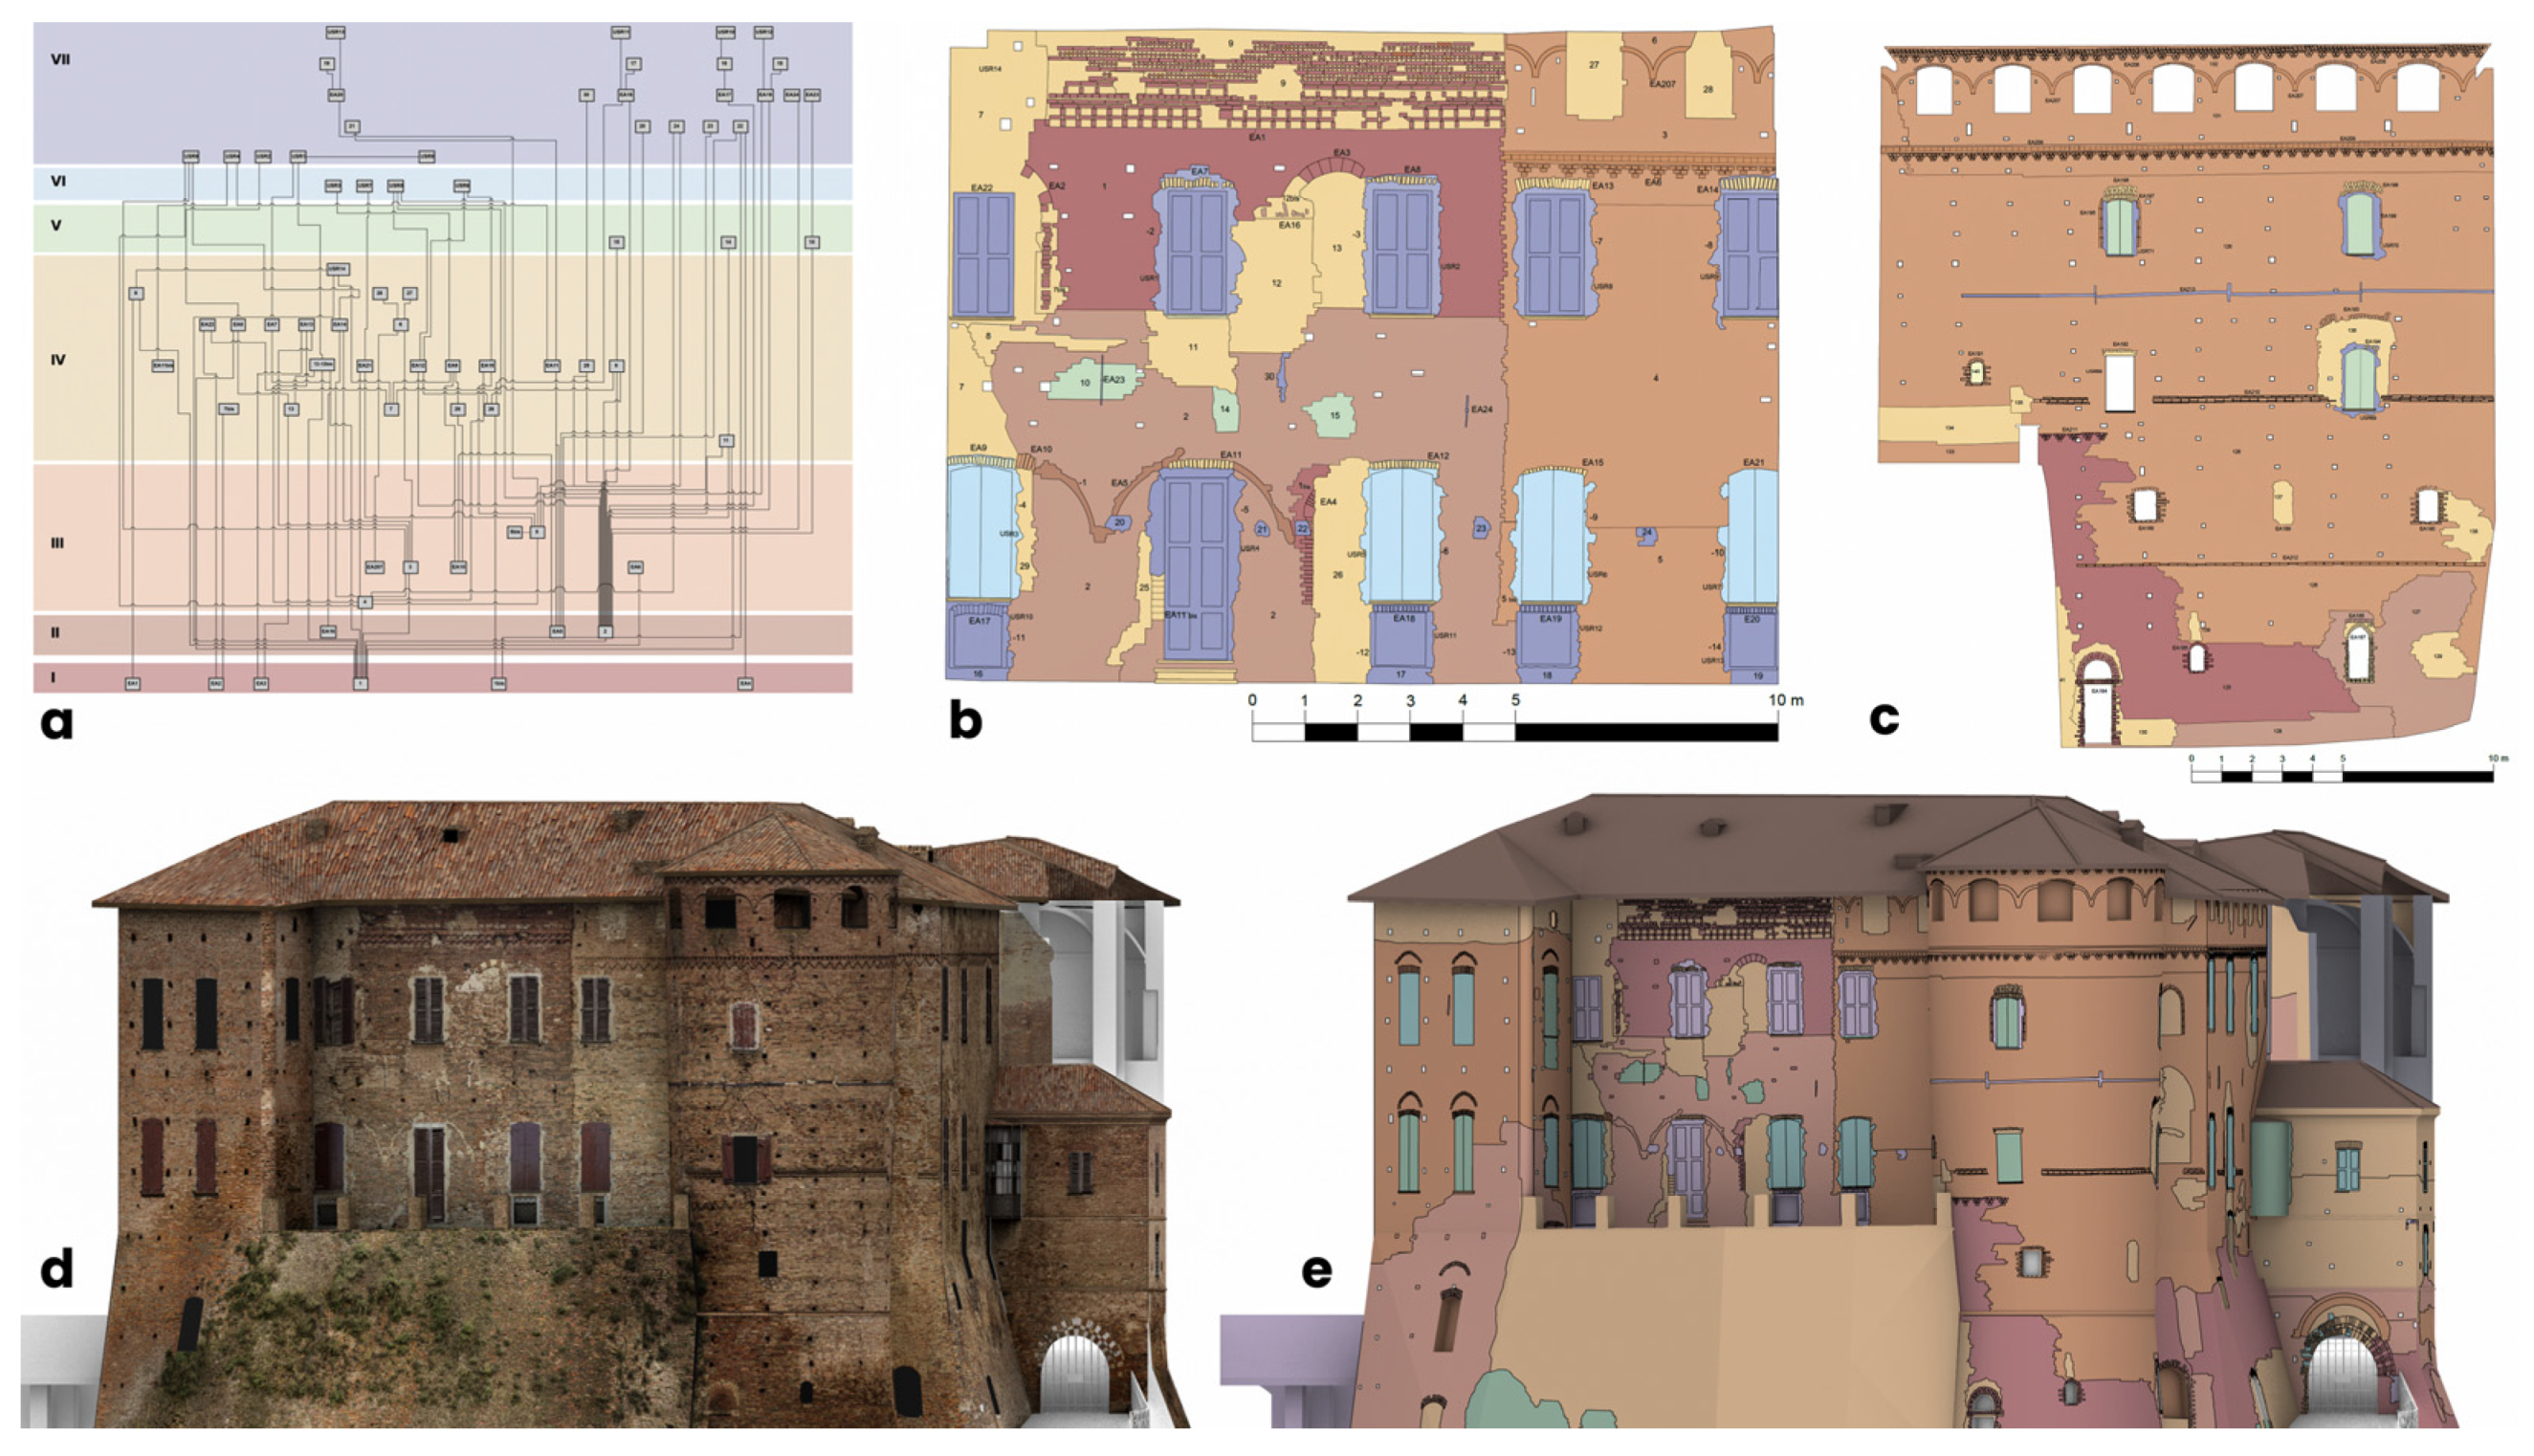
From the stratigraphic analysis to the immersive 3D model. Section of the west side: matrix and period of the central part of the west front (a,b); understanding of the cylindric tower (cylindric unwrap) (c); NURBS model with textures and understanding (d,e).
Figure 23.
From the stratigraphic analysis to the immersive 3D model. Section of the west side: matrix and period of the central part of the west front (a,b); understanding of the cylindric tower (cylindric unwrap) (c); NURBS model with textures and understanding (d,e).

Figure 24.
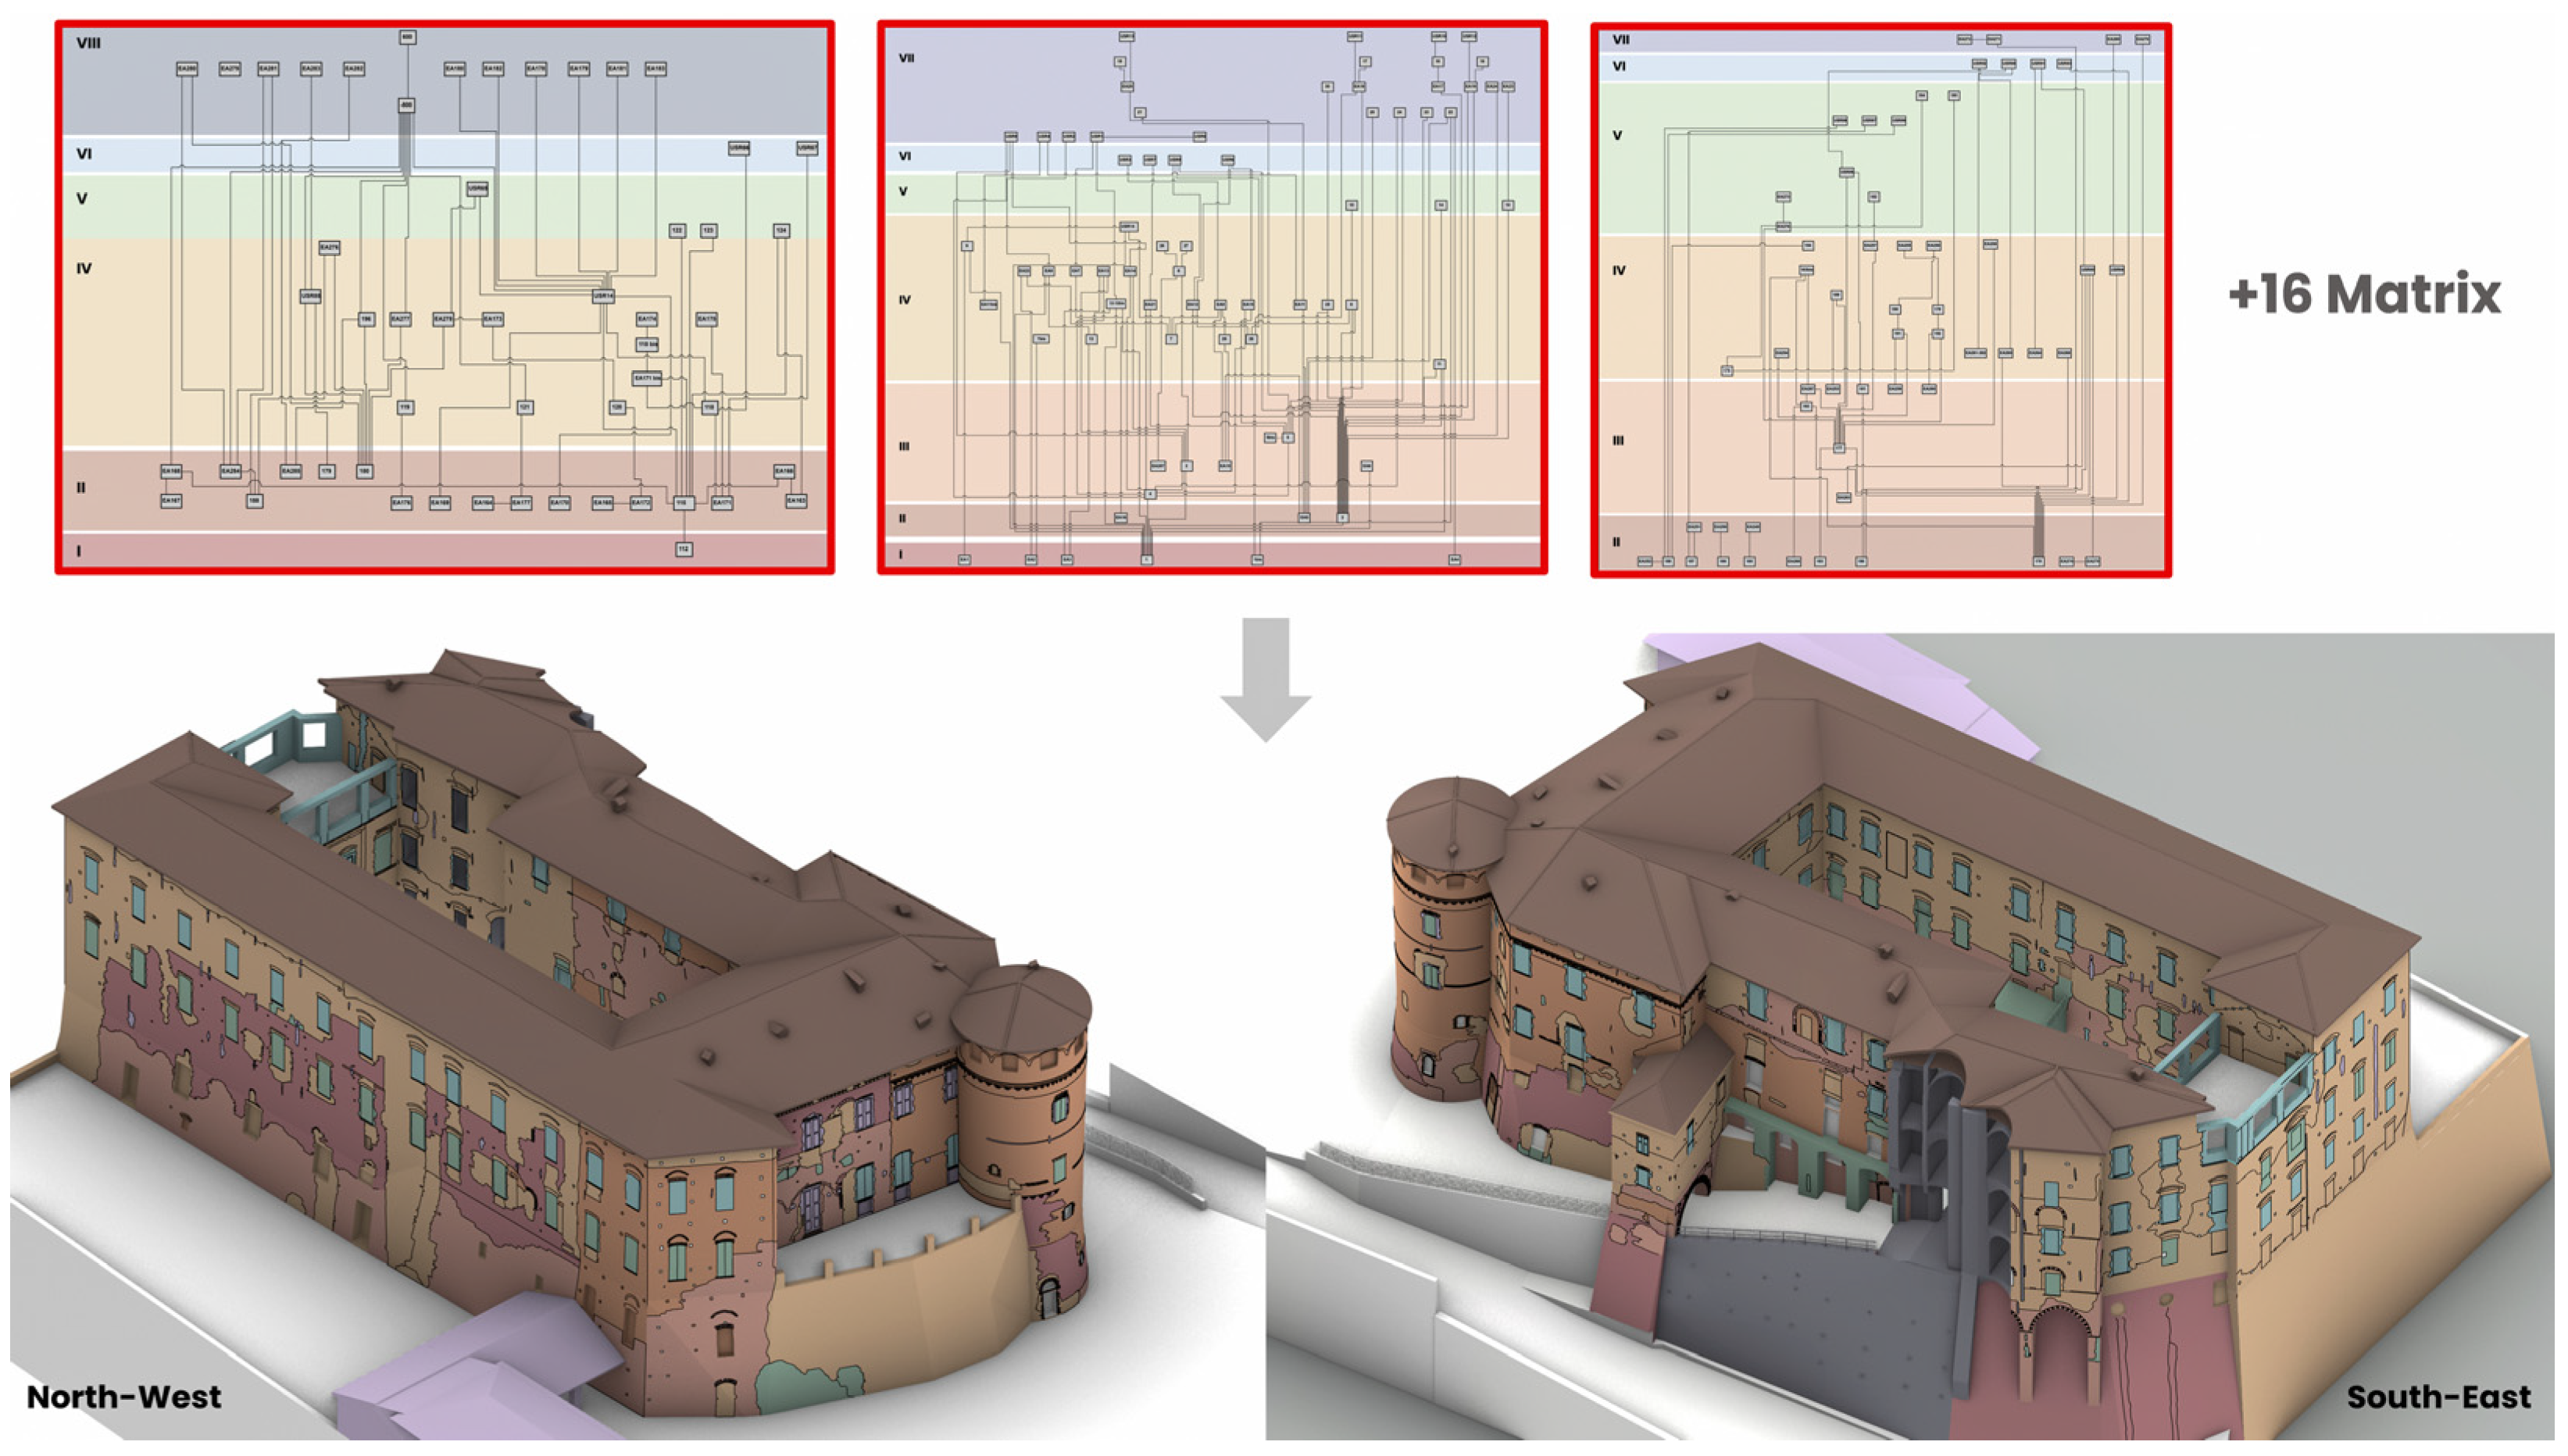
3D NURBS model of the Frinco Castle coloured depending on historical interpretation carried out via stratigraphic diagrams. Details of the northwest and southeast of the castle.
Figure 24.
3D NURBS model of the Frinco Castle coloured depending on historical interpretation carried out via stratigraphic diagrams. Details of the northwest and southeast of the castle.

Figure 25.
Three-dimensional NURBS model of the Frinco Castle with the stratigraphic analysis and interpretation: the legend shows the period sequences.
Figure 25.
Three-dimensional NURBS model of the Frinco Castle with the stratigraphic analysis and interpretation: the legend shows the period sequences.

Figure 26.
The 3D-rendered model proposed for reconstructing the collapsed area: modelled with Rhinoceros and V-Ray. South front of the castle.
Figure 26.
The 3D-rendered model proposed for reconstructing the collapsed area: modelled with Rhinoceros and V-Ray. South front of the castle.

Figure 27.
The 3D-rendered model proposed for reconstructing the collapsed area: modelled with Rhinoceros and V-Ray. Isometric view of the south front of the castle.
Figure 27.
The 3D-rendered model proposed for reconstructing the collapsed area: modelled with Rhinoceros and V-Ray. Isometric view of the south front of the castle.

Figure 28.
The Frinco Castle project: from the integrated survey to the NURBS modelling and metric analysis and from the stratigraphic analysis and the historical interpretation to the collapsed area reconstruction.
Figure 28.
The Frinco Castle project: from the integrated survey to the NURBS modelling and metric analysis and from the stratigraphic analysis and the historical interpretation to the collapsed area reconstruction.

Disclaimer/Publisher’s Note: The statements, opinions and data contained in all publications are solely those of the individual author(s) and contributor(s) and not of MDPI and/or the editor(s). MDPI and/or the editor(s) disclaim responsibility for any injury to people or property resulting from any ideas, methods, instructions or products referred to in the content. |
© 2023 by the authors. Licensee MDPI, Basel, Switzerland. This article is an open access article distributed under the terms and conditions of the Creative Commons Attribution (CC BY) license (https://creativecommons.org/licenses/by/4.0/).
Share and Cite
MDPI and ACS Style
Diara, F.; Roggero, M. The Frinco Castle: From an Integrated Survey to 3D Modelling and a Stratigraphic Analysis for Helping Knowledge and Reconstruction. Remote Sens. 2023, 15, 4874. https://doi.org/10.3390/rs15194874
AMA Style
Diara F, Roggero M. The Frinco Castle: From an Integrated Survey to 3D Modelling and a Stratigraphic Analysis for Helping Knowledge and Reconstruction. Remote Sensing. 2023; 15(19):4874. https://doi.org/10.3390/rs15194874
Chicago/Turabian StyleDiara, Filippo, and Marco Roggero. 2023. "The Frinco Castle: From an Integrated Survey to 3D Modelling and a Stratigraphic Analysis for Helping Knowledge and Reconstruction" Remote Sensing 15, no. 19: 4874. https://doi.org/10.3390/rs15194874
Note that from the first issue of 2016, this journal uses article numbers instead of page numbers. See further details here.