
A Method for Spatiotemporally Merging Multi-Source Precipitation Based on Deep Learning
by
 , ,
, ,
Wei Fang
1,2,
Hui Qin
1,2,*,
Guanjun Liu
1,2,
Xin Yang
1,2,
Zhanxing Xu
1,2,3,
Benjun Jia
4 and
Qianyi Zhang
1,2 1
School of Civil and Hydraulic Engineering, Huazhong University of Science and Technology, Wuhan 430074, China
2
Hubei Provincial Key Laboratory of Digital Watershed Science and Technology, Huazhong University of Science and Technology, Wuhan 430074, China
3
Power China Huadong Engineering Corporation Limited, Hangzhou 311122, China
4
Hubei Key Laboratory of Intelligent Yangtze and Hydroelectric Science, China Yangtze Power Co., Ltd., Yichang 443000, China
*
Author to whom correspondence should be addressed.
Remote Sens. 2023, 15(17), 4160; https://doi.org/10.3390/rs15174160
Submission received: 2 July 2023
/
Revised: 16 August 2023
/
Accepted: 22 August 2023
/
Published: 24 August 2023
Abstract
:Reliable precipitation data are essential for studying water cycle patterns and climate change. However, there are always temporal or spatial errors in precipitation data from various sources. Most precipitation fusion methods are influenced by high-dimensional input features and do not make good use of the spatial correlation between precipitation and environmental variables. Thus, this study proposed a novel multi-source precipitation spatiotemporal fusion method for improving the spatiotemporal accuracy of precipitation. Specifically, the attention mechanism was used to first select critical input information to dimensionalize the inputs, and the Convolutional long-short-term memory network (ConvLSTM) was used to merge precipitation products and environmental variables spatiotemporally. The Yalong River in the southeastern part of the Tibetan Plateau was used as the case study area. The results show that: (1) Compared with the original precipitation products (IMERG, ERA5 and CHIRPS), the proposed method has optimal accuracy and good robustness, and its correlation coefficient (CC) reaches 0.853, its root mean square coefficient (RMSE) decreases to 3.53 mm/d and its mean absolute error (MAE) decreases to 1.33 mm/d. (2) The proposed method can reduce errors under different precipitation intensities and greatly improve the detection capability for strong precipitation. (3) The merged precipitation generated by the proposed method can be used to describe the rainfall–runoff relationship and has good applicability. The proposed method may greatly improve the spatiotemporal accuracy of precipitation in complex terrain areas, which is important for scientific management and the allocation of water resources.
1. Introduction
Precipitation is the key climatic factor for describing the hydrological cycle system in a region [1,2]. High-precision precipitation estimates can effectively reflect the surface environmental conditions and the spatiotemporal distribution of a water cycle, which is helpful to provide the scientific basis for decision making for water resource management [3]. Furthermore, precipitation is also an important indicator of climate change [1,4]. In recent years, drought and flood disasters caused by too much or too little precipitation have occurred frequently because of global warming [5,6]. For example, in the Yangtze River Basin, severe floods displaced millions of residents due to extreme precipitation events in 2020 [7,8], while extreme drought caused difficulties in water supply and power consumption for millions of people due to the persistent lack of precipitation in the summer of 2022 [9]. These natural disasters caused by precipitation have seriously threatened the safety of human life and property and sustainable economic development. Therefore, high-precision precipitation with high spatiotemporal resolution is very important for the study of water cycles, the reduction of drought and flood disasters and the sustainable development of the economy, etc.
At present, the sources of precipitation data are mainly ground observation data, radar monitoring data, satellite retrieval data and reanalysis products [3,10]. Ground observation precipitation is directly measured by the rain gauge, so its accuracy is generally considered to be the highest [11,12]. Because they are affected by topographic conditions and economic development, the number and density of ground monitoring stations are different in different places [13,14]. As for China, the east has a much higher density of ground monitoring stations than the west, and plain areas have a much higher density than mountain and plateau areas [12]. Thus, although ground observation precipitation has high accuracy, it cannot reflect the spatial characteristics of precipitation well, especially in high-altitude areas such as the Tibetan Plateau. Radar monitoring of precipitation, which is estimated from radar echo intensity, has good accuracy and can capture the spatial distribution information of precipitation over a large range [15,16]. However, radar precipitation still has a larger error than ground observation precipitation because radar monitoring is easily affected by various factors such as the terrain and climate [15,17]. Moreover, the construction cost of radar monitoring networks is high [3,15]. Thus, radar precipitation can only be used in a limited range and cannot meet the application requirements of complex terrain, such as the source region of the Yangtze River. Compared to the former two, precipitation products based on satellite and reanalysis are widely used in hydrological research because of their high spatiotemporal resolution [16,17,18]. For example, the Integrated Multi-satellite Retrievals for GPM (IMERG) can provide precipitation with a 0.1° spatial and 30-min temporal resolution, and Climate Hazards Group InfraRed Precipitation with Station Data (CHIRPS) can provide precipitation with a spatial resolution of 0.05° [18,19,20]. Although the satellite retrieval of precipitation is not constrained by geographical conditions, it still has large errors due to the influence of retrieval algorithms and sensors [19,21]. To improve the accuracy of observations, reanalysis products combining numerical model data with various observations are produced by quality control and data assimilation algorithms [4,21,22,23]. They have been used as approximations of observations because of the advantages of high spatiotemporal resolution and long time series [21]. One of the well-known reanalysis products, ERA5, has provided 0.1° hourly precipitation data since 1950 [24,25]. However, because they are affected by numerical models and assimilation algorithms, reanalysis products inevitably contain systematic and random errors which call for further improvement [18,23]. Therefore, constrained by geographical environments, precipitation measurement’s high cost, numerical models and algorithms, multi-source precipitation cannot be directly applicable to hydrological research in a certain basin.
Now, it has become a mainstream way to study multi-source precipitation fusion methods for improving precipitation accuracy [26,27,28,29]. The basic idea is that using ground observation precipitation as the benchmark, high-precision precipitation datasets with long sequences are obtained by merging radar precipitation, satellite precipitation, reanalysis products and other auxiliary variables with ground observation precipitation, based on fusion models [3,17]. Traditional mathematical regression models (such as mean bias correction, geographically weighted regression, optimum interpolation and so on) were used for global or local correction of multi-source precipitation early on [30,31,32,33]. For example, Chao et al. [32] used the geographically weighted regression model to merge ground observation precipitation and CMORPH precipitation data, improving the accuracy and applicability of CMORPH. Shen et al. [17] proposed a new fusion model based on local gauge correction and optimal interpolation to produce China’s 1-km gauge–radar–satellite-merged precipitation dataset. However, traditional mathematical regression models rely too much on strong assumptions to adequately capture the non-linear relationship between ground observation precipitation and other precipitation products [12,34]. Instead, machine learning models have been introduced for multi-source precipitation fusion methods due to their strong nonlinear learning ability, including neural networks, support vector machine and tree models [35,36,37]. For example, Zhang et al. [36] proposed a novel double machine learning approach that could better capture the temporal dynamics of precipitation, realizing the fusion of multiple satellite precipitation products and gauge observations. Zhang et al. [38] used the eXtreme Gradient Boosting model and the Kriging interpolation model to merge ground observation precipitation and radar precipitation, respectively, and indicated that the eXtreme Gradient Boosting model had a better effect.
In addition, it is of great significance for improving precipitation accuracy to consider the impact of environmental variables on precipitation. Many studies have shown that precipitation change is closely related to surface temperature and wind speed [39,40,41]. Fang et al. pointed out that topographic factors (such as slope, aspect and terrain roughness) have important effects on precipitation [42]. Jia et al. developed the multi-source precipitation fusion study in Qaidam Basin and indicated that the addition of a normalized difference vegetation index (NDVI), elevation and aspect could promote the improvement of precipitation accuracy [43]. Therefore, various environmental variables have been added as fusion models’ driving inputs. For example, Hong et al. [44] added elevation, surface pressure and wind speed to the input factors to merge gauge, satellite and reanalysis data based on artificial neural networks and developed a daily precipitation dataset with a spatial resolution of 0.1° in the Tibetan Plateau. Jing et al. [45] introduced surface temperature as one of the Random Forest inputs to downscale the yearly TRMM 3B43 V7 precipitation data and improve the temporal and spatial accuracy of precipitation. Furthermore, other environmental variables, including longitude, latitude and slope, can also contribute to the improvement of precipitation accuracy [46,47].
Although great progress has been made in the study of multi-source precipitation fusion in recent decades, most fusion models based on traditional mathematical regression models or general machine learning models only focus on one aspect of the temporal–spatial correlation between ground observation precipitation and other precipitation products rather than both concurrently [12]. For example, the spatial interpolation method can only reflect spatial correlation, while the support vector machine can only reflect temporal correlation. With the development of computer technology, deep learning methods, which have greater advantages in processing massive and spatiotemporal information, have been widely used in image recognition and video processing as well as streamflow and precipitation forecasting [48,49,50,51]. For example, Shi et al. [50] used convolutional long-short-term memory network (ConvLSTM) for precipitation forecasting and indicated that ConvLSTM could reflect spatiotemporal correlations well. Liu et al. [52] proposed a directed graph deep neural network that could effectively capture the spatiotemporal information of precipitation and streamflow and achieved good results in streamflow forecasting. It can be seen that the emergence of deep learning models can provide the possibility to handle the temporal–spatial nonlinear relationship between ground-observed precipitation and other precipitation products better. However, to the best of our knowledge, spatiotemporal deep learning methods have been less applied in the study of multi-source precipitation fusion. In addition, most studies were developed in areas with dense precipitation stations and seldom evaluated the practicability of the results from the perspective of the rainfall–runoff relationship well [1,10,12,26].
In this study, we aim to propose a multi-source precipitation fusion model based on deep learning to improve the spatiotemporal accuracy of precipitation estimates in the Yalong River. The purposes of this study are as follows: (1) to propose a multi-source precipitation spatiotemporal fusion model by coupling the attention mechanism and ConvLSTM; (2) to verify the effectiveness of the proposed model through comparing other models and evaluating its performance under different precipitation intensities; (3) to produce a multi-source merged precipitation dataset and evaluate its availability using hydrological models. The remainder of this study is organized as follows: The details of the study area and data and methods are given in Section 2. The experimental results and discussion are presented in Section 3. Finally, conclusions are drawn in Section 4.
2. Data and Methodology
2.1. Study Area and Data
2.1.1. Study Area
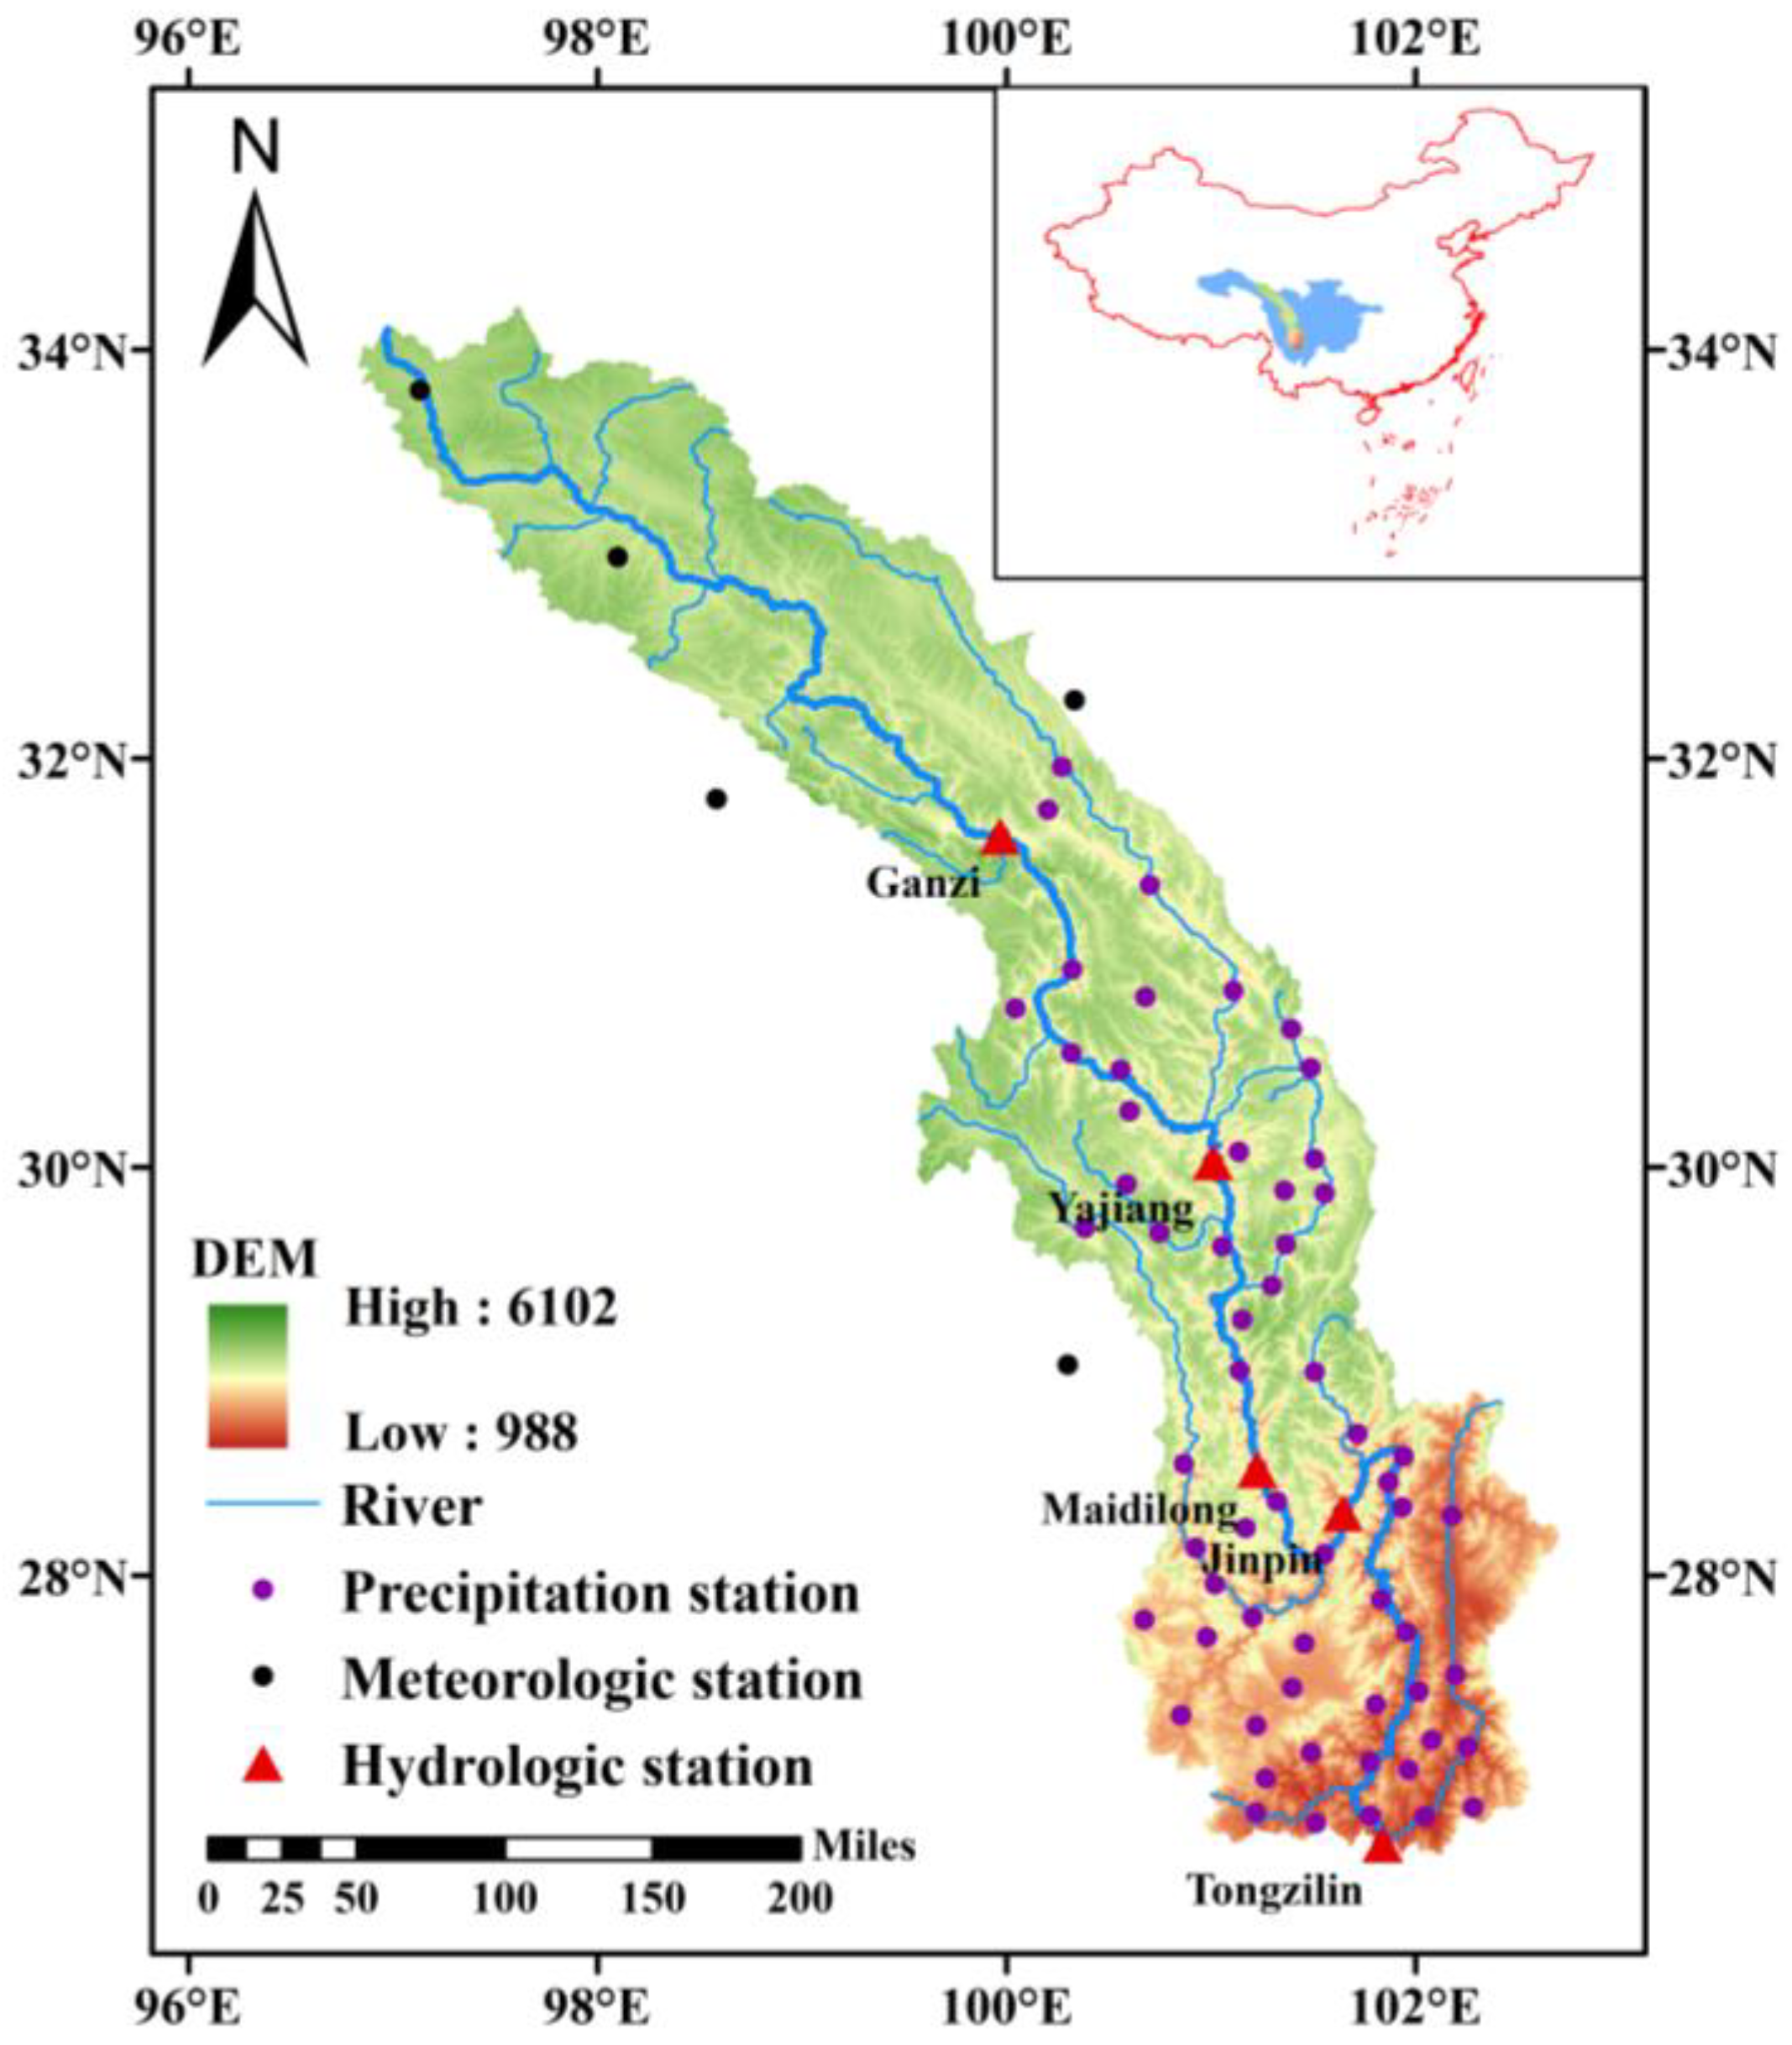
In this study, the Yalong River was used as the research area to verify the effectiveness and applicability of the proposed method. Located in the southern part of the Tibetan Plateau, the Yalong River (Figure 1) is the largest tributary of the Jinsha River in the upper reaches of the Yangtze River, which is also a typical high mountain and canyon river. It has abundant hydropower resources, with a total length of 1571 km and a drainage area of about 136,000 km2. There are five important hydrological stations from upstream to downstream in the basin, namely Ganzi, Yajiang, Maidilong, Jinping and Tongzilin. The altitude of the Yalong River is mostly over 1500 m, and the terrain is higher in the northwest and lower in the southeast, with a huge natural precipitation [53,54]. Affected by topographic conditions and monsoon climate, the precipitation is unevenly distributed in time and space. In terms of space, the annual average precipitation increases from northwest to southeast and varies greatly from upstream to downstream; it is 600–800 mm upstream, 1000–1400 mm in the middle and 900–1300 mm downstream [55]. In terms of time, precipitation is mainly concentrated from June to September, and heavy precipitation is prone to occur in July and August [1,56]. However, it can be seen from Figure 1 that the precipitation stations in the Yalong River are relatively scarce and mainly concentrated in low-altitude areas due to the constraints of terrain conditions and the economic level. Therefore, to improve the spatiotemporal accuracy of precipitation in the Yalong River, it is of great significance to develop this multi-source precipitation fusion study.
2.1.2. Data
Based on previous studies [1,2], ground observation precipitation, satellite precipitation data, reanalysis precipitation data, normalized difference vegetation index (NDVI), digital elevation model (DEM) and streamflow series of 5 hydrological stations from 2011 to 2020 were selected in this study. The basic information on the data used is listed in Table 1.
(1) Ground observation precipitation
In this study, ground observation precipitation was obtained from the real-time monitoring data of 67 precipitation stations and 5 meteorological stations. Precipitation stations were set up by the Yalong River Hydropower Development Co., Ltd. to monitor the precipitation information, whose average control area was 1500 km2. However, their distribution was uneven due to the influence of terrain conditions, and there were few stations above the Ganzi hydrological station (Figure 1).
To fully verify the applicability of the proposed model, meteorological stations were added to provide upstream precipitation information and were from the Chinese Surface Climate Data Daily Value dataset (V3.0) provided by the China Meteorological Data Service Center. This dataset’s accuracy and completeness were improved after quality control and provided reliable long-sequence daily precipitation data. In this study, to avoid duplication in the location of precipitation stations, daily precipitation data on 5 meteorological stations around the Yalong River (Figure 1) between 2011 and 2020 were selected.
(2) IMERG
As a typical representative product of the Global Precipitation Measurement Mission (GPM), the Integrated Multi-satellite Retrievals for GPM (IMERG) can provide precipitation data with a maximum temporal resolution of 0.5 h and a spatial resolution of 0.1°. According to the calibration times of precipitation data, IMERG can be subdivided into “early run”, “late run” and “final run”. Among them, the IMERG final run is currently the most applicable because it is bias-corrected based on ground observation precipitation [57,58,59,60]. Recently, it has been updated to Version 06. Therefore, the GPM IMERG Final Precipitation V06 product, containing level 3 data between 2011 and 2020, was selected in this study.
(3) CHIRPS
Climate Hazards Group InfraRed Precipitation With Station Data (CHIRPS) is a precipitation product jointly created by the United States Geological Survey and the University of California for trend analysis and seasonal drought monitoring [61]. It has provided precipitation data with a spatial resolution of 0.05° since 1981, and its latest version is V2.0 [62]. In this study, we selected CHIRPS-2.0 daily data with a spatial resolution of 0.05° between 2011 and 2020.
(4) ERA5
ERA5 is the fifth generation of atmospheric reanalysis global climate data produced by the European Centre for Medium-Range Weather Forecasts (ECMWF). It was generated by merging multiple sources of observation data, based on the four-dimensional assimilation system and advanced parameterization schemes. Therefore, it has a very high spatiotemporal resolution and can provide hourly estimates of hydrometeorological variables such as temperature, wind, precipitation and so on. In this study, ERA5-Land hourly precipitation data with a spatial resolution of 0.1° between 2011 and 2020 were used. In addition, temperature and wind data from ERA5-Land were also selected as auxiliary variables of the fusion model.
(5) Other data
Normalized difference vegetation index (NDVI), which is an important indicator for the macroscopic monitoring of vegetation, can reflect vegetation coverage and vegetation growth. In general, NDVI has a positive correlation with precipitation [43,63]. In this study, we used MODIS 16-day NDVI data with a spatial resolution of 0.05° between 2011 and 2020.
The digital elevation model (DEM) is used to digitally express the shape of the terrain surface, which can reflect information on a region’s topographic factors such as slope, aspect and elevation. In this study, the DEM data, with a spatial resolution of 90 m, were obtained from the Shuttle Radar Topography Mission system.
In addition, the daily streamflow series of hydrological stations including Ganzi, Yajiang, Maidilong, Jinping and Tongzilin (2011–2020) were used to explore the hydrological effects of the multi-source merged precipitation dataset in this study. They came from the monitoring data of hydrological stations built by the Yalong River Hydropower Development Co., Ltd. Interventionary studies involving animals or humans and other studies that require ethical approval must list the authority that provided approval and the corresponding ethical approval code.
2.2. Methods
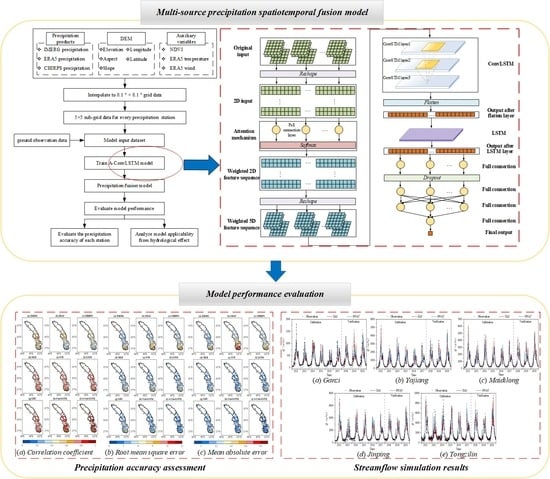
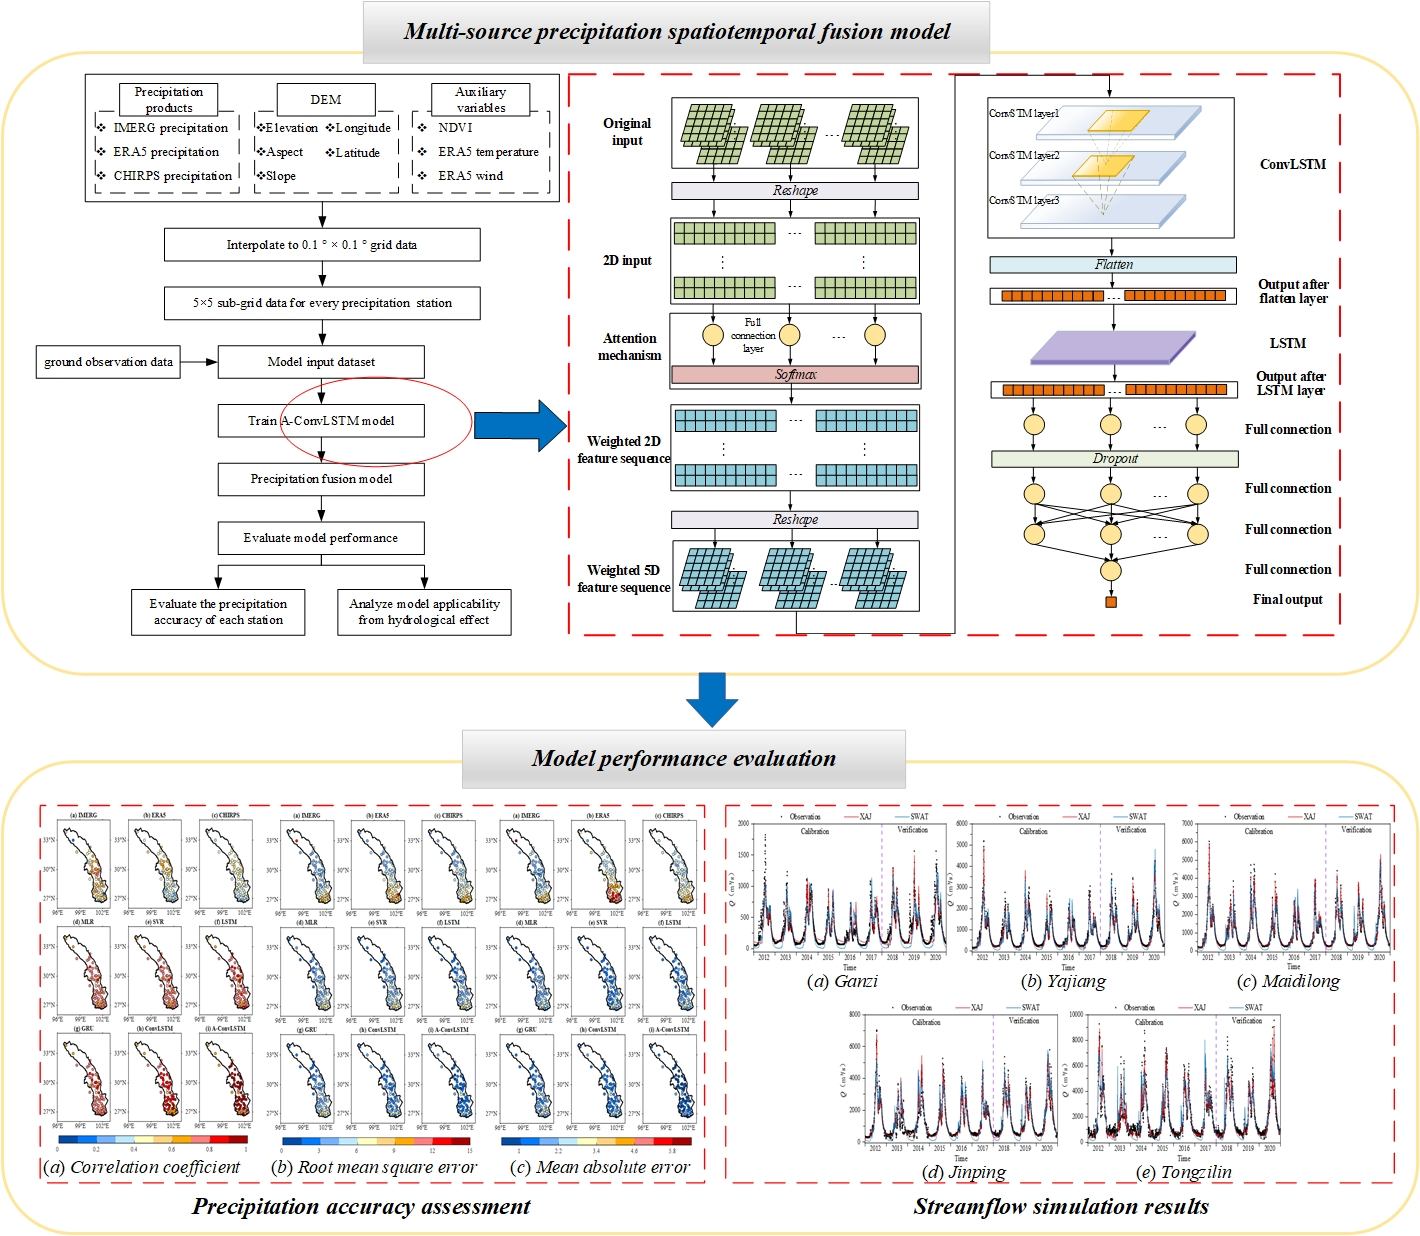
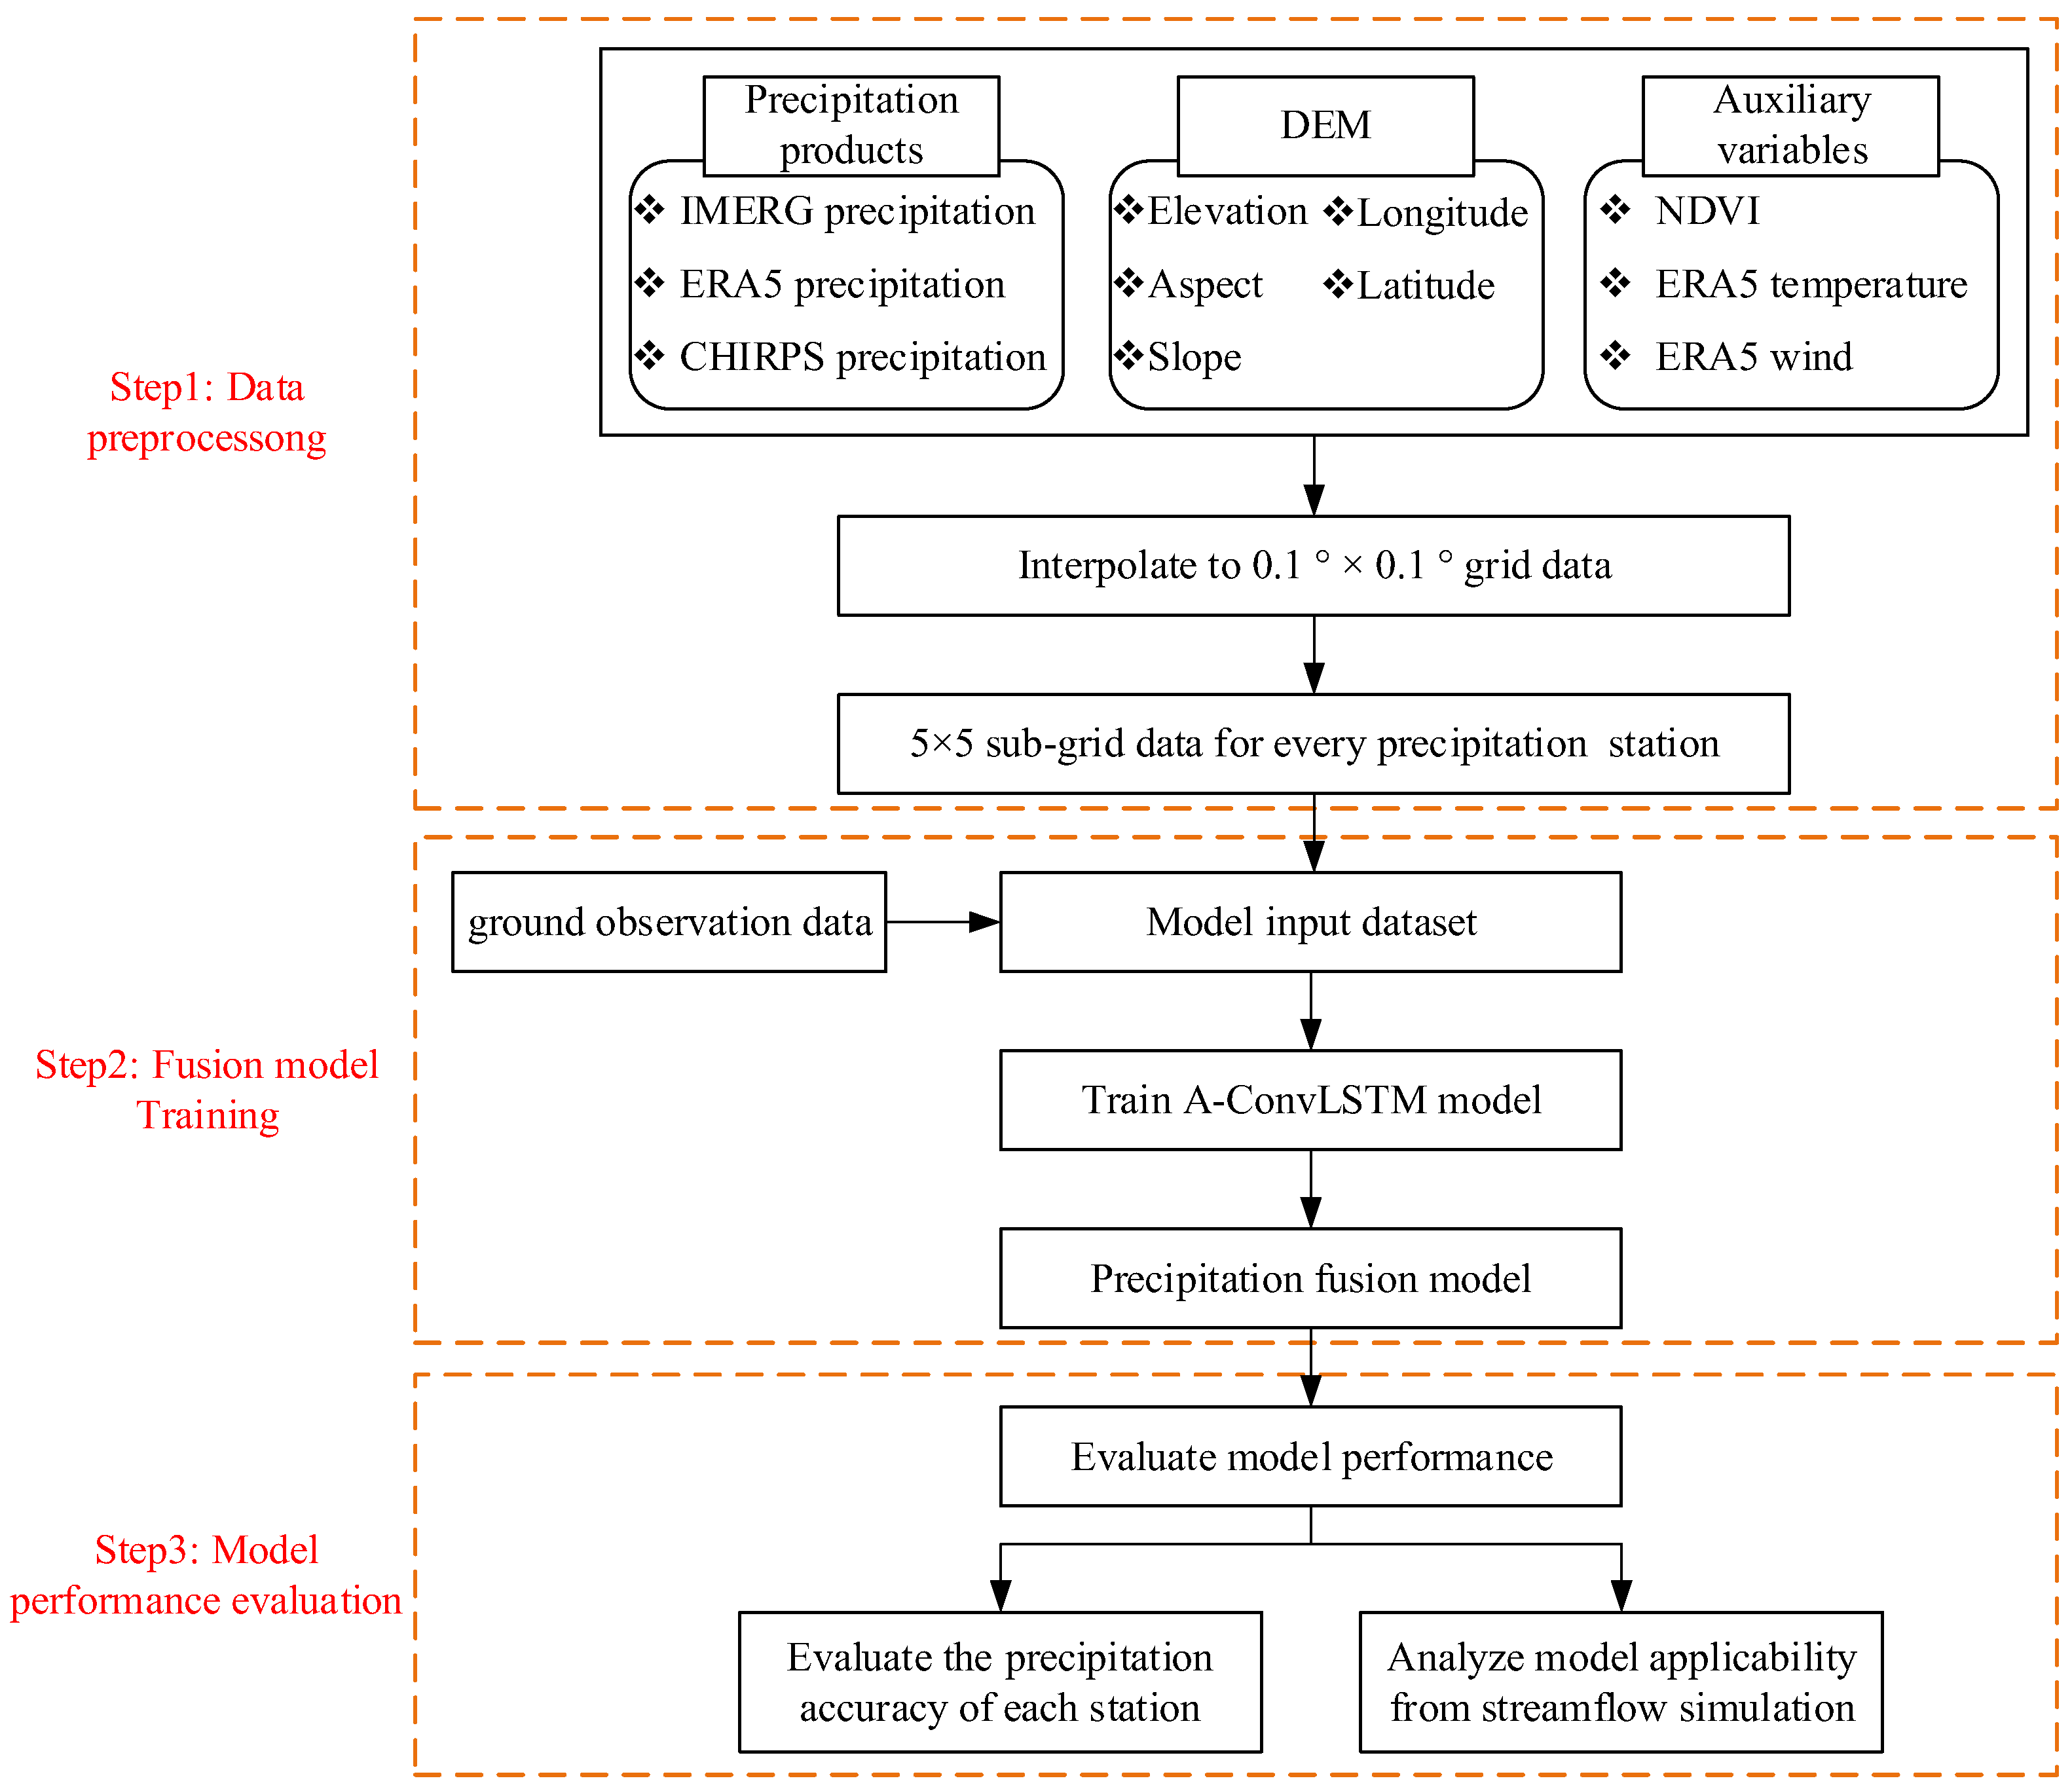
In this study, the framework of the proposed multi-source precipitation spatiotemporal fusion method based on the attention mechanism and Convolutional LSTM Network (ConvLSTM), is shown in Figure 2. The steps of this method are as follows.
(1) Data preprocessing: precipitation products, DEM and other auxiliary variables were collected and organized, which were unified into a daily scale in time and interpolated to 0.01° in space.
(2) Model building and training: The multi-source precipitation spatiotemporal fusion model was established by coupling the attention mechanism and ConvLSTM. The input dataset was constructed to train the fusion model by extracting the information on precipitation products, DEM and other auxiliary variables of the sub-grid around each precipitation station or meteorologic station.
(3) Model performance evaluation: According to the precipitation simulation results of each station, the accuracy of the fusion model was evaluated using evaluation indices. In addition, the multi-source fusion precipitation dataset of the entire study area, which was generated by the trained fusion model, was used to drive hydrological models to evaluate the practicability of the fusion model to the streamflow simulation results.
2.2.1. Data Preprocessing
There are missing and abnormal values in the ground precipitation data, precipitation product data, temperature data, wind data and NDVI data. Therefore, the missing values need to be processed to maintain data integrity. In this study, the missing and abnormal values of precipitation data were filled with zero, and other data were processed through linear interpolation.
Since the time scale of each data is different, it is necessary to unify the time scale. In this study, the time scale was unified into a daily scale according to the ground precipitation data. Therefore, the ERA5 daily precipitation data were obtained by accumulating, the ERA5 daily temperature and wind data were obtained by averaging, and the daily NDVI data were obtained through the strategy in which the daily values were set as equal to the 16-day values.
Since precipitation changes are related to terrain factors, factors such as elevation, slope and aspect need to be extracted from the DEM data, which were used as the input of the fusion model. In this study, the longitude, latitude, elevation, slope and aspect data of each sub-grid point were extracted from the DEM with the help of ArcGIS 10.2.
Since the spatial resolution of each data is initially different, the spatial resolution needs to be made consistent. In this study, the spatial resolution of the grid data was processed to 0.1° by the inverse distance weighting method.
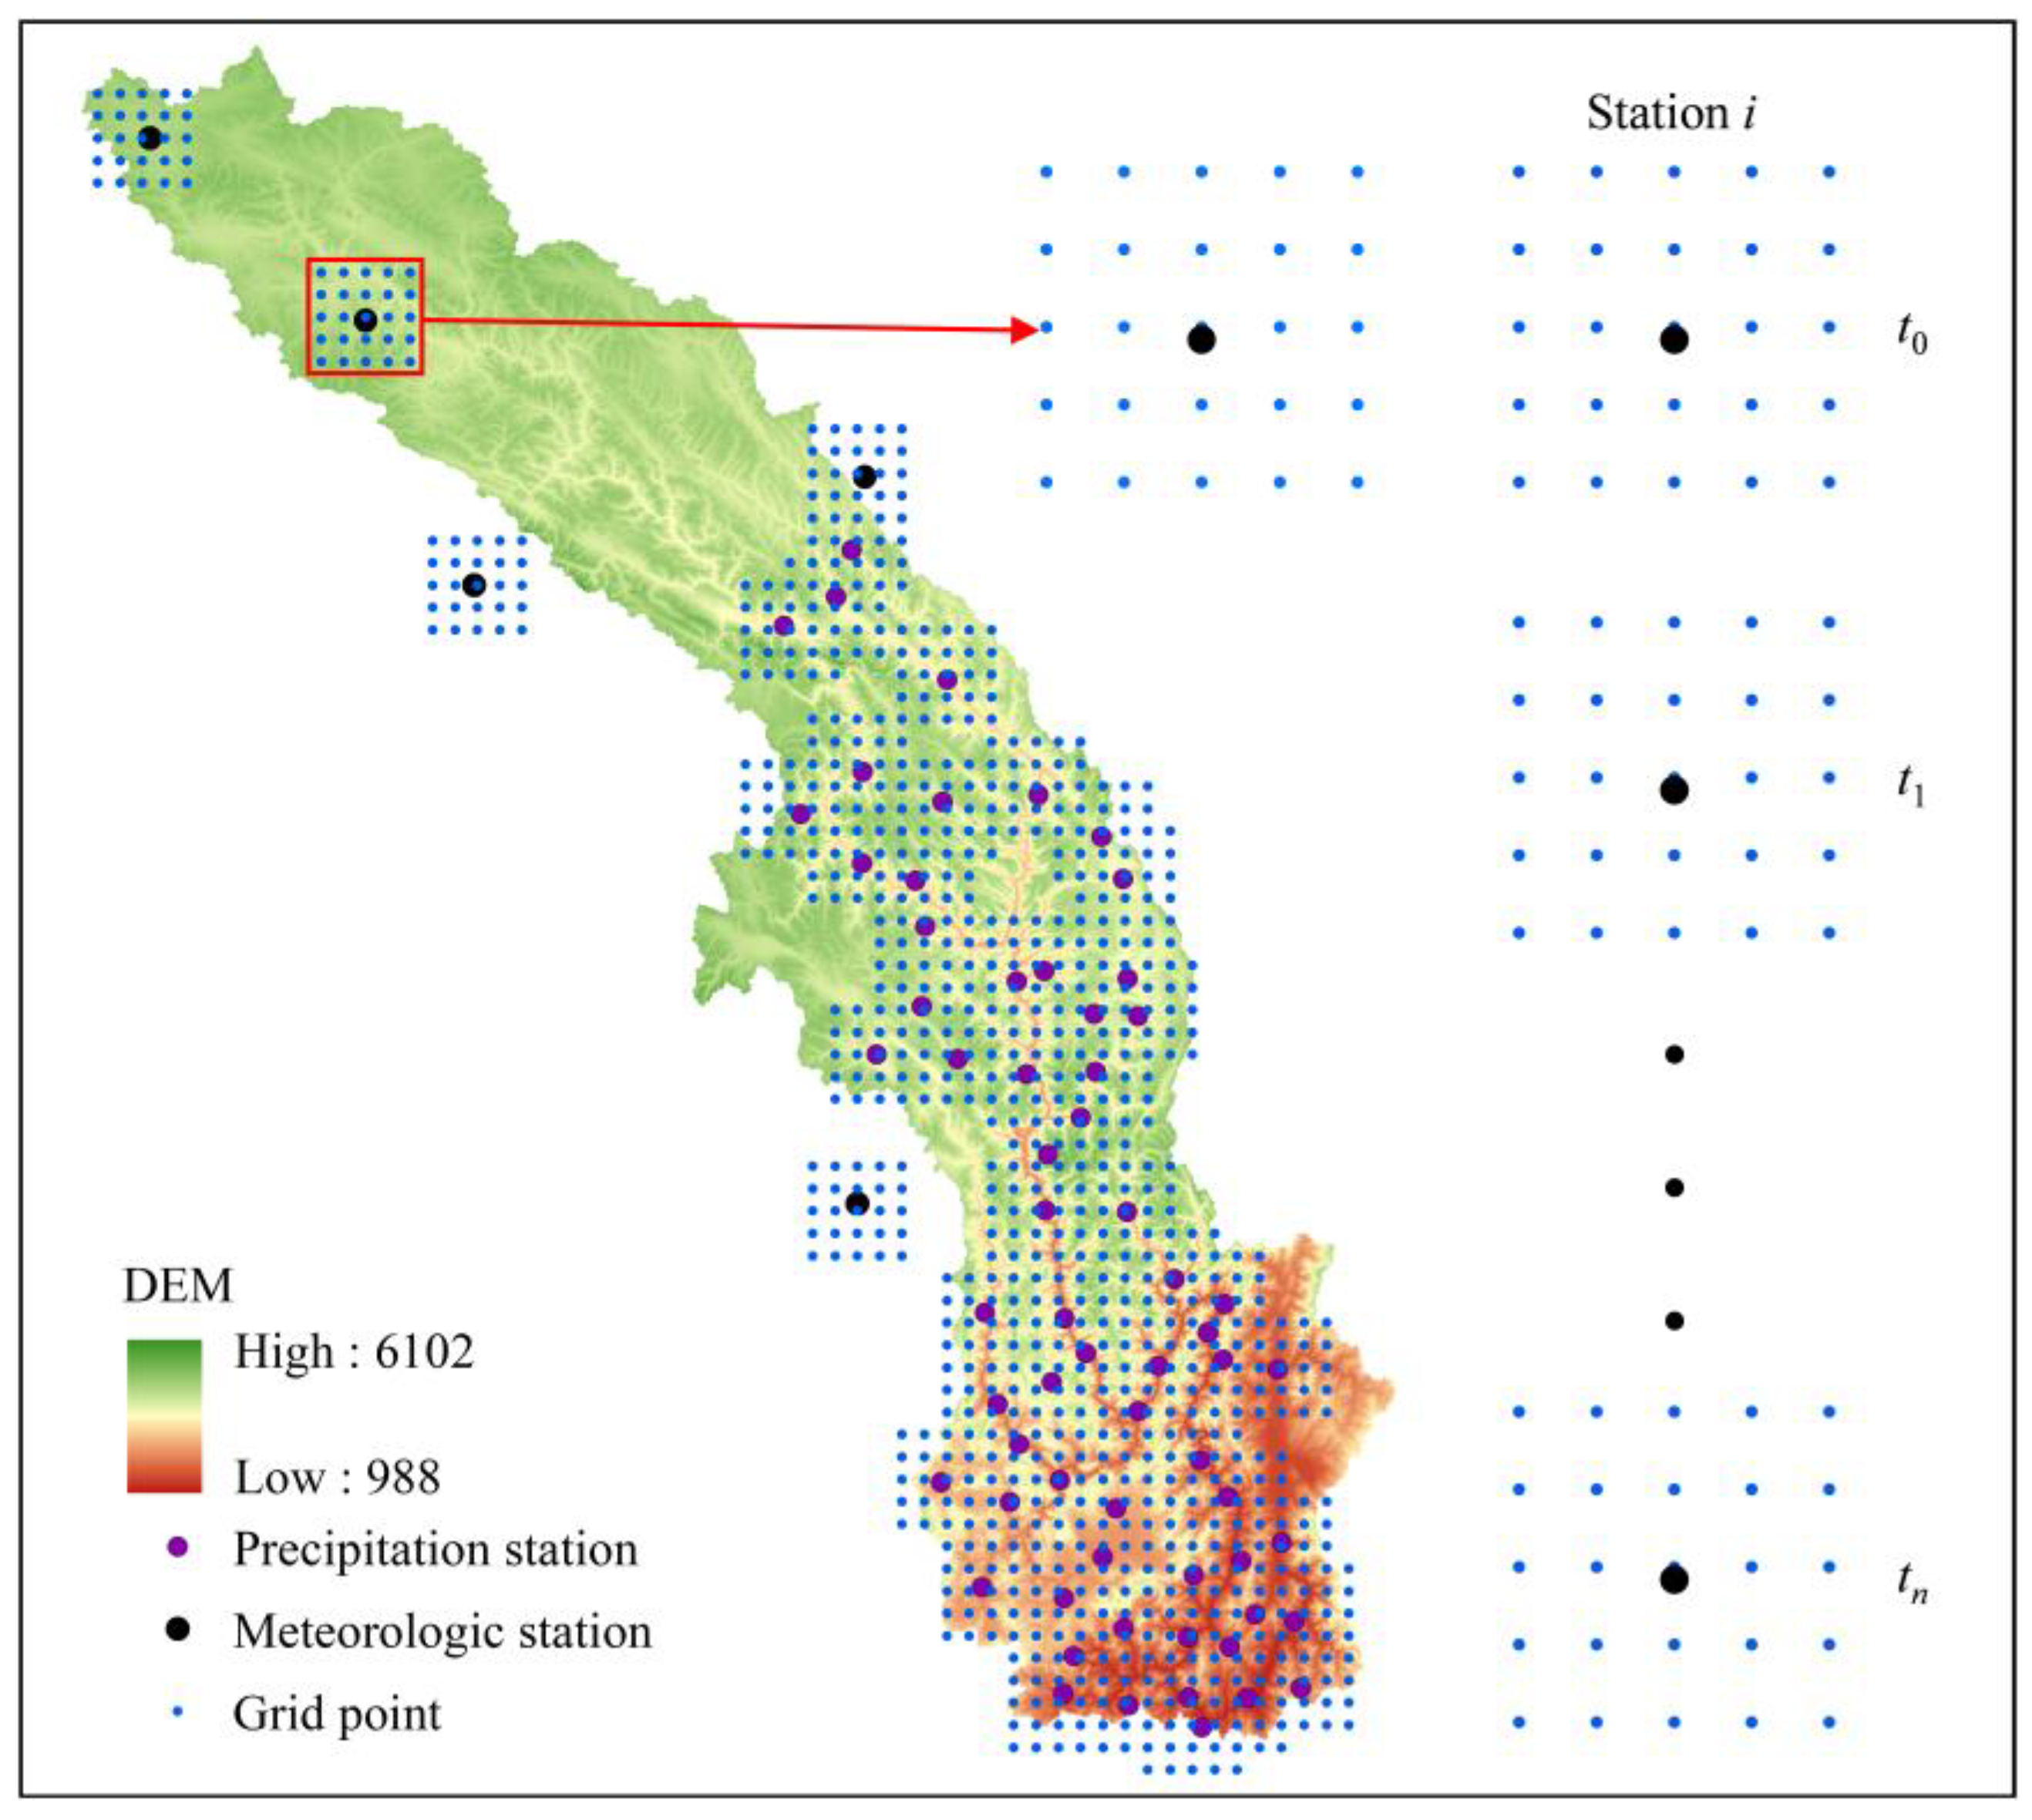
By considering the variables related to precipitation in time and space, the input dataset of the fusion model was constructed. First, n × n sub-grids were extracted by taking each precipitation station or meteorologic station as the center. Second, the data of precipitation products, ERA5 temperature, ERA5 wind and NDVI were extracted corresponding to each simulation period in each sub-grid. Spatial features, including longitude, latitude, elevation, slope and aspect, were also extracted in each sub-grid. Finally, the model input dataset corresponding to the grid data and the ground observation precipitation in time and space was constructed. The detailed sub-grid extraction is shown in Figure 3.
2.2.2. Attention Mechanism
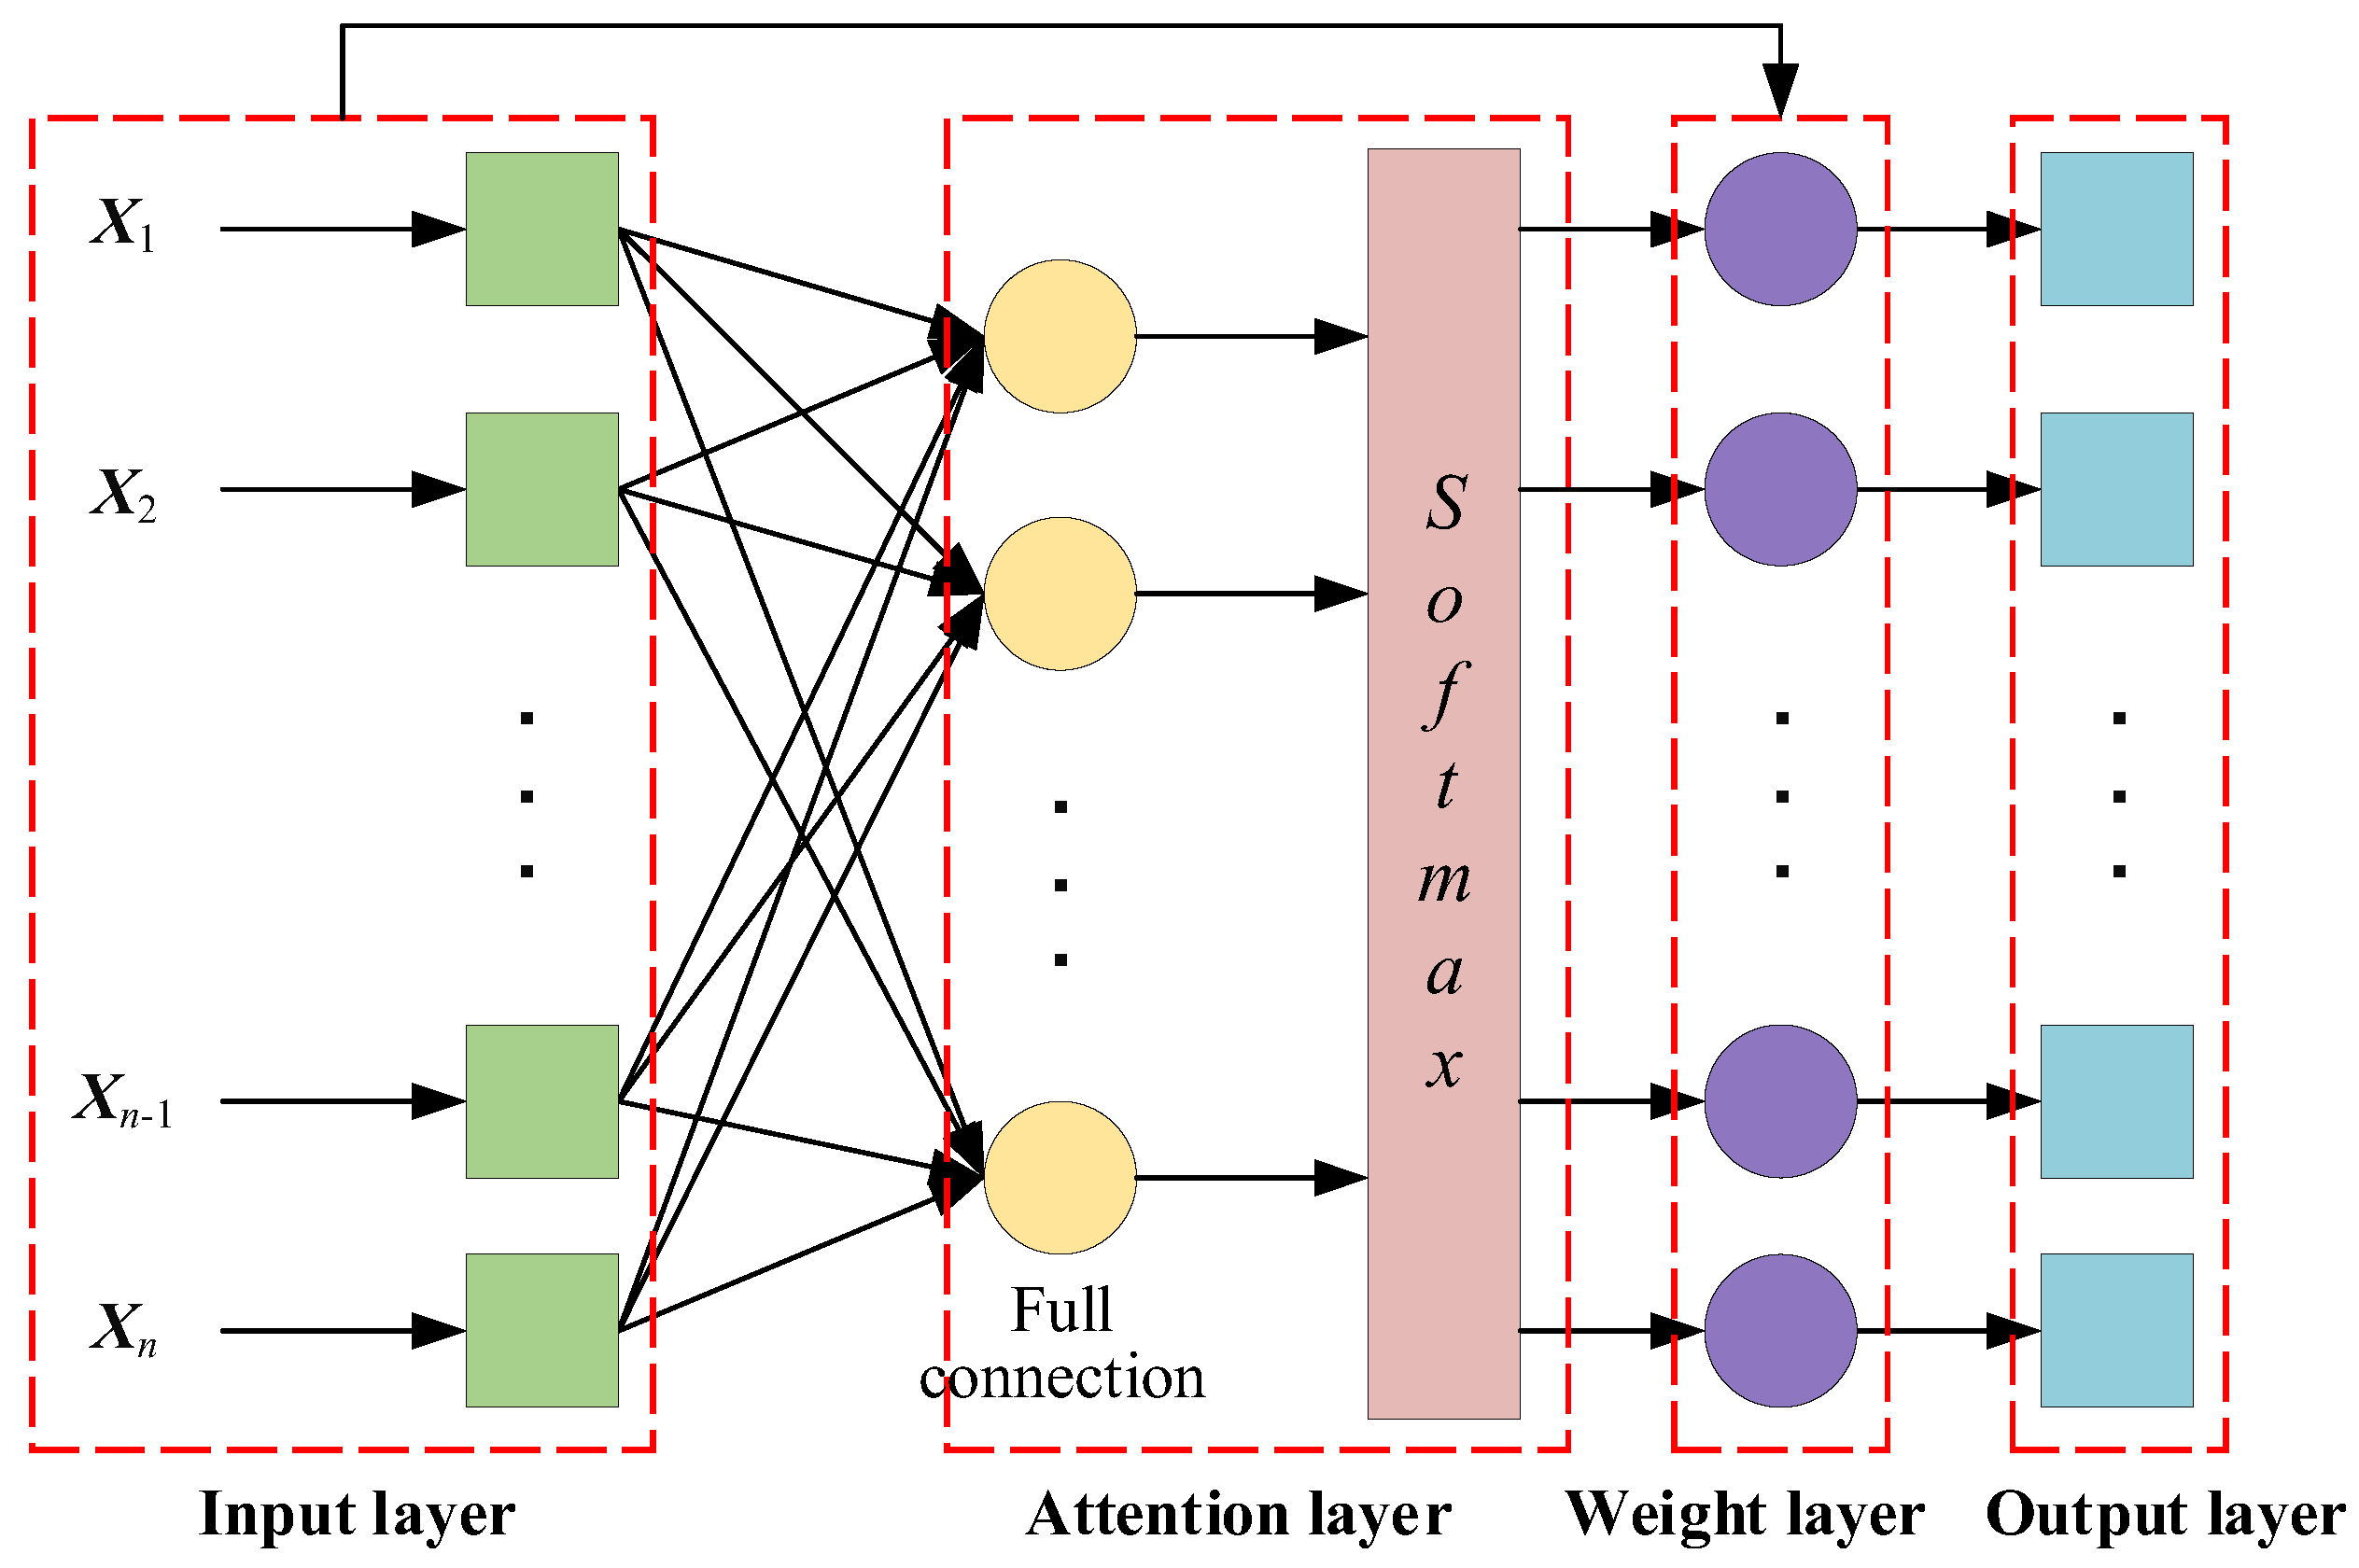
The attention mechanism, which is inspired by human visual attention, is proposed by researchers from Google [64,65]. In cognitive science, to rationally utilize limited visual information processing resources, focus is places on important parts of information while ignoring other visible information. Similarly to the human attention function, the attention mechanism in deep learning can focus on input factors that are more critical to output variables among many factors and reduce attention to other factors. The network structure of the attention mechanism is shown in Figure 4. The network mainly consists of three layers, namely the input layer, attention layer and output layer. First, the input layer receives the input factors. Second, the attention layer constructs the attention weight matrix based on the importance of the input factors to the decision variable to obtain the attention weights of each factor. Finally, the output layer outputs the weighted factors obtained by multiplying the attention weights with the input factors. The general function of the attention mechanism is described as follows:
where X denotes the input vector, W and b denote the weight vector and bias that need to be trained, A denotes the attention weights and X′ denotes the weighted vector.
2.2.3. ConvLSTM
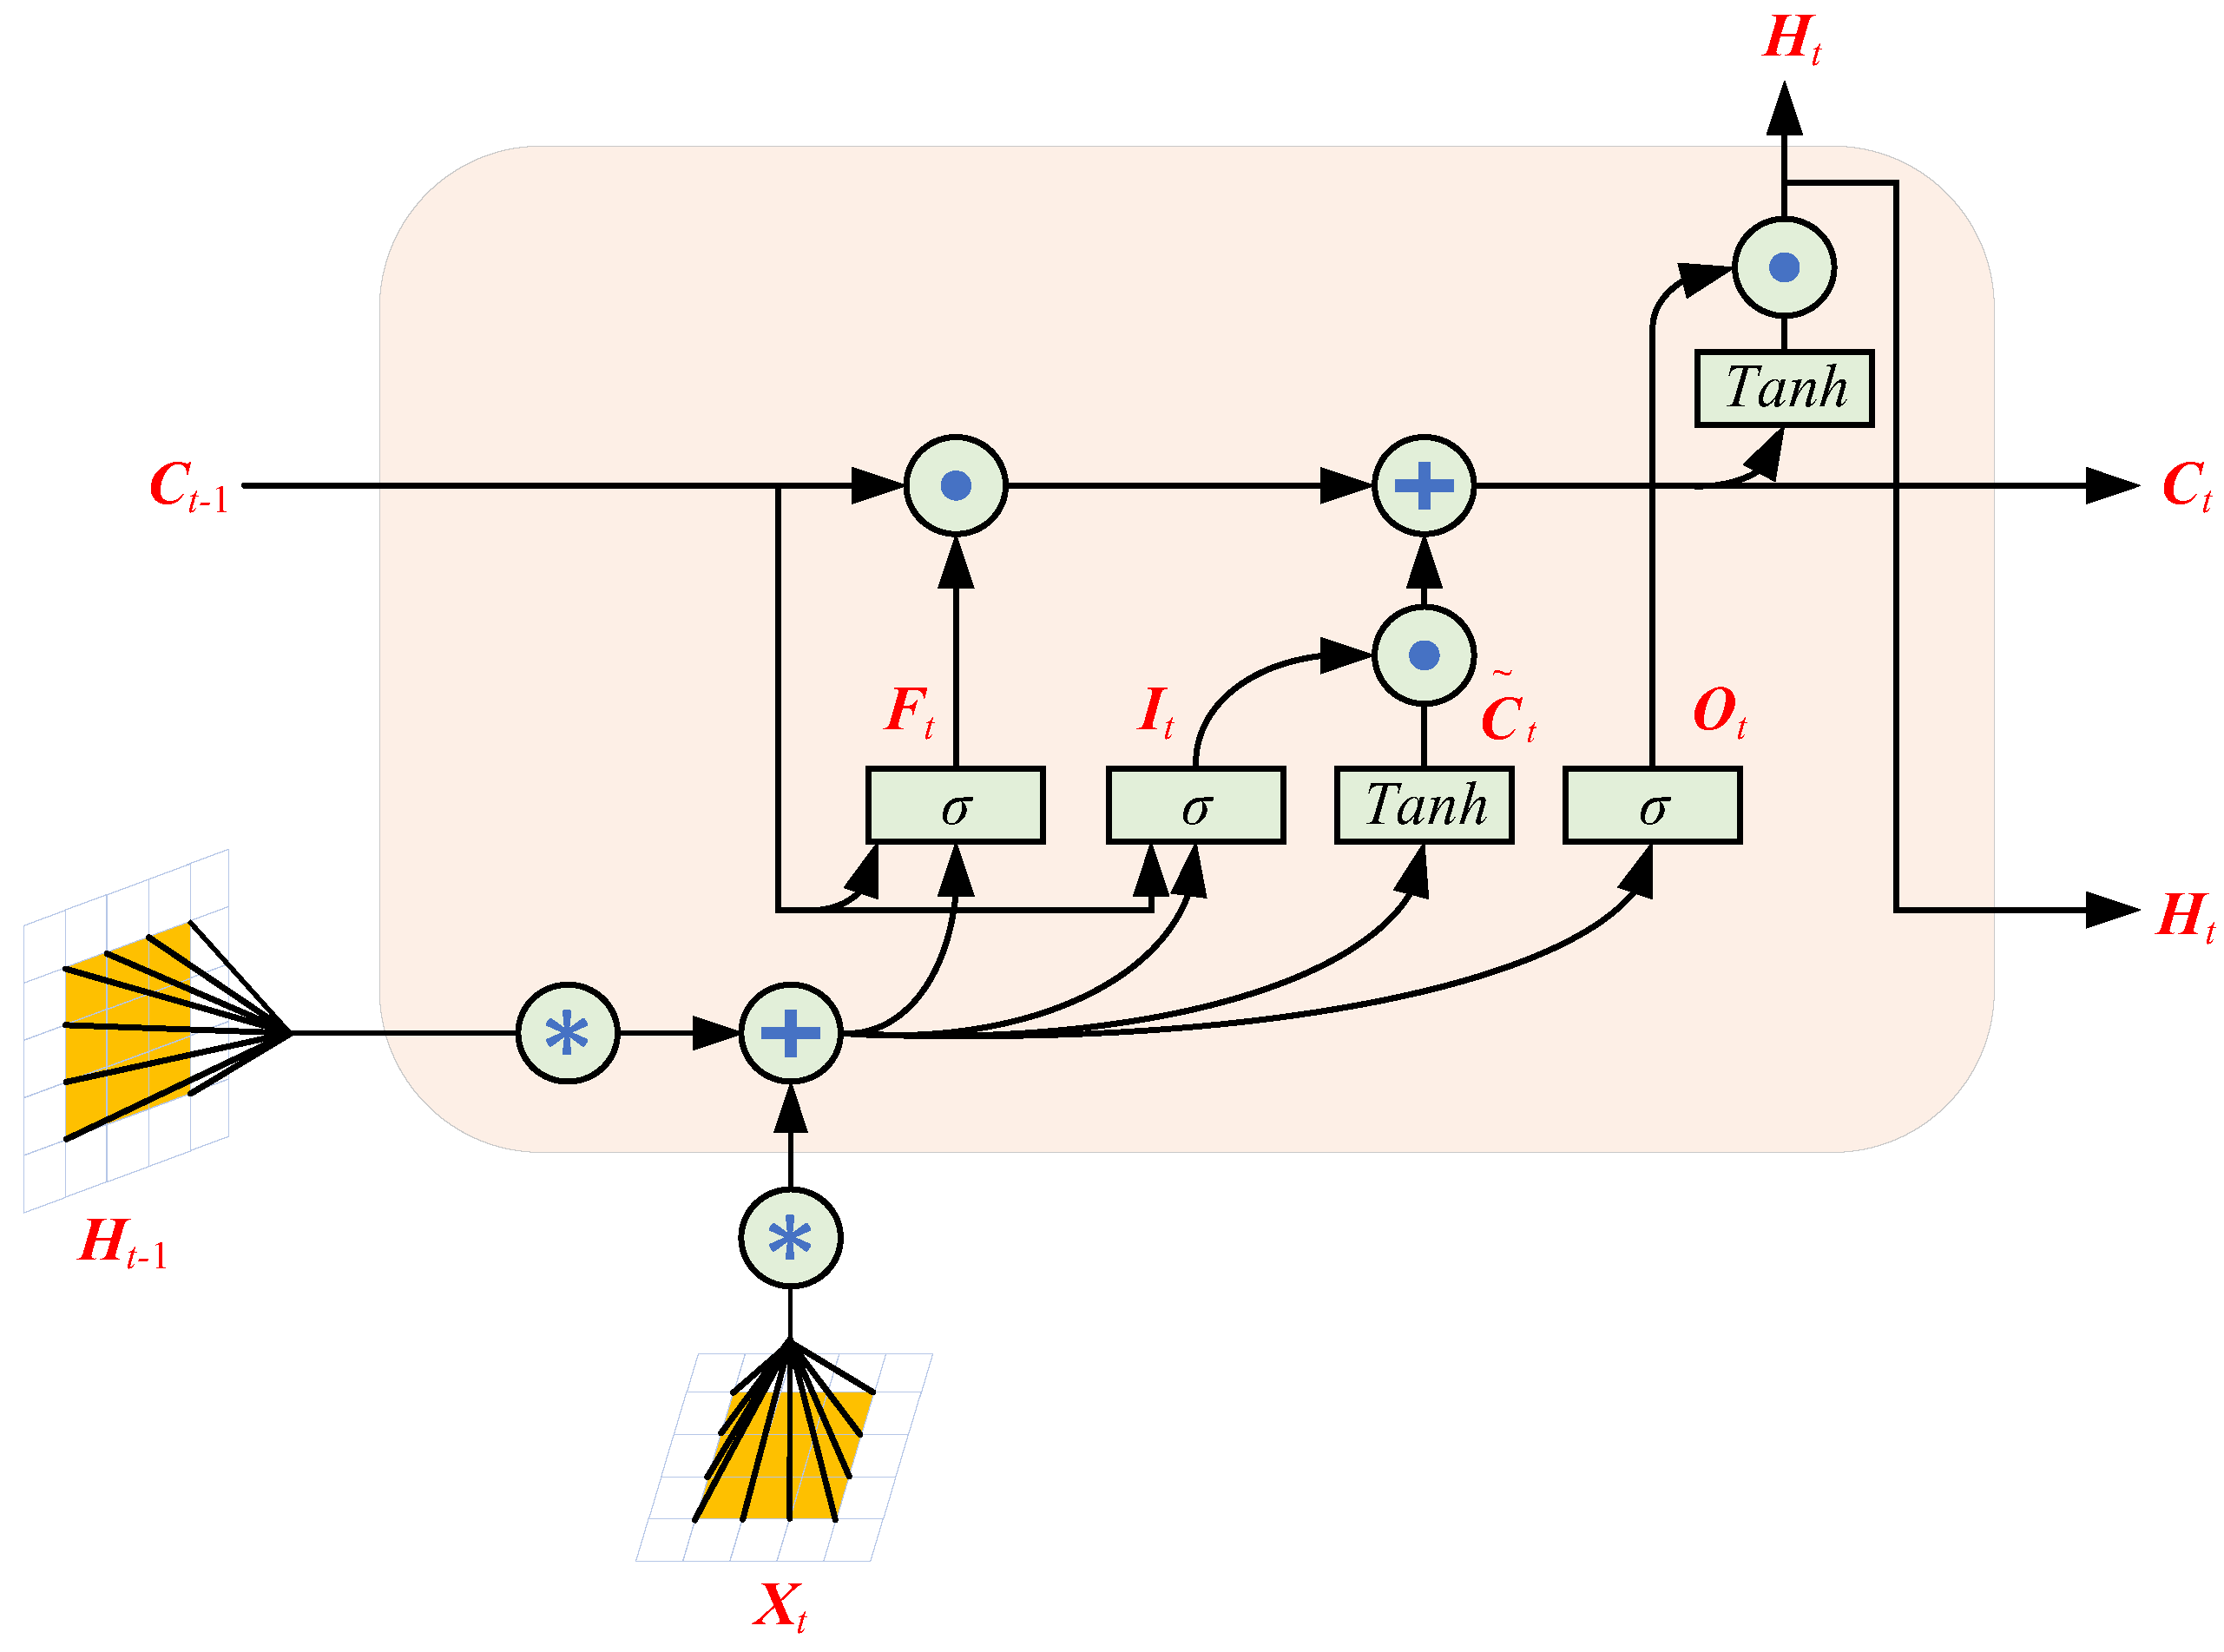
As an improvement of the long-short-term memory network (LSTM), the Convolutional long-short-term memory network (ConvLSTM) not only has temporal modeling ability but can also describe local spatial features like a convolutional neural network [66]. LSTM consists of an input gate, forget gate, state gate and output gate, whose computation between network layers is processed similarly to a feed-forward neural network. Therefore, it can handle time series data well, but cannot describe the local spatial features well. To make up for this deficiency, ConvLSTM replaces the feed-forward connection between layers with convolutional structures, which is helpful for the extraction of spatial features. The internal detailed structure of ConvLSTM is shown in Figure 5, where the mathematical expressions are described as follows (other data were processed through linear interpolation):
where t denotes time, denotes convolution operation, denotes Hadamard product, X denotes the input vector, I, F, , C, O and H denote the output of the input gate, forget gate, candidate memory, memory cell state, output gate and hidden layer, and denote the weight vector and bias of each gate or network layer that need to be trained, denotes Sigmoid function and tanh(·) denotes hyperbolic tangent function.
2.2.4. A-ConvLSTM
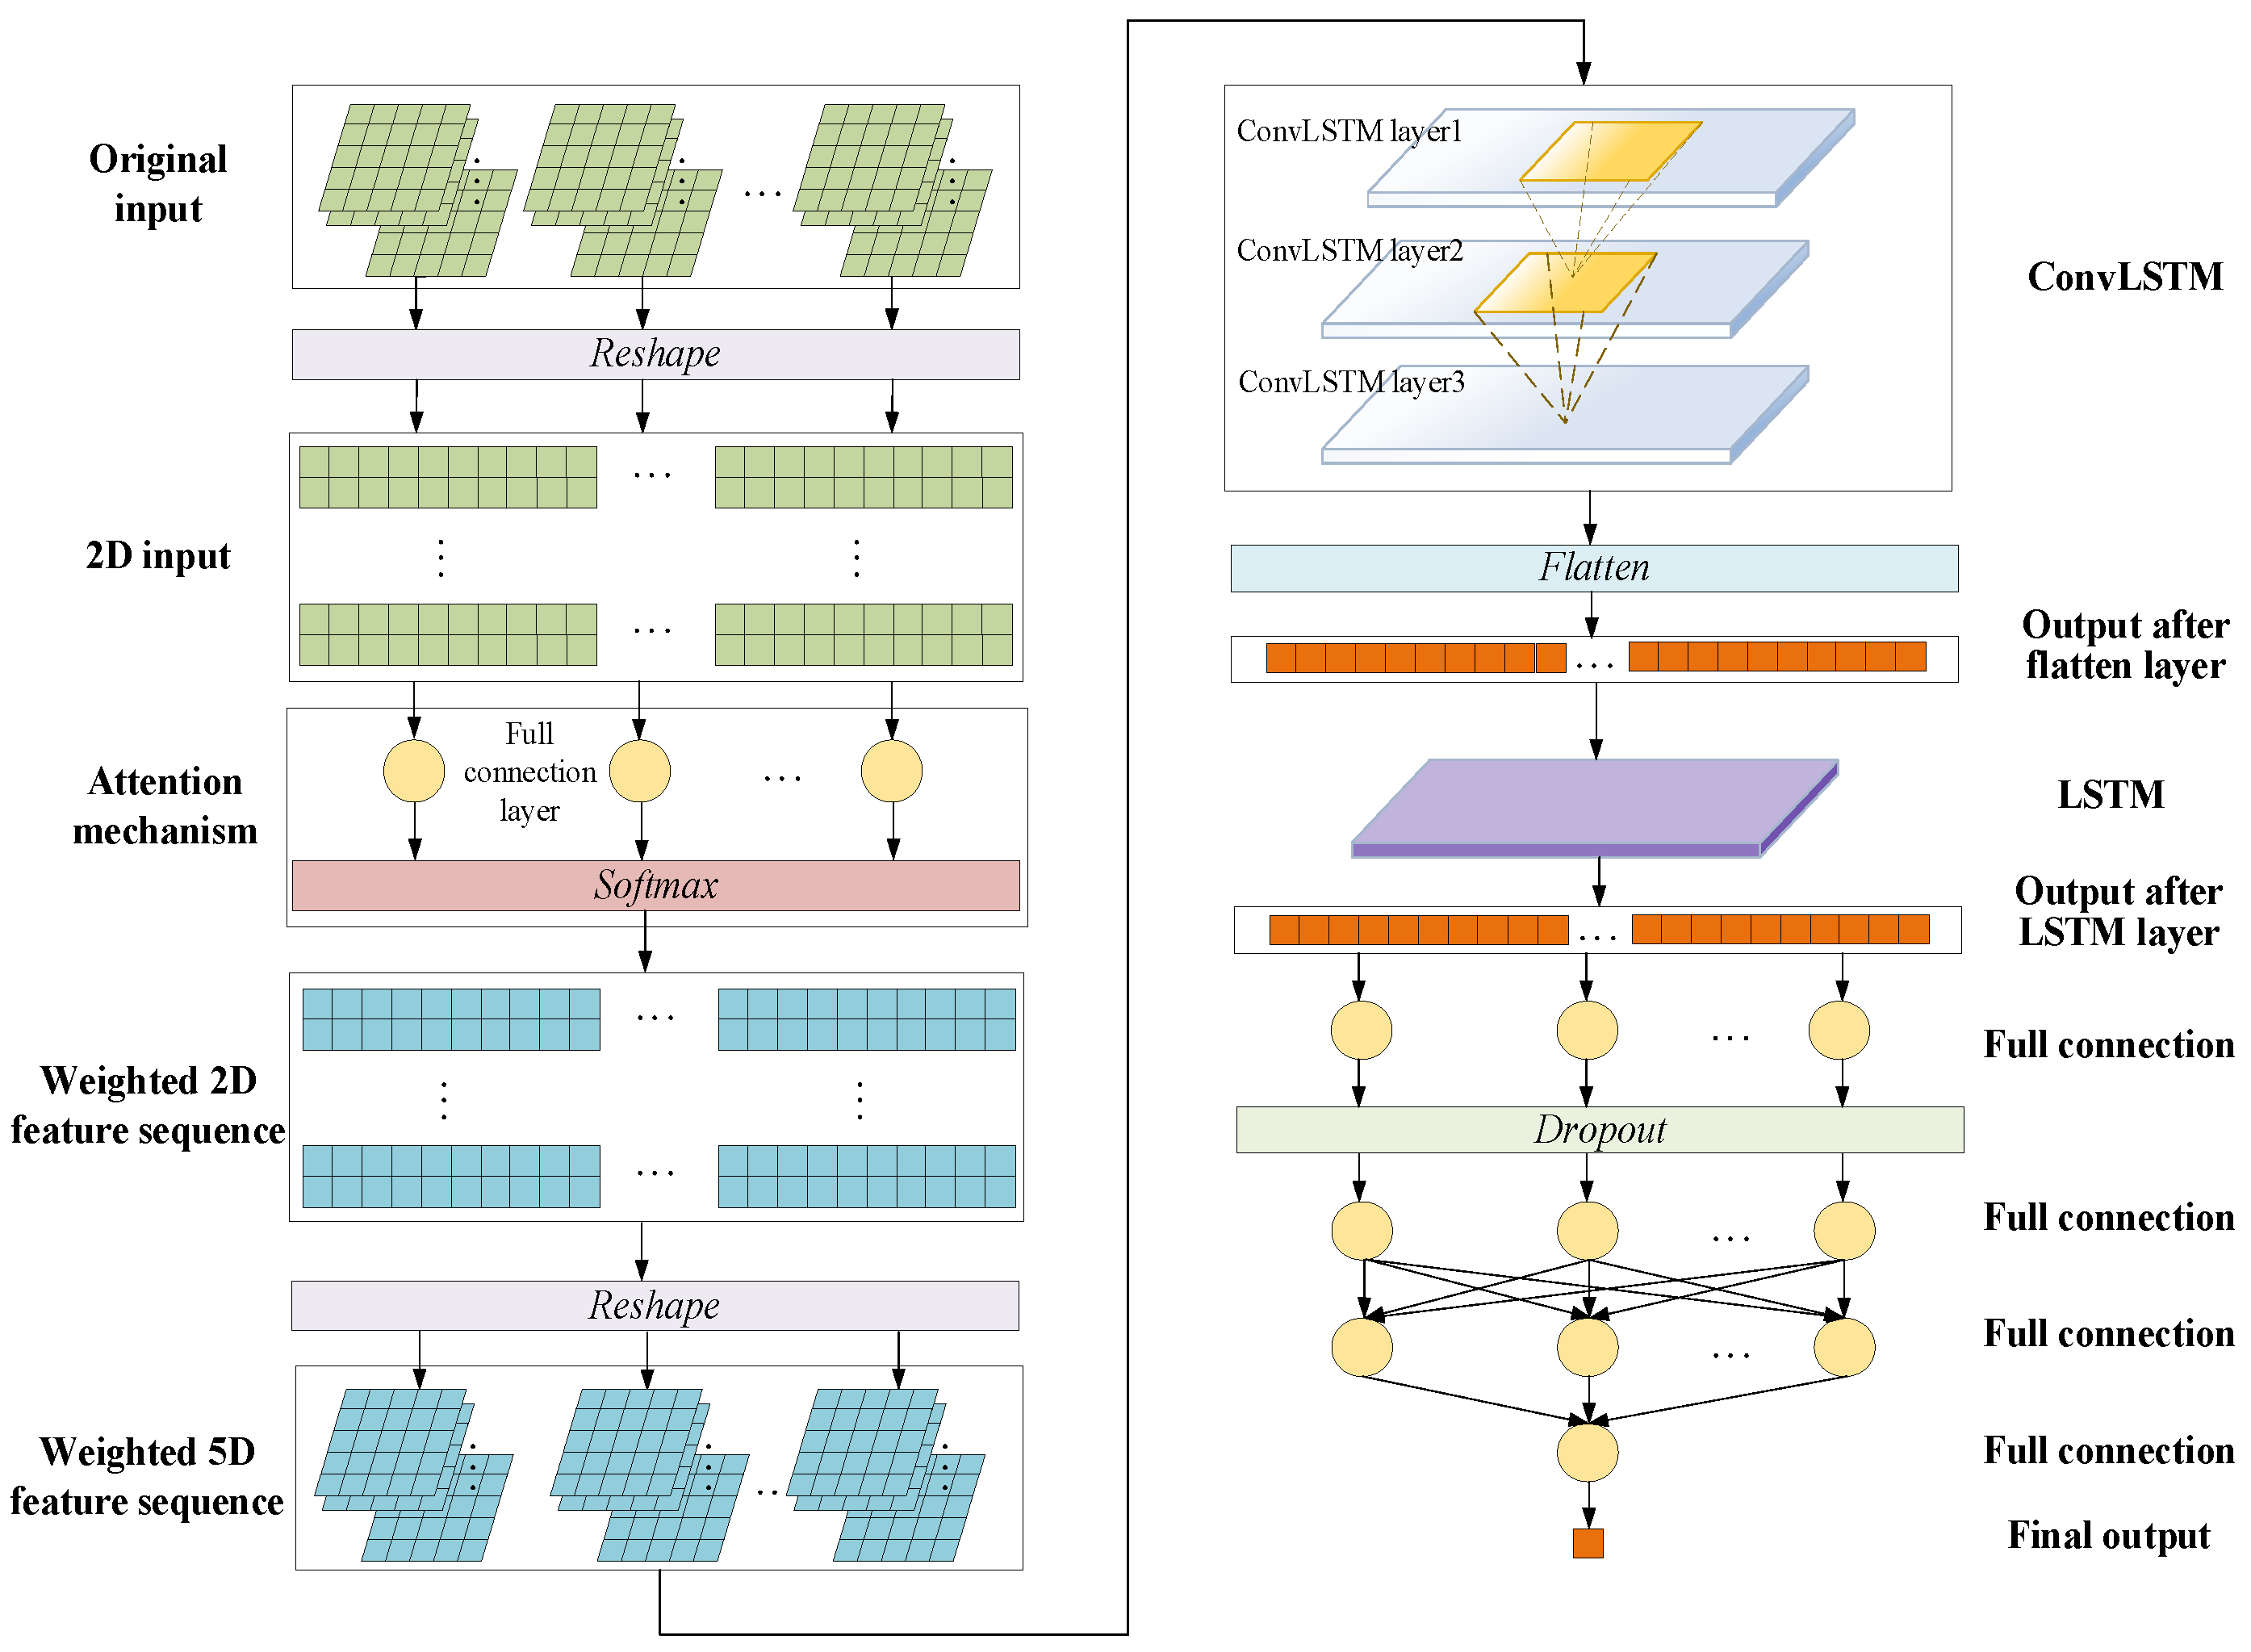
To accurately simulate spatiotemporal correlations between ground observation precipitation and other precipitation products, the multi-source precipitation spatiotemporal fusion model, by coupling the attention mechanism and ConvLSTM (A-ConvLSTM), is proposed to merge multi-source precipitation data. The attention mechanism is used to highlight the input factors that have greater impacts on the response variable, and ConvLSTM is used to capture spatiotemporal features. The structure of A-ConvLSTM is shown in Figure 6.
In Figure 6, the squares represent different types of input factors, intermediate results and the output. The Reshape function is used to rescale the rows, columns and dimensions of the data to match the input type of the model without changing the characteristics of the original data. The attention mechanism, consisting of a fully connected layer and the Softmax function, is applied to highlight key input information. The 3-layer connected ConvLSTM layer is used to improve the spatiotemporal capture ability and merging accuracy of multi-source precipitation. The Flatten layer is used to one-dimensionally process the multi-dimensional output of the ConvLSTM network and then decode the output through the LSTM layer. Dropout is a regularization function to prevent overfitting, and dense is a fully connected layer. Therefore, the main coupling steps of A-ConvLSTM are as follows:
(1) The attention mechanism assigns attention weights to the two-dimensional inputs transferred from the original multi-dimensional inputs through the reshape function, and a weighted two-dimensional feature sequence is obtained.
(2) The reshape function converts weighted features into five-dimensional data as inputs of ConvLSTM to extract the spatiotemporal features of multi-source precipitation.
(3) The outputs of ConvLSTM are decoded by the LSTM network, and the final results are obtained via the fully connected network.
2.2.5. Other Models
(1) MLR
Multiple linear regression (MLR) is suitable for characterizing the correlation between multiple independent variables and a dependent variable.
(2) SVR
Support Vector Regression (SVR) is a well-known machine learning based on the principle of structural risk minimization. It works by defining a suitable kernel function to find the optimal regression plane that roughly satisfies all the data.
(3) LSTM
As a special type of Recurrent Neural Network (RNN), Long Short-Term Memory Neural Network (LSTM) is used to replace the units of RNN with memory units to improve long-term memory ability. Memory units are located in the hidden layer, including the forget gate, input gate and output gate. They can process the incoming information from the previous stage, discard some useless information and store valuable information to update the cell to obtain the best output result.
(4) GRU
The network structure of the Gated Recurrent Unit (GRU) is similar to LSTM. Unlike LSTM, its memory unit has only two gates: the update gate and reset gate. Furthermore, GRU uses hidden states to convey information. Therefore, the structure of GRU is simpler than LSTM.
(5) XAJ
The Xin’anjiang model (XAJ) is an aggregate hydrological model that can be used in humid and semi-humid areas. The model first divides the basin into a number of unit areas, then calculates the streamflow of each unit, based on the principle of runoff generation under saturated conditions, performs the calculation of catchment flow, and finally superimposes the sink flow of each unit as the forecast basin process of the whole basin.
(6) SWAT
The Soil and Water Assessment Tool (SWAT) is a distributed watershed hydrologic model based on GIS. Firstly, it divides multiple hydrologic response units according to a combination of soil type, land use and topography. Secondly, the water balance equation is utilized to simulate the process of a terrestrial hydrologic cycle. Third, the Muskingum method or variable storage coefficients are used for catchment calculations on the river. Finally, the hydrological processes in the watershed are simulated based on the characteristics of the river network.
2.3. Evaluation Indices
In this study, five evaluation indices, including root mean square error (RMSE), mean absolute error (MAE), correlation coefficient (CC), Nash-Sutcliffe model efficiency coefficient (NSE) and average relative error (MRE), were used to evaluate the accuracy and applicability of the proposed A-ConvLSTM model. RMSE reflects the degree to which the simulated sequence deviates from the observed sequence. MAE reflects the average error range of the simulated sequence, which can accurately reflect the actual error. CC reflects the linear correlation between the simulated and observed series. NSE reflects the overall agreement between simulated and observed sequences. MRE reflects the relative error between the simulated and observed sequence, which can better reflect the credibility of simulation errors. CSI reflects the success rate of precipitation products in detecting actual precipitation events. These are described as follows:
where O denotes the observed sequence, denotes the mean value of the observed sequence, S denotes the simulated sequence, i denotes the time interval and n denotes sequence length. Nxy is the number of observed precipitation events in category x detected by the precipitation product in category y (x, y = 0, 1; 0 means no precipitation and 1 means precipitation).
3. Results and Discussion
3.1. Precipitation Fusion Performance with Different Models
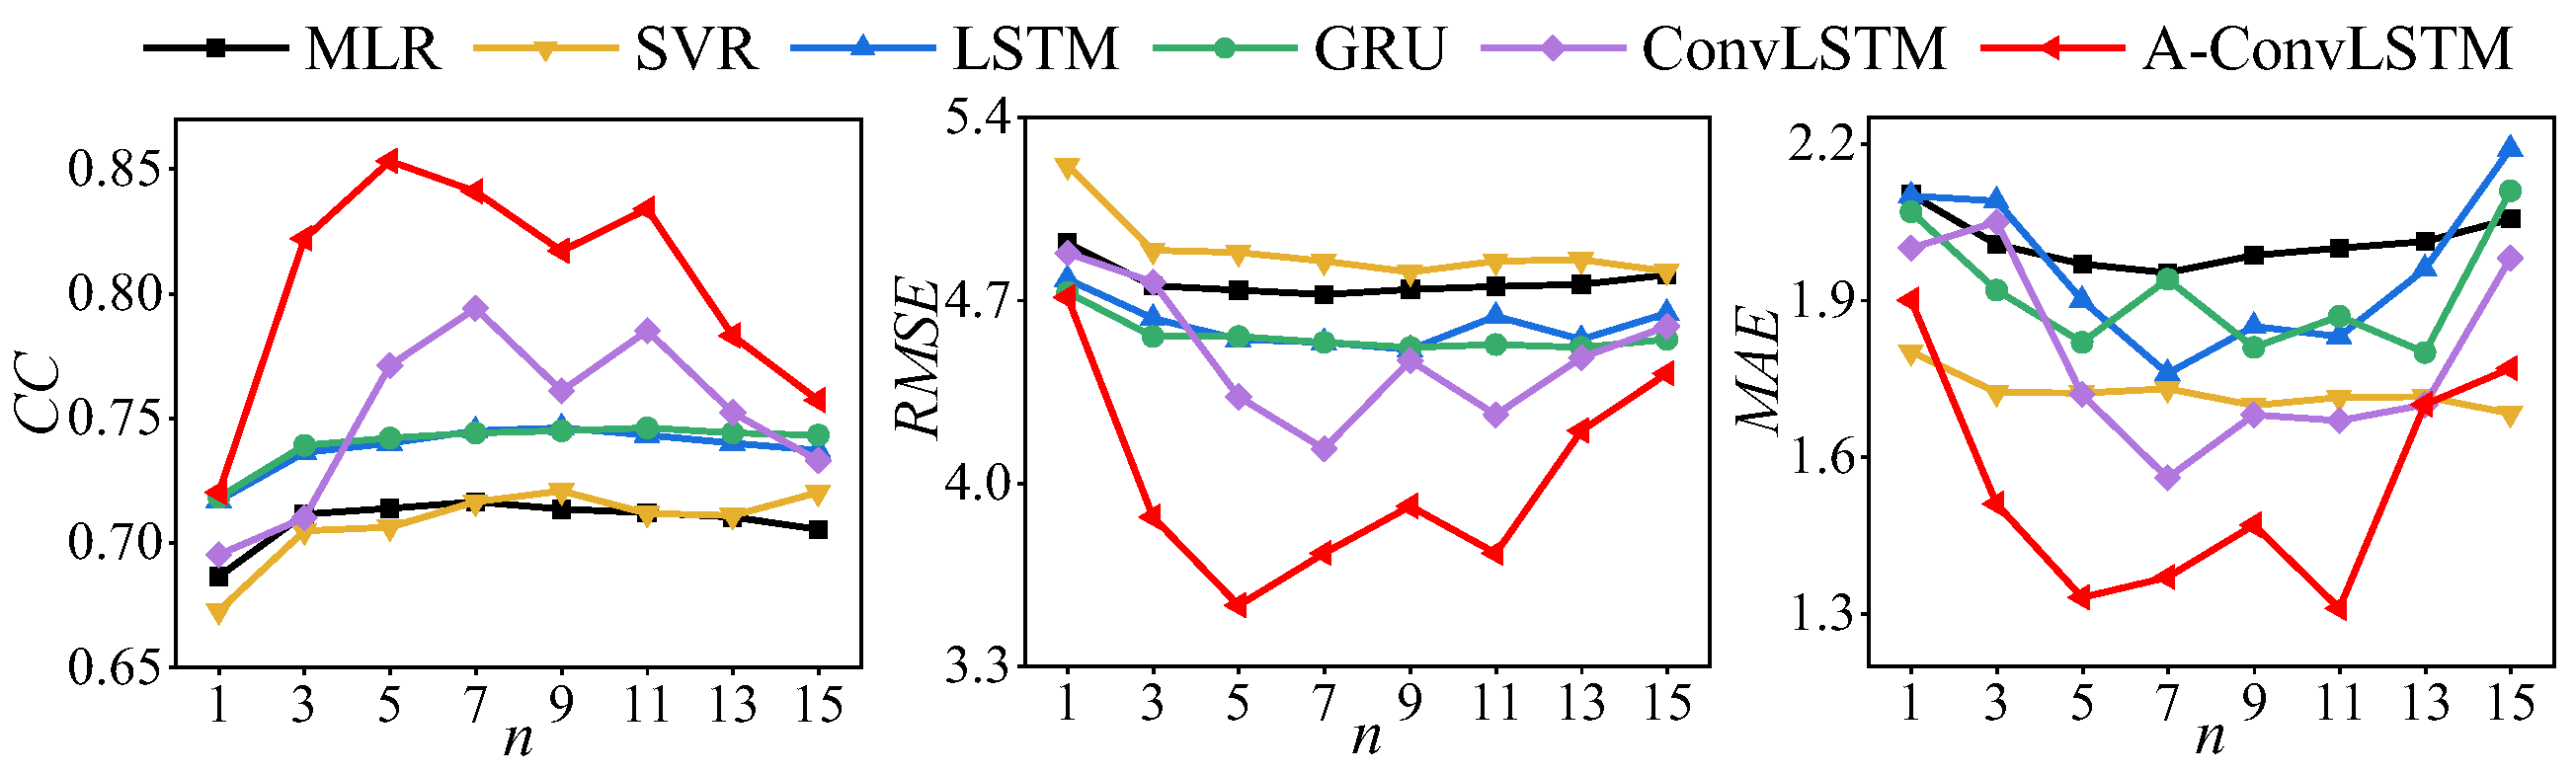
To evaluate the performance of the A-ConvLSTM model, the 5-fold cross-validation method was used to randomly divide the used modeling data into five parts according to the distribution of seventy-two ground stations, four of which were used for training and one for testing. Different model input datasets were obtained based on the different numbers of sub-grids for the model training. Each model used the Bayesian optimization algorithm to optimize the parameters, which was trained 50 times and iterated 100 times for each training. The optimal results of each model under different sub-grid numbers are shown in Figure 7.
It can be seen from Figure 7 that as the sub-grid numbers increase, the accuracy of ConvLSTM and A-ConvLSTM first increase and then decrease, while the same trend is not very obvious in other models. This may be because ConvLSTM and A-ConvLSTM can capture the spatiotemporal feature of precipitation and can comprehensively merge sub-grid information. Within a certain range, the increase in the number of sub-grids, which means the addition of spatiotemporal information, can certainly improve the effect of precipitation fusion. However, increasing the number of sub-grids too much will cause too much useless information to interfere with the accuracy. Other models can only capture the temporal features of precipitation, and the addition of spatial information does not greatly improve their accuracy. Therefore, their accuracy varies relatively insignificantly with the number of sub-grids. Based on various evaluation indices, the sub-grid numbers selected for the optimal MLR, SVR, LSTM, GRU, ConvLSTM and A-ConvLSTM models were 7 × 7, 9 × 9, 9 × 9, 11 × 11, 7 × 7 and 5 × 5, respectively. In addition, the precipitation product data (IMERG, ERA5 and CHIRPS) of each ground station were obtained by the inverse distance interpolation method to be compared with the proposed A-ConvLSTM model. The performance of different precipitation fusion models is shown in Table 2.
It can be seen from Table 2 that, compared with the original precipitation products, the performance of precipitation fusion models is improved, and A-ConvLSTM performs best. In terms of evaluation indices, IMERG is the best and ERA5 is the worst, with CCs, RMSEs and MAEs of 0.452, 6.11 mm/d and 2.64 mm/d and 0.390, 7.01 mm/d and 3.83 mm/d, respectively. When MLR is used, the CC increases from 0.383 to 0.714, the RMSE decreases from 7.01 mm/d to 4.74 mm/d, and the MAE decreases from 3.83 mm/d to 1.99 mm/d, which indicates that considering the linear time-series correlation between input factors and the response variable can effectively improve the accuracy of merged precipitation. Compared with MLR, machine learning models such as SVR, LSTM and GRU have better precipitation fusion effects because of their strong nonlinear time-series fitting and generalization capabilities. The ConvLSTM model is clearly superior to the other models because it fully considers the spatial distribution of the input factors and integrates the terrain information around ground precipitation monitoring stations. However, because it is affected by irrelevant or weakly influential information in the input factors, the accuracy of ConvLSTM can still be further improved. A-ConvLSTM, which couples the attention mechanism and ConvLSTM, can provide a ConvLSTM with key information on the response variable in a large number of input factors to effectively improve accuracy and computational efficiency. The CC is increased from 0.383 to 0.853, and the RMSE and MAE are, respectively, 3.48 and 2.5 lower than for the original ERA5 data. Therefore, A-ConvLSTM has the best improvement in accuracy compared to the original precipitation products.
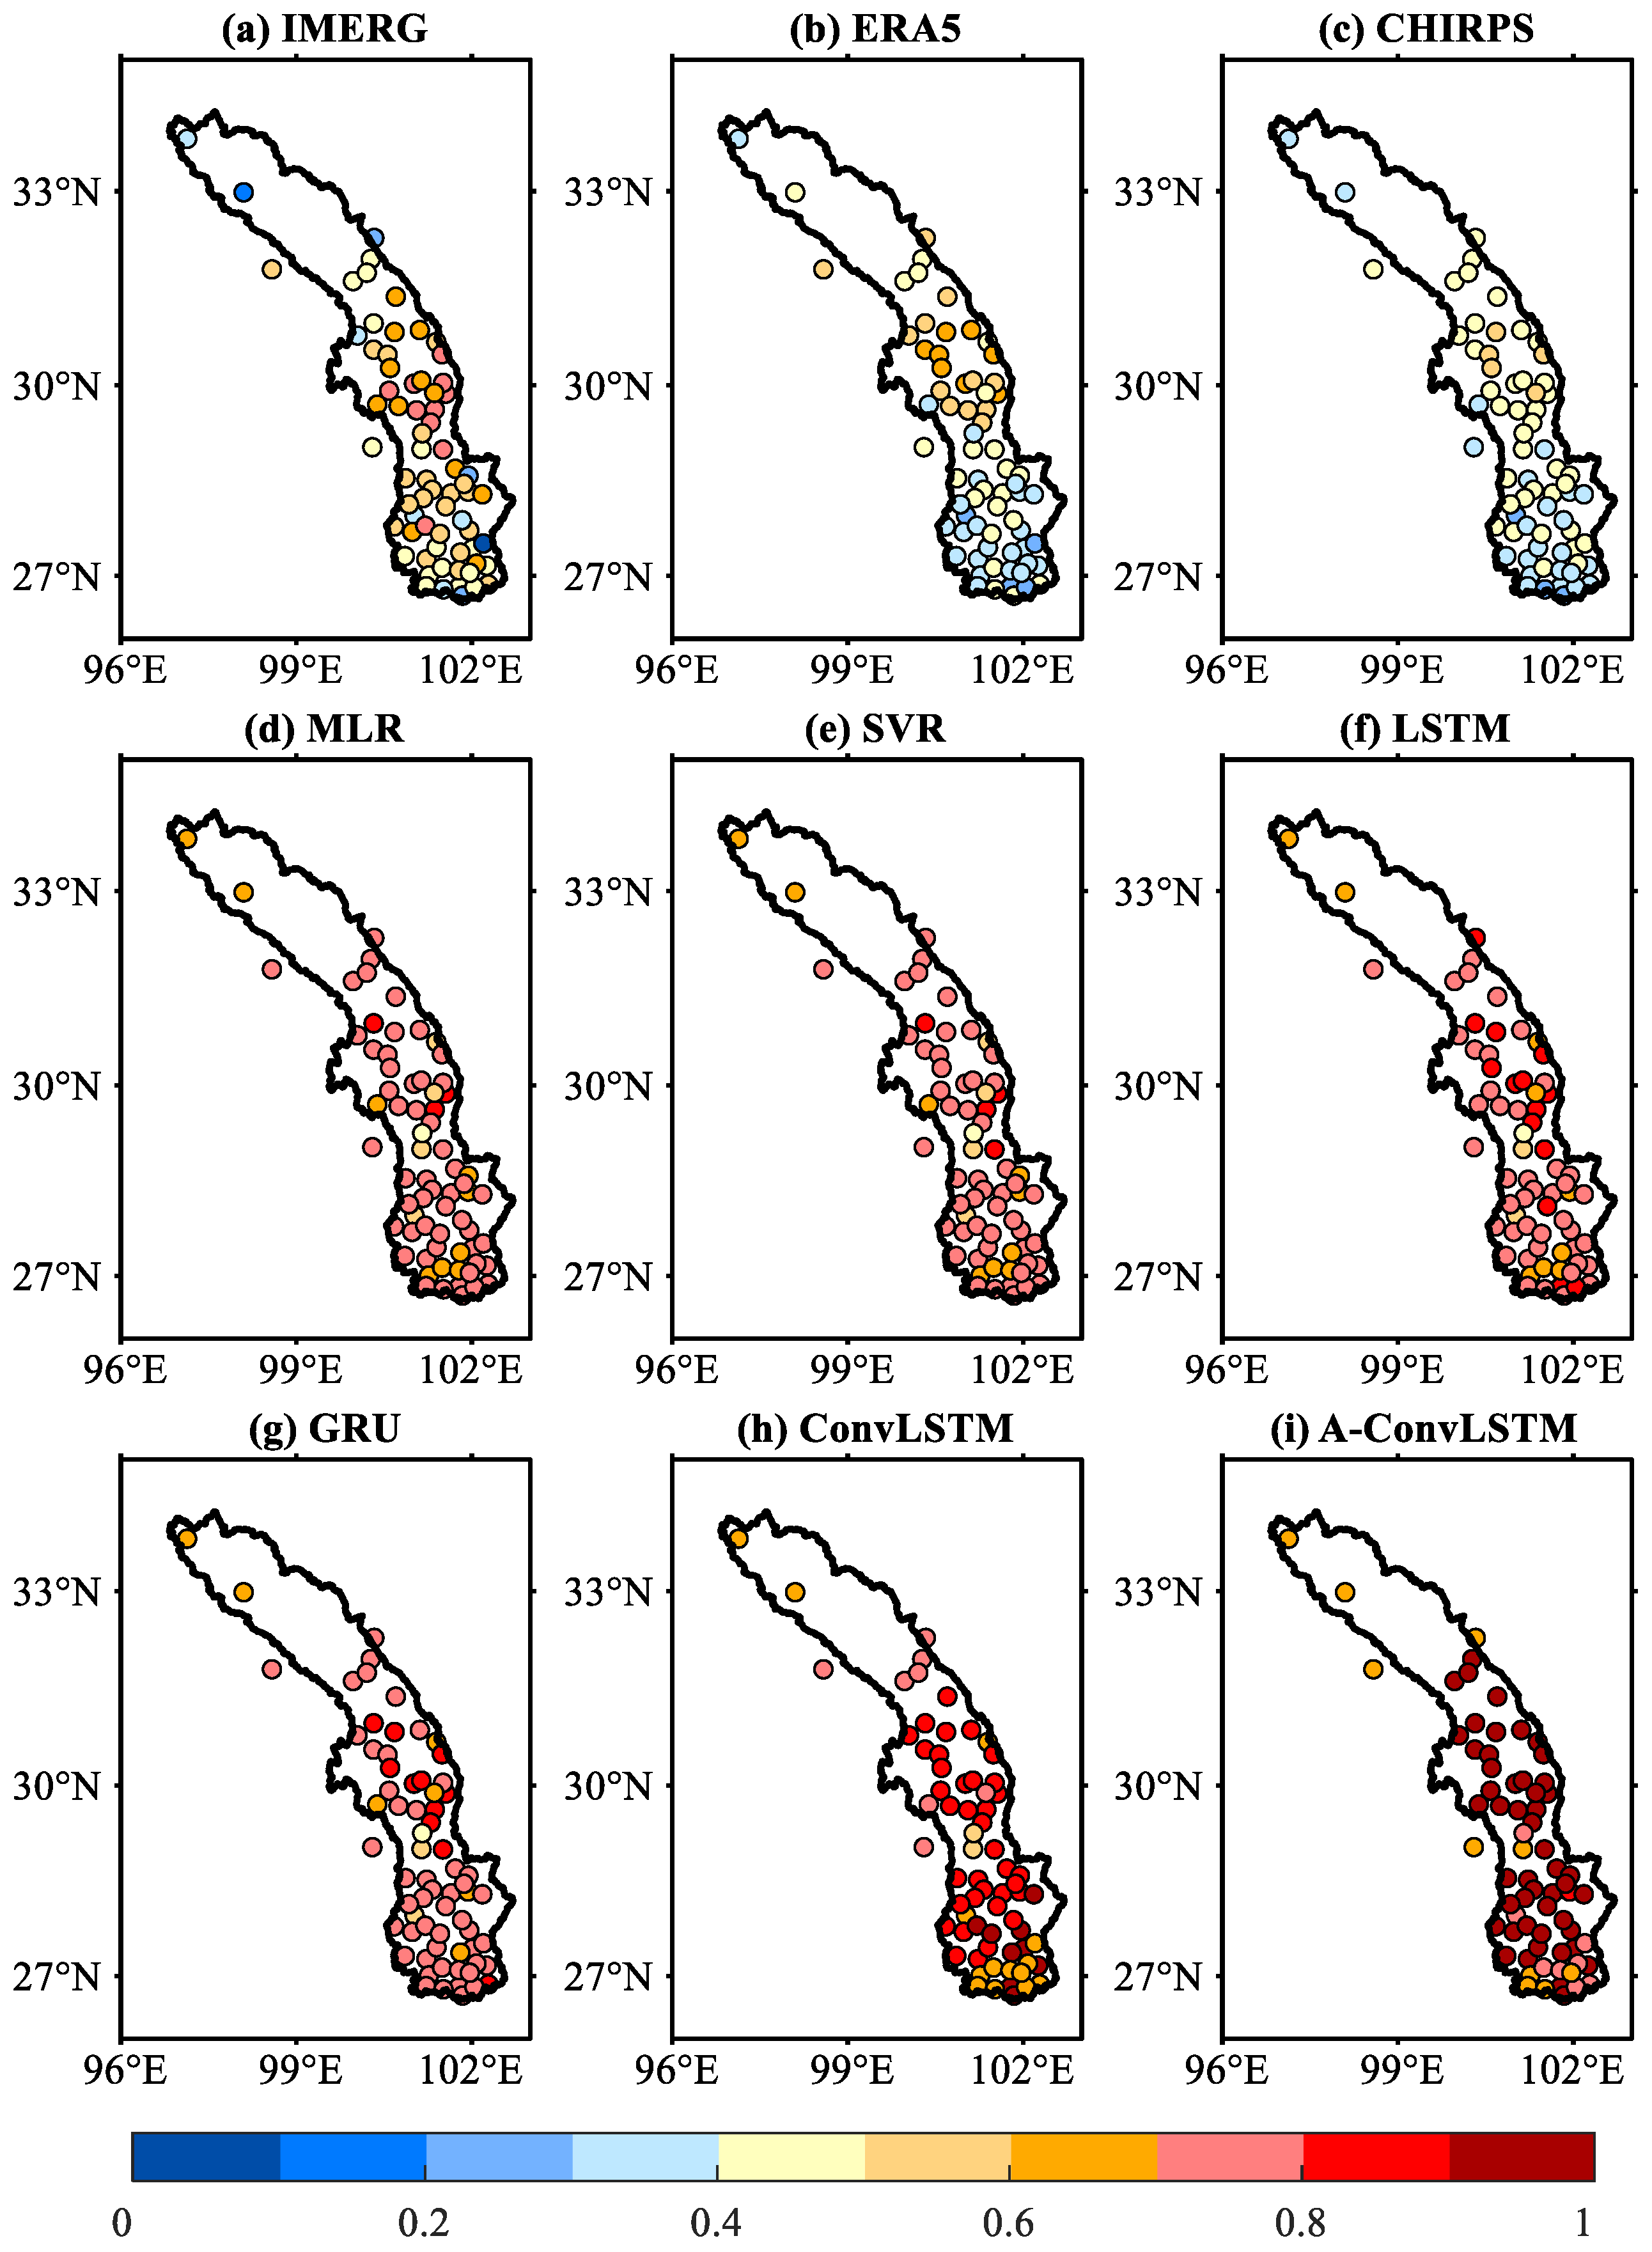
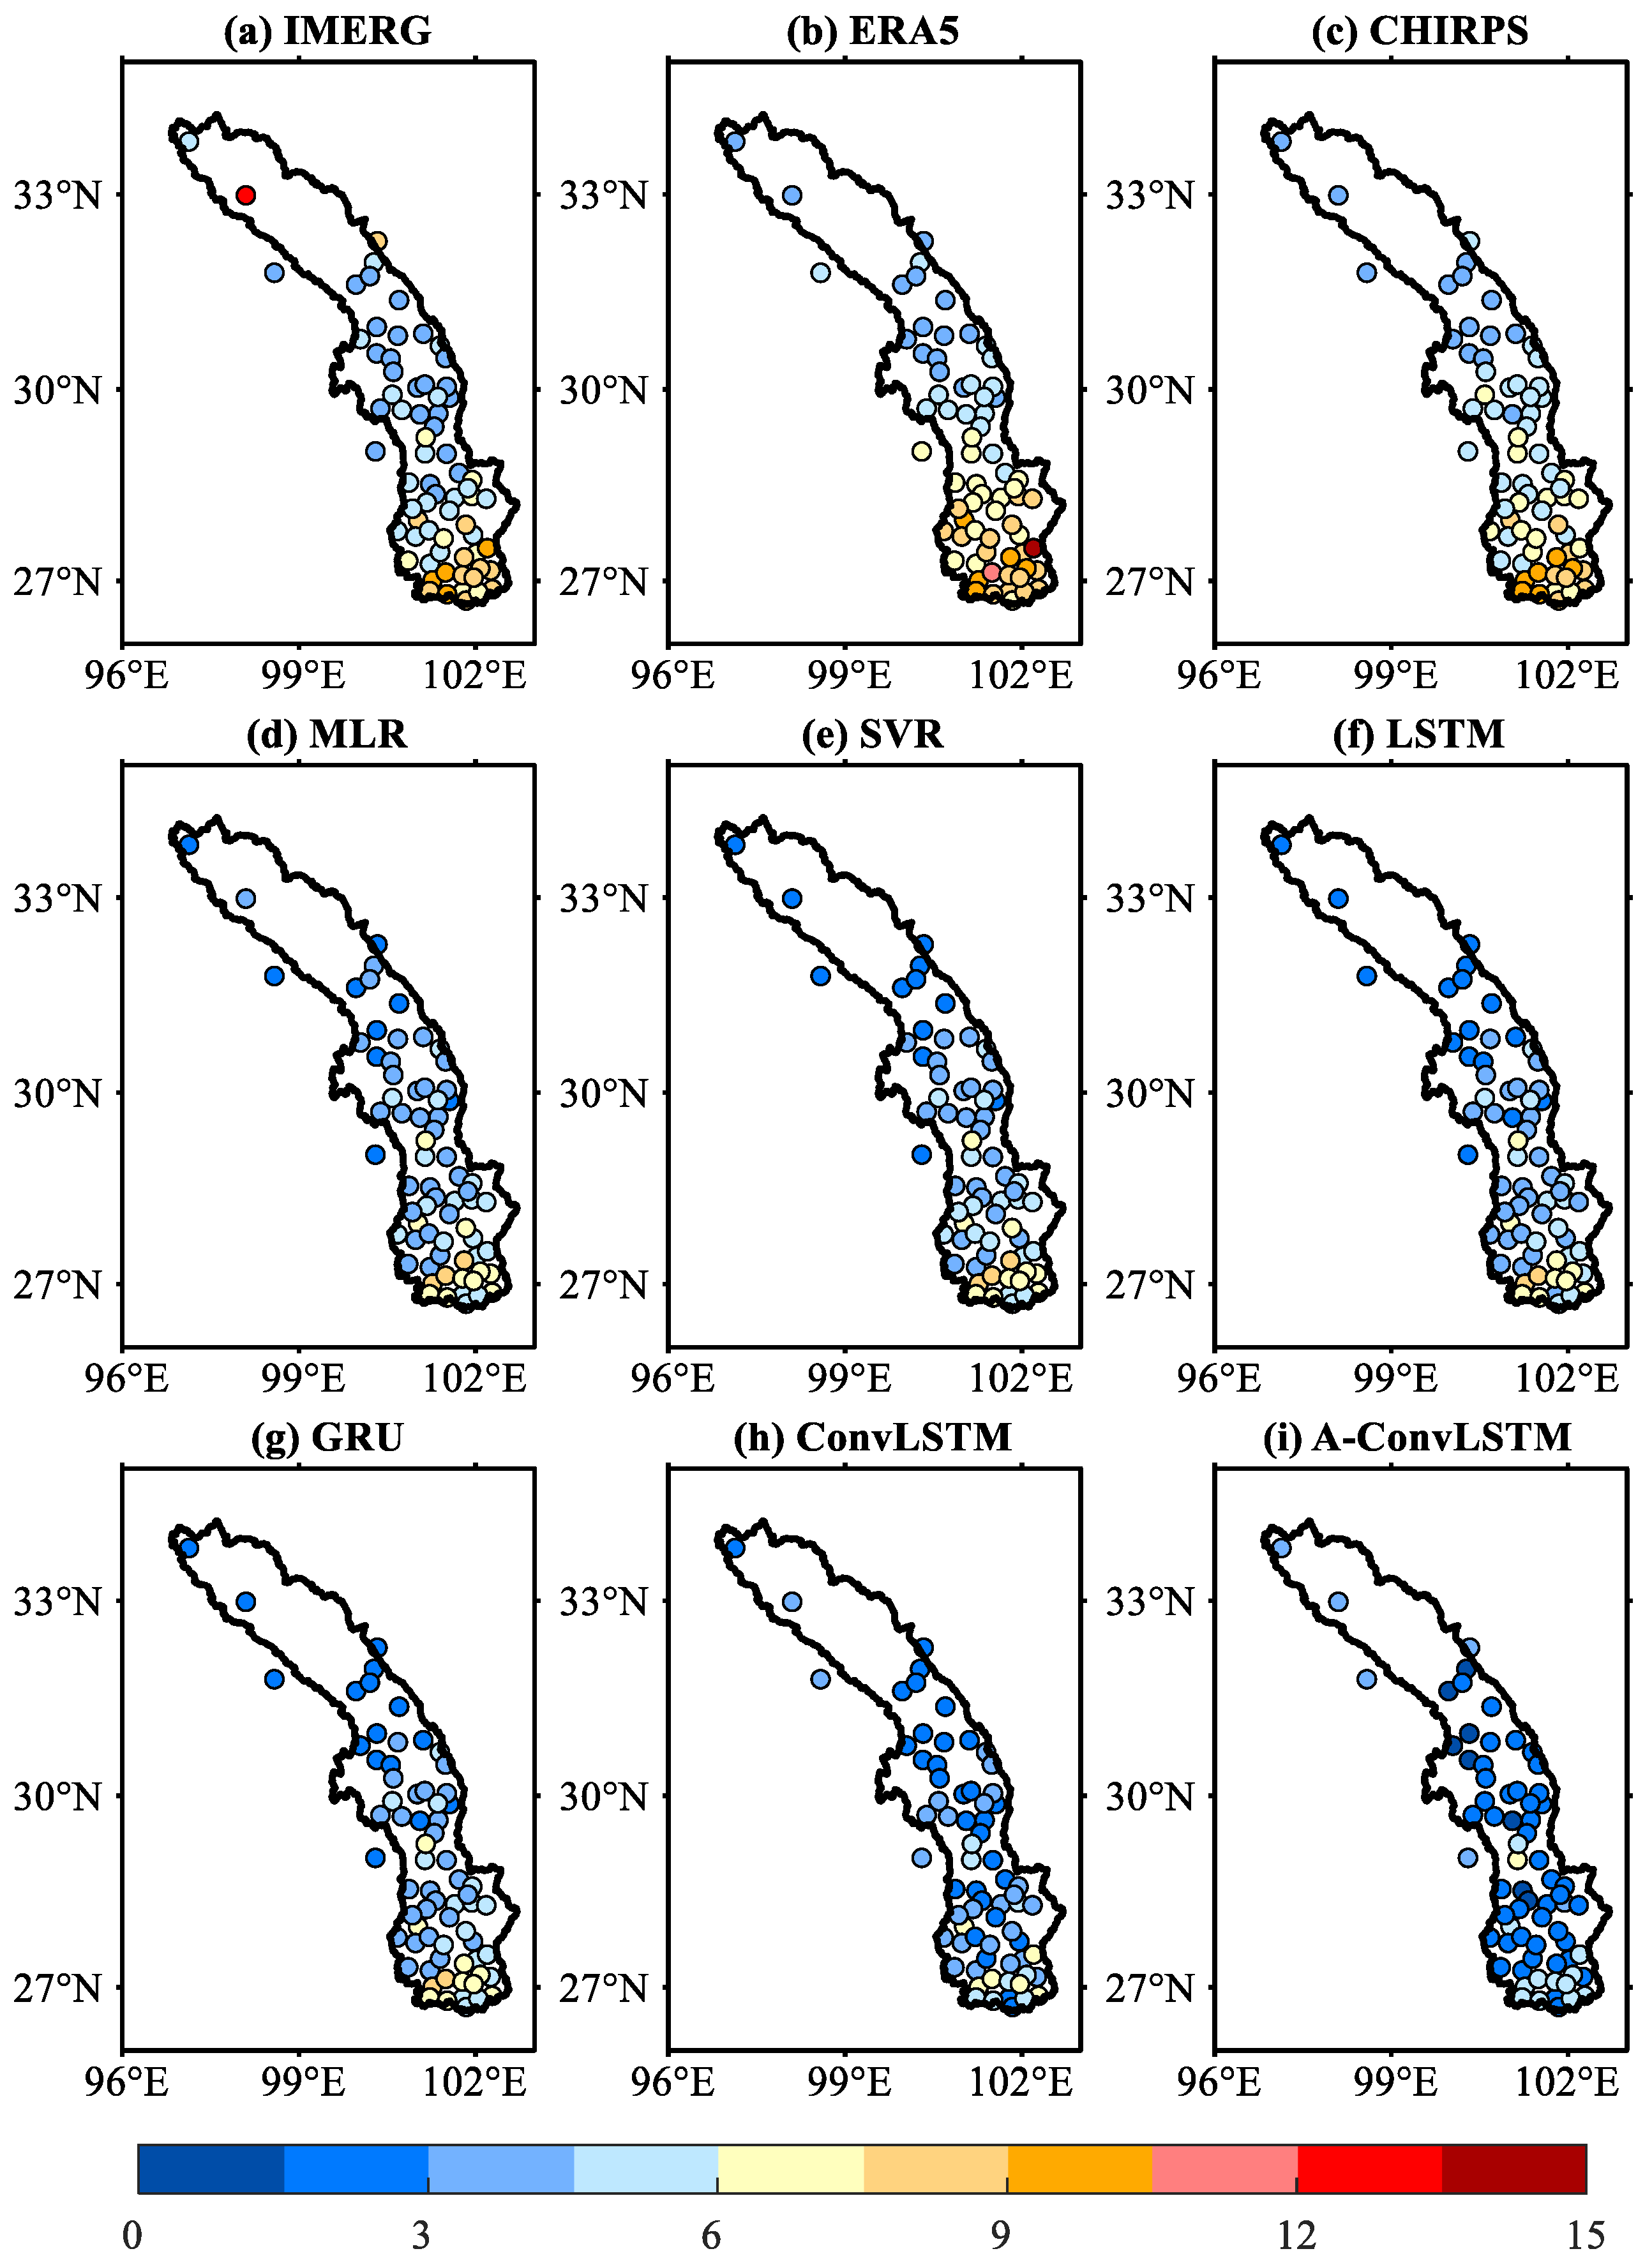
Based on the observed precipitation of ground stations, the CC, RMSE and MAE of each station are calculated for different precipitation fusion methods to obtain the spatial distribution of each index, as shown in Figure 8, Figure 9 and Figure 10.
From Figure 8, Figure 9 and Figure 10, it can be seen that the performance of each model is different at each ground station. Among the three precipitation products, IMERG performs best but has relatively large errors upstream and downstream of the Yalong River. Analyzing the possible factors, the following conclusions may be drawn: Firstly, due to the influence of the terrain, the precipitation process in high-altitude areas is usually more complex than that in plain areas, and there are fewer ground precipitation monitoring stations, which makes precipitation estimation by satellite sensors difficult [67,68,69]. Secondly, since precipitation in the Yalong River increases from northwest to southeast, high precipitation downstream increases the difficulty of satellite estimation [70]. ERA5 has the lowest accuracy, especially in the downstream areas, with large errors. This may be because the physical calculation process of ERA5 is mainly inclined toward high accuracy in Europe, and the high precipitation in the downstream of Yalong River increases the difficulty of its parameter adjustment [1]. CHIRPS has the smallest error fluctuation range among the three precipitation products, which indicates that its precipitation estimates are relatively stable at different stations. However, due to the limitations of a complex terrain and evolution algorithm [71,72], it still has large errors, especially downstream.
Aiming at overcoming the shortcomings of the original precipitation products, multi-source precipitation fusion models improve the accuracy of precipitation products by merging precipitation product data, ground observation precipitation and other auxiliary variable information. Because a higher CC value and lower RMSE and MAE values mean that models have a better performance, the redder points in Figure 8 and the bluer points in Figure 9 and Figure 10 represent better results for the model. It can be seen from Figure 8, Figure 9 and Figure 10 that each precipitation fusion model has a good effect on improving merged precipitation accuracy, especially downstream. It indicates that the addition of environmental variables such as wind speed, temperature, vegetation data and terrain factors can improve the accuracy of the precipitation products; this is similar to the conclusions of previous studies [39,40,41,42,43]. Due to varying model complexity and ability to handle nonlinear relationships, LSTM and GRU are comparable in precipitation fusion and slightly better than SVM and MLR. However, these models, which can only represent the temporal correlation between input factors and the response variable, need to expand the two-dimensional spatiotemporal vectors into one-dimensional vectors for their input and calculation, which inevitably results in losing the spatial distribution of the input factors. Thus, their performance is inferior to ConvLSTM and A-ConvLSTM. A-ConvLSTM uses the attention mechanism to select beneficial input factors for the ConvLSTM inputs to improve the accuracy of merged precipitation. Compared with ConvLSTM, A-ConvLSTM can improve the precipitation fusion effect of downstream stations, indicating that it has a better improvement effect on stations with heavy precipitations. However, it is noted that, because there are fewer ground stations, there is still room for a further improvement of A-ConvLSTM upstream. In conclusion, from the performance evaluation based on the observed precipitation data, A-ConvLSTM has the smallest error and strong robustness and can better reflect the spatial distribution characteristics of precipitation.
3.2. Fusion Model Performance under Different Precipitation Intensities
The error between merged precipitation and observed precipitation may be different at different precipitation intensities. A quantitative and qualitative evaluation of errors under different precipitation intensities can reflect the performance of the precipitation fusion model more comprehensively. According to the grade standard of valley area precipitation, light precipitation, moderate precipitation and heavy precipitation refer to 24-h station precipitations of 0.1~10 mm/d, 10~25 mm/d and 25~50 mm/d, respectively. In this study, the total number of days with light precipitation, moderate precipitation, heavy precipitation and above heavy precipitation at all stations are 54,911, 16,917, 4585 and 728, respectively. Table 3 shows the errors of the original precipitation products and merged precipitation at all stations at different precipitation intensities.
According to the changes in the indices from Table 3, it can be found that the accuracy of the three original precipitation products decreases with the increase in precipitation intensity. When the precipitation intensity is light, IMERG has the highest accuracy and the best precipitation detection performance. However, ERA5 has a large error, which may be because it tends to overestimate weak precipitation [1]. At an intensity of 10~50 mm/day, IMERG’s CC is higher than for ERA5, while its RMSE and MAE are higher than for ERA5 and its CSI is lower than for ERA5. This indicates that ERA5 is better than IMERG in detecting moderate or heavy precipitation. In addition, it is worth noting that when the precipitation intensity is more than 25 mm/day, CHIRPS’s CC and CSI are both less than 0.1. This indicates that CHIRPS has a weak ability to capture heavy precipitation, which is similar to the conclusion of Bai et al. [71]. When the precipitation intensity exceeds 50 mm/d, all precipitation products’ CCs are less than 0, the CSIs are less than 0.01, and the RMSEs and MAEs are more than 50 mm/d, which indicates that original precipitation products are less capable of capturing rainstorm in the Yalong River. This greatly limits their ability to detect extreme precipitation. From the comparison of indices with a precipitation intensity of more than 0.1 mm/day, the overall accuracy of IMERG is slightly better than that of ERA5 and CHIRPS.
After multi-source precipitation fusion by A-ConvLSTM, the correlation coefficient of the merged precipitation is increased, the error is reduced and the probability of successful detection is improved under different precipitation intensities. For example, compared with IMERG, MAE decreases by 1, 4.39, 14.32 and 28.6, and CSI increases by 0.107, 0.377, 0.469 and 0.366 when the precipitation intensities are light precipitation, moderate precipitation, heavy precipitation and above. When the precipitation intensity exceeds 50 mm/day, the merged precipitation’s CC increases from −0.026 to 0.109, its CSI increases from 0.001 to 0.367, its RMSE decreases from 56.19 to 37.6, and its MAE decreases from 52.67 to 25.95. Therefore, merged precipitation has a certain ability to detect extreme precipitation. On the whole, it can be concluded that the A-ConvLSTM precipitation fusion model can correct and improve the original precipitation product data, and merged precipitation can reflect the intensity and spatial distribution characteristics of regional precipitation more accurately.
3.3. Application of Merged Precipitation in Streamflow Simulation
Precipitation is an important component of the water cycle and plays a critical role in streamflow simulations. Most of the existing hydrological models describe the process of precipitation forming a watershed streamflow through simulation methods. Thus, in this study, five main hydrological control stations, including Ganzi, Yajiang, Maidilong, Jinping and Tongzilin at the mainstream of the Yalong River, were used for streamflow simulation. Their daily average restored streamflow series from 2011 to 2020 were collected to evaluate the applicability of merged precipitation. Among them, 2011 was used as the warm-up period, 2012~2017 as the calibration period and 2018~2020 as the verification period. Table 4 shows the verification results of the hydrological models at each station.
It can be preliminarily determined from Table 4 that except for Ganzi Station, all models achieved good results in the streamflow simulation at each station, with an NSE of more than 0.85, a CC of more than 0.9, and an MRE of less than 0.2. Snowfall is an important component of precipitation in the upper Yalong River, resulting in a certain proportion of snowmelt production in the multi-year runoff [73]. Because the merged precipitation may have insufficient detection capability for snowfall and hydrological models cannot adequately reflect the process of snowmelt production, the runoff simulation error at Ganzi station is large. However, its NSEs are all above 0.7, its CCs are above 0.9 and its RMSEs are below 200, which indicates that the dispersion between simulated and observed streamflow is small. Thus, the simulated results of Ganzi station can still reflect the trend of the observed streamflow. In general, merged precipitation has good applicability in streamflow simulation and can be used in hydrological forecasting to guide water resources management and allocation.
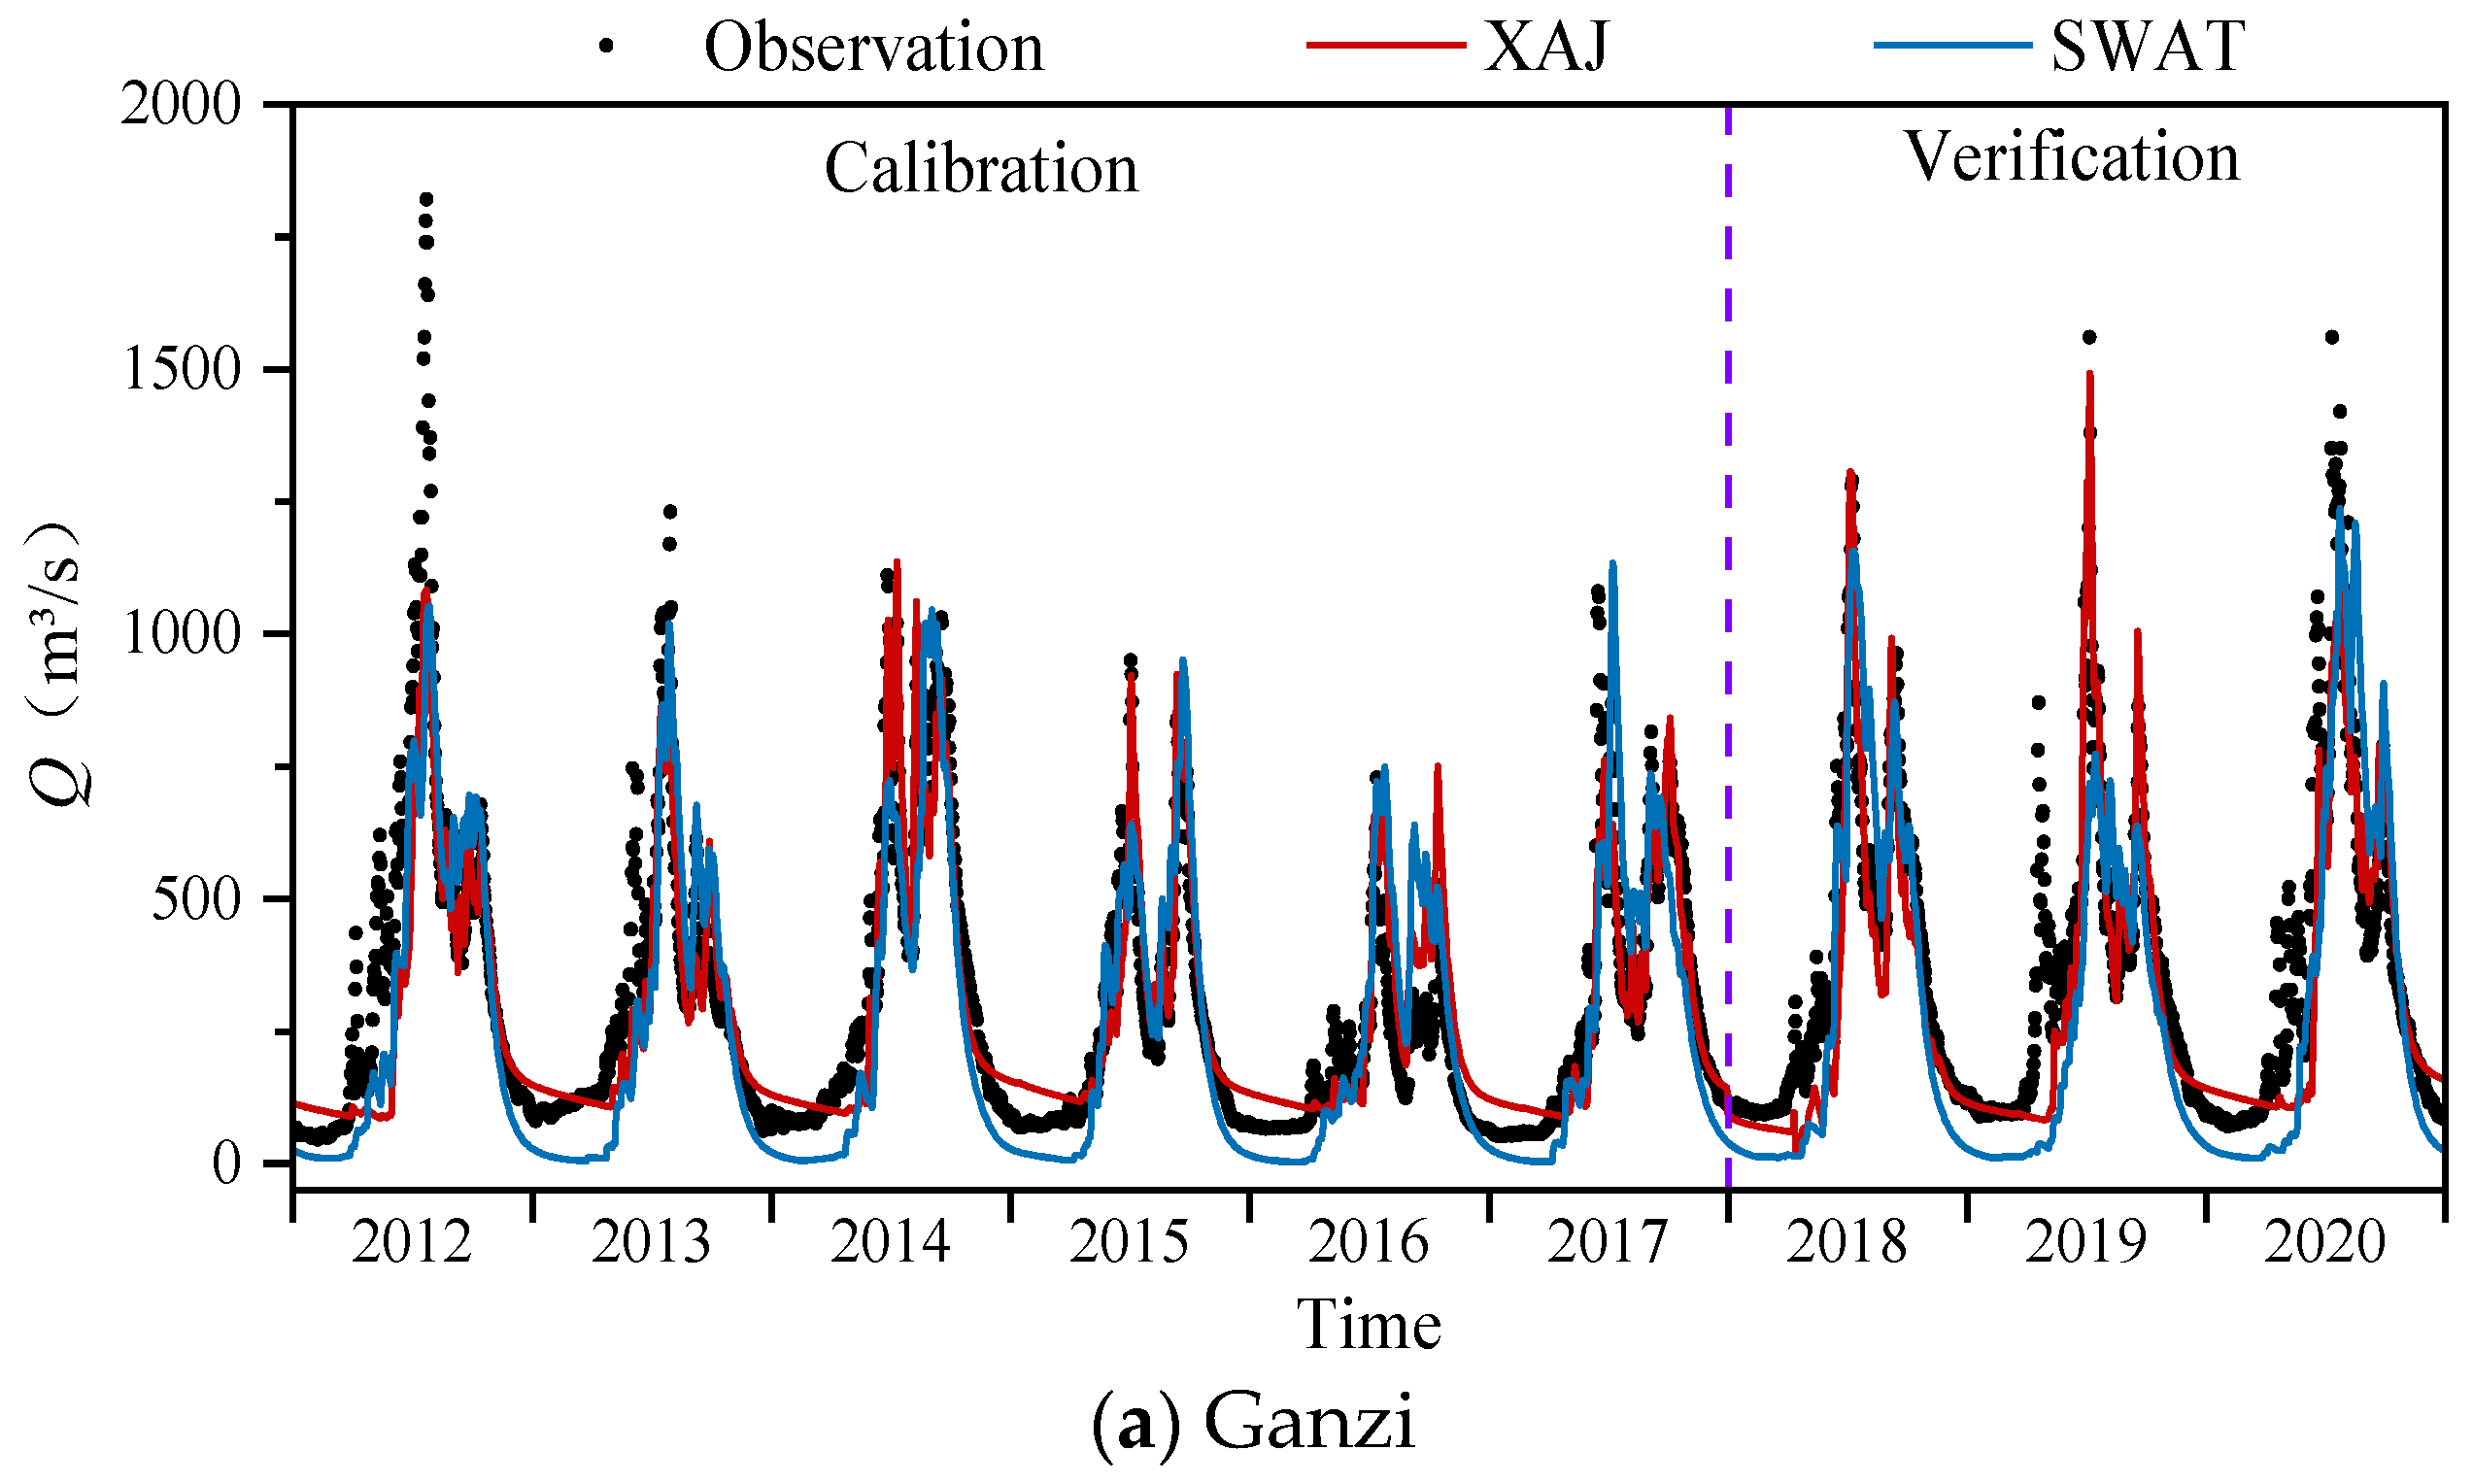
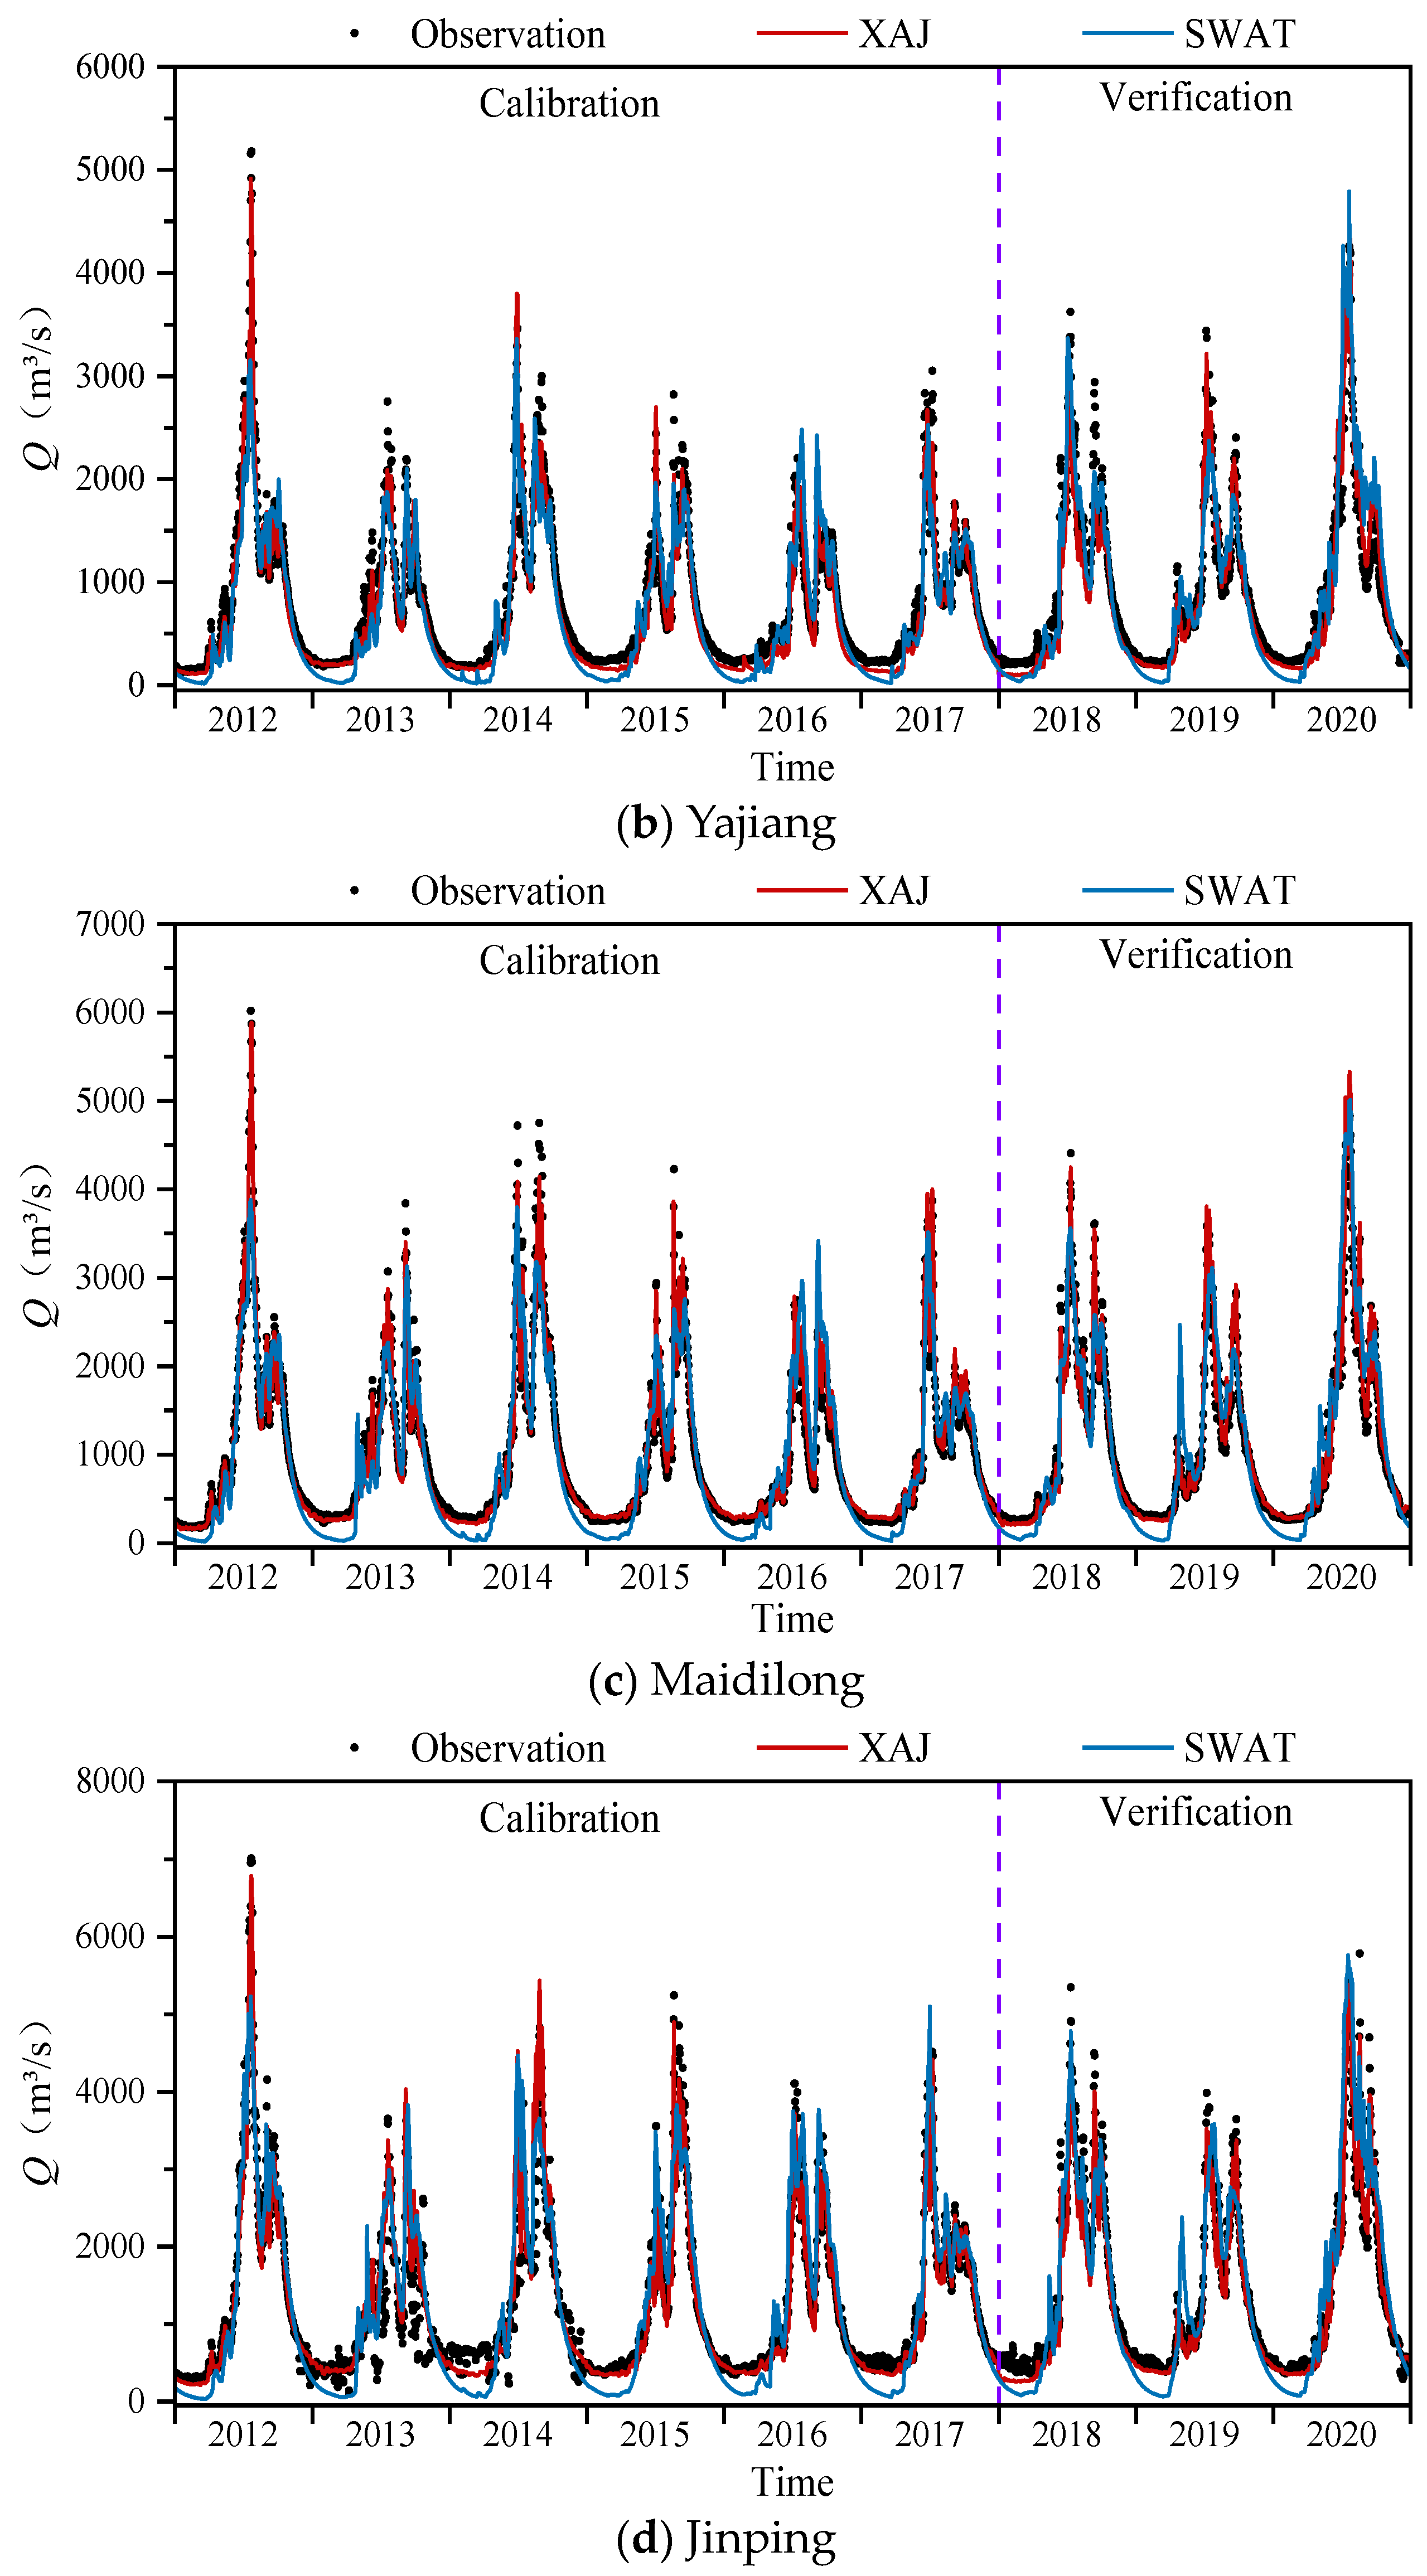
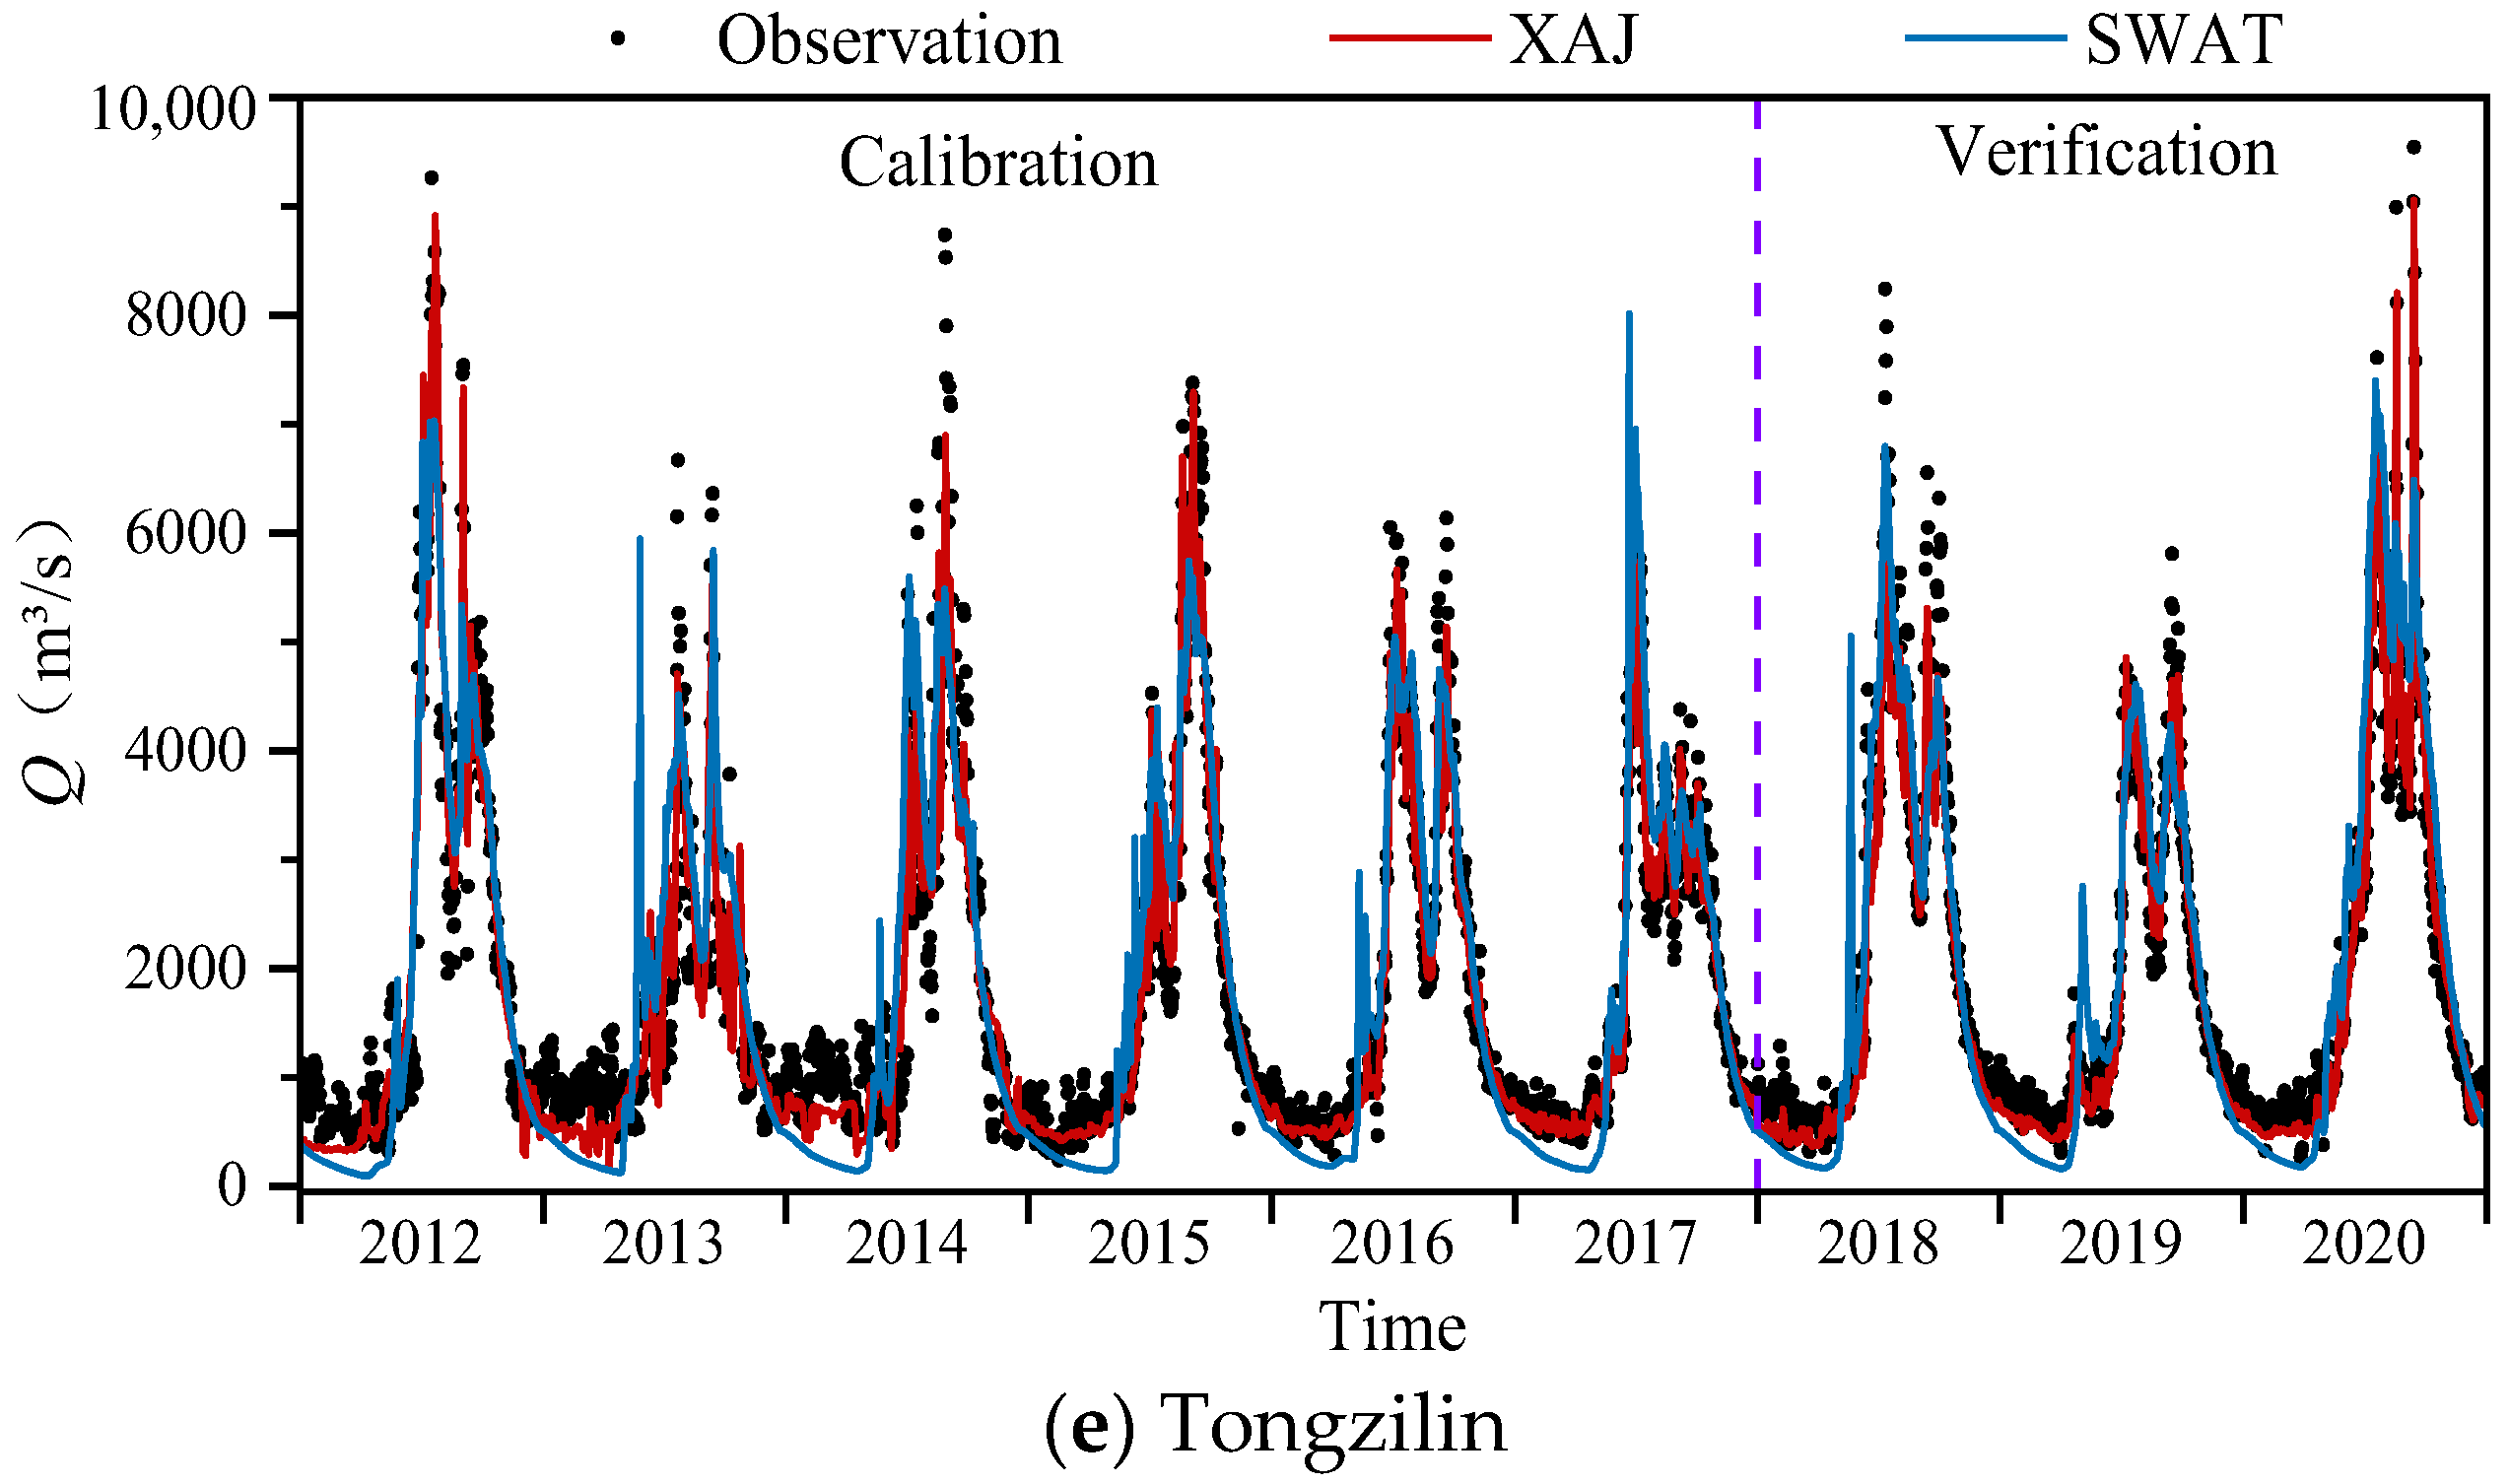
To visually evaluate and analyze the applicability of merged precipitation for streamflow simulation, the daily streamflow processes at five hydrological stations in the Yalong River are simulated by two hydrological models. The simulation results are shown in Figure 11.
As shown in Figure 11, the simulated streamflow’s overall trends are consistent with the observed streamflow at each station, which highlights the main features of the observed streamflow. The simulated streamflow based on merged precipitation fits well with the observed streamflow peak, but there is an underestimation, especially at the Ganzi station. The flood characteristics of the Yalong River are characterized by a high peak, small volume and short duration. Thus, the accurate detection of the strong precipitation values helps to accurately simulate the flooding process. Though merged precipitation makes some corrections to the strong precipitation, it still underestimates the strong precipitation, leading to an underestimation of the streamflow peak. Especially in the upper Yalong River, the simulation is poor in some years at the Ganzi station because of fewer ground stations and the insufficient ability of merged precipitation to estimate snowfall, which affects the overall accuracy. However, the simulated streamflow can still represent the trend of the observed streamflow well and has the feasibility of an application.
In addition, it can be inferred from Table 4 and Figure 11 that the overall simulation results of XAJ are better than that of SWAT. This may be due to the complex structure of SWAT, which needs to consider many variables such as solar radiation, temperature and land use type, resulting in the superposition of various errors when the model parameters are optimized [74]. The XAJ model has a simple structure, requiring only precipitation and evaporation as input data, with less uncertainty in the inputs and parameters than SWAT. Nevertheless, as a kind of distributed hydrological model, SWAT can describe the water flow movement and its changing rules in a more detailed and comprehensive way based on physical equations, which represents the frontier of hydrological modeling research.
In summary, combined with the daily streamflow simulation evaluation indices and streamflow fitting diagram, it can be concluded that merged precipitation has good applicability in the Yalong River and can be applied to hydrological forecasting.
4. Conclusions
High-precision precipitation estimates with a high spatiotemporal resolution can effectively reflect the spatial and temporal distribution of a water cycle in a basin, which can guide scientific management and the allocation of water resources. This study focuses on using deep learning models to merge multi-source precipitation products with environmental variables to improve the spatiotemporal accuracy of precipitation in high-altitude areas. Thus, a multi-source precipitation spatiotemporal fusion model is proposed by coupling the attention mechanism and ConvLSTM, and the accuracy and applicability of the merged precipitation are evaluated from some perspectives. The main conclusions are as follows:
(1) The A-ConvLSTM model outperforms the comparison models (MLR, SVR, LSTM, GRU and ConvLSTM) and can effectively improve the precipitation estimation of the three precipitation products in time and space. Meanwhile, the merged precipitation correlates well with the ground observation precipitation with high consistency.
(2) The A-ConvLSTM model can correct and improve the original precipitation product data under different precipitation intensities and enhance the ability to detect strong precipitation but still underestimate its value.
(3) The streamflow simulation validation based on XAJ and SWAT models shows that the merged precipitation obtained by A-ConvLSTM can be applied to hydrological forecasting, indicating that merged precipitation has the potential to be extended for application in areas with no or little data.
This study proposes a useful method to improve the spatiotemporal accuracy of precipitation in high-altitude areas by exploring the spatiotemporal correlation between the original precipitation products and ground observation precipitation. However, it is undeniable that there is still room to improve the accuracy of merged precipitation, especially the detection of high-intensity precipitation, due to the small number of ground precipitation monitoring stations caused by the topography. With the further increase in ground stations in the future, the proposed model can be validated and applied to different regions.
Author Contributions
All authors contributed significantly to this manuscript. W.F.: writing—original draft preparation, software.; H.Q.: writing—review and editing, resources, funding acquisition.; G.L.: methodology.; X.Y.: investigation.; Z.X.: supervision. B.J.: data curation; Q.Z.: drawings. All authors have read and agreed to the published version of the manuscript.
Funding
This study was supported by the National Key Research and Development Program of China (2021YFC3200303) and the National Natural Science Foundation of China (52039004, 51979113).
Acknowledgments
The authors would like to thank Yalong River Hydropower Development Co., Ltd., China Meteorological DataService Center, the National Climate Center of China Meteorological Administration, NASA, JAXA, USGS, the University of California, Santa Barbara and ECMWF for providing the basic data.
Conflicts of Interest
The authors declare no conflict of interest.
References
- Zhao, Y.; Xu, K.; Dong, N.; Wang, H. Optimally Integrating Multi-Source Products for Improving Long Series Precipitation Precision by Using Machine Learning Methods. J. Hydrol. 2022, 609, 127707. [Google Scholar] [CrossRef]
- Zhang, Y.; Ye, A.; Nguyen, P.; Analui, B.; Sorooshian, S.; Hsu, K. Error Characteristics and Scale Dependence of Current Satellite Precipitation Estimates Products in Hydrological Modeling. Remote Sens. 2021, 13, 3061. [Google Scholar] [CrossRef]
- Lei, X.; Hao, W.; Liao, W.; Yang, M.; Gui, Z. Advances in Hydro-Meteorological Forecast under Changing Environment. J. Hydraul. Eng. 2018, 49, 9–18. [Google Scholar]
- Xu, L.; Chen, N.; Moradkhani, H.; Zhang, X.; Hu, C. Improving Global Monthly and Daily Precipitation Estimation by Fusing Gauge Observations, Remote Sensing, and Reanalysis Data Sets. Water Resour. Res. 2020, 56, e2019WR026444. [Google Scholar] [CrossRef]
- Aghakouchak, A.; Chiang, F.; Huning, L.S.; Love, C.A.; Mallakpour, I.; Mazdiyasni, O.; Moftakhari, H.; Papalexiou, S.M.; Ragno, E.; Sadegh, M. Climate Extremes and Compound Hazards in a Warming World. Annu. Rev. Earth Planet. Sci. 2020, 48, 519–548. [Google Scholar] [CrossRef]
- Wang, G.; Zhang, Q.; Yu, H.; Shen, Z.; Sun, P. Double Increase in Precipitation Extremes across China in a 1.5 °C/2.0 °C Warmer Climate. Sci. Total Environ. 2020, 746, 140807. [Google Scholar] [CrossRef]
- Zhou, Z.; Xie, S.; Zhang, R. Historic Yangtze Flooding of 2020 Tied to Extreme Indian Ocean Conditions. Proc. Natl. Acad. Sci. USA 2021, 118, e2022255118. [Google Scholar] [CrossRef]
- Wang, L.; Hoang, D.V.; Liou, Y.A. Quantifying the Impacts of the 2020 Flood on Crop Production and Food Security in the Middle Reaches of the Yangtze River, China. Remote Sens. 2022, 14, 3140. [Google Scholar] [CrossRef]
- Xia, J.; Chen, J.; She, D. Impacts and Countermeasures of Extreme Drought in the Yangtze River Basin in 2022. J. Hydraul. Eng. 2022, 53, 1143–1153. [Google Scholar]
- Zhang, Z.; Wang, D.; Qiu, J.; Zhu, J.; Wang, T. Machine Learning Approaches for Improving Near-Real-Time IMERG Rainfall Estimates by Integrating Cloud Properties from NOAA CDR PATMOS-X. J. Hydrometeorol. 2021, 22, 2767–2781. [Google Scholar] [CrossRef]
- Chen, Y.; Huang, J.; Song, X.; Wen, H.; Song, H. Evaluation of the Impacts of Rain Gauge Density and Distribution on Gauge-Satellite Merged Precipitation Estimates. IEEE Trans. Geosci. Remote Sens. 2022, 60, 4100218. [Google Scholar] [CrossRef]
- Wu, H.; Yang, Q.; Liu, J.; Wang, G. A Spatiotemporal Deep Fusion Model for Merging Satellite and Gauge Precipitation in China. J. Hydrol. 2020, 584, 124664. [Google Scholar] [CrossRef]
- Maggioni, V.; Massari, C.; States, U. On the Performance of Satellite Precipitation Products in Riverine Flood Modeling: A Review. J. Hydrol. 2018, 558, 214–224. [Google Scholar] [CrossRef]
- Jiang, S.; Ding, Y.; Liu, R.; Wei, L.; Liu, Y.; Ren, M.; Ren, L. Assessing the Potential of IMERG and TMPA Satellite Precipitation Products for Flood Simulations and Frequency Analyses over a Typical Humid Basin in South China. Remote Sens. 2022, 14, 4406. [Google Scholar] [CrossRef]
- Xiong, L.; Liu, C.; Chen, S.; Zha, X.; Ma, Q. Review of Post-Processing Research for Remote-Sensing Precipitation Products. Adv. Water Sci. 2021, 32, 627–637. [Google Scholar]
- Chen, C.; He, M.; Chen, Q.; Zhang, J.; Li, Z.; Wang, Z. Triple Collocation-Based Error Estimation and Data Fusion of Global Gridded Precipitation Products over the Yangtze River Basin. J. Hydrol. 2022, 605, 127307. [Google Scholar] [CrossRef]
- Shen, Y.; Hong, Z.; Pan, Y.; Yu, J.; Maguire, L. China’s 1 Km Merged Gauge, Radar and Satellite Experimental Precipitation Dataset. Remote Sens. 2018, 10, 264. [Google Scholar] [CrossRef]
- Yin, J.; Guo, S.; Gu, L.; Zeng, Z.; Liu, D.; Chen, J.; Shen, Y. Blending Multi-Satellite, Atmospheric Reanalysis and Gauge Precipitation Products to Facilitate Hydrological Modelling. J. Hydrol. 2021, 593, 125878. [Google Scholar] [CrossRef]
- Tang, G.; Clark, M.P.; Michael, S.; Ma, Z.; Hong, Y. Have Satellite Precipitation Products Improved over Last Two Decades? A Comprehensive Comparison of GPM IMERG with Nine Satellite and Reanalysis Datasets. Remote Sens. Environ. 2020, 240, 111697. [Google Scholar] [CrossRef]
- He, Q.; Yang, J.; Chen, H.; Liu, J.; Ji, Q.; Wang, Y.; Tang, F. Evaluation of Extreme Precipitation Based on Three Long-Term Gridded Products over the Qinghai-Tibet Plateau. Remote Sens. 2021, 13, 3010. [Google Scholar] [CrossRef]
- Yin, J.; Guo, S.; Wang, J.; Zhu, Q.; Zeng, Q.; Liu, H. Blending Multi-Source Data in Hydrological Simulations Based on BMA Method. J. Hydraul. Eng. 2020, 51, 1335–1346. [Google Scholar] [CrossRef]
- Sun, Q.; Miao, C.; Duan, Q.; Ashouri, H.; Sorooshian, S.; Hsu, K.-L. A Review of Global Precipitation Data Sets: Data Sources, Estimation, and Intercomparisons. Rev. Geophys. 2018, 56, 79–107. [Google Scholar] [CrossRef]
- Li, C.; Tang, G.; Hong, Y. Cross-Evaluation of Ground-Based, Multi-Satellite and Reanalysis Precipitation Products: Applicability of the Triple Collocation Method across Mainland China Changming. J. Hydrol. 2018, 562, 71–83. [Google Scholar] [CrossRef]
- Hersbach, H.; Bell, B.; Berrisford, P.; Hirahara, S.; Horányi, A.; Nicolas, J.; Peubey, C.; Radu, R.; Balsamo, G.; Bonavita, M.; et al. The ERA5 Global Reanalysis. Q. J. R. Meteorol. Soc. 2020, 146, 1999–2049. [Google Scholar] [CrossRef]
- Jiang, Q.; Li, W.; Fan, Z.; He, X.; Sun, W.; Chen, S.; Wen, J.; Gao, J.; Wang, J. Evaluation of the ERA5 Reanalysis Precipitation Dataset over Chinese Mainland. J. Hydrol. 2021, 595, 125660. [Google Scholar] [CrossRef]
- Zhu, S.; Ma, Z.; Xu, J.; He, K.; Liu, H.; Ji, Q.; Tang, G.; Hu, H.; Gao, H. A Morphology-Based Adaptively Spatio-Temporal Merging Algorithm for Optimally Combining Multisource Gridded Precipitation Products. IEEE Trans. Geosci. Remote Sens. 2022, 60, 4103221. [Google Scholar] [CrossRef]
- Beck, H.E.; Wood, E.F.; Pan, M.; Fisher, C.K.; Miralles, D.G.; van Dijk, A.I.J.M.; McVicar, T.R.; Adler, R.F. MSWEP V2 Global 3-Hourly 0.1° Precipitation Methodology and Quantitative Assessment. Bull. Am. Meteorol. Soc. 2019, 100, 473–502. [Google Scholar] [CrossRef]
- Li, Y.; Wang, W.; Wang, G. Evaluation and Hydrological Application of a Data Fusing Method of Multi-Source Precipitation Products-A Case Study over Tuojiang River Basin. Remote Sens. 2021, 13, 2630. [Google Scholar] [CrossRef]
- Arshad, A.; Zhang, W.; Zhang, Z.; Wang, S.; Zhang, B.; Jehanzeb, M.; Cheema, M.; Jafari, M. Reconstructing High-Resolution Gridded Precipitation Data Using an Improved Downscaling Approach over the High Altitude Mountain Regions of Upper Indus Basin (UIB). Sci. Total Environ. 2021, 784, 147140. [Google Scholar] [CrossRef]
- Chen, S.; Xiong, L.; Ma, Q.; Kim, J.S.; Chen, J.; Xu, C.Y. Improving Daily Spatial Precipitation Estimates by Merging Gauge Observation with Multiple Satellite-Based Precipitation Products Based on the Geographically Weighted Ridge Regression Method. J. Hydrol. 2020, 589, 125156. [Google Scholar] [CrossRef]
- Grimes, D.I.F.; Pardo-Iguzquiza, E.; Bonifacio, R. Optimal Areal Rainfall Estimation Using Raingauges and Satellite Data. J. Hydrol. 1999, 222, 93–108. [Google Scholar] [CrossRef]
- Chao, L.; Zhang, K.; Li, Z.; Zhu, Y.; Wang, J.; Yu, Z. Geographically Weighted Regression Based Methods for Merging Satellite and Gauge Precipitation. J. Hydrol. 2018, 558, 275–289. [Google Scholar] [CrossRef]
- Lu, X.; Tang, G.; Wang, X.; Liu, Y.; Ming, W.; Zhang, Y. The Development of a Two-Step Merging and Downscaling Method for Satellite Precipitation Products. Remote Sens. 2020, 12, 398. [Google Scholar] [CrossRef]
- Tang, X.; Yin, Z.; Qin, G.; Guo, L.; Li, H. Integration of Satellite Precipitation Data and Deep Learning for Improving Flash Flood Simulation in a Poor-Gauged Mountainous Catchment. Remote Sens. 2021, 13, 5083. [Google Scholar] [CrossRef]
- Baez-Villanueva, O.M.; Zambrano-Bigiarini, M.; Beck, H.E.; McNamara, I.; Ribbe, L.; Nauditt, A.; Birkel, C.; Verbist, K.; Giraldo-Osorio, J.D.; Xuan Thinh, N. RF-MEP: A Novel Random Forest Method for Merging Gridded Precipitation Products and Ground-Based Measurements. Remote Sens. Environ. 2020, 239, 111606. [Google Scholar] [CrossRef]
- Zhang, L.; Li, X.; Zheng, D.; Zhang, K.; Ma, Q.; Zhao, Y. Merging Multiple Satellite-Based Precipitation Products and Gauge Observations Using a Novel Double Machine Learning Approach. J. Hydrol. 2021, 594, 125969. [Google Scholar] [CrossRef]
- Kolluru, V.; Kolluru, S.; Wagle, N.; Acharya, T.D. Secondary Precipitation Estimate Merging Using Machine Learning: Development and Evaluation over Krishna River Basin, India. Remote Sens. 2020, 12, 3013. [Google Scholar] [CrossRef]
- Zhang, J.; Ruan, H.; Xu, J.; Dai, X.; Zheng, Y.; Zhang, J. An XGBoost-Merging Method for High-Resolution Daily Precipitation Estimation for a Regional Rainstorm Event. Trop. Geogr. 2021, 41, 845–856. [Google Scholar]
- Morales, A.; Posselt, D.J.; Morrison, H.; He, F. Assessing the Influence of Microphysical and Environmental Parameter Perturbations on Orographic Precipitation. J. Atmos. Sci. 2019, 76, 1373–1395. [Google Scholar] [CrossRef]
- Berg, P.; Moseley, C.; Haerter, J.O. Strong Increase in Convective Precipitation in Response to Higher Temperatures. Nat. Geosci. 2013, 6, 181–185. [Google Scholar] [CrossRef]
- Purr, C.; Brisson, E.; Schlünzen, K.H.; Ahrens, B. Convective Rain Cell Properties and the Resulting Precipitation Scaling in a Warm-Temperate Climate. Q. J. R. Meteorol. Soc. 2022, 148, 1768–1781. [Google Scholar] [CrossRef]
- Fang, J.; Du, J.; Xu, W.; Shi, P.; Li, M.; Ming, X. Spatial Downscaling of TRMM Precipitation Data Based on the Orographical Effect and Meteorological Conditions in a Mountainous Area. Adv. Water Resour. 2013, 61, 42–50. [Google Scholar] [CrossRef]
- Jia, S.; Zhu, W.; Aifeng, L.; Yan, T. A Statistical Spatial Downscaling Algorithm of TRMM Precipitation Based on NDVI and DEM in the Qaidam Basin of China. Remote Sens. Environ. 2011, 115, 3069–3079. [Google Scholar] [CrossRef]
- Hong, Z.; Han, Z.; Li, X.; Long, D.; Tang, G.; Wang, J. Generation of an Improved Precipitation Dataset from Multisource Information over the Tibetan Plateau. J. Hydrometeorol. 2021, 22, 1275–1295. [Google Scholar] [CrossRef]
- Jing, W.; Yang, Y.; Yue, X.; Zhao, X. A Spatial Downscaling Algorithm for Satellite-Based Precipitation over the Tibetan Plateau Based on NDVI, DEM, and Land Surface Temperature. Remote Sens. 2016, 8, 655. [Google Scholar] [CrossRef]
- Silver, M.; Svoray, T.; Karnieli, A.; Fredj, E. Improving Weather Radar Precipitation Maps: A Fuzzy Logic Approach. Atmos. Res. 2020, 234, 104710. [Google Scholar] [CrossRef]
- Chen, Y.; Huang, J.; Sheng, S.; Mansaray, L.R. A New Downscaling-Integration Framework for High-Resolution Monthly Precipitation Estimates: Combining Rain Gauge Observations, Satellite- Derived Precipitation Data and Geographical Ancillary Data. Remote Sens. Environ. 2018, 214, 154–172. [Google Scholar] [CrossRef]
- Yi, P.; Wang, Z.; Jiang, K. Multi-Temporal Ultra Dense Memory Network for Video Super-Resolution. IEEE Trans. Circuits Syst. Video Technol. 2020, 30, 2503–2516. [Google Scholar] [CrossRef]
- Liu, J.; Ding, H.; Shahroudy, A.; Duan, L.; Jiang, X.; Member, S.; Wang, G.; Member, S.; Kot, A.C. Feature Boosting Network For 3D Pose Estimation. IEEE Trans. Pattern Anal. Mach. Intell. 2020, 42, 494–501. [Google Scholar] [CrossRef]
- Shi, X.; Chen, Z.; Wang, H. Convolutional LSTM Network: A Machine Learning Approach for Precipitation Nowcasting. In Proceedings of the 29th Annual Conference on Neural Information Processing Systems, Montreal, QC, Canada, 7–12 December 2015; pp. 1–9. [Google Scholar]
- Chen, S.; Xu, X.; Zhang, Y.; Shao, D.; Zhang, S.; Zeng, M. Two-Stream Convolutional LSTM for Precipitation Nowcasting Precipitation Forecast Method Based on Radar Extrapolation. Neural Comput. Appl. 2022, 34, 13281–13290. [Google Scholar] [CrossRef]
- Liu, Y.; Hou, G.; Huang, F.; Qin, H.; Wang, B.; Yi, L. Directed Graph Deep Neural Network for Multi-Step Daily Streamflow Forecasting. J. Hydrol. 2022, 607, 127515. [Google Scholar] [CrossRef]
- Yang, M.; Jiang, Y.; Wang, Z.; Wang, H. Building and Application of WRF Model in Yalong River Basin. J. Tianjin Univ. Technol. 2016, 49, 349–354. [Google Scholar] [CrossRef]
- Yuan, D.; Ai, P.; Hong, M.; Liao, H.; Chen, B.; Yue, Z. Estimation of Areal Rainfall in Yalong River Basin Based on Geospatial Factors. Adv. Water Sci. 2018, 29, 779–787. [Google Scholar]
- Liu, J.; Wei, R.; Zhang, T.; Zhang, Q.; Liu, Y. Spatial and Temporal Evolution Characteristics of Dry and Wet Condition in Yalongjiang River Basin Based on the Chirps Satellite Precipitation. Resour. Environ. Yangtze Basin 2020, 29, 1800–1811. [Google Scholar]
- Zhao, Y.; Dong, N.; Wang, H. Quantifying the Climate and Human Impacts on the Hydrology of the Yalong River Basin Using Two Approaches. River Res. Appl. 2021, 37, 591–604. [Google Scholar] [CrossRef]
- Chen, X.; Zhong, R.; Wang, Z.; Lai, C.; Chen, J. Evaluation on the Accuracy and Hydrological Performance of the Latest-Generation GPM IMERG Product over South China. J. Hydraul. Eng. 2017, 48, 1147–1156. [Google Scholar]
- Gavahi, K.; Abbaszadeh, P.; Moradkhani, H. How Does Precipitation Data in Fl Uence the Land Surface Data Assimilation for Drought Monitoring? Sci. Total Environ. 2022, 831, 154916. [Google Scholar] [CrossRef]
- Huang, C.; Hu, J.; Chen, S.; Zhang, A.; Liang, Z.; Tong, X.; Xiao, L.; Min, C.; Zhang, Z. How Well Can IMERG Products Capture Typhoon Extreme Precipitation Events over Southern China? Remote Sens. 2019, 11, 70. [Google Scholar] [CrossRef]
- Zhou, C.; Gao, W.; Hu, J.; Du, L.; Du, L. Capability of IMERG V6 Early, Late, and Final Precipitation Products for Monitoring Extreme Precipitation Events. Remote Sens. 2021, 13, 689. [Google Scholar] [CrossRef]
- Guo, J.; Ding, G.; Yang, X.; Tang, Z.; Zhang, H.; Pan, R.; Dai, L. Comparison of Temporal and Spatial Accuracy of Precipitation Products from Multi-Source Satellites in the Yangtze River Basin. South-to-North Water Transf. Water Sci. Technol. 2022, 20, 230–252. [Google Scholar]
- Funk, C.; Peterson, P.; Landsfeld, M.; Pedreros, D.; Verdin, J.; Shukla, S.; Husak, G.; Rowland, J.; Harrison, L.; Hoell, A.; et al. The Climate Hazards Infrared Precipitation with Stations—A New Environmental Record for Monitoring Extremes. Sci. Data 2015, 2, 150066. [Google Scholar] [CrossRef]
- Ebrahimi-Khusfi, Z.; Mirakbari, M.; Khosroshahi, M. Vegetation Response to Changes in Temperature, Rainfall, and Dust in Arid Environments. Environ. Monit. Assess. 2020, 192, 691. [Google Scholar] [CrossRef]
- Vaswani, A.; Shazeer, N.; Parmar, N.; Uszkoreit, J.; Jones, L.; Gomez, A.N.; Kaiser, Ł.; Polosukhin, I. Attention Is All You Need. In Proceedings of the 31st Annual Conference on Neural Information Processing Systems, Long Beach, CA, USA, 4–9 December 2017; Volume 30, pp. 1–15. [Google Scholar]
- Zhang, Z.; Qin, H.; Li, J.; Liu, Y.; Yao, L.; Wang, Y.; Wang, C.; Pei, S.; Li, P.; Zhou, J. Operation Rule Extraction Based on Deep Learning Model with Attention Mechanism for Wind-Solar-Hydro Hybrid System under Multiple Uncertainties. Renew. Energy 2021, 170, 92–106. [Google Scholar] [CrossRef]
- Cheng, Z.; Qi, H.; Wei, S.; Zengzhou, H.; Dongmei, H.; Zeyu, H. Regional Sea Surface Temperature Prediction Algorithm Combined with Attention Mechanism. Mar. Sci. Bull. 2020, 39, 191–199. [Google Scholar]
- Xu, R.; Tian, F.; Yang, L.; Hu, H.; Lu, H.; Hou, A. Ground Validation of GPM IMERG and Trmm 3B42V7 Rainfall Products over Southern Tibetan Plateau Based on a High-Density Rain Gauge Network. J. Geophys. Res. 2017, 122, 910–924. [Google Scholar] [CrossRef]
- Fang, J.; Yang, W.; Luan, Y.; Du, J.; Lin, A.; Zhao, L. Evaluation of the TRMM 3B42 and GPM IMERG Products for Extreme Precipitation Analysis over China. Atmos. Res. 2019, 223, 24–38. [Google Scholar] [CrossRef]
- Navarro, A.; García-Ortega, E.; Merino, A.; Sánchez, J.L.; Tapiador, F.J. Orographic Biases in IMERG Precipitation Estimates in the Ebro River Basin (Spain): The Effects of Rain Gauge Density and Altitude. Atmos. Res. 2020, 244, 105068. [Google Scholar] [CrossRef]
- Prakash, S.; Mitra, A.K.; Pai, D.S.; AghaKouchak, A. From TRMM to GPM: How Well Can Heavy Rainfall Be Detected from Space? Adv. Water Resour. 2016, 88, 1–7. [Google Scholar] [CrossRef]
- Bai, L.; Shi, C.; Li, L.; Yang, Y.; Wu, J. Accuracy of CHIRPS Satellite-Rainfall Products over Mainland China. Remote Sens. 2018, 10. [Google Scholar] [CrossRef]
- Shen, Z.; Yong, B.; Gourley, J.J.; Qi, W.; Lu, D.; Liu, J.; Ren, L.; Hong, Y.; Zhang, J. Recent Global Performance of the Climate Hazards Group Infrared Precipitation (CHIRP) with Stations (CHIRPS). J. Hydrol. 2020, 591, 125284. [Google Scholar] [CrossRef]
- Huang, Y.; Hongli, Z.; Yunzhong, J.; Lu, X. Runoff and Its Influencing Factors in the Upper Reaches of the Yalong River. Arid Land Geogr. 2018, 41, 126–133. [Google Scholar] [CrossRef]
- Peng, D.; Zhijia, L. Comparison of Three Hydrological Models in Flood Simulation for Xixian Basin of Huaihe River. J. Hohai Univ. Sci. 2013, 41, 377–382. [Google Scholar]
Figure 1.
Terrain and station distribution in the Yalong River.

Figure 2.
Flowchart of multi-source precipitation spatiotemporal fusion method based on attention mechanism and ConvLSTM.
Figure 2.
Flowchart of multi-source precipitation spatiotemporal fusion method based on attention mechanism and ConvLSTM.

Figure 3.
Diagram of sub-grid data extraction.

Figure 4.
Network structure of attention mechanism.

Figure 5.
Internal detailed structure of ConvLSTM.

Figure 6.
The structure of the A-ConvLSTM model.

Figure 7.
Optimal results of each model under different sub-grid numbers.

Figure 8.
Correlation coefficient (CC) for different models.

Figure 9.
Root mean square error (RMSE) for different models.

Figure 10.
Average absolute error (MAE) for different models.

Figure 11.
Daily streamflow simulation at five hydrological stations with two hydrological models.


Table 1.
Basic information of data used.
| Name | Spatial Resolution | Temporal Resolution | Source |
|---|---|---|---|
| Precipitation from precipitation station | \ | 1 d | Yalong River Hydropower Development Co., Ltd., China |
| Precipitation from meteorologic station | \ | 1 d | http://data.cma.cn/data/cdcdetail/dataCode/SURF_CLI_CHN_MUL_DAY_V3.0 (accessed on 1 July 2023) |
| Streamflow from hydrological station | \ | 1 d | Yalong River Hydropower Development Co., Ltd., China |
| IMERG | 0.1° | 1 d | https://disc.gsfc.nasa.gov/datasets/GPM_3IMERGDF_06/summary (accessed on 1 July 2023) |
| CHIRPS | 0.05° | 1 d | https://data.chc.ucsb.edu/products/CHIRPS-2.0/ (accessed on 1 July 2023) |
| ERA5 | 0.1° | 1 h | https://cds.climate.copernicus.eu/cdsapp#!/dataset/reanalysis-era5-land?tab=form (accessed on 1 July 2023) |
| NDVI | 0.05° | 16 d | https://search.earthdata.nasa.gov/ (accessed on 1 July 2023) |
| DEM | 90 m | \ | http://www.gscloud.cn/sources/accessdata/305?pid=302 (accessed on 1 July 2023) |
Table 2.
Accuracy of different precipitation fusion models.
| Model | CC | RMSE (mm/d) | MAE (mm/d) |
|---|---|---|---|
| IMERG | 0.452 | 6.11 | 2.64 |
| ERA5 | 0.390 | 7.01 | 3.83 |
| CHIRPS | 0.383 | 6.31 | 2.88 |
| MLR | 0.714 | 4.74 | 1.99 |
| SVR | 0.720 | 4.81 | 1.68 |
| LSTM | 0.746 | 4.51 | 1.85 |
| GRU | 0.747 | 4.53 | 1.87 |
| ConvLSTM | 0.791 | 4.17 | 1.71 |
| A-ConvLSTM | 0.853 | 3.53 | 1.33 |
Table 3.
Accuracy of original precipitation products and merged precipitation at different precipitation intensities.
Table 3.
Accuracy of original precipitation products and merged precipitation at different precipitation intensities.
| Precipitation (mm/Day) | Indices | IMERG | ERA5 | CHIRPS | A-ConvLSTM |
|---|---|---|---|---|---|
| light precipitation (0.1~10) | CC | 0.182 | 0.161 | 0.167 | 0.509 |
| RMSE (mm/d) | 4.85 | 7.03 | 4.4 | 3.19 | |
| MAE (mm/d) | 3.01 | 4.75 | 3.23 | 2.01 | |
| CSI | 0.320 | 0.237 | 0.277 | 0.427 | |
| moderate precipitation (10~25) | CC | 0.171 | 0.093 | 0.091 | 0.508 |
| RMSE (mm/d) | 9.83 | 8.73 | 10.61 | 6.05 | |
| MAE (mm/d) | 8.54 | 7.15 | 9.33 | 4.15 | |
| CSI | 0.137 | 0.158 | 0.113 | 0.514 | |
| heavy precipitation (25~50) | CC | 0.098 | 0.012 | 0.007 | 0.356 |
| RMSE (mm/d) | 24.53 | 23.08 | 26.78 | 13.33 | |
| MAE (mm/d) | 23.19 | 21.44 | 25.60 | 8.87 | |
| CSI | 0.015 | 0.025 | 0.001 | 0.485 | |
| above heavy precipitation (>50) | CC | −0.026 | −0.101 | −0.143 | 0.109 |
| RMSE (mm/d) | 57.75 | 56.19 | 60.70 | 37.60 | |
| MAE (mm/d) | 54.54 | 52.67 | 57.68 | 25.95 | |
| CSI | 0.001 | 0.001 | 0.000 | 0.367 | |
| total (>0.1) | CC | 0.363 | 0.241 | 0.236 | 0.807 |
| RMSE (mm/d) | 10.28 | 10.76 | 10.90 | 6.34 | |
| MAE (mm/d) | 5.97 | 6.80 | 6.53 | 3.18 | |
| CSI | 0.490 | 0.411 | 0.442 | 0.603 |
Table 4.
Accuracy of hydrological models at each station.
| Hydrologic Station | Hydrological Model | NSE | CC | MRE | RMSE (m3/s) |
|---|---|---|---|---|---|
| Ganzi | XAJ | 0.81 | 0.90 | 0.25 | 118.81 |
| SWAT | 0.73 | 0.90 | 0.33 | 152.83 | |
| Yajiang | XAJ | 0.94 | 0.98 | 0.12 | 175.43 |
| SWAT | 0.85 | 0.94 | 0.15 | 301.92 | |
| Maidilong | XAJ | 0.99 | 0.99 | 0.01 | 105.05 |
| SWAT | 0.87 | 0.95 | 0.08 | 338.24 | |
| Jinpin | XAJ | 0.94 | 0.97 | 0.11 | 267.72 |
| SWAT | 0.85 | 0.94 | 0.17 | 301.92 | |
| Tongzilin | XAJ | 0.94 | 0.97 | 0.10 | 410.77 |
| SWAT | 0.85 | 0.93 | 0.18 | 664.22 |
Disclaimer/Publisher’s Note: The statements, opinions and data contained in all publications are solely those of the individual author(s) and contributor(s) and not of MDPI and/or the editor(s). MDPI and/or the editor(s) disclaim responsibility for any injury to people or property resulting from any ideas, methods, instructions or products referred to in the content. |
© 2023 by the authors. Licensee MDPI, Basel, Switzerland. This article is an open access article distributed under the terms and conditions of the Creative Commons Attribution (CC BY) license (https://creativecommons.org/licenses/by/4.0/).
Share and Cite
MDPI and ACS Style
Fang, W.; Qin, H.; Liu, G.; Yang, X.; Xu, Z.; Jia, B.; Zhang, Q. A Method for Spatiotemporally Merging Multi-Source Precipitation Based on Deep Learning. Remote Sens. 2023, 15, 4160. https://doi.org/10.3390/rs15174160
AMA Style
Fang W, Qin H, Liu G, Yang X, Xu Z, Jia B, Zhang Q. A Method for Spatiotemporally Merging Multi-Source Precipitation Based on Deep Learning. Remote Sensing. 2023; 15(17):4160. https://doi.org/10.3390/rs15174160
Chicago/Turabian StyleFang, Wei, Hui Qin, Guanjun Liu, Xin Yang, Zhanxing Xu, Benjun Jia, and Qianyi Zhang. 2023. "A Method for Spatiotemporally Merging Multi-Source Precipitation Based on Deep Learning" Remote Sensing 15, no. 17: 4160. https://doi.org/10.3390/rs15174160
Note that from the first issue of 2016, this journal uses article numbers instead of page numbers. See further details here.