


Analysis of Soil Moisture Change Characteristics and Influencing Factors of Grassland on the Tibetan Plateau

1
Institute of Soil and Water Conservation, Chinese Academy of Sciences and Ministry of Water Resources, Xianyang 712100, China
2
College of Grassland Agriculture, Northwest Agriculture and Forestry University, Yangling 712100, China
*
Author to whom correspondence should be addressed.
Remote Sens. 2023, 15(2), 298; https://doi.org/10.3390/rs15020298
Submission received: 1 November 2022
/
Revised: 25 December 2022
/
Accepted: 27 December 2022
/
Published: 4 January 2023
(This article belongs to the Topic Water and Soil Management in Adaptation to Climate Change)
Abstract
:Soil moisture is an important component of the soil–vegetation–atmosphere terrestrial hydrological cycle and is an important factor affecting terrestrial ecosystems. In the context of extensive vegetation greening on the Tibetan Plateau (TP), it is important to investigate the effect of vegetation greening on soil moisture to maintain ecosystem stability and protect the sustainability of ecological restoration projects. To evaluate the effect of vegetation greening on soil moisture on the TP, the spatial distribution and trends of soil moisture and vegetation on the TP were analyzed using GIMMS NDVI data and ERA5 soil moisture data from 1982 to 2015. The effects of grassland NDVI, precipitation, and temperature on SM were also explored using multiple regression apparent and SEM. The main results are as follows: from 1982 to 2015, both grassland NDVI and SM showed a stable increasing trend. Precipitation was the most important factor influencing SM changes on the TP. In the context that vegetation greening is mainly influenced by temperature increase, vegetation plays a dominant role in SM changes in soil drying and soil wetting zones. In this paper, the climate–vegetation–soil moisture coupling mechanism of grasslands on the TP is investigated, and the related results can provide some theoretical references and suggestions for global ecosystem conservation and the sustainable development of ecological restoration projects.
1. Introduction
The global average surface temperature has continued to rise, and the warming of the Tibetan Plateau (TP) has become more pronounced. In recent decades, the rate of warming on the TP has been significantly higher than the average rate of warming in the rest of China, the mid-latitudes of the northern hemisphere, and the world over the same period, acting as a “magnifying glass” for global warming [1]. Rapid warming poses a huge ecological security challenge to the TP, which is an important ecological barrier for China. On the one hand, vegetation is an essential component of terrestrial ecosystems and is the most active factor in the ecosystem, acting as a bridge between soil, atmosphere, water, and other ecological factors, and its changes affect the material cycle and energy flow in important circles of the earth. On the other hand, changes in ecosystems can be reflected by sensitive vegetation [2]. Scientific assessment of vegetation change on the TP will help maintain the ecological balance of the plateau region and restore the plateau ecosystem to cope with the negative impacts of global climate change. An understanding of the changes in vegetation cover will be significant to the harmonious development of the regional economy and ecological civilization.
Global environmental change is rapidly affecting terrestrial vegetation dynamics, but the mechanisms by which vegetation responds to a rapidly changing environment are not yet clear. Therefore, the feedback and response of vegetation ecology to climate change is of continuing interest to experts and scholars. The TP is an alpine ecosystem, covered mainly by alpine grasslands and alpine meadows, which are more fragile than other ecosystems and are therefore the focus of relevant research [3]. In recent years, studies on the ecosystems of the TP have focused on vegetation phenology, vegetation greenness, forest line position, biodiversity, ecosystem productivity, and carbon sinks [3,4,5]. Among these, vegetation greenness is an important element of ecosystem monitoring, and there is a growing number of studies using indicators derived from satellite remote sensing, such as the Normalized Vegetation Index (NDVI), to assess the long-term condition of vegetation on the TP and reveal changes in vegetation [6,7]. Over the past 40 years, the vegetation on the TP has shown an “overall increase, local decrease” trend [8,9].
Soil moisture (SM) is an important factor in the flow and interconnection of material and energy within a range formed by the soil, vegetation, and the atmosphere. It has a strong influence on the evapotranspiration and transport of water from the surface soil and the cycling of elements such as carbon and nitrogen; soil moisture can determine the growth state and distribution pattern of vegetation in an ecosystem within a given territory. The distribution of soil moisture in the topsoil is influenced by many factors, such as precipitation and topography, and thus shows a strong spatial unevenness. The use of remote sensing is a new entry point for obtaining reliable soil moisture distribution characteristics quickly and on a large scale. As the world goes green, the pressure on regional water resources comes to the fore [10]. Mankin et al. [11] suggested that under a high CO2 emission scenario, more than 40% of the global land area would be characterized by a combination of the greening of vegetation and the drying of soils. The revegetation of the Loess Plateau has created conflicting water demands between the ecosystem and humans, and the sustainable use of water resources is approaching its limits [12]. The warming of the TP causes melting of permafrost ice and snow, increase in lake area and volume, and water temperature on the one hand, and induces the variability of hydrological cycle processes on the other [13,14,15]. Because vegetation strongly influences the water cycle, the interaction between vegetation and soil moisture is the basis of ecological processes on the TP. Vegetation affects interception, infiltration, and evaporation in the water cycle [16,17], and widespread vegetation greening increases the uptake of soil water and thus has an important impact on soil moisture changes [18]. Growing vegetation has an important impact on both the input and output links of soil moisture, thus leading to increasing uncertainty in soil moisture changes. Therefore, it becomes even more important to sort out the response of soil moisture to vegetation as it becomes green. The purpose of this study is to analyze the spatial distribution status and trends of soil moisture and grassland vegetation on the TP using GIMMS NDVI data and ERA5 soil moisture data from 1982 to 2015. Meanwhile, the response of SM to NDVI, precipitation, and temperature is also explored, and the relative contribution of the greening of grassland vegetation to SM changes is emphasized. This study explored the climate–vegetation–SM coupling mechanism in alpine grassland ecosystems with SM changes as the ultimate orientation. In the context of the global warming era, it improves the reference basis for management activities such as maintaining the stability of fragile ecosystems, preventing ecological disasters, and promoting grassland ecological restoration.
2. Materials and Methods
2.1. Study Area
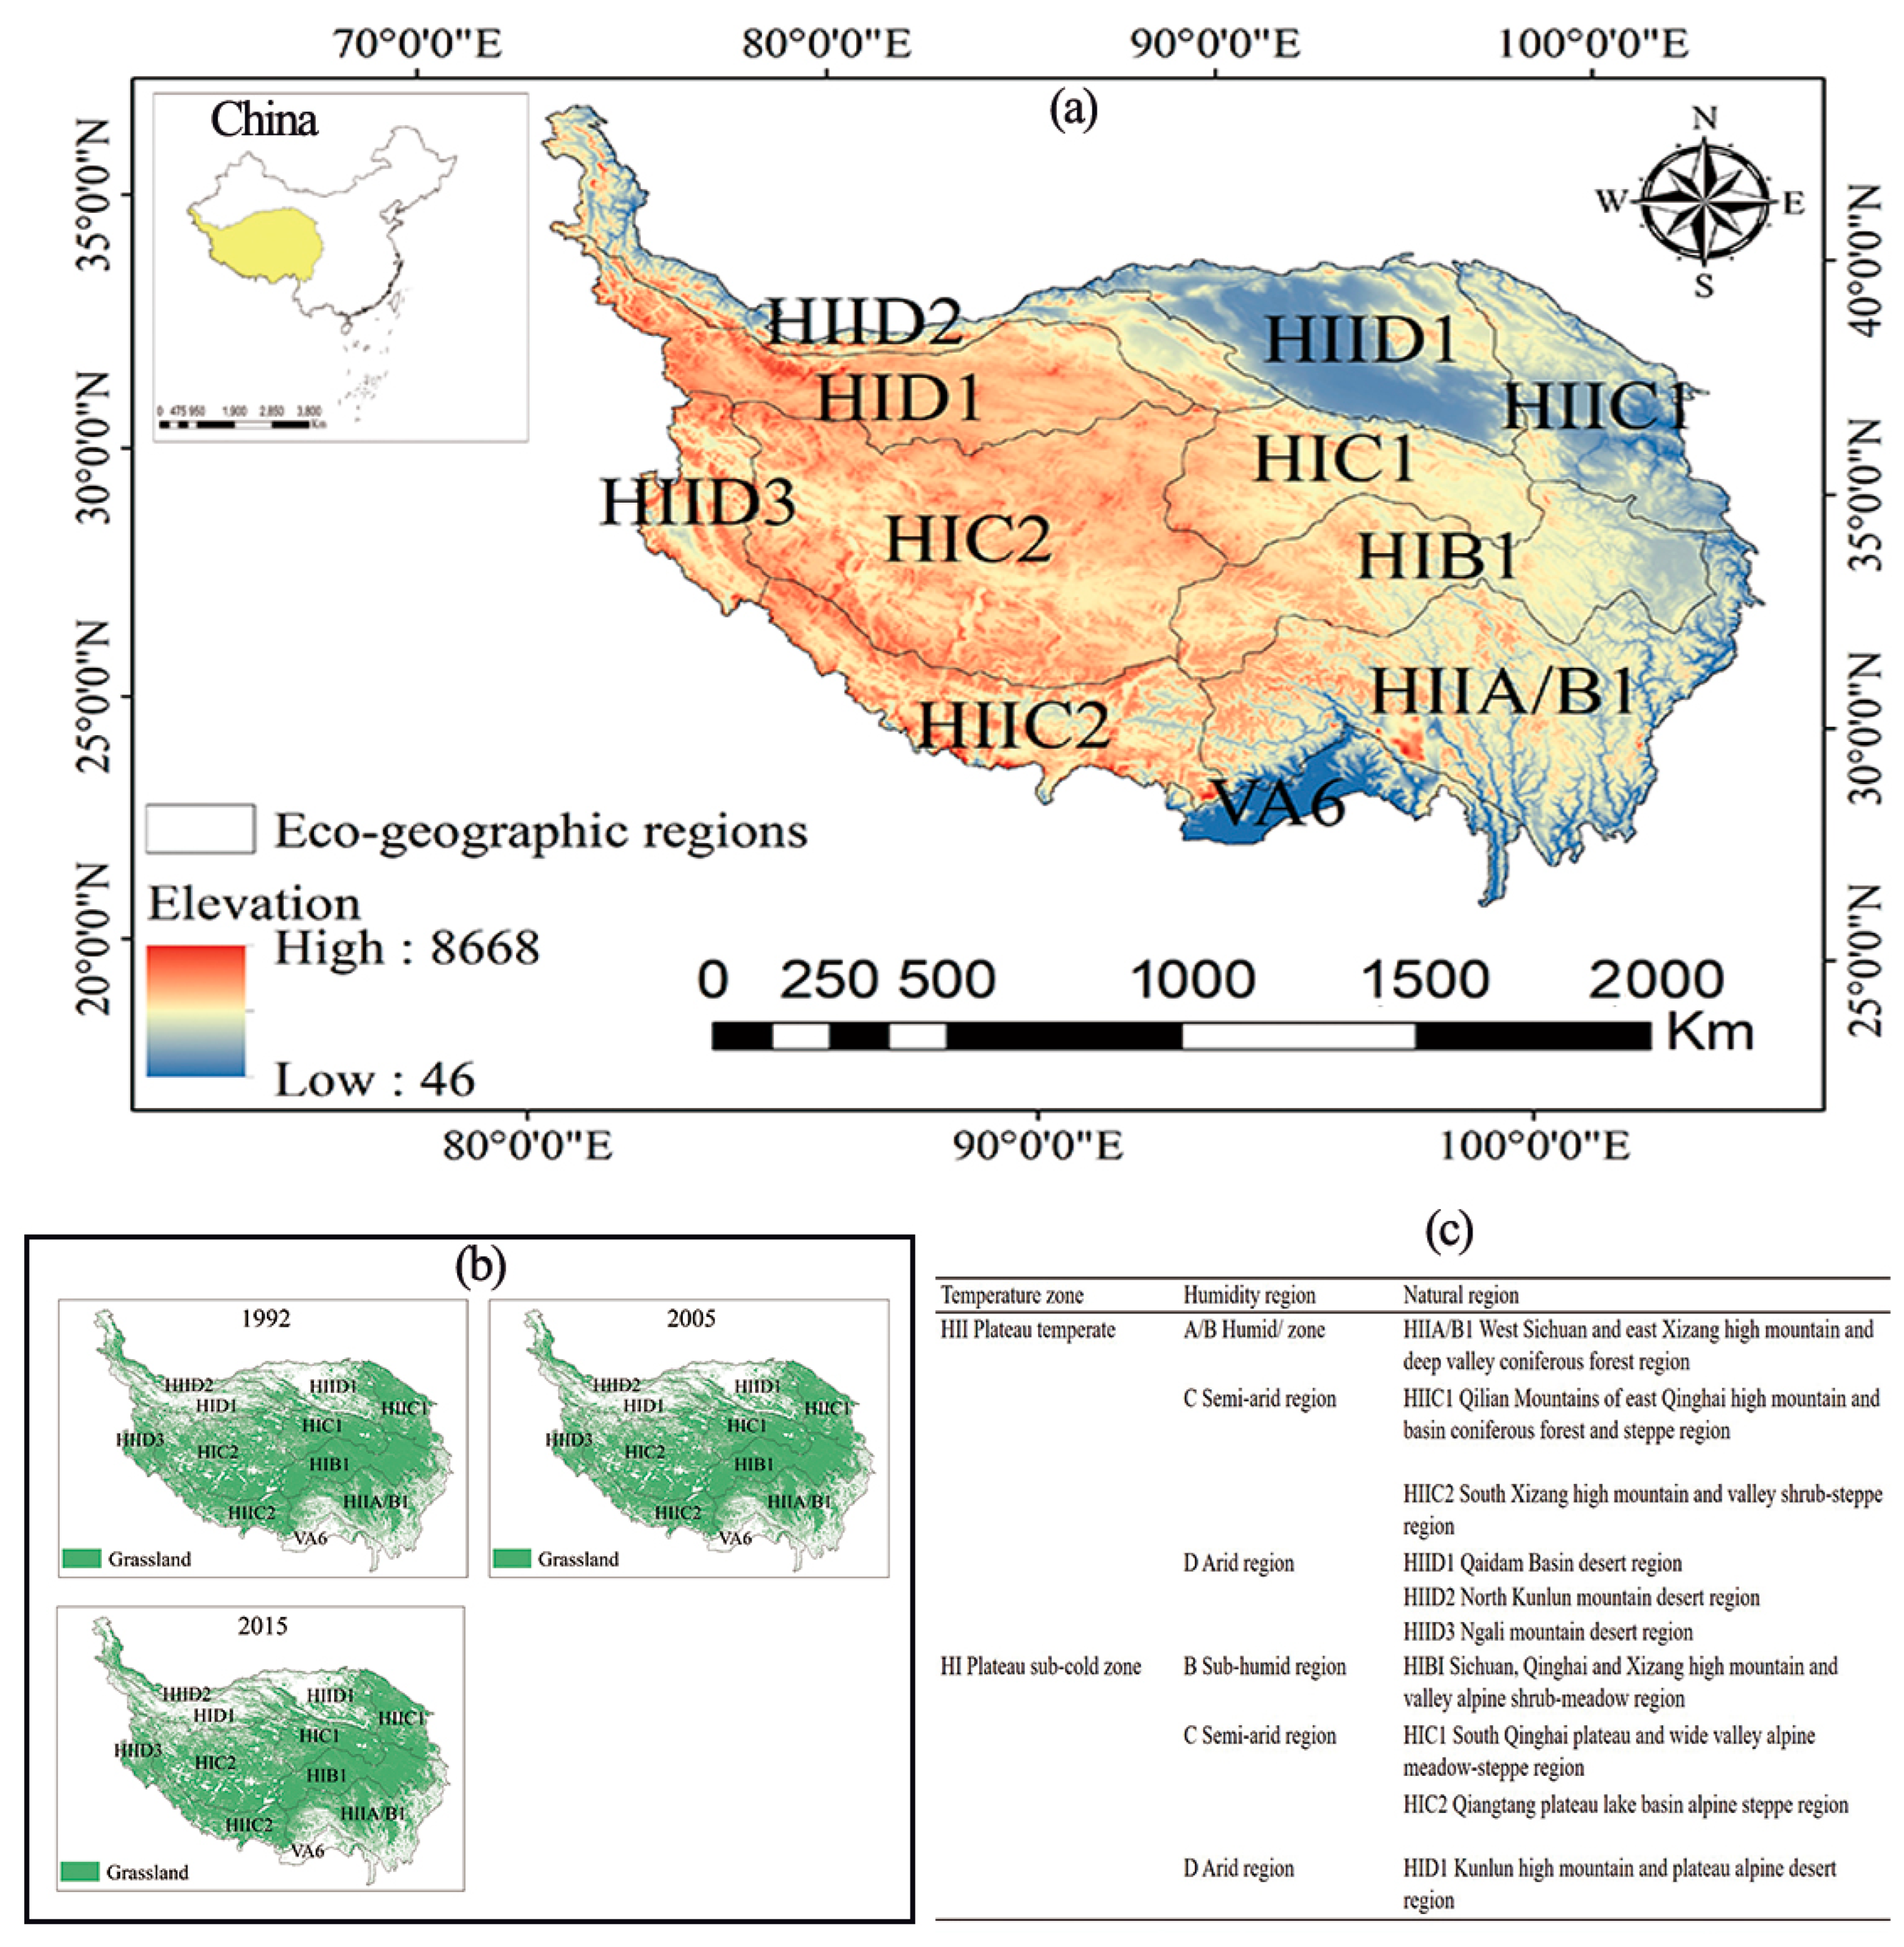
The TP (26°00′N–39°47′N, 73°19′E–104°47′E) mainly includes parts of Qinghai, Gansu, Xinjiang, Yunnan, and Sichuan Provinces, and all of Tibet in China. The average altitude of the TP is around 4000 m, far higher than the surrounding areas at the same latitude. The TP region is characterized by dramatic differences in elevation and complex topography, with high relief in the northwest and low relief in the southeast. The TP is characterized by its high topography and the consequent cold climate. The geographical position of the TP and the large altitude difference cause a relatively regular decline in temperature with increasing latitude and altitude, although the latter changes are far more significant than the former. Similar to the spatial distribution of temperature, annual precipitation shows a gradient from southeast to northwest, dropping from over 1000 mm to less than 100 mm [19]. The plateau is known as the “Water Tower of China” and has an unusually rich water resource due to its stable glacial snow melt, as well as a relatively rich animal and plant resource due to the outstanding vertical zonation of the TP. In particular, it is an important pastoral area in China, with a wide variety of grassland types and natural grassland vegetation. In response to the topographic features, water and heat conditions, and vegetation cover of the TP, Wu et al. [20] divided the plateau into 10 natural zones (Figure 1) containing two temperature zones and four wet and dry regions.
2.2. Materials
2.2.1. Normalized Difference Vegetation Index (NDVI)
The NDVI data used in this paper were downloaded from the National Tibetan Plateau Data Centre (http://data.tpdc.ac.cn/en/, accessed on 12 August 2022), and the dataset name is Global GIMMS NDVI3g v1 dataset (1981~2015). The GIMMS (Global Inventory Modeling and Mapping Studies) NDVI data is a global vegetation index data set launched by NOAA (National Oceanic and Atmospheric Administration) in November 2003, and can also be downloaded from their website (https://www.nasa.gov/nex, accessed on 2 September 2022). The data have a temporal resolution of 15 days, with an overall time span of July 1981 to December 2015. The spatial resolution of the data is 1/12°, and the spatial extent is global. The study shows that the GIMMS NDVI dataset shows good consistency with MODIS NDVI and SPOT NDVI [21].
2.2.2. ERA5-Land Soil Moisture Data
The soil moisture data selected for this paper is the ERA5 soil moisture dataset from the European Centre for Medium-Range Weather Forecasts (ECMWF) (https://www.ecmwf.int/, accessed on 2 September 2022), with a temporal resolution of months and a time span of 1950 to the present. The vertical distribution of ERA5 soil moisture data is divided into four layers: 0–7, 7–28, 28–100, and 100–289 cm, respectively. This dataset has shown great strengths in global atmospheric mass, humidity, energy, and angular momentum balance, and its soil moisture data products have many improvements in time span, prediction models, and error corrections [22]. In existing studies, the ERA5 soil moisture dataset performs better on global long time scales and better represents the global real soil moisture conditions than other global soil moisture datasets [23]. Therefore, in this paper, the soil moisture data of the top-most soil from 1982 to 2015 was chosen to study the soil moisture variability.
2.2.3. Climate and Vegetation Data
The grassland distribution data comes from the National Tibetan Plateau Data Center (NTPDC, http://data.tpdc.ac.cn/zh-hans/, accessed on 12 August 2022)—Land use of the Tibet Plateau in 2015 (Version 1.0). This dataset contains land use data on the TP in 1992, 2005, and 2015, and the areas where the grassland coverage has remained unchanged in these three years are selected to represent the grassland distribution on the TP. The rasterized data of precipitation and temperature are also from the NTDPC—1-km monthly precipitation dataset for China (1901–2020) and 1-km monthly mean temperature dataset for China (1901–2020).
2.3. Method
2.3.1. Pixel-By-Pixel Trend Analysis
In order to obtain the changes of soil moisture and vegetation on the TP over the study period, the Theil–Sen Median method was used to determine the temporal trends of these factors on a pixel-by-pixel scale. The formula of this method is shown as follows.
where Median() stands for taking the median value, xj and xi denote the variable x in different time series, and is the trend of the variable. The Theil–Sen Median method is usually used in conjunction with the M–K (Mann–Kendall) nonparametric test to determine whether the trend of the variables obtained by the Theil–Sen Median method is statistically significant [23].
2.3.2. Partial Correlation Analysis
In a multi-element geographic system, the fuzzy boundedness between elements leads to interactions between different elements, so there is a significant variability in the correlations between them [24]. The idea of partial correlation is to explore the correlation between two elemental subjects while controlling or even eliminating the influence of other elements [25]. Because it breaks through the statistical limitations of traditional correlation analysis and helps to better analyze the main controlling factors affecting the changes of geographical elements, it is widely used in the attribution analysis of geographical phenomena [26,27]. The implementation of the relevant research methods can be found in Li et al. [28].
2.3.3. Structural Equation Model (SEM)
SEM consists of two parts: one is a measurement model to verify the relationship between explicit and implicit variables, while the other is a structural model to highlight the relationship between implicit variables [29], and these two models can be realized by factor analysis and through-put analysis, respectively. Obviously, SEM contains two basic statistical analysis methods, namely factor analysis and path analysis. In dealing with the latent variables and measurement errors in the study, the traditional statistical analysis methods have been difficult to achieve, but SEM can do both [30]. In addition, SEM can extract common factors from complex multivariate relationships and explain some conceptual problems based on intuitive data combined with professional theoretical knowledge, making it more scientific.
2.3.4. Wavelet Analysis
Wavelet analysis is a widely used tool for time-frequency analysis. The wavelet method has the advantage of amplifying the local features of the signal due to its time-frequency tunable feature [31]. The key and prerequisite of wavelet analysis is the introduction of the fundamental wavelet function, the basic principle of which is to study the information at each scale level of the signal through the scaling transformation of the wavelet basis, and to extract both temporal (spatial) and frequency signals from the data signal [32]. The basic trend of the signal is studied by the generalized series, and the fluctuation details of the signal are studied by the detailed series, which can accurately discover the abrupt change points of the data and bring out the singular information in the data and can analyze the data in stages [33]. The mathematical expressions are as follows:
where Wf(a,b) is the wavelet coefficient; a is the scaling factor; b is the translation factor; t is the time; f(t) is an arbitrary square productable function, i.e., the time series of the study object; φ(t) is a basic wavelet function; and φ*(t) is the conjugate function.
In practical application, the Morlet wavelet with a complex form is more advantageous than a wavelet with real form, so the Morlet wavelet is used as the mother wavelet in this paper. Based on the basic form of the Morlet wavelet, wavelet coefficients and wavelet variance are calculated by the wavelet variation equation. The wavelet coefficients are used to analyze the time-frequency variation characteristics of the time series, and the wavelet variance reflects the strength of the periodic oscillation of the signal at different scales. The periodicity of SM, NDVI, precipitation, and temperature on the TP at each time scale is detected by wavelet analysis.
3. Results
3.1. Spatial and Temporal Variation Characteristics of Vegetation and Soil Moisture
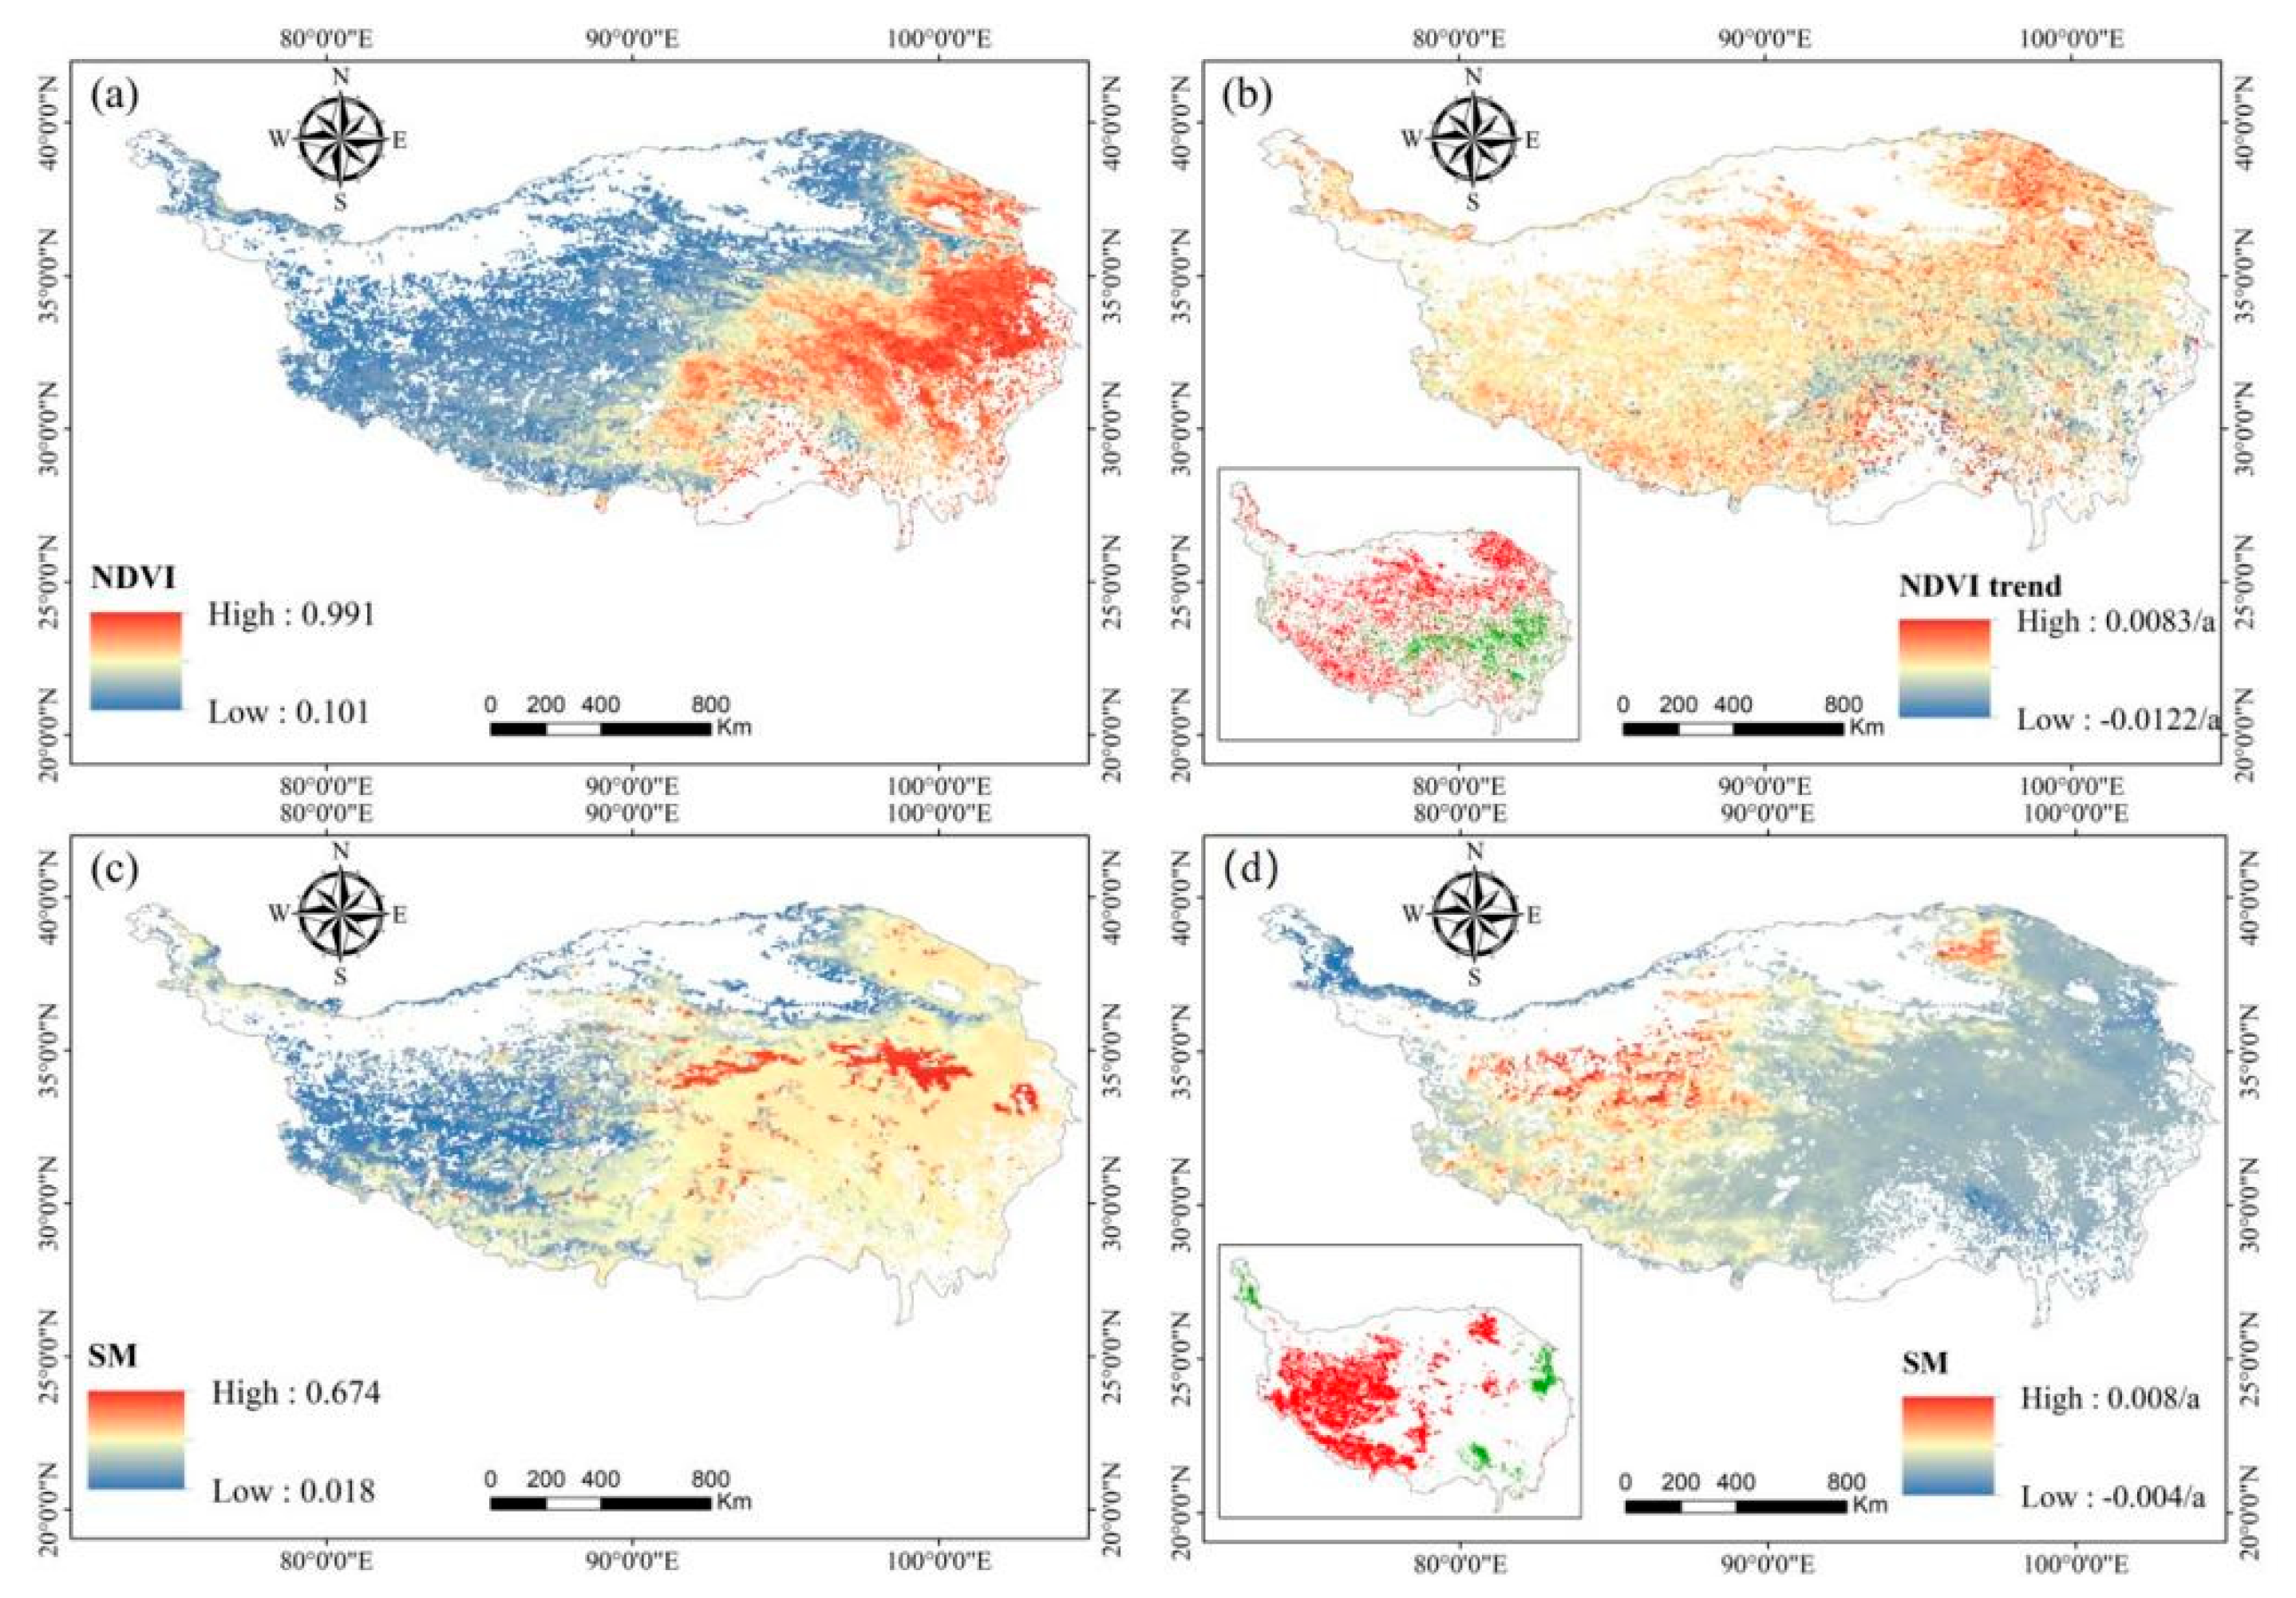
As shown in Figure 2, the overall condition of grassland vegetation from 1982 to 2015 is good; however, the NDVI is not evenly distributed spatially, and the overall distribution of grassland NDVI across the TP is characterized by high levels in the east and southeast and low levels in the vast north, west, and southwest. The low values of NDVI are mainly found in the vast northwestern and northern parts of the TP, which is a typical alpine desert area with a small proportion of grassland and alpine vegetation. The Qaidam Basin in the north has the lowest distribution of NDVI values on the TP. The trend of the NDVI of grassland on the TP from 1982 to 2015 is shown in Figure 2b; grassland NDVI showed a stable increasing trend for many years, 58.9% (p < 0.05 area accounted for 24.4%) of vegetation areas increased greening, and the areas showing a decreasing trend were mainly distributed in the southwest. In addition, the soil moisture of the TP showed an overall increasing trend from 1982 to 2015 (Figure 2d). In the western part of the TP, soil water showed a significant increase, while some areas in the east and south showed a small decrease in soil water. The area of the region with significant increases in soil water (30.9%) was much larger than that with significant decreases (4.2%). The spatial distribution of both vegetation and soil water from 1982 to 2015 showed a heterogeneous distribution, with large differences between different regions.
3.2. Influence of Vegetation and Climate on SM Changes
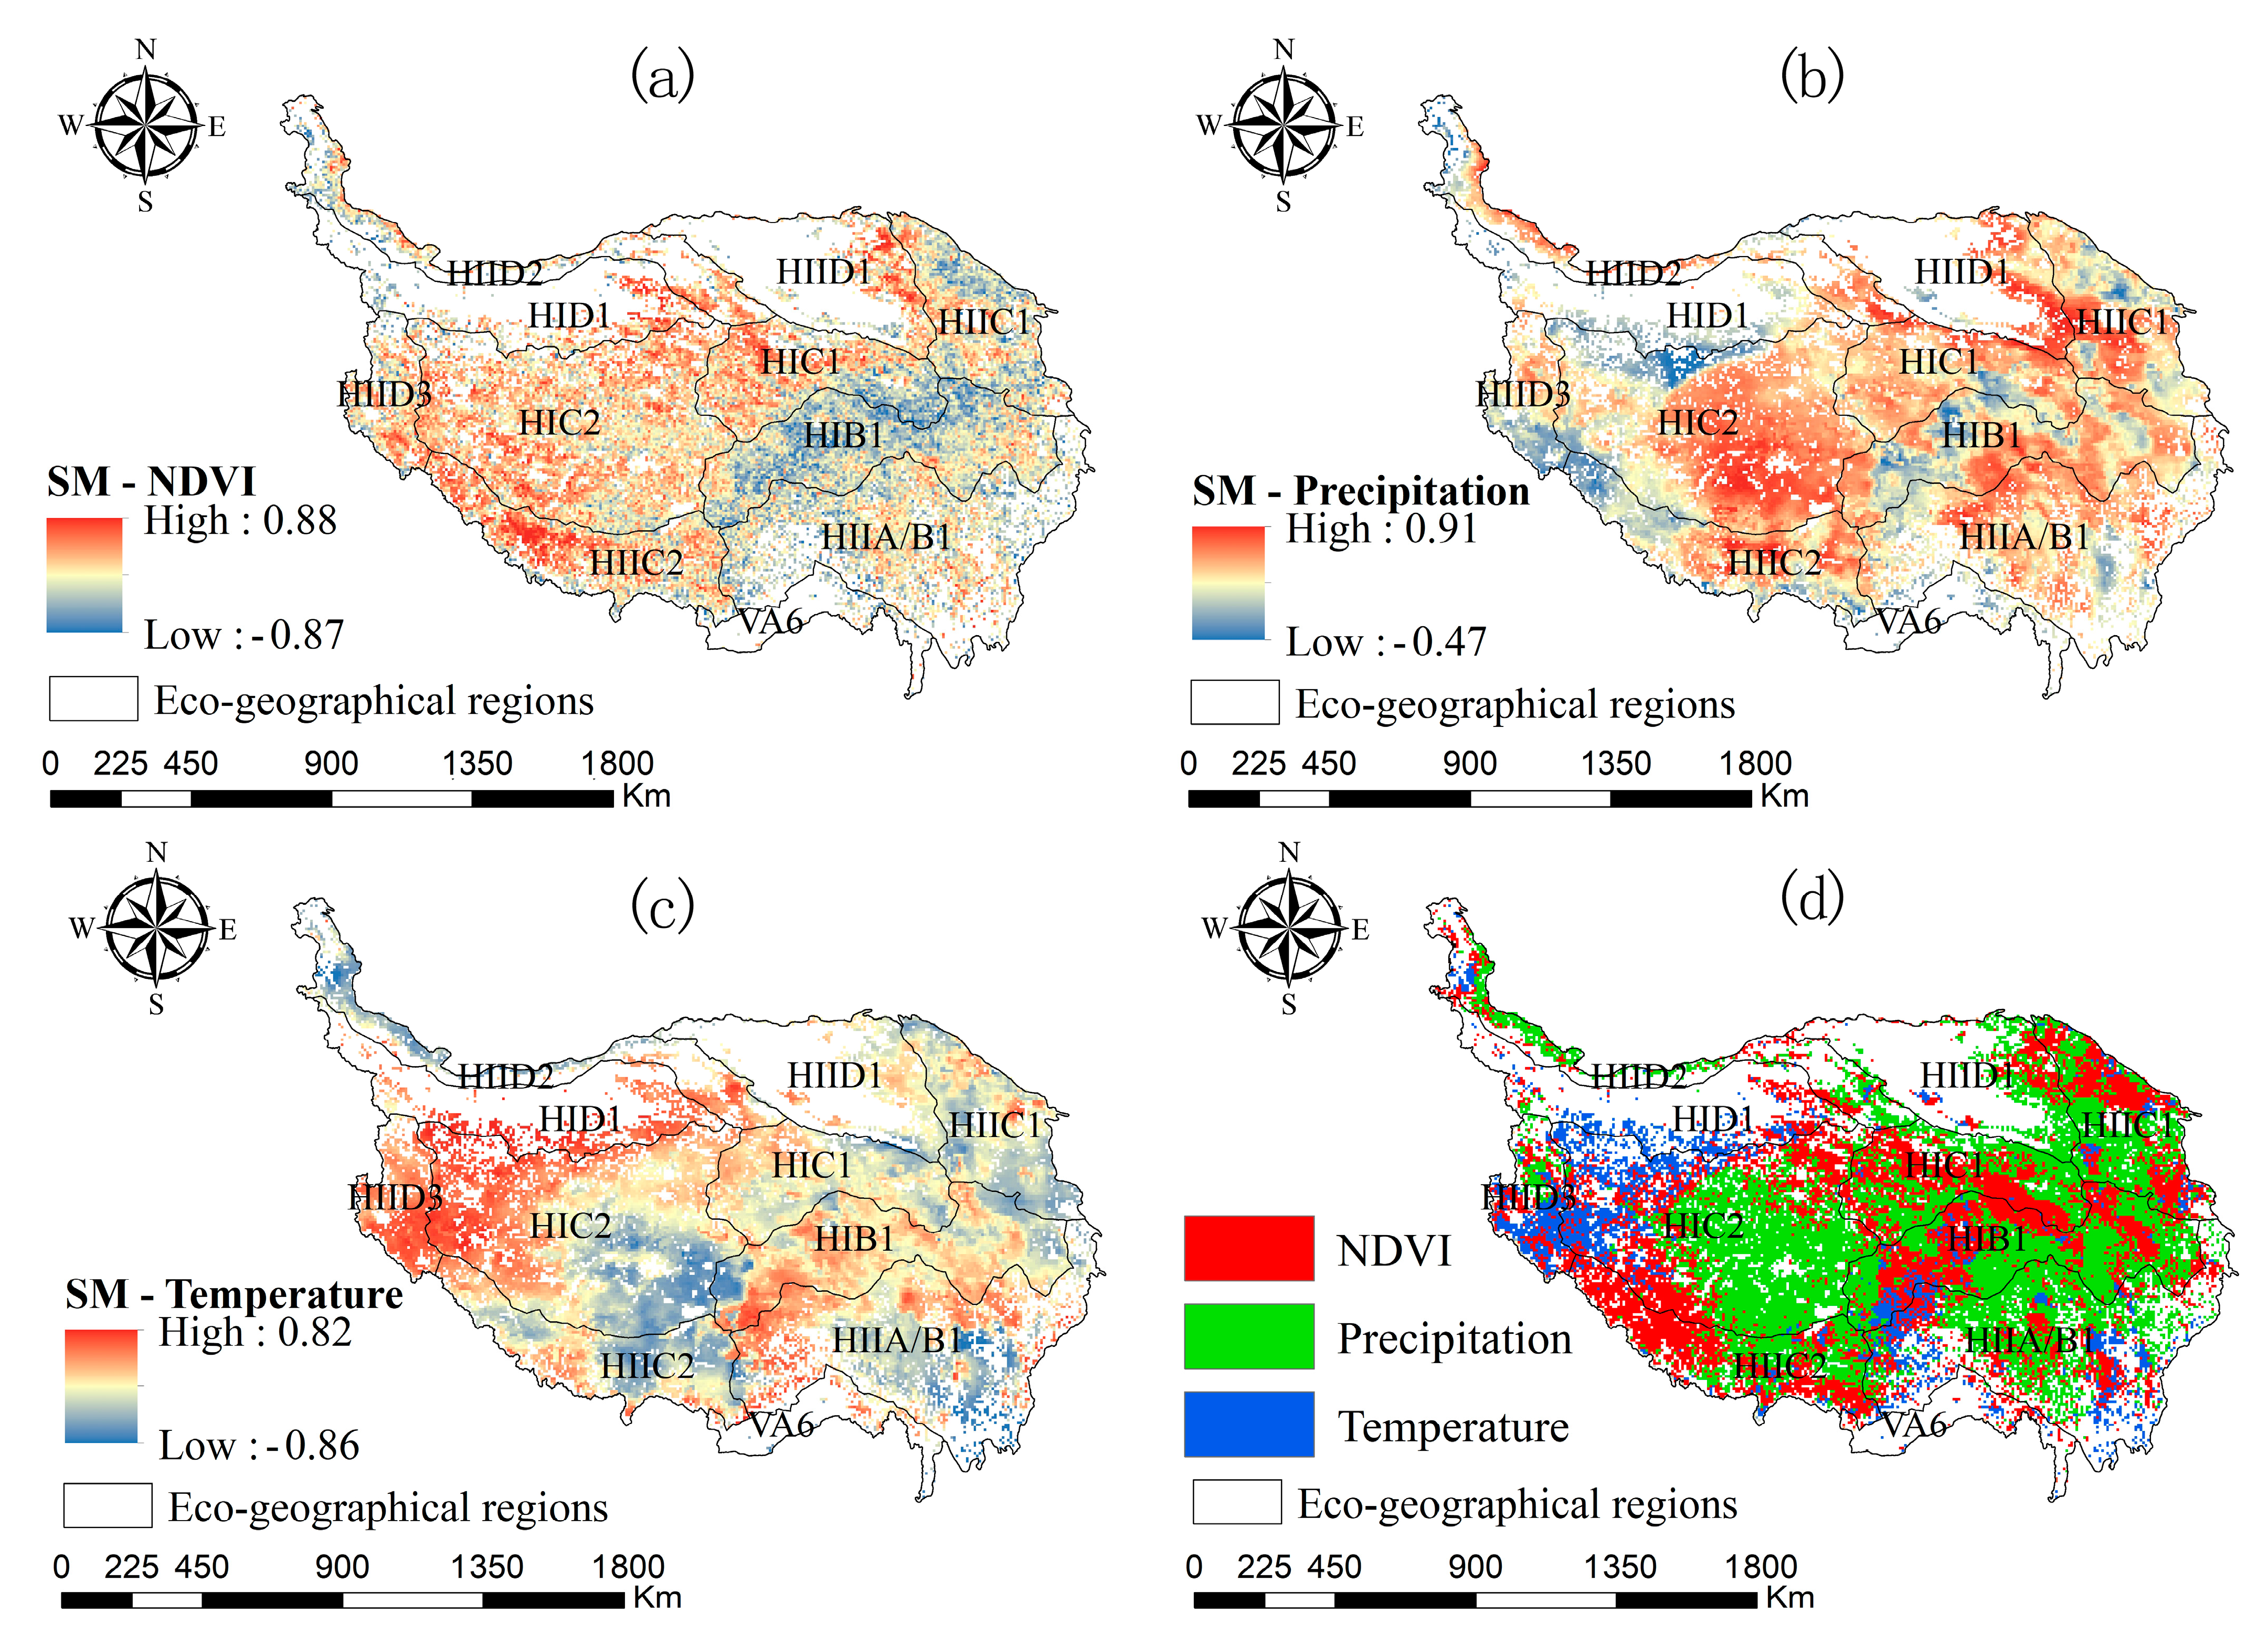
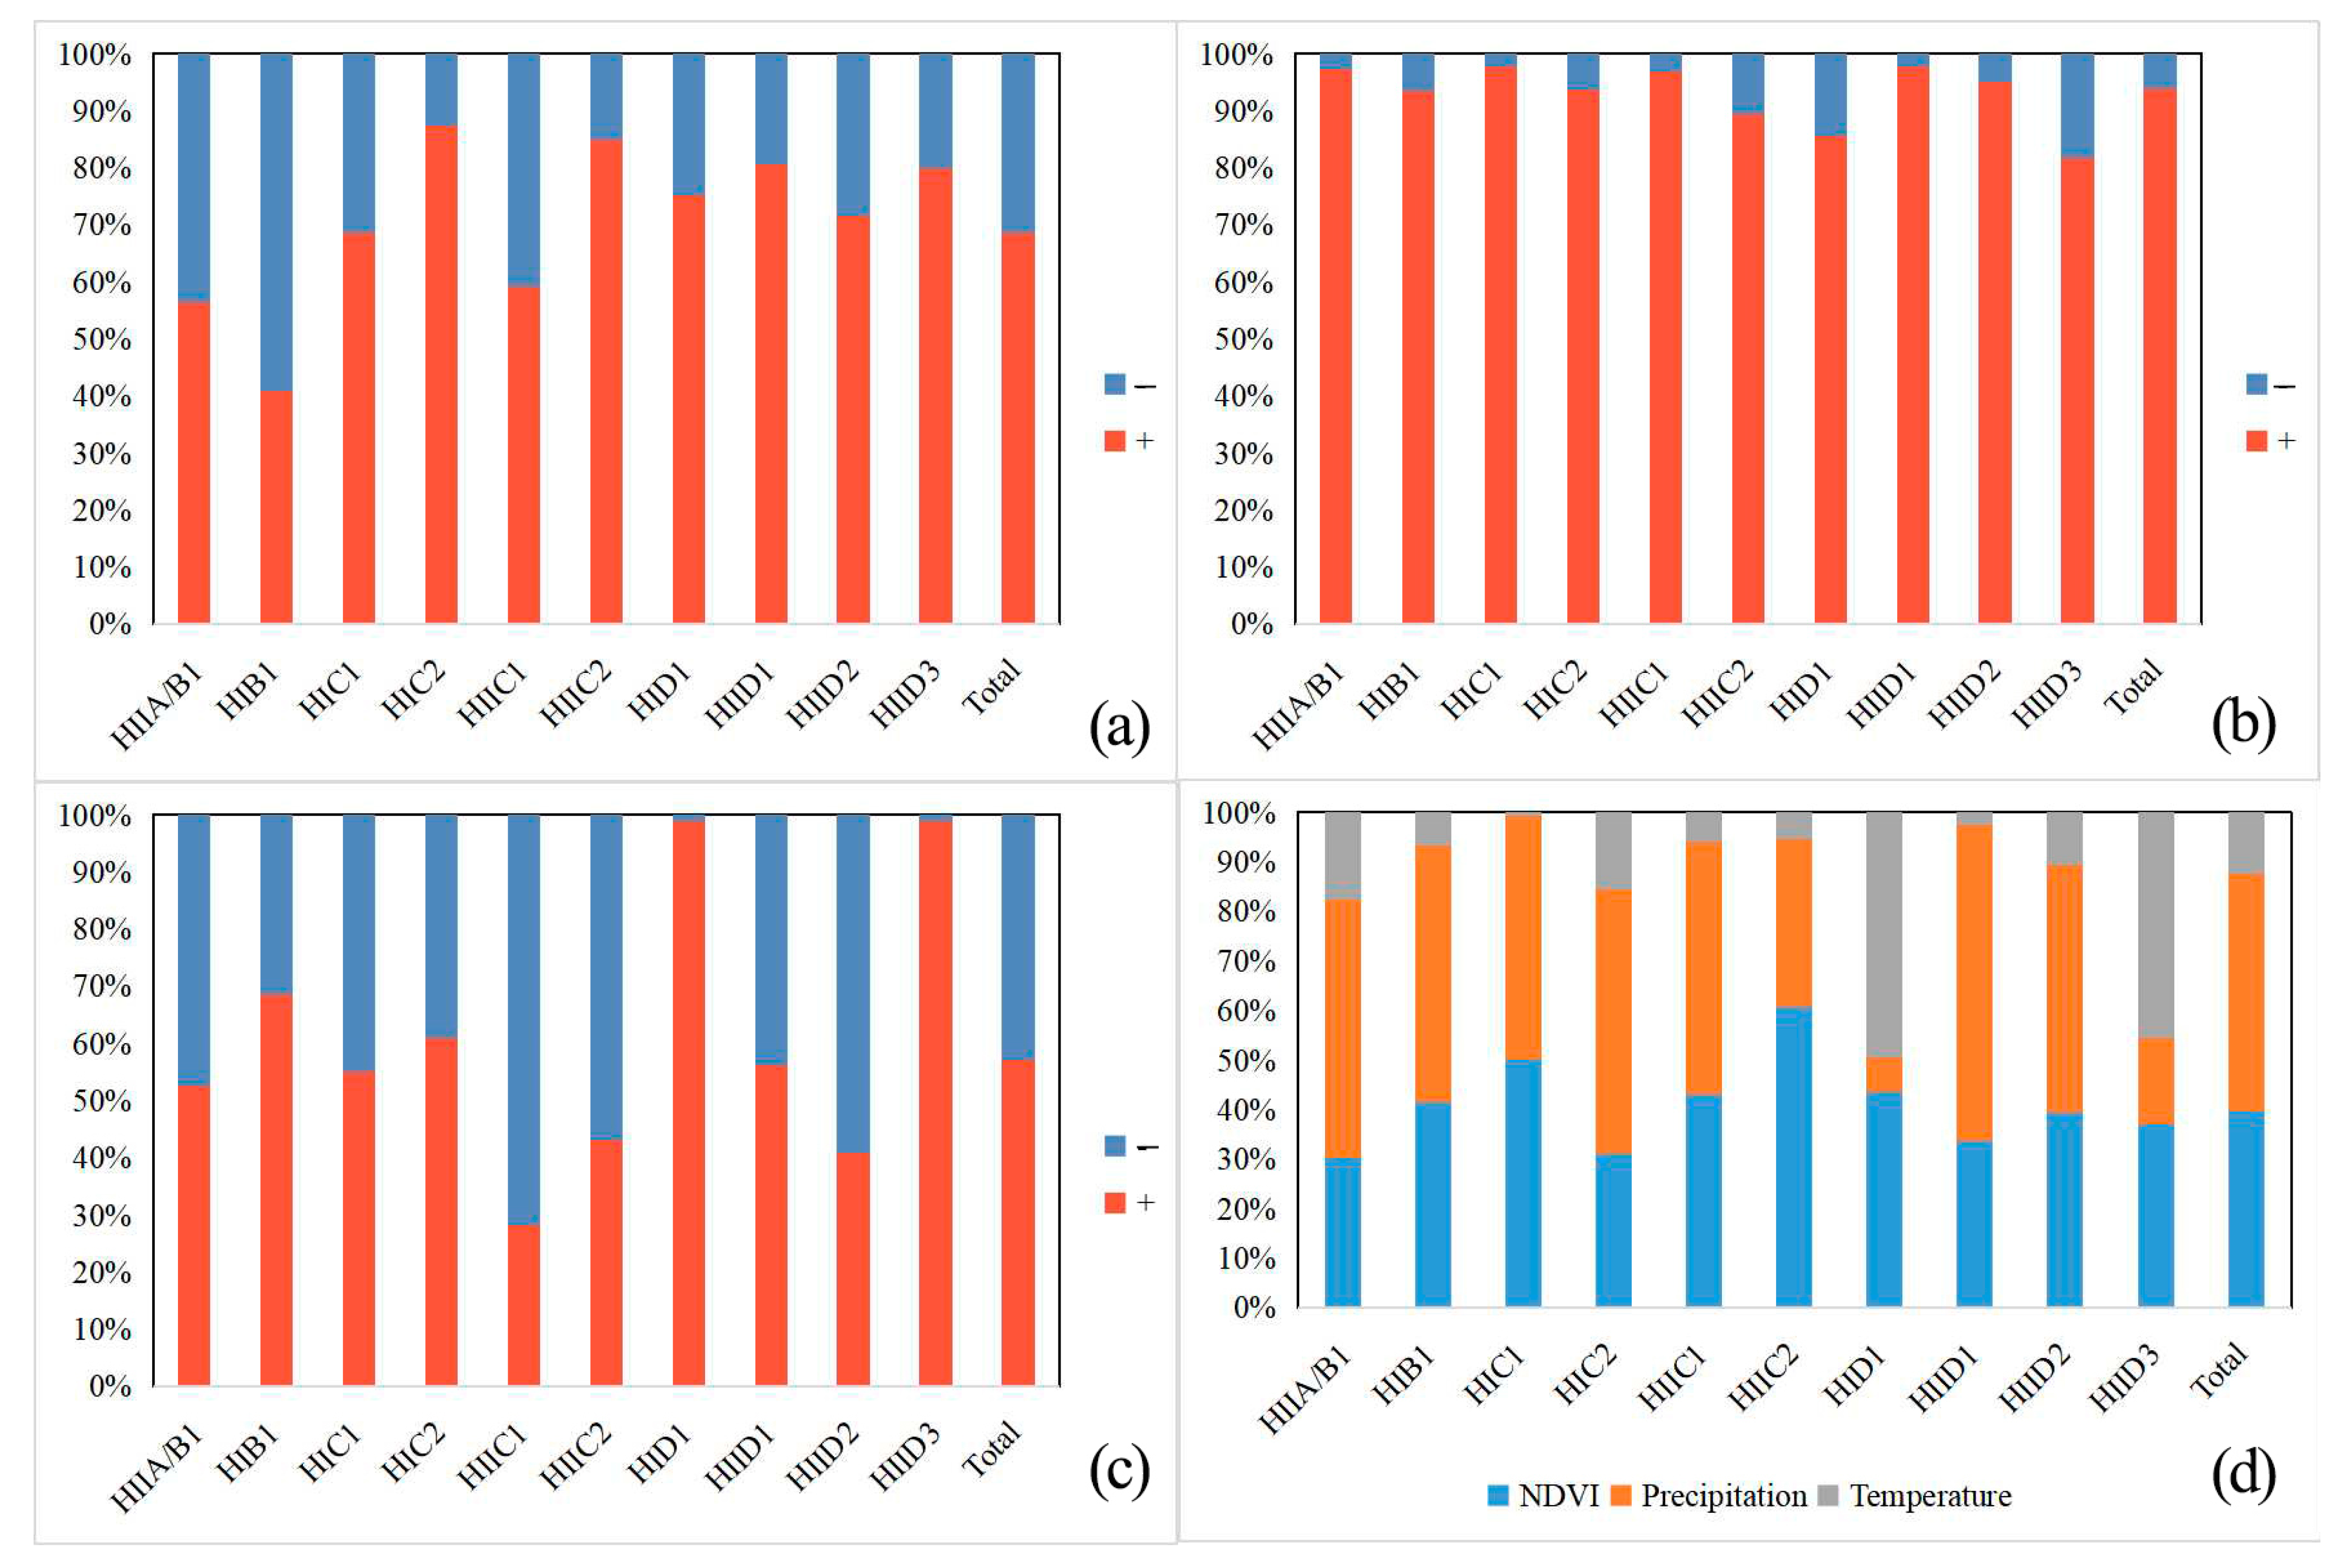
To better understand the influence of vegetation and climate factors on SM, the partial correlation coefficients of SM with NDVI, precipitation, and temperature were analyzed using the partial correlation method, while their spatial distribution is shown in Figure 3. From Figure 3a, it can be concluded that the correlation between NDVI and SM is dominated by positive correlation. More specifically, the percentage of area showing negative correlation between SM and NDVI is higher than that of positive correlation in HIB1 area, while in other areas, the positive correlation is dominant (Figure 4). For precipitation, the majority of areas in the TP showed that precipitation could well contribute to the increase in SM. The positive effect of temperature on SM was concentrated in the eastern part of HIC2, HID1, and HIID3 regions, while the distribution area of positive correlation between temperature and SM was higher than that of negative correlation. Combining the degree of influence of different factors on SM (Figure 3d), it can be concluded that precipitation is the most important factor influencing SM changes on the TP, followed by NDVI and temperature. Meanwhile, temperature, as the dominant factor influencing SM, is concentrated in the high-altitude areas in the western part of the TP. Comparing the area share of dominant factors in wet and arid areas (Table 1), it can be concluded that precipitation is still the dominant factor influencing SM changes. However, the area share of precipitation dominance decreases when wet areas shift to arid areas, while the area share of NDVI and temperature increases, with the largest increase in NDVI.
3.3. Analysis of the Causes of Soil Moisture Changes in Different Ecological Regions
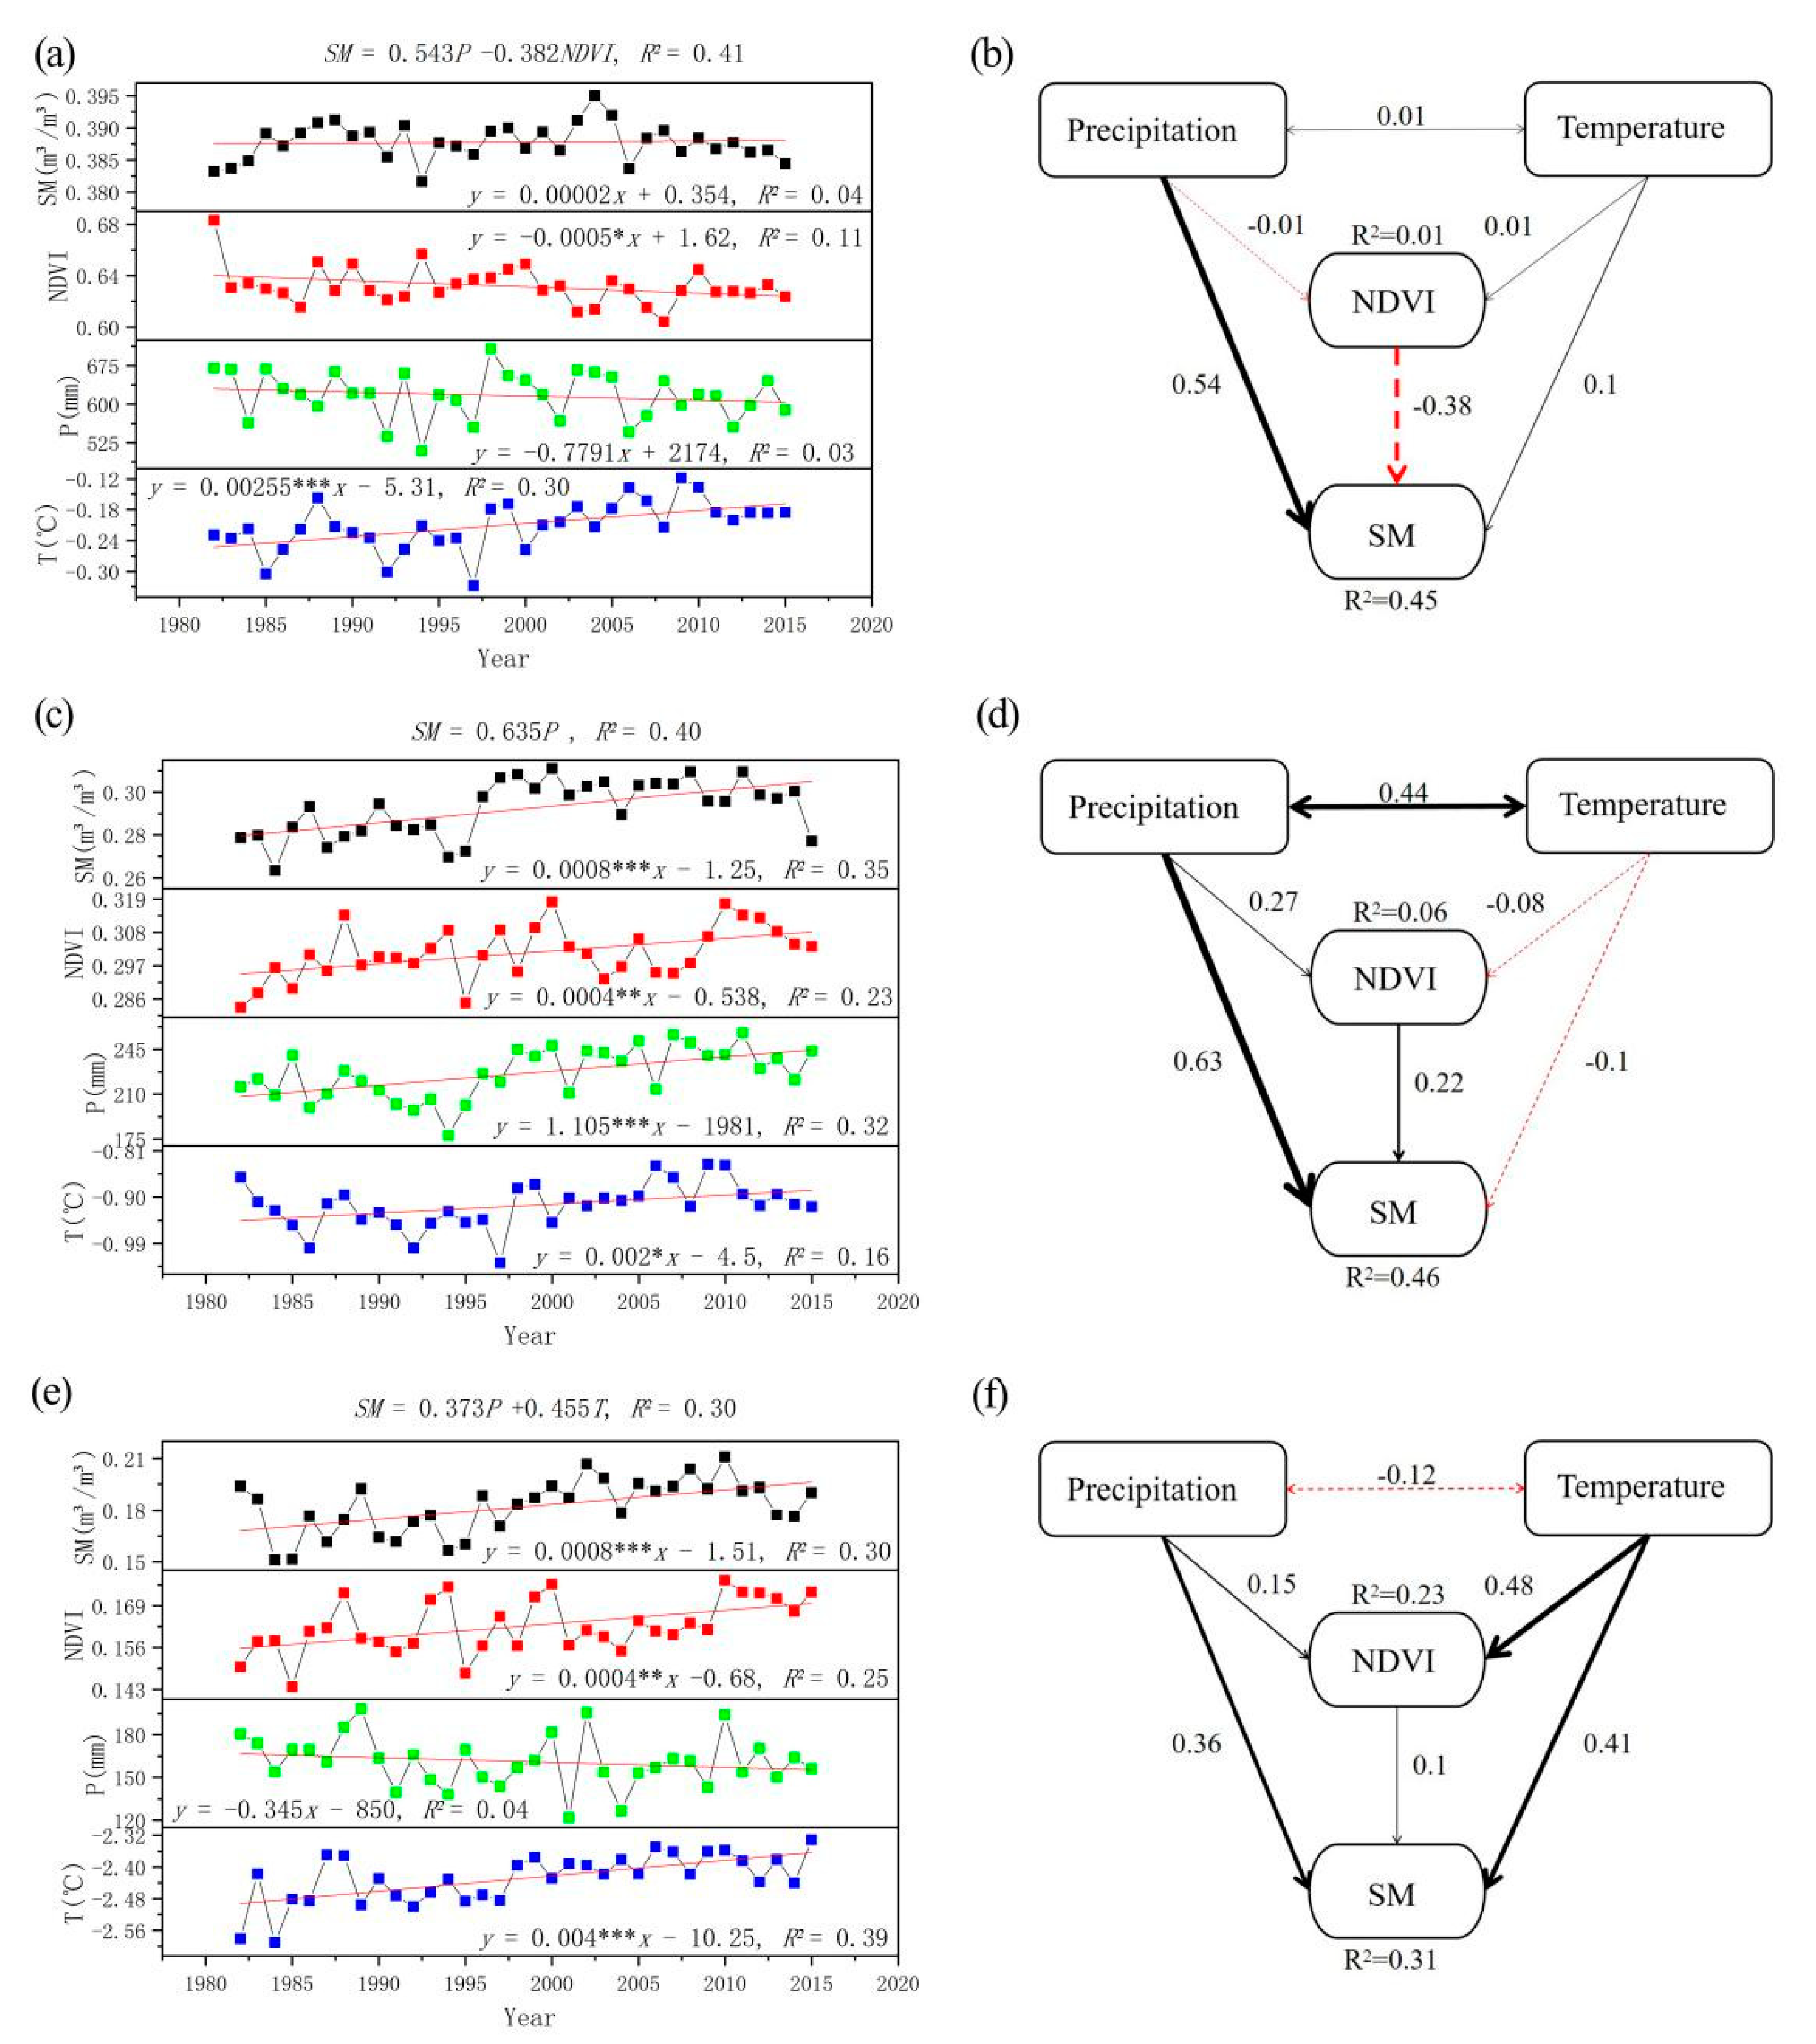
Multiple stepwise linear regression is one of the most commonly used multiple linear regression models that can solve the multicollinearity problem and select a more streamlined combination of effective variables to construct the model. NDVI, precipitation, and temperature were used as inputs to the multiple stepwise linear regression model to reveal the influence of these elements on SM, and their standardized regression coefficients can be used to characterize the magnitude of the impact intensity [34]. According to the criteria of ecogeographic zoning, HIIA/B1 and HIB1 were considered as wet zones; HIC1, HIC2, HIIC1, and HIIC2 as semi-arid zones; and HID1, HIID1, HIID2, and HIID3 as arid zones. As can be seen from Figure 5, the variation of soil moisture in the humid zone with interannual is not significant, while NDVI and temperature show significant decreasing and increasing trends, respectively. The variation of SM can be explained by the dynamic response with precipitation and NDVI. The positive correlation between precipitation and SM implies that the presence of the phenomenon of precipitation reduction in the humid areas caused a decrease in soil moisture. The vegetation greenness reflects the vegetation growth activity to a certain extent, and the reduced activity reduces the consumption of soil moisture by vegetation and facilitates the accumulation of soil moisture. The increase in SM caused by the decrease in NDVI and the decrease in SM caused by the decrease in precipitation offset each other, which finally contributed to the situation of no significant change of soil moisture in the humid zone. However, the extremely low correlation between the changes in vegetation NDVI and precipitation and temperature may be due to the disorderly variation of precipitation and temperature, and the very small correlation coefficient between precipitation and temperature verifies the existence of this disorderly state. In the semi-arid region, SM, NDVI, precipitation, and temperature all showed significant increasing trends. From the regression relationship, it can be concluded that precipitation has a significant contribution to the growth of SM. The increase in precipitation promotes the vegetation activity to a certain extent, which brings the increase in NDVI. Meanwhile, the remaining precipitation was used to replenish the soil, causing a significant increase in soil moisture. SM, NDVI, and temperature in arid areas showed significant increases from 1982 to 2015, while precipitation showed a non-significant decrease. The significant increase in temperature brought about an increase in soil moisture, which may be due to the fact that the arid zone is located in a cold area at high altitude, where the increase in temperature favors soil freezing and thawing and releases moisture [35].
4. Discussion
4.1. Soil Moisture Characteristics and Attribution Analysis of the Tibetan Plateau
The TP is a large mountain system consisting of rolling hills and mountains, with slopes and elevations creating a distinct temperature and moisture gradient; TP grasslands are one of the most sensitive ecosystems to global climate change. Spatial trends in climate factors, as well as changes in ecosystem service functions and water resources on the TP and its surrounding areas, may lead to spatial heterogeneity of alpine grasslands. It is obvious from the statistical results in Figure 5 that soil moisture, NDVI, and hydrothermal conditions are better in wet areas than in semi-arid and arid areas, while arid areas are better than arid areas, which is consistent with the general perception. The spatial differences in the combined hydrothermal conditions are the main controlling factors of vegetation spatial distribution determining the progressively worse vegetation cover condition in the plateau areas from southeast to northwest.
There is no doubt that precipitation is the decisive and dominant factor leading to the variation of soil moisture. Precipitation has a significant effect on the variation of SM in different dry and wet areas of the TP [36]. However, the development of SM is not only influenced by precipitation, but also by elements such as temperature and vegetation [37,38,39]. Temperature as the dominant factor affects the western and northern high-altitude areas of the TP, mainly due to the extensive distribution of permafrost. Permafrost, as an impermeable layer, prevents the infiltration of soil moisture. During thawing, the downward hydrothermal process becomes more active due to the increase in short-wave radiation from the ground, and the thawed water is quickly absorbed by the soil and the deep soil moisture migrates to the shallow soil layer [39]. Based on the relationship between multi-year permafrost and soil moisture, it can be assumed that the presence of multi-year permafrost stabilizes soil water content and nearly reduces the correlation between surface soil moisture and precipitation.
The warm–wet trend on the TP has been widely demonstrated [40,41], and this warm–wet trend will continue [42]. There is no doubt that increased precipitation favors soil moisture accumulation, as shown by Deng et al. [23] in three river source areas of the TP; Liu et al.’s [43] studies of soil moisture dynamics on the TP have validated this view. Temperature is an important factor, causing changes in vapor pressure difference, and elevated temperature causes an increase in surface evapotranspiration, which may lead to a decrease in soil moisture. However, the perennial and seasonal permafrost areas on the TP account for 40.2% and 56.0% of the total plateau area, respectively [39]. Increased temperature favors permafrost thawing and thus increases SM. Therefore, the effect of temperature on the variability of SM on the TP may be very different in different regions. Similar to Li et al. [39], the positive correlation between vegetation NDVI and SM was predominant.
4.2. Cyclical Characteristics of SM and the Possibility of Future Changes
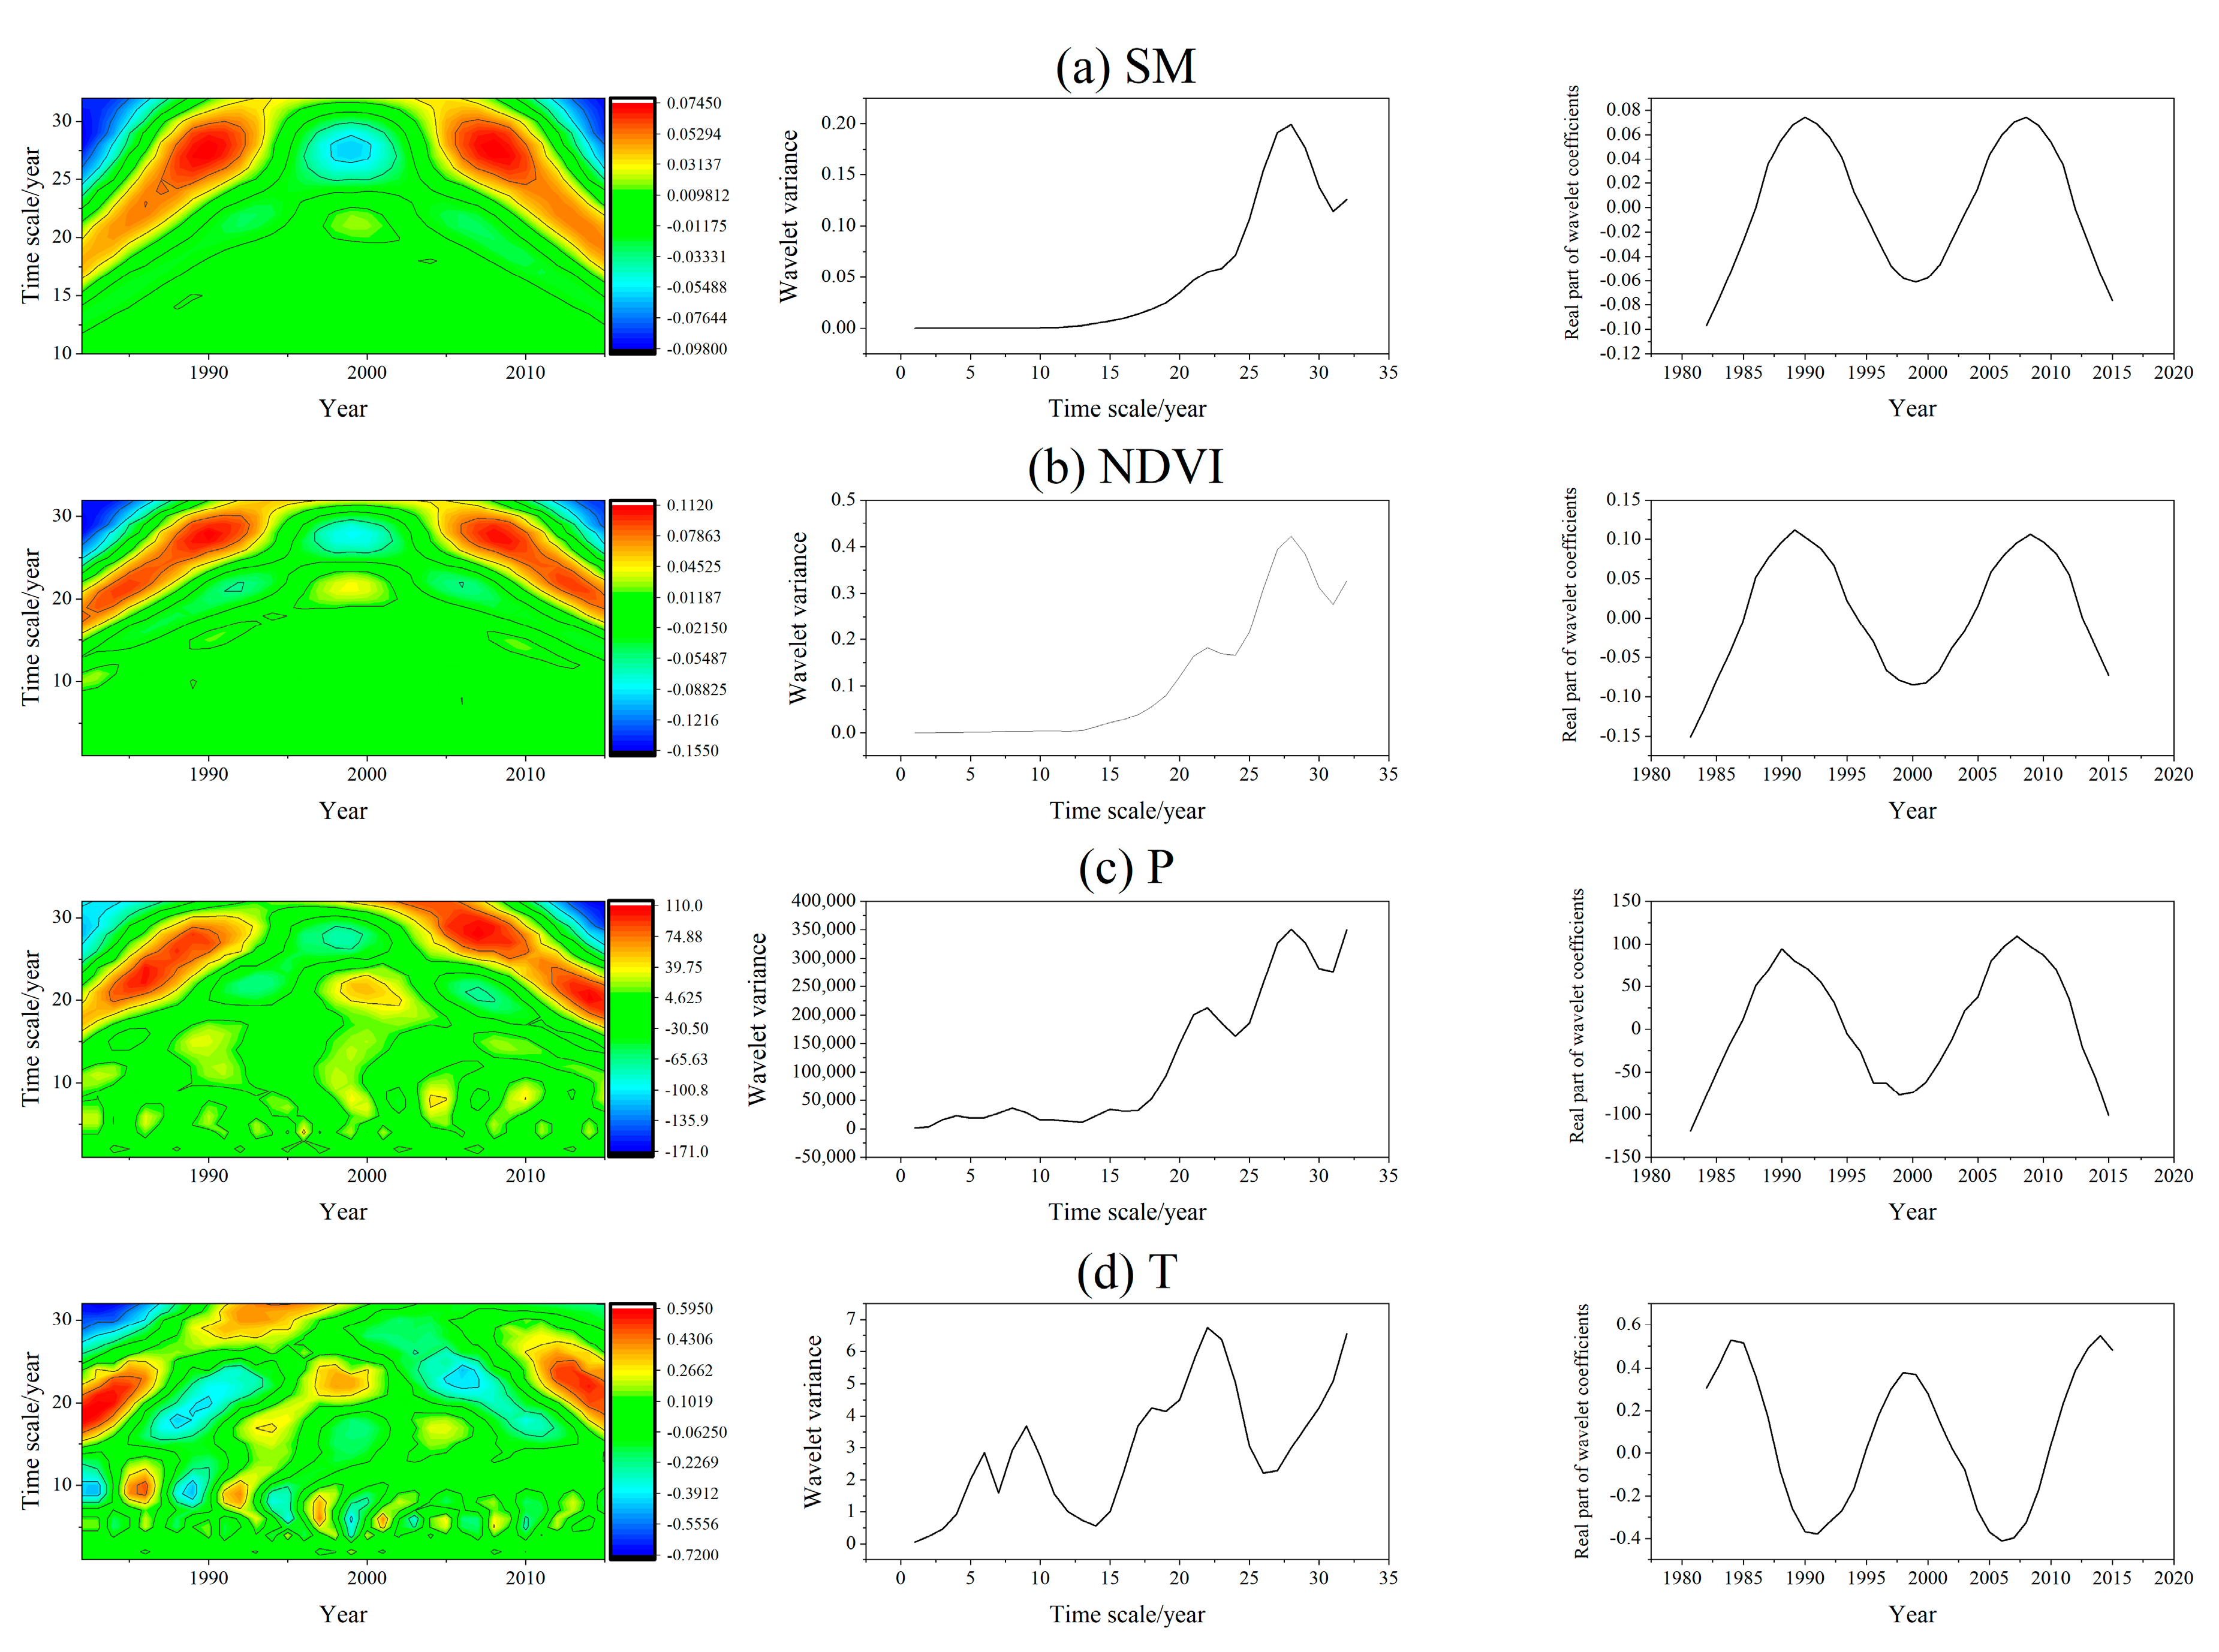
The wavelet analysis can reflect the periodic change pattern of the study object, and the results are shown in Figure 6. The multi-timescale characteristics of the evolution of SM, NDVI, precipitation, and temperature on the TP over the years can be clearly seen. In general, the evolution of SM mainly has a cyclic variation pattern of 25–30 a, and NDVI has a cyclic variation of 20–30 a. The periodic variations of precipitation and temperature are more complicated, with 5–10 a and 20–32 a periodic variations of precipitation. The period of temperature varying is then 5–12 a and 15–25 a. On the time scale of 20–30 a, there are quasi-2 oscillations with alternating high–low value changes in SM, NDVI, and precipitation. More specifically, the period variation of precipitation at time scales below 10 a is rather heterogeneous, indicating that the annual precipitation on the TP varies frequently and less regularly under small-scale cycles. According to the analysis of the results of wavelet variance, the time series of SM has the strongest oscillation in the cycle around 28 a in the last 34 years, while there are oscillation cycles of 22 a and 28 a for NDVI and precipitation, of which 28 a is the first main cycle of variation. However, the oscillatory changes of temperature are more complicated, with oscillatory cycles of 6 a, 9 a, 16 a, and 22 a. Figure 6a–c—right) shows that the average variation period of SM, NDVI, and precipitation is about 18 years on the time scale of 28 a, and about 2 cycles of high-low transition, while it can be predicted that the SM, NDVI, and precipitation in the humid zone will experience a short decrease in the short period after 2015, and then enter into an accelerated increase. However, the complex cyclic variation of temperature results in an average variation period of about 15 years on a time scale of 22 a, with about 2 cycles of warming–cooling transition. From Figure 6d—right, the contours of the most significant cycle of temperature in 2015 are not closed, which indicates that the temperature of the TP will continue to be high after 2015. The similar cycle changes between SM, NDVI, and precipitation may lead to a more obvious positive correlation between SM and NDVI and precipitation, as in Figure 6d, while the non-contemporaneous changes between temperature and SM, NDVI, and precipitation make the correlation between temperature and SM weaker.
4.3. Influence of Vegetation Greening on SM Changes
Greening of vegetation is the general trend of global vegetation change at present [44]. Extensive vegetation greening increases the uptake of soil moisture and thus has an important impact on soil moisture changes. Therefore, it becomes more important to sort out the response of soil moisture to vegetation greening.
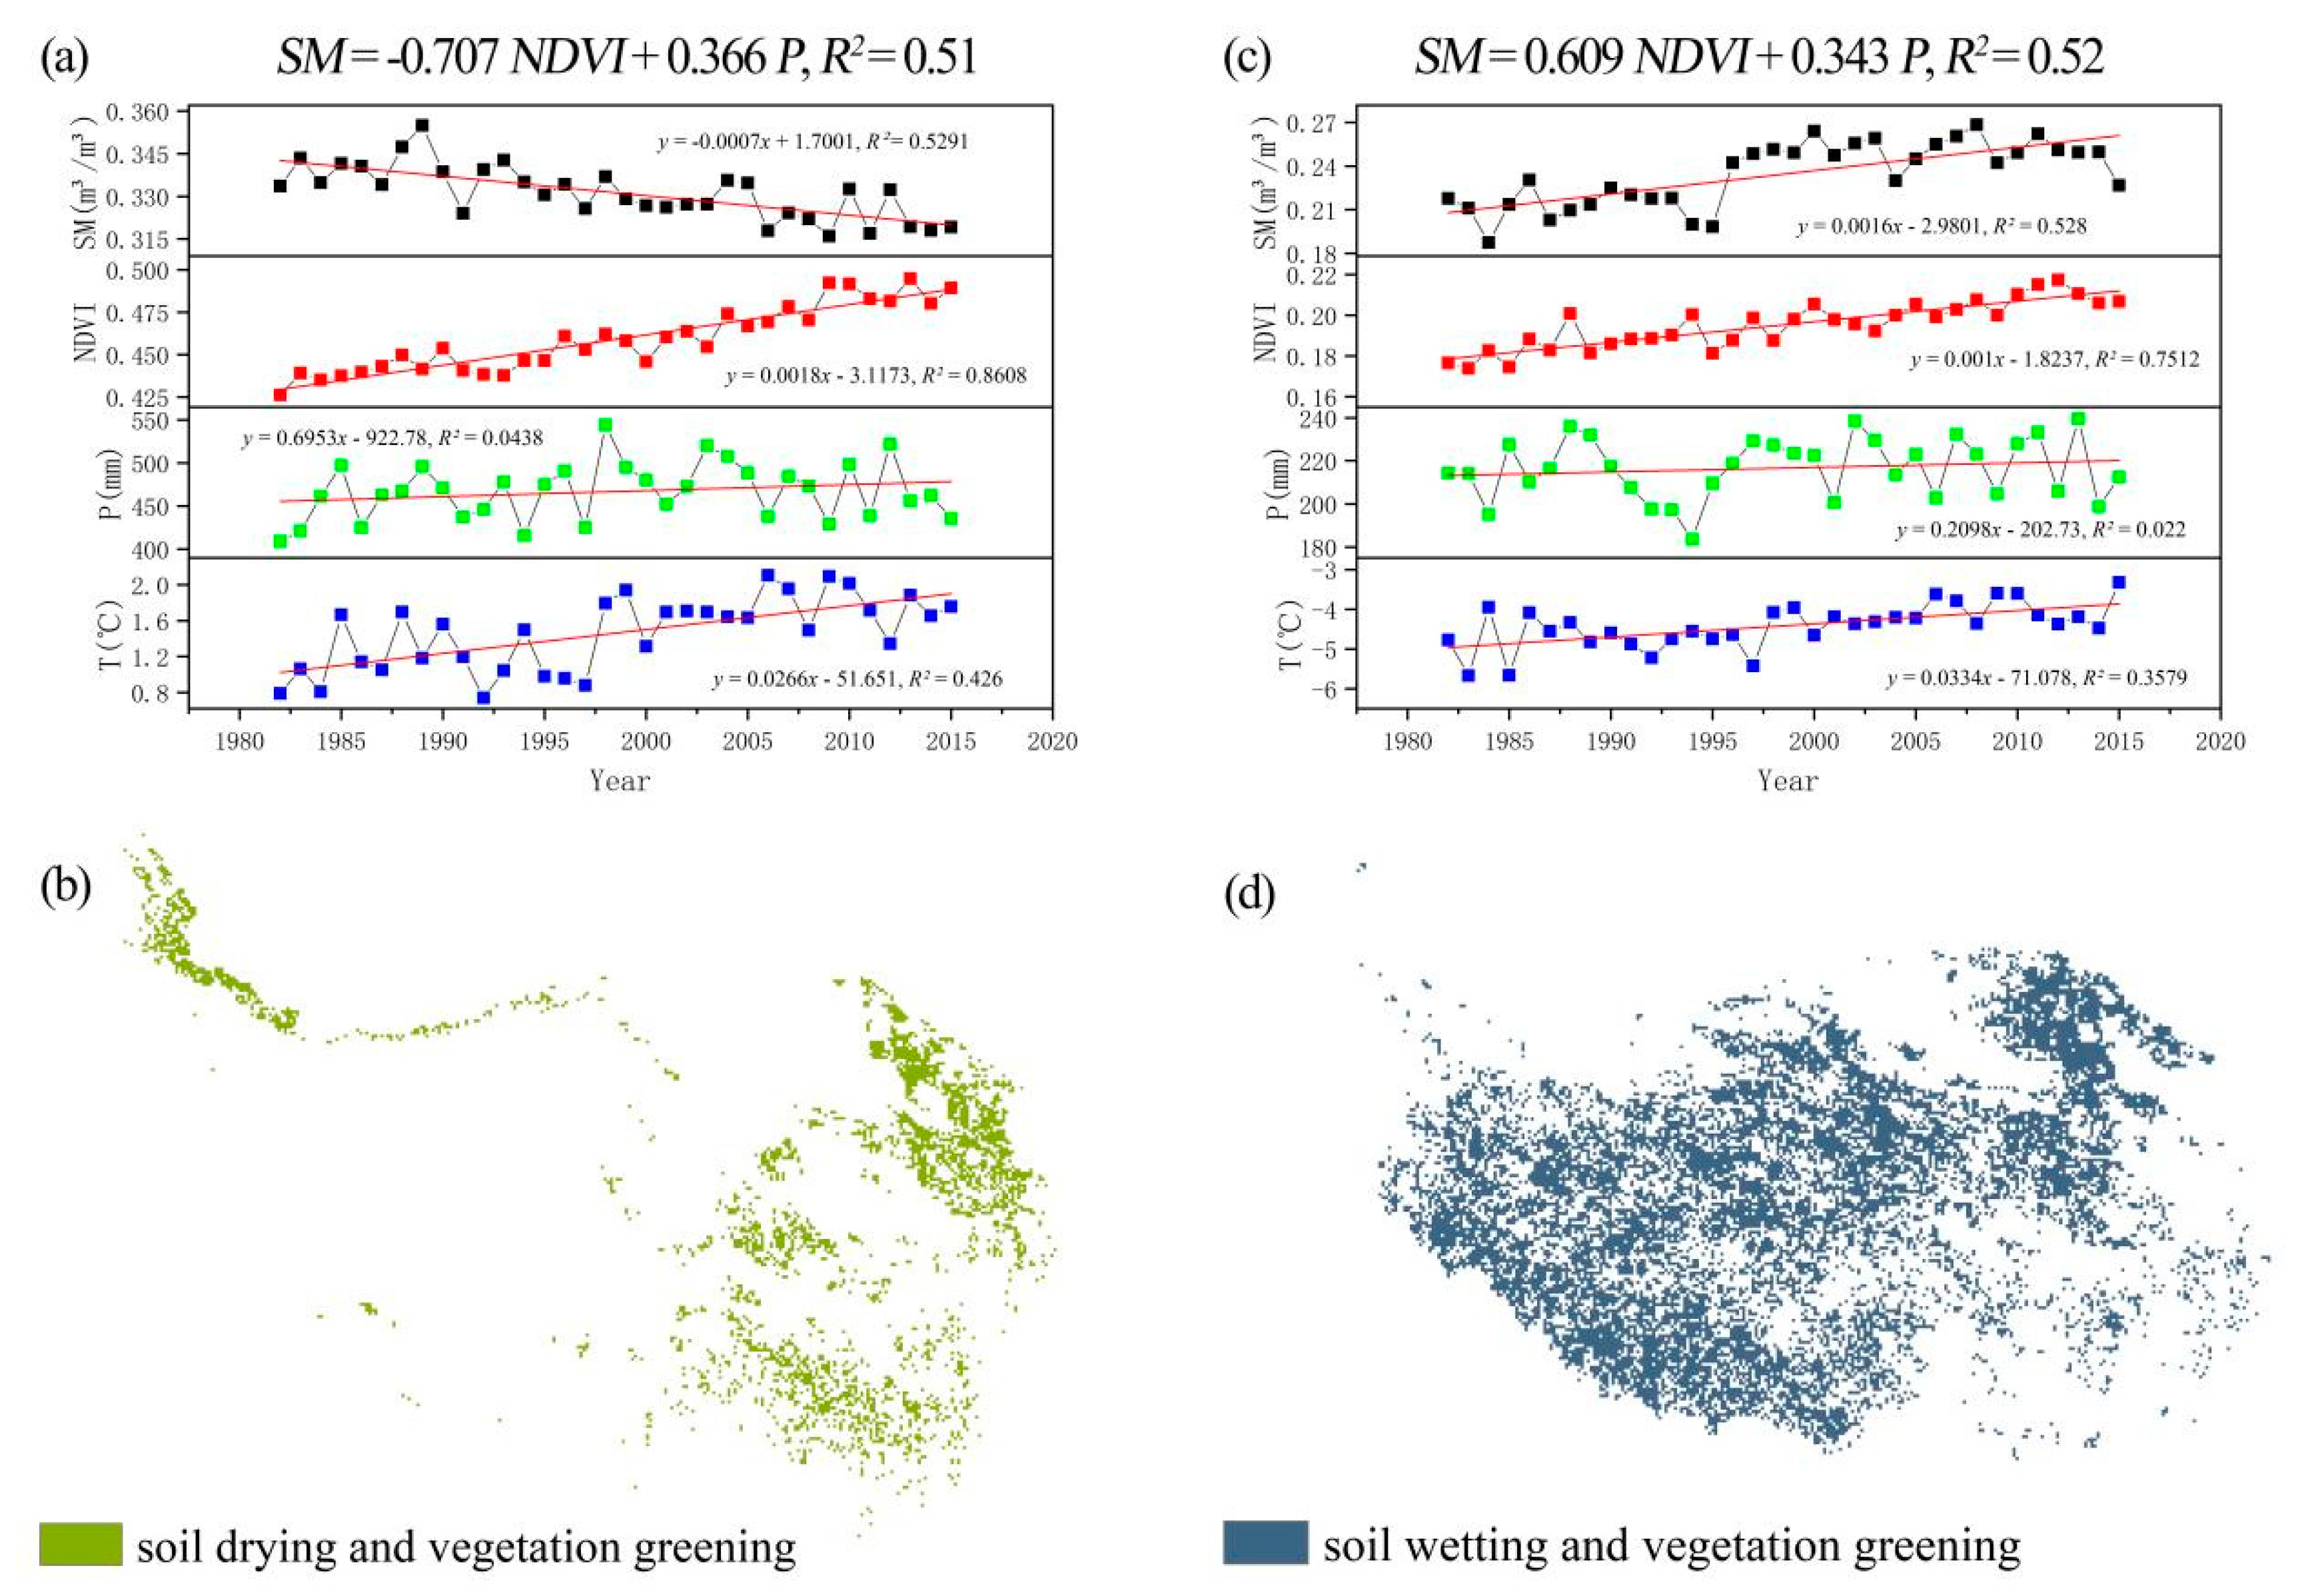
The area where the slope of Theil–Sen of NDVI is greater than 0 is used as the vegetation greening zone, the area where the slope of Theil–Sen of SM is less than 0 is used as the soil drying zone, and the area where the slope of Theil–Sen of SM is greater than 0 is used as the soil wetting zone. As shown in Figure 7, temperature and NDVI increased significantly from 1982 to 2015 in the soil drying zone and the soil wetting zone, while the average annual precipitation showed a non-significant increasing trend. Vegetation growth in the soil drying zone was better than in the soil wetting zone, mainly due to the fact that the average annual precipitation, temperature, and soil water in this region were higher than in the soil wetting zone. The results showed that the soil drying zone and the soil wetting zone were influenced by increased vegetation and precipitation, and that temperature had a minimal effect on soil water. The coefficients indicate that in both scenarios, vegetation has a stronger effect on SM compared to climatic factors.
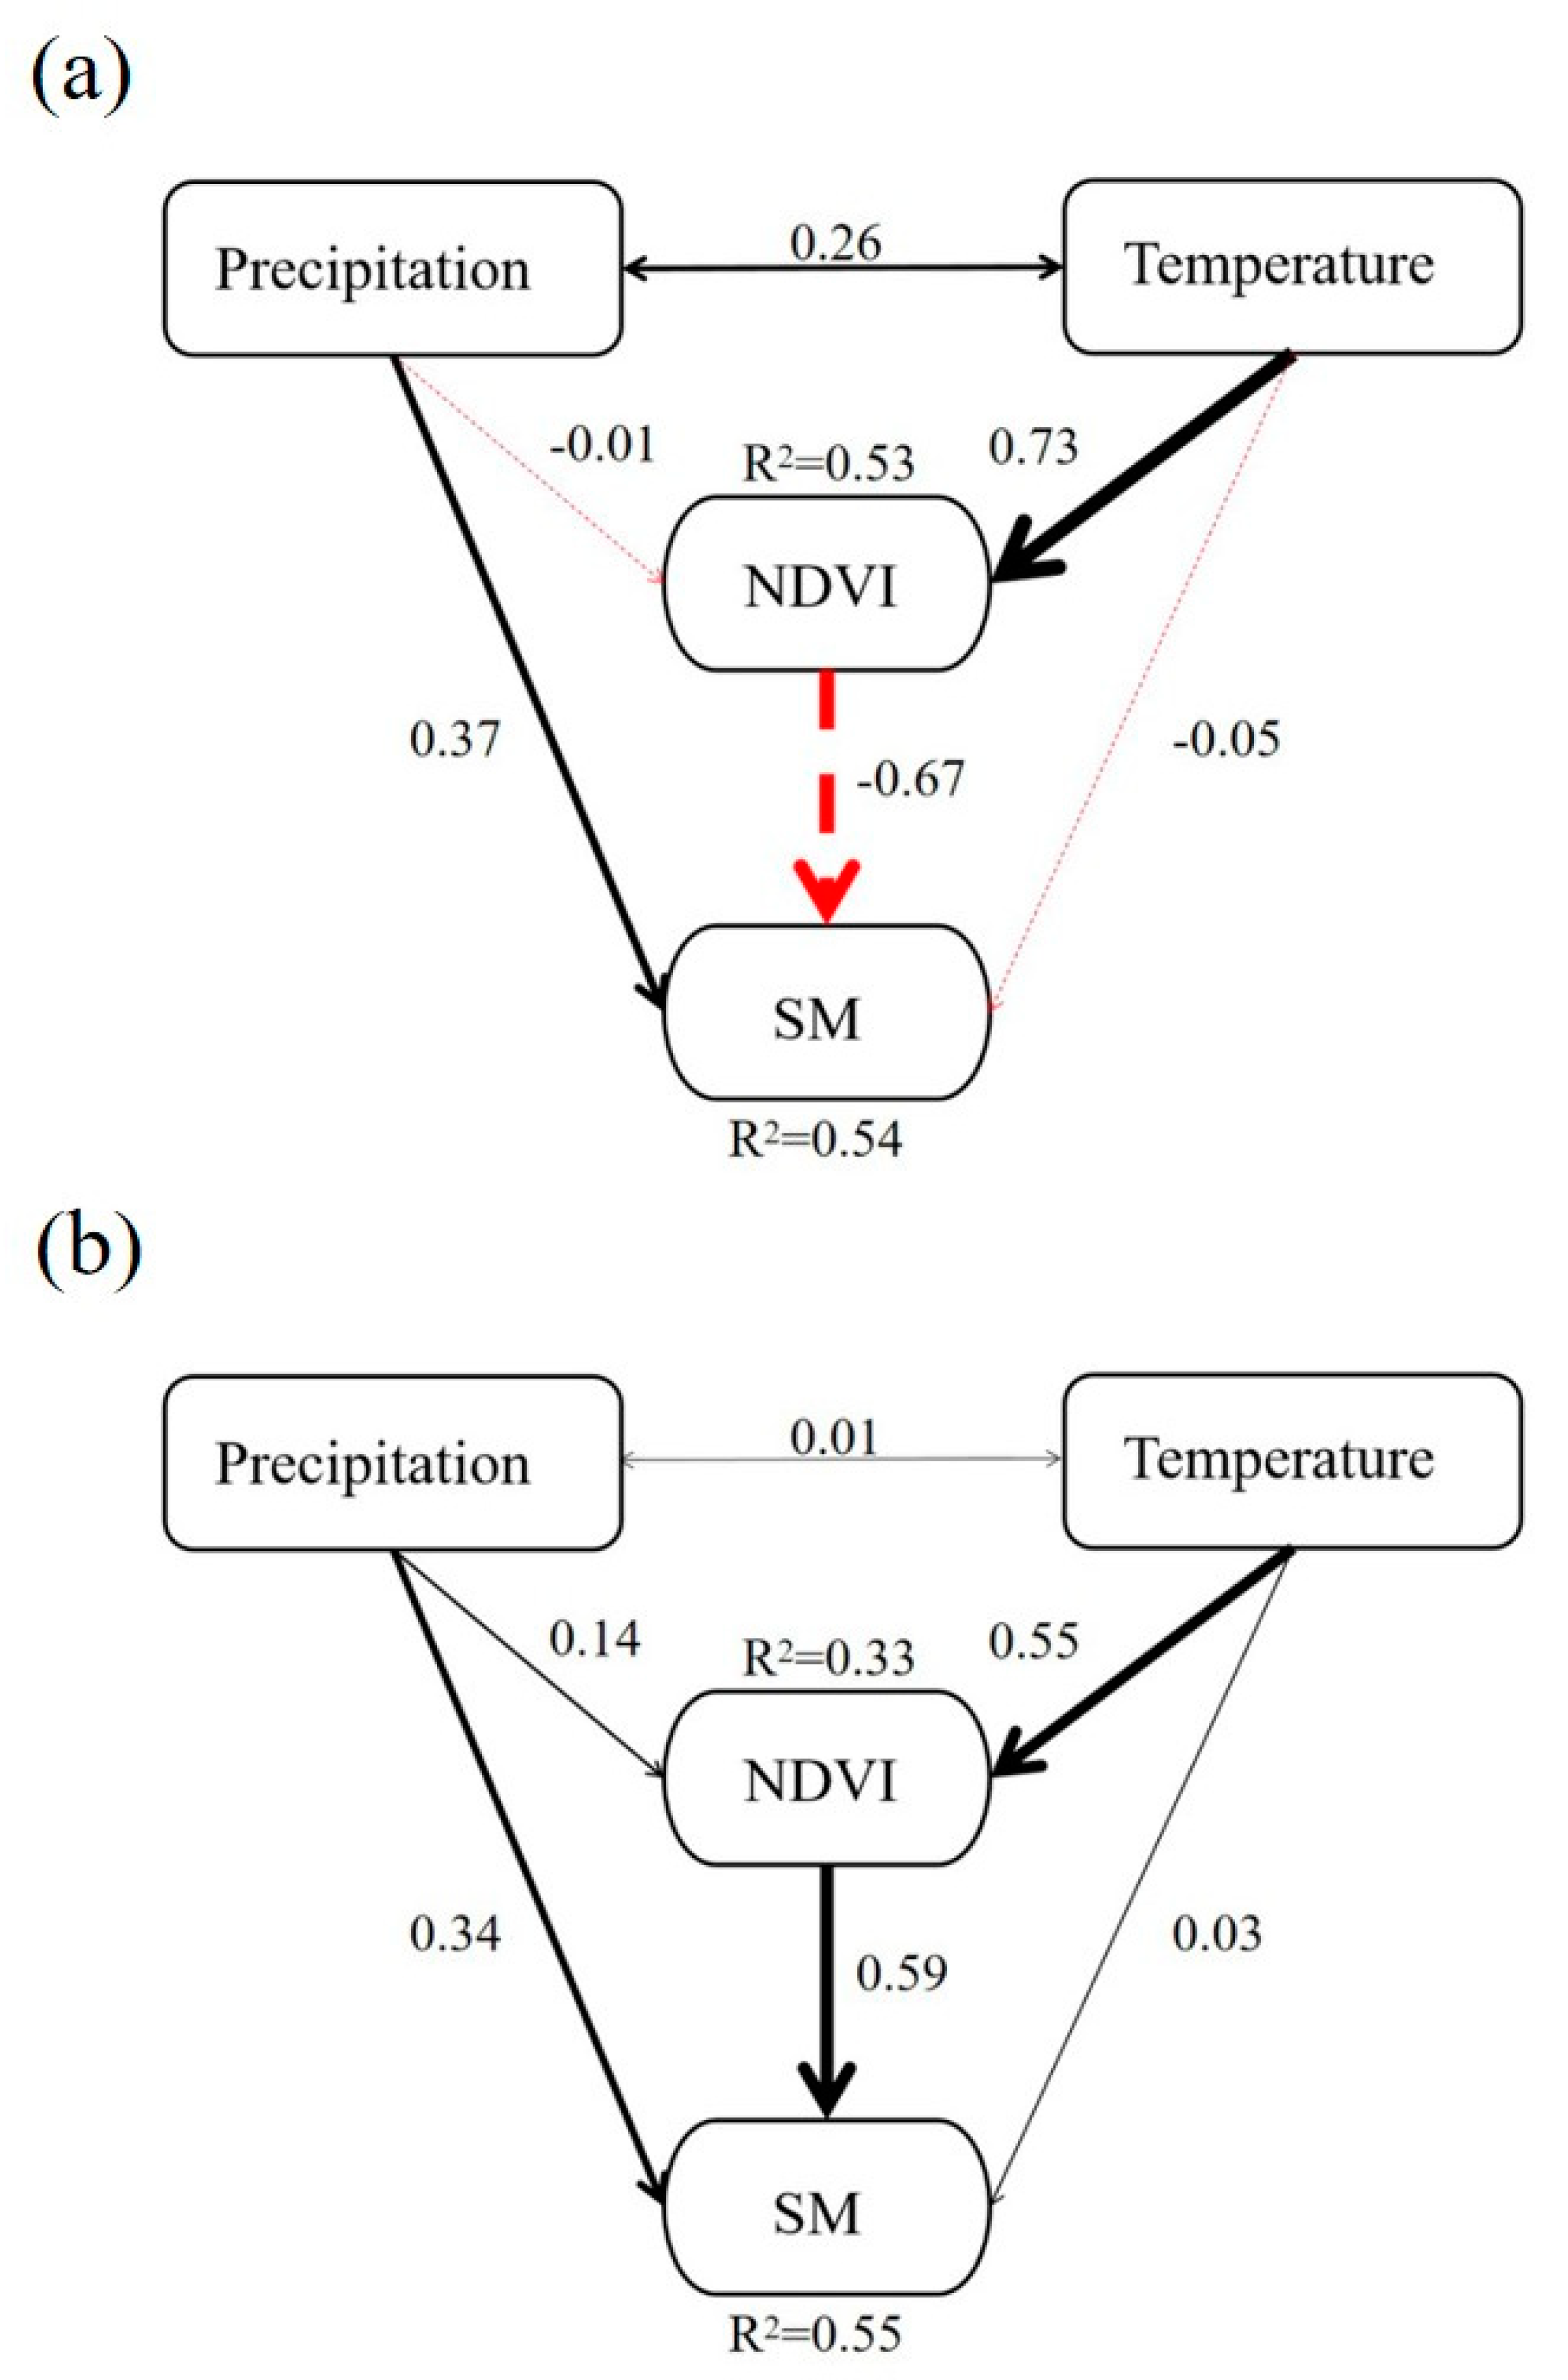
In Figure 8, the SEM shows that the SM in the drying and wetting soil zones is largely influenced by the direct effect of vegetation greening, with vegetation greening bringing about a decrease in SM in the soil drying zone and the opposite in the soil wetting zone. The direct effect of temperature on SM changes was not significant, and temperature indirectly affected SM by significantly promoting vegetation greening. Precipitation had a predominantly direct effect on SM, and the increase in precipitation could significantly increase SM. In summary, in the context that vegetation greening was mainly influenced by the increase in temperature, vegetation played a dominant role in SM changes in the soil drying zone and the soil wetting zone.
The results of this paper indicate a strong correlation between vegetation greening and temperature on the TP, which is consistent with the findings of previous studies that show the sensitivity of vegetation cover changes to temperature changes; the same conclusion was obtained in a study on the relationship between vegetation and climate on the local scale on the TP [45,46]. Increased temperature can promote organic matter production by enhancing plant photosynthesis or promoting mineral nutrient uptake, thus facilitating plant growth and development [47]. However, as temperature increases, the degree of aridity in grassland increases and water deficit can also limit the growth of some vegetation. Furthermore, the TP is an arid and semi-arid region, and the effective water for vegetation mainly comes from precipitation. Zhao et al. [5] concluded that the response of vegetation productivity to temperature increases with time is dominated by moisture when studying the effect of drought on vegetation productivity, which also fully confirms the positive contribution of moisture and temperature to the growth of grasslands in alpine arid and semi-arid regions.
Soil moisture on the TP shows obvious spatial heterogeneity, and the distribution pattern of soil moisture is in good agreement with the spatial distribution of precipitation, showing an overall decreasing trend from northwest to southeast. From the SEM results, it is obvious that NDVI shows a significant negative influence on the eastern part of the TP with good moisture conditions, while the western part of the TP with poor moisture conditions shows a significant positive influence. In the areas with sufficient moisture conditions, the soil moisture content is higher and the soil colloids have a weaker ability to adsorb soil moisture, thus making it easier for vegetation to absorb soil moisture and thus the amount of effect of vegetation greening on the mean soil moisture value is larger. In contrast, in areas with a more arid climate, the soil is dry, the soil colloidal particles have a strong sorption capacity for soil moisture [48,49], and the effective water content of the soil available for vegetation uptake is low, thus making the amount of vegetation influence on soil moisture less.
Vegetation construction can both increase precipitation infiltration to replenish soil moisture and increase soil water loss due to vegetation transpiration, and the key to increasing or decreasing soil moisture is the balance between the two. Greening of vegetation leads to an increase in soil porosity, allowing the soil to store more water. At the same time, the increase in cover due to increased vegetation will also contribute to the rise in soil moisture. This is mainly due to the fact that the greening of vegetation reduces the loss of soil water in evaporation and infiltration, thus allowing more water to be stored in the soil. The reduction of soil evaporation due to greening of vegetation may slow down the inland hydrological microcycle. Before vegetation greening, more of the surface is exposed and thus its soil evaporation is high [50], while after vegetation greening, this water loss is transformed to be absorbed by plants and consumed through vegetation transpiration. Compared to soil evaporation, the rate of water loss due to vegetation transpiration will be relatively slow [51]. The presence of these factors together contributes to the emergence of a synergistic increase between NDVI and SM in grasslands. In the relationship between precipitation and vegetation, soil water reservoirs play a regulatory and buffering role. If the dysfunctional relationship between water and vegetation exceeds the regulating capacity of soil reservoirs, it may lead to depletion of soil reservoirs and the formation of a dry soil layer, which in turn has a negative impact on the established vegetation.
4.4. Prospects for Future Research
The influencing factors of soil moisture are not limited to temperature and precipitation. The variation of soil moisture is caused by the joint action of various factors in the surrounding environment, resulting in a strong spatial heterogeneity of soil moisture, which, as can be seen from the above study, means that the variation of temperature and precipitation in some areas may be slightly different from the local variation of soil moisture. Therefore, in future work, the combined effects of other factors along with temperature and precipitation on soil moisture, such as conditions of surface radiation, light, and soil properties, can be considered in studying the influencing factors of soil moisture.
5. Conclusions
In this paper, using ERA5 soil moisture products, meteorological data and GIMMS NDVI data, we calculated and analyzed the temporal variation characteristics and spatial distribution characteristics of NDVI and SM in the grassland area during the study period using trend analysis and partial correlation analysis, and also evaluated the effects of different environmental factors on soil moisture changes. The main findings are as follows:
The spatial distribution of both vegetation and soil moisture on the TP from 1982 to 2015 showed a heterogeneous distribution, with large differences among different regions, but both were still dominated by an upward trend.
Precipitation is the most important factor influencing SM changes on the TP, followed by NDVI and temperature. Meanwhile, temperature as the dominant factor influencing SM is concentrated in the high-altitude areas in the western part of the TP. The similar cyclic variation among SM, NDVI, and precipitation may lead to a more obvious positive correlation between SM and NDVI and precipitation, while the non-contemporaneous variation between temperature and SM, NDVI, and precipitation makes the correlation between temperature and SM weaker.
In the vegetation greening and soil drying zone and the vegetation greening and soil wetting zone, soil moisture was influenced by the increase in vegetation and precipitation, and the effect of temperature on soil water was minimal. In both scenarios, the influence of vegetation on SM was stronger compared to climatic factors. SEM results show that vegetation plays a dominant role in SM changes in soil drying zones and soil wetting zones in a context where vegetation greening is mainly influenced by increasing temperature.
Overall, with global climate change, the climate–vegetation–soil moisture coupling mechanism of grasslands on the TP has become more complex, and the spatial heterogeneity of related ecological responses and feedbacks has become more pronounced.
Author Contributions
Conceptualization, Z.W. and L.W.; methodology, J.L.; software, L.W. and J.L.; validation, G.D.; formal analysis, R.Z.; investigation, Z.W.; resources, L.W.; writing—original draft preparation, L.W.; writing—review and editing, Z.W., J.L. and R.Z.; supervision, Z.W., J.L. and R.Z.; funding acquisition, Z.W. All authors have read and agreed to the published version of the manuscript.
Funding
This study was supported by the National Natural Science Foundation of China (No. 41671289 and No. 41977077).
Data Availability Statement
The data presented in this study are available on request from the corresponding author.
Acknowledgments
This work was supported by the National Natural Science Foundation of China (No. 41671289 and No. 41977077). We also thank the National Tibetan Plateau Data Centre for NDVI, land use, and meteorological data, the European Centre for Medium-Range Weather Forecasts for soil moisture data, and the anonymous reviewers for improving the paper.
Conflicts of Interest
The authors declare no conflict of interest.
References
- Yan, Y.P.; You, Q.L.; Wu, F.Y.; Pepin, N.; Kang, S.C. Surface mean temperature from the observational stations and multiple reanalyses over the Tibetan Plateau. Clim. Dyn. 2020, 55, 2405–2419. [Google Scholar] [CrossRef]
- Nemani, R.R.; Keeling, C.D.; Hashimoto, H.; Jolly, W.M.; Piper, S.C.; Tucker, C.J.; Myneni, R.B.; Running, S.W. Climate-driven increases in global terrestrial net primary production from 1982 to 1999. Science 2003, 300, 1560–1563. [Google Scholar] [CrossRef] [PubMed] [Green Version]
- Verrall, B.; Pickering, C.M. Alpine vegetation in the context of climate change: A global review of past research and future directions. Sci. Total Environ. 2020, 748, 141344. [Google Scholar] [CrossRef]
- Murthy, K.; Bagchi, S. Spatial patterns of long-term vegetation greening and browning are consistent across multiple scales: Implications for monitoring land degradation. Land Degrad. Dev. 2018, 29, 2485–2495. [Google Scholar] [CrossRef]
- Zhao, M.; Running, S.W. Drought-induced reduction in global terrestrial net primary production from 2000 through 2009. Science 2010, 329, 940–943. [Google Scholar] [CrossRef] [Green Version]
- Liu, C.; Li, W.; Wang, W.; Zhou, H.; Liang, T.; Hou, F.; Xu, J.; Xue, P. Quantitative spatial analysis of vegetation dynamics and potential driving factors in a typical alpine region on the northeastern Tibetan Plateau using the Google Earth Engine. Catena 2021, 206, 105500. [Google Scholar] [CrossRef]
- Li, L.; Zhang, Y.; Liu, L.; Wu, J.; Wang, Z.; Li, S.; Zhang, H.; Zu, J.; Ding, M.; Paudel, B. Spatiotemporal Patterns of Vegetation Greenness Change and Associated Climatic and Anthropogenic Drivers on the Tibetan Plateau during 2000–2015. Remote Sens. 2018, 10, 1525. [Google Scholar] [CrossRef] [Green Version]
- Zhang, X.; Wang, J.; Gao, Y.; Wang, L.X. Variations and controlling factors of vegetation dynamics on the Qingzang Plateau of China over the recent 20 years. Geogr. Sustain. 2021, 2, 74–85. [Google Scholar] [CrossRef]
- Huang, K.; Zhang, Y.; Zhu, J.; Liu, Y.; Zu, J.; Zhang, J. The Influences of Climate Change and Human Activities on Vegetation Dynamics in the Tibetan Plateau. Remote Sens. 2016, 8, 876. [Google Scholar] [CrossRef] [Green Version]
- Liu, J.G.; Yang, H.; Gosling, S.N.; Kummu, M.; Flörke, M.; Pfister, S.; Hanasaki, N.; Wada, Y.; Zhang, X.; Zheng, C.; et al. Water scarcity assessments in the past, present and future. Earth’s Future 2017, 5, 545–559. [Google Scholar] [CrossRef]
- Mankin, J.S.; Seagar, R.; Smerdon, J.E.; Cook, B.I.; Williams, A.P.; Horton, R.M. Blue Water Trade-Offs With Vegetation in a CO2-Enriched Climate. Geophys. Res. Lett. 2018, 45, 3115–3125. [Google Scholar] [CrossRef]
- Feng, X.M.; Fu, B.J.; Piao, S.L.; Wang, S.; Ciais, P.; Zeng, Z.; Lü, Y.; Zeng, Y.; Li, Y.; Jiang, X.; et al. Revegetation in China’s Loess Plateau is approaching sustainable water resource limits. Nat. Clim. Chang. 2016, 6, 1019–1022. [Google Scholar] [CrossRef]
- Liu, Y.; Zhao, L.R.; Liu, Y.F.; Huang, Z.; Shi, J.; Wang, Y.; Ma, Y.; Lucas-Borja, M.E.; López-Vicente, M.; Wu, G.L. Restoration of a hillslope grassland with an ecological grass species (Elymus tangutorum) favors rainfall interception and water infiltration and reduces soil loss on the Qinghai-Tibetan Plateau. Catena 2022, 219, 106632. [Google Scholar] [CrossRef]
- Liu, Y.; Li, S.Y.; Shi, J.J.; Niu, Y.; Cui, Z.; Zhang, Z.; Wang, Y.; Ma, Y.; López-Vicente, M.; Wu, G.L. Effectiveness of mixed cultivated grasslands to reduce sediment concentration in runoff on hillslopes in the Qinghai-Tibetan Plateau. Geoderma 2022, 422, 115933. [Google Scholar] [CrossRef]
- Niu, Y.L.; Li, S.Y.; Liu, Y.; Shi, J.; Wang, Y.; Ma, Y.; Wu, G.L. Regulation of alpine meadow patch coverage on runoff and sediment under natural rainfall on the eastern Qinghai-Tibetan Plateau. J. Hydrol. 2021, 603, 127101. [Google Scholar] [CrossRef]
- Stothoff, S.A.; Or, D.; Groeneveld, D.P.; Jones, S.B. The effect of vegetation on infiltration in shallow soils underlain by fissured bedrock. J. Hydrol. 1999, 218, 169–190. [Google Scholar] [CrossRef]
- Sun, G.; Zhou, G.Y.; Zhang, Z.Q.; Wei, X.H.; McNulty, S.G.; Vose, J.M. Potential water yield reduction due to forestation across China. J. Hydrol. 2005, 328, 548–558. [Google Scholar] [CrossRef]
- Deng, Y.H.; Wang, S.J.; Bai, X.Y.; Luo, G.; Wu, L.; Chen, F.; Wang, J.; Li, C.; Yang, Y.; Hu, Z.; et al. Vegetation greening intensified soil drying in some semi-arid and arid areas of the world. Agric. For. Meteorol. 2020, 292–293, 108103. [Google Scholar] [CrossRef]
- Tang, G.Q.; Long, D.; Hong, Y.; Gao, J.; Wan, W. Documentation of multifactorial relationships between precipitation and topography of the Tibetan Plateau using spaceborne precipitation radars. Remote Sens. Environ. 2018, 208, 82–96. [Google Scholar] [CrossRef]
- Wu, S.H.; Yang, Q.Y.; Zheng, D. Delineation of eco-geographic regional system of China. J. Geogr. Sci. 2003, 13, 309–315. [Google Scholar]
- Liu, Y.C.; Li, Z.; Chen, Y.N.; Li, Y.; Li, H.; Xia, Q.; Kayumba, P.M. Evaluation of consistency among three NDVI products applied to High Mountain Asia in 2000–2015. Remote Sens. Environ. 2022, 269, 112821. [Google Scholar] [CrossRef]
- Dee, D.P.; Uppala, S.M.; Simmons, A.J.; Berrisford, P.; Poli, P.; Kobayashi, S.; Andrae, U.; Balmaseda, M.A.; Balsamo, G.; Bauer, P.; et al. The ERA-Interim reanalysis: Configuration and performance of the data assimilation system. Q. J. R. Meteorol. Soc. 2011, 137, 553–597. [Google Scholar] [CrossRef]
- Deng, Y.; Wang, S.; Bai, X.; Luo, G.; Wu, L.; Cao, Y.; Li, H.; Li, C.; Yang, Y.; Hu, Z.; et al. Variation trend of global soil moisture and its cause analysis. Ecol. Indic. 2020, 110, 105939. [Google Scholar] [CrossRef]
- Duveiller, G.; Hooker, J.; Cescatti, A. The mark of vegetation change on Earth’s surface energy balance. Nat. Commun. 2018, 9, 679. [Google Scholar] [CrossRef] [PubMed] [Green Version]
- Gorbach, T.; Luna, X. Inference for partial correlation when data are missing not at random. Stat. Probab. Lett. 2018, 141, 82–89. [Google Scholar] [CrossRef] [Green Version]
- Liu, Y.Y.; Zhou, R.L.; Ren, H.Y.; Zhang, W.; Zhang, Z.X.; Zhang, Z.Y.; Wen, Z.M. Evaluating the dynamics of grassland net primary productivity in response to climate change in China. Glob. Ecol. Conserv. 2021, 28, e01574. [Google Scholar] [CrossRef]
- Gao, J.; Jiao, K.; Wu, S. Investigating the spatially heterogeneous relationships between climate factors and NDVI in China during 1982 to 2013. J. Geogr. Sci. 2019, 29, 1597–1609. [Google Scholar] [CrossRef] [Green Version]
- Li, P.; Wang, J.; Liu, M.M.; Xue, Z.; Bagherzadeh, A.; Liu, M. Spatio-temporal variation characteristics of NDVI and its response to climate on the Loess Plateau from 1985 to 2015. Catena 2021, 203, 105331. [Google Scholar] [CrossRef]
- Anderson, J.C.; Gerbing, D.W. Structural equation modeling in practice: A review and recommended two-step approach. Psychol. Bull. 1988, 103, 411–423. [Google Scholar] [CrossRef]
- Kline, R.B. Latent variable path analysis in clinical research: A beginner’s tour guide. J. Clin. Psychol. 1991, 47, 471–484. [Google Scholar] [CrossRef]
- Ashraf, F.B.; Haghighi, A.T.; Riml, J.; Mathias Kondolf, G.; Kløve, B.; Marttila, H. A method for assessment of sub-daily flow alterations using wavelet analysis for regulated rivers. Water Resour. Res. 2022, 58, e2021WR03. [Google Scholar] [CrossRef]
- Meng, Y.; Sun, W. Relationship between the Formation of PM2.5 and Meteorological Factors in Northern China: The Periodic Characteristics of Wavelet Analysis. Adv. Meteorol. 2021, 2021, 9723676. [Google Scholar] [CrossRef]
- Yang, T.; Wang, G. Periodic variations of rainfall, groundwater level and dissolved radon from the perspective of wavelet analysis: A case study in Tengchong, southwest China. Environ. Earth Sci. 2021, 80, 492. [Google Scholar] [CrossRef]
- Oh, H.; Ha, K.J. Prediction of dominant intraseasonal modes in the East Asian-western North Pacific summer monsoon. Clim. Dyn. 2016, 47, 2025–2037. [Google Scholar] [CrossRef]
- Cheng, G.; Wu, Q.; Li, R.; Li, X.; Sheng, Y.; Hu, G.; Zhao, L.; Jin, H.; Zou, D.; Wu, X. Characteristic, changes and impacts of permafrost on Tibetan Plateau. Chin. Sci. Bull. 2019, 64, 2783–2795. [Google Scholar]
- Xie, Q.; Li, J.; Zhao, Y. Effects of Air Temperature and Precipitation on Soil Moisture on the Tibetan Plateau during the 2015 Growing Season. Adv. Meteorol. 2020, 2020, 4918945. [Google Scholar] [CrossRef]
- Liu, Y.; Yang, Y. Multi-depth evolution characteristics of soil moisture over the Tibetan Plateau in the past 70 years using reanalysis products. Front. Environ. Sci. 2022, 10, 979853. [Google Scholar] [CrossRef]
- Si, M.K.; Guo, X.W.; Lan, Y.T.; Fan, B.; Cao, G. Effects of Climatic Variability on Soil Water Content in an Alpine Kobresia Meadow, Northern Qinghai–Tibetan Plateau, China. Water 2022, 14, 2754. [Google Scholar] [CrossRef]
- Li, H.; Liu, F.; Zhang, S.; Zhang, C.; Zhang, C.; Ma, W.; Luo, J. Drying–Wetting Changes of Surface Soil Moisture and the Influencing Factors in Permafrost Regions of the Tibetan Plateau, China. Remote Sens. 2022, 14, 2915. [Google Scholar] [CrossRef]
- Li, L.; Yang, S.; Wang, Z.; Zhu, X.; Tang, H. Evidence of Warming and Wetting Climate over the Tibetan Plateau. Arct. Antarct. Alp. Res. 2010, 42, 449–457. [Google Scholar] [CrossRef]
- Sun, C.; Xu, X.D.; Wang, P.J.; Yang, D.; Zhang, S.-J.; Wang, C.-Z.; Cai, W.-Y. The Warming and Wetting Ecological Environment Changes over the QinghaiTibetan Plateau and the Driving Effect of the Asian Summer Monsoon. J. Trop. Meteorol. 2022, 28, 95–108. [Google Scholar]
- Pang, Q.; Zhao, L.; Li, S.; Ding, Y. Active layer thickness variations on the Qinghai–Tibet Plateau under the scenarios of climate change. Environ. Earth Sci. 2012, 66, 849–857. [Google Scholar] [CrossRef]
- Liu, Q.; Du, J.; Shi, J.; Jiang, L. Analysis of spatial distribution and multi-year trend of the remotely sensed soil moisture on the tibetan plateau. Sci. China Earth Sci. 2013, 56, 2173–2185. [Google Scholar] [CrossRef]
- Chen, C.; He, B.; Yuan, W.P.; Guo, L.L.; Zhang, Y.F. Increasing interannual variability of global vegetation greenness. Environ. Res. Lett. 2019, 14, 124005. [Google Scholar] [CrossRef]
- Zhang, Y.X.; Xu, G.C.; Li, P.; Li, Z.B.; Wang, Y.; Wang, B.; Jia, L.; Cheng, Y.T.; Zhang, J.X.; Zhuang, S.H.; et al. Vegetation change and its relationship with climate factors and elevation on the Tibetan plateau. Int. J. Environ. Res. Public Health 2019, 16, 4709. [Google Scholar] [CrossRef] [PubMed] [Green Version]
- Wang, Y.; Peng, D.L.; Shen, M.G.; Xu, X.Y.; Yang, X.H.; Huang, W.; YU, L.; Liu, L.; Li, C.; Li, X.; et al. Contrasting Effects of Temperature and Precipitation on Vegetation Greenness along Elevation Gradients of the Tibetan Plateau. Remote Sens. 2020, 12, 2751. [Google Scholar] [CrossRef]
- Gao, W.D.; Zheng, C.; Liu, X.H.; Lu, Y.D.; Chen, Y.F.; Wei, Y.; Ma, Y.D. NDVI-based vegetation dynamics and their responses to climate change and human activities from 1982 to 2020: A case study in the Mu Us Sandy Land, China. Ecol. Indic. 2022, 137, 108745. [Google Scholar] [CrossRef]
- Bai, X.; Jia, X.X.; Jia, Y.H.; Shao, M.A.; Hu, W. Modeling long-term soil water dynamics in response to land-use change in a semi-arid area. J. Hydrol. 2020, 585, 124824. [Google Scholar] [CrossRef]
- McColl, K.A.; Alemohammad, S.H.; Akbar, R.; Konings, A.G.; Yueh, S.; Entekhabi, D. The global distribution and dynamics of surface soil moisture. Nat. Geosci. 2017, 10, 100–104. [Google Scholar] [CrossRef]
- Qiu, L.; Wu, Y.; Shi, Z.; Yu, M.; Zhao, F.; Guan, Y. Quantifying spatiotemporal variations in soil moisture driven by vegetation restoration on the Loess Plateau of China. J. Hydrol. 2021, 600, 126580. [Google Scholar] [CrossRef]
- Miguez-Macho, G.; Fan, Y. Spatiotemporal origin of soil water taken up by vegetation. Nature 2021, 598, 624–628. [Google Scholar] [CrossRef] [PubMed]
Figure 1.
The location of the TP and spatial distribution of eco-geographic regions and grasslands. (a) Location of the Tibetan Plateau in China; (b) distribution patterns of grasslands on the Tibetan Plateau in 1992, 2005, and 2015; (c) ecogeographic divisions summarized in the table.
Figure 1.
The location of the TP and spatial distribution of eco-geographic regions and grasslands. (a) Location of the Tibetan Plateau in China; (b) distribution patterns of grasslands on the Tibetan Plateau in 1992, 2005, and 2015; (c) ecogeographic divisions summarized in the table.

Figure 2.
Spatial distribution and trends of NDVI and SM in grasslands on the TP from 1982 to 2015. (a,c) spatial distribution of annual grassland NDVI and SM, respectively. (b,d) spatial distribution of trends of annual grassland NDVI and SM, respectively; the illustration in the bottom left corner shows the significance (p < 0.05) of the change in trend.

Figure 3.
Partial correlation coefficients between (a) NDVI, (b) precipitation, (c) temperature and SM from 1982 to 2015, and (d) dominant factors influencing SM.
Figure 3.
Partial correlation coefficients between (a) NDVI, (b) precipitation, (c) temperature and SM from 1982 to 2015, and (d) dominant factors influencing SM.

Figure 4.
Percentage statistics of positive and negative correlations of (a) NDVI, (b) precipitation, and (c) temperature with SM; (d) area percentage of dominant factors.
Figure 4.
Percentage statistics of positive and negative correlations of (a) NDVI, (b) precipitation, and (c) temperature with SM; (d) area percentage of dominant factors.

Figure 5.
Interannual variation of annual mean precipitation (P), temperature (T), NDVI, and SM in (a) humid, (c) semi-arid, and (e) arid regions of the Tibetan Plateau from 1982 to 2015. ⁎⁎⁎, ⁎⁎, ⁎ represents significance levels of 0.001, 0.01, 0.05; stepwise regression equations for SM are shown at the top of (a,c,e). (b,d,f) are the results of structural equation modeling of the relationship between NDVI, precipitation, temperature, and SM.

Figure 6.
Wavelet analysis results of SM, NDVI, precipitation (P), and temperature (T) on the Tibetan Plateau from 1982 to 2015: the wavelet coefficient contour plot is on the left, the wavelet variance plot is in the middle, and the right panel indicates the process of wavelet coefficient variation in the real part.

Figure 7.
Changes in annual mean precipitation (P), temperature (T), NDVI, and SM in the (a) soil drying and (c) soil wetting zones from 1982 to 2015. The stepwise regression equation for SM is shown at the top of Figure 7. (b,d) are the spatial distribution of soil drying and soil wetting zones, respectively.

Figure 8.
Results of structural equation modeling of the relationship between NDVI, precipitation, temperature, and SM in the (a) soil drying zone and the (b) soil wetting zone. A solid black line indicates a positive coefficient, a dashed red line indicates a negative coefficient and the thickness of the line indicates the absolute value.


Table 1.
Area percentage of dominant factors causing SM changes in humid and arid regions (%).
| Humid Regions | Arid Regions | |
|---|---|---|
| NDVI | 35.68 | 41.29 |
| Precipitation | 52.09 | 46.09 |
| Temperature | 12.23 | 12.62 |
Disclaimer/Publisher’s Note: The statements, opinions and data contained in all publications are solely those of the individual author(s) and contributor(s) and not of MDPI and/or the editor(s). MDPI and/or the editor(s) disclaim responsibility for any injury to people or property resulting from any ideas, methods, instructions or products referred to in the content. |
© 2023 by the authors. Licensee MDPI, Basel, Switzerland. This article is an open access article distributed under the terms and conditions of the Creative Commons Attribution (CC BY) license (https://creativecommons.org/licenses/by/4.0/).
Share and Cite
MDPI and ACS Style
Wang, L.; Lu, J.; Zhou, R.; Duan, G.; Wen, Z. Analysis of Soil Moisture Change Characteristics and Influencing Factors of Grassland on the Tibetan Plateau. Remote Sens. 2023, 15, 298. https://doi.org/10.3390/rs15020298
AMA Style
Wang L, Lu J, Zhou R, Duan G, Wen Z. Analysis of Soil Moisture Change Characteristics and Influencing Factors of Grassland on the Tibetan Plateau. Remote Sensing. 2023; 15(2):298. https://doi.org/10.3390/rs15020298
Chicago/Turabian StyleWang, Licheng, Jinxin Lu, Ronglei Zhou, Gaohui Duan, and Zhongming Wen. 2023. "Analysis of Soil Moisture Change Characteristics and Influencing Factors of Grassland on the Tibetan Plateau" Remote Sensing 15, no. 2: 298. https://doi.org/10.3390/rs15020298
Note that from the first issue of 2016, this journal uses article numbers instead of page numbers. See further details here.