Multi-depth evolution characteristics of soil moisture over the Tibetan Plateau in the past 70 years using reanalysis products
 Yangxiaoyue Liu1,2*
  Yaping Yang1,2
- 1State Key Laboratory of Resources and Environmental Information Systems, Institute of Geographic Sciences and Natural Resources Research, Chinese Academy of Sciences, Beijing, China
- 2Jiangsu Center for Collaborative Innovation in Geographical Information Resource Development and Application, Nanjing, China
Soil moisture (SM) is a crucial component of the hydrological cycle. Both the spatial–temporal distribution and the variation characteristics of SM are effective indicators of regional land surface water resource homogeneity and heterogeneity. With consideration of the crucial role of the Tibetan Plateau (TP) in the hydrological process in Asia, this study investigated the fluctuation of multi-depth soil moisture across the TP during 1950–2020 on a monthly scale against the background of global warming by using ERA5 reanalysis datasets. The correlation and potential causality between soil moisture and associated driving factors were explored. Our research revealed that the soil moisture across the TP shows a slight wetting trend at 0–100 cm depth for the past 70 years against the background of climate warming and increasing precipitation. Additionally, the wetting region (variation trend ≥ 0.005 m3/m3 per decade) had sufficient water supplementation from precipitation and a mild soil temperature increase. By comparison, there is a noteworthy warming tendency and falling precipitation in the sparsely distributed drying region (variation trend ≤ −0.005 m3/m3 per decade). In terms of vertical variation features, the temporal dynamic fluctuation of soil moisture and soil temperature evidently decreases as the depth increases, suggesting high sensitivity of the surface layer soil to atmospheric conditions. Precipitation and snowmelt preliminarily proved to be the dominant drivers causing spatial and temporal variations in soil moisture (occupying over 70% of the TP region), and bidirectional causality (ranging between 15.52% and 50.56%) was found between soil moisture and these two parameters. In summary, this study explored the spatial–temporal fluctuation in the evolutionary characteristics of SM, which is expected to advance our understanding of soil moisture dynamics under the conditions of climate change across the TP.
1 Introduction
Soil moisture is an important form of surface water storage and is widely recognized as an indispensable climate variable across the globe (Dorigo and De Jeu, 2016; Gruber et al., 2019; Deng et al., 2020a). The soil moisture layer is a pivotal area where atmospheric water, surface water, groundwater, and vegetation water are connected and exchanged (Koster et al., 2004; Swenson et al., 2008; Chen et al., 2014). Soil moisture is also a critical vehicle for storing and exchanging carbon, nitrogen, phosphorus, and other nutrients, which could have far-reaching effects on the growth of vegetation and microorganisms in ecosystems (Xu et al., 2004; Flanagan and Johnson, 2005). The spatial–temporal distribution of and variations in soil moisture directly affect geochemical, climatic, ecological, and hydrological processes and their interactions on the Earth’s surface (Verrot and Destouni, 2016; Dorigo et al., 2017). Thus, it is important to investigate how soil moisture fluctuates both temporally and spatially across different depths and what the potential climate drivers could be.
Because it is essential to acquire sufficient soil moisture records before variation analysis, great efforts have been devoted to the monitoring of soil moisture since the 1930s (Robock et al., 2000). First, in situ measurements emerged as an effective and efficient method to detect and record accurate soil moisture levels at exact locations and depths (Dorigo et al., 2011). Nevertheless, as the requirements gradually changed from regional to large-scale observations, it was barely possible for point-scale-based measurements to provide a plausible spatial-continuous dataset. With the development of satellite technology, remotely sensed soil moisture observations have brought unprecedented opportunities for the availability of products with global coverage (Attema et al., 1998; Njoku et al., 2003; Bartalis et al., 2007; Spencer et al., 2010). Numerous satellite-retrieved soil moisture products have been utilized in various hydrological studies (Lakshmi et al., 2004; Seneviratne et al., 2010; Dorigo et al., 2017). However, owing to the limited penetration capacity of microwave signals and radio frequency interference, widespread gap regions exist in remotely sensed soil moisture retrievals, and microwave signals can merely depict the surface (> 5 cm) soil water content (Wang and Qu, 2009; Bradley et al., 2010). Comparatively speaking, the root-zone soil humidity conditions are certainly equally important in indicating agricultural drought levels, especially in analyzing the effects of water stress on the growth and yield of crops. Therefore, it is important to acquire multi-depth soil humidity information to gain a comprehensive understanding of the integral state of multi-depth soil moisture.
The accessibility of multi-depth soil moisture data is made possible by the emergence of data assimilation algorithms. The data assimilation approach integrates multi-source heterogeneous data to drive land surface models to retrieve long time-series surface parameter estimations. Moreover, it simultaneously overcomes the limitations of spatial representation of in situ measurements, improves the restricted penetration depth of spaceborne microwave signals, and realizes the multi-depth spatial–temporal seamless coverage of soil moisture (Spennemann et al., 2015). Reanalysis data are derived by using a state-of-the-art data assimilation system to combine and optimally integrate various types of observation data with short-term weather forecast products (Hersbach et al., 2020). ERA5, the fifth generation of the European Centre for Medium-Range Weather Forecasts reanalysis, continuously provides soil moisture information for 0–289 cm depth and numerous climate variables across the globe since 1950 (Mahto and Mishra, 2019). Great attention has been paid to evaluation of the ERA5 soil moisture products since its inception. Li et al. (2020) validated soil moisture data originating from five reanalyses, namely the Japanese 55-year reanalysis (JRA-55) (Kobayashi et al., 2015), the National Centers for Environmental Prediction Climate Forecast System Reanalysis (CFSR) (Ek et al., 2003), the Modern-Era Retrospective analysis for Research and Applications version 2 (MERRA-2) (Gelaro et al., 2017), ERA-Interim (Dee et al., 2011), and ERA5. ERA5 showed better performance than the other four retrievals, as indicated by a high correlation coefficient and favorable annual cycles. Mahto and Mishra (2019) evaluated the quality of ERA5 soil moisture data in India, and they found that ERA5 can be either better than or comparable to other products retrieved from JRA-55, CFSR, MERRA-2, and ERA-Interim. Additionally, the applicability of ERA5 and ERA-Interim in describing soil moisture conditions across the Tibetan Plateau (TP) was acknowledged in previous studies (Zeng et al., 2015; Cheng et al., 2019). Many other climate variables of ERA5 (i.e., precipitation, temperature, evaporation) were also thoroughly assessed and found to be valuable for hydrological and climate change applications (Olauson, 2018; Mahto and Mishra, 2019; Xin et al., 2021).
The TP, known as the “third pole” and the roof of the world, is the highest plateau in the world, with an average altitude of approximately 4,000–5,000 m (Yang et al., 2013). Given the climate particularity and ecological fragility caused by its unique terrain and location, the TP acts as an initiator and regulator of climate variation in the Northern Hemisphere. The climate evolution of the TP not only remarkably influences the corresponding climate change in Asia but also has a considerable impact on the Northern Hemisphere. Additionally, the TP can reveal notable sensitivity, advancement, and regulation of global climate change. Climate warming accelerates global hydrological circulation and strengthens the process of soil water evaporation (Li et al., 2022). Soil moisture, a critical component of the water cycle, is regarded as an effective indicator of climate change (Deng et al., 2020b). It is of great significance to systematically explore the evolutionary trend of soil moisture to promote the understanding of surface water circulation characteristics in the context of global warming. However, little is known about the trend of soil moisture across the TP, and previous studies have mainly focused on the accuracy evaluation of multi-source soil moisture products derived from in situ measurements (Bai et al., 2017; Chen et al., 2017; Xie et al., 2017; Li et al., 2018; Cheng et al., 2019; Xing et al., 2021).
In this study, the multi-depth soil moisture variation trend across the TP was disclosed by using ERA5 products with the long-term perspective of 1950–2020. Closely related climate variables, including soil temperature, precipitation, snowmelt, and evaporation, were used to investigate potential causal links that may trigger variations in soil moisture. The main purpose of this study was to clarify the spatial and temporal fluctuation rules of multi-depth soil moisture and to investigate the dominant climatic factors that trigger the evolution of soil moisture. This paper is organized as follows. Section 2 introduces the basic properties of the TP, including location, terrain, climate, and land cover. The ERA5 soil moisture and ancillary climate variable datasets utilized in this study are also briefly introduced. In addition, the employed spatiotemporal trend analysis and causality investigation approaches are presented. Section 3 describes the investigation results for temporal–spatial soil moisture and soil temperature variation trends across the TP, which reflect the evolutionary characteristics of the synthetic climate regime in the past 70 years. Moreover, the potential causal links between soil moisture and climatic parameters are investigated. In the final section, apart from the abovementioned climate variables, we discuss the other possible inherent mechanisms that may induce the fluctuations in soil moisture and explore the uncertain factors that may influence the results. Finally, conclusions are drawn from this study to summarize the findings and demonstrate future research directions.
2 Study region, data resources, and methodology
2.1 Study region
As shown in Figure 1A, the TP is the highest plateau in the world and is situated in Inner Asia (Gasse et al., 1991; Wang et al., 2021). Specifically, the TP, with a gross area of approximately 2.5 × 10⁶ km2, is located between 26°00′–39°47′ N (spanning 300–1,500 km from north to south) and 73°19′–104°47′ E (spanning 2,800 km from east to west). The steep and complex terrain fluctuates greatly, ranging from 84 to 8,848 m. Generally, the terrain is relatively high in the west and low in the east. As presented in Figure 2B, the southeast margin is dominated by a tropical humid/semi-humid climate, and the remaining vast region contains semi-humid, semi-arid, and arid zones. Correspondingly, the southeastern margin is mainly covered by forests and humid soils. In comparison, alpine meadows, alpine scrubs, and desert meadows dominate the plateau climate region, along with relatively moderate soil moisture content. Moreover, there is a vast area of desert in the north of the TP, which is an important sensitive heat source in the Earth system, accompanied by high albedo, small soil heat capacity, and low water content.
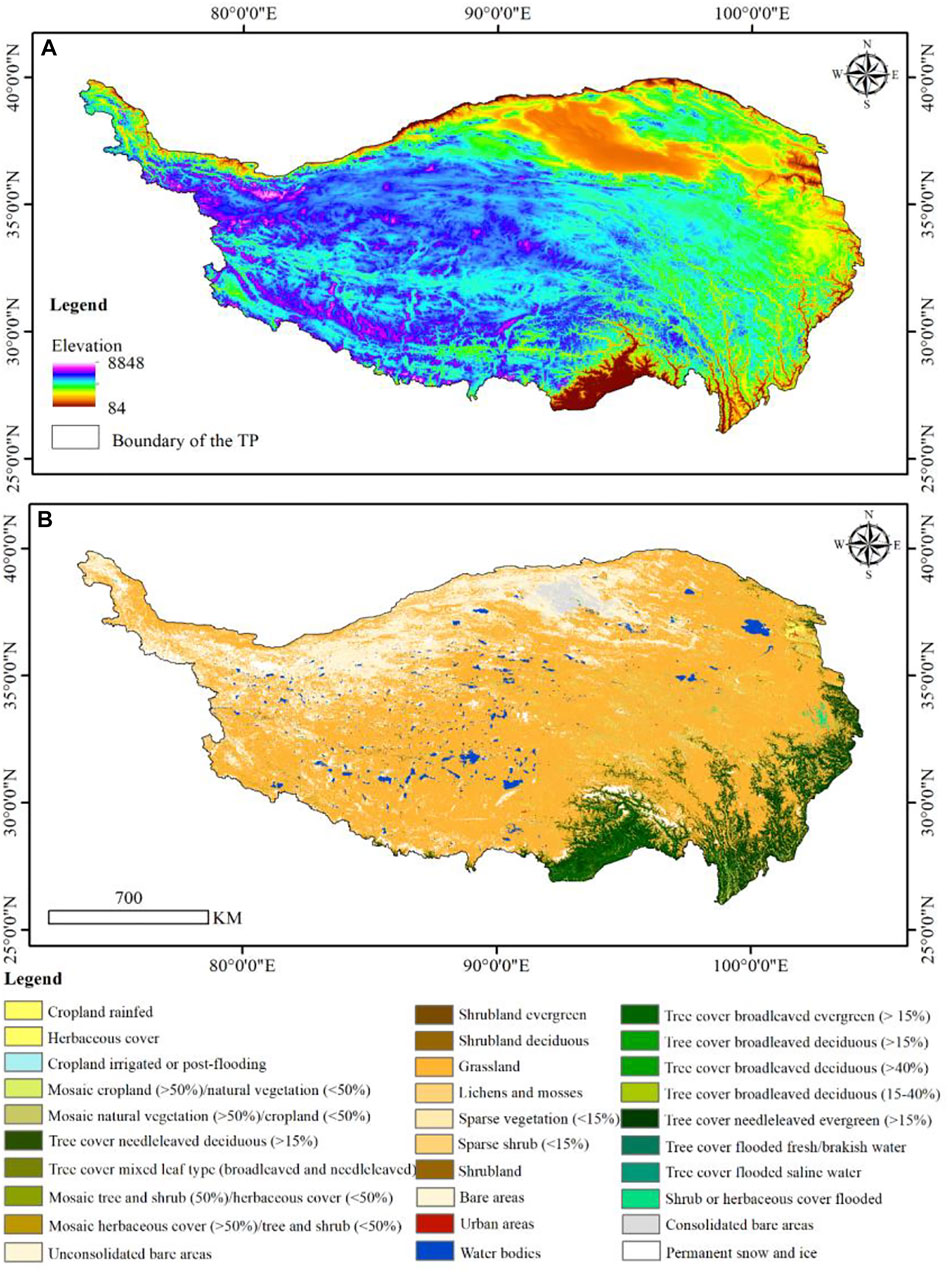
FIGURE 1. (A) Elevation distribution of the TP. This dataset is acquired from the Shuttle Radar Topography Mission (SRTM). For more details about the SRTM, readers are kindly referred to Farr et al. (2007). Moreover, the boundary of the TP is accessed from the National Tibetan Plateau Data Center, China (http://data.tpdc.ac.cn/). (B) Land cover types of the TP in 2017. The land cover data is retrieved from the European Space Agency Climate Change Initiatives Land Cover Project (https://www.esa-landcover-cci.org/). For more information about this dataset, readers are kindly referred to Bontemps et al. (2013).
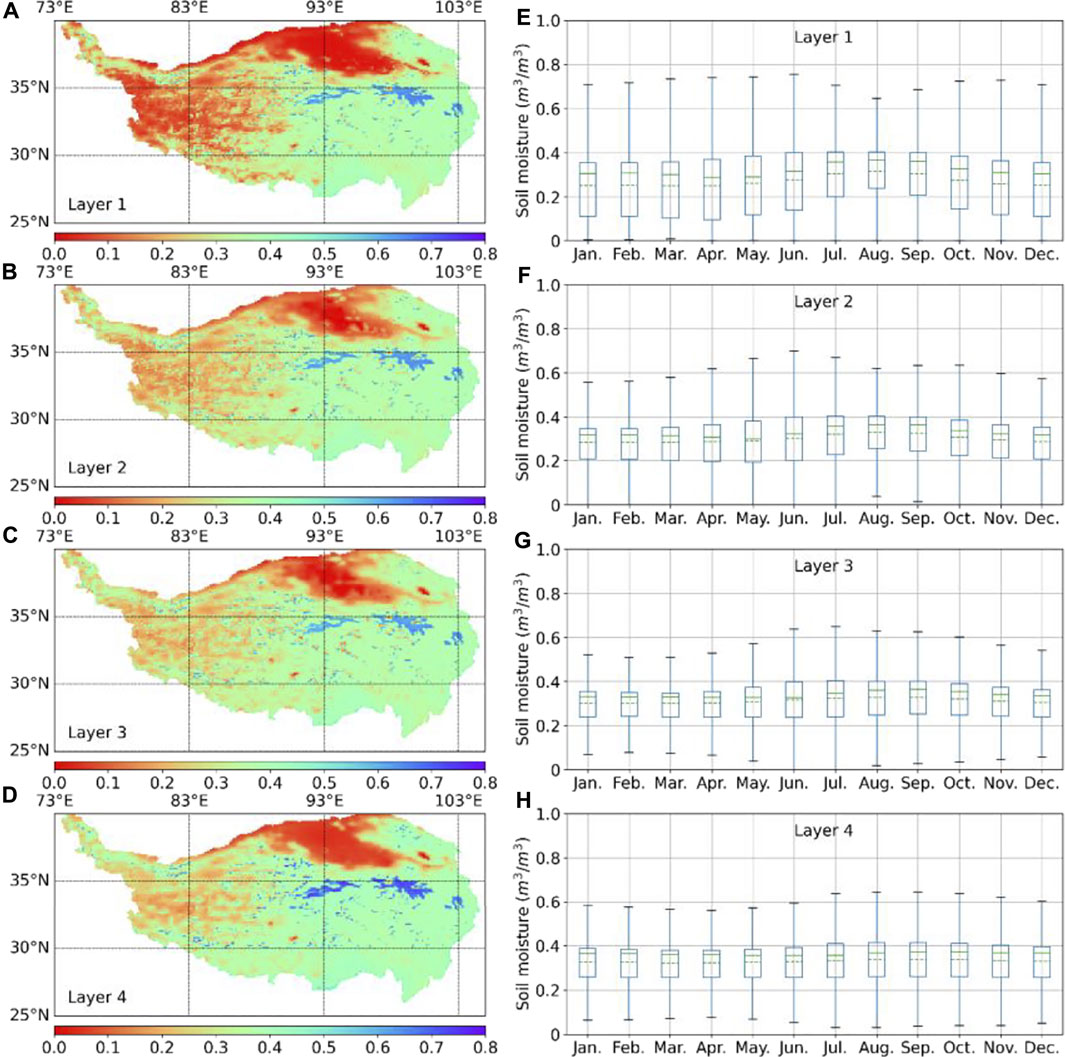
FIGURE 2. Spatial (A–D) and temporal (E–H) boxplot distribution pattern of average soil moisture at the TP during 1950–2020.
2.2 Dataset
ERA5, the successor of ERA-Interim, provides a host of atmospheric, land, and oceanic climate variables (Hersbach et al., 2020). As a vital member of ERA5, ERA5-Land is focused on the consistent evolution of land variables from 1950 onwards (Muñoz-Sabater et al., 2021). It continually provides a description of past global climate features with high precision and favorable spatiotemporal integrity by utilizing the law of physics. These variables were designed and generated to depict the characteristics of hydrology and energy circulation quantifiably at the land surface from a long-term perspective.
In this study, we used ERA5-Land monthly averaged data to investigate the trend of soil moisture at the TP. As shown in Table 1, both soil moisture and ancillary climatic variable datasets were accessed from the Copernicus Climate Change Service Climate Data Store (https://cds.climate.copernicus.eu/) to systematically analyze the variation trends and possible driving forces. In addition to gravity, the land surface thermodynamic process originating from solar radiation can be the most crucial driver for the soil water cycle (Li et al., 2020); therefore, soil temperature estimation at a corresponding depth is selected as an essential supplement to understand soil moisture fluctuation tendencies. Precipitation is recognized as the dominant replenishment source of soil water at the TP, where there is barely any artificial interference, such as irrigation. Apart from the widely acknowledged promotion of precipitation to soil moisture content, non-negligible soil moisture–precipitation feedback has been observed. Soil moisture can promote or suppress precipitation based on different underlying surface properties (Hohenegger et al., 2009; Tuttle and Salvucci, 2016; Yang et al., 2018). Additionally, in the frozen season, precipitation in the form of snow hardly nourishes the soil. However, as the temperature rises, snowmelt is expected to significantly boost the soil water content. Therefore, it is assumed that using precipitation and snowmelt data together would be more beneficial for exploring soil moisture variation mechanisms than using only one of them. Evaporation records the accumulated amount of water evaporated from the Earth’s surface, which is tightly linked to soil water deficits (Martens et al., 2017). Specifically, for the ERA5 evaporation product, negative values indicate evaporation, and positive values indicate condensation.

TABLE 1. Basic properties of the employed soil moisture and ancillary climatic variable datasets.
2.3 Methodology
2.3.1 Anomaly calculation
With the consideration that this study is mainly dedicated to investigating the long-term variation trend of soil moisture, anomalies in the employed datasets were calculated to simultaneously remove strong seasonality and explicitly magnify fluctuation regularity. Thus, the anomaly of each variable was calculated by deducting the multi-year average of a corresponding month, as in Xie et al. (2019). The specific equation is as follows:
where
2.3.2 Rolling mean calculation
Several abnormal peak and valley values occasionally appeared in the anomaly results, which may be induced by unexpected extreme weather events during certain monthly scale periods. Because this study was focused on trend analysis over several decades rather than short-period extreme weather events, the rolling means of the soil moisture and the other variables were calculated to allow clear observation of temporal evolutionary tendencies. The rolling mean was obtained by subtracting the moving average of the anterior months (Zivot and Wang, 2003) as follows:
where
2.3.3 Granger causality exploration
According to previous findings (Hohenegger et al., 2009; Martens et al., 2017; Li et al., 2020), soil moisture has tight bidirectional links to soil temperature, precipitation, snowmelt, and evaporation. Thus, in addition to exploring the soil moisture evolution law, it is crucial to demonstrate the causality between the soil moisture and these closely related variables, which could be beneficial for understanding the inherent driving mechanism of the evolution phenomenon. Moreover, it could be conducive to preliminarily determine the feedback of the soil moisture to these variables across the TP. The Granger causality, proposed by Nobel Economics Laureate Clive W. J. Granger in 1969, is a simple but effective statistical hypothesis test for determining whether the time series of a certain variable is useful in forecasting another one (Granger, 1969). Since its inception, Granger causality analysis has been predominantly used in the field of economics (Hiemstra and Jones, 1994; Dutta, 2001; Kónya, 2006). Recently, Granger causality analysis has become increasingly popular in investigating the interactions of Earth system processes, resulting in stable and reliable findings (Jiang et al., 2015; Papagiannopoulou et al., 2017; Runge et al., 2019). The equations for the Granger causality test are as follows:
where
2.3.4 Spatial–temporal perspective analysis
Soil moisture dynamics results from the combined non-linear effects of climate, soil properties, terrain, and vegetation. In addition, changing climate and artificial interference further exacerbate its uncertainty, randomness, and unpredictability. Consequently, soil moisture patterns exhibit a high degree of complexity. Therefore, it is necessary to comprehensively and systematically investigate the dynamics of soil moisture from the perspectives of time, depth, latitude, and longitude. It is thought that spatial–temporal perspective analysis could be helpful in gaining a clear and synthetic outlook of soil moisture dynamic patterns across the TP (Zhang et al., 2015). The arithmetic mean of each pixel per month was calculated to express the average spatial/temporal distribution pattern of soil moisture. Similarly, the spatial/temporal variation trends were presented by calculating the pixel/month-scale rolling mean.
Additionally, a significance test with a 95% confidence level was used throughout the study to ensure the reliability and stability of our findings.
3 Results
3.1 Spatial–temporal perspective dynamic pattern analysis
As shown in Figure 2, the dry region is mainly distributed to the north and west of the TP. The northern drought area is located in the Qaidam Basin and is predominantly occupied by deserts. The western region is characterized by a severely cold continental alpine climate and sparse precipitation. The soil moisture deficit was gradually alleviated when the depth increased. Comparatively, the southern and eastern parts of the TP remain relatively humid owing to the monsoon climate. In terms of the temporal sequence, as shown in the boxplot series (Mirzargar et al., 2014), soil moisture displays a mild seasonal rhythm cycle. Moreover, it is noteworthy that as the depth increases, the month for the maximum value emergence is delayed from June to August because it is not susceptible to surface atmospheric conditions. Similarly, the soil temperature also exhibited a delay. The corresponding soil temperature displayed evident evolution characteristics of a time series and favorably matched the climate cycle (Figures 3E–H). The spatial distribution of soil temperature was in accordance with climatic features. In general, temperature is a critical indicator for characterizing the hydrothermal exchange intensity of the underlying surface. Nevertheless, it is difficult for temperature to play a decisive role in soil water content. For example, the average soil temperature in the north could reach 10–15°C and in the western area could reach as low as −15 to −20°C, whereas the soil moisture showed similar drought levels despite the large temperature difference. In comparison, the soil maintains moderate humidity on the southern side of the TP, where the annual average temperature remains stable at 10–20°C.
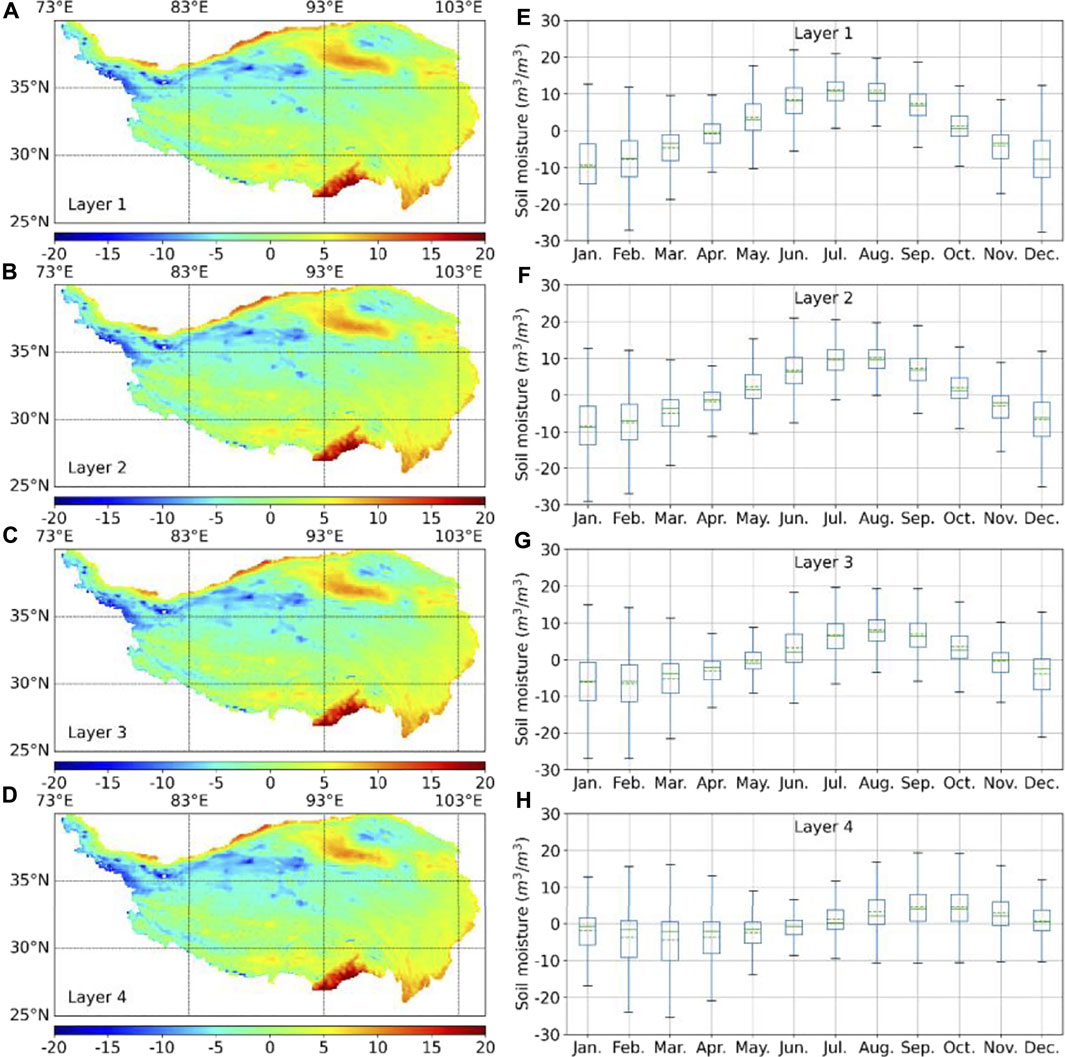
FIGURE 3. Spatial (A–D) and temporal (E–H) distribution pattern of average soil temperature at the TP during 1950–2020.
Figure 4 displays the spatial pattern of the soil moisture evolution trend at increasing depths from January 1950 to December 2020. Correspondingly, the evolution trend of the soil temperature was also examined (Figure 5) for attribution analysis. More than 80% of the TP shows stable soil moisture conditions, which are mainly distributed in the central and eastern regions. The proportion with a stable tendency was observed to rise slowly as depth increased, implying the insusceptibility of the deep soil layer. In addition, the fluctuation degree of the soil moisture series becomes notably mild from layers 1 to 4 (Figure 6), further illustrating the stability of the deep soil layer. The wetting area, accounting for 5.33%–12.93% as the soil depth decreases, is situated on the northwest border, which belongs to the west side of the Kunlun Mountains, with an average altitude of above 5,500 m. This region, with glacier coverage exceeding 3,000 km2, is one of the largest glacier areas in China (Yang et al., 1996). Glacial melt water is the source of several major rivers, including the Yangtze, Yellow, and Mekong Rivers. The drying region is sparsely distributed in the southwest, and the degree of drying is alleviated from layers 1 to 3. Overall, the soil moisture across the TP revealed a slight wetting trend from 0 to 100 cm depth during the past 70 years. However, the 100–289 cm depth soil showed an inapparent drying trend.
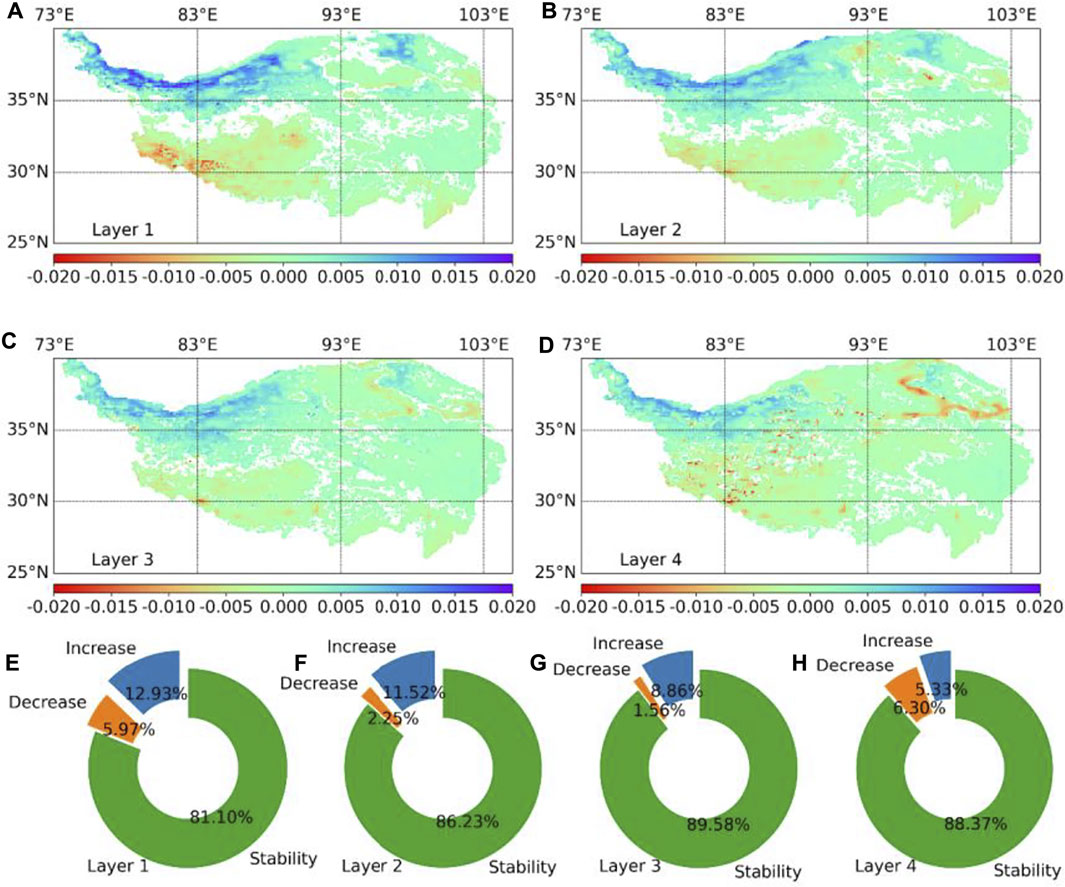
FIGURE 4. (A–D) Spatial distribution of the soil moisture variation trend in different layers. The unit is m3/m3 per decade. A significance test is applied here as a mask to filter out regions that do not attain 95% confidence level. (E–H) Corresponding value percent of (A–D). Pixel values greater than 0.005 m3/m3 per decade are considered as an increase (rendered in blue), whereas those less than −0.005 m3/m3 per decade are considered as a decrease (rendered in orange); other values are regarded as stability (rendered in green).
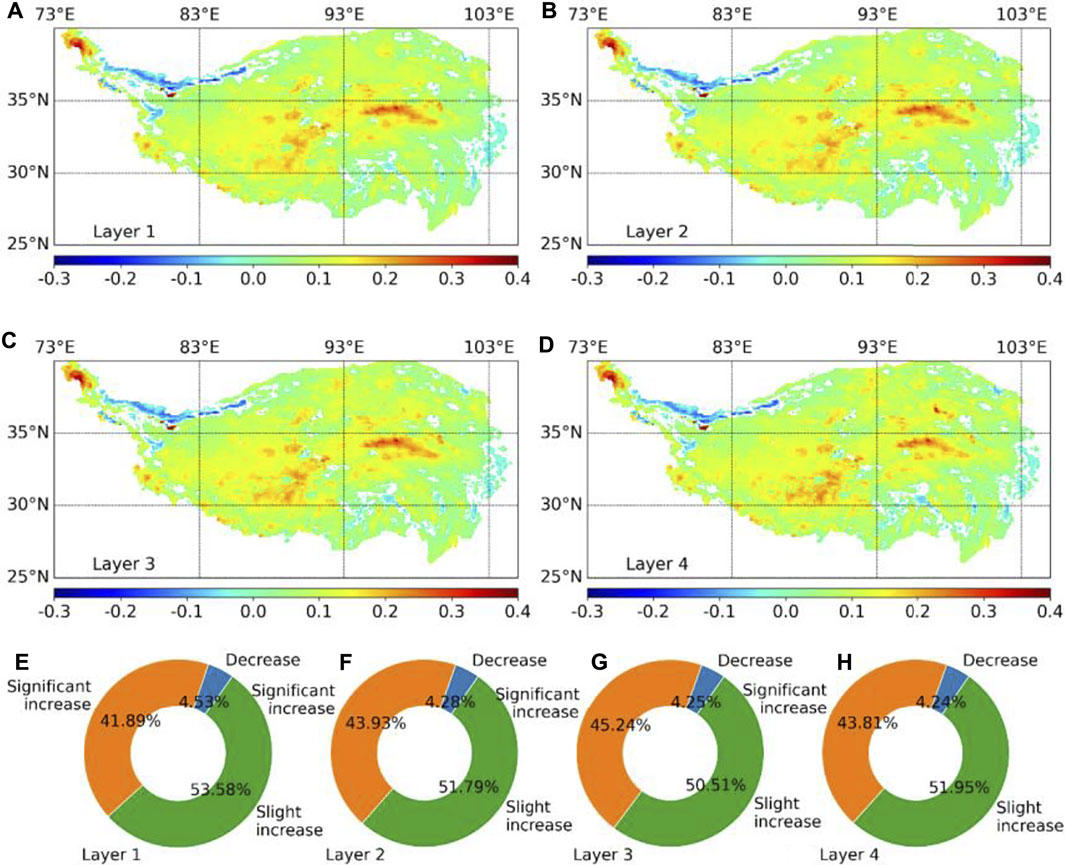
FIGURE 5. (A–D) Spatial distribution of the soil temperature variation trend in different layers. The unit is °C per decade. A significance test is applied here as a mask to filter out regions that do not attain 95% confidence level. (E–H) Corresponding value percent of (A–D). Pixel values greater than 0.1°C per decade are considered significant as an increase (rendered in orange), whereas those less than 0°C per decade are considered as a decrease (rendered in blue); other values are regarded as a slight increase (rendered in green).
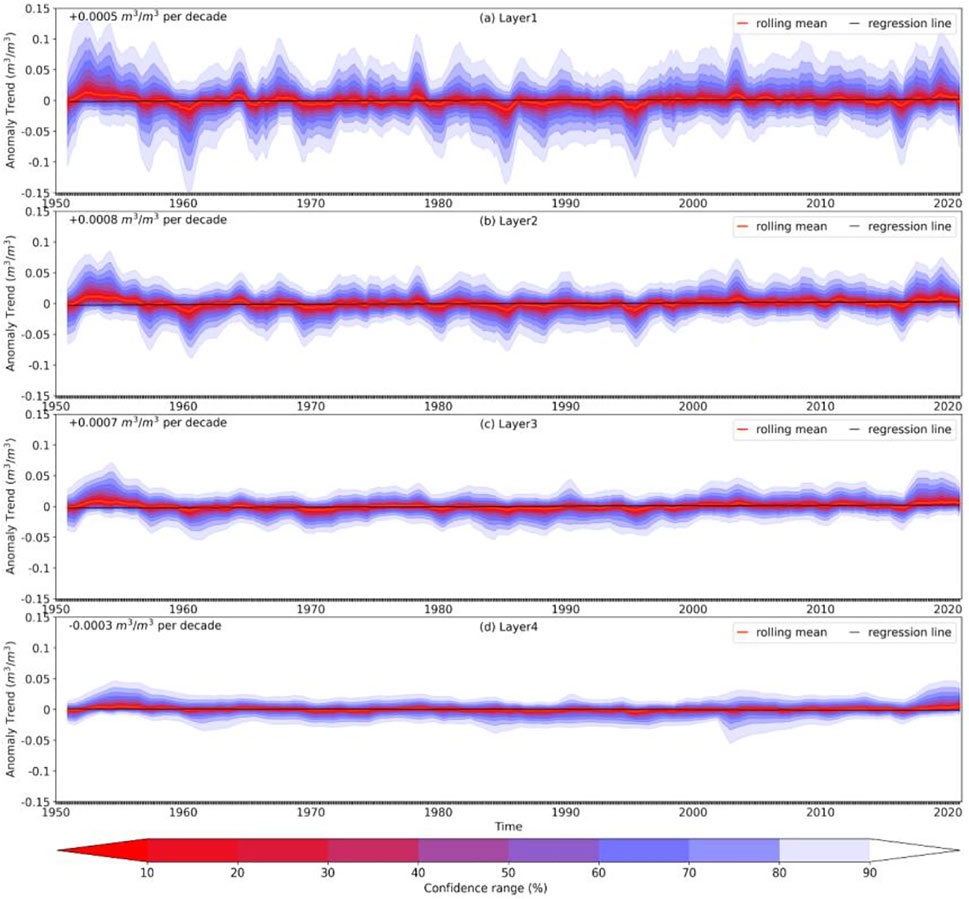
FIGURE 6. The temporal anomaly trend of soil moisture at increasing depth as presented by different layers (A–D) during 1950–2020 across the TP.
Under the background of global warming, the soil temperature generally rises throughout the TP at different depths. The warming trend appears in more than 95% of the whole region, among which nearly half displays a significant increase of greater than 0.1°C per decade. The degree of fluctuation displayed a similar weakening trend with increasing soil depth (Figure 7). In particular, it is observed that the northwest border of the TP, namely the Karakoram, experiences a steady cooling process, which is probably induced by the declining average temperature in summer (Cogley, 2011; Gardelle et al., 2012; Azam et al., 2018). This unexpected phenomenon reflects the low sensitivity of the Karakoram to climate change. Because the overall soil moisture shows a stable or even wetting trend under warming conditions, there must be considerable water replenishment to effectively nourish soil layers. Therefore, it is meaningful that we go a step further and learn the evolution characteristics of the soil-moisture-related climate parameters in the significantly drying and wetting regions, respectively.
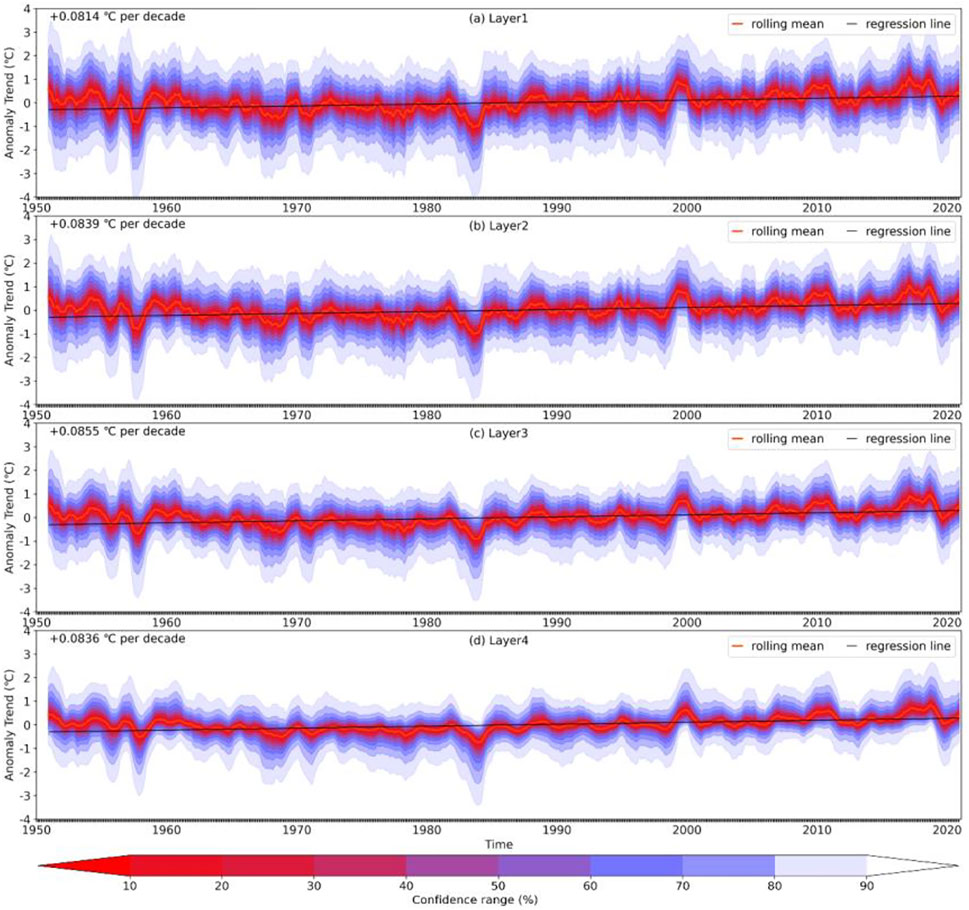
FIGURE 7. The temporal anomaly trend of soil temperature at increasing depth as presented by different layers (A–D) during 1950–2020 across the TP.
3.2 Time-series analysis at wetting and drying regions
The features of temporal dynamics in regions with evident soil moisture increasing/decreasing tendencies were investigated to further advance our understanding of the variation mechanism. Water stress resulting from a soil moisture deficit directly affects vegetation growth and crop yield. However, excessive soil water can cause hypoxia, which can trigger root rot or even death. The wetting (pixel trend greater than 0.005 m3/m3 per decade) and drying (pixel trend less than −0.005 m3/m3 per decade) regions were extracted and are plotted in Figures 8, 9, respectively, for analysis.
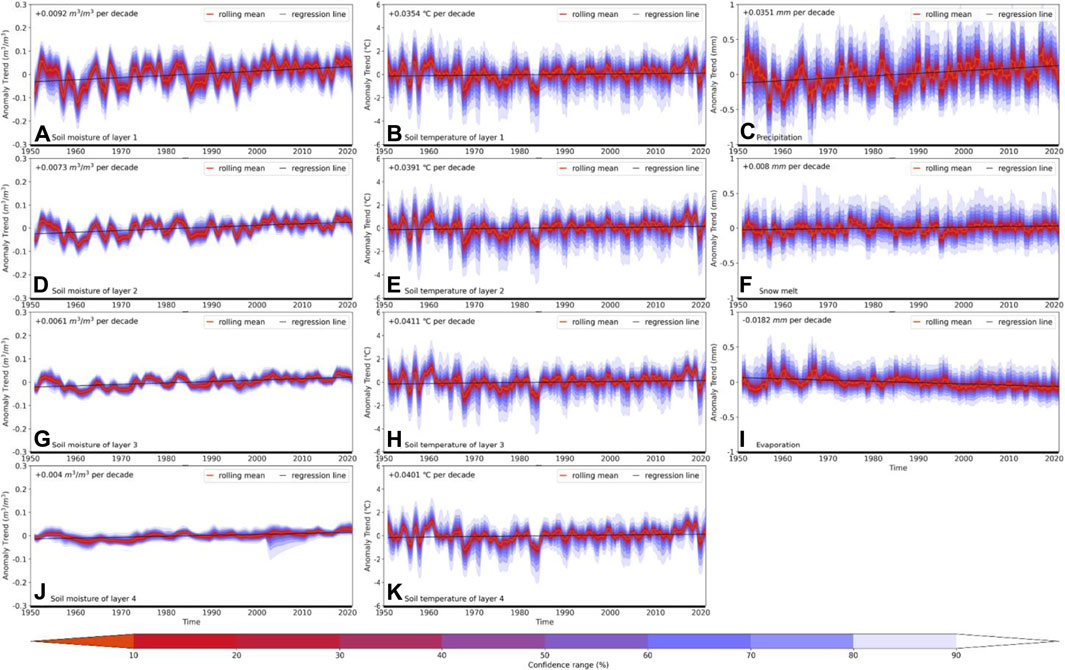
FIGURE 8. Time series of the evolutionary anomaly trends of soil moisture (A,D,G,J), soil temperature (B,E,H,K), precipitation (C), snowmelt (F), and evaporation (I) at the wetting region with confidence ranges and regression lines.
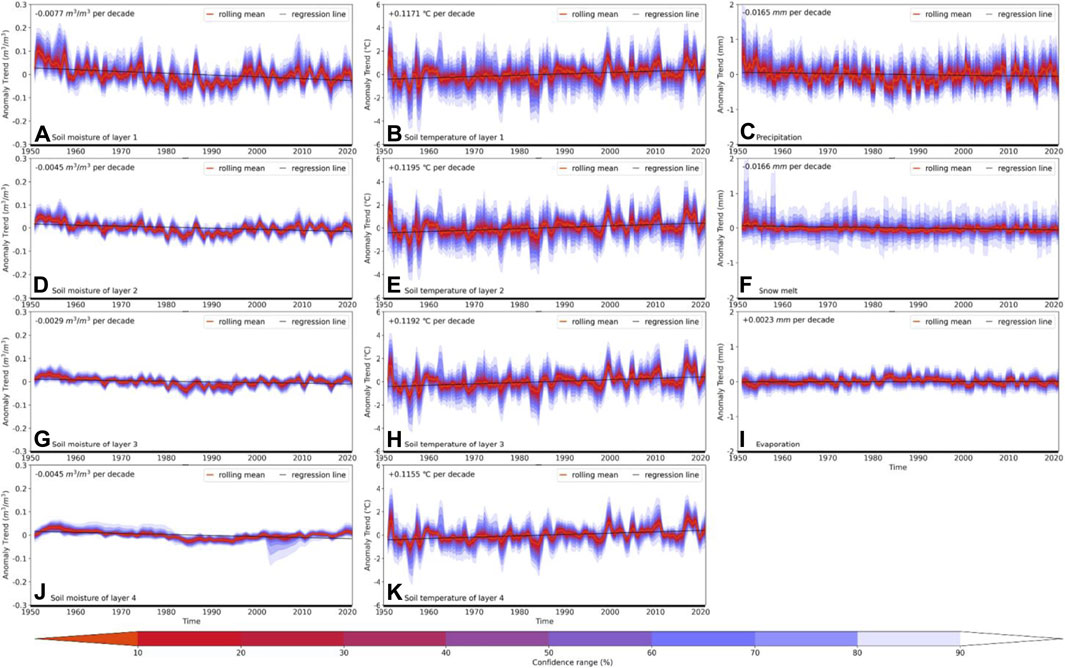
FIGURE 9. Time series of the anomaly evolutionary trends of soil moisture (A,D,G,J), soil temperature (B,I,H,K), precipitation (C), snowmelt (F), and evaporation (I) at the drying region with confidence ranges and regression lines.
Similar to the overall pattern in the vertical dimension, both wetting and drying regions expressed gradually attenuated variation levels as the depth increased. However, in terms of soil temperature, the weakened variation trend in the vertical dimension was relatively imperceptible. It can be easily observed that the surface layer soil moisture (Figures 8A, 9A) and precipitation (Figures 8C, 9C) express homologous temporal dynamics, suggesting that the predominant driving force of precipitation is the variation in soil moisture. In comparison, snowmelt, although originating from frozen precipitation, does not reveal dynamics analogous to precipitation.
It can be observed in Figure 8 that, accompanied by rising precipitation and snowmelt, the vertical soil moisture presents a decreasing wetting trend (from 0.0092 m3/m3 per decade to 0.004 m3/m3 per decade) as the depth increases. The decreasing wetting trend could provide indirect evidence to suggest that the supplied water is from the atmosphere and falls on the Earth’s surface. It then migrates down through the soil pores layer by layer to recharge the water content of each soil layer under the combined effects of the soil molecular forces, gravity, and capillary forces with some conduction loss (Sokol et al., 2009). In terms of the drying region, as shown in Figure 9, there appears to be a significant heating up trend of approximately 0.12°C per decade. Furthermore, precipitation and snowmelt displayed an almost identical declining trend of −0.017 mm per decade. Therefore, the soil becomes dry because of the deficiency in water nourishment and rising temperatures.
3.3 Causality investigation
Given the seemingly related temporal evolution series among soil moisture and climatic parameters across the TP, it is imperative to further explore the potential causality links, which would be of great significance in advancing our understanding of soil moisture variation mechanisms. First, density scatterplots were drawn to express the distribution correlation features across the TP in the past decades in a convenient way. As shown in Figure 10, regardless of increasing depth, the different layers of soil moisture responded consistently to climatic variables. Surprisingly, it appears that there is little correlation between temperature and soil moisture, implying that temperature could hardly be the immediate driving force in triggering soil moisture change. In terms of water supplementation, both precipitation and snowmelt contributed remarkably to the promotion of soil moisture. Furthermore, according to the density distribution, there appears to be a threshold of approximately 0.35–0.40 m3/m3, and the steadily increasing precipitation or snowmelt barely enriches the content of soil water when it attains this threshold. Moreover, although there is an obvious positive correlation between evaporation and soil moisture, the fluctuation in evaporation hardly has a material impact on soil moisture when the threshold is met. This threshold is called the saturated water content, which refers to the water content when both capillary and non-capillary pores are filled with water, and it represents the maximum water holding capacity of the soil (Vauclin et al., 1979; Schmugge et al., 1980). Additionally, the saturated moisture presents a visible vertical distribution characteristic of increasing trend from 0.35 to 0.40 m3/m3 as the soil depth increases from 0 to 289 cm.
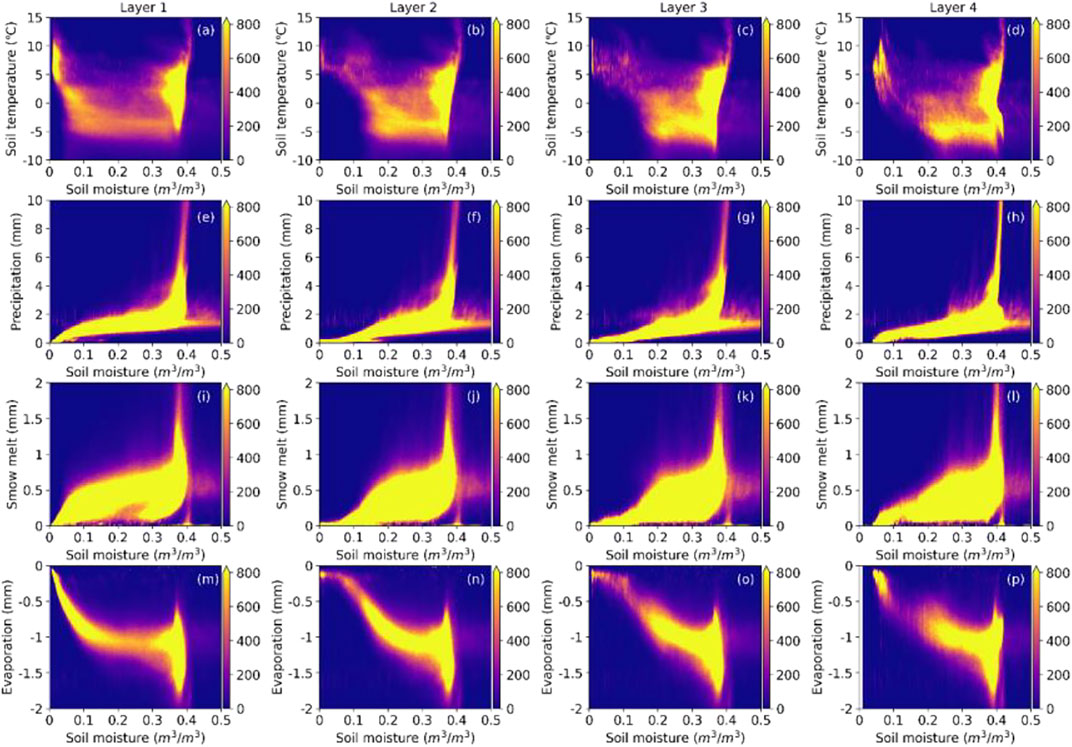
FIGURE 10. Scatter density map between soil temperature, precipitation, snowmelt, evaporation, and soil moisture in layer 1 (A,E,I,M), layer 2 (B,F,J,N), layer 3 (C,G,K,O), and layer 4 (D,H,L,P).
Apart from intuitive scatter correlation analysis, Granger analysis was employed to detect potential causality links between the soil moisture and climatic variables. As indicated in Figures 11A–D, there is an inconspicuous interaction between the soil moisture and temperature, as demonstrated by the extensively distributed regions across the TP lacking a significant causal relationship. In addition, areas that are thought to have a causal link change unreasonably among different layers. However, it should be noted that the proportion of soil temperature recognized as the unidirectional cause of soil moisture experiences a noticeable increase from 15.68% to 44.80% as the depth gradually increases. This phenomenon signifies a more pronounced influence of temperature on the variation in soil moisture than on the relative surface moisture. Previous research has discovered the effectiveness of increasing the soil moisture in shrinking the soil temperature gap between daytime and nighttime, along with increasing heat storage capacity (Al-Kayssi et al., 1990). Nevertheless, it seems that the soil moisture had very limited effect on the soil temperature on a monthly scale, regardless of depth.
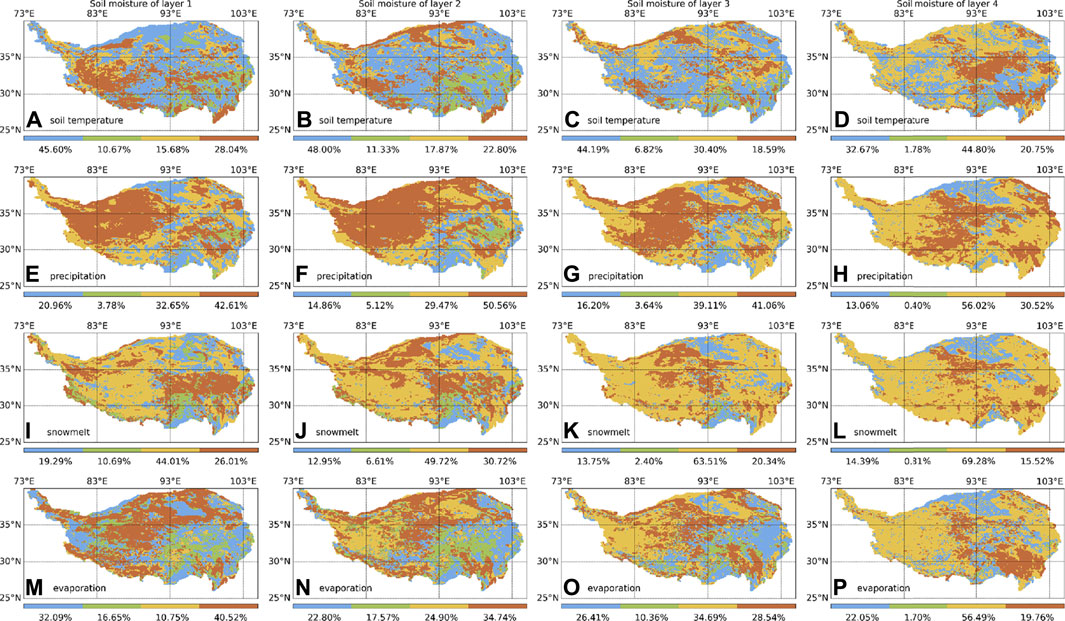
FIGURE 11. Spatial distribution of Granger causality between soil temperature, precipitation, snowmelt, evaporation, and soil moisture in layer 1 (A,E,I,M), layer 2 (B,F,J,N), layer 3 (C,G,K,O), and layer 4 (D,H,L,P). The red areas indicate bidirectional causality relationships between the soil moisture and related climate parameters; yellow indicates that the related climate parameters are the unidirectional cause of the soil moisture; green indicates that the soil moisture is the unidirectional cause of the related climate parameters. Areas without significant causal links are shown in blue.
In terms of precipitation, as shown in Figures 11E–H, unidirectional causality relationships prevalently exist at the TP among all layers, proving the significant promotion effect of precipitation on soil moisture. Additionally, mutual correlations were observed across different layers despite a certain degree of fluctuation, providing substantial evidence for the feedback of soil moisture to precipitation on a monthly scale. This feedback is mainly expressed by the 0–100 cm depth soil moisture and becomes weak for the fourth layer at 100–289 cm depth. Owing to the temperature features of the dominant plateau climate across the TP, there could be a lengthy freezing season throughout the year. Precipitation in the form of snow barely nourished the soil when the temperature remained below freezing point throughout the day. However, snow is a non-ignorable water supplement that has great potential for nourishing the soil. Few studies have systematically explored its positive effect on soil moisture; thus, preliminarily causality analysis is necessary for disclosing the probable correlation. Snowmelt, derived from the combined action of accumulated snow and the temperature climbing above freezing point, is thought to be effective in elevating soil moisture. Figures 11I–L explicitly show that snowmelt plays an increasingly vital role in nourishing the soil as the depth increases. Snowmelt is recognized to have a statistically significant effect on the current value of soil moisture and is thought to be the Granger cause of soil moisture. Accordingly, the significant proportion, including both the yellow and red regions, consistently increased from 70.02% to 84.80% as the soil depth increased. Evaporation, which is a crucial method of soil water loss, is found to have bidirectional causality relationships with soil moisture across different layers, indicating tight mutual interaction, which is in accordance with previous studies (Krakauer et al., 2010; Vargas Zeppetello et al., 2019). The bidirectional causality gradually turns to unidirectional causality as the depth increases, signifying that evaporation is capable of affecting soil moisture regardless of depth, whereas the influence of soil moisture on evaporation decreases with the deepening of the soil layer from 0 to 289 cm.
4 Discussion
Soil moisture, as a fundamental surface hydrological variable, is both an active participant and sensitive responder in various hydrological processes (Dobriyal et al., 2012; Peng et al., 2017; Deng et al., 2020a). The distribution and dynamics of soil moisture can be an effective indicator of regional climate evolution characteristics (Seneviratne et al., 2010; Zhang et al., 2019; Deng et al., 2020b). The TP plays a crucial role in climate change in the Northern Hemisphere. Exploring the variability features of soil moisture across the TP is important to advancing our understanding of climate change. Thus, this study systematically and comprehensively investigated the variation trend of the soil moisture across the TP from a four-dimensional perspective (time, longitude, latitude, and depth) on a monthly scale during 1950–2020. The soil moisture and related climate variable information was retrieved from the ERA5-Land products, which have been widely evaluated and applied since inception (Hersbach et al., 2020; Muñoz-Sabater et al., 2021; Wu et al., 2021; Xu et al., 2022).
4.1 Driving mechanism of soil moisture variability
Our investigation revealed that the spatial–temporal series of the soil moisture remained roughly stable in the context of a prevalent warming trend, implying sufficient water supplementation to consistently nourish the soil. Previous findings show a positive correlation between the trends of soil moisture and precipitation across the TP, which means that the wetting of the soil is mainly caused by increasing precipitation. Deng et al. (2020b) investigated the responses of soil moisture to regional climate change over three river source regions at the TP. They discovered a significant positive correlation between the soil moisture and precipitation in most case-study regions. Liu et al. (2013) analyzed the spatial distribution and dynamic variation of remotely sensed surface soil moisture across the TP and found a favorable correlation between the spatial–temporal evolution pattern of the soil moisture and precipitation. In addition, the fluctuation patterns of both moisture and temperature obviously declined as the soil depth increased, demonstrating the insensitivity of deep-layer soil to momentary atmospheric dynamics. Increased soil depth resulted in lower variability, which is in accordance with the findings of previous studies on the characteristics of surface and root-zone soil. Through a case study in France, Albergel et al. (2008) disclosed that the soil water indices derived from the surface layer agreed well with those from the root-zone layer. Paris Anguela et al. (2008) investigated the dynamics of surface and root-zone soil moisture in France and shed light on the high variability of surface soil moisture resulting from atmospheric conditions and the stability of root-zone moisture. Meng et al. (2022) also discovered decreasing interannual fluctuations in deep-layer soil moisture by assessing the spatiotemporal variability of soil moisture across the Mongolian Plateau from 1982 to 2019.
Through spatial statistical distribution, it was observed that the significantly wetted region was mainly concentrated at the northwest border, whereas the drying region was sparsely distributed across the TP. It was observed that the wetting region was accompanied by a notable increase in precipitation, snowmelt, temperature, and evaporation. The drying region is characterized by evident warming, as well as slightly reduced precipitation, snowmelt, and evaporation. Moreover, we noticed that the wetting region belongs to the Karakoram, where the glacier experiences a slight mass gain and the temperature is steadily cooling (Cogley, 2011; Gardelle et al., 2012; Azam et al., 2018). According to Pascolini-Campbell et al. (2021), global land evapotranspiration increased by 10% during 2003–2019, mainly driven by increasing temperatures, and precipitation was increasingly partitioned into evapotranspiration rather than runoff. Jung et al. (2010) suggested that soil moisture limitation is the primary driver that restricts the rate of land evapotranspiration. Deng et al. (2020a) analyzed the variation trend of global surface soil moisture from 1979 to 2017. Temperature and precipitation are the two predominant factors that lead to variation in the soil moisture across the TP. Additionally, a reasonably good agreement between the surface soil moisture and precipitation has been observed in tropical and temperate climate zones (Wagner et al., 2003). However, Dorigo et al. (2012) revealed that even though precipitation is the main driver of variations in soil moisture, its impact could be quite different owing to the combined influences of evaporation, soil type, irradiation, vegetation, and topography. In addition to land climate parameters, the sea can also transmit a far-reaching influence on soil moisture. Sheffield and Wood (2008) demonstrated that the leading modes of soil moisture variability are closely associated with sea surface temperatures.
The causality between multi-layer soil moisture and climate variables was investigated through correlation and Granger analysis. Instead of soil temperature, precipitation and snowmelt have been proven to be the main drivers in the variation trend of soil moisture, and the soil moisture also provides notable feedback to these supplements. Under the global warming scenario, precipitation across the TP continuously increases and is driven by the South Asian monsoon (Wang et al., 2021). A previous study illustrated the predominant positive feedback of the surface soil moisture to precipitation and the non-negligible negative feedback in wet and dry regions across the globe (Yang et al., 2018). According to an investigation of soil moisture–precipitation feedback across the United States, positive feedback generally appears in arid regions, whereas relatively humid regions tend to display negative feedback (Tuttle and Salvucci, 2016). In addition to the significant differences resulting from different case-study areas, feedback also varies in terms of different resolutions. The 25-km grid Consortium for Small-Scale Modeling Model in Climate Mode (CCLM) simulations basically maintain strong positive soil moisture–precipitation feedback, whereas the 2.2-km resolution expresses dominantly negative feedback over the alpine regions (Hohenegger et al., 2009). In general, the specific feedback of soil moisture to precipitation varies unpredictably based on hydrothermal conditions, regions, and scales. Additionally, through Granger analysis, we found that, although the feedback of soil moisture to evaporation gradually decreased, the impact of evaporation on soil moisture continuously increased as the depth increased. The soil moisture interacts with the atmosphere primarily through dynamic surface water and energy balances (Delworth and Manabe, 1988). It is widely acknowledged that evaporation is limited by the available soil moisture in dry regions and the temperature in humid regions (Vargas Zeppetello et al., 2019). The mutual feedback mechanism between evaporation and multi-layer soil moisture has been used to estimate global land evaporation and root-zone soil moisture (Martens et al., 2017).
4.2 Uncertainty factors
Apart from the abovementioned factors, surface hydrological evolution phenomena such as glacier melt, permafrost thaw, and lake expansion, induced by a warming climate, could all boost the increase in soil water content. Many other factors (i.e., soil texture, groundwater depth, and vegetation) could also affect the spatial and temporal distribution patterns of the soil moisture. This study is expected to advance the understanding of the effect of climate change across the TP during 1950–2020 from the perspective of soil moisture. Although we obtained some significant discoveries through the investigation, it is necessary to discuss the possible existence of uncertainty in order to maintain rigor.
Notably, human activities could play a non-negligible role in triggering variations in soil moisture. The ever-increasing human water withdrawal significantly causes stress on the sustainable water resource supply, which potentially affects the pattern of soil moisture. The population density of the TP is quite low because the plateau climate is not suitable for human living. However, it is still critical to quantitatively explore the influence of human water consumption on the soil moisture variability across the TP in future studies.
The analysis results were mainly derived by using ERA5-Land products, which could inevitably have both spatially and temporally varied biases in terms of the complex land surface properties. Numerous studies have evaluated the accuracy of ERA5-Land products and demonstrated their good performance in fitting the dynamics of ground observations (Li et al., 2020; Muñoz-Sabater et al., 2021; Xu et al., 2022). However, errors occasionally occur in plateau mountain climate zones. Additionally, because the multi-depth soil moisture and climatic parameters used in this study are all from ERA5-Land products, inherent uniformity inevitably exists among these datasets. Future work with diverse data sources that are independent of each other is needed to investigate the correlation between soil moisture and climatic factors with more objectivity.
As a classical measurement method, the Granger causality test has been widely accepted and used in Earth system science studies. However, this method may not be sufficiently rigorous to define a temporally related phenomenon as a causality. Therefore, this study merely conducted a causality analysis to attempt to explain the reason for the variations in soil moisture.
5 Conclusion
In summary, this study systematically and comprehensively investigated the evolutionary characteristics of soil moisture from a four-dimensional (time, longitude, latitude, and depth) perspective across the TP during 1950–2020. It was found that, based on the interaction of climate warming and increasing precipitation, soil moisture across the TP had a slight wetting trend at a depth of 0–100 cm over the past 70 years. Moreover, there is sufficient water supply from precipitation and a mild soil temperature increase in the wetting region (variation trend greater than 0.005 m3/m3 per decade). In comparison, the drying region (variation trend of less than −0.005 m3/m3 per decade) is accompanied by a noteworthy warming tendency and falling precipitation. In terms of vertical variation features, the temporal dynamic fluctuation of the soil moisture evidently decreases as the depth increases, suggesting high sensitivity of near-surface-layer soil moisture to atmospheric conditions. Through correlation and Granger causality analysis, precipitation and snowmelt were preliminarily proved to be the dominant drivers causing the spatial and temporal variations in the soil moisture. Bidirectional causality relationships were found between soil moisture and these two parameters. Evaporation changes then occurred owing to the joint efforts of rising temperature and water supplementation. This study explored the spatial–temporal fluctuation of the evolutionary characteristics of soil moisture, which is expected to boost our understanding of soil moisture dynamics under the conditions of climate change across the TP. With consideration of the intrinsic inhomogeneity of soil moisture, more work is needed to further clarify the mechanism underlying soil moisture variations.
Data availability statement
The original contributions presented in the study are included in the article/supplementary material; further inquiries can be directed to the corresponding author.
Author contributions
Conceptualization, methodology, writing—original draft preparation, YL; Writing—review and editing, supervision, funding acquisition, YY.
Funding
This work was supported in part by the Special Program of Network Security and Informatization of the Chinese Academy of Sciences (CAS-WX2021SF-0106-03), in part by the Second Tibetan Plateau Scientific Expedition and Research Program (2019QZKK09), in part by the National Natural Science Foundation of China under Grant 42101475, in part by the Geographic Resources and Ecology Knowledge Service System of the China Knowledge Center for Engineering Sciences and Technology under Grant CKCEST-2015-1-4, in part by the National Earth System Science Data Center (http://www.geodata.cn/), and in part by the Guangzhou Science and Technology Plan Program (202102020676).
Acknowledgments
We thank the reviewers for their very insightful comments on this article.
Conflict of interest
The authors declare that the research was conducted in the absence of any commercial or financial relationships that could be construed as a potential conflict of interest.
Publisher’s note
All claims expressed in this article are solely those of the authors and do not necessarily represent those of their affiliated organizations, or those of the publisher, the editors, and the reviewers. Any product that may be evaluated in this article, or claim that may be made by its manufacturer, is not guaranteed or endorsed by the publisher.
References
Al-Kayssi, A. W., Al-Karaghouli, A., Hasson, A., and Beker, S. (1990). Influence of soil moisture content on soil temperature and heat storage under greenhouse conditions. J. Agric. Eng. Res. 45, 241–252. doi:10.1016/s0021-8634(05)80152-0
Albergel, C., Rudiger, C., Pellarin, T., Calvet, J. C., Fritz, N., Froissard, F., et al. (2008). From near-surface to root-zone soil moisture using an exponential filter: an assessment of the method based on in-situ observations and model simulations. Hydrol. Earth Syst. Sci. 5 (3), 1323–1337. doi:10.5194/hess-12-1323-2008
Attema, E. P. W., Duchossois, G., and Kohlhammer, G. (1998). “ERS-1/2 SAR land applications: overview and main results,” in IEEE international geoscience & Remote sensing symposium. Seattle, WA: IEEE.
Azam, M. F., Wagnon, P., Berthier, E., Vincent, C., Fujita, K., and Kargel, J. S. (2018). Review of the status and mass changes of himalayan-karakoram glaciers. J. Glaciol. 64 (243), 61–74. doi:10.1017/jog.2017.86
Bai, X., He, B., Li, X., Zeng, J., Wang, X., Wang, Z., et al. (2017). First assessment of Sentinel-1A data for surface soil moisture estimations using a coupled water cloud model and advanced integral equation model over the tibetan plateau. Remote Sens. 9 (7), 714. doi:10.3390/rs9070714
Bartalis, Z., Wagner, W., Naeimi, V., Hasenauer, S., Scipal, K., Bonekamp, H., et al. (2007). Initial soil moisture retrievals from the METOP-A advanced scatterometer (ASCAT). Geophys. Res. Lett. 34 (20), L20401. doi:10.1029/2007gl031088
Bontemps, S., Defourny, P., Radoux, J., Van Bogaert, E., Lamarche, C., Achard, F., et al. (2013). “Consistent global land cover maps for climate modelling communities: Current achievements of the ESA’s land cover CCI,” in Proceedings of the ESA living planet symposium (Edimburgh).
Bradley, D., Brambora, C., Wong, M. E., Miles, L., Durachka, D., Farmer, B., et al. (2010). “Radio-frequency interference (RFI) mitigation for the soil moisture active/passive (SMAP) radiometer,” in Geoscience and Remote sensing symposium. Honolulu, Hawaii: IEEE.
Chen, T., de Jeu, R., Liu, Y., van der Werf, G., and Dolman, A. (2014). Using satellite based soil moisture to quantify the water driven variability in ndvi: a case study over mainland australia. Remote Sens. Environ. 140 (140), 330–338. doi:10.1016/j.rse.2013.08.022
Chen, Y., Yang, K., Qin, J., Cui, Q., Lu, H., La, Z., et al. (2017). Evaluation of SMAP, SMOS, and AMSR2 soil moisture retrievals against observations from two networks on the tibetan plateau. J. Geophys. Res. Atmos. 122 (11), 5780–5792. doi:10.1002/2016jd026388
Cheng, M., Zhong, L., Ma, Y., Zou, M., Ge, N., Wang, X., et al. (2019). A study on the assessment of multi-source satellite soil moisture products and reanalysis data for the Tibetan Plateau. Remote Sens. (Basel). 11 (10), 1196. doi:10.3390/rs11101196
Cogley, J. G. (2011). Present and future states of himalaya and karakoram glaciers. Ann. Glaciol. 52 (59), 69–73. doi:10.3189/172756411799096277
Dee, D. P., Uppala, S. M., Simmons, A. J., Berrisford, P., Poli, P., Kobayashi, S., et al. (2011). The ERA‐Interim reanalysis: configuration and performance of the data assimilation system. Q. J. R. meteorological Soc. 137 (656), 553–597.
Delworth, T. L., and Manabe, S. (1988). The influence of potential evaporation on the variabilities of simulated soil wetness and climate. J. Clim. 1 (5), 523–547. doi:10.1175/1520-0442(1988)001<0523:tiopeo>2.0.co;2
Deng, M., Meng, X., Li, Z., Lyv, Y., Lei, H., Zhao, L., et al. (2020). Responses of soil moisture to regional climate change over the three rivers source region on the tbetan plateau. Int. J. Climatol. 40 (4), 2403–2417. doi:10.1002/joc.6341
Deng, Y., Wang, S., Bai, X., Luo, G., Wu, L., Cao, Y., et al. (2020). Variation trend of global soil moisture and its cause analysis. Ecol. Indic. 110, 105939. doi:10.1016/j.ecolind.2019.105939
Dobriyal, P., Qureshi, A., Badola, R., and Hussain, S. A. (2012). A review of the methods available for estimating soil moisture and its implications for water resource management. J. Hydrology 458-459, 110–117. doi:10.1016/j.jhydrol.2012.06.021
Dorigo, W. A., Wagner, W., Hohensinn, R., Hahn, S., Paulik, C., Xaver, A., et al. (2011). The international soil moisture Network: a data hosting facility for global in situ soil moisture measurements. Hydrol. Earth Syst. Sci. 15 (5), 1675–1698. doi:10.5194/hess-15-1675-2011
Dorigo, W., de Jeu, R., Chung, D., Parinussa, R., Liu, Y., Wagner, W., et al. (2012). Evaluating global trends (1988–2010) in harmonized multi-satellite surface soil moisture. Geophys. Res. Lett. 39 (18). doi:10.1029/2012gl052988
Dorigo, W., and De Jeu, R. (2016). Satellite soil moisture for advancing our understanding of earth system processes and climate change. Int. J. Appl. Earth Observation Geoinformation 48, 1–4. doi:10.1016/j.jag.2016.02.007
Dorigo, W., Wagner, W., Albergel, C., Albrecht, F., Balsamo, G., Brocca, L., et al. (2017). ESA CCI soil moisture for improved earth system understanding: state-of-the art and future directions. Remote Sens. Environ. 203, 185–215. doi:10.1016/j.rse.2017.07.001
Dutta, A. (2001). Telecommunications and economic activity: an analysis of granger causality. J. Manag. Inf. Syst. 17 (4), 71–95.
Ek, M., Mitchell, K. E., Lin, Y., Rogers, E., Grunmann, P., Koren, V., et al. (2003). Implementation of Noah land surface model advances in the national centers for environmental prediction operational mesoscale Eta model. J. Geophys. Res. 108 (D22), 2002JD003296. doi:10.1029/2002jd003296
Farr, T. G., Rosen, P. A., Caro, E., Crippen, R., Duren, R., Hensley, S., et al. (2003). The shuttle radar topography mission. 45. doi:10.1029/2005RG000183
Flanagan, L. B., and Johnson, B. G. (2005). Interacting effects of temperature, soil moisture and plant biomass production on ecosystem respiration in a northern temperate grassland. Agric. For. Meteorology 130 (3-4), 237–253. doi:10.1016/j.agrformet.2005.04.002
Gardelle, J., Berthier, E., and Arnaud, Y. (2012). Slight mass gain of karakoram glaciers in the early twenty-first century. Nat. Geosci. 5 (5), 322–325. doi:10.1038/ngeo1450
Gasse, F., Arnold, M., Fontes, J. C., Fort, M., Gibert, E., Huc, A., et al. (1991). A 13, 000-year climate record from western tibet. Nature 353 (6346), 742–745. doi:10.1038/353742a0
Gelaro, R., McCarty, W., Suarez, M. J., Todling, R., Molod, A., Takacs, L., et al. (2017). The modern-era retrospective analysis for research and applications, version 2 (MERRA-2). J. Clim. 30 (14), 5419–5454. doi:10.1175/jcli-d-16-0758.1
Granger, C. W. (1969). Investigating causal relations by econometric models and cross-spectral methods. Econometrica 37, 424–438. doi:10.2307/1912791
Gruber, A., Scanlon, T., van der Schalie, R., Wagner, W., and Dorigo, W. (2019). Evolution of the ESA CCI Soil Moisture climate data records and their underlying merging methodology. Earth Syst. Sci. Data 11 (2), 717–739. doi:10.5194/essd-11-717-2019
Hersbach, H., Bell, B., Berrisford, P., Hirahara, S., Horanyi, A., Munoz-Sabater, J., et al. (2020). The ERA5 global reanalysis. Q. J. R. Meteorol. Soc. 146 (730), 1999–2049. doi:10.1002/qj.3803
Hiemstra, C., and Jones, J. D. J. T. J. o. F. (1994). Testing for linear and nonlinear granger causality in the stock price-volume relation. J. Finance 49 (5), 1639–1664. doi:10.1111/j.1540-6261.1994.tb04776.x
Hohenegger, C., Brockhaus, P., Bretherton, C. S., and Schar, C. (2009). The soil moisture–precipitation feedback in simulations with explicit and parameterized convection. J. Clim. 22 (19), 5003–5020. doi:10.1175/2009jcli2604.1
Jiang, B., Liang, S., and Yuan, W. (2015). Observational evidence for impacts of vegetation change on local surface climate over northern china using the granger causality test. J. Geophys. Res. Biogeosci. 120 (1), 1–12. doi:10.1002/2014jg002741
Jung, M., Reichstein, M., Ciais, P., Seneviratne, S. I., Sheffield, J., Goulden, M. L., et al. (2010). Recent decline in the global land evapotranspiration trend due to limited moisture supply. Nature 467 (7318), 951–954. doi:10.1038/nature09396
Kobayashi, S., Ota, Y., Harada, Y., Ebita, A., Moriya, M., Onoda, H., et al. (2015). The JRA-55 reanalysis: general specifications and basic characteristics. J. Meteorological Soc. Jpn. 93 (1), 5–48. doi:10.2151/jmsj.2015-001
Kónya, L. (2006). Exports and growth: granger causality analysis on OECD countries with a panel data approach. Econ. Model. 23 (6), 978–992. doi:10.1016/j.econmod.2006.04.008
Koster, R. D., Dirmeyer, P. A., Guo, Z., Bonan, G., Chan, E., Cox, P., et al. (2004). Regions of strong coupling between soil moisture and precipitation. Science 305 (5687), 1138–1140. doi:10.1126/science.1100217
Krakauer, N., Cook, B., and Puma, M. (2010). Contribution of soil moisture feedback to hydroclimatic variability. Hydrol. Earth Syst. Sci. 14 (3), 505–520. doi:10.5194/hess-14-505-2010
Lakshmi, V., Piechota, T., Narayan, U., and Tang, C. (2004). Soil moisture as an indicator of weather extremes. Geophys. Res. Lett. 31 (11), 1–4. doi:10.1029/2004gl019930
Li, C., Lu, H., Yang, K., Han, M., Wright, J., Chen, Y., et al. (2018). The evaluation of SMAP enhanced soil moisture products using high-resolution model simulations and in-situ observations on the Tibetan plateau. Remote Sens. 10 (4), 535. doi:10.3390/rs10040535
Li, M., Wu, P., and Ma, Z. (2020). A comprehensive evaluation of soil moisture and soil temperature from third-generation atmospheric and land reanalysis data sets. Int. J. Climatol. 40 (13), 5744–5766. doi:10.1002/joc.6549
Li, M., Wu, P., Ma, Z., Pan, Z., Lv, M., Yang, Q., et al. (2022). The increasing role of vegetation transpiration in soil moisture loss across China under global warming. J. Hydrometeorol. 23 (2), 253–274. doi:10.1175/jhm-d-21-0132.1
Liu, Q., Du, J., Shi, J., and Jiang, L. (2013). Analysis of spatial distribution and multi-year trend of the remotely sensed soil moisture on the tibetan plateau. Sci. China Earth Sci. 56 (12), 2173–2185. doi:10.1007/s11430-013-4700-8
Mahto, S. S., and Mishra, V. (2019). Does ERA-5 outperform other reanalysis products for hydrologic applications in India? J. Geophys. Res. Atmos. 124 (16), 9423–9441. doi:10.1029/2019jd031155
Martens, B., Miralles, D. G., Lievens, H., van der Schalie, R., de Jeu, R. A. M., Fernandez-Prieto, D., et al. (2017). GLEAM v3: satellite-based land evaporation and root-zone soil moisture. Geosci. Model Dev. 10 (5), 1903–1925. doi:10.5194/gmd-10-1903-2017
Meng, F., Luo, M., Sa, C., Wang, M., and Bao, Y. (2022). Quantitative assessment of the effects of climate, vegetation, soil and groundwater on soil moisture spatiotemporal variability in the mongolian plateau. Sci. Total Environ. 809, 152198. doi:10.1016/j.scitotenv.2021.152198
Mirzargar, M., Whitaker, R. T., and Kirby, R. M. (2014). Curve boxplot: generalization of boxplot for ensembles of curves. IEEE Trans. Vis. Comput. Graph. 20 (12), 2654–2663. doi:10.1109/tvcg.2014.2346455
Muñoz-Sabater, J., Dutra, E., Agusti-Panareda, A., Albergel, C., Arduini, G., Balsamo, G., et al. (2021). ERA5-Land: a state-of-the-art global reanalysis dataset for land applications. Earth Syst. Sci. Data 13 (9), 4349–4383. doi:10.5194/essd-13-4349-2021
Njoku, E. G., Jackson, T., Lakshmi, V., Chan, T., and Nghiem, S. (2003). Soil moisture retrieval from AMSR-E. IEEE Trans. Geosci. Remote Sens. 41 (2), 215–229. doi:10.1109/tgrs.2002.808243
Olauson, J. J. R. e. (2018). ERA5: The new champion of wind power modelling, 126, 322. doi:10.1016/j.renene.2018.03.056
Papagiannopoulou, C., Miralles, D. G., Decubber, S., Demuzere, M., Verhoest, N. E. C., Dorigo, W. A., et al. (2017). A non-linear Granger-causality framework to investigate climate–vegetation dynamics. Geosci. Model Dev. 10 (5), 1945–1960. doi:10.5194/gmd-10-1945-2017
Paris Anguela, T., Zribi, M., Hasenauer, S., Habets, F., and Loumagne, C. (2008). Analysis of surface and root-zone soil moisture dynamics with ERS scatterometer and the hydrometeorological model SAFRAN-ISBA-MODCOU at grand morin watershed (France). Hydrol. Earth Syst. Sci. 12 (6), 1415–1424. doi:10.5194/hess-12-1415-2008
Pascolini-Campbell, M., Reager, J. T., Chandanpurkar, H. A., and Rodell, M. (2021). Retracted article: A 10 per cent increase in global land evapotranspiration from 2003 to 2019. Nature 593 (7860), 543–547. doi:10.1038/s41586-021-03503-5
Peng, J., Loew, A., Merlin, O., and Verhoest, N. E. C. (2017). A review of spatial downscaling of satellite remotely sensed soil moisture. Rev. Geophys. 55 (2), 341–366. doi:10.1002/2016rg000543
Robock, A., Vinnikov, K. Y., Srinivasan, G., Entin, J. K., Hollinger, S. E., Speranskaya, N. A., et al. (2000). The global soil moisture data bank. Bull. Am. Meteorol. Soc. 81 (6), 1281–1299. doi:10.1175/1520-0477(2000)081<1281:tgsmdb>2.3.co;2
Runge, J., Bathiany, S., Bollt, E., Camps-Valls, G., Coumou, D., Deyle, E., et al. (2019). Inferring causation from time series in earth system sciences. Nat. Commun. 10 (1), 2553–2613. doi:10.1038/s41467-019-10105-3
Schmugge, T., Jackson, T., and McKim, H. (1980). Survey of methods for soil moisture determination. Water Resour. Res. 16 (6), 961–979. doi:10.1029/wr016i006p00961
Seneviratne, S. I., Corti, T., Davin, E. L., Hirschi, M., Jaeger, E. B., Lehner, I., et al. (2010). Investigating soil moisture–climate interactions in a changing climate: a review. Earth-Science Rev. 99 (3-4), 125–161. doi:10.1016/j.earscirev.2010.02.004
Sheffield, J., and Wood, E. F. J. J. o. C. (2008). Global trends and variability in soil moisture and drought characteristics, 1950–2000, from observation-driven simulations of the terrestrial hydrologic cycle. J. Clim. 21 (3), 432–458. doi:10.1175/2007jcli1822.1
Sokol, Z., BližŇÁk, V., and Michaelides, S. (2009). Areal distribution and precipitation-altitude relationship of heavy short-term precipitation in the Czech Republic in the warm part of the year. Atmos. Res. 94 (4), 652–662. doi:10.1016/j.atmosres.2009.03.001
Spencer, M., Wheeler, K., White, C., West, R., Piepmeier, J., Hudson, D., et al. (2010). “The Soil Moisture Active Passive (SMAP) mission L-Band radar/radiometer instrument,” in Geoscience and Remote sensing symposium (IGARSS) (Honolulu, Hawaii: IEEE International), 3240
Spennemann, P. C., Rivera, J. A., Saulo, A. C., and Penalba, O. C. (2015). A comparison of GLDAS soil moisture anomalies against standardized precipitation index and multisatellite estimations over south america. J. Hydrometeorol. 16 (1), 158–171. doi:10.1175/jhm-d-13-0190.1
Swenson, S., Famiglietti, J., Basara, J., and Wahr, J. (2008). Estimating profile soil moisture and groundwater variations using GRACE and Oklahoma mesonet soil moisture data. Water Resour. Res. 44 (1). doi:10.1029/2007wr006057
Tuttle, S., and Salvucci, G. D. (2016). Empirical evidence of contrasting soil moisture–precipitation feedbacks across the united states. Science 352 (6287), 825–828. doi:10.1126/science.aaa7185
Vargas Zeppetello, L. R., Battisti, D. S., and Baker, M. B. (2019). The origin of soil moisture evaporation “regimes”. J. Clim. 32 (20), 6939–6960. doi:10.1175/jcli-d-19-0209.1
Vauclin, M., Khanji, D., and Vachaud, G. (1979). Experimental and numerical study of a transient, two-dimensional unsaturated-saturated water table recharge problem. Water Resour. Res. 15 (5), 1089–1101. doi:10.1029/wr015i005p01089
Verrot, L., and Destouni, G. (2016). Worldwide soil moisture changes driven by future hydro-climatic change scenarios. Hydrol. Earth Syst. Sci. Discuss., 1. doi:10.5194/hess-2016-165
Wagner, W., Scipal, K., Pathe, C., Gerten, D., Lucht, W., Rudolf, B., et al. (2003). Evaluation of the agreement between the first global remotely sensed soil moisture data with model and precipitation data. J. Geophys. Res. 108 (D19), 4611. doi:10.1029/2003jd003663
Wang, L., and Qu, J. J. (2009). Satellite remote sensing applications for surface soil moisture monitoring: a review. Front. Earth Sci. China 3 (2), 237–247. doi:10.1007/s11707-009-0023-7
Wang, T., Zhao, Y., Xu, C., Ciais, P., Liu, D., Yang, H., et al. (2021). Atmospheric dynamic constraints on tibetan plateau freshwater under paris climate targets. Nat. Clim. Chang. 11 (3), 219–225. doi:10.1038/s41558-020-00974-8
Wu, Z., Feng, H., He, H., Zhou, J., and Zhang, Y. (2021). Evaluation of soil moisture climatology and anomaly components derived from ERA5-land and GLDAS-2.1 in China. Water Resour. manage. 35 (2), 629–643. doi:10.1007/s11269-020-02743-w
Xie, X., He, B., Guo, L., Miao, C., and Zhang, Y. (2019). Detecting hotspots of interactions between vegetation greenness and terrestrial water storage using satellite observations. Remote Sens. Environ. 231, 111259. doi:10.1016/j.rse.2019.111259
Xie, Z., Hu, Z., Gu, L., Sun, G., Du, Y., and Yan, X. (2017). Meteorological forcing datasets for blowing snow modeling on the tibetan plateau: evaluation and intercomparison. J. Hydrometeorol. 18 (10), 2761–2780. doi:10.1175/jhm-d-17-0075.1
Xin, Y., Lu, N., Jiang, H., Liu, Y., and Yao, L. (2021). Performance of ERA5 reanalysis precipitation products in the guangdong-hong kong-macao greater bay area, China. J. Hydrology 602, 126791. doi:10.1016/j.jhydrol.2021.126791
Xing, Z., Fan, L., Zhao, L., De Lannoy, G., Frappart, F., Peng, J., et al. (2021). A first assessment of satellite and reanalysis estimates of surface and root-zone soil moisture over the permafrost region of Qinghai-Tibet Plateau. Remote Sens. Environ. 265, 112666. doi:10.1016/j.rse.2021.112666
Xu, J., Ma, Z., Yan, S., and Peng, J. (2022). Do ERA5 and ERA5-land precipitation estimates outperform satellite-based precipitation products? a comprehensive comparison between state-of-the-art model-based and satellite-based precipitation products over mainland China. J. Hydrol. X. 605, 127353. doi:10.1016/j.jhydrol.2021.127353
Xu, L., Baldocchi, D. D., and Tang, J. (2004). How soil moisture, rain pulses, and growth alter the response of ecosystem respiration to temperature. Glob. Biogeochem. Cycles 18 (4). doi:10.1029/2004gb002281
Yang, J.-S., Robinson, P., Jiang, C. F., and Xu, Z. Q. (1996). Ophiolites of the kunlun mountains, china and their tectonic implications. Tectonophysics 258 (1-4), 215–231. doi:10.1016/0040-1951(95)00199-9
Yang, K., Qin, J., Zhao, L., Chen, Y., Tang, W., Han, M., et al. (2013). A multi-scale soil moisture and freeze-thaw monitoring network on the third Pole. Bull. Am. Meteorol. Soc. 94 (12), 1907–1916. doi:10.1175/bams-d-12-00203.1
Yang, L., Sun, G., Zhi, L., and Zhao, J. (2018). Negative soil moisture-precipitation feedback in dry and wet regions. Sci. Rep. 8 (1), 4026. doi:10.1038/s41598-018-22394-7
Zeng, J., Li, Z., Chen, Q., Bi, H., Qiu, J., and Zou, P. (2015). Evaluation of remotely sensed and reanalysis soil moisture products over the tibetan plateau using in-situ observations. Remote Sens. Environ. 163, 91–110. doi:10.1016/j.rse.2015.03.008
Zhang, M., Huang, X., Chuai, X., Yang, H., Lai, L., and Tan, J. (2015). Impact of land use type conversion on carbon storage in terrestrial ecosystems of china: a spatial-temporal perspective. Sci. Rep. 5 (1), 10233–10313. doi:10.1038/srep10233
Zhang, Q., Fan, K., Singh, V. P., Song, C., Xu, C. Y., and Sun, P. (2019). Is himalayan-tibetan plateau “drying”? historical estimations and future trends of surface soil moisture. Sci. Total Environ. 658, 374–384. doi:10.1016/j.scitotenv.2018.12.209
Keywords: soil moisture, Tibetan Plateau, evolution characteristics, multi-depth, long time series
Citation: Liu Y and Yang Y (2022) Multi-depth evolution characteristics of soil moisture over the Tibetan Plateau in the past 70 years using reanalysis products. Front. Environ. Sci. 10:979853. doi: 10.3389/fenvs.2022.979853
Received: 28 June 2022; Accepted: 18 July 2022;
Published: 22 August 2022.
Edited by:
Wenlong Jing, Guangzhou Institute of Geography, ChinaReviewed by:
Yuyue Xu, Nanjing University, ChinaXin Lyu, Beijing Normal University, China
Yongchang Ye, South Dakota State University, United States
Copyright © 2022 Liu and Yang. This is an open-access article distributed under the terms of the Creative Commons Attribution License (CC BY). The use, distribution or reproduction in other forums is permitted, provided the original author(s) and the copyright owner(s) are credited and that the original publication in this journal is cited, in accordance with accepted academic practice. No use, distribution or reproduction is permitted which does not comply with these terms.
*Correspondence: Yangxiaoyue Liu, lyxy@lreis.ac.cn