Technical Note

Impact of Using a New High-Resolution Solar Reference Spectrum on OMI Ozone Profile Retrievals

1
Institute of Environmental Studies, Pusan National University, Busan 46241, Korea
2
Smithsonian Astrophysical Observatory (SAO), Center for Astrophysics|Harvard & Smithsonian, Cambridge, MA 02138, USA
3
Laboratory for Atmospheric and Space Physics, University of Colorado Boulder, Boulder, CO 80303, USA
4
Department of Atmospheric Sciences, Pusan National University, Busan 46241, Korea
*
Author to whom correspondence should be addressed.
Remote Sens. 2022, 14(1), 37; https://doi.org/10.3390/rs14010037
Submission received: 22 November 2021 / Revised: 13 December 2021 / Accepted: 14 December 2021 / Published: 23 December 2021
(This article belongs to the Section Atmospheric Remote Sensing)

Abstract

:
We evaluated a new high-resolution solar reference spectrum for characterizing space-borne Ozone Monitoring Instrument (OMI) measurements as well as for retrieving ozone profile retrievals over the ultraviolet (UV) wavelength range from 270 to 330 nm. The SAO2010 solar reference has been a standard for use in atmospheric trace gas retrievals, which is a composite of ground-based and balloon-based solar measurements from the Kitt Peak National Observatory (KPNO) and Air Force Geophysics Laboratory (AFGL), respectively. The new reference spectrum, called the TSIS-1 Hybrid Solar Reference Spectrum (HSRS), spans 202–2730 nm at a 0.01 to ~0.001 nm spectral resolution. The TSIS-1 HSRS in the UV region of interest in this study is a composite of AFGL and ground-based solar measurements from the Quality Assurance of Spectral Ultraviolet Measurements In Europe (QASUME) campaign, with a radiometric calibration that used the lower resolution Spectral Irradiance Monitor (SIM) instrument on the space-based Total and Spectral Solar Irradiance Sensor-1 (TSIS-1) mission. The TSIS-1 HSRS radiometric uncertainties were below 1% whereas those of SAO2010 ranged from 5% in the longer UV part to 15% in the shorter UV part. In deriving slit functions and wavelength shifts from OMI solar irradiances, the resulting fitting residuals showed significant improvements of 0.5–0.7% (relatively, 20–50%) due to switching from the SAO2010 to the TSIS-1 HSRS. Correspondingly, in performing ozone profile retrievals from OMI radiances, the fitting residuals showed relative improvements of up to ~5% in 312–330 nm with relative differences of 5–7% in the tropospheric layer column ozone; the impact on stratospheric ozone retrievals was negligible.

1. Introduction

The accurate knowledge of extraterrestrial solar radiation is required in many physical applications to study the natural influence of the sun on the radiative forcing of the climate and photochemistry of the earth as well as its oceanic and atmospheric circulation. This paper particularly focuses on the use of a well-calibrated high-resolution solar spectrum as a reference for hyperspectral remote-sensing measurements in ultraviolet (UV), visible for retrieving atmospheric trace gas concentrations. The primary use of this solar reference spectrum is for the in-flight wavelength assignment and instrument spectral response function (ISRF) characterization by means of matching the solar Fraunhofer absorption lines between the measured and reference spectra [1,2]. The derived ISRFs are required in forward model simulations for the convolution of either high-resolution input spectra or simulated output spectra into an instrumental resolution [3,4]. The solar reference spectrum also plays an important role in accounting for the ring effect and in simulating radiances at the instrument resolution for the spectral fitting analysis of scattered sunlight [5,6]. In addition, for airborne or surface-based measurements of the transmitted or scattered sunlight, it is used to simulate the extraterrestrial solar irradiance spectra that are often not available [7,8]. In order to assure the utility of those applications, the absolute accuracy of the solar reference spectrum needs to be in the order of 3–5% or better whereas the spectral resolution needs to be at least an order of magnitude finer than that of the atmospheric measurements, which have approximately a 0.2–1.0 nm resolution [9,10]. Direct, space-based observations of solar spectral irradiance exist (e.g., [11,12]) but at a spectral resolution no better than 0.1 nm and they are subject to instrument degradation, particularly at UV wavelengths, due to the space environment [9,12]. Therefore, ground-based observations of the sun at high-altitude sites have been applied to derive the high-resolution solar reference spectra in the UV, both visible and near-infrared. These spectra have the advantages of broadband coverage with a single instrument as well as a high-resolution capability but lack an absolute radiometric accuracy due to strong interference from atmospheric absorption and scattering. Furthermore, the atmospheric interference becomes strong below 300 nm where the ozone and oxygen of the earth absorb all incident radiation before penetrating into ground sites. To extend the spectral range to the shorter UV spectrum, a high-altitude stratospheric balloon spectrum by Hall and Anderson [13] has typically been employed to avoid the strong absorption of the ozone layer and aerosol/cloud loading. However, it has a lower spectral resolution and narrower spectral coverage than ground-based measurements due to constraints on the size and weight of the instruments although the atmospheric interferences above the balloon altitude can still be significant.
Chance and Kurucz [10] constructed a high-resolution (0.04 nm) SAO2010 solar reference spectrum with an intensity accuracy better than 5%, which has been regarded as the standard in atmospheric trace gas retrievals over the last decade (the number of citations was 363 as of 20 December 2021). The Royal Netherlands Meteorological Institute (KNMI) presented a solar reference spectrum in Dobber et al. [9] within the framework of the Ozone Monitoring Instrument (OMI) aboard the NASA Aura spacecraft for radiometric and wavelength calibrations. This KNMI2008 solar spectrum has also been popularly applied in the OMI and its successor instruments (e.g., the number of citations was 60 as of 20 December 2021). Recently, Coddington et al. [14] presented a new reference spectrum with a spectral resolution of 0.001 to ~0.01 nm and an accuracy of 1.3% in UV and 0.3–0.5% in the visible and near-infrared, which is named the Total and Spectral Solar Irradiance Sensor-1 (TSIS-1) Hybrid Solar Reference Spectrum (HSRS).
In this work, we evaluated this newly released solar reference for ozone profile retrievals from space-borne backscattered UV measurements against the existing solar reference spectra, SAO2010 and KNMI2008. The detailed descriptions of the solar reference datasets and ozone profile algorithm used in this paper follow in Section 2. Section 3 presents the direct fitting analysis on the solar irradiance measurements and impacts on the ozone profile retrievals, highlighting that these solar reference spectra have not yet been compared and evaluated in the literature to our knowledge for use in the analysis of atmospheric spectra to retrieve the ozone profile and trace gases. We summarize and discuss the solar reference data that should establish a new standard for UV ozone retrievals in the 270–330 nm range in Section 4.

2. Data and Methodology

2.1. Solar Reference Spectra

In this paper, we focus on three solar reference datasets from Dobber et al. [9], Chance and Kurucz [10] and Coddington et al. [14] to determine which one gives the best fitting precisions for ozone profile retrievals using UV measurements (270–330 nm). As mentioned above, due to instrument limitations, each reference spectrum is a composite of several different sources. The main characteristics of both composite datasets and input sources are shown in Table 1.

2.1.1. KNMI2008 Spectrum

The KNMI2008 solar spectrum spans 250–550 nm at 0.01 nm intervals with a spectral resolution of 0.025 nm [9]. This is a composite of high-resolution balloon-based UV measurements (AFGL [13]) and ground-based high-resolution FTS measurements obtained at Kitt Peak (KPNO1995 [16]), following the approach of Chance and Spurr [22] in which the earlier version of the SAO2010 spectrum was released (SAO1997). Therefore, the wavelength accuracy remained unchanged from SAO1997 as 1–2 × 10⁻³ nm. However, the biased radiometric scales of the high-resolution inputs ( F h ) were adjusted into lower resolution but higher accuracy spectra ( F L ) through the spectral ratio method. The low-resolution input was taken from space-borne SUSIM measurements [18] in the UV range below 410 nm and balloon-borne measurements [20] in the visible range, respectively. The correction spectrum was based on the spectral ratio of F L / F h that was derived at the spectral resolution of F L after convolving F h with the slit functions of F L and then interpolated at the sampling grids of F h .

2.1.2. SAO2020 Spectrum

The SAO2010 data [10] is a composite of the AFGL and KPNO measurements, similar to SAO1997 and KNMI2008. The AFGL spectrum remained unchanged from the original dataset. However, the FTS measurements were converted to solar transmittances with an improved reduction for atmospheric transmission and Nyquist sampled at 0.01 nm for the convolved spectrum using a Gaussian slit function of 0.04 nm FWHM resolution, referred to as KPNO2005 [16]. Note that the KPNO1995 spectrum was sampled at every 2 pixels per FWHM. Therefore, the wavelength accuracy was estimated as < 3. 0 × 10 4 nm for SAO2010 where the KPNO2005 was merged, which corresponded with an order of magnitude improvement compared with KNMI2008. Improvements in the radiometric accuracy were also demonstrated to an agreement of 1% (or 2% at a few UV wavelengths) for KPNO2005 compared with KPNO1995.

2.1.3. TSIS-1 HSRS Spectrum

Coddington et al. [14] hybridized four existing high-resolution solar datasets to cover the range from 202 to 2730 nm by radiometrically adjusting them to the absolute scale of the TSIS-1 SIM and CSIM space-based observations of solar spectral irradiances. The uncertainties of the space-based TSIS-1 SIM solar irradiance spectra were ~0.41% < 460 nm and 0.24% > 460 nm; concurrent CSIM and TSIS-1 SIM observations agreed at better than 1% across the spectrum. The high-resolution datasets, summarized in Table 1, included the QASUMEFTS irradiance in the UV from 305.5 nm to 373.6 nm and the AFGL irradiance, KPNO transmittance and SPTS transmittance datasets were employed for extending to the shorter UV, visible and IR spectral ranges, respectively.
The derivation of the TSIS-1 HSRS spectrum included two key differences from those of the SAO2010 and KNMI2008 spectra. The TSIS-1 HSRS included high-resolution QASUMEFTS solar line data over the UV range for which both SAO2010 and KNMI2008 incorporated KPNO solar line data. In order to correct the radiometric uncertainties of the high-resolution input, the TSIS-1 HSRS also applied a modified (double convolution) spectral ratio method based on the TSIS-1 SIM satellite measurements, which was a change from the single convolution of the KNMI2008 spectral ratio approach based on SUSIM satellite measurements. The TSIS-1 HSRS modification included first convolving the high-resolution datasets to the TSIS-1 SIM and CSIM spectral resolutions followed by a second convolution that degraded all datasets to a coarser resolution than the TSIS-1 SIM and CSIM. The second convolution reduced the uncertainties in the TSIS-1 SIM and CSIM instrument line shapes (ILS) on the derived spectral ratio factor. Due to the varying spectral resolution of the TSIS-1 SIM and CSIM instruments, the following spectral resolutions were implemented in deriving the spectral ratio correction: 6 nm from 200 to 307 nm, 10 nm from 307 to 475 nm, 45 nm from 475 to 2365 nm and 100 nm from 2365 to 2800 nm.

2.2. Ozone Profile Retrievals

The OMI is a hyperspectral imager, which has been flying on the Aura spacecraft since 15 July 2004 [23]. It observes the radiance of the earth and extraterrestrial solar radiance in three bands: UV1 (270–310 nm), UV2 (310–365 nm) and VIS (365–500 nm). The spectral sampling varies from 0.15 to 0.32 nm with a spectral resolution of ~0.5 nm. The OMI scans a wide swath of 2600 km on the surface of the earth, which enables a global daily coverage within 14–15 orbits. In the normal operational mode, the cross-track swath is divided into 30 pixels for the UV1 band and 60 pixels for the UV2/VIS band, producing a nadir ground pixel size of 13 km × 24 km2 for the UV1 product and 13 km × 48 km2 for the UV2/VIS product, respectively. In this study, a fitting window of 270–330 nm was targeted for the ozone profile retrievals and two adjacent cross-track pixels of UV2 were co-added to match the UV1 spatial resolution. We used an optimal estimation (OE)-based ozone profile algorithm [24] that is in operation to produce OMI research ozone profile products, available from https://avdc.gsfc.nasa.gov (accessed on 10 December 2021). This inversion technique iteratively optimizes the solution of the ozone profiles by minimizing the difference between the observed and simulated radiances and between a priori and the retrieval variables constrained with observation and a priori uncertainties, respectively. The retrieved profile is partial ozone columns at 24 layers from surface to ~65 km, bounded by 25 pressure levels including the tropopause height. Hereafter, we describe where the high-resolution solar reference is used in this retrieval algorithm; other details can be found in Liu et al. [24]. As an initial step, the OMI slit functions were theoretically estimated from the OMI irradiance measurements through direct fitting to the convolution of a high-resolution solar reference I o with the assumed slit function as follows:
I s λ = A × I o λ + Δ λ     S × P s m λ + P b m λ
where A is the scaling parameter for Io. λ + Δ λ indicates the process of the wavelength calibration (e.g., shift and squeeze); only the wavelength shift was considered in this study. P s m λ and P b m λ   represent the scaling and baseline m t h order polynomials (third order in this study), respectively. The slit shapes were assumed to be Gaussian:
S   ( λ ) = exp λ λ ¯ ω 2
where ω is the half-width at 1/e intensity. In the retrieval process, the derived slit functions were used to simulate the OMI observation I ; A monochromatic radiance was calculated at 0.05 nm I h and then convolved with the instrumental slit functions S to match with the OMI spectral resolution using a solar I o corrected convolution approach:
I λ = I h × I o     S / I o     S
where represents the convolution along with I o , a high-resolution solar reference.

3. Results

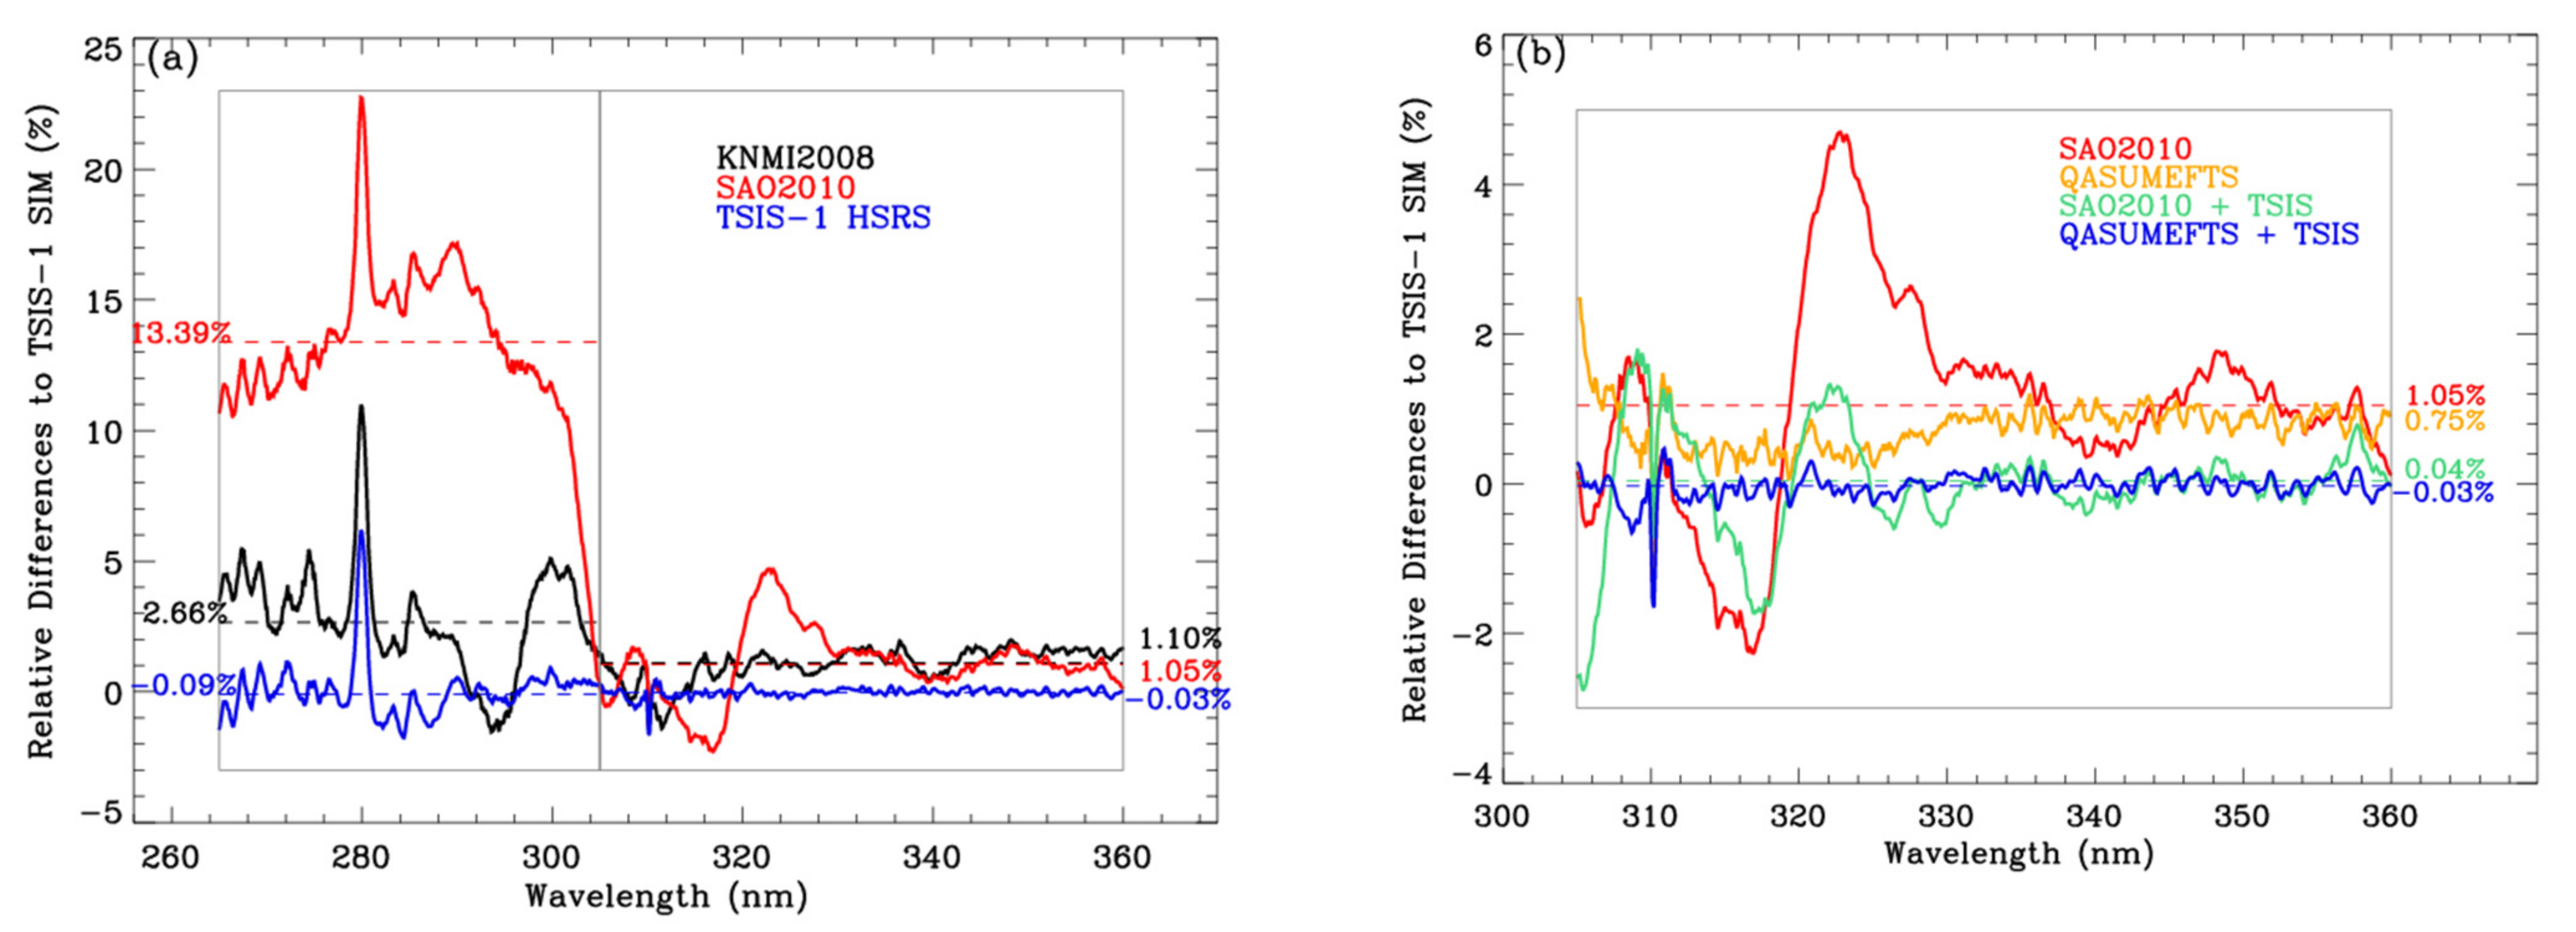
3.1. Comparisons of the High-Resolution Solar References

Figure 1a compares the irradiance scales of different high-resolution solar reference spectra against the TSIS-1 SIM satellite measurements. The comparison was limited to the Hartley and Huggins wavelengths from 265 to 360 nm where the ozone information is extractable from the satellite measurements of backscattered solar radiance. To reduce the impact of different spectral resolutions on the comparison, the high-resolution spectra were commonly smoothed with the measured TSIS-1 SIM wavelength-dependent instrument line shapes (ILS) whose FWHMs increase from 0.2 nm at 200 nm to 2.4 nm at 360 nm [11]. At the shorter UV wavelengths below ~305 nm, the low-frequency components of the differences could be explained by how the AFGL balloon-borne measurements are incorporated. In the SAO2010 spectrum, where the AFGL observations are applied at their reported radiometric scale, the average bias from the TSIS-1 SIM is 13.39%. The magnitude of this bias is consistent with the radiometric uncertainties (10–15%) of the AFGL spectrum reported by Hall and Anderson [13] and could arise from uncertainties in correcting the AFGL observations for stratospheric ozone absorption. In addition, individual biases of up to ~23% around 280 nm are likely to arise from the uncorrected strong emission from Mg+ in the ionosphere. The biases between KNMI2008 and the TSIS-1 SIM (2.66% ±   ~5%) and between the TSIS-1 HSRS and TSIS-1 SIM (0.09 ±   1.5 % ) are noticeably reduced owing to the radiometric recalibration of the AFGL measurements through the spectral ratio method, as described in Section 2. In the longer UV range above 305 nm, the biases in these reference spectra from the TSIS-1 SIM are 1.05% ±   3.5% for SAO2010, 1.10 ±   0.5% for KNMI2008 and −0.03 ±   0.15% for the TSIS-1 HSRS.
Figure 1b further examines how other reference spectra differ from the TSIS-1 SIM above 305 nm and motivates the inclusion of the QASUMEFTS observations in the TSIS-1 HSRS at these wavelengths as opposed to the KPNO data that is incorporated into the SAO2010 and KNMI2008 reference spectra. A spectral feature from 310–330 nm that is evident in the SAO2010 comparison (red) persisted but with a reduced magnitude after applying the modified spectral ratio method to recalibrate it to the TSIS-1 SIM absolute irradiance scale (green). This feature is absent in the QASUMEFTS data at the original radiometric scale (orange) and after recalibration to the TSIS-1 SIM scale (blue). A conclusive understanding of the source of the spectral feature is beyond the scope of this paper. However, the result implies that there is a limit to how well the modified spectral ratio approach could recalibrate large, oscillatory residual features in high-resolution solar line data to the absolute scale of a higher accuracy but lower resolution irradiance measurement. In the absence of large residual features (for example, from 330–360 nm), Figure 1b shows that the modified spectral ratio approach could perform equally well in recalibrating the solar line datasets of different underlying radiometric accuracies (see Table 1) to a common scale.

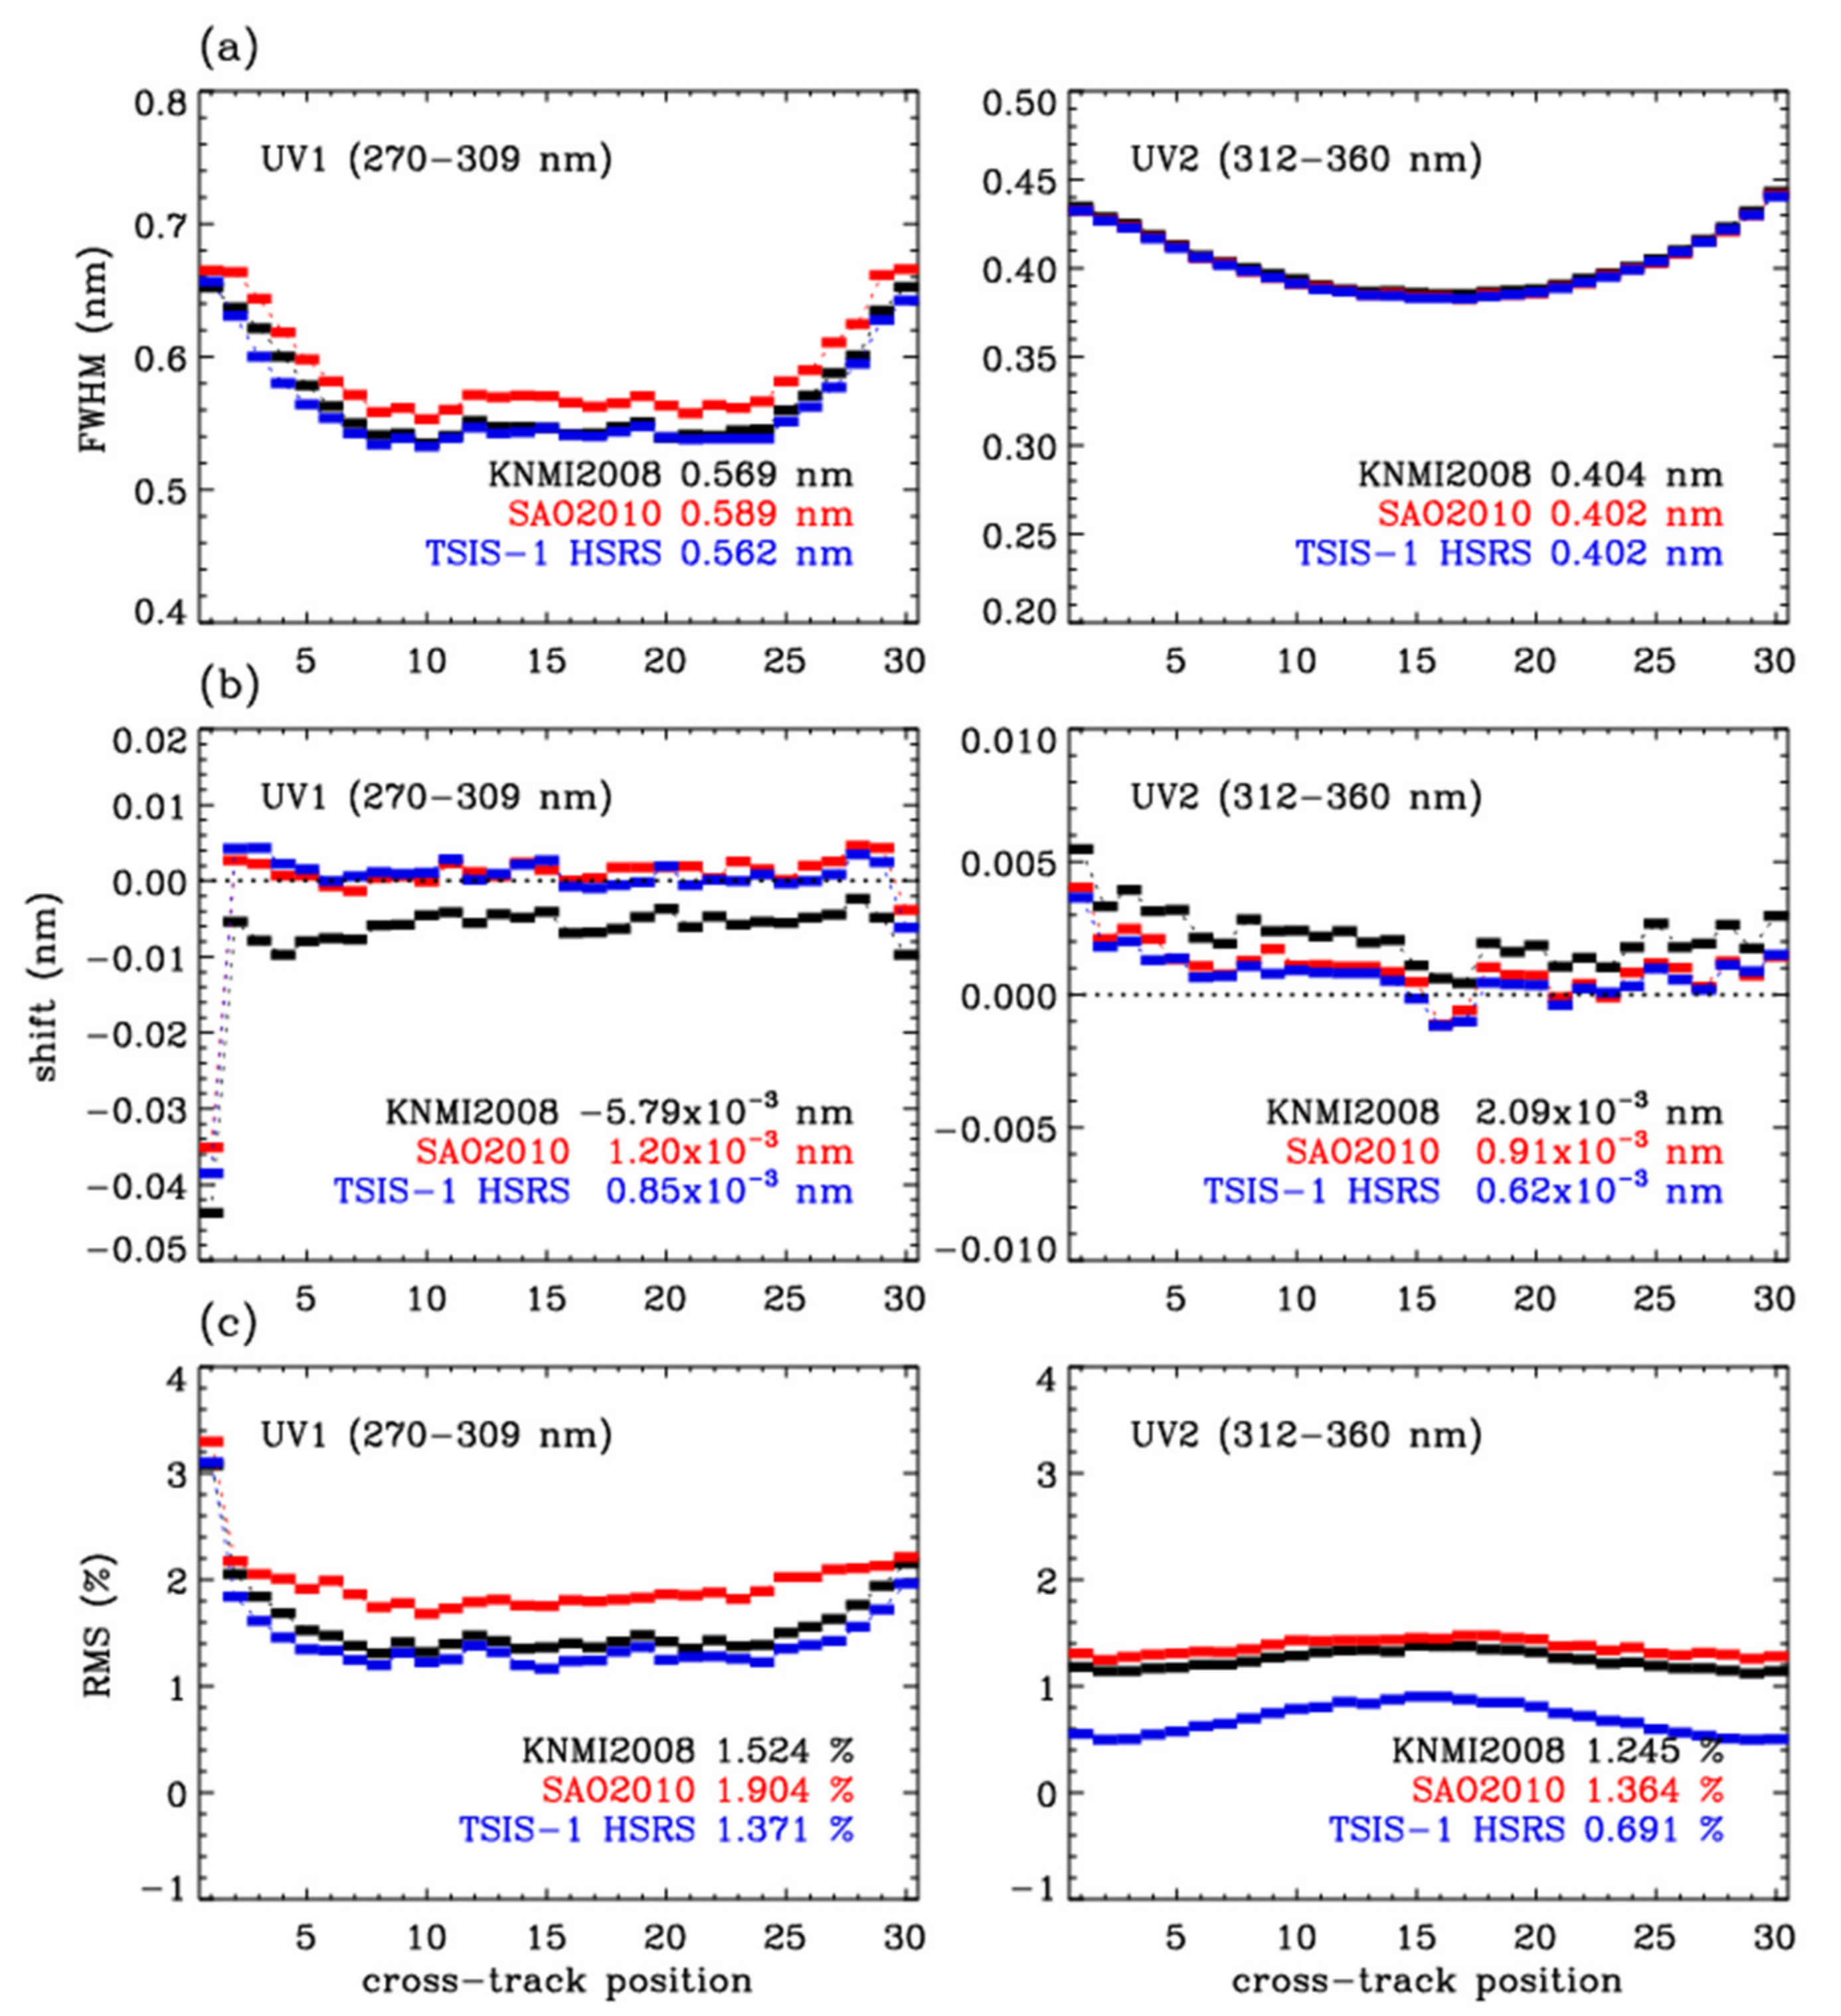
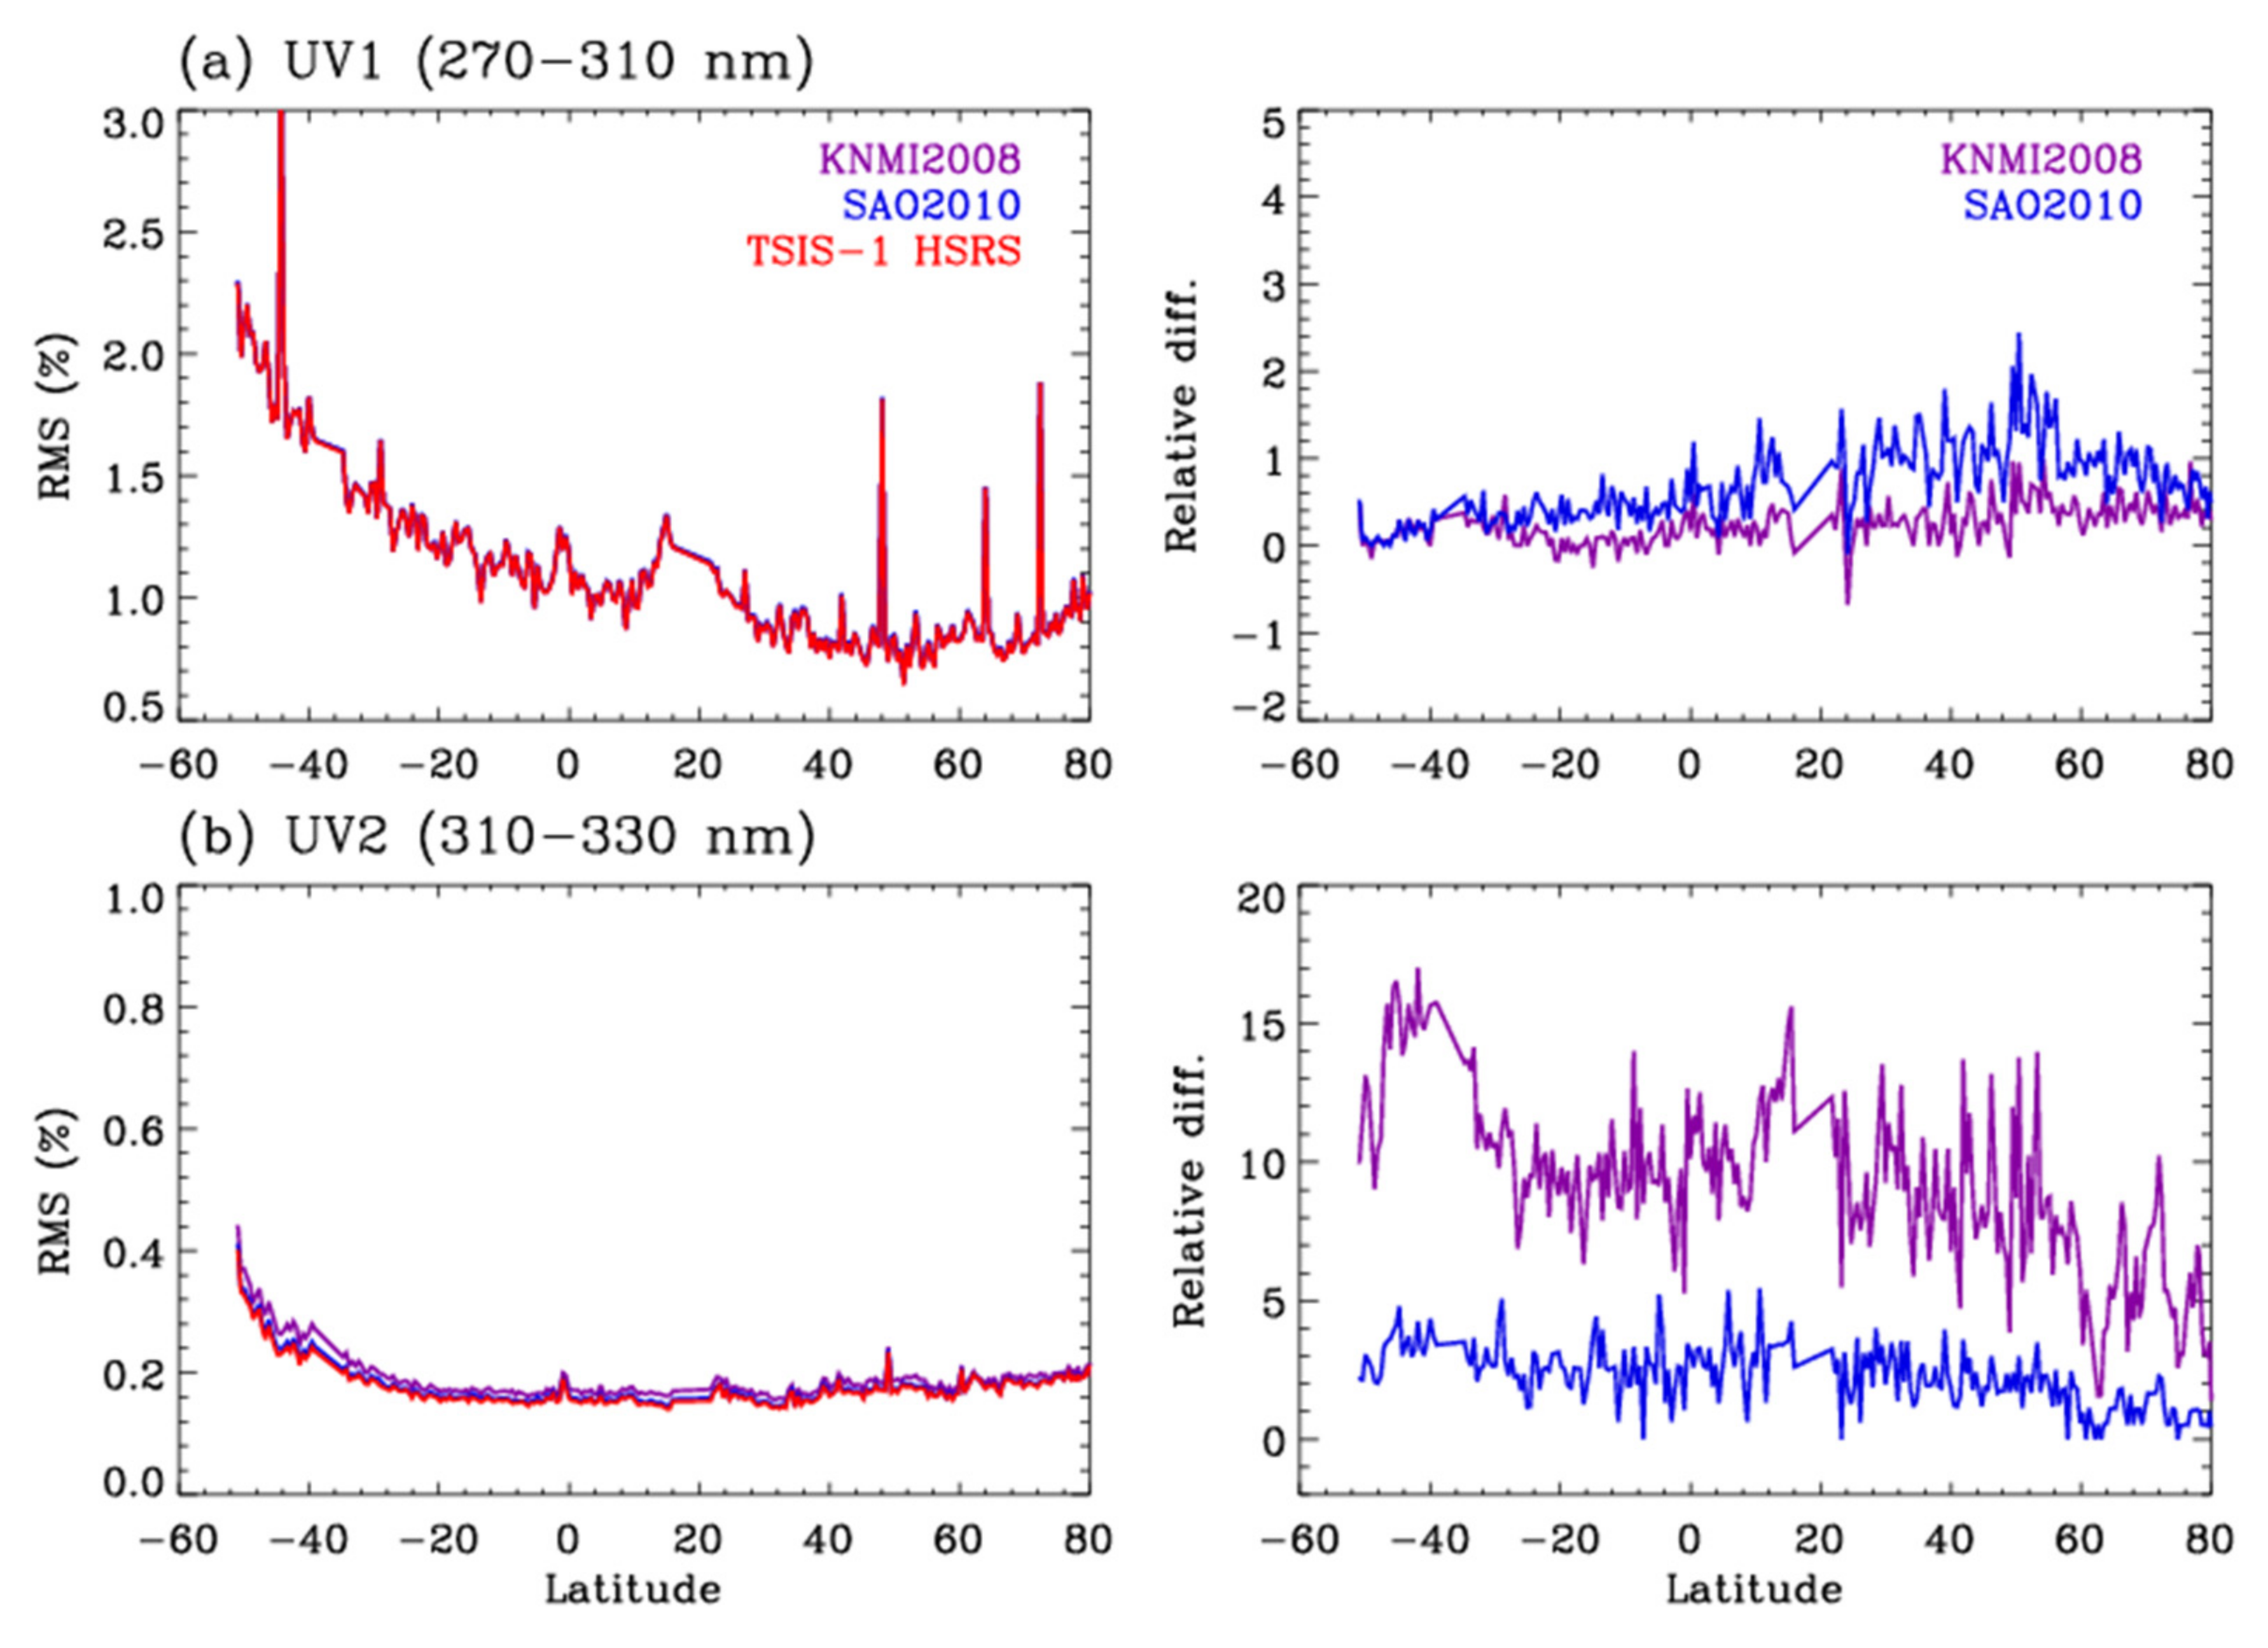
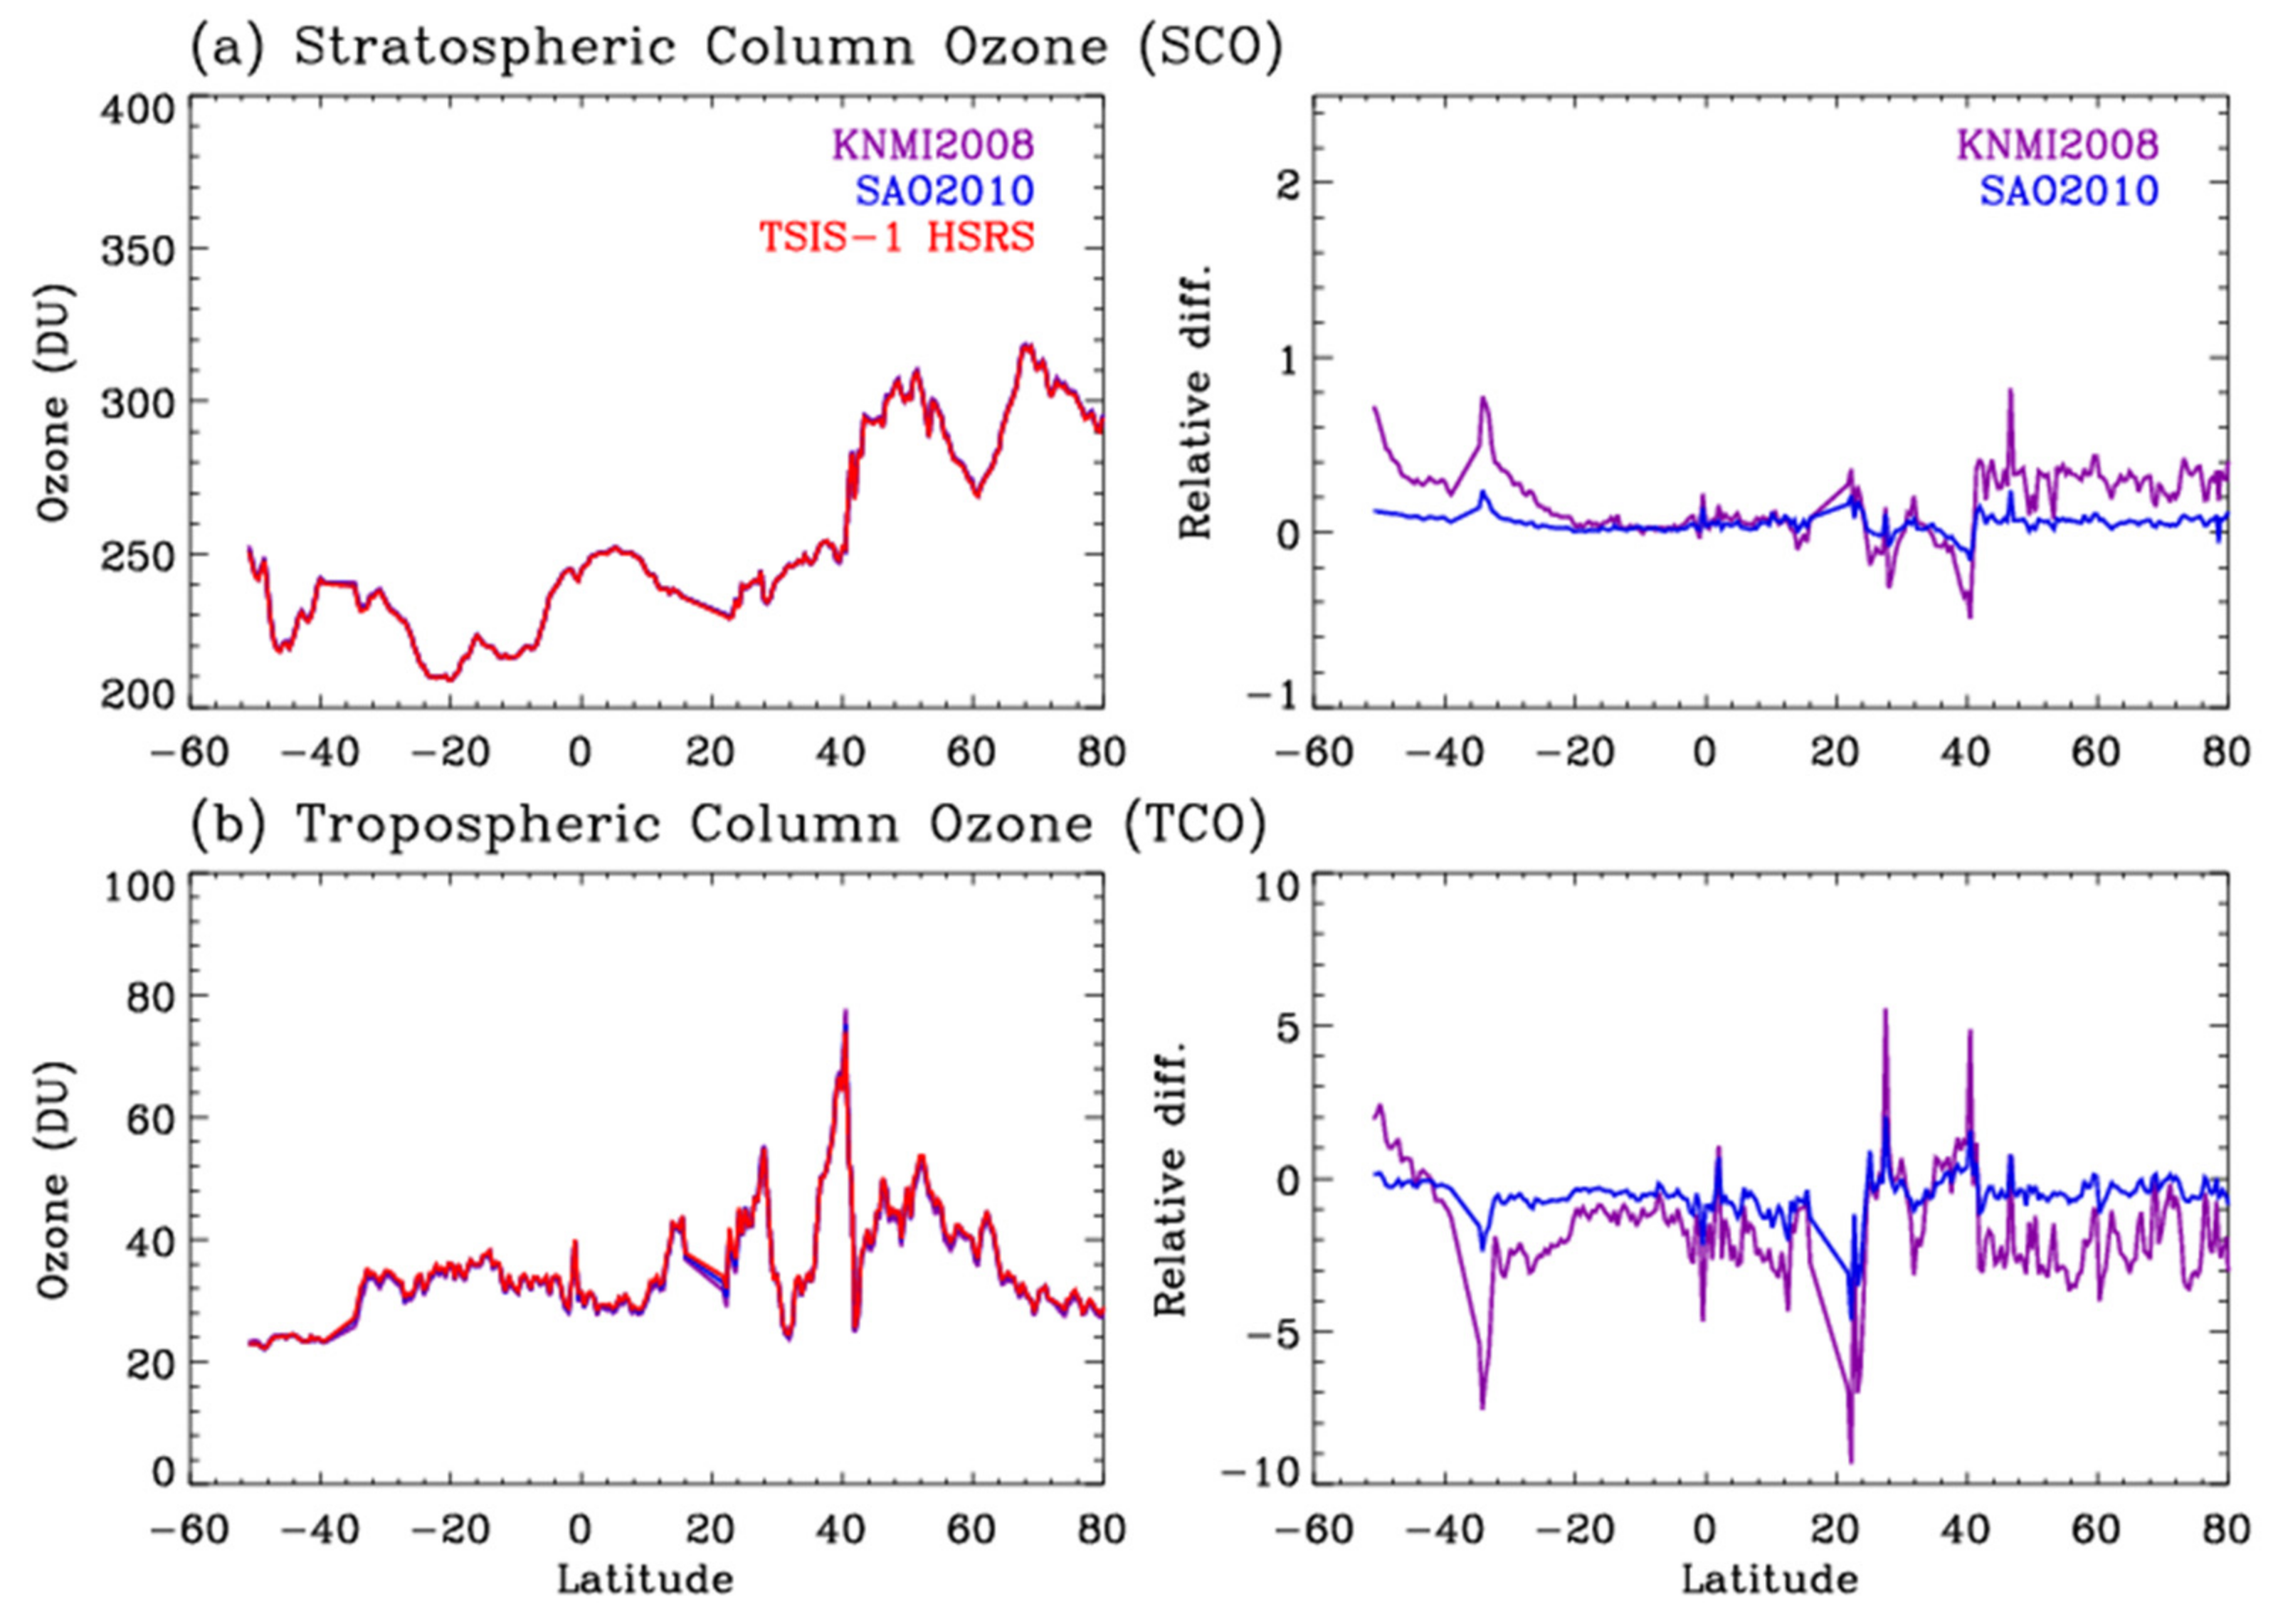
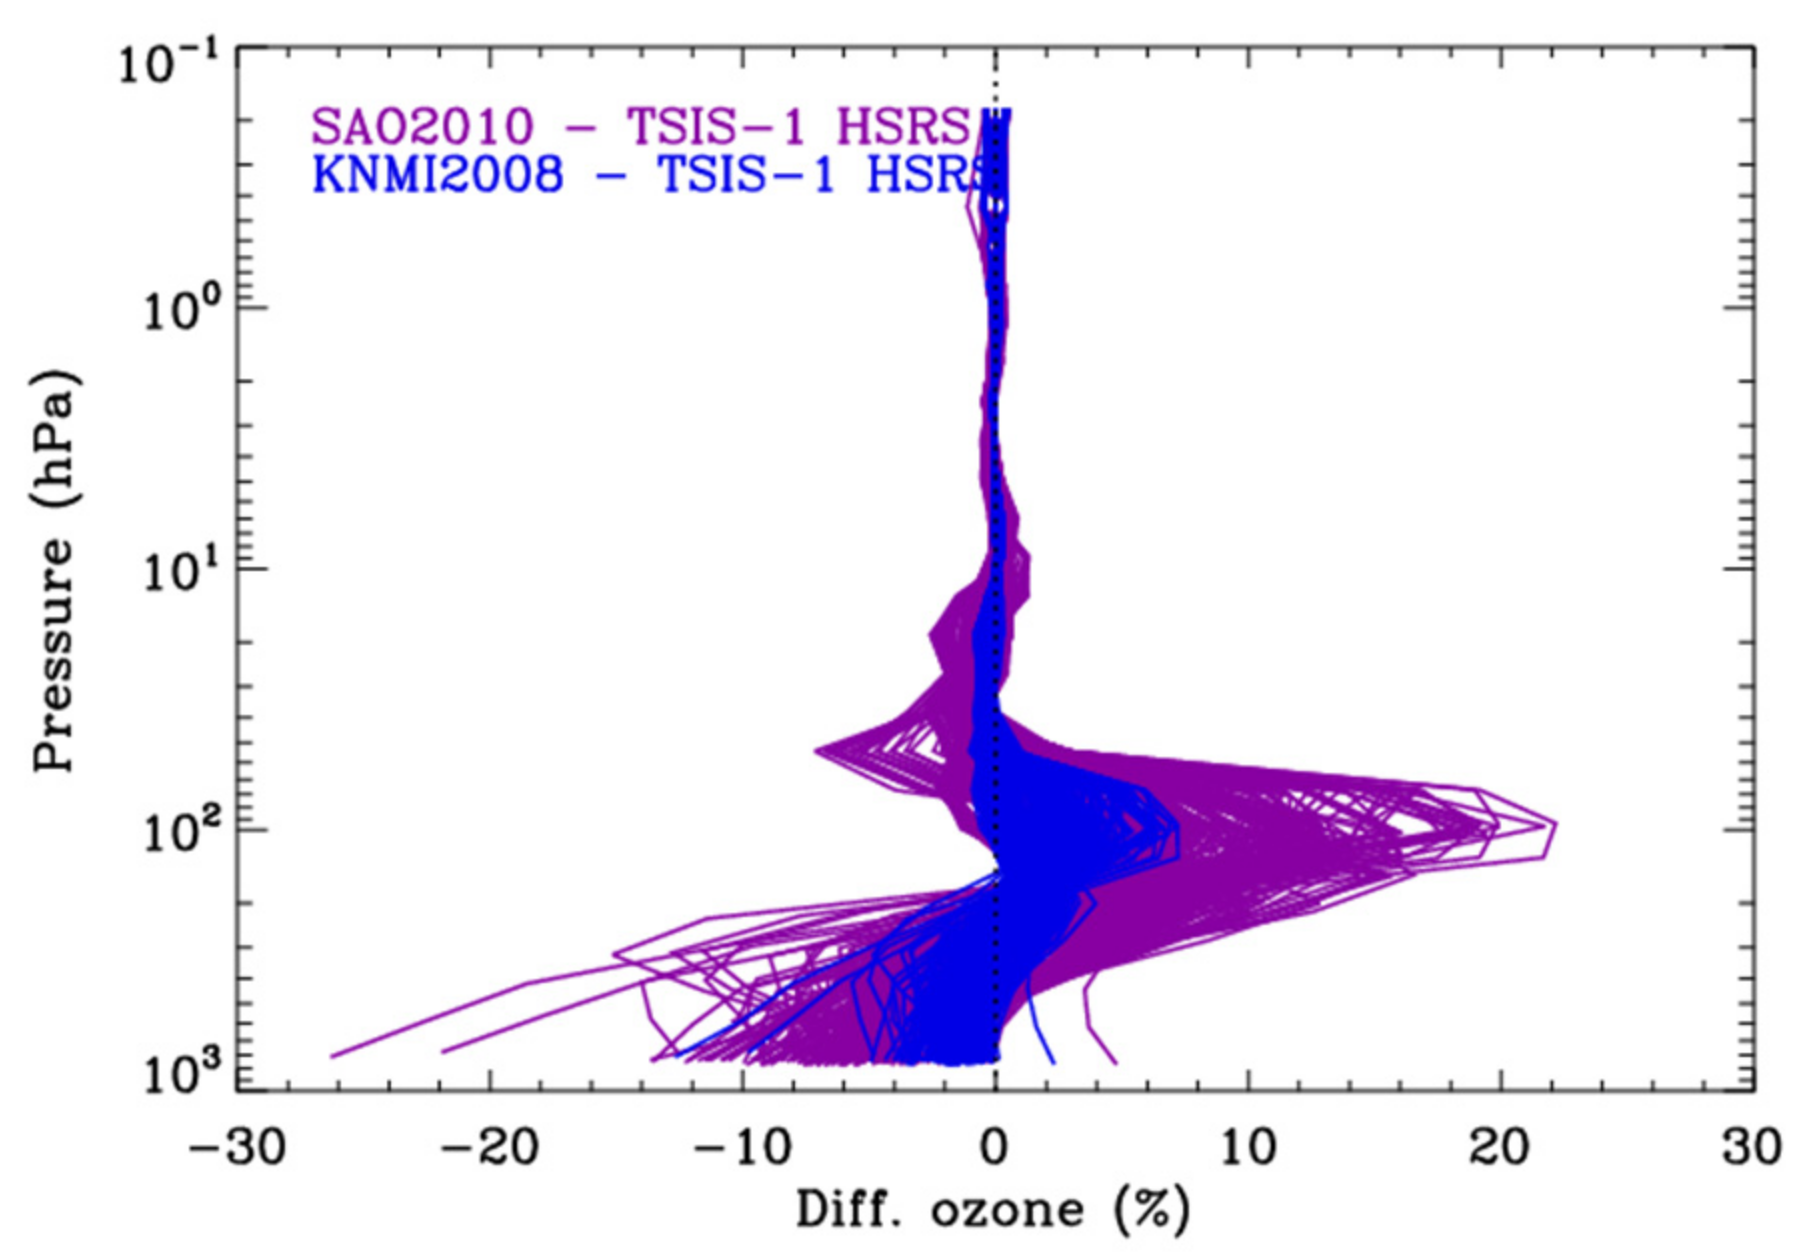
3.2. Comparison of the Ozone Profile Retrievals with Different Solar Reference Datasets

Previous works have evaluated solar reference spectra by assessing their radiometric and wavelength accuracies. However, this work is the first that we are aware of that has investigated the impact of applying different solar reference spectra to trace gas retrieval applications. As described in Section 2.2, retrieving ozone profiles requires a high-resolution solar reference spectrum to derive the OMI slit functions that are used to convolve simulated radiances into an OMI spectral resolution. Therefore, the accuracy of the solar reference spectrum directly impacts on the quality of the ozone profile retrievals from the optimal estimation solution to the best fit between the measured and simulated OMI radiances. The OMI slit functions vary mainly with the wavelength and cross-track pixel position [1]; the slit functions also suffer from instrument degradation over time [4]. Note that the wavelength dependence of the OMI slit functions is negligible within each UV band according to Bak et al. [4]. In this experiment, the OMI solar irradiances were averaged for July 2006 to remove short-term noise and then the slit functions and wavelength shifts were derived for the UV1 and UV2 bands, respectively. In Figure 2a, the slit width ω derived here was converted to 2 l n ω , representing the FWHM. The slit widths are broader in UV1 than in UV2. The FWHM differes by ~0.02 nm in the UV1 range and ~0.002 nm in the UV2 range due to different solar reference spectra. Figure 2b compares the magnitude of the spectral shifts required to match the OMI irradiances with the different high-resolution solar reference spectra convolved to the OMI resolution. The shifts of the UV1 irradiance are at the level of 1.0 × 10 3 when using SAO2010 and the TSIS-1 HSRS but are consistently biased over the cross-track pixels by ~6.0 × 10 3 when using KNMI2008. For the UV2 range, the shifts are at the level of 1.0 × 10 3 , except when the OMI spectra are fitted to the KNMI2008 reference spectrum ( Δ λ = 2.09 × 10 3 ). As noticed, the cross-track patterns of the fitted shifts are very similar in both UV1 and UV2 and, hence, the different magnitudes of the shifts could be attributed to the systematic differences in the wavelength accuracy among the three solar spectra. Figure 2c evaluates the root mean square (RMS) of the fitting residuals: RMS = 1 N 1 N ( I m I s / I m ) 2   × 100   % for the measured I m and simulated I s irradiance spectra, which could be representative of the qualities for the derived slit and wavelength calibration parameters. The average RMS values are 1.90% in UV1 and 1.36% in UV2 when applying the current standard dataset, SAO2010. The RMS values in the UV1 and UV2 bands are significantly reduced to 1.37% and 0.69%, respectively, by switching to the new solar reference dataset, TSIS-1 HSRS. The RMS values for KNMI2008 in the UV1 band are closer to those of TSIS-1 HSRS and slightly better than those of SAO2010. However, in the UV2 band, the RMS values for KNMI2008 are still significantly worse than those of the TSIS-1 HSRS.
In the rest of this section, the impact on the ozone profile retrievals using one orbit measurement from 1 July 2006 is discussed. Figure 3 compares the RMS of the fitting residuals between the measured and simulated radiance spectra, which should typically be minimized for better ozone profile retrievals. The best radiance fitting results are found generally when the TSIS-1 HSRS is applied. In UV1, the fitting RMS values are larger by 2% when using SAO2010 and comparable with those using KNMI. In UV2, the fitting RMS values are relatively larger by up 5% for SAO2010 and relatively larger by 5–15% for KNMI2008. Overall, the impact on the ozone spectral fitting is much larger in UV2 than in UV1 in spite of the larger impact of different solar reference spectra on the derived slit widths in UV1. That is because the convolution errors could be less important in the spectrally broad Hartley band (UV1) compared with the highly structured Huggins band (UV2) [4]. In Figure 4, the impact on the retrieved ozone is compared for the stratospheric and tropospheric ozone columns, respectively. Note that the atmospheric ozone was retrieved at 24 layers from the surface to 65 km and then integrated based on the thermal tropopause. The OMI UV1 channel contains most of the information for the stratospheric ozone whereas the tropospheric ozone information comes from the UV2 measurements. The sensitivity of the stratospheric ozone retrievals to different solar reference datasets is relatively weak within 0.2% due to switching from SAO2010 to the TSIS-1 HSRS. On the other hand, the tropospheric ozone retrievals are more sensitive with biases of ~2% due to using SAO2010 instead of the TSIS-1 HSRS. Furthermore, the impacts of using KNMI2008 on the ozone column retrievals are much larger; the biases increases up to ~5% and ~1% over the troposphere and stratosphere, respectively. Figure 5 is similar to Figure 4b but for individual layer ozone columns. Compared with using the TSIS-1 HSRS, the retrieved ozone is positively biased in the upper troposphere due to using the existing solar reference spectra but negatively biased in the lower troposphere. The impact on the individual layers is much larger than the integrated column ozone in the troposphere. For example, the retrieved ozone is perturbed from −5% at the surface layer to 7% at the tropopause layer when changing the current input (SAO2010) to the TSIS-1 HSRS whereas the ozone retrievals above 50 hPa are almost unperturbed.

4. Summary

We evaluated a new solar irradiance reference spectrum to investigate improvements in ozone profile retrievals using UV spectral information from OMI backscattered measurements. The OMI algorithm has utilized the SAO2010 reference spectrum derived from balloon measurements (AFGL) and ground-based FTS (KPNO2005) measurements [10]. A different solar reference spectrum, KNMI2008, has been applied to many atmospheric trace gas retrievals, especially from the OMI and its successors. It was composed from the AFGL and KPNO1995 by applying the spectral ratio method for the adjustment of high-resolution solar data to the irradiance scale of a more accurate but a lower spectral resolution spectrum based on SUSIM observations. The new dataset (TSIS-1 HSRS) was taken from utilizing the ground-based QASUMEFTS spectrum in the UV range from 305.5 nm to 373.6 nm and extended down to 202 nm and up to 2730 nm with other high-resolution datasets [14]. It was developed with a modified spectral ratio method being used to scale the high-resolution datasets to the lower resolution TSIS-1 SIM and Compact SIM (CSIM) datasets. The TSIS-1 HSRS takes advantage of the improvements in the radiometric accuracy (0.2–0.4%) of the TSIS-1 SIM measurements, which had a higher accuracy across the full spectrum than any previously reported solar reference spectra.
We evaluated the radiometric scales of solar reference spectra against those of TSIS-1 SIM solar irradiance measurements. Compared with the TSIS-1 SIM spectrum, SAO2010 revealed an average difference of 13.39% due to the radiometric uncertainties of the underlying AFGL spectrum ( λ < 305 nm). However, the TSIS-1 HSRS and KNMI2008 showed a closer agreement to the TSIS-1 SIM at the levels of 0.09% and 2.66%, respectively. In the UV2 range, the radiometric scales were well-matched within ~ ±   1% of the TSIS-1 SIM baseline, especially for the TSIS-1 HSRS (bias = −0.03% on average) except for SAO2010 below 330 nm (bias from −2 to 5%). The assumed solar reference spectrum directly impacted on the slit function characterization and wavelength assignment from the OMI irradiances. We found that applying the TSIS-1 HSRS resulted in the best fitting accuracies (i.e., lowest fitting residual); ~0.69% on average in the UV2 range and 1.37% in the UV1 range. Particularly in UV2, the fitting accuracies were approximately a factor of two better with the TSIS-1 HSRS than when using KNMI2008 and SAO2010 (~1.3%).
In extracting the ozone information from the OMI radiances, applying KNMI2008 resulted in the largest fitting residual in the UV2 range. The ozone profile retrievals were perturbed by up to 20% in the troposphere when shifting the solar reference from KNMI2008 to the TSIS-1 HSRS. In comparison between the TSIS-1 HSRS and SAO2010, the intergrade column ozone matched within ~2% in the troposphere but the difference increased up to 5–7% for the individual layer column ozone. On the other hand, the impact on the stratosphere ozone column or ozone profile was negligible. The fitting residuals were reduced by up to ~5% in the UV2 range as well as ~2% in the UV1 range. Overall, the ozone retrievals are sensitive to the solar reference input in the troposphere due to the highly structured Huggins band (UV2), where convolution errors greatly affect the radiative transfer calculations, compared with the stratosphere where the spectrally broad Hartley band is applied for the ozone retrievals. In conclusion, the improved solar reference spectrum led to quantifiable improvements for use in the analysis of atmospheric UV spectra (270–330 nm) and, therefore, the radiometric accuracy of the TSIS-1 HSRS is acceptable as a new benchmark for developing a high-resolution solar spectrum. Based on this conclusion, we decided to change the standard input of the high-resolution solar reference spectrum from SAO2010 to the TSIS-1 HSRS for use in the Smithsonian Astrophysical Observatory (SAO) ozone profile algorithm-processing OMI [24] and other missions [3,25,26]. The investigation of using the TSIS-1 HSRS in retrieving other SAO trace gases based on the basic optical absorption spectroscopy approach [27,28,29] is ongoing to see if the new solar reference can help with slit functions and wavelength shifts as well as the solar-I0 effect and Ring effect.

Author Contributions

J.B. and X.L. designed the research; O.C. and K.C. provided oversights and guidance for using the high-resolution solar reference spectra; X.L. contributed to analyzing the ozone profile retrievals with different solar spectra; J.B. conducted the research and wrote the paper; C.-H.K. provided financial support to make this study possible. O.C., X.L., K.C., H.-J.L., W.J., J.-H.K. and C.-H.K. contributed to the discussion and edited the paper. All authors have read and agreed to the published version of the manuscript.

Funding

This research has been supported by the Basic Science Research Program through the National Research Foundation of Korea (NRF) funded by the Ministry of Education (grant no. 2020R1A6A1A03044834 and 2021R1A2C1004984).

Institutional Review Board Statement

Not applicable.

Informed Consent Statement

Not applicable.

Data Availability Statement

TSIS-1 HSRS: https://lasp.colorado.edu/lisird/data/tsis1_hsrs (accessed on 10 December 2021). SAO2010: https://www.cfa.harvard.edu/atmosphere/links/sao2010.solref.converted (accessed on 10 December 2021). KNMI2008: Contact Marcel Dobber at [email protected].

Acknowledgments

We thank Julian Gröbner for specifying the radiometric and wavelength information in the QASUMEFTS data. We acknowledge the OMI science team for providing their satellite data. The research at Pusan National University is funded by the Basic Science Research Program through the National Research Foundation of Korea (NRF) funded by the Ministry of Education (2020R1A6A1A03044834 and 2021R1A2C1004984). Research at the Smithsonian Astrophysical Observatory is funded by the NASA Aura science team program (NNX17AI82G) and research at the University of Colorado Boulder is funded by the NASA TSIS-1 project (80GSFC18C0056) and NASA’s Solar Irradiance Science Team (80NSSC18K1304).

Conflicts of Interest

The authors declare no conflict of interest.

References

  1. Sun, K.; Liu, X.; Huang, G.; Abad, G.G.; Cai, Z.; Chance, K.; Yang, K. Deriving the slit functions from OMI solar observations and its implications for ozone-profile retrieval. Atmos. Meas. Tech. 2017, 10, 3677–3695. [Google Scholar] [CrossRef] [Green Version]
  2. Kang, M.; Ahn, M.H.; Liu, X.; Jeong, U.; Kim, J. Spectral calibration algorithm for the geostationary environment monitoring spectrometer (Gems). Remote Sens. 2020, 12, 2846. [Google Scholar] [CrossRef]
  3. Bak, J.; Liu, X.; Kim, J.-H.; Haffner, D.P.; Chance, K.; Yang, K.; Sun, K. Characterization and correction of OMPS nadir mapper measurements for ozone profile retrievals. Atmos. Meas. Tech. 2017, 10, 4373–4388. [Google Scholar] [CrossRef] [Green Version]
  4. Bak, J.; Liu, X.; Sun, K.; Chance, K.; Kim, J.-H. Linearization of the effect of slit function changes for improving Ozone Monitoring Instrument ozone profile retrievals. Atmos. Meas. Tech. 2019, 12, 3777–3788. [Google Scholar] [CrossRef] [Green Version]
  5. Joiner, J.; Yoshida, Y.; Vasilkov, A.P.; Middleton, E.M.; Campbell, P.K.E.; Yoshida, Y.; Kuze, A.; Corp, L.A. Filling-in of near-infrared solar lines by terrestrial fluorescence and other geophysical effects: Simulations and space-based observations from SCIAMACHY and GOSAT. Atmos. Meas. Tech. 2012, 5, 809–829. [Google Scholar] [CrossRef] [Green Version]
  6. Wagner, T.; Chance, K.; Gil, M.; Goutail, F.; Johnston, P.V.; Kostadinov, I.; Leser, H.; Petritoli, A.; Richter, A.; Van Roozendael, M.; et al. Correction of the Ring effect and I0-effect for DOAS observations of scattered sunlight. In Proceedings of the 1st DOAS Workshop, Heidelberg, Germany, 13–14 September 2001. [Google Scholar]
  7. Liu, C.; Liu, X.; Kowalewski, M.G.; Janz, S.J.; Abad, G.G.; Pickering, K.E.; Chance, K.; Lamsal, L.N. Characterization and verification of ACAM slit functions for trace-gas retrievals during the 2011 DISCOVER-AQ flight campaign. Atmos. Meas. Tech. 2015, 8, 751–759. [Google Scholar] [CrossRef] [Green Version]
  8. Liu, X.; Chance, K.; Sioris, C.E.; Newchurch, M.J.; Kurosu, T.P. Tropospheric ozone profiles from a ground-based ultraviolet spectrometer: A new retrieval method. Appl. Opt. 2006, 45, 2352–2359. [Google Scholar] [CrossRef] [PubMed] [Green Version]
  9. Dobber, M.; Voors, R.; Dirksen, R.; Kleipool, Q.; Levelt, P. The high-resolution solar reference spectrum between 250 and 550 nm and its application to measurements with the ozone monitoring instrument. Sol. Phys. 2008, 249, 281–291. [Google Scholar] [CrossRef] [Green Version]
  10. Chance, K.; Kurucz, R.L. An improved high-resolution solar reference spectrum for earth’s atmosphere measurements in the ultraviolet, visible, and near infrared. J. Quant. Spectrosc. Radiat. Transf. 2010, 111, 1289–1295. [Google Scholar] [CrossRef]
  11. Richard, E.; Harber, D.; Coddington, O.; Drake, G.; Rutkowski, J.; Triplett, M.; Pilewskie, P.; Woods, T. SI-traceable spectral irradiance radiometric characterization and absolute calibration of the TSIS-1 spectral irradiance monitor (SIM). Remote Sens. 2020, 12, 1818. [Google Scholar] [CrossRef]
  12. Thuillier, G.; Labs, D.; Foujols, T.; Peetermans, W.; Gillotay, D.; Simon, P.C.; Mandel, H. The solar spectral irradiance from 200 to 2400 nm as measured by the solspec spectrometer from the atlas and eureca missions. Sol. Phys. 2003, 214, 1–22. [Google Scholar] [CrossRef]
  13. Hall, L.A.; Anderson, G. High-resolution solar spectrum between 2000 and 3100 Å. J. Geophys. Res. 1991, 96, 12927–12931. [Google Scholar] [CrossRef]
  14. Coddington, O.M.; Richard, E.C.; Harber, D.; Pilewskie, P.; Woods, T.N.; Chance, K.; Liu, X.; Sun, K. The TSIS-1 Hybrid Solar Reference Spectrum. Geophys. Res. Lett. 2021, 48, e2020GL091709. [Google Scholar] [CrossRef] [PubMed]
  15. Kurucz, R.L. The solar spectrum: Atlases and line identifications. In Laboratory and Astronomical High Resolution Spectra; Astronomical Society of the Pacific Conference Series 44; Sauval, A.J., Blomme, R., Grevesse, N., Eds.; 1995; Volume 81, pp. 17–31. Available online: http://kurucz.harvard.edu/papers/irradiance/solarirr.tab (accessed on 10 December 2021).
  16. Kurucz, R.L. High Resolution Irradiance Spectrum from 300 to 1000 nm. In Proceedings of the AFRL Transmission Meeting, Lexington, MA, USA, 15–16 June 2005; Available online: "https://arxiv.org/pdf/astro-ph/0605029.pdf (accessed on 10 December 2021).
  17. Gröbner, J.; Kröger, I.; Egli, L.; Hülsen, G.; Riechelmann, S.; Sperfeld, P. The high-resolution extraterrestrial solar spectrum (QASUMEFTS) determined from ground-based solar irradiance measurements. Atmos. Meas. Tech. 2017, 10, 3375–3383. [Google Scholar] [CrossRef] [Green Version]
  18. Floyd, L.; Rottman, G.; Deland, M.; Pap, J. Solar Variability as an input to the Earth’s Environment. In Proceedings of the International Solar Cycle Studies (ISCS) Symposium, Tatranská Lomnica, Slovakia, 23–28 June 2003; Wilson, A., Ed.; ESA SP-535. ESA Publications Division: Noordwijk, The Netherlands, 2003; p. 195. [Google Scholar]
  19. Toon, G.C. Solar Line List for GGG2014. TCCON Data Archive, Hosted by the Carbon Dioxide Information Analysis Center. Available online: https://doi.org/10.14291/tccon.ggg2014.solar.R0/1221658 (accessed on 10 December 2021).
  20. Gurlit, W.; Bösch, H.; Bovensmann, H.; Burrows, J.P.; Butz, A.; Camy-Peyret, C.; Dorf, M.; Gerilowski, K.; Lindner, A.; Noël, S.; et al. The UV-A and visible solar irradiance spectrum: Inter-comparison of absolutely calibrated, spectrally medium resolution solar irradiance spectra from balloon- and satellite-borne measurements. Atmos. Chem. Phys. 2005, 5, 1879–1890. [Google Scholar] [CrossRef] [Green Version]
  21. Richard, E.C.; Harber, D.M.; Drake, G.; Rutkowsi, J.; Castleman, Z.; Smith, M.; Sprunck, J.; Zheng, W.; Smith, P.; Fisher, M.; et al. The compact spectral irradiance monitor flight demonstration mission. Proc. SPIE 2019, 11131, 1113105. [Google Scholar] [CrossRef]
  22. Chance, K.V.; Spurr, R.J.D. Ring effect studies: Rayleigh scattering, including molecular parameters for rotational Raman scattering, and the Fraunhofer spectrum. Appl. Opt. 1997, 36, 5224–5230. [Google Scholar] [CrossRef] [Green Version]
  23. Levelt, P.F.; Joiner, J.; Tamminen, J.; Veefkind, J.P.; Bhartia, P.K.; Zweers, D.C.S.; Duncan, B.N.; Streets, D.G.; Eskes, H.; McLinden, C.; et al. The Ozone Monitoring Instrument: Overview of 14 years in space. Atmos. Chem. Phys. 2018, 18, 5699–5745. [Google Scholar] [CrossRef] [Green Version]
  24. Liu, X.; Bhartia, P.K.; Chance, K.; Spurr, R.J.D.; Kurosu, T.P. Ozone profile retrievals from the Ozone Monitoring Instrument. Atmos. Chem. Phys. 2010, 10, 2521–2537. [Google Scholar] [CrossRef] [Green Version]
  25. Cai, Z.; Liu, Y.; Liu, X.; Chance, K.; Nowlan, C.R.; Lang, R.; Munro, R.; Suleiman, R. Characterization and correction of global ozone monitoring experiment 2 ultraviolet measurements and application to ozone profile retrievals. J. Geophys. Res. Atmos. 2012, 117, 1–16. [Google Scholar] [CrossRef]
  26. Zoogman, P.; Liu, X.; Suleiman, R.M.; Pennington, W.F.; Flittner, D.E.; Al-Saadi, J.A.; Hilton, B.B.; Nicks, D.K.; Newchurch, M.J.; Carr, J.L.; et al. Tropospheric emissions: Monitoring of pollution (TEMPO). J. Quant. Spectrosc. Radiat. Transf. 2017, 186, 17–39. [Google Scholar] [CrossRef] [Green Version]
  27. Chan Miller, C.; Gonzalez Abad, G.; Wang, H.; Liu, X.; Kurosu, T.; Jacob, D.J.; Chance, K. Glyoxal retrieval from the Ozone Monitoring Instrument. Atmos. Meas. Tech. 2014, 7, 3891–3907. [Google Scholar] [CrossRef] [Green Version]
  28. González Abad, G.; Liu, X.; Chance, K.; Wang, H.; Kurosu, T.P.; Suleiman, R. Updated Smithsonian Astrophysical Observatory Ozone Monitoring Instrument (SAO OMI) formaldehyde retrieval. Atmos. Meas. Tech. 2015, 8, 19–32. [Google Scholar] [CrossRef] [Green Version]
  29. Wang, H.; Souri, A.H.; González Abad, G.; Liu, X.; Chance, K. Ozone Monitoring Instrument (OMI) Total Column Water Vapor version 4 validation and applications. Atmos. Meas. Tech. 2019, 12, 5183–5199. [Google Scholar] [CrossRef] [Green Version]
Figure 1. (a) Comparison of the three high-resolution solar reference datasets (KNMI2008, SAO2010, TSIS-1 HSRS) against the TSIS-1 SIM spectrum at the spectral resolution of the TSIS-1 SIM with the mean values of individual differences below and above 305 nm noted in the legend. (b) Same as (a) but for KPNO2005 and QASUMEFTS with and without the TSIS-1 SIM-based spectral adjustment, respectively.
Remotesensing 14 00037 g001
Figure 2. Impact of using different solar reference datasets on the spectral fitting of OMI irradiances with respect to (a) FWHMs fitted as Gaussian functions and (b) wavelength shifts as well as (c) RMS of fitting residuals. This experiment was performed for the monthly mean irradiances of daily OMI observations (July 2006) as a function of the cross-track positions over the UV1 (left) and UV2 (right) bands, respectively. The legend represents the average values of the fitting variables over the cross-track positions.
Remotesensing 14 00037 g002
Figure 3. Impact of using different solar reference datasets on the RMS (%) of the spectral fitting residuals resulting from an orbit of retrieval at cross-track position 15 (nadir) on 1 July 2006 (orbit number: 10427). In the left panel, the fitting RMS values are plotted over the (a) UV1 and (b) UV2 ranges, respectively, as a function of the latitude with their differences relative to the TSIS-1 HSRS in the right panels.
Remotesensing 14 00037 g003
Figure 4. Same as Figure 3 but for vertically integrated ozone columns over the (a) stratosphere and (b) troposphere, respectively.
Remotesensing 14 00037 g004
Figure 5. The relative difference in the individual layer ozone columns when switching from SAO2010 or KNMI2008 to the TSIS-1 HSRS. Note that the ozone profiles were retrieved from one orbit measurement used in Figure 3 and Figure 4.
Remotesensing 14 00037 g005
Table 1. Main characteristics of the three high-resolution solar reference datasets (rows 1–3) and their input spectra (rows 4–8) in the UV and visible range.
Input SpectraWavelength RangeSpectral
Resolution +
Sampling ResolutionRadiometric
Accuracy (%)
Wavelength Accuracy (nm)Ref.
KNMI2008AFGL: 250–303 nm
KPNO1995: 295–550 nm
250–550 nm0.025 nm0.01 nm4–5 1 × 10 3 @ 305 nm
2 × 10 3 @ 300 nm
[9]
SAO2010AFGL: 200–305 nm
KPNO2005: 300–1000 nm
200–1000 nm0.04 nm0.01 nm5 3 × 10 3 @ < 305 nm
3 × 10 4 @ >305 nm
[10]
TSIS-1 HSRS aAFGL: 202–306.5 nm
QASUMEFTS: 305.5–373.6 nm
KPNO: 373.5–745 nm
SPTS b: 743–2730 nm
202–2730 nm0.025 @ < 374 nm0.005 @ > 374 nm0.001 nm1.3 @ < 400 nm
0.5 @ 400–460 nm
0.3 @ 460–2365 nm
1.3 @ > 2365 nm
Same as input[14]
AFGL cBalloon-borne grating spectrometer200–310 nm0.01 nm0.01 nm10–150.003[13]
KPNO dGround-based FTS measurements300–1000 nm0.005 nm0.001 nmN/A 2.5 × 10 4 [15,16]
QASUMEFTS eGround-based QASUME and FTS measurements300–500 nm0.025 nm0.01 nm4 @ < 310 nm2 @ > 310 nm 1.0 × 10 3 [17]
SUSIM fSpace-borne measurements110–410 nm0.15 nm0.05 nm3–40.035[18]
TSIS-1 SIM gSpace-borne measurements200–2400 nm0.2–42 nm0.04 nm @ 233 nm
0.13 nm @ 354 nm
0.53 nm @ 550 nm
1.94 nm @ 1345 nm
0.41 @ <460 nm0.24 @ > 460 nm0.085%[11]
+ The spectral resolution stands for the full-width at half-maximum (FWHM) of the slit functions or ISRFs. a The spectral resolution of the TSIS-1 HSRS ranges from 0.001 nm to ~0.01 nm and variants of the dataset are also provided for lower, fixed spectral resolutions. We used the ‘p005’ variant, which has a 0.001 nm sampling resolution and a fixed spectral resolution, defined as the full-width half-maximum of a Gaussian convolution kernel, of 0.025 nm for wavelengths below 374 nm and a 0.005 nm resolution for wavelengths above 374 nm. b Semi-empirical Solar Pseudo-Transmittance Spectrum (SPTS) atlas [19]. c Air Force Geophysical Laboratory (AFGL) ultraviolet solar irradiance spectrum based on balloon-borne measurements near 40 km in the stratosphere in 1978 and 1983. d Ground-based FTS observations taken at the Kitt Peak National Observatory (KPNO) were converted to solar transmittances in a multi-step process and calibrated to solar irradiance by normalizing to a model or measurement of the irradiance. See, for example, KPNO1995 [15] and KPNO2005 [16]. e Quality Assurance of Spectral Ultraviolet Measurements In Europe (QASUME) Fourier transform spectrometer (FTS) solar irradiance observations (QASUMEFTS) was obtained by normalizing the FTS solar spectrum (305–380 nm) to the high-accuracy, medium-resolution solar spectrum measured with QASUME (300–500 nm) after extrapolation to 0 airmass. KPNO2005 measurements were used for wavelengths longer (shorter) than 380 nm (305 nm). Note that the wavelength accuracy was quantified though a comparison with KPNO2005 in the spectral range of 305 to 380 nm. f UARS Solar Ultraviolet Spectral Irradiance Monitor (SUSIM) space-based observations measured in the UV spectral range, used in deriving the spectral ratio factor for KNMI2008 together with balloon spectra taken from Gurlit et al. [20] in the visible range. g TSIS-1 Spectral Irradiance Monitor (SIM) space-based observations used in deriving the spectral ratio factor for the TSIS-1 HSRS together with the space-based Compact SIM (CSIM) measurements [21] above 2365 nm.
Publisher’s Note: MDPI stays neutral with regard to jurisdictional claims in published maps and institutional affiliations.

