
A Novel Vegetation Point Cloud Density Tree-Segmentation Model for Overlapping Crowns Using UAV LiDAR


1
Research Center of Forestry Remote Sensing & Information Engineering, Central South University of Forestry and Technology, Changsha 410004, China
2
Key Laboratory of Forestry Remote Sensing Based Big Data & Ecological Security for Hunan Province, Changsha 410004, China
3
Key Laboratory of State Forestry Administration on Forest Resources Management and Monitoring in Southern Area, Changsha 410004, China
4
School of Civil Engineering, Sun Yat-sen University, Guangzhou 510275, China
*
Author to whom correspondence should be addressed.
Remote Sens. 2021, 13(8), 1442; https://doi.org/10.3390/rs13081442
Submission received: 19 March 2021
/
Revised: 7 April 2021
/
Accepted: 7 April 2021
/
Published: 8 April 2021
(This article belongs to the Special Issue Monitoring of Forest Ecological Environment Based on Remote Sensing Technology)
Abstract
:Detecting and segmenting individual trees in forest ecosystems with high-density and overlapping crowns often results in bias due to the limitations of the commonly used canopy height model (CHM). To address such limitations, this paper proposes a new method to segment individual trees and extract tree structural parameters. The method involves the following key steps: (1) unmanned aerial vehicle (UAV)-scanned, high-density laser point clouds were classified, and a vegetation point cloud density model (VPCDM) was established by analyzing the spatial density distribution of the classified vegetation point cloud in the plane projection; and (2) a local maximum algorithm with an optimal window size was used to detect tree seed points and to extract tree heights, and an improved watershed algorithm was used to extract the tree crowns. The proposed method was tested at three sites with different canopy coverage rates in a pine-dominated forest in northern China. The results showed that (1) the kappa coefficient between the proposed VPCDM and the commonly used CHM was 0.79, indicating that performance of the VPCDM is comparable to that of the CHM; (2) the local maximum algorithm with the optimal window size could be used to segment individual trees and obtain optimal single-tree segmentation accuracy and detection rate results; and (3) compared with the original watershed algorithm, the improved watershed algorithm significantly increased the accuracy of canopy area extraction. In conclusion, the proposed VPCDM may provide an innovative data segmentation model for light detection and ranging (LiDAR)-based high-density point clouds and enhance the accuracy of parameter extraction.
1. Introduction
Forests are some of the most important terrestrial ecosystems in the global biosphere. Among terrestrial ecosystems, forest ecosystems play an important role in water conservation, carbon storage, global climate change mitigation, and maintaining the ecological balance [1,2,3]. Trees are the basic units of forests, and their spatial structure and biophysical and chemical components are key factors in forest resource investigation and ecological environmental modeling. Therefore, it is of great significance to obtain accurate structural information about each tree in a forest to modernize forestry resource management, develop appropriate management practices, and perform quantitative estimations of global carbon storage [4,5,6].
Traditional forest resource survey methods are limited by human factors; they require considerable labor and material resources and often have long measurement cycles, poor timeliness, and high measurement error. Only point data can be obtained through such surveys, and it is difficult to obtain data at regional or larger scales [7,8]. However, the rapid development of remote sensing technology has created favorable conditions for forest resource monitoring. Visible-spectrum remote sensing can quickly and accurately obtain forest growth factor data and ecological and environmental information over a large area [9]. This approach can provide effective verification for forest resource monitoring and management and is widely used in regional forest volume inversion research [10]. However, the ability of visible-spectrum remote sensing to obtain the three-dimensional (3D) structural parameters of individual trees is limited [11,12,13].
LiDAR is a measurement technology that involves actively transmitting high-frequency laser pulses to detect targets. This technology can directly obtain accurate three-dimensional spatial coordinates and echo information from tree branches and leaves in the forest structure [14]. LiDAR has unique advantages for estimating forest canopy height, performing canopy segmentation and extracting feature parameters; these advantages improve the estimation accuracy for key forest structural parameters, especially vertical structural parameters [15]. LiDAR data acquisition as applied for in tree segmentation research includes mainly terrestrial laser scanning (TLS) and airborne laser scanning (ALS). TLS is a kind of bottom-up scanning method that can be used to obtain abundant undergrowth information. Its feature parameter extraction accuracy is very high, but its data acquisition process has some shortcomings, such as a low efficiency and requirement to clear the undergrowth vegetation blocking the scanning field. ALS is a top-down scanning method that obtains information mainly from the top of the tree crown. The accuracy of parameter extraction by ALS is not as high as that of TLS, and the diameter at breast height (DBH) parameter cannot be obtained directly by ALS. However, due to its relatively high efficient and convenient data acquisition process, especially when performed with an unmanned aerial vehicle (UAV), and ALS presents no harm to forest vegetation compared to TLS, it is favored for forest resource surveys.
At present, there are two approaches to research on crown segmentation by UAV-ALS. The first approach uses point data. The point cloud data are classified into surface points and vegetation points; then, after the normalization of the ground points, the point cloud data are subjected to clustering using the position information and spatial structural relationship between point clouds to directly segment the tree crown. This approach is carried out mainly through region growing, clustering algorithms, normalized cuts, voxel space projection, and similar methods [16,17,18]. Li et al. [19] proposed a point cloud segmentation (PCS) method based on region growth and threshold judgment by using the distances between the tops of trees. Wang et al. [20] used voxels to represent canopies at different height levels and defined a local voxel space by projecting normalized points onto a two-dimensional horizontal plane. Yan et al. [21] proposed an adaptive bandwidth mean shift algorithm that can automatically estimate the optimal kernel bandwidth without any prior knowledge of tree crown size. Karel et al. [22] segmented the trunk based on the point density of the voxel density in the subcanopy space and used the Hough transform, random sample consistency (RANSAC), and robust least trimmed squares (RLTS) estimator to fit the cross-section of the trunk.
The second approach uses raster data. Raster surface models, such as the digital surface model (DSM) and canopy height model (CHM), are generated from point cloud data. The spatial characteristics of the pixel values of the raster data are used for tree seed point recognition and tree canopy segmentation, which usually involves local maximum methods, watershed algorithms, K-means clustering, polynomial fitting, and other methods [23,24,25]. Morsdorf et al. [26] used the local maximum clustering analysis method to identify seed points to segment a single-tree in LiDAR point data; the tree position, tree height, and crown diameter were extracted, and geometric reconstruction of forest scenes was conducted. Gupta et al. [27] found that applying the improved K-means algorithm using external seed points in combination with reducing the height of clustering initialization was the most promising method of extracting the features of a single-tree, such as the LiDAR point density, forest conditions, terrain type, tree crown coverage and tree density. Heinzel et al. [28] proposed a watershed segmentation method based on prior knowledge. First, the iterative granularity method was used to classify the tree crown size, and watershed segmentation was then used to draw the tree crown. Chen et al. [29] used the local maximum method with a variable window size to detect treetops based on estimations of tree crown size. Other individual canopy segmentation methods include the morphological image analysis method, multiscale template matching, the Laplacian of Gaussian approach, and calculating the minimum curvature of the CHM, among others [30,31,32]. In a sample plot with a low tree density, the watershed algorithm achieved high single-tree segmentation accuracy and identified the crown boundary segmentation as an irregular closed curve, with a high degree of coincidence with the actual crown boundary. However, in the region with overlapping crowns, the watershed planes of different tree crowns overlap, and the watershed algorithm cannot correctly segment the crown boundary, leading to parameter extraction error [33,34,35].
A large number of previous studies have shown that canopy segmentation based on a raster surface model is generated mostly by the height characteristics of UAV-ALS point cloud data, and uses the spatial distribution characteristics of the pixel values in different cross-sections to segment individual trees. However, a tree canopy segmentation method based on the spatial density characteristics of UAV-ALS point cloud data or the density distribution of point clouds in different vertical sections has not been developed or reported. In a simple sample plot, a CHM is generated from low-density point cloud data using the local maximum and the original watershed algorithm, after which many high-precision single-tree segmentation results can be obtained. In a complex sample plot, it is more difficult to apply this approach. With the increase in density of point cloud data, the spatial density characteristics of point cloud data can be used to perform single-tree segmentation.
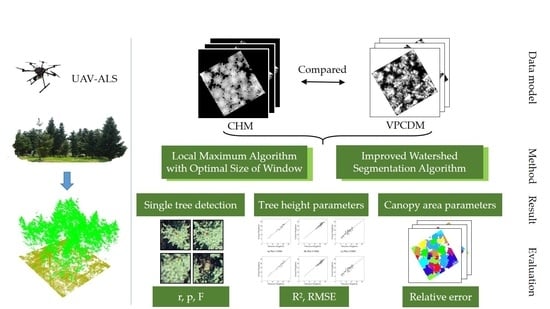
All previously applied methods have exhibited under or over segmentation because the segmentation ability of the CHM generated by UAV-ALS high-density point clouds is limited in complex sample plots. Therefore, this paper presents a data model for individual-tree segmentation based on the vegetation point cloud density. A local maximum algorithm with an optimal window size and an improved watershed algorithm were used to segment individual trees and extract their parameters, and the results were compared with those from the CHM. This study selected 242 trees in three sample plots with different tree densities in coniferous forests of northern China as the research object and used an innovative vegetation point cloud density model (VPCDM) for single-tree segmentation. The segmentation algorithm was then modified to improve the accuracy of parameter extraction. First, the spatial distribution characteristics of the vegetation point cloud density of UAV-ALS data were used to detect tree seed points and extract the tree height parameter based on the local maximum algorithm with the optimal window size. Then, the improved watershed algorithm was used to extract the tree crown area parameter. Finally, combined with the ground survey data and a visual interpretation method, the accuracy of the tree detection was evaluated by calculating the detection rate, accuracy rate, and F-score. The segmentation accuracy evaluation consisted of two parts: tree height accuracy and crown accuracy. The determination coefficient (R2) and root mean square error (RMSE) between the measured tree height and extracted tree height were calculated to evaluate the tree height accuracy, and the accuracy of the extracted crown area was calculated by comparing the extracted values with crown reference values. The methodological framework of this study is shown in Figure 1. The remainder of the paper is organized as follows: Section 2 introduces the research area and experimental data in detail, as well as the proposed VPCDM tree seed point detection and parameter extraction methods. Section 3 introduces the experimental results, and the segmentation accuracy is analyzed and discussed in Section 4. Section 5 provides the conclusion.
2. Materials and Methods
2.1. Study Area and Field Experiments
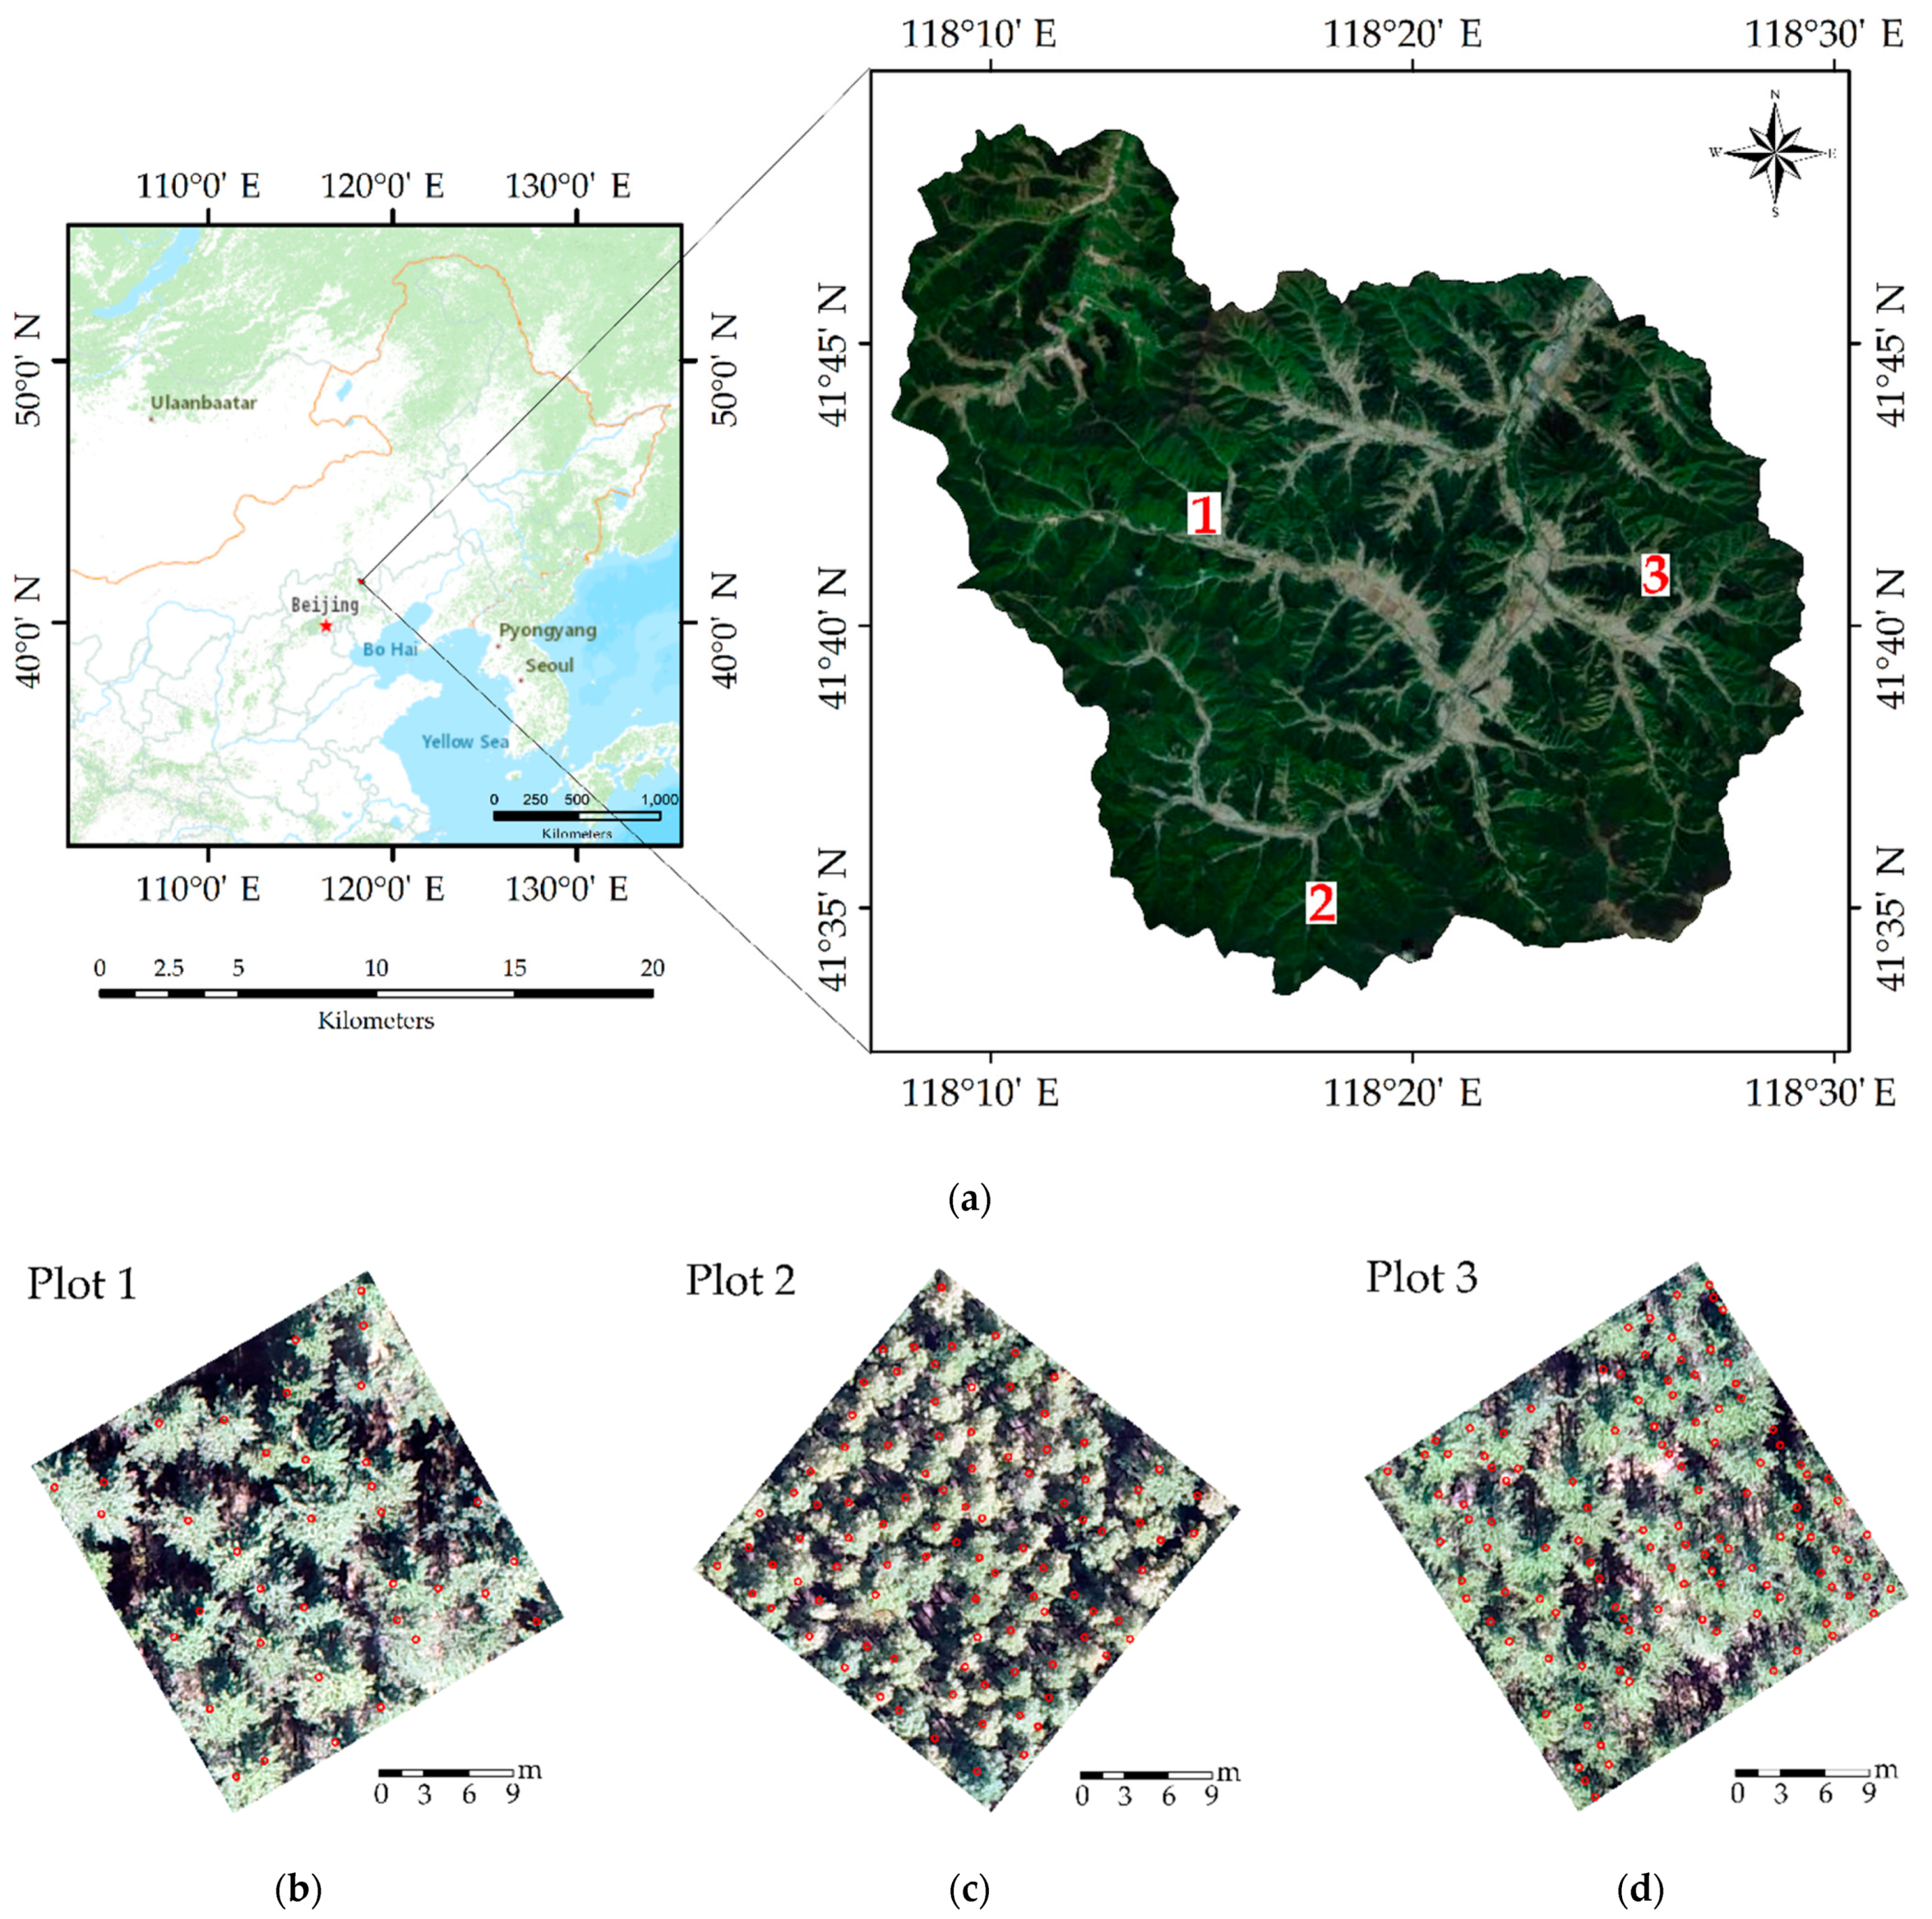
The study area is located at Wangyedian Forest Farm in Chifeng city, Inner Mongolia, North China (118°9′~118°30′ E and 41°21’~41°39′ N; Figure 2), at an average altitude of 800–1890 m. This area experiences a typical continental monsoon climate, with an annual average temperature of 4.2 °C and an average annual precipitation of 300–500 mm that falls mainly from July to August. At Wangyedian Forest Farm, Pinus tabuliformis Carriere is the dominant tree species, and Betula platyphylla Sukaczev is the secondarily dominant species. Three plots with different plant densities were established. The size of the plots was 25.8 × 25.8 m (0.067 ha). The plots were labeled plot 1, plot 2, ansd plot 3 and had 33, 93, and 116 individual trees in each plot, respectively. Tree structural parameters, such as height, diameter at breast height (DBH), and crown size, were determined for all 242 trees (Table 1). The location of each individual tree and its distance to adjacent trees were also recorded to compare these data with the tree locations detected with the method used in this study and evaluate its accuracy.
LiDAR point cloud data were obtained using the DJ-M600 UAV platform and a RIEGL VUX-1 (http://www.riegl.com/products/unmanned-scanning/riegl-vux-1uav/). The data were scanned in November 2019. The flight height of the UAV was 100 m, and the speed was 6 m/s. To increase the density of the point cloud data, a Y-shaped flight belt was designed for the sampling area to enhance the route overlap. The sensor recorded the complete information from the laser pulse return waveform, and the sample repetition interval was 2 ns. Ground control points were established in the survey area, and the actual coordinates of all the point clouds were obtained by post-differential processing. The field of view was 330°, and the scanning frequency was 500 KHz. The survey-grade accuracy was 10 mm, and the average density of the point cloud was more than 100 pts/m2. Lidar360 software was used to remove noise, such as bird points and low points, from the original UAV laser point cloud data before segmentation. To accurately and effectively classify the point cloud data, the cloth simulation filtering (CSF) algorithm was used to classify the ground points and non-ground points (vegetation points) [36].
2.2. Vegetation Point Cloud Density Model and Local Maximum Algorithm
The vegetation point cloud density is the number of vegetation points on the plane projection per unit area. The filtered point cloud data were classified into a ground point cloud and a vegetation point cloud [37]. The vegetation point cloud was projected on the plane normalized by the ground points, and a square of 0.2 m × 0.2 m was selected as the target unit. The order of magnitude of each unit area was calculated according to the projection points in the neighborhood of each unit. The crown shapes in the study area produce local vegetation point clouds that are very dense, which causes segmentation errors. Therefore, all the vegetation point cloud density values were normalized. The normalized vegetation point cloud density values of all grids constituted the VPCDM. Furthermore, inverse distance weighted (IDW) interpolation was used to generate a digital elevation model (DEM) from the laser-scanned classified ground point cloud [38,39,40], and a DSM was generated by laser point cloud interpolation of the first echo. The grid cell size was 0.2 m × 0.2 m. The DEM was subtracted from the DSM to obtain a normalized digital surface model to eliminate the interference of terrain fluctuations on the surface feature elevation in the DSM. To demonstrate the feasibility of the VPCDM as well as the accuracy of the individual tree segmentation and parameter extraction, all the experimental results were compared with those from the CHM.
A local maximum algorithm with an optimal window size was used to detect tree seed points and extract tree height data. In this algorithm, when the pixel value of a grid within a given window is larger than that of the surrounding grids, the grid is defined as the local maximum value of the window [41,42]. Due to factors, such as stand density and crown shape, missing segmentation points or multi-segmentation can often occur in the process of single-tree seed detection using a fixed local maximum algorithm. Therefore, it is necessary to select the appropriate window size for seed extraction. In this study, nine window sizes ranging from 1 × 1 to 9 × 9 were tested to set the vertices of the window. If a given vertex was the maximum value of the corresponding window area, it was saved; otherwise, it was deleted. Pinus tabuliformis Carriere is a coniferous tree species. Unlike in other tree species, the highest point of coniferous tree species is usually the center of the canopy [43,44,45]. In the single-tree CHM, the pixel value of each raster represents the height of the tree crown, and the highest pixel value is the treetop. In the single-tree VPCDM, the pixel value of each raster represents the density of the tree crown, the maximum value corresponds to the area near the center of the trunk, and the tree height is the maximum value of the point cloud height within the raster space.
2.3. Improved Watershed Segmentation Algorithm
The watershed segmentation algorithm is a mathematical morphology segmentation method based on topological theory [46,47,48]. It regards the image as a geodesic topological landform. The gray value of each pixel in the image represents the elevation of the pixel, each local minimum value and its affected area are regarded as a catchment basin, and the boundary of the catchment basin forms a watershed. The algorithm can be considered to automatically construct a barrier along the watershed boundary (canopy boundary) to prevent water from two adjacent watersheds (tree models) from merging. The watershed algorithm has higher segmentation accuracy in sample plots with lower tree densities. However, for sample plots with high tree density, the segmentation line of the overlapping area of the tree crown is based on the distance-transformed image, which cannot accurately express the real range of the tree crown. In studies of single-tree parameter extraction, the segmentation accuracy for single-tree crowns is low due mainly to crown overlap caused by high tree density. Therefore, this study proposes an improved watershed algorithm that can accurately identify the area of overlap between tree crowns and re-segment that area.
To identify whether the crown areas of different trees overlapped, the density-graph method was used to analyze the changes in point cloud density in different canopies [49]. The idea of this method is to observe the relationship between the density value d and the area Sd enclosed by the corresponding irregular closed curve. A density isoline is drawn according to the vegetation point cloud. The isoline of the point density of a single-tree is a series of irregular closed curves that take the top as the center and expand to the edge of the crown with decreasing point density. The theoretical radius of the irregular curve is determined as sqrt(Sd), and the derivative of the increment of the theoretical radius is calculated. Theoretically, when the derivative of the increment of the theoretical radius is equal to 0, the density curve is uniform—that is, the area is an independent single-tree. When the derivative of the increment of the theoretical radius is less than 0, the density isoline is not uniform, and the increment of the theoretical radius, which is the overlapping area among multiple tree crowns, is reduced. The spatial distribution characteristics of the density-graph are as follows. (1) Single-tree distribution structure: The density-graph is a straight line because the density of the point cloud decreases uniformly from the maximum value of the treetop to the surrounding area. (2) Overlapping distribution structure of the crown: from the edge to the center of the crown, the density of the point cloud changes from low to high. The density-graph also shows that with a high increment line in the overlapping area of the crown edge, then, when it leaves the overlapping area of the crown, the density-graph begins to decline, finally revealing a low increment line in the crown center of the high density.
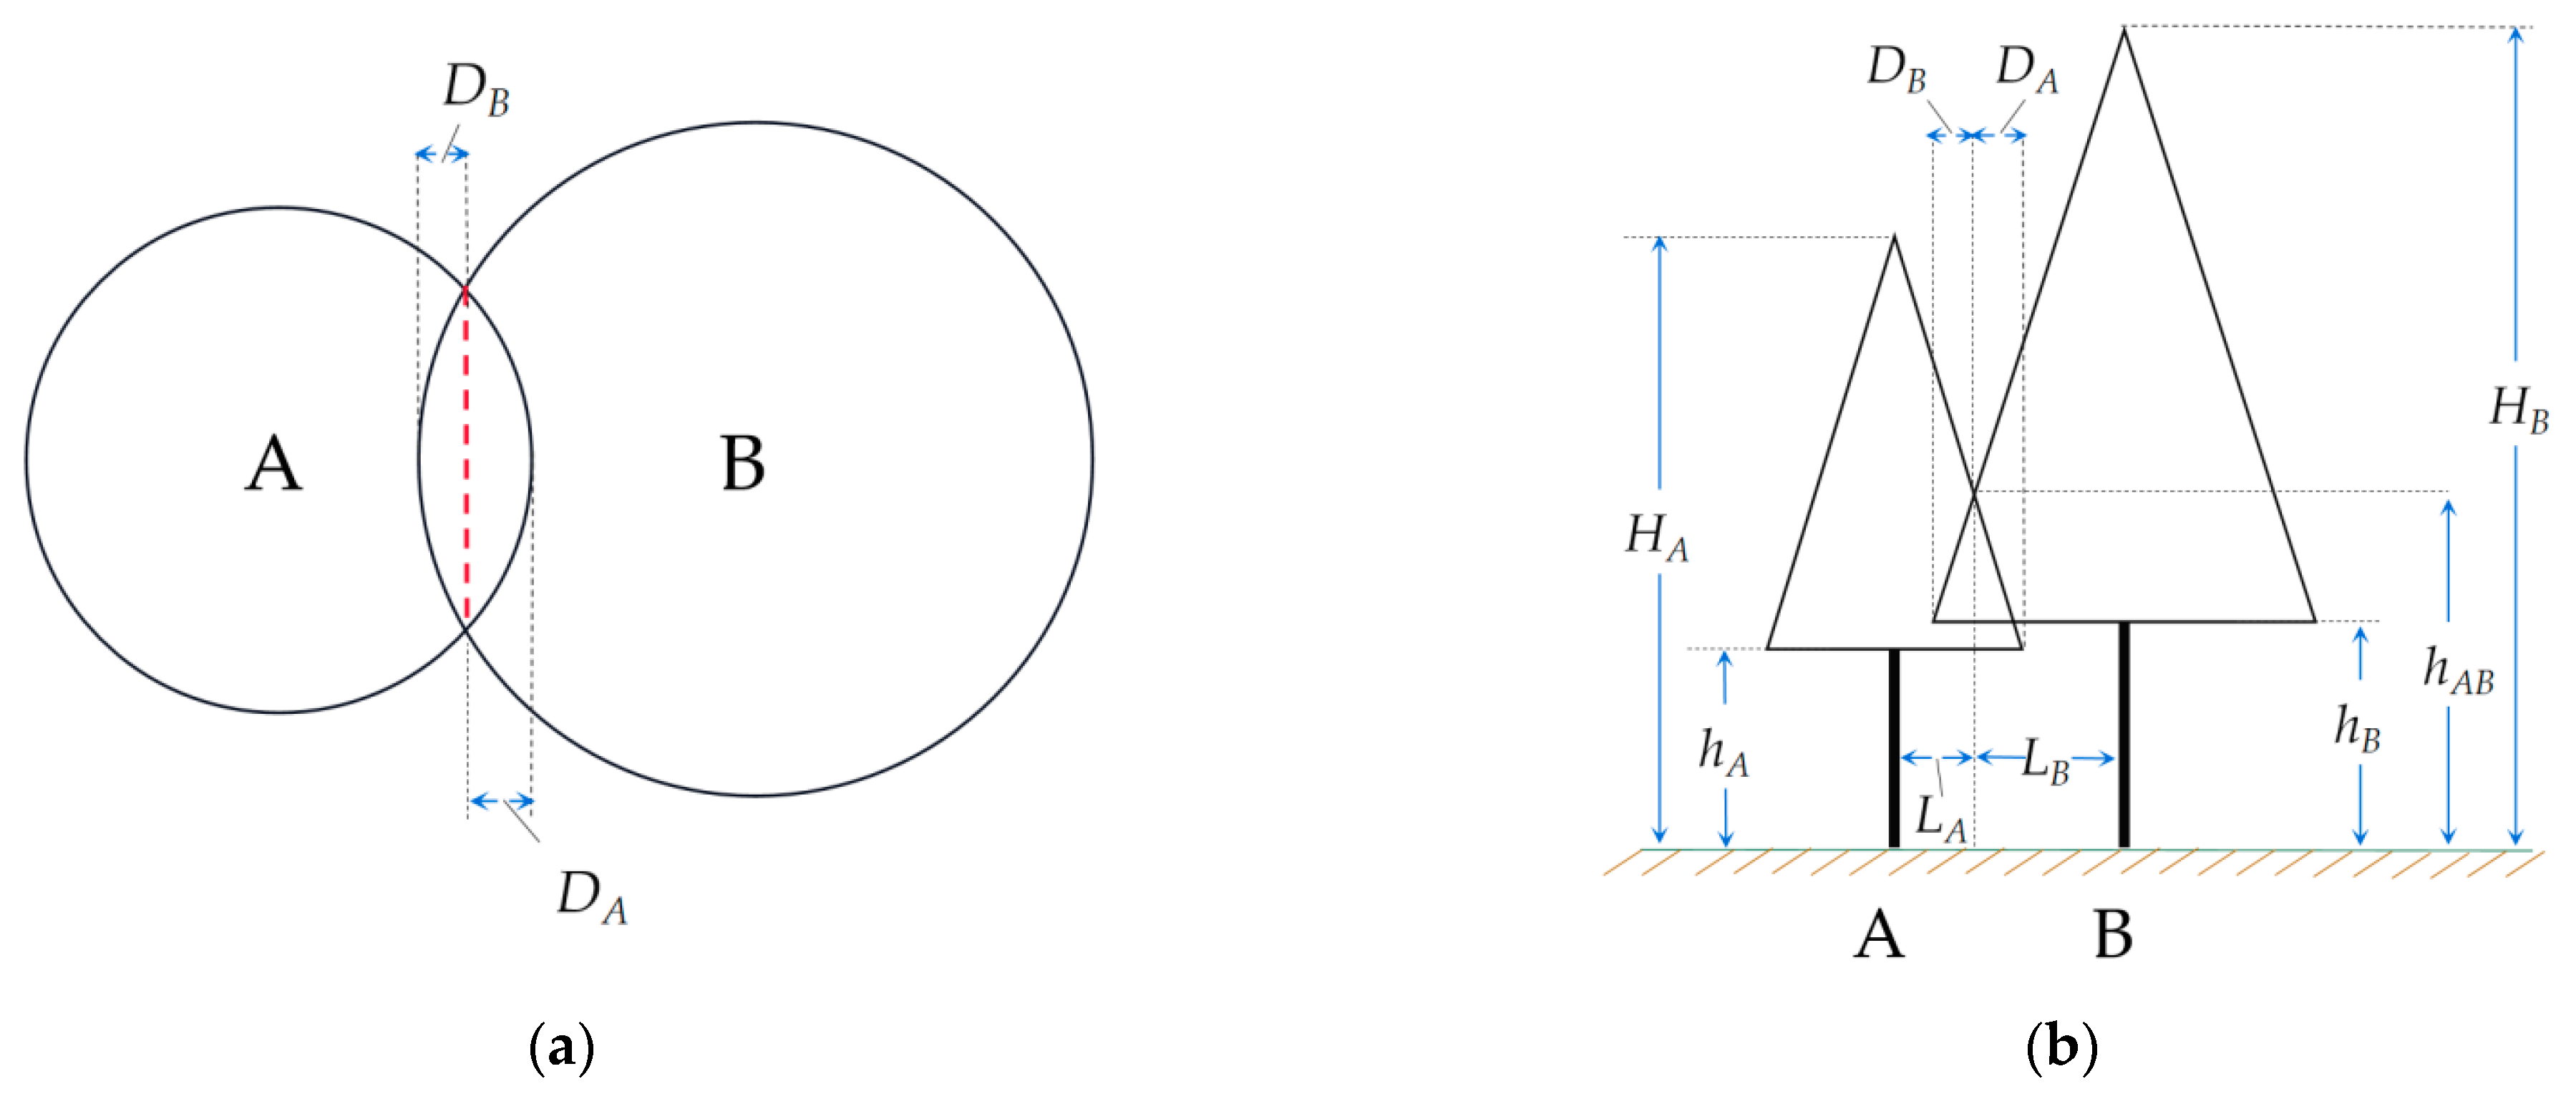
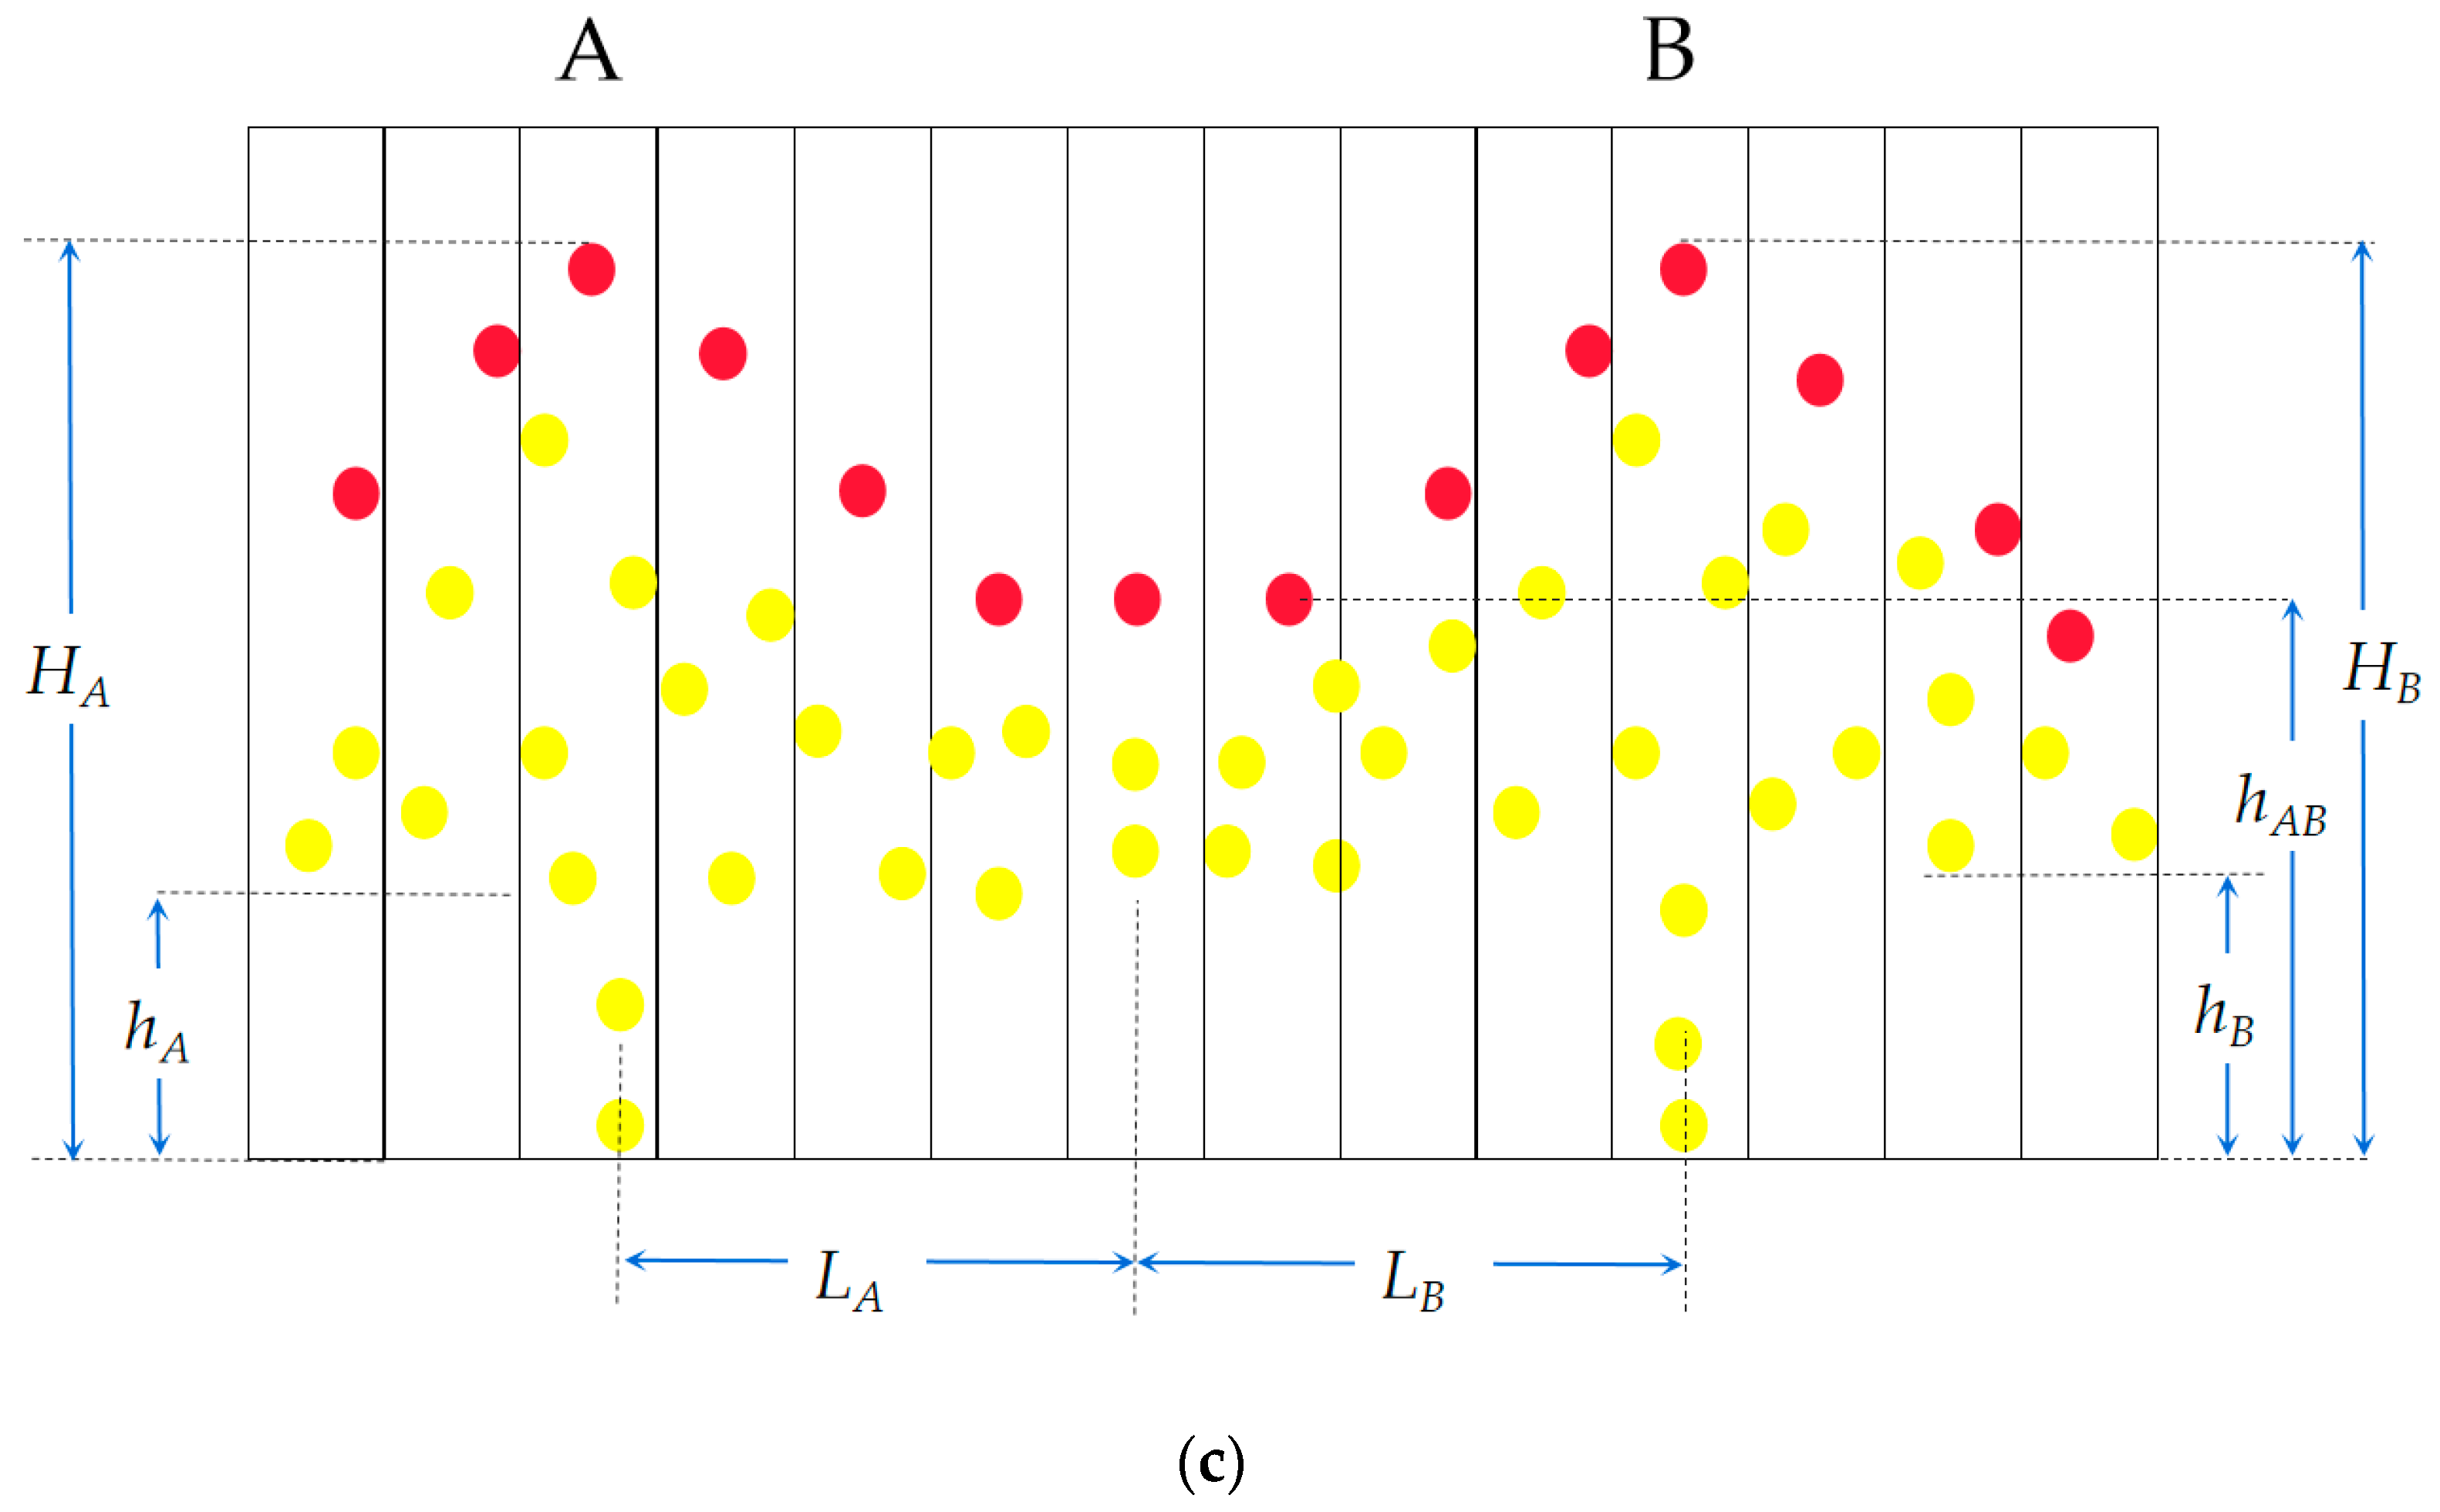
The overlapping tree crown area identified by analyzing adjacent trees is again segmented by geometric relationships to improve the segmentation accuracy in the crown area. The geometric model and point cloud distribution characteristic model for trees A and B are shown in Figure 3. For trees A and B, the maximum canopy heights are HA and HB. The canopy height corresponding to the crown boundary separated by the watershed algorithm is the under branch height, hA and hB. The canopy height of the overlapping area between tree A and tree B is HAB, and the horizontal distances from the maximum values of tree A and tree B are LA and LB, respectively. According to the geometric relationship between them, the added value of the actual canopy boundary of trees A and B in the overlapping area of the tree crown relative to the boundary extracted by the watershed algorithm is Di:
2.4. Accuracy Evaluation Method
To evaluate the accuracy of the models, the results obtained from the CHM and VPCDM were compared to the field observations using indices including the kappa coefficient, single-tree detection rate (Equation (2)), single-tree accuracy rate (Equation (3)), and F-score (Equation (4)) [50,51].
where r represents the detection rate of a single-tree; p represents the accuracy rate of the detection of a single-tree; the F-score is calculated from r and p; and Nc, Nm and No represent the number of correct segmentations, missing segmentations and instances of over segmentation, respectively. A higher F-score indicates a more accurate single-tree detection result. The F-score and the kappa coefficient were calculated in SPSS software.
To evaluate the modelled tree height and crown area, determination coefficient (R2), relative accuracy (RA), and relative RMSE were used.
where n is the number of correctly segmented individual trees; Xi represents the parameter of the individual segmented trees; represents the mean value of the parameter of the individual trees; xi represents the measured parameter of the individual trees corresponding to the segmented trees; and represents the mean value of the measured parameter of the individual trees corresponding to the segmented trees.
3. Results
3.1. Single-Tree Detection
The single-tree detection evaluation criteria included correct detection, missing detection, and over detection analysis (Figure 4). The accuracy of the single-tree detection method with the maximum value of the local window was analyzed (Table 2). In plot 1, the detection and accuracy rates of the CHM were 0.94 and 1, the detection and accuracy rates of the VPCDM were both 0.97, and the F-score for both models was 0.97. In plot 2, the detection rate of the CHM was 0.88, while that of the VPCDM was higher, at 0.92; however, the CHM achieved a higher accuracy than the VPCDM, at 0.92 and 0.90, respectively. The VPCDM also had a higher F-score for single-tree detection; the F-scores for the CHM and VPCDM were 0.90 and 0.91, respectively. In plot 3, the detection rates of the CHM and VPCDM were 0.76 and 0.81, the accuracy rates were 0.87 and 0.78, and the F-scores were 0.81 and 0.80, respectively. In general, the single-tree detection accuracy of the two data models decreased with increasing plot tree density. The detection rate of the segmentation method based on the VPCDM was generally higher than that based on the CHM, but the accuracy of the former method was lower than that of the latter in the plot with the highest number of trees. Concurrently, the F-scores of the two models were similar, and each model had its own advantages and disadvantages.
3.2. Accuracy of Tree Height Parameters
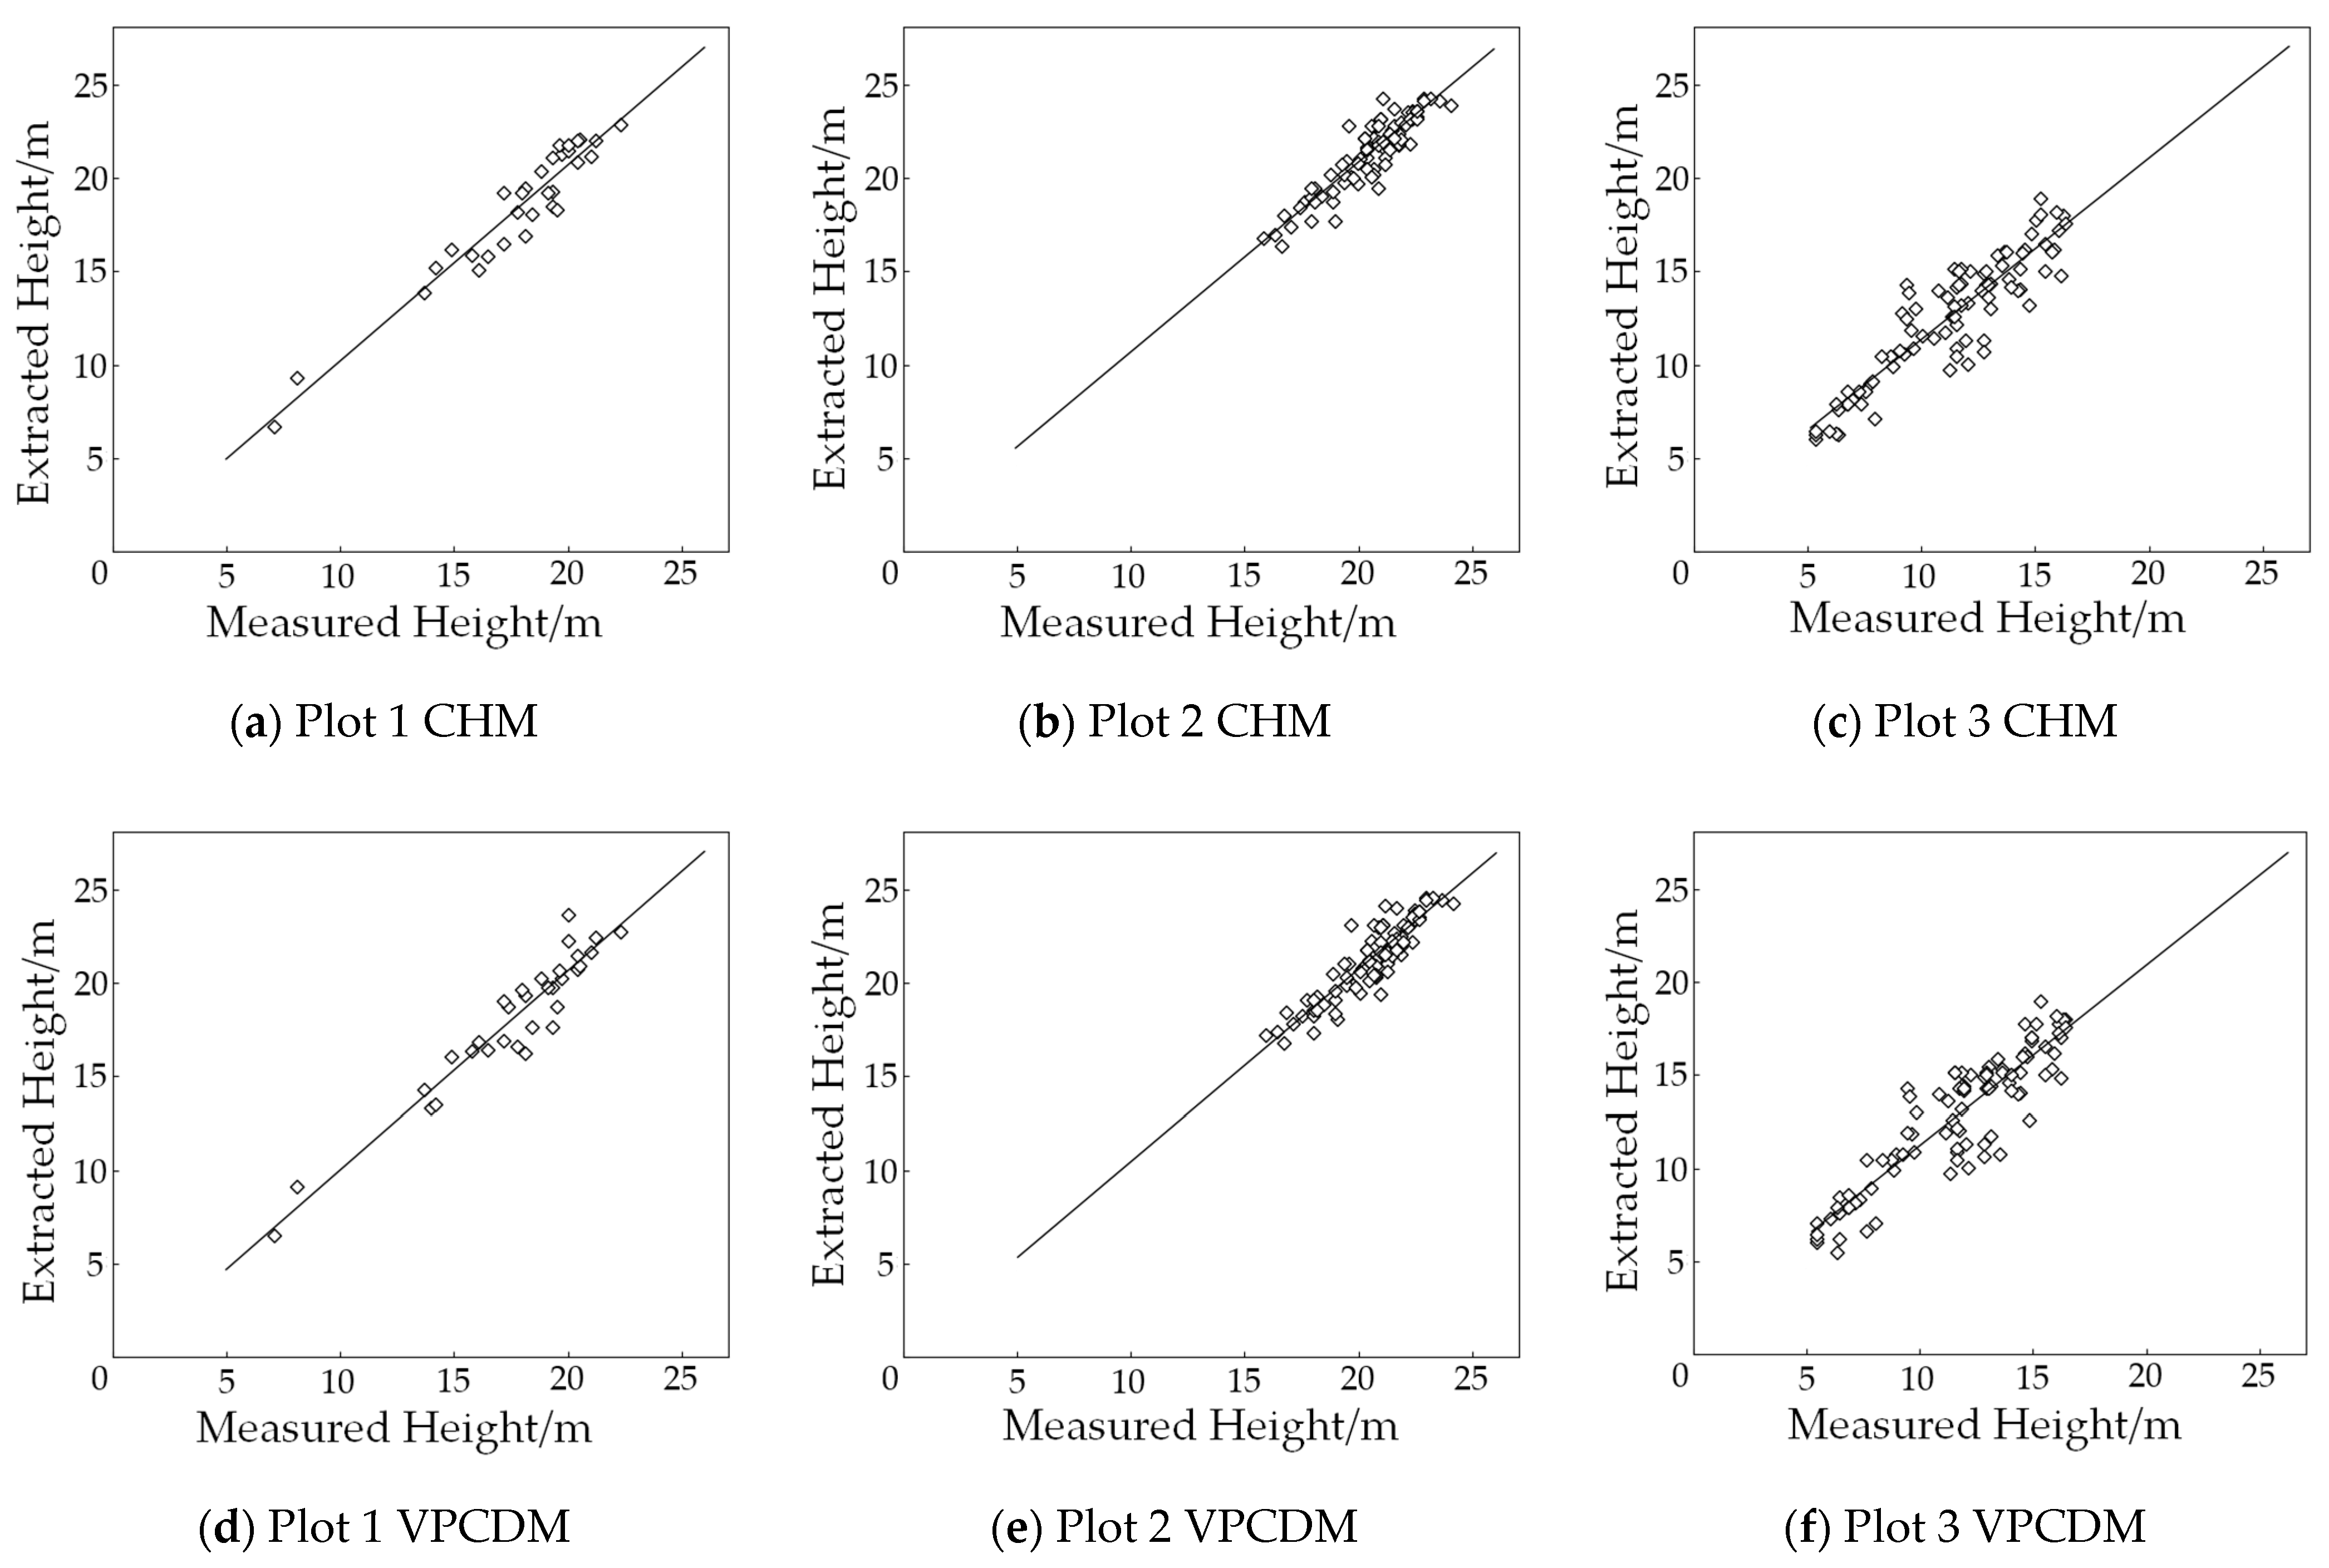
The correct detection results for individual trees based on the local maximum algorithm with the optimal window size were obtained from the CHM and VPCDM, and the accuracy of the extracted structural parameters and the measured values of the matched sample plots were evaluated. The extracted tree heights and the measured tree heights in the three sample plots are plotted in Figure 5.
The R2 and RMSE of the comparison of the extracted tree heights and measured tree heights are shown in Table 3. The results show that in plot 1, due to the low tree density, the detection accuracies of the CHM and VPCDM were relatively high. The R2 values of the extracted tree height and measured tree height were 0.92 and 0.91, and the RMSE values were 0.68 and 0.71. In plots 2 and 3, the R2 of the two data models decreased significantly with increasing tree density. The RMSE was the highest in plot 3, with values of 1.55 and 1.63 for the CHM and VPCDM, respectively. Overall, the accuracy of the tree height extraction by the two data models was very similar and was affected mainly by the density of trees in each sample plot. In terms of RMSE, the method error of the CHM was less than that of the VPCDM.
3.3. Accuracy of Crown Area Parameters
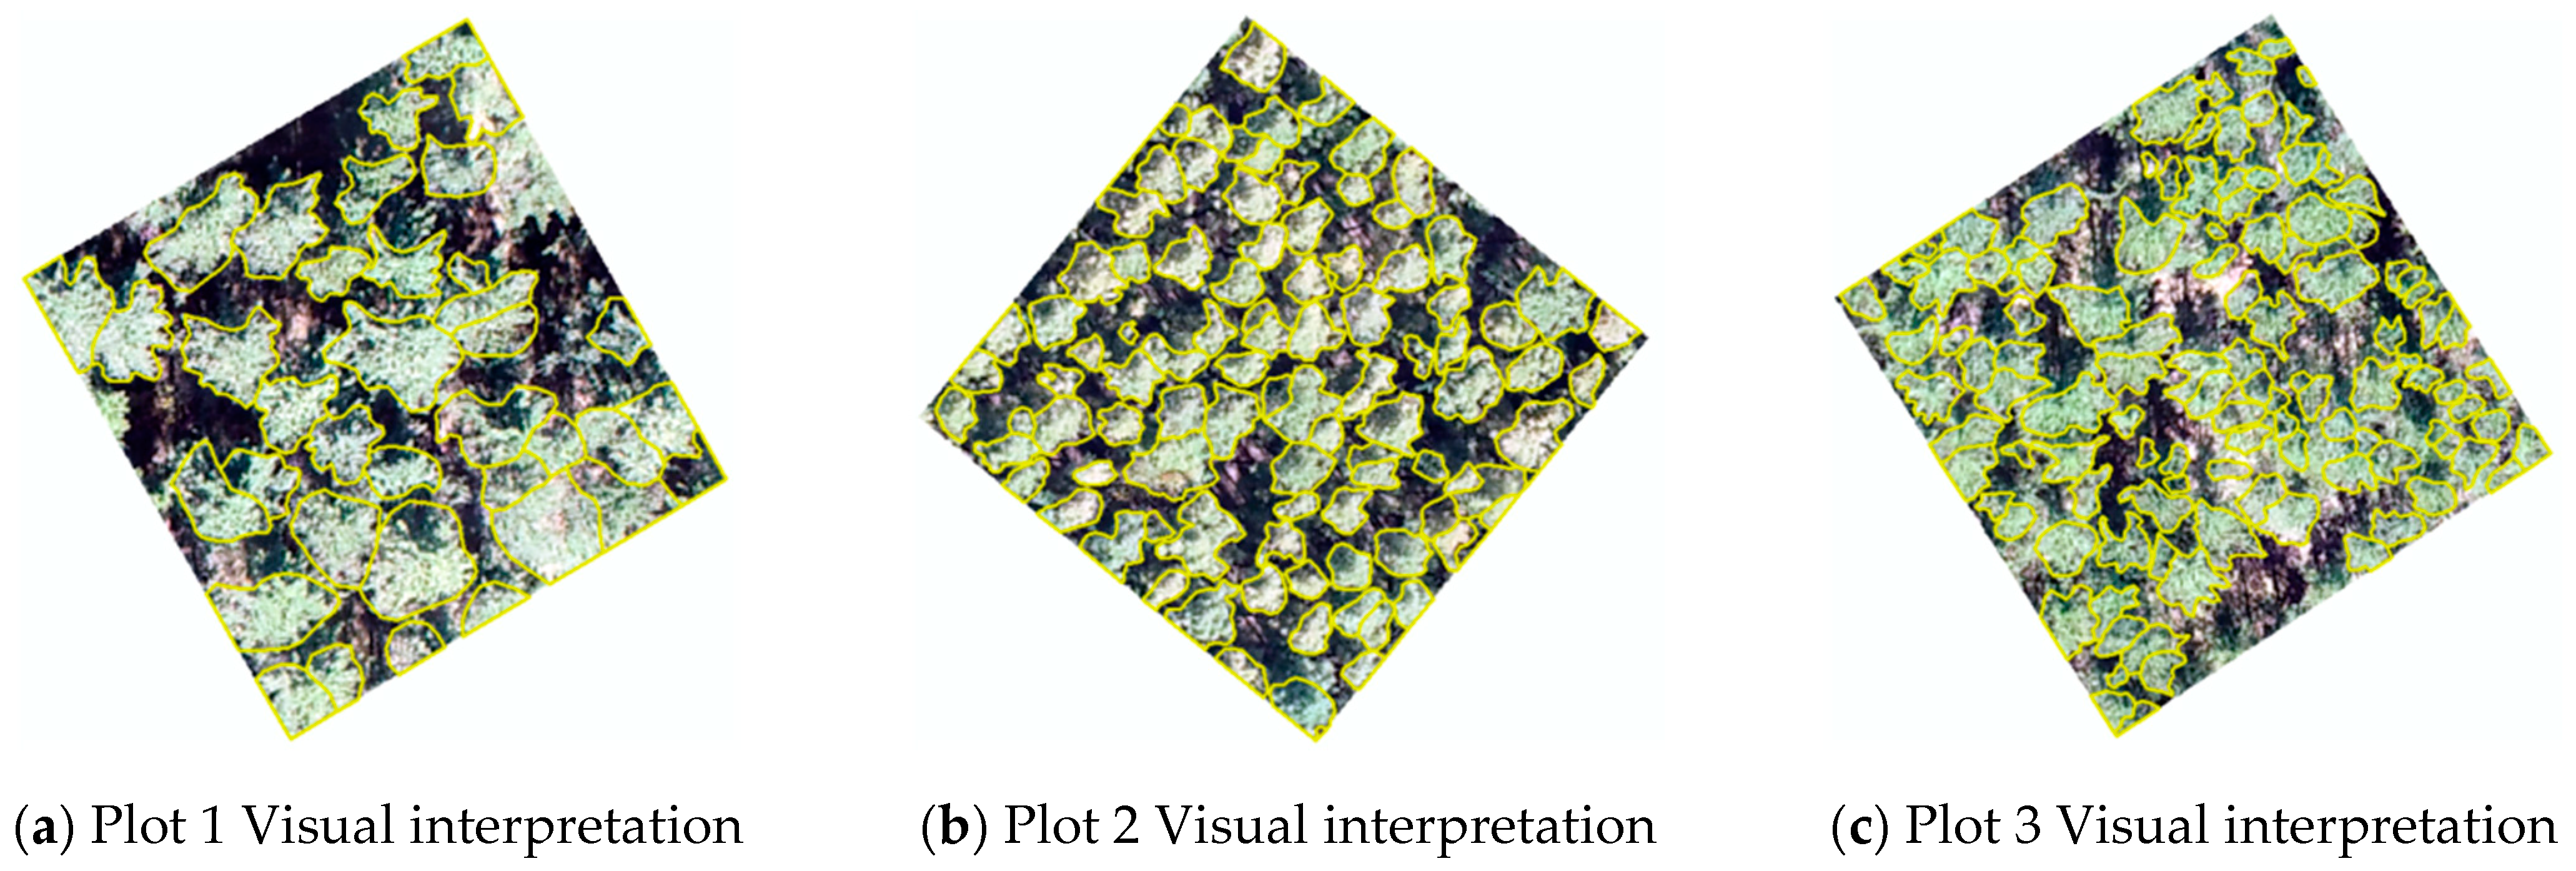
The canopy boundaries of the three plots were visually interpreted from the high-resolution digital orthophoto images, and the canopy boundaries were segmented using the original watershed algorithm. The results are shown in Figure 6. In the accuracy analysis of the crown area extraction (Table 4), the reference values were the canopy area of the visually interpreted boundaries combined with the measured east-west crown length and north-south crown length within each sample plot. These values were compared with the extracted crown area and the results from the original and improved watershed algorithms. The results showed that the relative accuracy of the original watershed algorithm was 0.94, 0.87, and 0.92 in the three plots, respectively, and that the relative accuracy of the improved watershed algorithm was 0.96, 0.93, and 0.95. In plot 2, due to the large average individual tree crowns, there were many overlapping crown areas. The improved watershed algorithm improved the crown area extraction relative accuracy from 0.87 to 0.93, which is a significant improvement. In plot 1, although the average tree crown size was large, the number of trees in the plot was lower than that in the other plots, and the gaps between tree crowns were larger. The direct extraction relative accuracy of the original watershed algorithm in plot 1 was 0.94. In plot 3, the number of trees was 116, but the average crown size of the trees was small, and the direct extraction relative accuracy of the original watershed algorithm was 0.92. In all three plots, the improved watershed segmentation algorithm had a higher canopy area extraction accuracy than the original watershed segmentation algorithm.
4. Discussion
4.1. VPCDM versus CHM
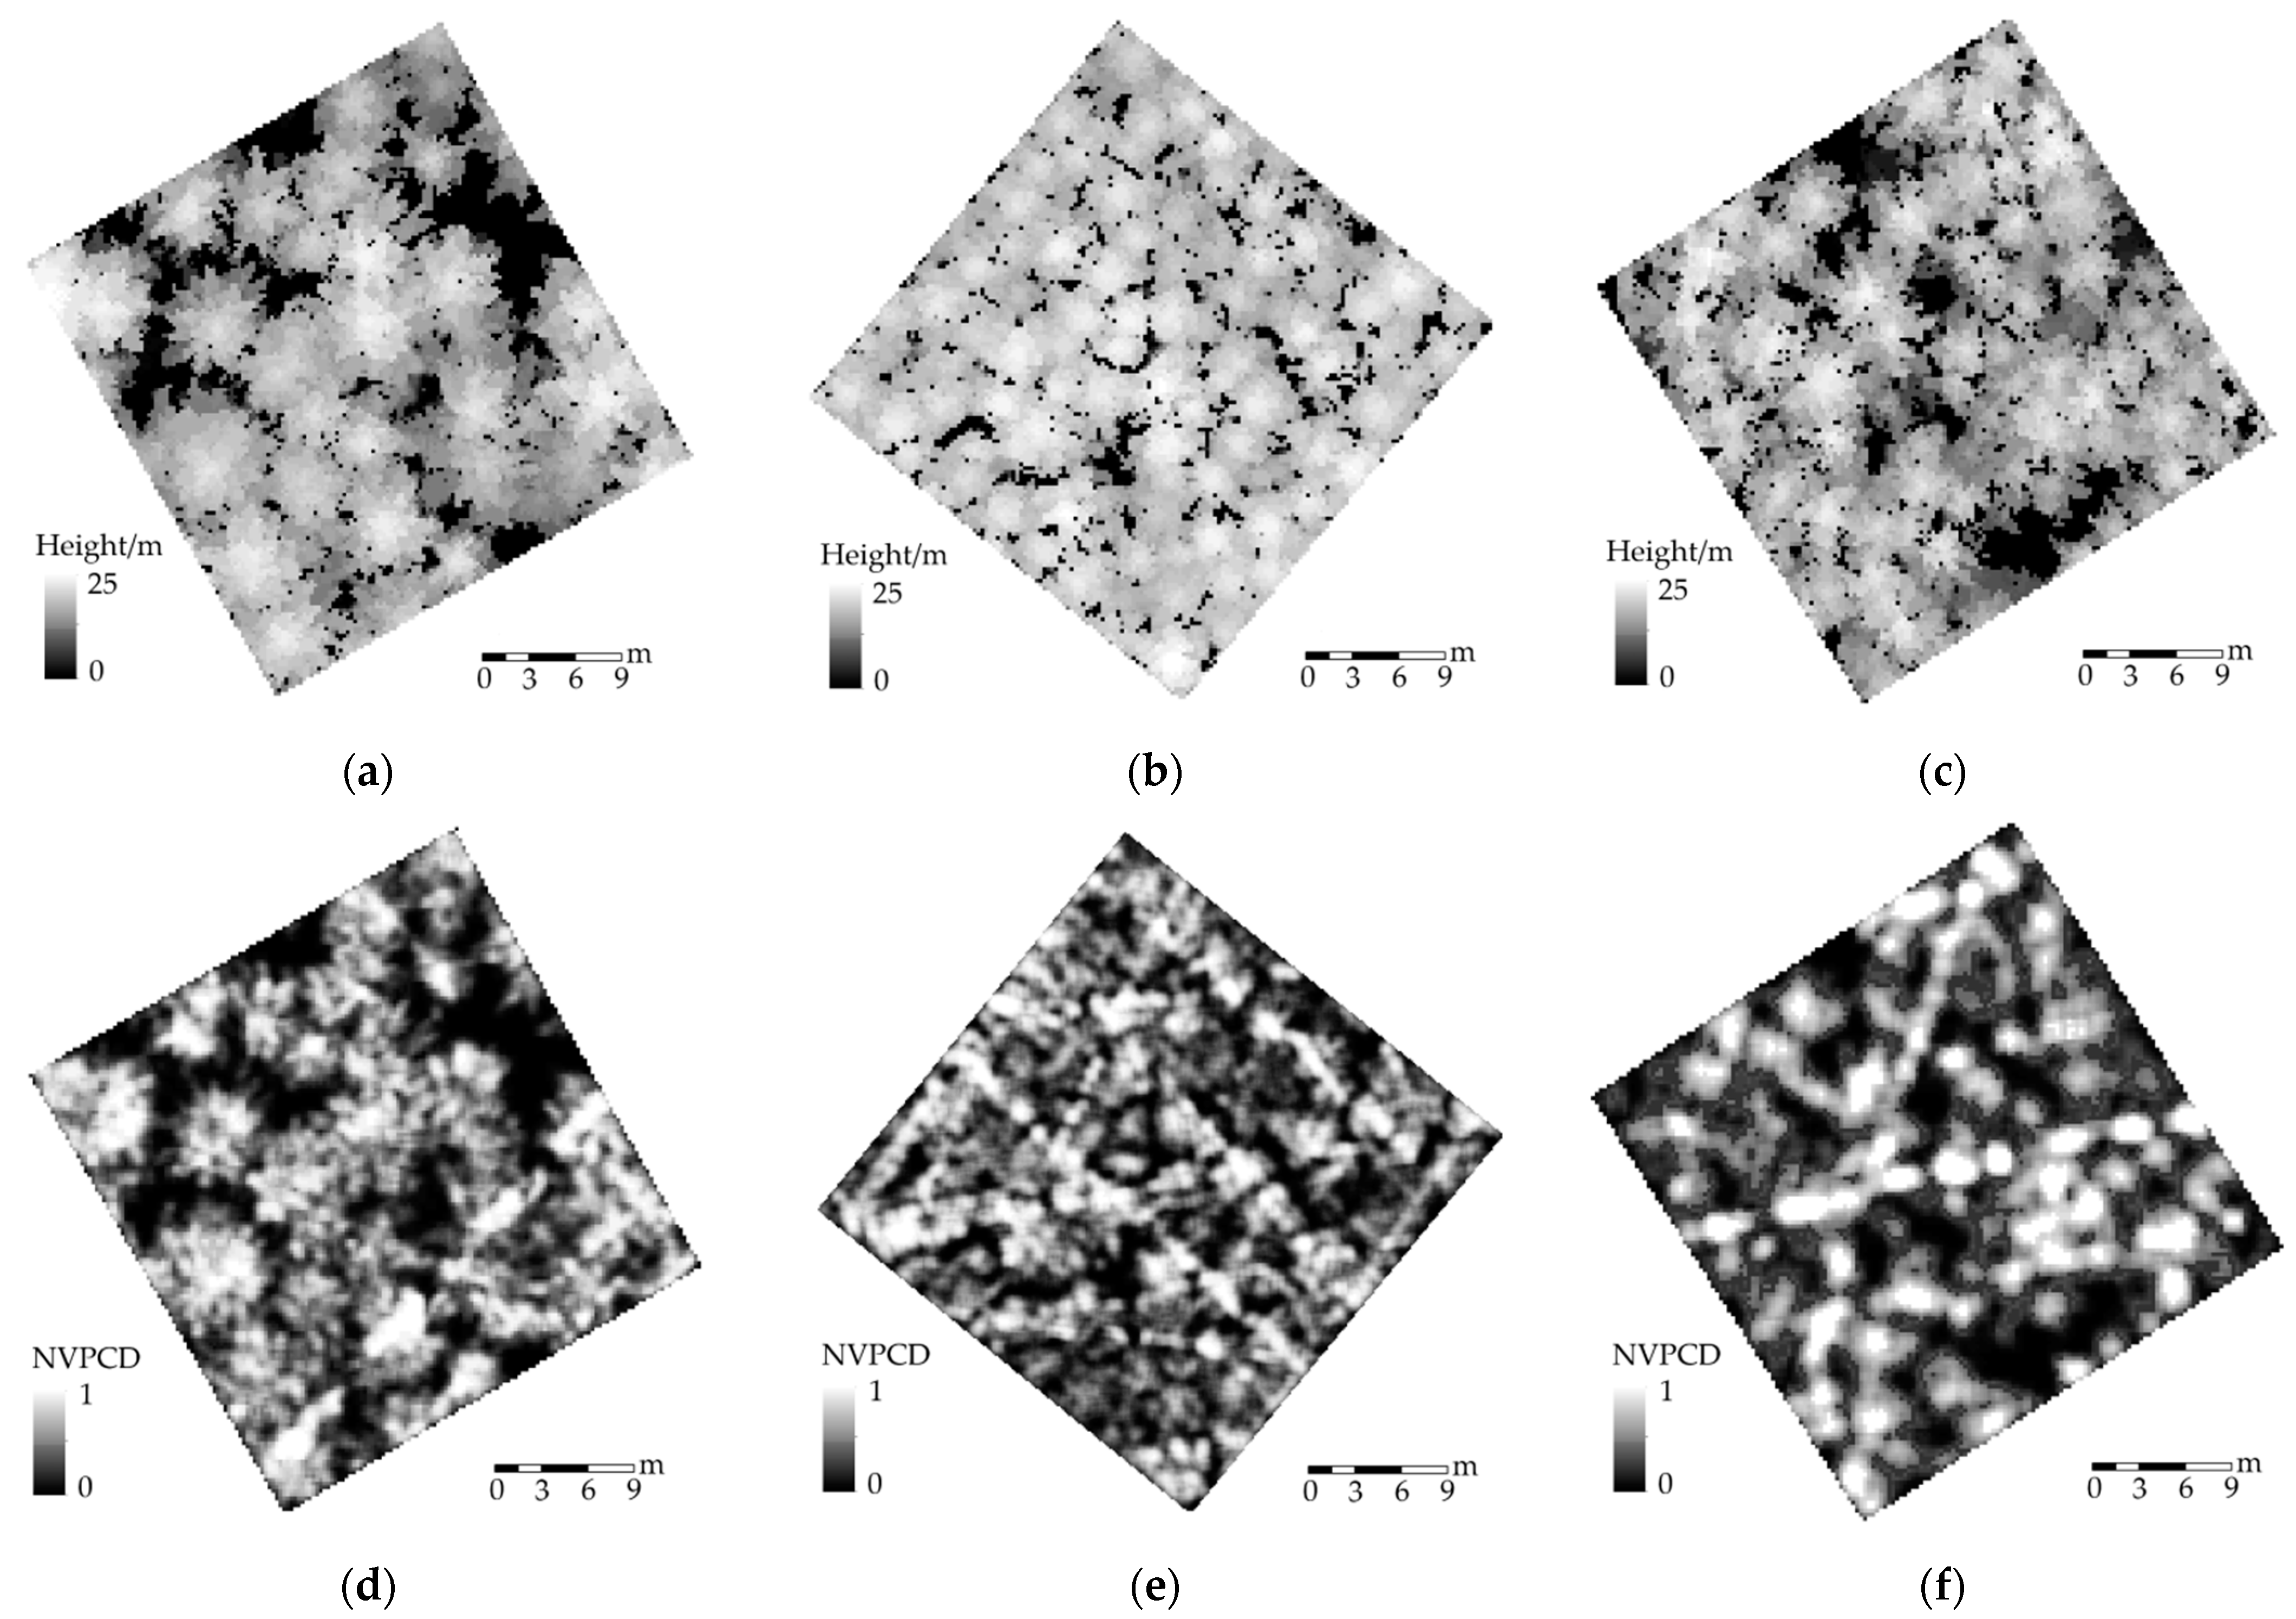
The CHM and VPCDM results generated from the UAV LiDAR data are shown in Figure 7. For coniferous forest trees with cone-shaped crowns, there are more branches and needles in the central area of the tree, and only a small amount of point clouds can penetrate the crown and reach the ground. In contrast, there are fewer branches in the crown at the edges of the tree, and a larger number of point clouds can penetrate the branches and reach the ground. The change trend for the single-tree point cloud density was as follows: closer to the center of the tree trunk, there were fewer ground points and a greater vegetation point cloud density; farther from the center of the tree trunk, there were more ground points and a lower vegetation point cloud density.
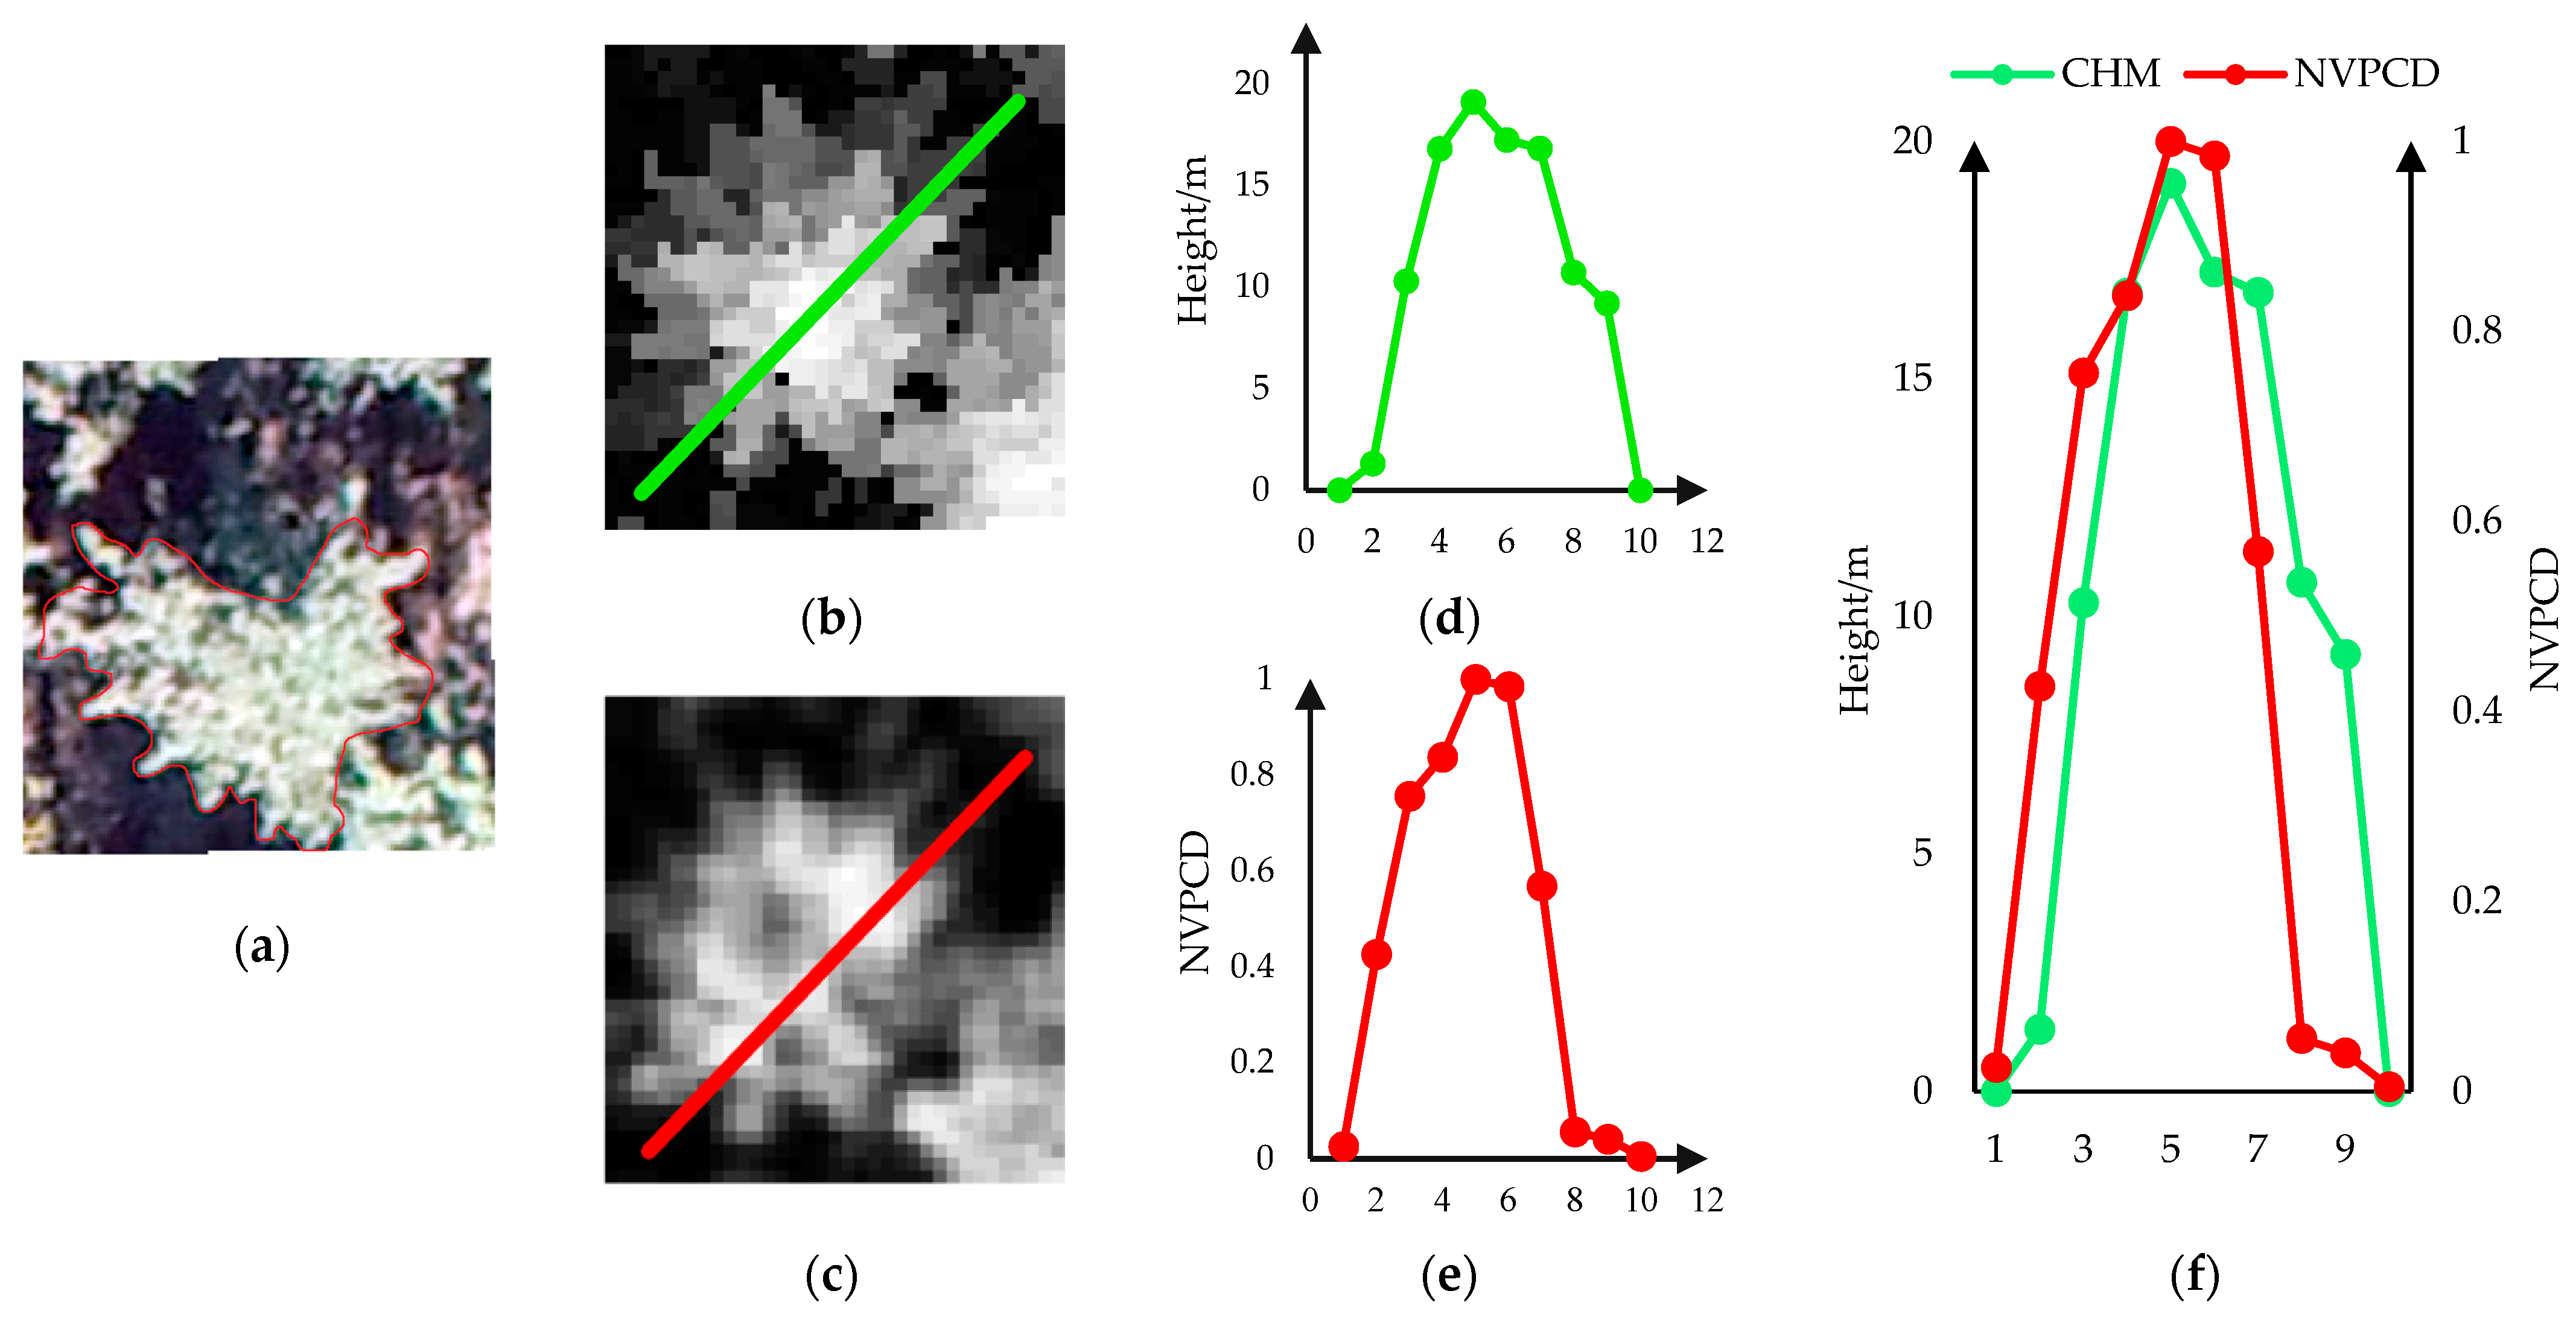
For a single-tree, the change trends of the CHM and VPCDM (Figure 8) were as follows: (1) In the center of the treetop of a single-tree, the height of the CHM and the normalized density of the VPCDM reached their maximum values. (2) Because the height of a coniferous tree canopy decreases gradually from the top of the tree outward, the decreasing trend of the height value in the CHM model was relatively gentle. However, due to the uneven distribution of branches and other factors, the normalized density value of the VPCDM in the different crown areas changed greatly, and the distribution map shows sharp decreases or pits. The results for the single-tree structural parameters demonstrated the feasibility of the single-tree segmentation method based on the vegetation point cloud density.
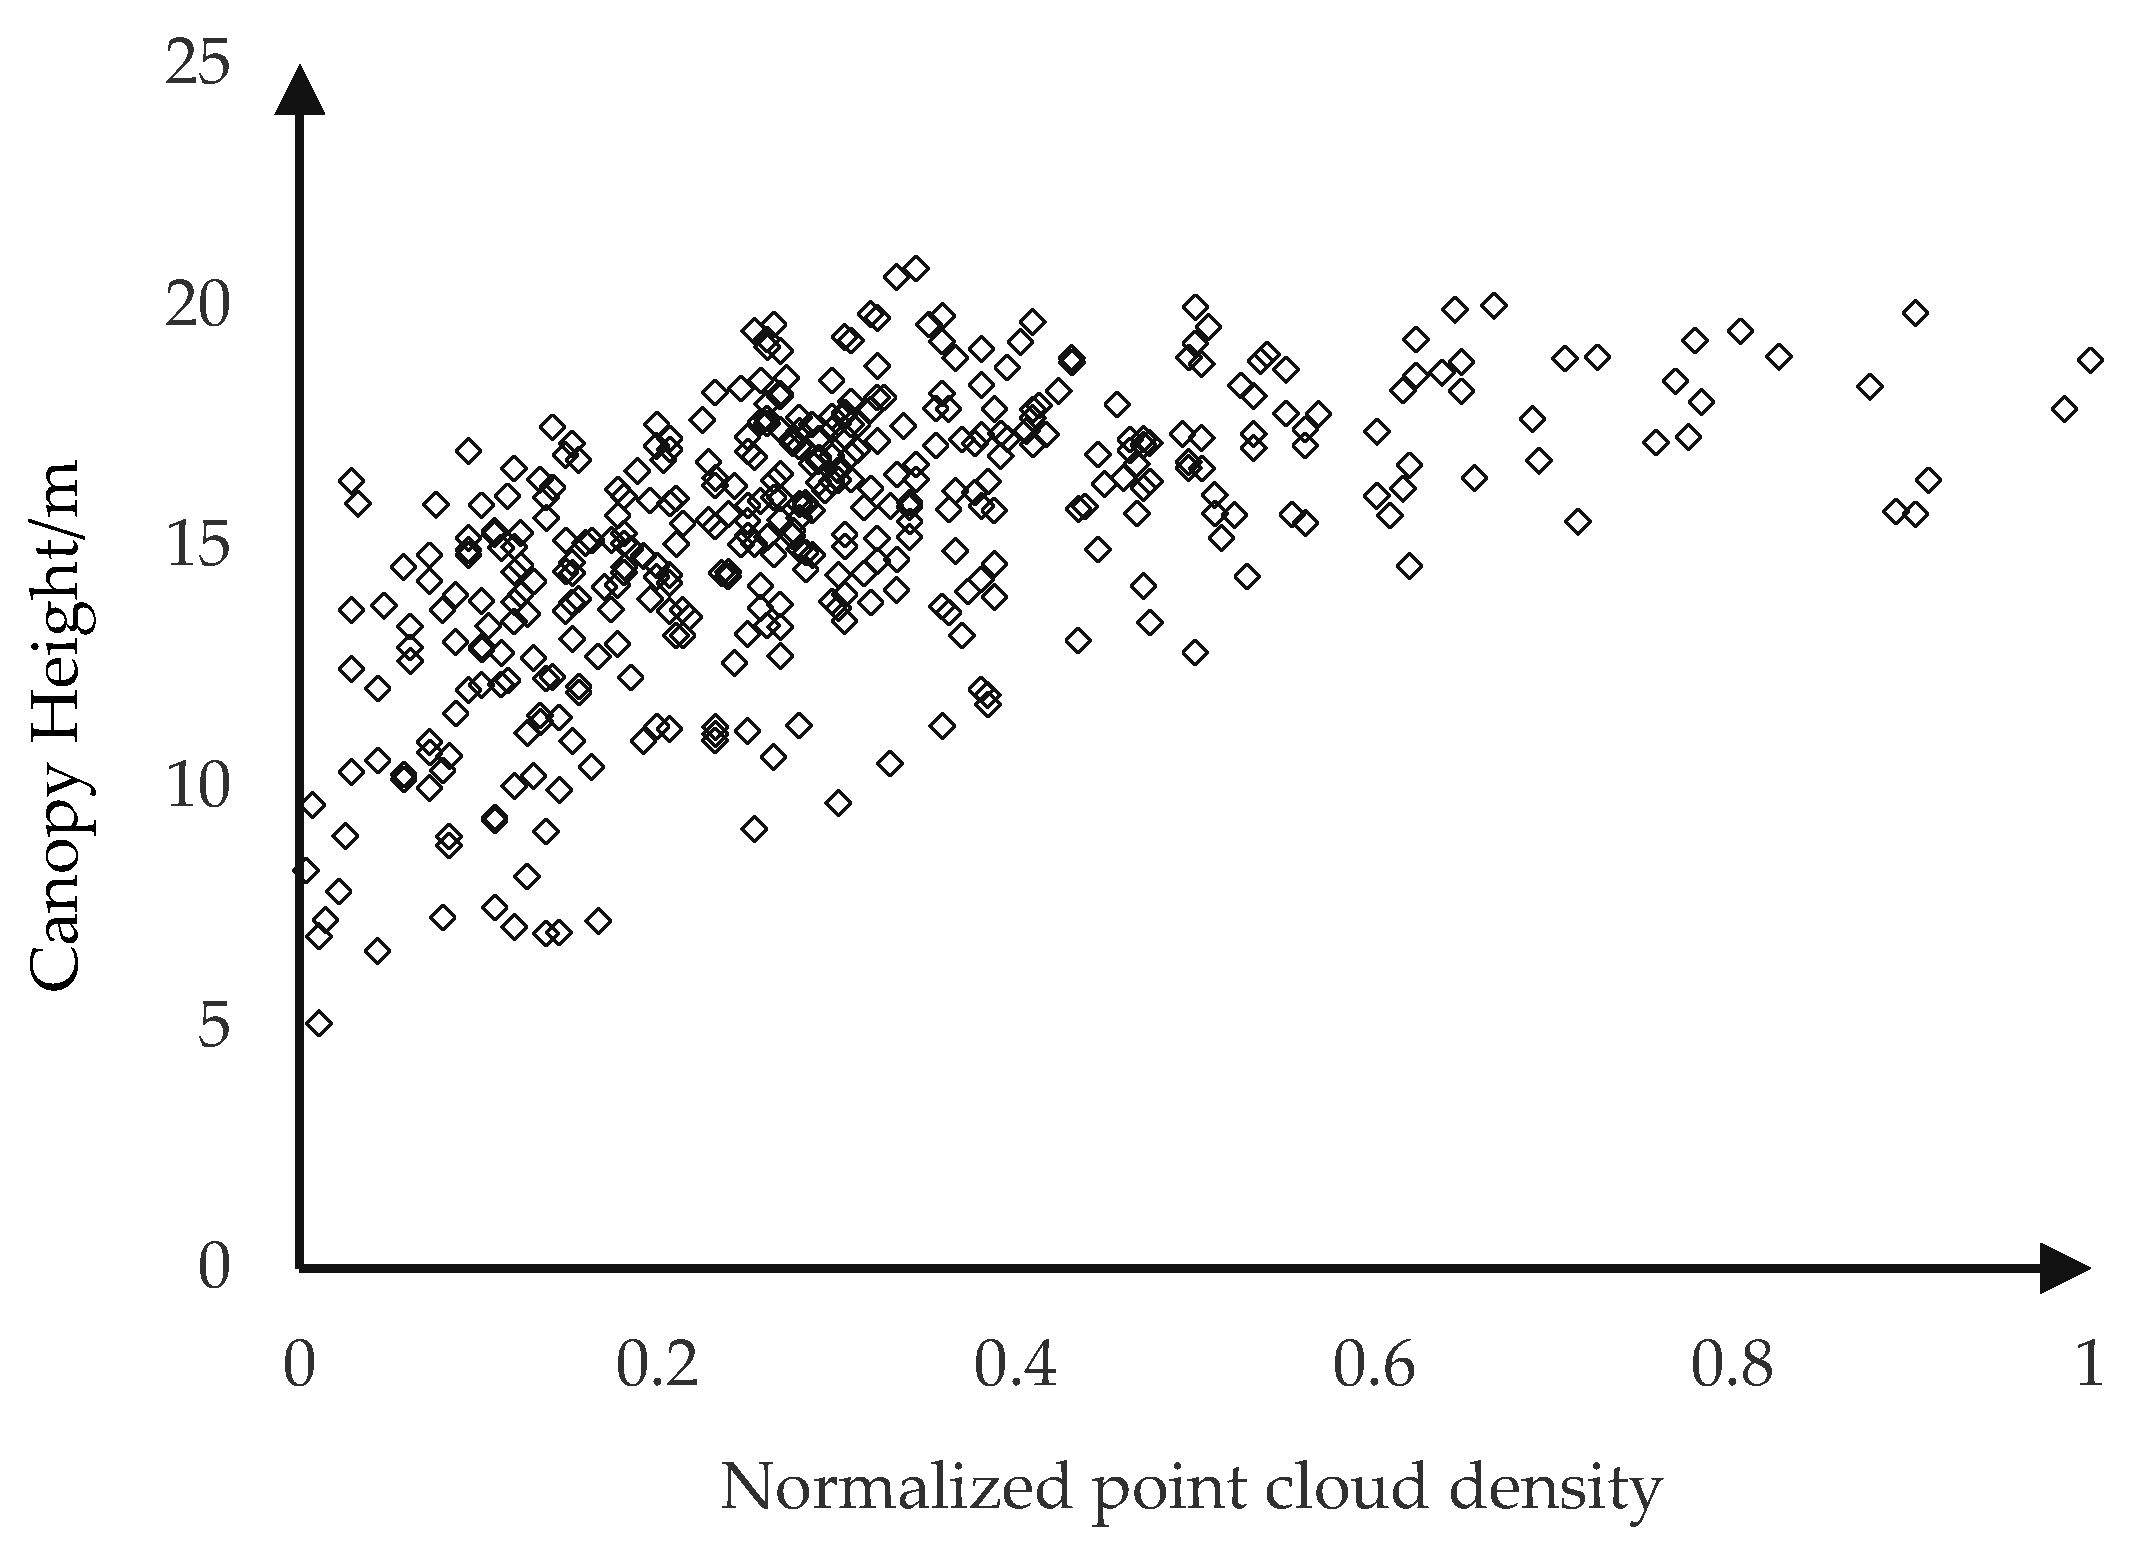
Five hundred points were randomly sampled from the CHM and VPCDM of each of the three plots, and the corresponding canopy height and normalized vegetation point cloud density values were extracted to form a new data set (Figure 9). The data set and its grid position (X,Y) form the confusion matrix, which was used to perform analyses such as consistency test and kappa coefficient assessment. The results showed that for coniferous forest species, because of their similar cone-shaped spatial structure, there was a strong consistency between the density of the vegetation point clouds and the height of the canopy. For an individual tree, the area where the maximum point cloud density and the maximum canopy height are located is the treetop point; at the plot scale, the kappa coefficient reached 0.79. This result indicated that the single-tree segmentation method based on the VPCDM was feasible and accurate in terms of its data format and as a theoretical model. This section validates the feasibility for the single-tree segmentation method and experiments based on vegetation point cloud density at the single-tree scale and sample-plot scale.
Single-tree segmentation based on the VPCDM and CHM had advantages in each of the three research plots. In the plot with the lowest tree density, the two data models had a high segmentation accuracy; however, with the increase in tree density, the segmentation accuracy was greatly reduced. The advantage of the single-tree segmentation method based on the VPCDM is reflected mainly in the single-tree detection results.
4.2. Advantage of VPCDM
This study presents the preliminary findings from using a VPCDM to segment individual trees and extract their parameters. The VPCDM is a raster data model formed by using the spatial characteristics of the point cloud density distribution on the plane projected by the vegetation point cloud obtained from UAV-ALS. The data model fully considers the spatial structural characteristics of tree vegetation point clouds and is therefore completely different from previous studies that used the height information from point clouds in each plane layer stack [17,19]. The tree detection algorithm based on the CHM is fast and efficient, but it readily produces omissions and errors [21,52]. The single-tree segmentation method based on the CHM uses the canopy height information from point cloud data. In sample plots with fewer trees, the distance between trees is greater, the point clouds are more separated, and there is an obvious maximum canopy height at the treetop. Therefore, previous studies have obtained many high-precision research results using the CHM [33,38,45]. However, in sample plots with higher plant density, the distance between trees is short, and the overlapping crown area is greater; moreover, in natural, irregular forests, many higher trees block and cover the surrounding dwarfed trees, resulting in the mixing of point clouds. In these cases, single-tree detection using the CHM can detect only the tallest trees, which affects the accuracy of tree detection [23,24]. In areas with trees, the point cloud density of the tree crown and trunk is higher, and the density increases closer to the trunk center. Single-tree segmentation based on the VPCDM can detect more individual tree positions in sample plots with a higher tree density, which is also the main advantage of such data models over the CHM.
Simultaneously, it should be emphasized that the single-tree segmentation method based on VPCDM has good accuracy for coniferous forest species with similar, conical shapes, but it is not suitable for other tree crown structures or broad-leaved forest species. On the one hand, the leaves of broad-leaved forests notably block light-based sensing systems, and the ability of point clouds to penetrate the canopy is very weak; only a few point clouds will reach the ground within the tree crown coverage area. On the other hand, trees with other crown structures form multicenter crown structures with multiple lateral branches; this leads to the existence of multiple local point cloud density maxima for a single-tree, which affects the segmentation results.
Given the advantages of the VPCDM in terms of its single-tree detection accuracy, it may provide a more significant improvement of the segmentation accuracy for natural forests with a higher tree density or greater complexity. In addition, the tree species, age group, diameter class, and other attributes of the stand may affect the segmentation accuracy of the two data models [30,53]. Therefore, in the field of point cloud segmentation improvement at the single-tree scale, segmentation methods based on VPCDM will likely be used more widely in the coming years.
4.3. Local Maximum Algorithm with an Optimal Window Size
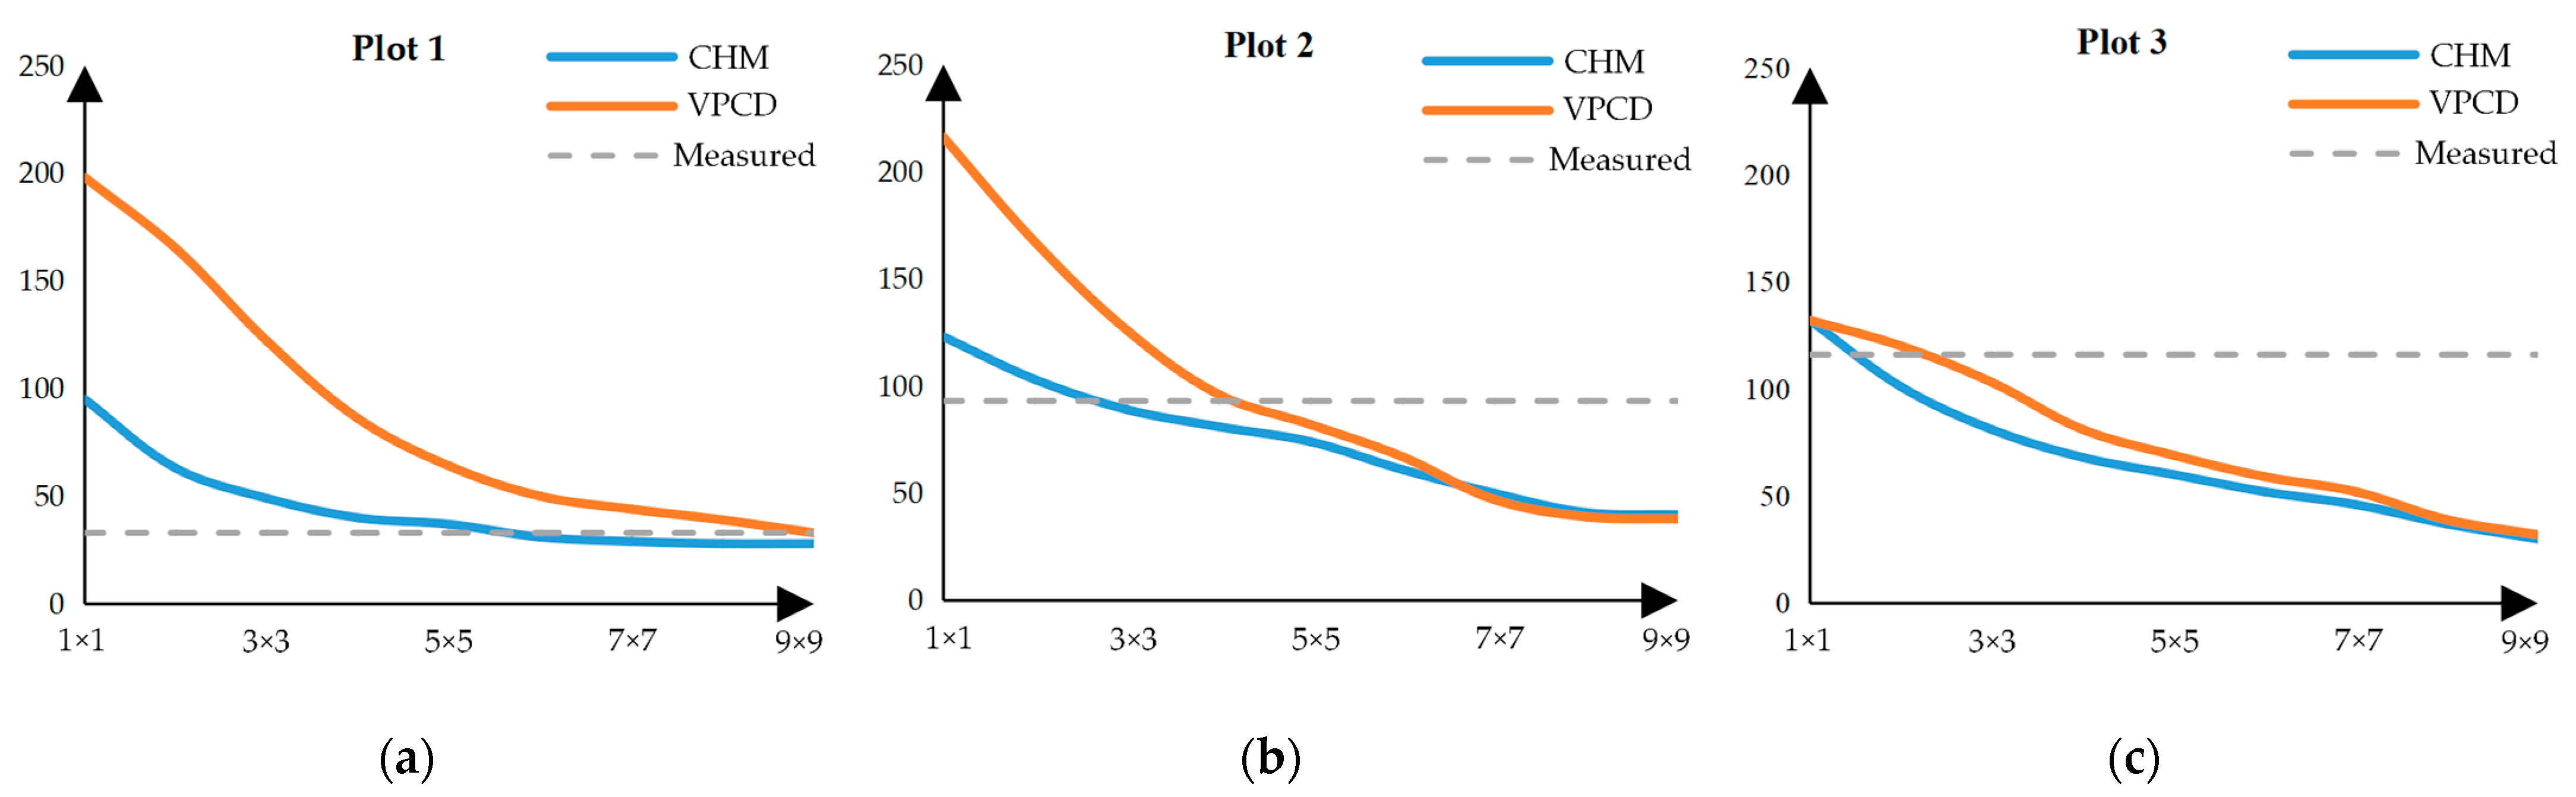
The results of single-tree detection by the CHM and VPCDM were obtained using the local maximum method with an optimal window size in the three plots (Figure 10). The vertical axis represents the number of detected trees, and the horizontal axis represents the window size. In plot 1, there were 33 trees. The accuracy of single-tree detection based on the CHM was highest when the window size was 6 × 6; the detection result was 31. Single-tree detection based on the VPCDM had the highest accuracy when the window size was 9 × 9; the detection result was 33. In plot 2, there were 93 trees. Single-tree detection based on the CHM had the highest accuracy when the window size was 3 × 3; the detection result was 31. Single-tree detection based on the VPCDM had the highest accuracy when the window size was 4 × 4, and the detection result was 33. In Plot 3, there were 116 trees. Single-tree detection based on the CHM and single-tree detection based on the VPCDM both had the highest accuracy when the window size was 2 × 2, and the detection results were 101 and 120, respectively. In other words, the window size was the most important factor influencing detection of the local maximum based on raster data. Based on the CHM and VPCDM, within each plot, there was a similar relationship between the window size and the number of detections. The smaller the window, the higher was the detection result; conversely, the larger the window, the lower was the detection result.
Lee et al. [53] proposed an approach that automatically grows locally optimal canopy clusters or adaptive search radii. Yan et al. [21] proposed a self-adaptive bandwidth estimation method to estimate the optimal kernel bandwidth to improve the accuracy of seed point detection. All of these results show that establishing the optimal window size is the key to single-tree detection based on the local maximum algorithm.
4.4. Improved Watershed Segmentation Algorithm
This study used an improved watershed algorithm to increase the precision of crown area parameter extraction. The overlapping area of the tree crowns was identified by the density curve, and the tree crowns were segmented again using the geometric relationships between the overlapping tree crowns. The improved watershed algorithm was able to fit the complete crown boundary and obtain more accurate crown area parameters than the original watershed algorithm. In the experiments in the three plots, the tree height parameters extracted with the CHM were slightly better than those extracted with the VPCDM. This difference resulted from the effect of single-tree segmentation using the CHM uses the height information from the crown point cloud to detect the treetop position directly, in contrast to single-tree segmentation using the VPCDM, which uses the area of the maximum point cloud density to detect the treetop position [46,48]. The treetop height in the CHM is a pixel value of the raster data, while the treetop height in the VPCDM is the highest value of the vegetation point cloud in the grid where the maximum point cloud density is located [47]. However, the improved watershed algorithm is obviously better than the original watershed algorithm in terms of extracting the canopy area. The experimental results showed that the larger the average tree crown in the plot, the more overlap there was in the crown area, and the more obvious was the improvement effect on the extracted crown area parameters. Therefore, the improved watershed algorithm significantly increased the extraction accuracy of canopy area parameters after identifying the overlapping canopy area. The improved watershed algorithm does have shortcomings. It can use the geometric relationship of the overlapping area to perform re-segmentation and calculate more accurate crown area parameters. However, two adjacent trees in the overlapping area, the crown real boundary cross, cannot be visually displayed by 2D image. Therefore, the canopy boundaries segmented by the improved watershed algorithm cannot be represented visually like the canopy boundaries segmented by the original watershed algorithm [54].
5. Conclusions
Single-tree segmentation based on the VPCDM and the improved watershed algorithm are completely reliable for single-tree detection and structural parameter extraction in coniferous forests. Single-tree segmentation with the VPCDM and CHM utilized the local maximum algorithm with the optimal window size to identify single-tree seed points. However, the principles of data composition for the two models are completely different. The CHM is constructed from the height characteristics of point cloud data, while the VPCDM is composed of the density distribution characteristics of the vegetation point cloud projected onto the horizontal plane using the structural information from trees. The results showed that the following:
(1) The CHM and VPCDM achieved a high accuracy for single-tree detection and structural parameter extraction. In the evaluation of their single-tree detection results, the CHM had some advantages in detection accuracy, while the VPCDM had advantages in detection rate;
(2) The window size of the local maximum algorithm was proportional to the number of detection, and the local maximum algorithm with the optimal window size provided the most accurate results for single-tree number and location detection;
(3) The improved watershed algorithm significantly increased the extraction accuracy for canopy area parameters compared with the original watershed algorithm.
This study shows that single-tree segmentation based on the VPCDM and the improved watershed algorithm have great research potential in the fields of single-tree detection and structural parameter extraction. As with CHM-based segmentation, the accuracy of detection and parameter extraction by VPCDM-based segmentation is affected mainly by the stand conditions in the experimental plot, which cannot easily be changed. In addition, the main challenges in this field are tree detection in complex broad-leaved forests and in mixed coniferous and broad-leaved forests. Further research will involve the use of a combination of techniques to address these challenges.
Author Contributions
Conceptualization and methodology, H.S. and K.M.; validation, K.M. and S.C.; formal analysis, K.M.; investigation, K.M., F.J., S.C., and H.S.; draft, K.M., F.J., and H.S.; supervision, Y.X. and H.S.; review, editing, and revision, K.M., Y.X., and H.S.; funding acquisition, K.M. and H.S. All authors have read and agreed to the published version of the manuscript.
Funding
This research was funded by the National Natural Science Foundation of China (No: 31971578); National Key R&D Program of China project “Research of Key Technologies for Monitoring Forest Plantation Resources” (No: 2017YFD0600900); Scientific Research Fund of Changsha Science and Technology Bureau (No: kq2004095); Scientific Research Fund of Hunan Provincial Education Department (No: 17A225); Training Fund of Young Professors from Hunan Provincial Education Department (No: 90102-7070220090001); Hunan Province Innovation Foundation for Post-graduates (No: CX20200705); and Scientific Innovation Fund for Post-Graduates of Central South University of Forestry and Technology (No: CX20201006).
Institutional Review Board Statement
Not applicable.
Informed Consent Statement
Not applicable.
Data Availability Statement
The data presented in this study are available on request from the corresponding author.
Conflicts of Interest
The authors declare no conflict of interest.
References
- FAO Voluntary Guidelines on National Forest Monitoring; Food and Agriculture Organization of the United Nations: Rome, Italy, 2017; ISBN 978-92-5-109619-2.
- Zhao, P.; Lu, D.; Wang, G.; Liu, L.; Li, D.; Zhu, J.; Yu, S. Forest aboveground biomass estimation in Zhejiang Province using the integration of Landsat TM and ALOS PALSAR data. Int. J. Appl. Earth Obs. 2016, 53, 1–15. [Google Scholar] [CrossRef]
- Rex, F.E.; Silva, C.A.; Dalla Corte, A.P.; Klauberg, C.; Mohan, M.; Cardil, A.; Silva, V.S.d.; Almeida, D.R.A.d.; Garcia, M.; Broadbent, E.N.; et al. Comparison of Statistical Modelling Approaches for Estimating Tropical Forest Aboveground Biomass Stock and Reporting Their Changes in Low-Intensity Logging Areas Using Multi-Temporal LiDAR Data. Remote Sens. 2020, 12, 1498. [Google Scholar] [CrossRef]
- Zhang, Y.; Schauer, J.J.; Zhang, Y.; Zeng, L.; Wei, Y.; Liu, Y.; Shao, M. Correction to Characteristics of Particulate Carbon Emissions from Real-World Chinese Coal Combustion. Environ. Sci. Technol. 2017, 51, 4734. [Google Scholar] [CrossRef]
- Cao, L.; Coops, N.C.; Innes, J.L.; Sheppard, S.R.J.; Fu, L.; Ruan, H.; She, G. Estimation of forest biomass dynamics in subtropical forests using multi-temporal airborne LiDAR data. Remote Sens. Environ. 2016, 178, 158–171. [Google Scholar] [CrossRef]
- Leite, R.V.; Silva, C.A.; Mohan, M.; Cardil, A.; Almeida, D.R.A.D.; Carvalho, S.d.P.C.e.; Jaafar, W.S.W.M.; Guerra-Hernández, J.; Weiskittel, A.; Hudak, A.T.; et al. Individual Tree Attribute Estimation and Uniformity Assessment in Fast-Growing Eucalyptus spp. Forest Plantations Using Lidar and Linear Mixed-Effects Models. Remote Sens. 2020, 12, 3599. [Google Scholar] [CrossRef]
- Li, Z.Y.; Liu, Q.W.; Pang, Y. Review on forest parameters inversion using LiDAR. Int. J. Remote Sens. 2016, 20, 1138–1150. [Google Scholar] [CrossRef]
- Roise, J.P.; Harnish, K.; Mohan, M.; Scolforo, H.; Chung, J.; Kanieski, B.; Catts, G.P.; McCarter, J.B.; Posse, J.; Shen, T. Valuation and production possibilities on a working forest using multi-objective programming, Woodstock, timber NPV, and carbon storage and sequestration. Scand. J. Res. 2016, 31, 674–680. [Google Scholar] [CrossRef]
- Ke, Y.; Quackenbush, L.J. A review of methods for automatic individual tree crown detection and delineation from passive remote sensing. Int. J. Remote Sens. 2011, 32, 4725–4747. [Google Scholar] [CrossRef]
- Sun, H.; Wang, G.; Lin, H.; Li, J.; Zhang, H.; Ju, H. Retrieval and Accuracy Assessment of Tree and Stand Parameters for Chinese Fir Plantation Using Terrestrial Laser Scanning. IEEE Geosci. Remote. Sens. Lett. 2015, 12, 1993–1997. [Google Scholar] [CrossRef]
- Zhen, Z.; Quackenbush, L.J.; Stehman, S.V.; Zhang, L. Agent-based region growing for individual tree crown delineation from airborne laser scanning (ALS) data. Int. J. Remote Sens. 2015, 36, 1965–1993. [Google Scholar] [CrossRef]
- Forzieri, G.; Guarnieri, L.; Vivoni, E.R.; Castelli, F.; Preti, F. Multiple attribute decision making for individual tree detection using high-resolution laser scanning. Ecol. Manag. 2009, 258, 2501–2510. [Google Scholar] [CrossRef]
- Kato, A.; Moskal, L.M.; Schiess, P.; Swanson, M.E.; Calhoun, D.; Stuetzle, W. Capturing tree crown formation through implicit surface reconstruction using airborne lidar data. Remote Sens. Environ. 2009, 113, 1148–1162. [Google Scholar] [CrossRef]
- Liu, Q.; Li, Z.; Chen, E.; Pang, Y.; Li, S.; Tian, X. Feature analysis of LIDAR waveforms from forest canopies. Sci. China Earth Sci. 2011, 54, 1206–1214. [Google Scholar] [CrossRef]
- Jaakkola, A.; Hyypp, J.; Kukko, Y.X.; Kaartinen, H.; Yi, L.; Lehtomäki, M. A low-cost multi-sensoral mobile mapping system and its feasibility for tree measurements. ISPRS J. Photogramm. Remote Sens. 2010, 65, 514–522. [Google Scholar] [CrossRef]
- Kukko, A.; Kaijaluoto, R.; Kaartinen, H.; Lehtola, V.V.; Jaakkola, A.; Hyyppä, J. Graph SLAM correction for single scanner MLS forest data under boreal forest canopy. ISPRS J. Photogramm. Remote Sens. 2017, 132, 199–209. [Google Scholar] [CrossRef]
- Reitberger, J.; Krzystek, P.; Stilla, U. Benefit of airborne full waveform lidar for 3D segmentation and classification of single trees. In Proceedings of the ASPRS 2009 Annual Conference, Baltimore, MD, USA, 9–13 March 2009; pp. 1–9. [Google Scholar]
- Yao, W.; Krzystek, P.; Heurich, M. Tree species classification and estimation of stem volume and DBH based on single tree extraction by exploiting airborne full-waveform LiDAR data. Remote Sens. Environ. 2012, 123, 368–380. [Google Scholar] [CrossRef]
- Li, W.; Guo, Q.; Jakubowski, M.K.; Kelly, M. A New Method for Segmenting Individual Trees from the Lidar Point Cloud. Photogramm. Eng. Remote. Sens. 2012, 78, 75–84. [Google Scholar] [CrossRef] [Green Version]
- Wang, Y.; Weinacker, H.; Koch, B.; Sterenczak, K. Lidar point cloud based fully automatic 3D single tree modelling in forest and evaluations of the procedure. Int. Arch. Photogramm. Remote Sens. Spat. Inform. Sci. 2008, 37, 45–51. [Google Scholar]
- Yan, W.; Guan, H.; Cao, L.; Yu, Y.; Li, C.; Lu, J. A Self-Adaptive Mean Shift Tree-Segmentation Method Using UAV LiDAR Data. Remote Sens. 2020, 12, 515. [Google Scholar] [CrossRef] [Green Version]
- Kuželka, K.; Slavík, M.; Surový, P. Very high density point clouds from UAV laser scanning for automatic tree stem detection and direct diameter measurement. Remote Sens. 2020, 12, 1236. [Google Scholar] [CrossRef] [Green Version]
- Ferraz, A.; Saatchi, S.; Mallet, C.; Meyer, V. Lidar detection of individual tree size in tropical forests. Remote Sens. Environ. 2016, 183, 318–333. [Google Scholar] [CrossRef]
- Melzer, T. Non-parametric segmentation of ALS point clouds using mean shift. J. Appl. Geodesy 2007, 1, 159–170. [Google Scholar] [CrossRef]
- Silva, V.S.d.; Silva, C.A.; Mohan, M.; Cardil, A.; Rex, F.E.; Loureiro, G.H.; Almeida, D.R.A.D.; Broadbent, E.N.; Gorgens, E.B.; Dalla Corte, A.P.; et al. Combined impact of sample size and modeling approaches for predicting stem volume in eucalyptus spp. forest plantations using field and LiDAR data. Remote Sens. 2020, 12, 1438. [Google Scholar] [CrossRef]
- Morsdorf, F.; Meiera, E.; Kötza, B.; Ittena, K.I.; Dobbertinc, M.; Allgöwer, B. LiDAR-based geometricreconstruction of boreal type forest stands at single tree level for forest and wildland fire management. Remote Sens. Environ. 2004, 92, 353–362. [Google Scholar] [CrossRef]
- Gupta, S.; Weinacker, H.; Koch, B. Comparative analysis of clustering-based approaches for 3-D single tree detection using airborne fullwave LiDAR data. Remote Sens. 2010, 2, 968–989. [Google Scholar] [CrossRef] [Green Version]
- Heinzel, J.N.; Weinacker, H.; Koch, B. Prior-knowledge-based single-tree extraction. Int. J. Remote Sens. 2011, 32, 4999–5020. [Google Scholar] [CrossRef]
- Chen, Q.; Baldocchi, D.; Gong, P.; Kelly, M. Isolating individual trees in a Savanna woodland using small footprint LiDAR data. Photogramm. Eng. Remote Sens. 2006, 72, 923–932. [Google Scholar] [CrossRef] [Green Version]
- Brandtberg, T.; Warner, T.A.; Landenberger, R.E.; McGraw, J.B. Detection and analysis of individual leaf-off tree crowns in small footprint, high sampling density lidar data from the eastern deciduous forest in North America. Remote Sens. Environ. 2003, 85, 290–303. [Google Scholar] [CrossRef]
- Ene, L.; Næsset, E.; Gobakken, T. Single tree detection in heterogeneous boreal forests using airborne laser scanning and area-based stem number estimates. Int. J. Remote Sens. 2012, 33, 5171–5193. [Google Scholar] [CrossRef]
- Smits, I.; Dagis, S.; Dubrovskis, D.; Prieditis, G. Individual tree identification using different LIDAR and optical imagery data processing methods. Biosyst. Inf. Technol. 2012, 1, 19–24. [Google Scholar] [CrossRef]
- Yang, J.; Kang, Z.; Cheng, S.; Yang, Z.; Akwensi, P. An individual tree segmentation method based on watershed algorithm and 3D spatial distribution analysis from airborne LiDAR point clouds. IEEE J-STARS 2020, 13, 1055–1067. [Google Scholar] [CrossRef]
- Hao, Y.; Widagdo, F.R.A.; Liu, X.; Quan, Y.; Dong, L.; Li, F. Individual Tree Diameter Estimation in Small-Scale Forest Inventory Using UAV Laser Scanning. Remote Sens. 2021, 13, 24. [Google Scholar] [CrossRef]
- Zhen, Z.; Quackenbush, L.J.; Zhang, L. Trends in automatic individual tree crown detection and delineation-evolution of LiDAR data. Remote Sens. 2016, 8, 333. [Google Scholar] [CrossRef] [Green Version]
- Wuming, Z.; Jianbo, Q.; Peng, W.; Wang, H.; Xiu, D.; Wang, X. An Easy-to-Use Airborne LiDAR Data Filtering Method Based on Cloth Simulation. Remote Sens. 2016, 8, 501. [Google Scholar] [CrossRef]
- Wu, J.; Yao, W.; Polewski, P. Mapping Individual Tree Species and Vitality along Urban Road Corridors with LiDAR and Imaging Sensors: Point Density versus View Perspective. Remote Sens. 2018, 10, 1403. [Google Scholar] [CrossRef] [Green Version]
- Hu, H.; Ding, Y.; Zhu, Q.; Wu, B.; Lin, H.; Du, Z.; Zhang, Y.; Zhang, Y. An adaptive surface filter for airborne laser scanning point clouds by means of regularization and bending energy. ISPRS J. Photogramm. Remote Sens. 2014, 92, 98–111. [Google Scholar] [CrossRef]
- Chen, W.; Zheng, Q.; Xiang, H.; Chen, X.; Sakai, T. Forest Canopy Height Estimation Using Polarimetric Interferometric Synthetic Aperture Radar (PolInSAR) Technology Based on Full-Polarized ALOS/PALSAR Data. Remote Sens. 2021, 13, 174. [Google Scholar] [CrossRef]
- Meng, X.; Currit, N.; Zhao, K. Ground Filtering Algorithms for Airborne LiDAR Data: A Review of Critical Issues. Remote Sens. 2010, 2, 833–860. [Google Scholar] [CrossRef] [Green Version]
- Chen, W.; Hu, X.; Chen, W.; Hong, Y.; Yang, M. Airborne LiDAR Remote Sensing for Individual Tree Forest Inventory Using Trunk Detection-Aided Mean Shift Clustering Techniques. Remote Sens. 2018, 10, 1078. [Google Scholar] [CrossRef] [Green Version]
- Zhen, Z.; Quackenbush, L.J.; Zhang, L. Impact of tree-oriented growth order in marker-controlled region growing for individual tree crown delineation using airborne laser scanner (ALS) data. Remote Sens. 2014, 6, 555–579. [Google Scholar] [CrossRef] [Green Version]
- Andersen, H.E.; Mcgaughey, R.J.; Reutebuch, S.E. Estimating forest canopy fuel parameters using LIDAR data. Remote Sens. Environ. 2005, 94, 441–449. [Google Scholar] [CrossRef]
- Zhao, K.; Popescu, S.; Nelson, R. Lidar remote sensing of forest biomass: A scale-invariant estimation approach using airborne lasers. Remote Sens Environ. 2009, 113, 182–196. [Google Scholar] [CrossRef]
- Næsset, E.; Gobakken, T. Estimation of above- and below-ground biomass across regions of the boreal forest zone using airborne laser. Remote Sens Environ. 2008, 112, 3079–3090. [Google Scholar] [CrossRef]
- Pouliot, D.; King, D.; Bell, F.; Pitt, D. Automated tree crown detection and delineation in high-resolution digital camera imagery of coniferous forest regeneration. Remote. Sens. Environ. 2002, 82, 322–334. [Google Scholar] [CrossRef]
- Koch, B.; Heyder, U.; Weinacker, H. Detection of Individual Tree Crowns in Airborne Lidar Data. Photogramm. Eng. Remote. Sens. 2006, 72, 357–363. [Google Scholar] [CrossRef] [Green Version]
- Vauhkonen, J.; Ene, L.; Gupta, S.; Heinzel, J.; Holmgren, J.; Pitkänen, J.; Solberg, S.; Wang, Y.; Weinacker, H.; Hauglin, K.; et al. Comparative testing of single-tree detection algorithms under different types of forest. Forestry 2011. [Google Scholar] [CrossRef] [Green Version]
- Xu, Z.; Gao, X. A novel method for identifying the boundary of urban built-up areas with POI data. Geogr. J. 2016, 71, 928–939. [Google Scholar] [CrossRef]
- Koukoulas, S.; Blackburn, G. Mapping individual tree location, height and species in broadleaved deciduous forest using airborne LiDAR and multi-spectral remotely sensed data. Int. J. Remote Sens. 2005, 26, 431–455. [Google Scholar] [CrossRef]
- Lu, X.; Guo, Q.; Li, W.; Flanagan, J. A bottom-up approach to segment individual deciduous trees using leaf-off lidar point cloud data. ISPRS J. Photogramm. Remote. Sens. 2014, 94, 1–12. [Google Scholar] [CrossRef]
- Paris, C.; Valduga, D.; Bruzzone, L. A Hierarchical Approach to Three-Dimensional Segmentation of LiDAR Data at Single-Tree Level in a Multilayered Forest. IEEE Trans. Geosci. Remote Sens. 2016, 54, 4190–4203. [Google Scholar] [CrossRef]
- Lee, H.; Slatton, K.C.; Roth, B.E.; Cropper, W.P., Jr. Adaptive clustering of airborne LiDAR data to segment individual tree crowns in managed pine forests. Int. J. Remote Sens. 2010, 31, 117–139. [Google Scholar] [CrossRef]
- Hyyppä, J.; Yu, X.; Hyyppä, H.; Vastaranta, M.; Holopainen, M.; Kukko, A.; Kaartinen, H.; Jaakkola, A.; Vaaja, M.; Koskinen, J.; et al. Advances in Forest Inventory Using Airborne Laser Scanning. Remote Sens. 2012, 4, 1190–1207. [Google Scholar] [CrossRef] [Green Version]
Figure 1.
The methodological framework of this study.

Figure 2.
Location of the study area (a), in which red numbers indicate the locations of the three plots; the investigated trees (red circles) in the three sampling plots (b–d).
Figure 2.
Location of the study area (a), in which red numbers indicate the locations of the three plots; the investigated trees (red circles) in the three sampling plots (b–d).

Figure 3.
Improved watershed algorithm for extracting the tree crown area. In the geometric model, (a,b) are the top view and side view of two trees, respectively. The red dotted line (a) is the crown boundary of the overlapping trees segmented by the original watershed algorithm. DA and DB are the distances between the real crown boundary and the boundary segmented by the original watershed algorithm. In the point cloud distribution model (c), the red points are the maximum heights in the grid, which are used to extract the height parameters (HA, HB, and HAB), and the yellow points are the crown point cloud, which is used to extract under branch height (hA, hB) at the boundary of the non-overlapping crown.


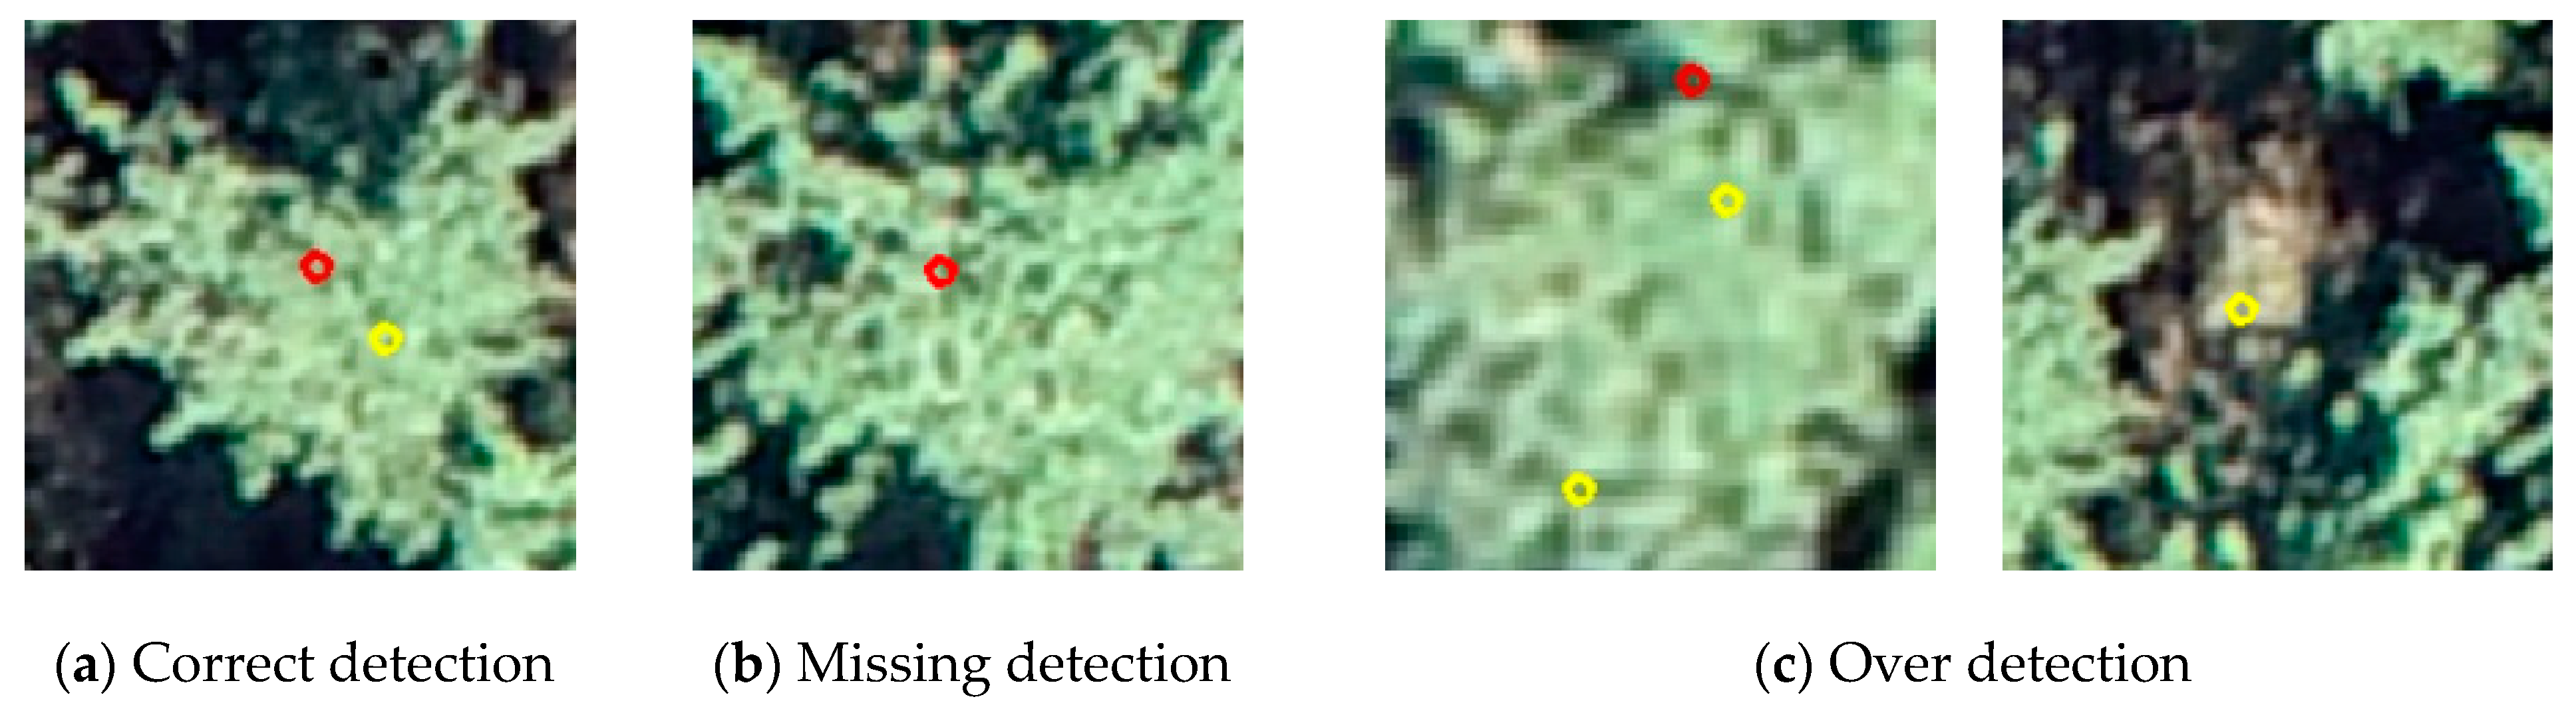
Figure 4.
Evaluation criteria for single-tree detection accuracy. The red circle indicates the measured location of an individual tree (Figure 2), and the yellow circle indicates the detected position of an individual tree (a–c). In (a), the measured tree position and the detected tree position are nearly coincident on the same crown; (b) shows an area with trees in which the segmentation algorithm did not detect trees; and (c) shows the detection of two trees within the same canopy and the detection of trees in an area without a tree canopy.

Figure 5.
Plots of the extracted height against the measured height. (a–c) are the extraction results for tree height in the three plots based on the local maximum algorithm using the CHM; (d–f) are the extraction results for tree height in the three plots using the VPCDM.
Figure 5.
Plots of the extracted height against the measured height. (a–c) are the extraction results for tree height in the three plots based on the local maximum algorithm using the CHM; (d–f) are the extraction results for tree height in the three plots using the VPCDM.

Figure 6.
Canopy boundaries determined by visual interpretation and the original watershed algorithm. (a–c) are the visual interpretation results in three plots; (d–f) are the original watershed algorithm results in three plots; (g–i) are the scatter plots with reference area values and the original watershed algorithm values in three plots.


Figure 7.
CHM and VPCDM. (a–c) are the CHM results for plot 1, plot 2, and plot 3, respectively; the lighter the grayscale, the higher is the canopy height. (d–f) are the VPCDM results for plot 1, plot 2, and plot 3, respectively; the lighter the grayscale, the higher is the normalized vegetation point cloud density.

Figure 8.
The trends of two data models for a single-tree. (a) show the digital orthophoto images and canopy boundary. (b,d) show the CHM and its height values as the central green tangent lines. (c–e) show the VPCDM and its normalized density values as the central red tangent lines. (f) is a graph of (d,e) combined. The horizontal axis represents the serial position number of the tangent values from the bottom left to the top right; the vertical axis represents the height and point density.

Figure 9.
Diagram of canopy height and normalized point cloud density. The horizontal axis is the normalized vegetation point cloud density of 500 sample points, and the vertical axis is the canopy height.
Figure 9.
Diagram of canopy height and normalized point cloud density. The horizontal axis is the normalized vegetation point cloud density of 500 sample points, and the vertical axis is the canopy height.

Figure 10.
Single-tree extraction results for different window sizes. (a–c) show the results of single-tree detection using the maximum value of local window when the window size is set to 1 × 1 to 9 × 9 in three plots.
Figure 10.
Single-tree extraction results for different window sizes. (a–c) show the results of single-tree detection using the maximum value of local window when the window size is set to 1 × 1 to 9 × 9 in three plots.


Table 1.
Characteristics of the three forest plots investigated in this study.
| Plot ID | Dominant Tree Species | Number of Trees | Height SD (m) | DBH SD (cm) |
|---|---|---|---|---|
| 1 | Chinese pine | 33 | 17.7 ± 3.31 | 28.84 ± 7.00 |
| 2 | Chinese pine | 93 | 20.47 ± 2.53 | 17.62 ± 2.76 |
| 3 | Chinese pine | 116 | 11.69 ± 3.41 | 13.57 ± 4.13 |
Table 2.
Evaluation of single-tree detection accuracy.
| M * | D * | CD * | MD * | OD * | DR * | AR * | F * | ||
|---|---|---|---|---|---|---|---|---|---|
| Plot 1 | CHM | 33 | 31 | 31 | 2 | 0 | 0.94 | 1.00 | 0.97 |
| VPCDM | 33 | 32 | 1 | 1 | 0.97 | 0.97 | 0.97 | ||
| Plot 2 | CHM | 93 | 89 | 82 | 11 | 7 | 0.88 | 0.92 | 0.90 |
| VPCDM | 96 | 86 | 8 | 10 | 0.92 | 0.90 | 0.91 | ||
| Plot 3 | CHM | 116 | 101 | 88 | 28 | 13 | 0.76 | 0.87 | 0.81 |
| VPCDM | 120 | 94 | 22 | 26 | 0.81 | 0.78 | 0.80 |
* Note: M, Measured; D, Detected; CD, Correct detection; MD, Missing detection; OD, Over detection; DR, Detection rate; AR, Accuracy rate; F, F-score.
Table 3.
Evaluation of tree height extraction accuracy by two data models based on the local maximum algorithm.
Table 3.
Evaluation of tree height extraction accuracy by two data models based on the local maximum algorithm.
| Plot ID | Data Model | R2 | RMSE (m) |
|---|---|---|---|
| 1 | CHM | 0.92 | 0.68 |
| VPCDM | 0.91 | 0.71 | |
| 2 | CHM | 0.84 | 0.77 |
| VPCDM | 0.83 | 0.79 | |
| 3 | CHM | 0.82 | 1.55 |
| VPCDM | 0.81 | 1.63 |
Table 4.
Evaluation of the tree canopy area extraction accuracy.
| Plot 1 | Plot 2 | Plot 3 | ||||
|---|---|---|---|---|---|---|
| Area (m2) | Accuracy | Area (m2) | Accuracy | Area (m2) | Accuracy | |
| Reference value | 545.6 | - | 636.3 | - | 625.5 | - |
| Original watershed algorithm | 512.5 | 0.94 | 555.9 | 0.87 | 578.2 | 0.92 |
| Improved watershed algorithm | 523.9 | 0.96 | 594.1 | 0.93 | 594.6 | 0.95 |
Publisher’s Note: MDPI stays neutral with regard to jurisdictional claims in published maps and institutional affiliations. |
© 2021 by the authors. Licensee MDPI, Basel, Switzerland. This article is an open access article distributed under the terms and conditions of the Creative Commons Attribution (CC BY) license (https://creativecommons.org/licenses/by/4.0/).
Share and Cite
MDPI and ACS Style
Ma, K.; Xiong, Y.; Jiang, F.; Chen, S.; Sun, H. A Novel Vegetation Point Cloud Density Tree-Segmentation Model for Overlapping Crowns Using UAV LiDAR. Remote Sens. 2021, 13, 1442. https://doi.org/10.3390/rs13081442
AMA Style
Ma K, Xiong Y, Jiang F, Chen S, Sun H. A Novel Vegetation Point Cloud Density Tree-Segmentation Model for Overlapping Crowns Using UAV LiDAR. Remote Sensing. 2021; 13(8):1442. https://doi.org/10.3390/rs13081442
Chicago/Turabian StyleMa, Kaisen, Yujiu Xiong, Fugen Jiang, Song Chen, and Hua Sun. 2021. "A Novel Vegetation Point Cloud Density Tree-Segmentation Model for Overlapping Crowns Using UAV LiDAR" Remote Sensing 13, no. 8: 1442. https://doi.org/10.3390/rs13081442
Note that from the first issue of 2016, this journal uses article numbers instead of page numbers. See further details here.