
Development of the PRISM Risk Assessment Method Based on a Multiple AHP-TOPSIS Approach


1
Department of Management and Business Economics, Budapest University of Technology and Economics, Magyar Tudósok Körútja 2, H-1117 Budapest, Hungary
2
Department of Management, University of Pannonia, Egyetem utca 10, H-8200 Veszprém, Hungary
*
Author to whom correspondence should be addressed.
Risks 2022, 10(11), 213; https://doi.org/10.3390/risks10110213
Submission received: 29 September 2022
/
Revised: 3 November 2022
/
Accepted: 7 November 2022
/
Published: 9 November 2022
(This article belongs to the Special Issue New Advance of Risk Management Models)
Abstract
:The PRISM method is a risk assessment approach that focuses on hidden-risk identification and ranking. The combined AHP-PRISM method was created for strategic assessments based on pairwise comparisons. The PRISM and AHP-PRISM methods have remarkable visual decision support and control functions that make them useful in practical problem solving. However, the methods can be successfully applied with the same factor weights. To eliminate this significant disadvantage and enable an in-depth analysis of the alternatives based on the ideal best and ideal worst solutions, AHP-PRISM was integrated with TOPSIS in this study. As a result, the novel AHP-TOPSIS-based PRISM method can be configured more extensively for practical decision-making problems than the previous PRISM approaches. In addition, the novel method supports the ideal best and worst analysis of the alternatives without losing its ability to focus on identifying hidden risk. The method was tested on data related to strategic incident groups of incoming logistics business processes at a nuclear power plant.
Keywords:
risk assessment; risk evaluation; risk management; TOPSIS; AHP; PRISM; MCDM; MCDA; NPP; partial risk map1. Introduction
The partial risk map (PRISM) risk management method was described by Bognár and Benedek (2021). This risk assessment approach is generally based on the fundamentals of failure mode and effects analysis (FMEA) and risk matrix (RM). An important novelty of the method is that PRISM assesses risks based on partial risks, which can be invisible or hidden, while applying FMEA and calculating the traditional risk priority number (RPN). The PRISM method is built on the three risk assessment dimensions of FMEA, but its risk interpretation is significantly different from the FMEA perspective. FMEA focuses on the overall risk level of an incident. Thus, the method systematically underrates incidents with high partial risk but lower overall risk, which can lead to significant failure or breakdown of business processes (Bognár and Hegedűs 2022). Applying the PRISM method may be advised in the case of an increased need for reliability in business processes, an increased need for environmental protection, or for safety-culture requirements.
Although the PRISM method can solve the problem of underrated partial risks, some limitations of the method have been addressed. Kovács et al. (2022) pointed out that the method applies only the three assessment dimensions of FMEA. Another issue is that the PRISM method requires the same factor weight of assessment dimensions, otherwise the results will be distorted. The assessment process is based on deterministic evaluation scales derived from a novel taxonomy of multi-criteria decision-making (MCDM) methods (Cinelli et al. 2022). Due to the inflexibility of deterministic evaluation scales, the data sensitivity of the PRISM method is critical. Some disadvantages of the PRISM method are counterbalanced by combining the method with the analytic hierarchy process (AHP), a pairwise-comparison-based MCDM method (Bognár and Benedek 2022a). However, the AHP-PRISM combination cannot solve the problem of the same factor weights of the assessment dimensions.
The research results in recent decades indicate that MCDM is a potent approach that can be a solid methodological basis for developing new risk assessment techniques. By combining MCDM and traditional risk assessment methods, we can better model the complexity of initial risk assessment approaches in the evaluation process.
Traditional assessment techniques, such as FMEA, RM, and fault-tree analysis (FTA), have had numerous MCDM-related developments in the last 25 years. The state of the art related to the development of these methods by MCDM techniques shows significant heterogeneity. Pairwise comparison techniques, especially AHP, have been applied to the development of the traditional FMEA (Braglia 2000; Kiss et al. 2011), RM (Sum 2015), and FTA (Hyun et al. 2015) to address some shortcomings of the traditional methods. These shortcomings are usually related to the applied deterministic evaluation scales and support the traditional methods when performing consistency checks. Since the TOPSIS and VIKOR methods have significant potential in comparing alternatives for an ideal best and ideal worst solution, these techniques are also intensively applied in the complex modeling of risk assessment (Liu 2016; De Magalhães and Lima Junior 2021). Fuzzy techniques are widely applied when machine learning is the focus of the assessment, especially when the decision-making problem is complex (Forgács et al. 2021; Braglia et al. 2003).
The aim of this study was to create a novel AHP-based PRISM method that enables different factor weights for the assessment dimensions and an in-depth analysis of the alternatives based on the ideal best and ideal worst solutions. Most of the time, AHP is combined with the technique for order preference by similarity to ideal solution (TOPSIS). Thus, there are numerous AHP-TOPSIS assessment approaches. Based on the observations by Kim et al. (1997) and Shih et al. (2007), four significant advantages of the TOPSIS method can be discussed. According to the interpretation of Shih et al. (2007), the method has sound logic; the solution of the method reflects both positive and negative ideal alternatives (Yang et al. 2010); the computational steps are simple; the TOPSIS process can be executed using simple spreadsheets; and the performance measures related to each alternative on different assessment dimensions can be visualized easily. According to Rađenović and Veselinović (2017), TOPSIS provides efficiency in ranking compared to other methods. Compared to other methods, TOPSIS can be considered as a powerful MCDM method based on the previously mentioned advantages (Shih et al. 2007). On the other hand, TOPSIS-based developments enable factor weights. Thus, TOPSIS was selected to improve the AHP-PRISM method.
Section 2 presents a brief overview of AHP-TOPSIS approaches. The steps of the proposed AHP-TOPSIS-based PRISM method are described in detail in Section 3. Section 4 presents the proposed method’s application based on the data of a case study in a European nuclear power plant (NPP) presented by Bognár and Benedek (2022a). Finally, the methodological outcomes are discussed in detail in Section 5.
2. Recent AHP-TOPSIS-Based Developments
Many AHP-TOPSIS applications have been published in international scientific articles in the last decade. The combination of AHP and TOPSIS results in a solid approach that builds on the strengths of both methods.
The studies of integrated AHP and TOPSIS generally focus on the following topics:
- Development of the TOPSIS method by combining it with AHP for solid factor weight determination and decision making.
- Development of other decision-making or evaluation methods by combining them with AHP-TOPSIS.
Agrawal et al. (2022) presented a combined AHP-TOPSIS methodology to develop standard decision-making trial and evaluation laboratory (DEMATEL) processes for evaluating success factors of e-service quality in the banking industry. Solaiman and Sharmin (2019) proposed the BigBank model for solving a bank branch location problem based on the combination of AHP and TOPSIS. Çalık et al. (2019) developed a three-stage AHP-TOPSIS decision-making model to support foreign investment selection. Barrios et al. (2016) applied an integrated AHP-TOPSIS model to select the most appropriate tomography equipment in a radiology department, and Aziz and Çalık (2022) tested three TOPSIS development approaches (AHP-TOPSIS, PFAHP-TOPSIS, and BWM-TOPSIS) for healthcare supplier selection.
AHP-TOPSIS approaches are highly represented solutions in supplier-selection problem solving. Menon and Ravi (2022) solved a sustainable supplier-selection problem of the supply chain in the electronics industry. Zaman (2020) applied AHP-TOPSIS and AHP-VIKOR to select the ideal supplier in the mill industry in Bangladesh. Supplier-selection problems have also been solved in the textile industry (Sasi and Digalwar 2015) and the manufacturing industry (Bhutia and Phipon 2012; Vimal et al. 2012). In addition, Yang et al. (2010) introduced a practical evaluation index for supplier selection in an NPP based on the AHP-TOPSIS approach.
Berdie et al. (2017) applied a combination of AHP and TOPSIS for integrated software assessment, Rađenović and Veselinović (2017) assessed the efficiency of health management information systems, Hanine et al. (2016) solved an exact, transform, and load (ETL) software-selection problem, and Abushark et al. (2021) presented a solution for software selection from the perspective of security-requirements engineering.
Hsueh and Lin (2017) introduced an integrated AHP-TOPSIS decision process for evaluating collection strategies in reverse logistics in the photovoltaic industry. Bafail and Abdulaal (2022) applied an AHP-TOPSIS and BWM-TOPSIS approach for assessing recycling methods in solid-waste management. Based on an integrated fuzzy AHP-TOPSIS method, Ligus and Peternek (2018) introduced a decision support process for selecting the most promising low-emission energy technologies in Poland. In addition, Sirisawat and Kiatcharoenpol (2018) developed a fuzzy AHP-TOPSIS approach for prioritizing solutions for reverse logistics barriers in Thailand.
AHP-TOPSIS-based approaches are widely applied in the nuclear industry for complex assessments. For example, Yoon et al. (2015) combined AHP and TOPSIS to evaluate nuclear fuel cycles based on five main assessment factors. Situmorang et al. (2018) developed a multi-criteria decision analysis method based on AHP-TOPSIS for the complex evaluation of safety culture. Anand Babu and Venkataramaiah (2015) applied an AHP-TOPSIS approach for optimizing the process parameters of electrical wire discharge machining based on a CNC machine assessment case study. Chakladar and Chakraborty (2008) combined AHP and TOPSIS to rank non-traditional machining processes in the metal industry. Salehi et al. (2018) applied an AHP-TOPSIS approach for solving foreign vehicle technology purchasing, while Bakioglu and Atahan (2021) developed an effective process for risk assessment of self-driving vehicles based on the integration of AHP with TOPSIS and VIKOR.
The AHP-TOPSIS approach was applied for selecting between leading industrial sectors (Rahmayanti et al. 2021), for selecting products in terms of inventory management (Kokoç and Ersöz 2019), for selecting excellence award winners (Supraja and Kousalya 2016), and for assessing and selecting among human resource manager candidates (Kusumawardani and Agintiara 2015).
The results of the literature review are summarized in Table 1. The article references are presented in descending order by year of publication.
3. Methods
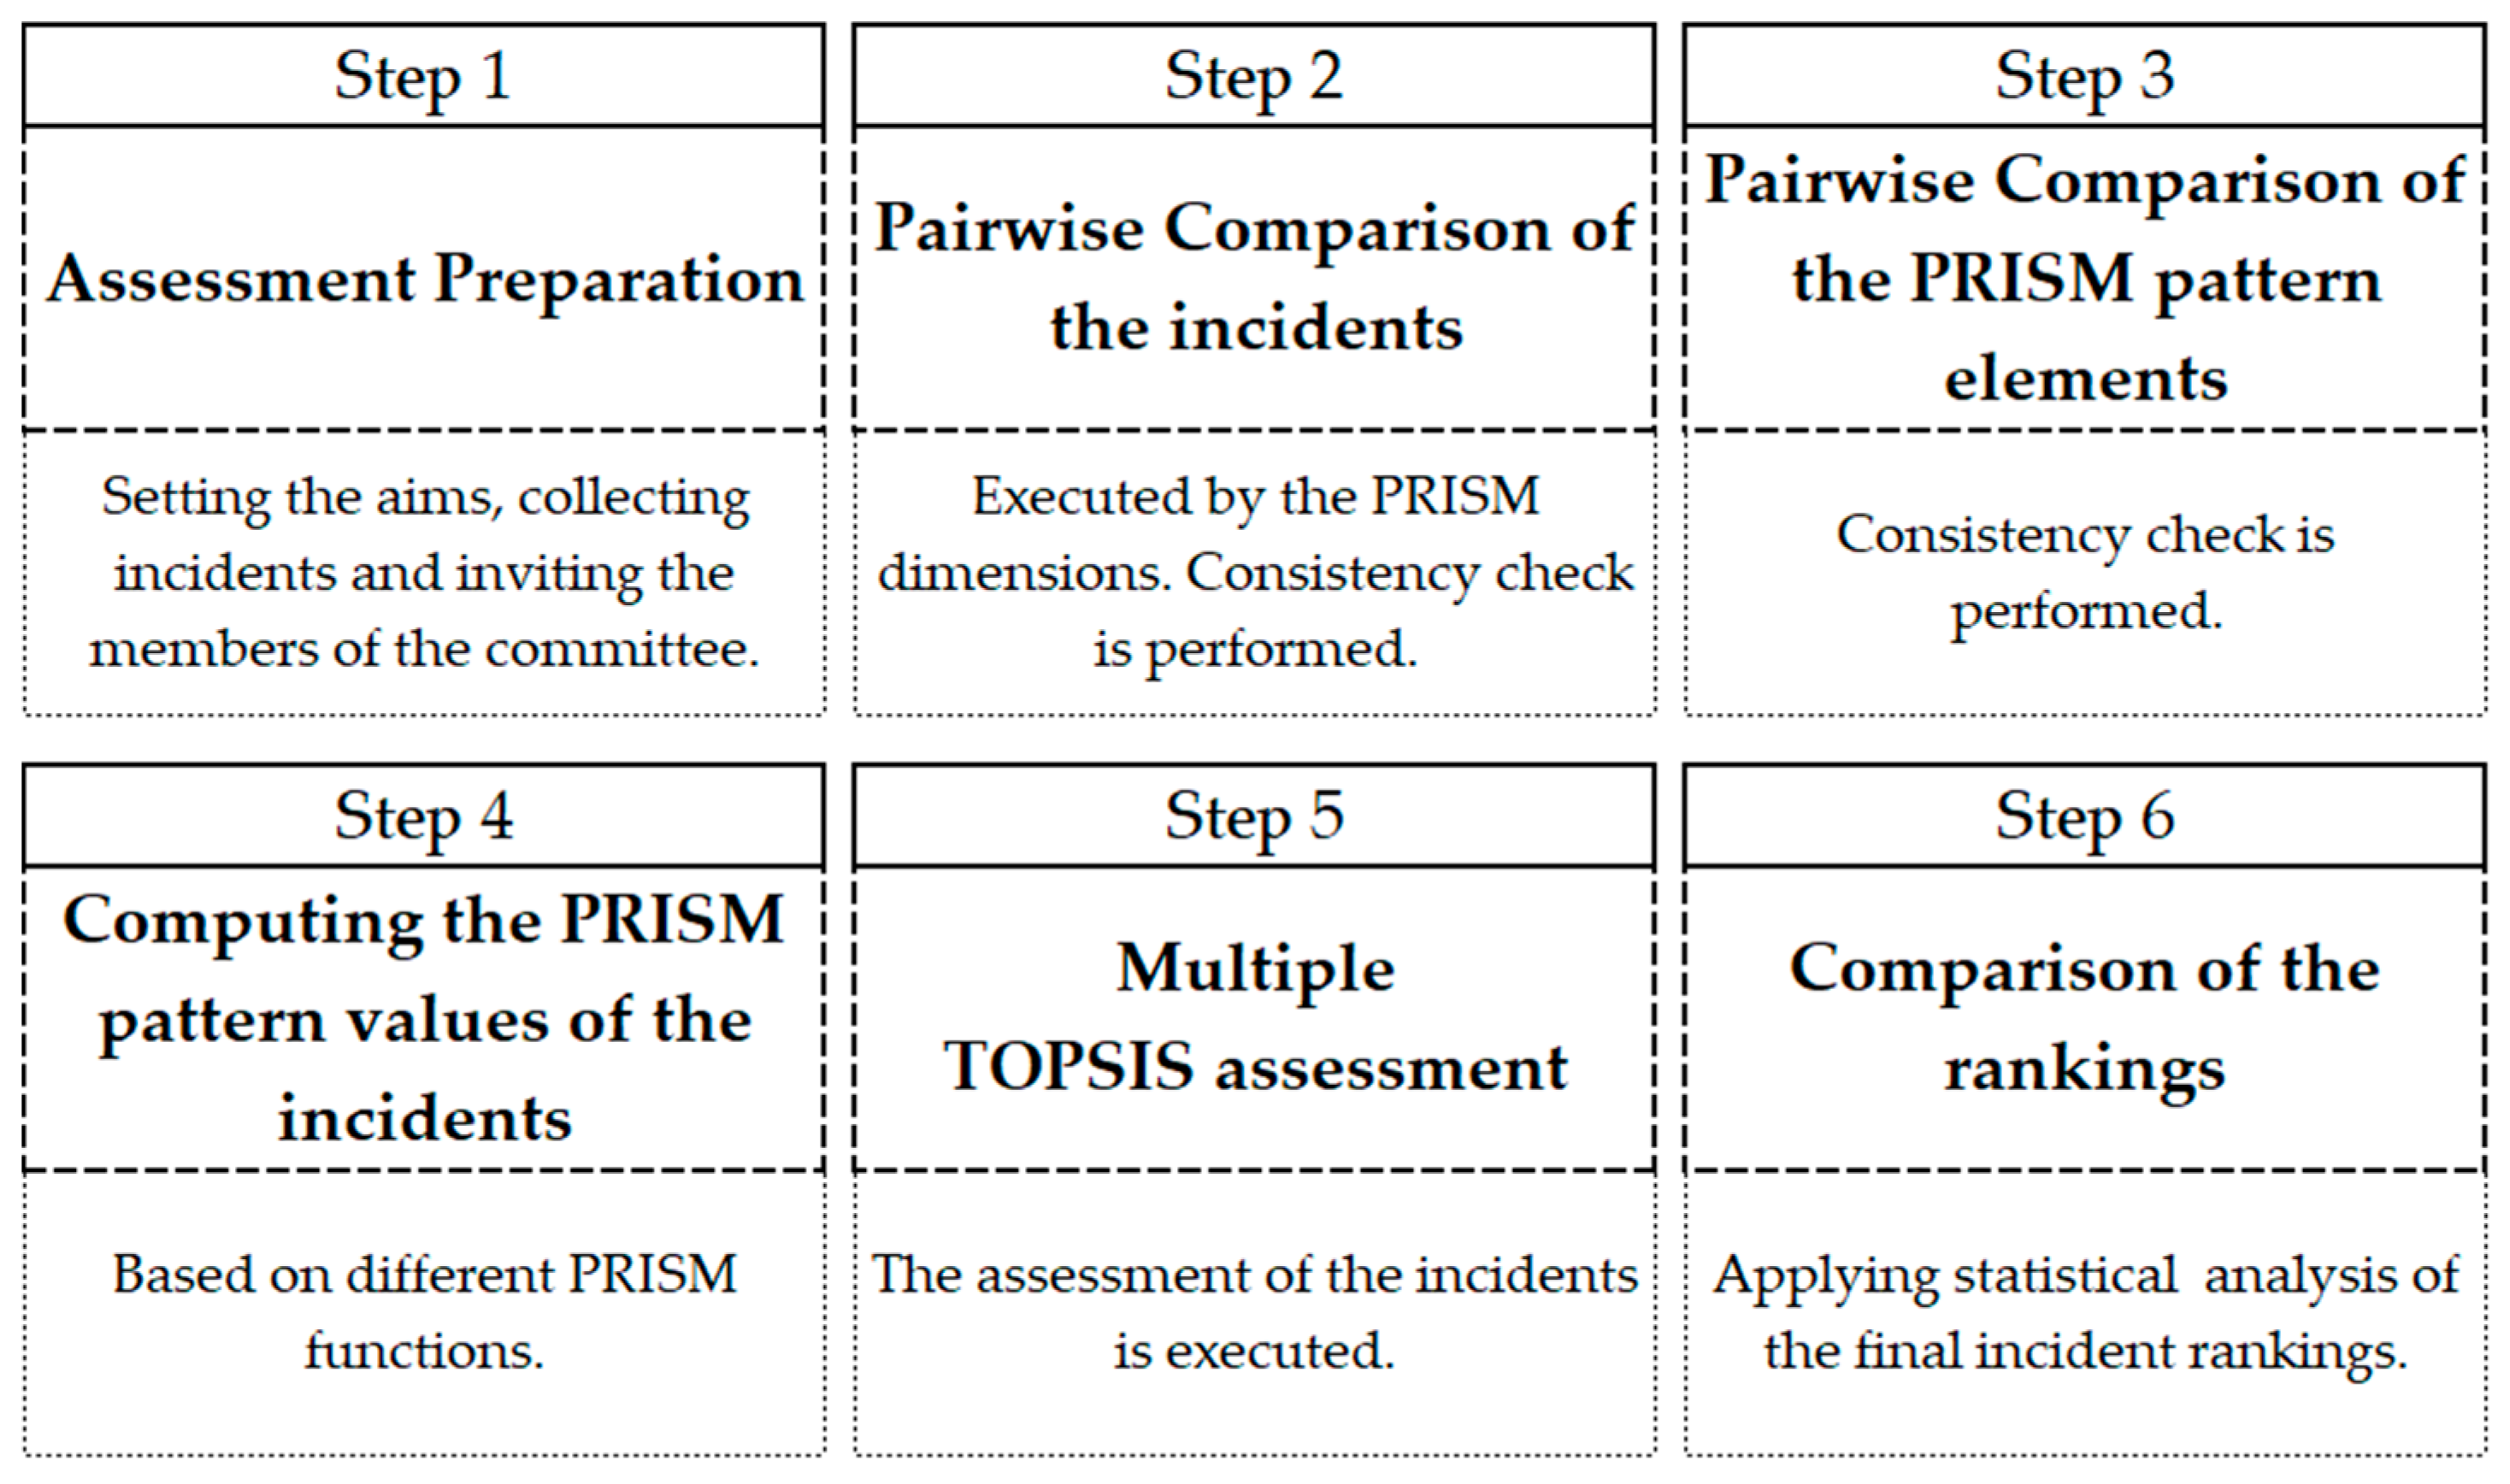
This section describes the process of the proposed AHP-TOPSIS-based PRISM risk assessment approach and the statistical methods applied for analyzing the case study results. First, the primary steps of the proposed assessment process are presented in Figure 1. Then, a detailed introduction and the critical characteristics of the process steps are presented, focusing on the quantitative characteristics and a formal description of the initial methods and the proposed assessment process.
3.1. Assessment Preparation
Based on the aim of risk assessment, some critical features of the process can be determined, including the applied methodology, the number of participants, and the number of alternatives. In the case of preliminary or first-time assessment, the problem is briefly structured in general, and further assessments are used for more intensive characterization based on the experiences of the preliminary assessment. Thus, a discussion-based focus group assessment was applied for the preliminary evaluation. The number of participants was kept within an optimal range from 3 to 14, since the proposed methodology is based on a focus group (Bloor et al. 2001; Gill et al. 2008). The number of alternatives is generally low in a preliminary assessment.
3.2. Pairwise Comparison of Incidents
The incident (alternative) comparison is based on the PRISM and AHP techniques. The initial PRISM method was used to assess the incidents related to three dimensions, just like the traditional FMEA method (Bognár and Benedek 2022b). The dimensions were as follows:
- The severity of consequences (severity) if an incident occurs (S).
- The probability of occurrence (occurrence) of the incident (O).
- The undetectability of incident occurrence (detection) (D).
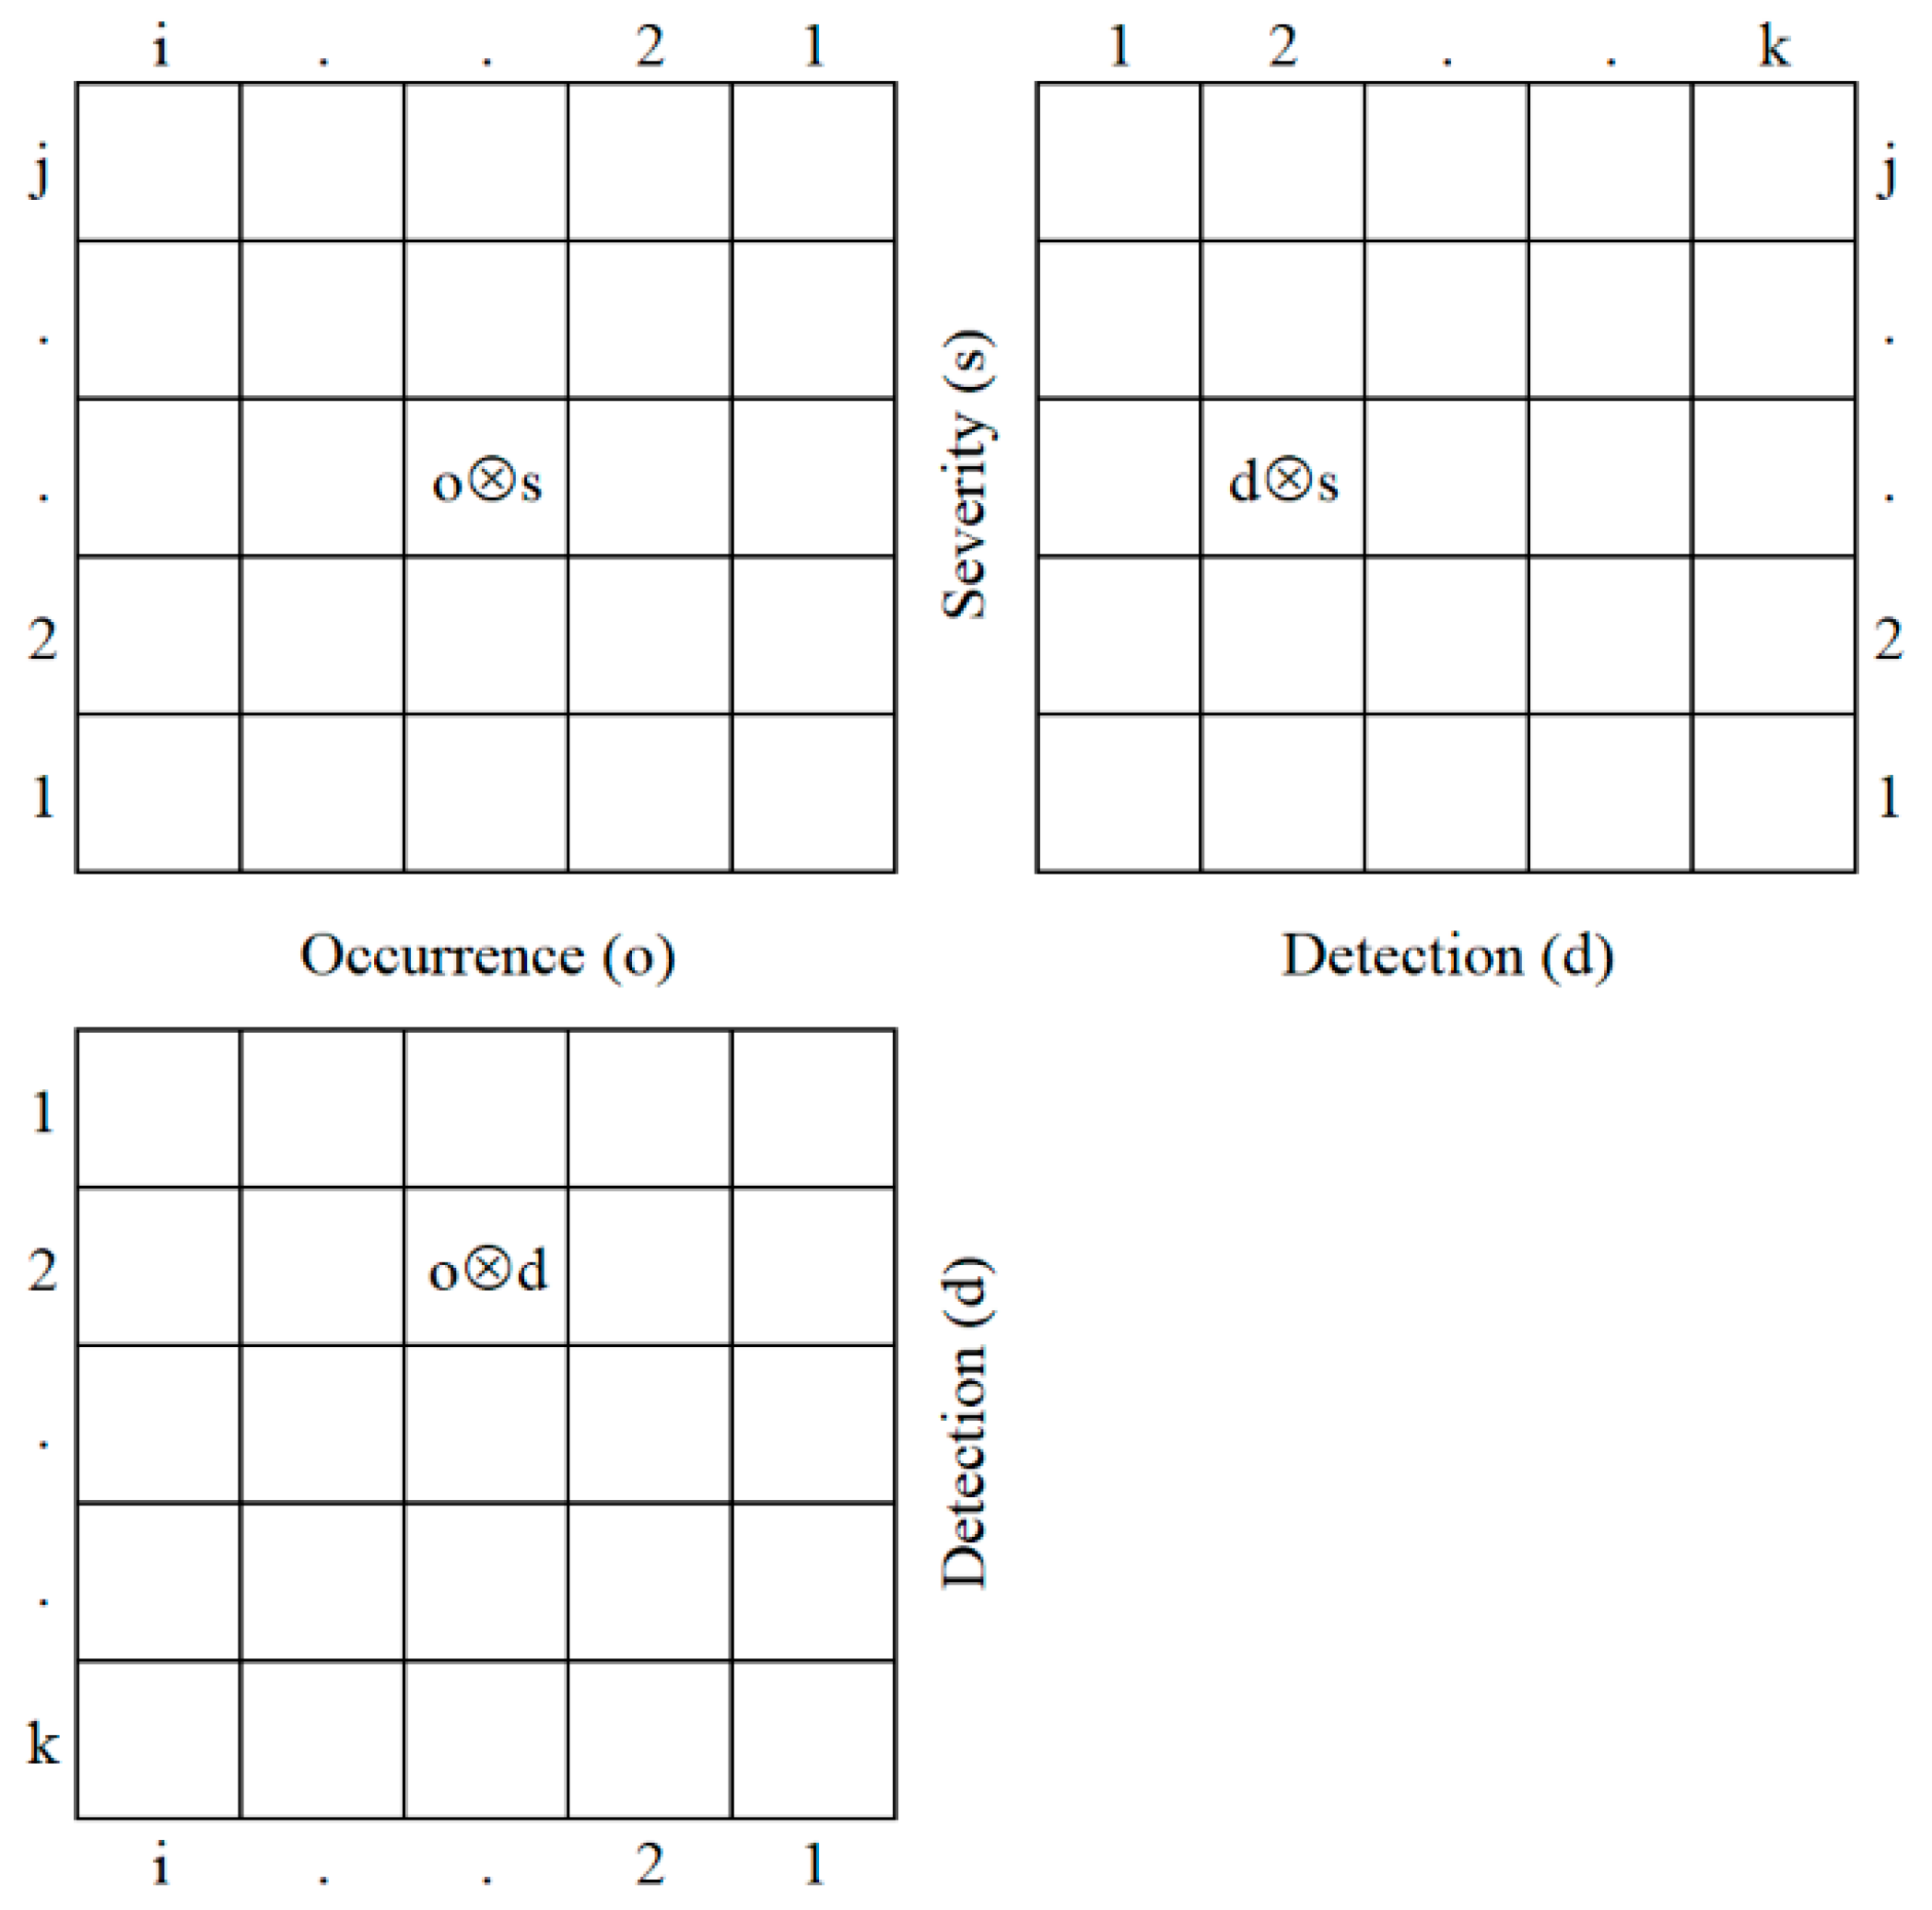
Incidents related to the PRISM dimensions are estimated first, applying the initial PRISM method. Thus, we denote as an incident with the previously described risk characteristics. The O, S, and D values can be estimated based on a deterministic scale of 1–10. The higher the value of the dimension, the higher the risk. Based on the 3 characteristics, PRISM combines the PRISM pattern of an incident. We denote as the PRISM pattern of an incident, where ⊗ is a mathematical operation (in general, addition, multiplication, or sum of squares) (Bognár and Hegedűs 2022). Thus, the PRISM pattern has 3 elements: , and . A visualization of the PRISM pattern is presented in Figure A1. In the initial PRISM method, the PRISM number of an incident can be calculated by selecting the maximal value of the 3 PRISM pattern elements.
In the proposed method, incidents are ranked based on a combined AHP-TOPSIS approach. Then, in step 2, pairwise comparison of the incidents is performed 3 times by the O, S, and D dimensions. The AHP-based pairwise comparison process, based on the work of Saaty (1980, 2008) and Menon and Ravi (2022), is briefly introduced in the following paragraphs.
Applying the judgment scores listed in Table A1, a pairwise comparison of any 2 elements can be executed. The higher the preference for an incident related to another, the higher the incident’s score; preferred incidents get an judgment score and non-preferred incidents get . The judgement matrix is represented by Table 2.
After the judgment matrix is constructed, it is normalized by applying Equation (1):
After normalization, the local weights are calculated using Equation (2), where i = 1, 2, …, n and j = 1, 2, …, n:
To evaluate consistency, the consistency vector is calculated first. We denote the consistency vector, which describes the consistency values for different incidents. After the consistency vector is calculated, the maximum eigenvalue can be calculated by Equation (3):
Then, the consistency index (CI) and consistency ratio (CR) are calculated by Equations (4) and (5) in the case of n incidents:
If CI equals 0, the pairwise comparison is evaluated consistently. RI represents the corresponding average random value of CI. The RI values are presented in Table A2. The evaluation is consistent if the CR value is not higher than 0.1. Otherwise, the problem definition should be repeated, and the preferences should be reset to improve the consistency ratio.
3.3. Pairwise Comparison of PRISM Pattern Elements
The aim is to identify the weights of severity vs. occurrence, occurrence vs. detection, and detection vs. severity aspects in the PRISM method. This step is similar to step 2, but now the and PRISM pattern elements should be compared. As a result of this step, the z weights of the PRISM pattern elements are calculated. These weights will be applied in the TOPSIS-based evaluation of alternatives in step 5.
3.4. Computing the PRISM Pattern Values of Incidents
The wi values based on Equation (2) are transformed into a 1 − x scale by applying linear transformation. This step results in o related to the occurrence dimension, s related to the severity dimension, and d related to the detection dimension. These are the PRISM weights of an incident. Based on the PRISM weights, each incident’s PRISM pattern element values can be calculated by Equations (6)–(8):
Based on Bognár and Hegedűs (2022), the calculations of PRISM pattern elements can result in different incident rankings, so the calculations are applied to test the robustness of the results in step 6.
3.5. Multiple TOPSIS Evaluation
The TOPSIS evaluation is executed in step 5. Since PRISM patterns can be calculated differently based on Equations (6)–(8), the TOPSIS evaluation is performed three times simultaneously. The steps of the TOPSIS method are introduced based on Hwang and Yoon (1981) and Menon and Ravi (2022). First, the decision matrix is constructed for the evaluation, as shown in Table 3, where mi represents the incidents, with ; Xj marks the criteria for the TOPSIS evaluation, with ; zj represents the weights of Xj criteria (see step 3), with ; and xi,j indicates the numerical outcome of the mi alternative with respect to the Xj criterion, with and .
The evaluation starts by constructing the normalized decision matrix based on Equation (9):
Then, the weighted normalized matrix is computed using Equation (10):
The ideal solution and negative-ideal solution (i.e., best and worst solutions) are calculated based on Equations (11) and (12), where is associated with beneficial criteria, while is associated with non-beneficial criteria. The maximum value of beneficial criteria and the minimum value of non-beneficial criteria are taken for , whereas the minimum value of beneficial criteria and maximum value of non-beneficial criteria are taken for .
The Euclidean distance of each alternative from the ideal solution can be calculated by Equation (13) (Menon and Ravi 2022), while the distance from the negative-ideal solution can be calculated using Equation (14):
The relative closeness to the ideal solution is calculated using Equation (15):
As a final step of the TOPSIS method, the alternatives are ranked in descending order according to .
When the criteria of the TOPSIS method are based on the PRISM dimensions, j has only three values according to the following: . All three criteria are non-beneficial ones. According to , , and , the PRISM pattern elements are calculated in three different ways. Thus, the TOPSIS evaluation is launched three times. As a result of step 5, three rankings of the incidents are provided.
3.6. Comparison of Rankings
The robustness of the risk assessment process can be identified based on a comparison of the rankings.
When measuring the association between rankings based on the data provided by , , and , Kendall’s W coefficient is calculated (Kendall 1970). As reported by Berényi et al. (2020), Kendall’s W coefficient is widely applied when the association between more than two rankings should be tested. The association between the rankings related to the data provided by vs. , , vs. , and vs. is measured with Kendall’s tau b rank correlation coefficient.
Kendall’s tau b value is −1 when the rankings have a totally negative association, 1 when the rankings are the same, and 0 when the rankings are independent. Kendall’s W value is 0 when the rankings have a totally negative association and 1 when the rankings are the same.
4. Application of the Proposed Method
The proposed approach was applied to solve a problem faced by the risk assessment committee of a European NPP in the summer of 2022. The scope of the risk assessment was to conduct a preliminary evaluation of the incoming business logistics processes of the NPP. The assessment was planned on a strategic level to identify the riskiest incident clusters that could affect the business processes of the incoming logistics.
According to step 1, 10 experts formed the risk assessment committee. A minimum of 5 years of NPP experience was required to join the committee; however, the average amount of experience was almost 13 years, and the median was 12.5 years. The assessment process was based on discussions among committee members. The main characteristics of the strategic incident group (SIG) formation were qualitative; the riskiest operative failures of the last 2 years were categorized into SIGs. The main goal of the SIG formation was to create groups with minimal overlap. Ten strategic incident groups were formed as the risk assessment subject; short descriptions of these groups can be found in Table A3, based on Bognár and Benedek (2022a). Each SIG had a primary ID, a verbal formulation, and a short description.
According to step 2, judgment matrices were constructed related to the incident clusters by severity, occurrence, and detection, and these are presented in Table A3, Table A4, Table A5, Table A6, Table A7 and Table A8. The judgment matrix related to the p(m) PRISM pattern elements based on step 3 is presented in Table A7. The consistency test results related to methodological steps 2 and 3 can be seen in Table A8. Since all CR values are lower than 0.1, the committee’s judgment matrices are consistent, and no preference resetting by the experts was needed. Thus, the weights of the SIGs related to the PRISM pattern elements and the weights of the PRISM pattern elements themselves could be calculated according to step 4. The weights of the PRISM pattern elements can be seen in Table 4. The local weights of the SIGs related to each calculation mode of the PRISM pattern elements calculated by Equations (6)–(8) are presented in Table 5.
Related to step 5 and based on Table 4 and Table 5, the decision matrix for TOPSIS analysis can be formed. Table 6 presents the normalized and weighted matrices for the multiple TOPSIS analysis, highlighting the ideal and negative-ideal solutions. The normalization was performed by Equation (9), while the matrix weighting was performed by Equation (10). Finally, the ideal and negative-ideal solutions were calculated by Equations (11) and (12).
Table 7 shows the Euclidean distance of each SIG from the ideal and negative-ideal solutions and the relative closeness to the ideal solution. Based on Table 7, the final ranking of SIGs was performed, as shown in Table 8. Step 5 ends by creating the SIG rankings.
Since the values of the PRISM pattern elements can be calculated differently by Equations (6)–(8), step 5 ends up with three rankings. Then, based on step 6, the rankings can be analyzed.
Table 9 shows the results of the rank-concordance analysis (Kendall’s W) and rank-correlation analysis of the three paired rankings. All measures are close to 1, and the significance level is close to 0 in all cases. Therefore, there is hardly any difference between the rankings. Thus, deeper analysis and risk mitigation actions can be planned based on the results of the risk assessment process. The first and second most risky SIGs are E4 and E1, so the focus should be on risk mitigation actions related to them.
5. Discussion
The PRISM method was designed to identify and emphasize the hidden risks in processes of the compliance and safety-intensive sectors. The AHP-PRISM method was developed to assess complex systems by combining the initial PRISM method with a pairwise-comparison-based MCDM technique. The role of BWM and the benefit of integrating it instead of AHP were discussed by Bognár and Benedek (2022b), and the findings are relevant to the AHP-TOPSIS-based PRISM method. Thus, in the case of an increased number of incident groups, an integrated BWM-TOPSIS-based PRISM method is a better option. For a more detailed introduction to the BWM method, see Rezaei (2015).
PRISM- and AHP-PRISM-based assessments can be performed by applying the exact weights of the evaluation dimensions without unnecessary distortion in the results. However, the role of AHP in the AHP-PRISM process is limited to assessing the alternatives, since the criteria weights should be kept equal. This is an essential limitation of both PRISM and AHP-PRISM, although the visual expressiveness of the methods is strong. Based on the advantages summarized by Shih et al. (2007) and Yang et al. (2010), the TOPSIS method was proposed for integration with AHP-PRISM to solve the problem of the same dimension weights. Applying TOPSIS, the visualization of AHP-PRISM is significantly reduced since the ranking is based on the TOPSIS approach instead of the PRISM function, which is discussed in detail by Bognár and Hegedűs (2022).
Managerial implications for application selection related to the PRISM, AHP-PRISM, and AHP-TOPSIS-PRISM methods can be addressed. The most important criteria related to applying the methods are presented in Table 10.
The following managerial implications can be formulated in practical problem-solving cases: (1) Where the weights of the assessment dimensions are equal and the assessment is based on deterministic scales, the initial PRISM method can be used, which will provide advanced visual control. (2) Where the weights of the assessment dimensions are equal and the assessment is based on pairwise comparison, the AHP-PRISM method can be used, which will provide advanced visual control. (3) When the weights of the assessment dimensions are different and the assessment is based on pairwise comparison, the AHP-TOPSIS-PRISM method can be used, which will provide moderate visual control options. As pairwise comparison techniques such as AHP are integrated, the number of alternatives should be significantly limited. Thus, integrating AHP can support practical decision-making problems at a strategic level.
The study has limitations, which can be summarized as follows. A significant limitation is that results are based on a group assessment, without detailed individual expert assessments. Thus, the agreement level of experts cannot be tested. The robustness test of the SIG rankings was performed based on only three basic PRISM functions. Adding more functions would increase the reliability of the results. Apart from the rankings formed by the PRISM method, no comparative analysis was performed with rankings by traditional methods.
Future development of the methodology has four main directions. One direction is to combine the AHP-PRISM method with MCDM methods other than TOPSIS. According to Opricovic and Tzeng (2004), the TOPSIS method determines the ideal best and worst solutions as reference points to compare the alternatives. However, unlike VIKOR, TOPSIS does not consider the relative importance of the distance from these reference points. As previously discussed, if the number of alternatives is relatively high, the AHP-TOPSIS-PRISM method can be alternated with BWM. The second direction is to develop other PRISM approaches and apply them in parallel to solve the same problem, providing validation options in practical cases where validation aspects are significant. The third direction is considering the uncertainty that can affect the assessment results. Thus, fuzzification of PRISM approaches in the future will be essential in developing expert-based assessment. Finally, a possible future development direction is to extend data collection to the individual expert level. Thus, the agreement level of experts can also be tested, which can provide more reliability for the risk management process.
6. Conclusions
The aim of this study was to describe a novel AHP-TOPSIS-based risk assessment methodology. Based on the three risk assessment dimensions of the FMEA, the initial PRISM method can help identify and visualize underestimated partial risks. The evaluation process is based on deterministic evaluation scales; hence, the data sensitivity of the method is critical. Combining the analytic hierarchy process (AHP) with the PRISM method corrects some of the disadvantages of the initial method. However, AHP-PRISM cannot solve the problem of the same factor weight of evaluation dimensions. In this study, we aimed to develop a method that allows different factor weighting of evaluation dimensions and in-depth analysis of alternatives based on ideal best and ideal worst solutions. Since TOPSIS provides efficiency in ranking compared to other methods, it was suitable for the further development of the AHP-PRISM method. Section 2 gave a brief overview of recent AHP-TOPSIS approaches widely used in the nuclear industry for complex assessments. Section 3 provided a detailed introduction and the critical characteristics of each process step of the proposed method, focusing on the quantitative characteristics and formal description of the initial methods and the proposed assessment process. Section 4 presented the method’s application by assessing the risks of SIGs in an NPP’s logistics business processes. Deeper analysis and risk mitigation actions could be planned based on the results of the risk assessment process. In practice, selecting a problem-solving method depends on assessing the dimensions and scales. Integrated AHP methods can better support the solving of practical decision-making problems when the number of alternatives is limited, such as at the strategic level.
Author Contributions
Conceptualization, methodology, formal analysis, writing—original draft preparation, writing—review and editing, visualization, project administration, F.B., B.S. and P.B. All authors have read and agreed to the published version of the manuscript.
Funding
This work has been implemented by the TKP2021-NVA-10 project with the support provided by the Ministry for Innovation and Technology of Hungary from the National Research, Development and Innovation Fund, financed under the 2021 Thematic Excellence Programme funding scheme.
Data Availability Statement
Not applicable.
Conflicts of Interest
The authors declare no conflict of interest.
Abbreviations
| AHP | Analytic hierarchy process |
| BWM | Best worst method |
| CI | Consistency index |
| CNC | Computer numerical control |
| CR | Consistency ratio |
| DEMATEL | Decision-Making Trial and Evaluation Laboratory |
| FMEA | Failure mode and effects analysis |
| FTA | Fault-tree analysis |
| MCDM | Multi-criteria decision making |
| MCDA | Multi-criteria decision analysis |
| NPP | Nuclear power plant |
| PFAHP | Pythagorean fuzzy analytic hierarchy process |
| PRISM | Partial risk map |
| RI | Random index |
| RM | Risk matrix |
| SIG | Strategic incident group |
| TOPSIS | Technique for Order Preference by Similarity to Ideal Solution |
| VIKOR | VIseKriterijumska Optimizacija i Kompromisno Resenje |
Appendix A
Figure A1.
Visualization of pattern in partial risk map (PRISM) (Bognár and Hegedűs 2022).
Figure A1.
Visualization of pattern in partial risk map (PRISM) (Bognár and Hegedűs 2022).


Table A1.
Traditional judgment scores in AHP (Menon and Ravi 2022).
Table A1.
Traditional judgment scores in AHP (Menon and Ravi 2022).
| Judgment | Score |
|---|---|
| Equal importance | 1 |
| Moderate importance | 3 |
| Strong importance | 5 |
| Demonstrated importance | 7 |
| Extreme importance | 9 |
| Intermediate values | 2, 4, 6, 8 |
Table A2.
Random indexes related to different numbers of alternatives (n) (Ok et al. 2022).
Table A2.
Random indexes related to different numbers of alternatives (n) (Ok et al. 2022).
| n | 1 | 2 | 3 | 4 | 5 | 6 | 7 | 8 | 9 | 10 |
| RI | 0 | 0 | 0.58 | 0.9 | 1.12 | 1.24 | 1.32 | 1.41 | 1.45 | 1.49 |
Appendix B
Table A3.
List of incident clusters (Bognár and Benedek 2022a).
Table A3.
List of incident clusters (Bognár and Benedek 2022a).
| ID | Strategic Incident Group Name | Description |
|---|---|---|
| E1 | Late fulfillment | Supplier partner does not meet agreed deadline but fulfills agreed obligations. Late fulfillment can cause (further) slippage of processes built on it. |
| E2 | Non-fulfillment | Supplier partner cannot meet commitments intentionally or for reasons beyond control. This risk will result in repeated work of procurement units and hinder the feasibility of plans. |
| E3 | Incorrect fulfillment | Supplier partner does not fulfill agreed quantity/quality obligations. Incorrect fulfillment hinders feasibility of plans. |
| E4 | Environmental risks | External risks on which neither supplier partner nor nuclear power plant has a direct influence. |
| E5 | Cooperation gaps | Risks are inherent in cooperation between stakeholders of logistics system and can result from both intentional and unintentional acts. |
| E6 | Issues of responsible designation | Risk arises from the designation of people responsible for specific stages of the procurement process, which may be from their knowledge/skills/skill deficiencies or impropriety of the organization’s authorization system. It does not allow completion of assigned tasks. |
| E7 | Stability issues in supply chain | Risk arises from operational problems of the supplier partner, such as a legal risk that can be considered independent of the organization (e.g., embargo) or risk arising from the economic stability of the organization. |
| E8 | Knowledge base issues | Risk is related to the knowledge base required to operate the procurement system and can arise from the intellectual competencies of contributors or the state of serving information systems. |
| E9 | Server system non-availability | Risk arises from the functionality of the logistics system, or can originate from hardware or software. |
| E10 | Performance control issues | During logistics processes, there is a failure to check the actual implementation of material, information, and money flow according to plan, resulting in documentation gaps and certifiability risks. |
Table A4.
Judgment matrix related to severity (S) dimension (Bognár and Benedek 2022a).
Table A4.
Judgment matrix related to severity (S) dimension (Bognár and Benedek 2022a).
| E1 | E2 | E3 | E4 | E5 | E6 | E7 | E8 | E9 | E10 | |
|---|---|---|---|---|---|---|---|---|---|---|
| E1 | 1 | 1/7 | 3 | 1/7 | 1 | 3 | 3 | 1 | 1 | 1/5 |
| E2 | 7 | 1 | 5 | 1/3 | 1 | 5 | 3 | 5 | 7 | 1 |
| E3 | 1/3 | 1/5 | 1 | 1/7 | 1/5 | 1 | 3 | 1/3 | 1 | 1/5 |
| E4 | 7 | 3 | 7 | 1 | 5 | 5 | 7 | 5 | 7 | 1 |
| E5 | 1 | 1 | 5 | 1/5 | 1 | 3 | 7 | 3 | 5 | 1/3 |
| E6 | 1/3 | 1/5 | 1 | 1/5 | 1/3 | 1 | 3 | 1/3 | 1/3 | 1/3 |
| E7 | 1/3 | 1/3 | 1/3 | 1/7 | 1/7 | 1/3 | 1 | 1/3 | 1/3 | 1/7 |
| E8 | 1 | 1/5 | 3 | 1/5 | 1/3 | 3 | 3 | 1 | 3 | 1/3 |
| E9 | 1 | 1/7 | 1 | 1/7 | 1/5 | 3 | 3 | 1/3 | 1 | 1/5 |
| E10 | 5 | 1 | 5 | 1 | 3 | 3 | 7 | 3 | 5 | 1 |
Table A5.
Judgment matrix related to occurrence (O) dimension (Bognár and Benedek 2022a).
Table A5.
Judgment matrix related to occurrence (O) dimension (Bognár and Benedek 2022a).
| E1 | E2 | E3 | E4 | E5 | E6 | E7 | E8 | E9 | E10 | |
|---|---|---|---|---|---|---|---|---|---|---|
| E1 | 1 | 9 | 5 | 1 | 7 | 5 | 7 | 5 | 7 | 7 |
| E2 | 1/9 | 1 | 1 | 1/9 | 1 | 1 | 3 | 1/3 | 1 | 1 |
| E3 | 1/5 | 1 | 1 | 1/5 | 3 | 3 | 3 | 5 | 5 | 3 |
| E4 | 1 | 9 | 5 | 1 | 5 | 5 | 7 | 5 | 5 | 7 |
| E5 | 1/7 | 1 | 1/3 | 1/5 | 1 | 1 | 3 | 1/3 | 5 | 3 |
| E6 | 1/5 | 1 | 1/3 | 1/5 | 1 | 1 | 1 | 1/3 | 3 | 1 |
| E7 | 1/7 | 1/3 | 1/3 | 1/7 | 1/3 | 1 | 1 | 1 | 1 | 1/3 |
| E8 | 1/5 | 3 | 1/5 | 1/5 | 3 | 3 | 1 | 1 | 3 | 3 |
| E9 | 1/7 | 1 | 1/5 | 1/5 | 1/5 | 1/3 | 1 | 1/3 | 1 | 1/3 |
| E10 | 1/7 | 1 | 1/3 | 1/7 | 1/3 | 1 | 3 | 1/3 | 3 | 1 |
Table A6.
Judgment matrix related to detection (D) dimension (Bognár and Benedek 2022a).
Table A6.
Judgment matrix related to detection (D) dimension (Bognár and Benedek 2022a).
| E1 | E2 | E3 | E4 | E5 | E6 | E7 | E8 | E9 | E10 | |
|---|---|---|---|---|---|---|---|---|---|---|
| E1 | 1 | 1 | 1/7 | 1 | 3 | 3 | 1/3 | 1/7 | 1/5 | 1/3 |
| E2 | 1 | 1 | 1/7 | 1 | 3 | 5 | 1/5 | 1/9 | 1/3 | 1/3 |
| E3 | 7 | 7 | 1 | 5 | 9 | 5 | 5 | 1 | 3 | 7 |
| E4 | 1 | 1 | 1/5 | 1 | 3 | 3 | 1/5 | 1/7 | 1/7 | 1/3 |
| E5 | 1/3 | 1/3 | 1/9 | 1/3 | 1 | 3 | 1/3 | 1/7 | 1/3 | 1 |
| E6 | 1/3 | 1/5 | 1/5 | 1/3 | 1/3 | 1 | 1/5 | 1/9 | 1/3 | 1/3 |
| E7 | 3 | 5 | 1/5 | 5 | 3 | 5 | 1 | 1/7 | 1 | 3 |
| E8 | 7 | 9 | 1 | 7 | 7 | 9 | 7 | 1 | 3 | 7 |
| E9 | 5 | 3 | 1/3 | 7 | 3 | 3 | 1 | 1/3 | 1 | 3 |
| E10 | 3 | 3 | 1/7 | 3 | 1 | 3 | 1/3 | 1/7 | 1/3 | 1 |
Table A7.
Judgment matrix related to PRISM pattern elements.
| 1 | 5 | 3 | |
| 1/5 | 1 | 1/3 | |
| 1/3 | 3 | 1 |
Table A8.
Results of consistency tests.
| O | S | D | p(m) | |
|---|---|---|---|---|
| n | 10 | 10 | 10 | 3 |
| λmax | 11.24 | 11.08 | 11.26 | 3.04 |
| CI | 0.14 | 0.12 | 0.14 | 0.02 |
| RI | 1.49 | 1.49 | 1.49 | 0.58 |
| CR | 0.09 | 0.08 | 0.09 | 0.03 |
References
- Abushark, Yoosef B., Asif Irshad Khan, Fawaz Jaber Alsolami, Abdulmohsen Almalawi, Md Mottahir Alam, Alka Agrawal, Rajeev Kumar, and Raees Ahmad Khan. 2021. Usability Evaluation through Fuzzy AHP-TOPSIS Approach: Security Requirement Perspective. Computers Materials & Continua 68: 1203–18. [Google Scholar] [CrossRef]
- Agrawal, Vivek, Nitin Seth, and Jitendra Kumar Dixit. 2022. A combined AHP–TOPSIS–DEMATEL approach for evaluating success factors of e-service quality: An experience from Indian banking industry. Electronic Commerce Research 22: 715–47. [Google Scholar] [CrossRef]
- Anand Babu, Kumba, and P. Venkataramaiah. 2015. Multi-response Optimization in Wire Electrical Discharge Machining (WEDM) of Al6061/SiCp Composite Using Hybrid Approach. Journal for Manufacturing Science and Production 15: 327–38. [Google Scholar] [CrossRef]
- Aziz, Iayla, and Ahmed Çalık. 2022. Health-care Supplier Selection using Hybrid Multicriteria Decision Making Methods: A Case Study from Morocco. Preprint. [Google Scholar] [CrossRef]
- Bafail, Omer A., and Reda M. S. Abdulaal. 2022. A Combined BWM-TOPSIS Approach versus AHP-TOPSIS Approach: An Application to Solid Waste Management. Paper presented at 3rd International Conference on Industrial Engineering and Industrial Management (IEIM), Barcelona, Spain, January 12–14; pp. 27–33. [Google Scholar] [CrossRef]
- Bakioglu, Gozde, and Ali Osman Atahan. 2021. AHP integrated TOPSIS and VIKOR methods with Pythagorean fuzzy sets to prioritize risks in self-driving vehicles. Applied Soft Computing 99: 106948. [Google Scholar] [CrossRef]
- Barrios, Miguel Angel Ortiz, Fabio De Felice, Kevin Parra Negrete, Brandon Aleman Romero, Adriana Yaruro Arenas, and Antonella Petrillo. 2016. An AHP-Topsis Integrated Model for Selecting the Most Appropriate Tomography Equipment. International Journal of Information Technology & Decision Making 15: 861–85. [Google Scholar] [CrossRef]
- Berdie, Adela Diana, Mihaela Osaci, Ionel Muscalagiu, and Cristian Barz. 2017. A combined approach of AHP and TOPSIS methods applied in the field of integrated software system. Paper presented at IOP Conference Series: Materials Science and Engineering, Volume 200, Innovative Ideas in Science 2016, Baia Mare, Romania, November 10–11; p. 012041. [Google Scholar] [CrossRef] [Green Version]
- Berényi, László, Zoltán Birkner, and Nikolett Deutsch. 2020. A Multidimensional Evaluation of Renewable and Nuclear Energy among Higher Education Students. Sustainability 12: 1449. [Google Scholar] [CrossRef] [Green Version]
- Bhutia, Pema Wangchen, and Ruben Phipon. 2012. Appication of ahp and topsis method for supplier selection problem. IOSR Journal of Engineering 2: 43–50. [Google Scholar] [CrossRef]
- Bloor, Michael, Jane Frankland, Michelle Thomas, and Kate Robson. 2001. Focus Groups in Social Research. London: Sage Publications. [Google Scholar] [CrossRef]
- Bognár, Ferenc, and Petra Benedek. 2021. A Novel Risk Assessment Methodology—A Case Study of the PRISM Methodology in a Compliance Management Sensitive Sector. Acta Polytechnica Hungarica 18: 89–108. [Google Scholar] [CrossRef]
- Bognár, Ferenc, and Petra Benedek. 2022a. A novel AHP-PRISM risk assessment method—An empirical case study in a nuclear power plant. Sustainability 14: 11023. [Google Scholar] [CrossRef]
- Bognár, Ferenc, and Petra Benedek. 2022b. Multi-Method Risk Assessment Process for Sustainable Business—A compliance research Follow-up Case Study. Acta Polytechnica Hungarica. in press. [Google Scholar]
- Bognár, Ferenc, and Csaba Hegedűs. 2022. Description and Consequences on some Aggregation functions of PRISM (Partial Risk Map) Risk Assessment Method. Mathematics 10: 676. [Google Scholar] [CrossRef]
- Braglia, Marcello. 2000. MAFMA: Multi-attribute failure mode analysis. International Journal of Quality and Reliability Management 17: 1017–33. [Google Scholar] [CrossRef] [Green Version]
- Braglia, Marcello, Marco Frosolini, and Roberto Montanari. 2003. Fuzzy TOPSIS approach for failure mode, effects and criticality analysis. Quality and Reliability Engineering International 19: 425–43. [Google Scholar] [CrossRef]
- Çalık, Ahmet, Sinan Çizmecioğlu, and Ayhan Akpınar. 2019. An integrated AHP-TOPSIS framework for determination of leading industrial sectors. Journal of Multi-Criteria Decision Analysis 26: 296–307. [Google Scholar] [CrossRef]
- Chakladar, N. D., and Samik Chakraborty. 2008. A combined TOPSIS-AHP-method-based approach for non-traditional machining processes selection. Proceedings of the Institution of Mechanical Engineers Part B: Journal of Engineering Manufacture 222: 1613–23. [Google Scholar] [CrossRef]
- Cinelli, Marc, Miłosz Kadziński, Grzegorz Miebs, Michael Gonzalez, and Roman Słowiński. 2022. Recommending multiple criteria decision analysis methods with a new taxonomy-based decision support system. European Journal of Operational Research 302: 633–51. [Google Scholar] [CrossRef]
- De Magalhães, Wauires Ribeiro, and Francisco Rodrigues Lima Junior. 2021. A model based on FMEA and Fuzzy TOPSIS for risk prioritization in industrial processes. Gestão & Produção 28: e5535. [Google Scholar] [CrossRef]
- Forgács, Anett, Judit Lukács, and Richárd Horváth. 2021. The Investigation of the Applicability of Fuzzy Rule-based Systems to Predict Economic Decision-Making. Acta Polytechnica Hungarica 18: 97–115. [Google Scholar] [CrossRef]
- Gill, Paul, Kate F. Steward, Elizabeth Treasure, and Barbara Lesley Chadwick. 2008. Methods of data collection in qualitative research: Interviews and focus groups. British Dental Journal 204: 291–95. [Google Scholar] [CrossRef]
- Hanine, Mohamed, Omar Boutkhoum, Abdessadek Tikniouine, and Tarek Agouti. 2016. Application of an integrated multi-criteria decision making AHP-TOPSIS methodology for ETL software selection. SpringerPlus 5: 263. [Google Scholar] [CrossRef] [PubMed] [Green Version]
- Hsueh, Jung-Tang, and Chun-Yueh Lin. 2017. Integrating the AHP and TOPSIS decision processes for evaluating the optimal collection strategy in reverse logistic for the TPI. International Journal of Green Energy 14: 1209–20. [Google Scholar] [CrossRef]
- Hwang, Ching-Lai, and Kwangsun Yoon. 1981. Multiple Attribute Decision Making: Methods and Applications. New York: Springer. [Google Scholar] [CrossRef]
- Hyun, K. C., Sangyoon Min, Hangseok Choi, Jeongjun Park, and In-Mo Lee. 2015. Risk analysis using fault-tree analysis (FTA) and analytic hierarchy process (AHP) applicable to shield TBM tunnels. Tunnelling and Underground Space Technology 49: 121–29. [Google Scholar] [CrossRef]
- Kendall, Maurice G. 1970. Rank Correlation Methods. London: Griffin. [Google Scholar]
- Kim, Gyutai, Chan S. Park, and K. Paul Yoon. 1997. Identifying investment opportunities for advanced manufacturing systems with comparative-integrated performance measurement. International Journal of Production Economics 50: 23–33. [Google Scholar] [CrossRef]
- Kiss, Judit, Zsolt Tibor Kosztyán, Anikó Németh, and Bognár Ferenc. 2011. Matrix-based methods for planning and scheduling maintenance projects. Paper presented at the Invest on Visualization—13th International DSM Conference, Cambridge, MA, USA, September 14–15; pp. 421–34. [Google Scholar]
- Kokoç, Melda, and Süleyman Ersöz. 2019. Comparison of AHP-TOPSIS and AHP-VIKOR Methods in Product Selection in terms of Inventory Management. International Journal of Engineering Research and Development 11: 163–72. [Google Scholar] [CrossRef]
- Kovács, Zoltán, Tibor Csizmadia, István Mihálcz, and Zsolt Tibor Kosztyán. 2022. Multipurpose Aggregation in Risk Assessment. Mathematics 10: 3166. [Google Scholar] [CrossRef]
- Kusumawardani, Renny Pradina, and Mayangsekar Agintiara. 2015. Application of Fuzzy AHP-TOPSIS Method for Decision Making in Human Resource Manager Selection Process. Procedia Computer Science 72: 638–46. [Google Scholar] [CrossRef]
- Ligus, Magdalena, and Piotr Peternek. 2018. Determination of most suitable low-emission energy technologies development in Poland using integrated fuzzy AHP-TOPSIS method. Energy Procedia 153: 101–06. [Google Scholar] [CrossRef]
- Liu, Hu-Chen. 2016. FMEA Using Fuzzy VIKOR Method. In FMEA Using Uncertainty Theories and MCDM Methods. Singapore: Springer. [Google Scholar] [CrossRef]
- Menon, Rakesh R., and V. Ravi. 2022. Using AHP-TOPSIS methodologies in the selection of sustainable suppliers in an electronics supply chain. Cleaner Materials 5: 100130. [Google Scholar] [CrossRef]
- Ok, Chi-IL, Chang-Lak Kim, Sang-Rae Moon, Hong-Sei Koo, Kee-Hoon Yun, and Sun-Kee Lee. 2022. Prioritization of radiological accident scenarios during decommissioning of nuclear power plants by risk matrix and AHP method. Annals of Nuclear Energy 175: 109239. [Google Scholar] [CrossRef]
- Opricovic, Serafim, and Gwo-Hshiung Tzeng. 2004. Compromise solution by MCDM methods: A comparative analysis of VIKOR and TOPSIS. European Journal of Operational Research 156: 445–55. [Google Scholar] [CrossRef]
- Rađenović, Žarko, and Ivana Veselinović. 2017. Integrated AHP-TOPSIS Method for the Assessment of Health Management Information Systems Efficiency. Economic Themes 55: 121–42. [Google Scholar] [CrossRef] [Green Version]
- Rahmayanti, Dina, Yumi Meuthia, Justin Albin, and Ahmad Hafizh. 2021. An integrated AHP-TOPSIS framework for determination of leading industrial sectors. Jurnal Sistem dan Manajemen Industri 5: 115–24. [Google Scholar] [CrossRef]
- Rezaei, Jafar. 2015. Best-worst multi-criteria decision-making method. Omega 53: 49–57. [Google Scholar] [CrossRef]
- Saaty, Thomas L. 1980. The Analytic Hierarchy Process. New York: McGraw-Hill. [Google Scholar]
- Saaty, Thomas L. 2008. Decision making with the analytic hierarchy process. International Journal of Services Sciences 1: 83–98. [Google Scholar] [CrossRef] [Green Version]
- Salehi, Seyedmohammad, Maghsoud Amiri, Pezhman Ghahremani, and Mohammadali Abedini. 2018. A Novel Integrated AHP-TOPSIS Model to Deal with Big Data in Group Decision Making. Paper presented at International Conference on Industrial Engineering and Operations Management, Washington, DC, USA, September 27–29; pp. 1043–53. [Google Scholar]
- Sasi, Jayaram C., and Abhijeet K. Digalwar. 2015. Application of AHP and TOPSIS Method for Supplier Selection Between India & China in Textile Industry. International Research Journal of Engineering and Technology 2: 1730–38. [Google Scholar]
- Shih, Hsu-Shih, Huan-Jyh Shyur, and E. Stanley Lee. 2007. An extension of TOPSIS for group decision making. Mathematical and Computer Modelling 45: 801–13. [Google Scholar] [CrossRef]
- Sirisawat, Pornwasin, and Tossapol Kiatcharoenpol. 2018. Fuzzy AHP-TOPSIS approaches to prioritizing solutions for reverse logistics barriers. Computers & Industrial Engineering 117: 303–18. [Google Scholar] [CrossRef]
- Situmorang, Johnny, Iman Kuntoro, Sigit Santoso, M. Subekti, and Geni Rina Sunaryo. 2018. Analysis respons to the implementation of nuclear installations safety culture using AHP-TOPSIS. Journal of Physics: Conference Series 962: 012051. [Google Scholar] [CrossRef]
- Solaiman, K., and Sadia Sharmin. 2019. BigBank: A GIS Integrated AHP-TOPSIS Based Expansion Model for Banks. Paper presented at 15th International Conference on Signal-Image Technology & Internet-Based Systems (SITIS), Sorrento, Italy, November 26–29; pp. 311–18. [Google Scholar] [CrossRef]
- Sum, R. Md. 2015. Risk Prioritisation Using The Anayltic Hierarchy Process. AIP Conference Proceedings 1691: 030028. [Google Scholar] [CrossRef]
- Supraja, S., and Pappu Kousalya. 2016. A comparative study by AHP and TOPSIS for the selection of all round excellence award. Paper presented at the International Conference on Electrical, Electronics, and Optimization Techniques (ICEEOT), Chennai, India, March 3–5; pp. 314–19. [Google Scholar] [CrossRef]
- Vimal, Jyoti, Vedansh Chaturvedi, and Ashutosh Kumar Dubey. 2012. Application of Topsis Method for Supplier Selection in Manufacturing Industry. International Journal of Research in Engineering & Applied Sciences 2: 25–35. [Google Scholar]
- Yang, Guang, Wen Jie Huang, and Lin Li Lei. 2010. Using AHP and TOPSIS Approaches in Nuclear Power Plant Equipment Supplier Selection. Key Engineering Materials 419–420: 761–64. [Google Scholar] [CrossRef]
- Yoon, S. R., S. Y. Choi, and W. I. Koc. 2015. Nuclear Fuel Cycle Analysis by Integrated AHP and TOPSIS Method Using an Equilibrium Model. Paper presented at the Korean Nuclear Society Spring Meeting, Jeju, Korea, May 7–8; p. 1CD-ROM. Available online: https://inis.iaea.org/search/search.aspx?orig_q=RN:47023547 (accessed on 26 September 2022).
- Zaman, Mobasshira. 2020. Supplier Selection Using AHP-VIKOR and AHP-TOPSIS Method: A Case Study for Bangladeshi Jute Mill of Khulna Region. SSRG International Journal of Industrial Engineering 7: 1–11. [Google Scholar] [CrossRef]
Figure 1.
Primary steps of proposed pairwise-comparison-based TOPSIS-PRISM method.

Table 1.
References of AHP-TOPSIS approach applications.
| Reference | Year | Problem | Field |
|---|---|---|---|
| Agrawal et al. (2022) | 2022 | e-service quality evaluation | banking industry |
| Aziz and Çalık (2022) | 2022 | supplier selection | healthcare |
| Bafail and Abdulaal (2022) | 2022 | recycling method selection | waste management |
| Menon and Ravi (2022) | 2022 | sustainable supplier selection | electronics industry |
| Abushark et al. (2021) | 2021 | security-requirements engineering | security engineering |
| Bakioglu and Atahan (2021) | 2021 | risk assessment | self-driving vehicles |
| Rahmayanti et al. (2021) | 2021 | industry selection | processing industry |
| Zaman (2020) | 2020 | supplier selection | mill industry |
| Çalık et al. (2019) | 2019 | economic sector selection | investment |
| Kokoç and Ersöz (2019) | 2019 | product selection | inventory management |
| Solaiman and Sharmin (2019) | 2019 | branch location problem | banking industry |
| Ligus and Peternek (2018) | 2018 | energy technology selection | energy industry |
| Salehi et al. (2018) | 2018 | vehicle technology purchasing | vehicle manufacturing |
| Sirisawat and Kiatcharoenpol (2018) | 2018 | logistics solutions ranking | electronics industry |
| Situmorang et al. (2018) | 2018 | safety culture analysis | nuclear industry |
| Berdie et al. (2017) | 2017 | technology selection | integrated software systems |
| Hsueh and Lin (2017) | 2017 | collection strategy evaluation | photovoltaic industry |
| Rađenović and Veselinović (2017) | 2017 | information system selection | electronic healthcare |
| Barrios et al. (2016) | 2016 | tomography equipment selection | healthcare |
| Hanine et al. (2016) | 2016 | ETL software selection | business intelligence |
| Supraja and Kousalya (2016) | 2016 | student selection | education |
| Anand Babu and Venkataramaiah (2015) | 2015 | process parameter optimization | production |
| Kusumawardani and Agintiara (2015) | 2015 | HRM selection | telecommunication |
| Sasi and Digalwar (2015) | 2015 | supplier selection | textile industry |
| Yoon et al. (2015) | 2015 | nuclear fuel cycle analysis | nuclear industry |
| Bhutia and Phipon (2012) | 2012 | supplier selection | manufacturing industry |
| Vimal et al. (2012) | 2012 | supplier selection | manufacturing industry |
| Yang et al. (2010) | 2010 | supplier selection | nuclear industry |
| Chakladar and Chakraborty (2008) | 2008 | machining process selection | production |
Table 2.
Judgment matrix in the case of n alternatives.
| O/S/D | m1 | m2 | mn |
|---|---|---|---|
| m1 | a11 | a12 | a1n |
| m2 | a21 | a22 | a2n |
| mn | an1 | an2 | ann |
Table 3.
TOPSIS decision matrix.
| X1 | X2 | Xj | Xn | |
|---|---|---|---|---|
| z1 | z2 | zj | zn | |
| m1 | x11 | x12 | x1j | x1,n |
| m2 | x21 | x22 | x2j | x2,n |
| mi | xi1 | xi2 | xij | xi,n |
| mm | xm1 | xm2 | xmj | xm,n |
Table 4.
Weights of PRISM pattern elements.
| zj | 0.33 | 0.106 | 0.26 |
Table 5.
Local weights of SIGs.
| p(m) | E1 | E2 | E3 | E4 | E5 | E6 | E7 | E8 | E9 | E10 | |
|---|---|---|---|---|---|---|---|---|---|---|---|
| 5.5 | 4.0 | 3.2 | 7.8 | 3.6 | 2.4 | 2.0 | 3.2 | 2.3 | 4.2 | ||
| 5.2 | 2.5 | 5.7 | 5.0 | 2.5 | 2.2 | 3.0 | 5.6 | 3.1 | 2.6 | ||
| 2.7 | 4.1 | 4.8 | 5.2 | 3.2 | 2.2 | 2.9 | 5.5 | 3.3 | 4.4 | ||
| 5.8 | 3.4 | 2.3 | 15.3 | 3.0 | 1.4 | 1.0 | 2.5 | 1.3 | 3.6 | ||
| 4.9 | 1.5 | 7.4 | 4.7 | 1.6 | 1.2 | 2.0 | 6.5 | 2.1 | 1.7 | ||
| 1.8 | 3.6 | 4.2 | 4.9 | 2.4 | 1.2 | 1.9 | 6.1 | 2.6 | 4.3 | ||
| 18.1 | 9.5 | 5.4 | 30.6 | 6.6 | 2.9 | 2.1 | 5.0 | 2.6 | 10.4 | ||
| 17.5 | 3.1 | 17.5 | 16.1 | 3.3 | 2.5 | 4.9 | 18.7 | 5.3 | 3.5 | ||
| 3.6 | 9.6 | 14.7 | 17.5 | 5.8 | 2.4 | 4.8 | 18.3 | 5.9 | 11.0 | ||
Table 6.
Normalized and weighted decision matrix.
| p(m) | |||||||||
|---|---|---|---|---|---|---|---|---|---|
| zj | 0.633 | 0.106 | 0.26 | 0.633 | 0.106 | 0.26 | 0.633 | 0.106 | 0.26 |
| E1 | 0.26 | 0.04 | 0.05 | 0.21 | 0.04 | 0.04 | 0.29 | 0.05 | 0.03 |
| E2 | 0.19 | 0.02 | 0.08 | 0.12 | 0.01 | 0.08 | 0.15 | 0.01 | 0.07 |
| E3 | 0.15 | 0.05 | 0.10 | 0.08 | 0.06 | 0.10 | 0.09 | 0.05 | 0.11 |
| E4 | 0.38 | 0.04 | 0.11 | 0.54 | 0.04 | 0.11 | 0.49 | 0.05 | 0.13 |
| E5 | 0.17 | 0.02 | 0.07 | 0.11 | 0.01 | 0.05 | 0.11 | 0.01 | 0.04 |
| E6 | 0.12 | 0.02 | 0.04 | 0.05 | 0.01 | 0.03 | 0.05 | 0.01 | 0.02 |
| E7 | 0.10 | 0.03 | 0.06 | 0.04 | 0.02 | 0.04 | 0.03 | 0.01 | 0.04 |
| E8 | 0.15 | 0.05 | 0.11 | 0.09 | 0.05 | 0.14 | 0.08 | 0.05 | 0.14 |
| E9 | 0.11 | 0.03 | 0.07 | 0.04 | 0.02 | 0.06 | 0.04 | 0.02 | 0.04 |
| E10 | 0.20 | 0.02 | 0.09 | 0.13 | 0.01 | 0.10 | 0.17 | 0.01 | 0.08 |
| 0.10 | 0.02 | 0.04 | 0.04 | 0.01 | 0.03 | 0.03 | 0.01 | 0.02 | |
| 0.38 | 0.05 | 0.11 | 0.54 | 0.06 | 0.14 | 0.49 | 0.05 | 0.14 | |
Table 7.
Distances from ideal and negative-ideal solutions and relative closeness to ideal solution.
Table 7.
Distances from ideal and negative-ideal solutions and relative closeness to ideal solution.
| E1 | 0.166 | 0.129 | 0.436 | 0.172 | 0.351 | 0.671 | 0.259 | 0.228 | 0.469 |
| E2 | 0.104 | 0.186 | 0.642 | 0.101 | 0.427 | 0.809 | 0.130 | 0.346 | 0.727 |
| E3 | 0.081 | 0.225 | 0.735 | 0.096 | 0.463 | 0.828 | 0.115 | 0.403 | 0.777 |
| E4 | 0.286 | 0.008 | 0.028 | 0.513 | 0.037 | 0.066 | 0.470 | 0.010 | 0.021 |
| E5 | 0.076 | 0.212 | 0.736 | 0.076 | 0.445 | 0.854 | 0.076 | 0.397 | 0.839 |
| E6 | 0.017 | 0.272 | 0.943 | 0.014 | 0.507 | 0.974 | 0.012 | 0.461 | 0.974 |
| E7 | 0.017 | 0.284 | 0.944 | 0.019 | 0.516 | 0.965 | 0.019 | 0.467 | 0.960 |
| E8 | 0.092 | 0.224 | 0.709 | 0.132 | 0.454 | 0.775 | 0.138 | 0.408 | 0.747 |
| E9 | 0.027 | 0.273 | 0.911 | 0.034 | 0.507 | 0.937 | 0.029 | 0.458 | 0.941 |
| E10 | 0.114 | 0.178 | 0.610 | 0.115 | 0.419 | 0.784 | 0.147 | 0.330 | 0.691 |
Table 8.
Final rankings of multiple TOPSIS analysis.
| p(m) | E1 | E2 | E3 | E4 | E5 | E6 | E7 | E8 | E9 | E10 |
|---|---|---|---|---|---|---|---|---|---|---|
| 2 | 4 | 6 | 1 | 7 | 9 | 10 | 5 | 8 | 3 | |
| 2 | 5 | 6 | 1 | 7 | 10 | 9 | 3 | 8 | 4 | |
| 2 | 4 | 6 | 1 | 7 | 10 | 9 | 5 | 8 | 3 |
Table 9.
Result of rank-concordance and rank-correlation analyses.
| P(m) | Kendall’s W | |||
|---|---|---|---|---|
| value | 0.978 | 0.867 | 0.956 | 9.111 |
| sig. | 0.002 | 0.000 | 0.000 | 0.000 |
Table 10.
Criteria for method selection.
| Method | Weights of Assessment Dimensions | Measurement Mode | Visual Support | Decision Level | Number of Alternatives |
|---|---|---|---|---|---|
| PRISM | same | deterministic scales | relevant | operative | many |
| AHP-PRISM | same | pairwise comparison | relevant | strategic | reduced |
| AHP-TOPSIS-PRISM | different | pairwise comparison | non-relevant | strategic | reduced |
Publisher’s Note: MDPI stays neutral with regard to jurisdictional claims in published maps and institutional affiliations. |
© 2022 by the authors. Licensee MDPI, Basel, Switzerland. This article is an open access article distributed under the terms and conditions of the Creative Commons Attribution (CC BY) license (https://creativecommons.org/licenses/by/4.0/).
Share and Cite
MDPI and ACS Style
Bognár, F.; Szentes, B.; Benedek, P. Development of the PRISM Risk Assessment Method Based on a Multiple AHP-TOPSIS Approach. Risks 2022, 10, 213. https://doi.org/10.3390/risks10110213
AMA Style
Bognár F, Szentes B, Benedek P. Development of the PRISM Risk Assessment Method Based on a Multiple AHP-TOPSIS Approach. Risks. 2022; 10(11):213. https://doi.org/10.3390/risks10110213
Chicago/Turabian StyleBognár, Ferenc, Balázs Szentes, and Petra Benedek. 2022. "Development of the PRISM Risk Assessment Method Based on a Multiple AHP-TOPSIS Approach" Risks 10, no. 11: 213. https://doi.org/10.3390/risks10110213
Note that from the first issue of 2016, this journal uses article numbers instead of page numbers. See further details here.