
MCDM Model for Evaluating and Selecting the Optimal Facility Layout Design: A Case Study on Railcar Manufacturing
 and
and
Abstract
:
1. Introduction
2. Literature Review
- (a)
- Minimise the cost of moving finished goods, raw materials, parts, tools, and works in progress between departments.
- (b)
- Facilitate the flow of traffic.
- (c)
- Increase employee morale.
- (d)
- Minimise the risk of personnel injuries and damage to property.
- (e)
- Where necessary, provide supervision and face-to-face communication.
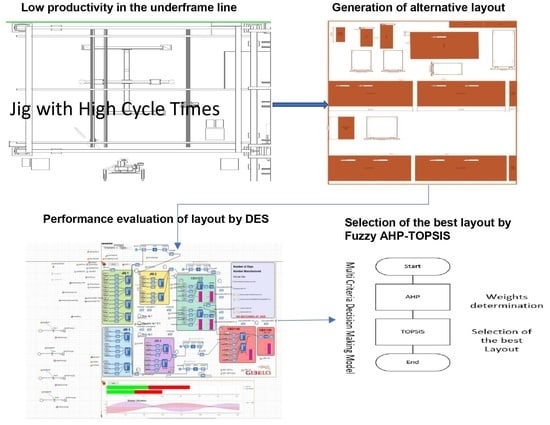
3. Problem Statement
- (1)
- How could the DES model be applied to provide the necessary KPIs to be used as criteria in selecting the best layout configuration for the underframe production line?
- (2)
- How could the quantitative KPIs from DES enhance pairwise comparison in the developed fuzzy AHP-TOPSIS methodology for selecting the best layout configuration?
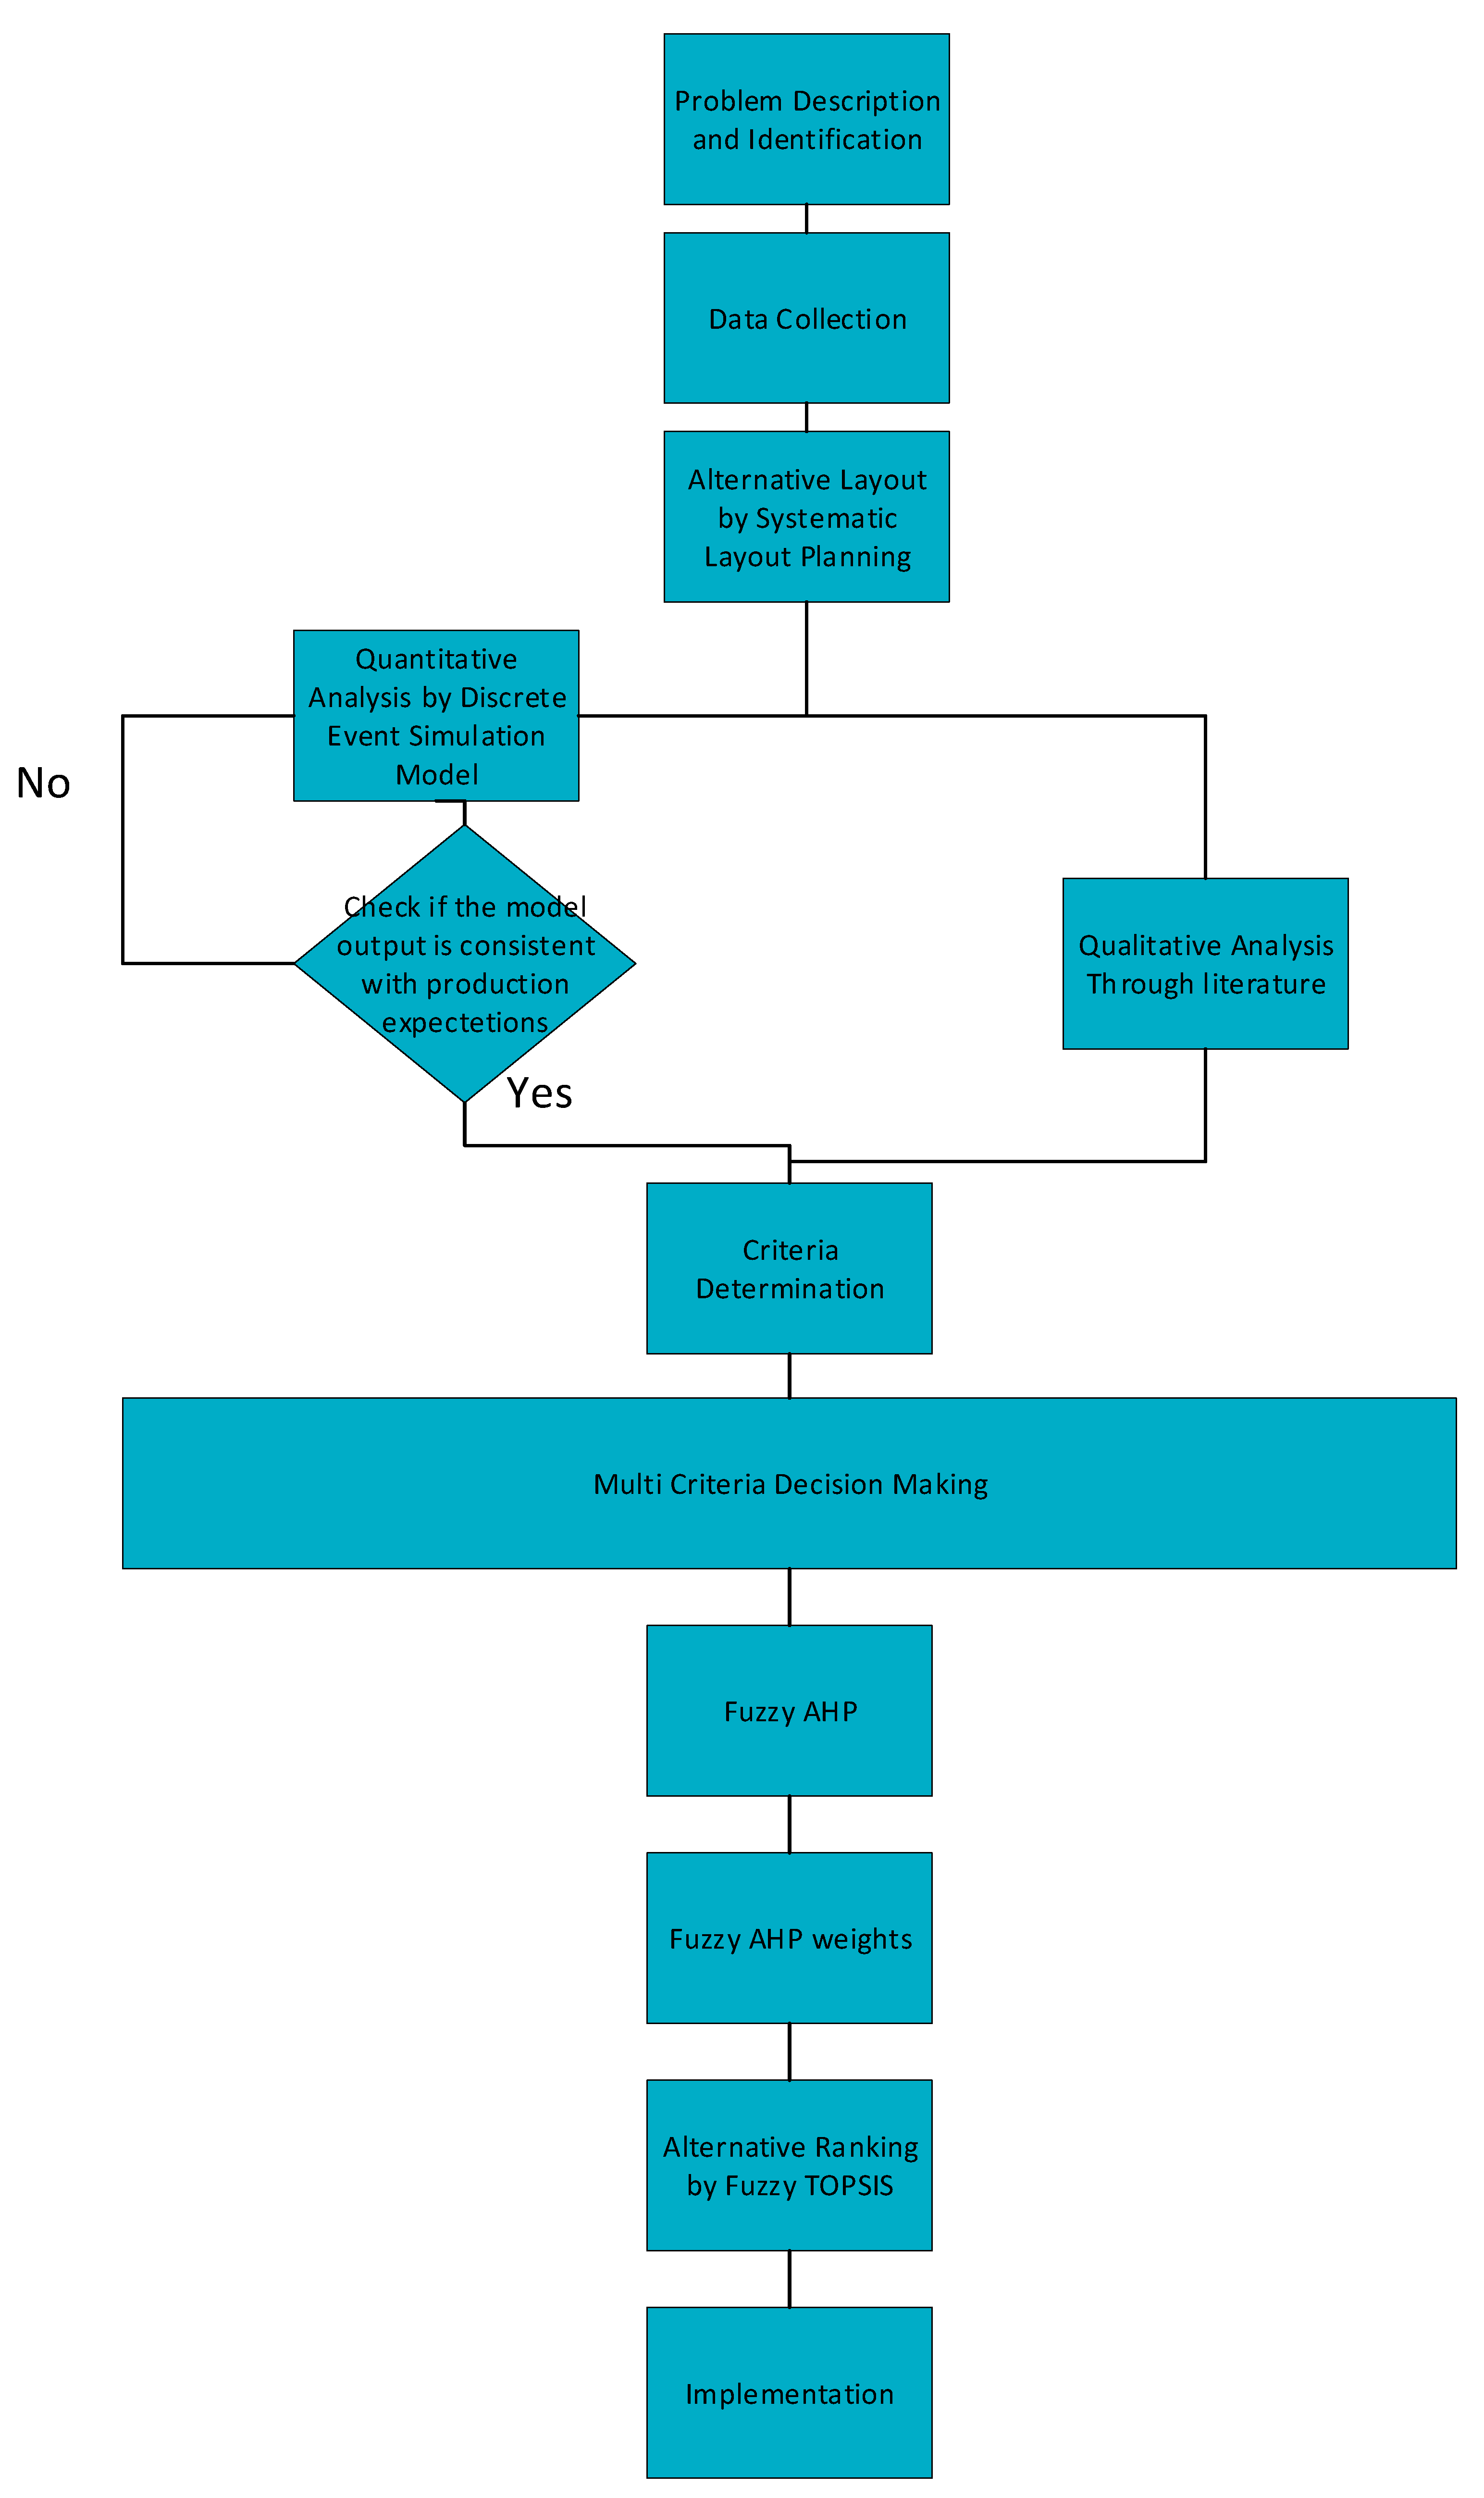
4. Materials and Methods
4.1. Proposed Fuzzy AHP-TOPSIS Method to Evaluate Layout Design Concepts
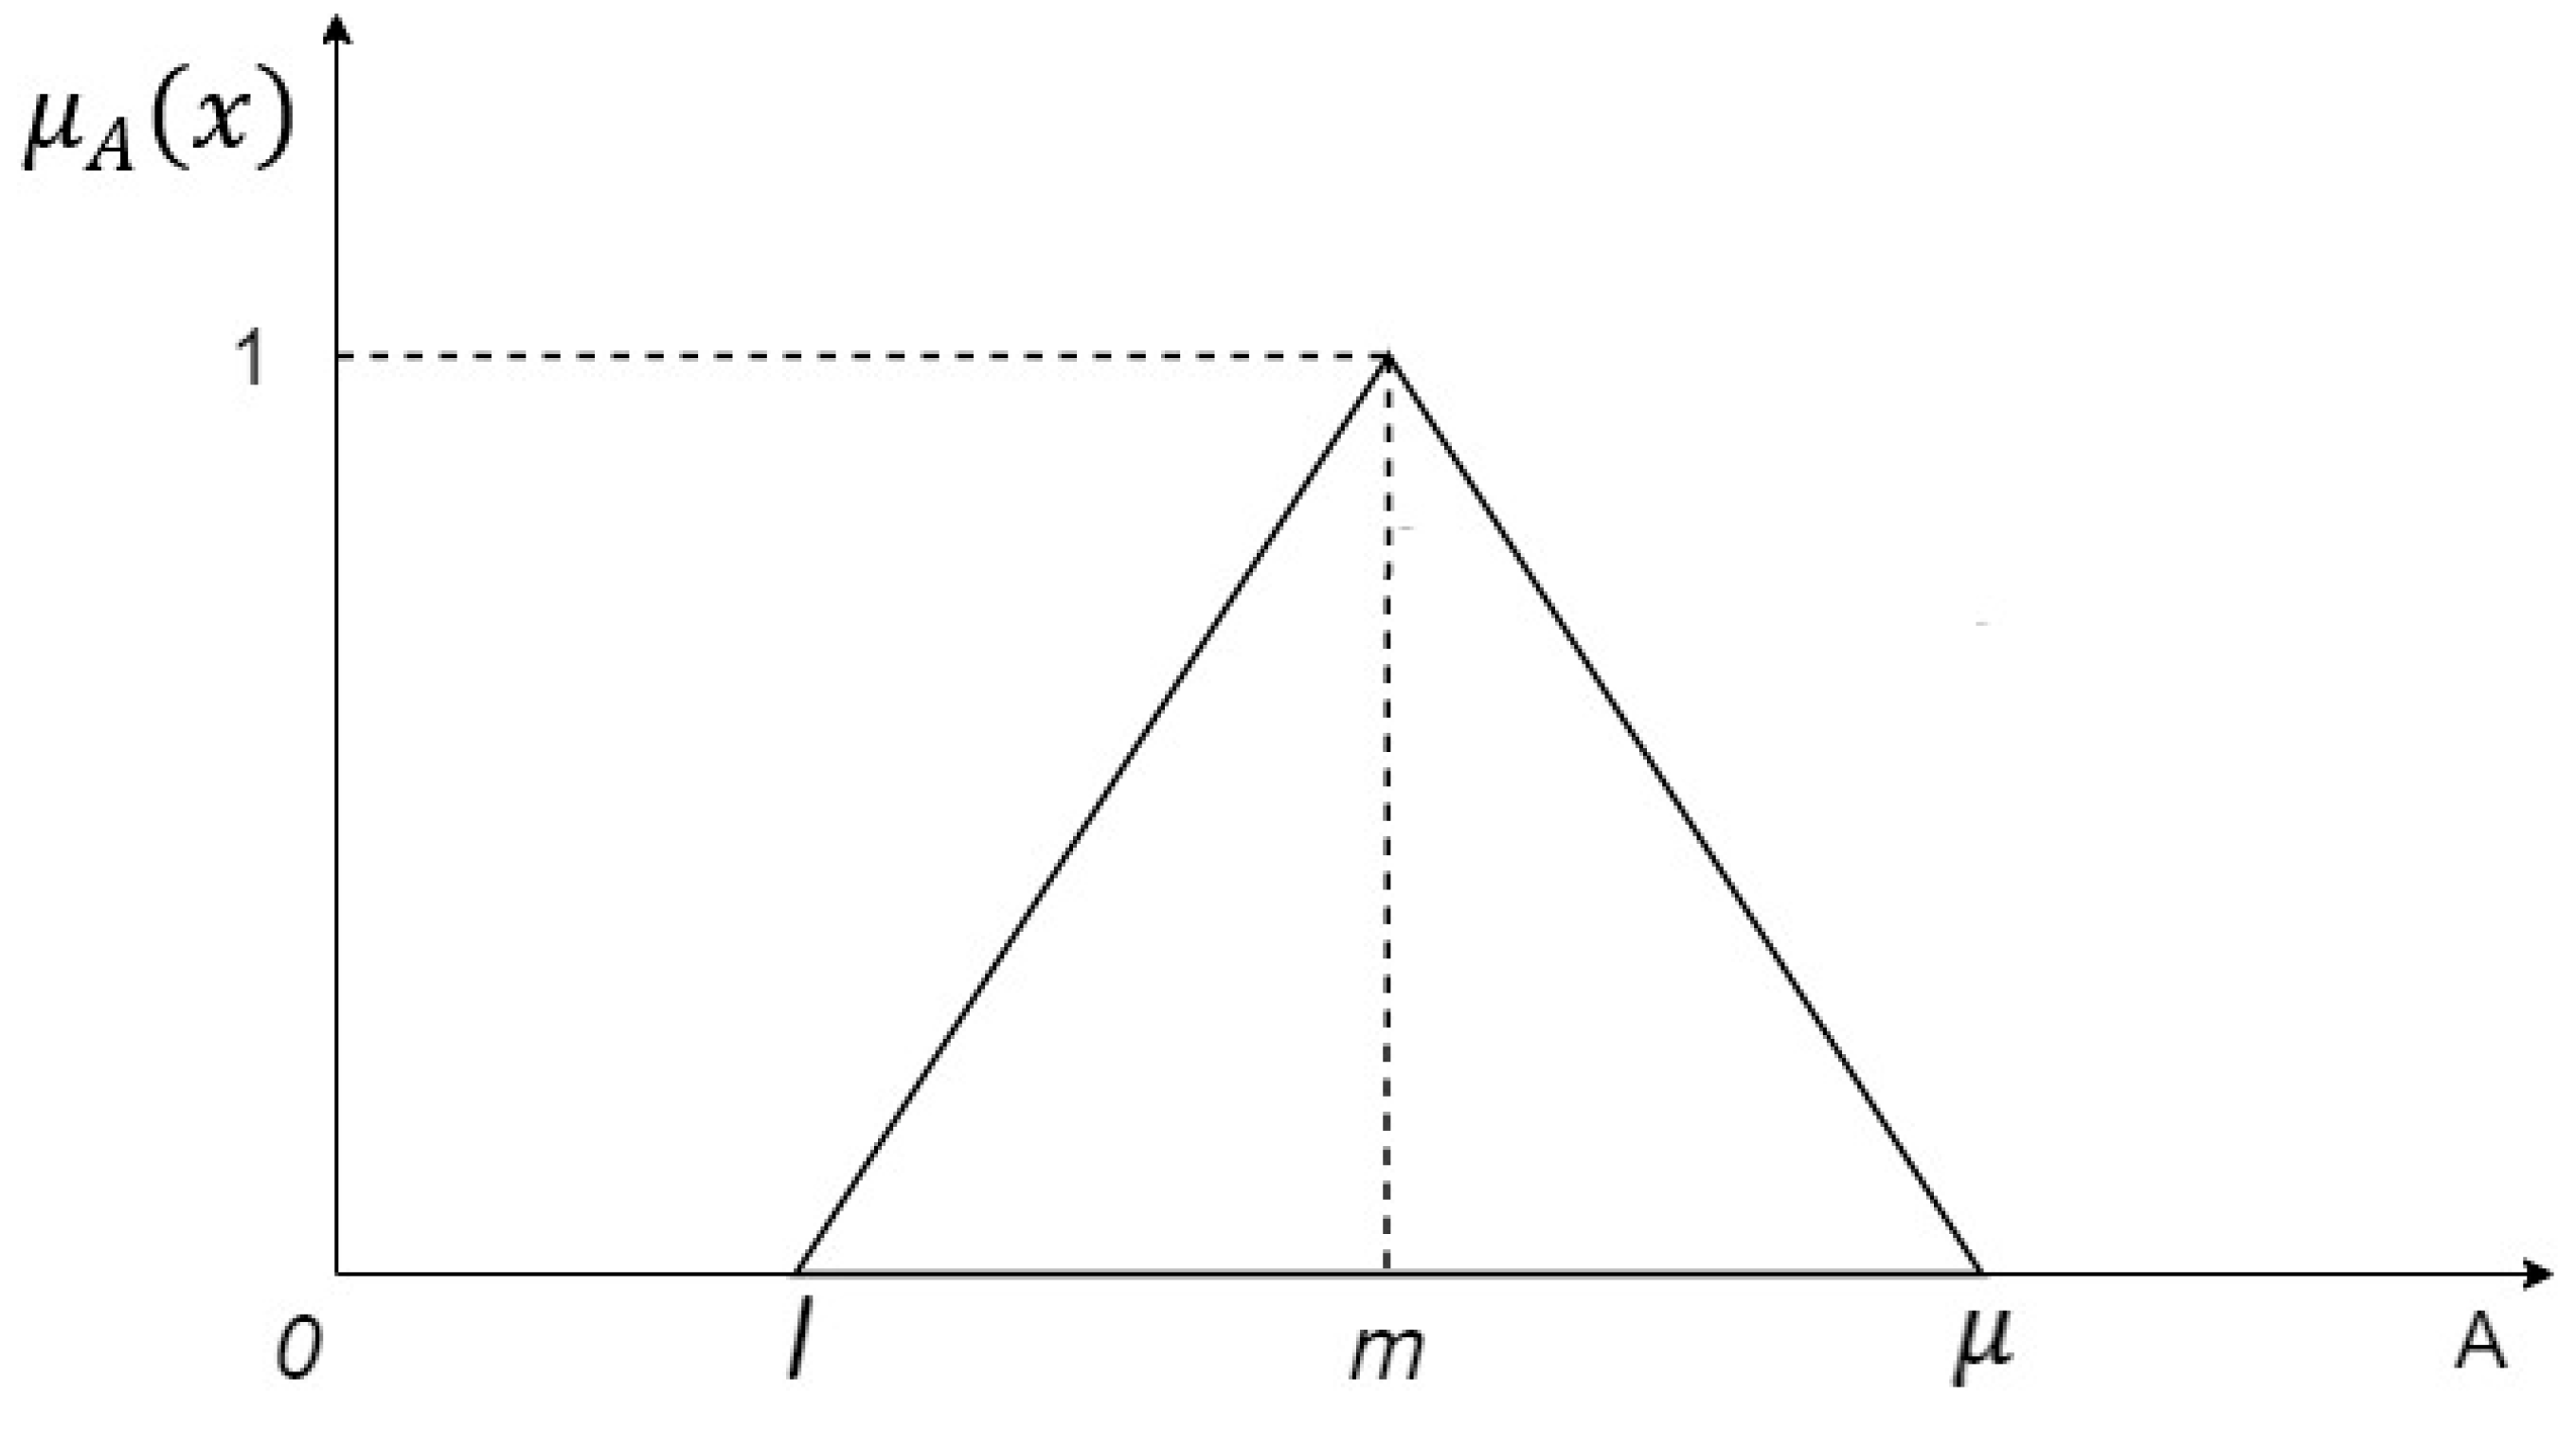
4.2. Fuzzy AHP Technique
- The classification of the overall goal of the decision, criteria, and alternatives in a hierarchical structure;
- The construction of comparative judgment matrices by pairwise comparisons based on the decision makers’ preferences using the scale;
- Determination of the weights;
- Compute the consistency ratio.
4.3. Fuzzy TOPSIS Technique
5. Railcar Industrial Case Study
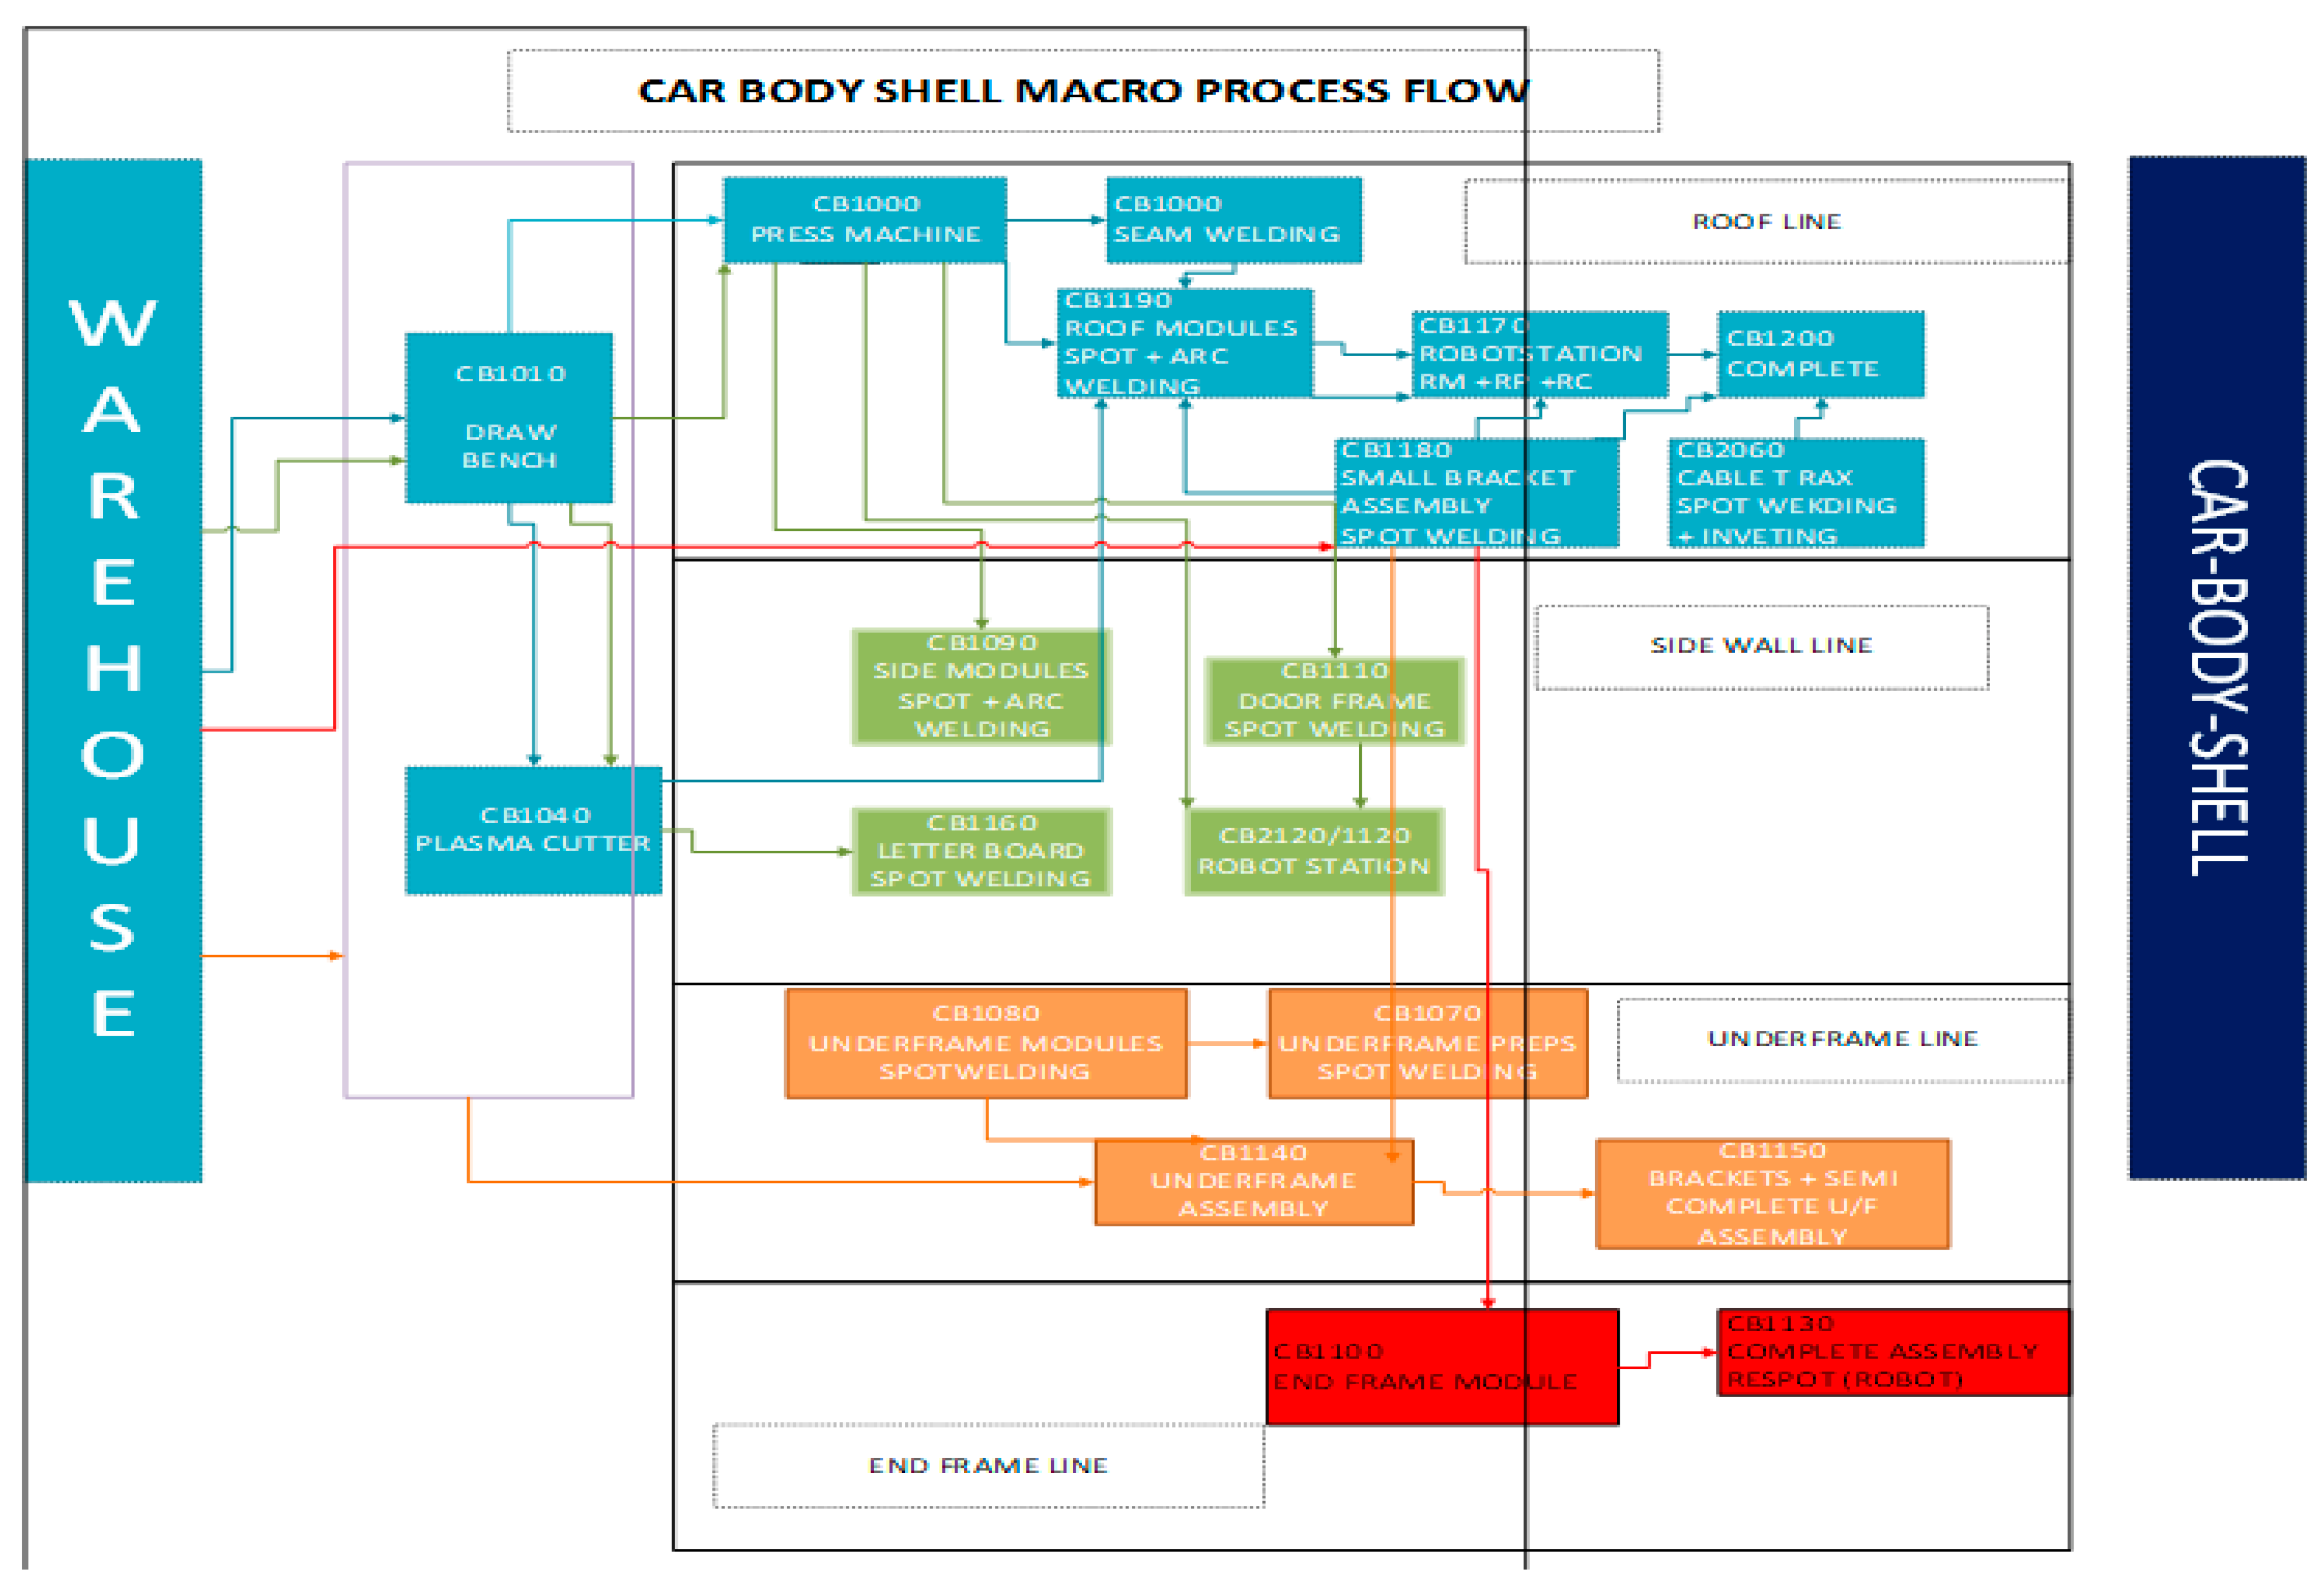
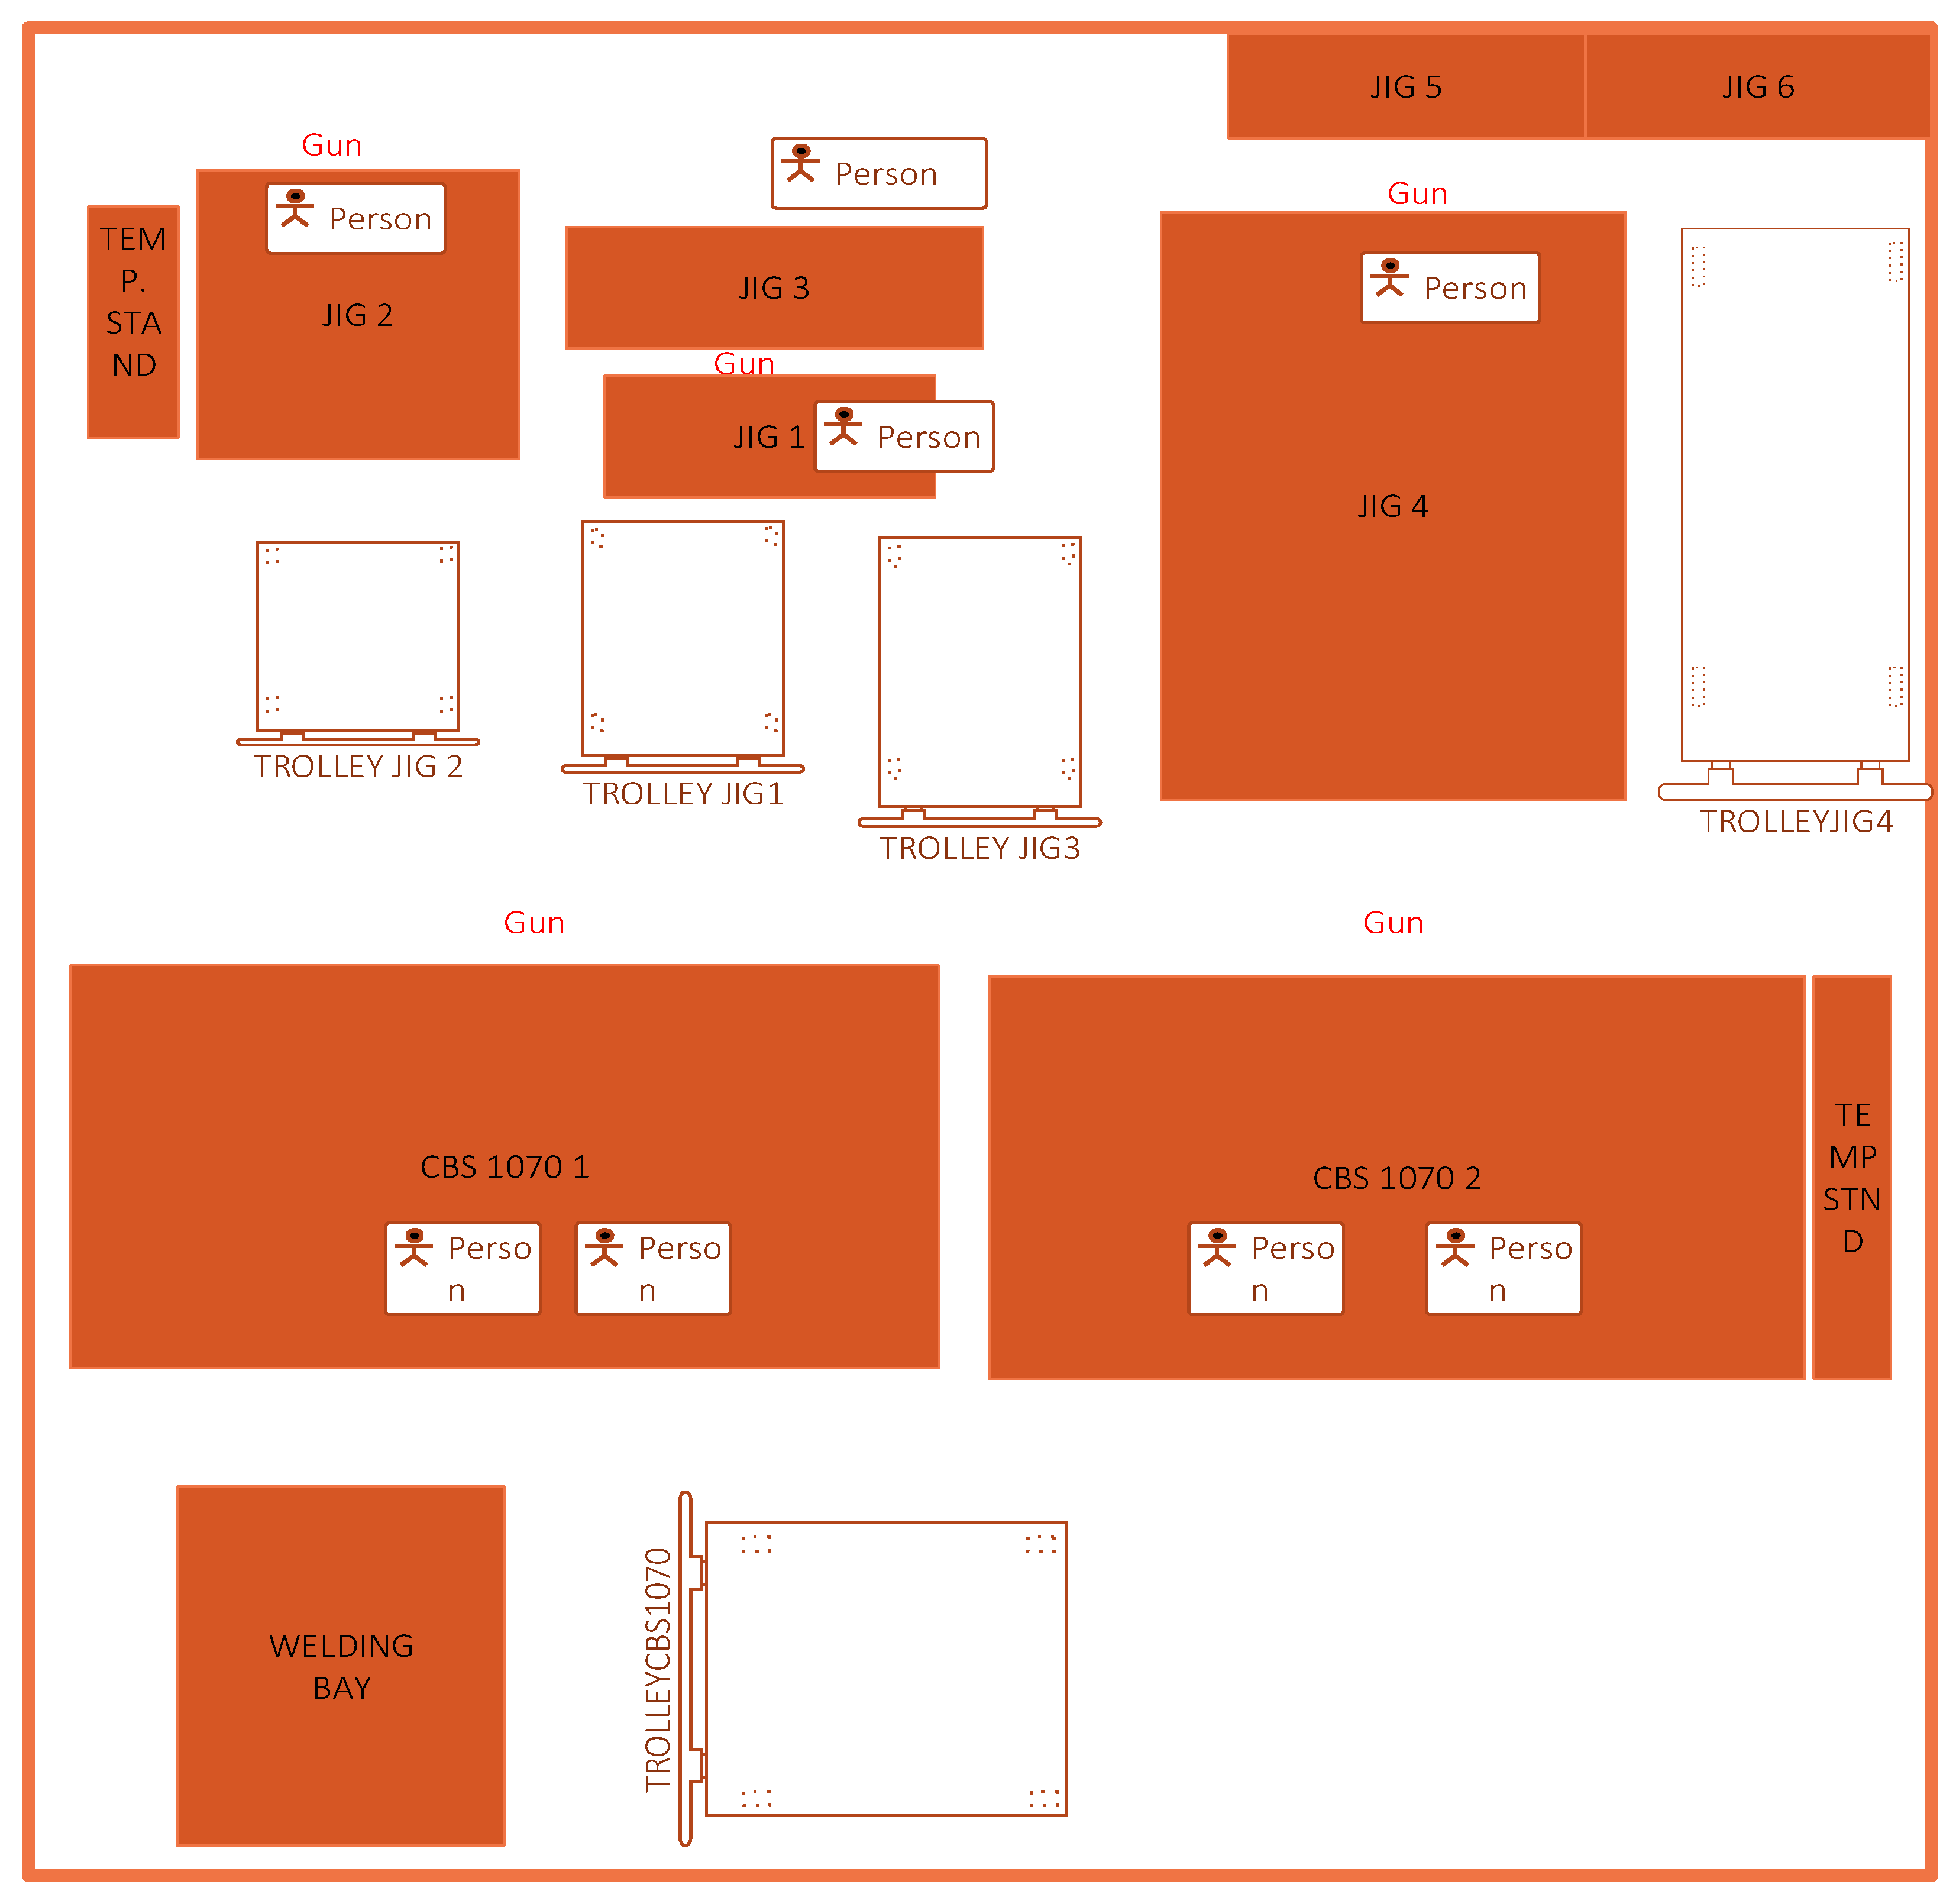
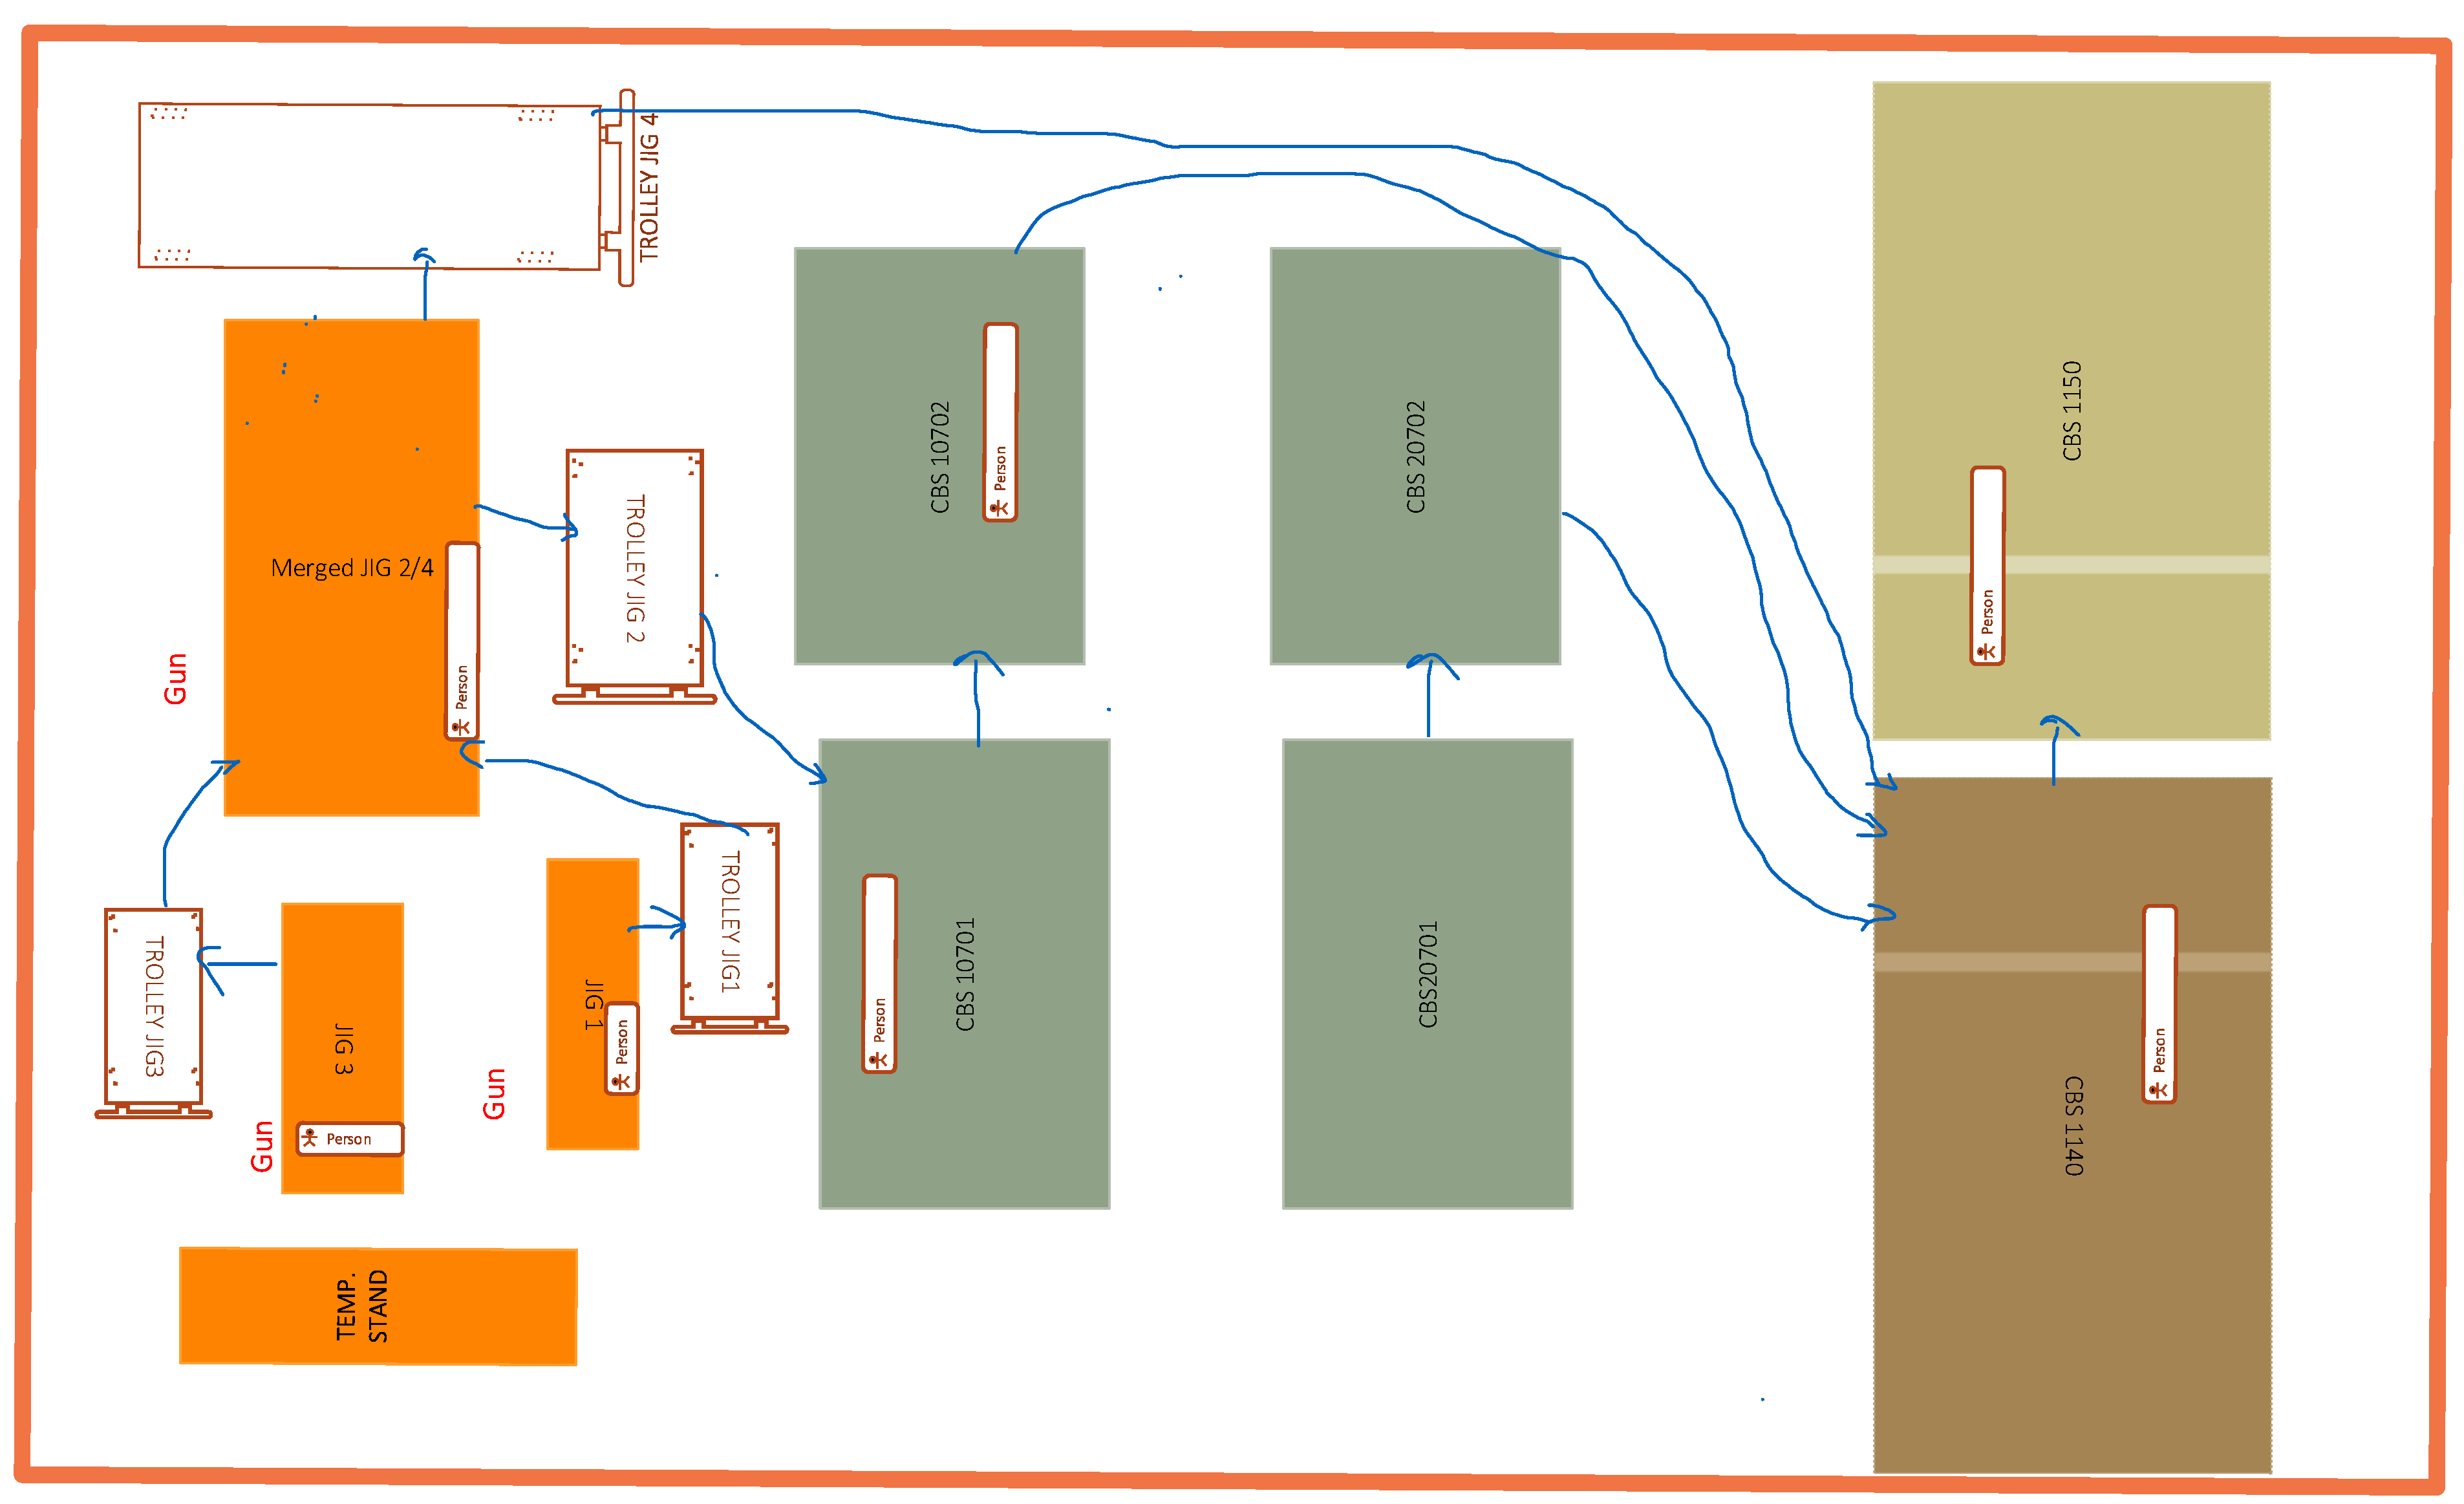
5.1. Description of the Underframe Production System
5.2. Concept Generation for DES Simulation
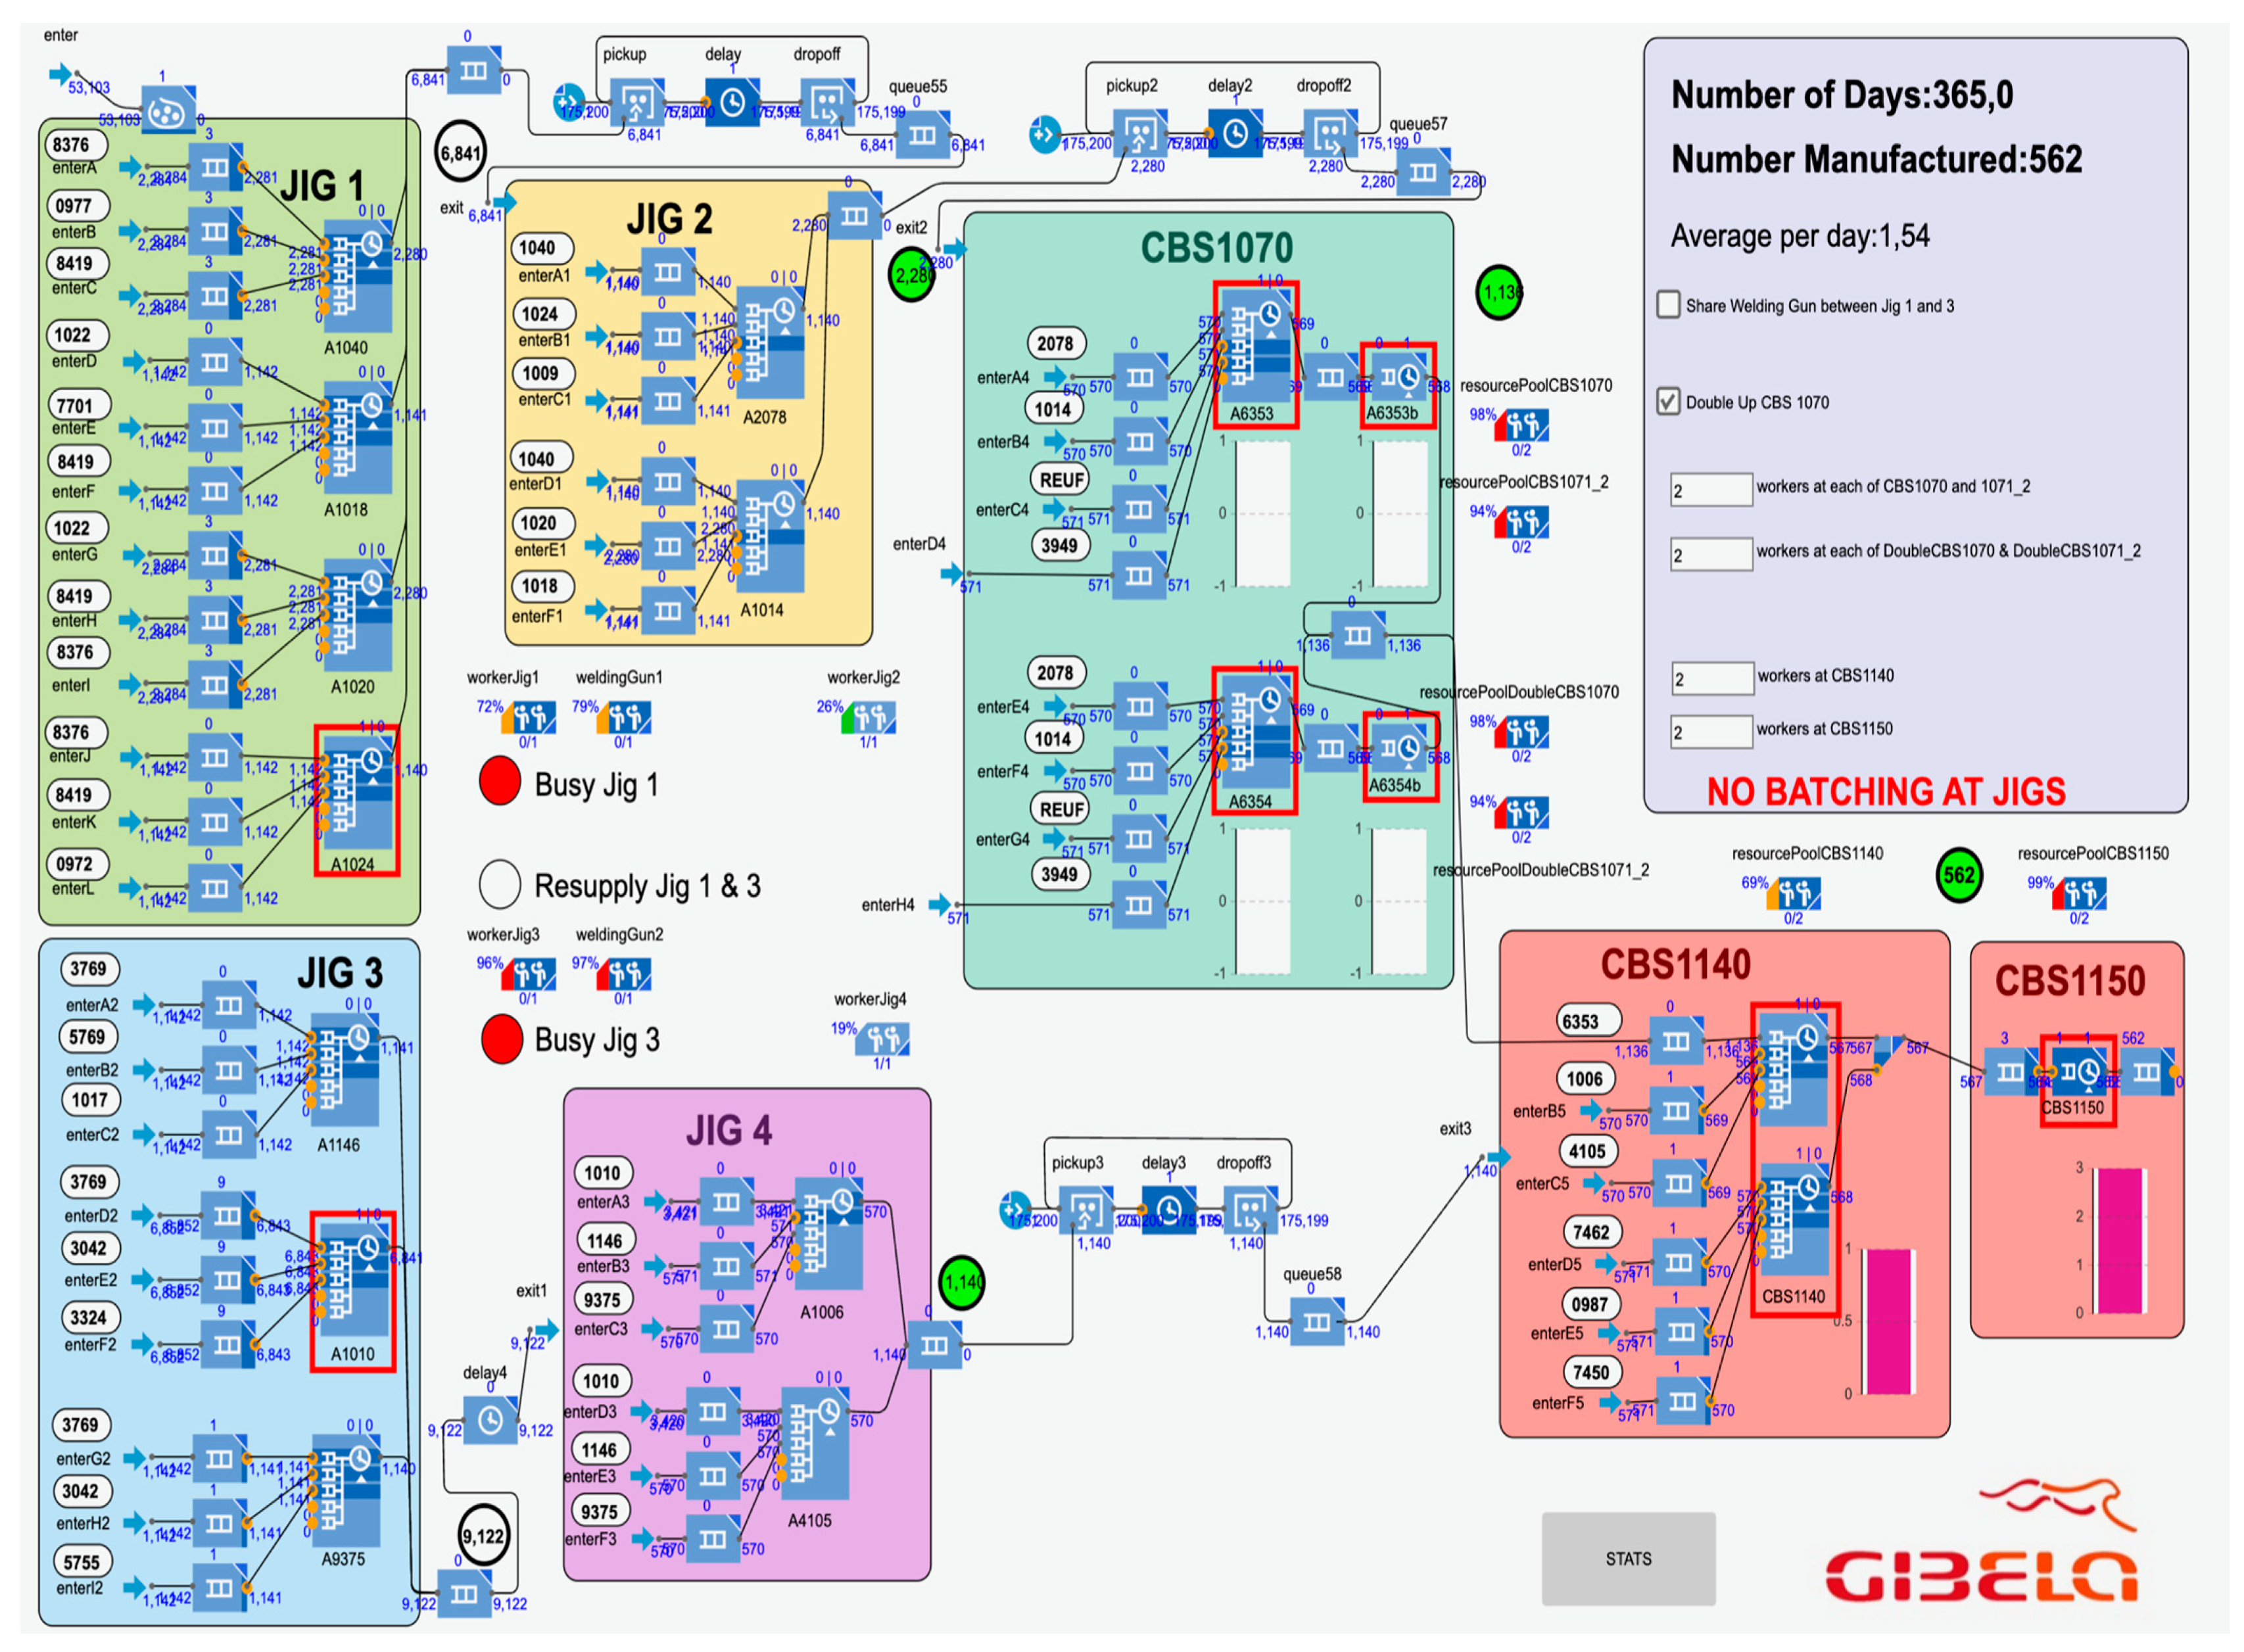
5.3. Discrete Event Simulation Model
5.4. Discrete Event Simulation Model Results
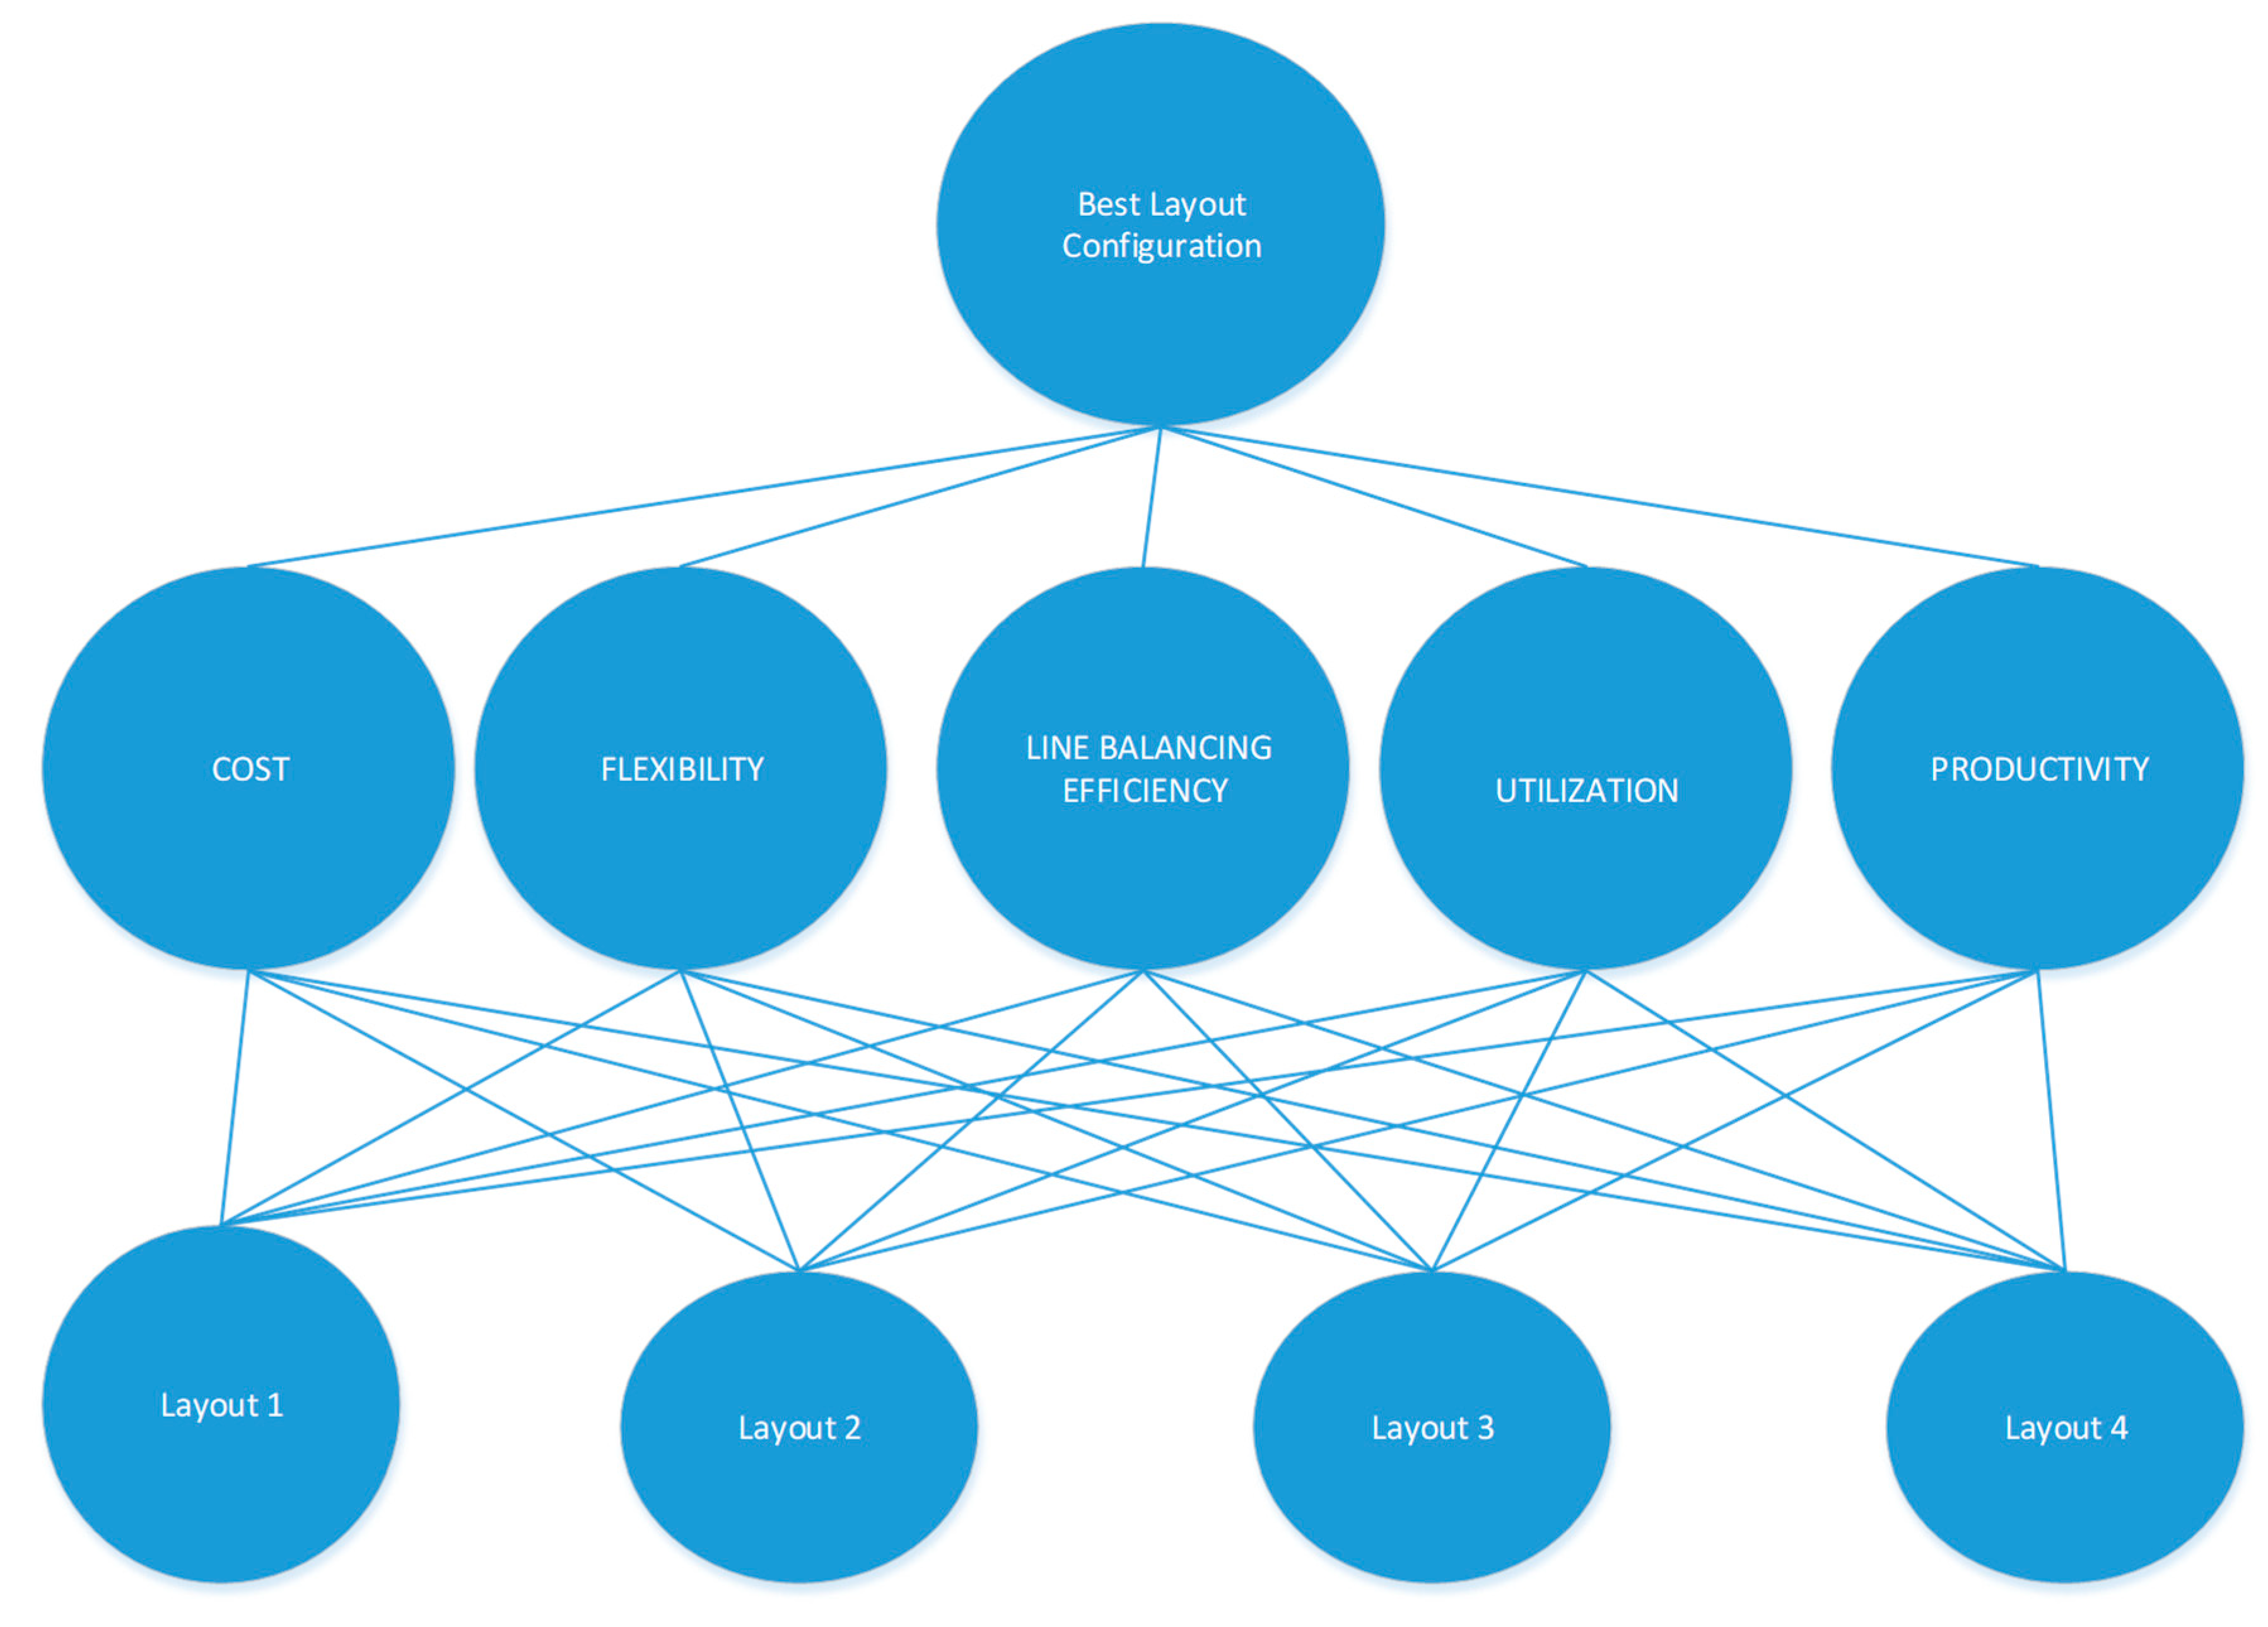
5.5. Application of F-AHP and F-TOPSIS
- (1)
- Cost
- (2)
- Flexibility
- (3)
- Line balancing efficiency (LBE)
- (4)
- Utilisation of resources
- (5)
- Productivity
5.6. Validation of the Fuzzy AHP-TOPSIS Model
6. Conclusions
Author Contributions
Funding
Institutional Review Board Statement
Informed Consent Statement
Data Availability Statement
Acknowledgments
Conflicts of Interest
References
- El-Araby, A.M.; Sabry, I.; El-Assal, A. Multi-Criteria Decision Making Approaches for Facilities Planning Problem. In Proceedings of the 2021 3rd Novel Intelligent and Leading Emerging Sciences Conference (NILES), Giza, Egypt, 23–25 October 2021; pp. 47–50. [Google Scholar]
- Karande, P.; Chakraborty, S. A Facility Layout Selection Model Using MACBETH Method. In Proceedings of the 2014 International Conference on Industrial Engineering and Operations Management, Bali, Indonesia, 7–9 January 2014. [Google Scholar]
- Bacudio, L.; Esmeria, G.J.; Promentilla, M.A. A Fuzzy Analytic Hierarchy Process Approach for Optimal Selection of Manufacturing Layout. In Proceedings of the DLSU Research Congress, Manila, Philippines, 7–9 March 2016; pp. 7–9. [Google Scholar]
- Iftikhar, M.A.; Siddiqui, A.S. A study on fuzzy AHP method and its applications in a tie breaking procedure. Glob. J. Pure Appl. Math. 2017, 13, 1619–1630. [Google Scholar]
- Besbes, M.; Affonso, R.C.; Zolghadri, M.; Masmoudi, F.; Haddar, M. Multi-criteria decision-making approaches for facility layout (FL) evaluation and selection: A survey. In Design and Modeling of Mechanical Systems—III, Proceedings of the 7th Conference on Design and Modeling of Mechanical Systems, CMSM’2017, Hammamet, Tunisia, 27–29 March 2018; Springer International Publishing: Berlin/Heidelberg, Germany, 2017; pp. 613–622. [Google Scholar]
- Lotfi, R.; Mostafaeipour, A.; Mardani, N.; Mardani, S. Investigation of wind farm location planning by considering budget constraints. Int. J. Sustain. Energy 2018, 37, 799–817. [Google Scholar] [CrossRef]
- Zha, S.; Guo, Y.; Huang, S.; Wang, S. A hybrid MCDM method using combination weight for the selection of facility layout in the manufacturing system: A case study. Math. Probl. Eng. 2020, 2020, 1–16. [Google Scholar] [CrossRef] [Green Version]
- Arunyanart, S.; Pruekthaisong, S. Selection of multi-criteria plant layout design by combining AHP and DEA methodologies. In MATEC Web of Conferences; EDP Sciences: Ulis, France, 2018; Volume 192, p. 01033. [Google Scholar]
- Sharma, P.; Sharma, R. Analysis of facility layout using MCDM approach: A case study of a manufacturing industry. Int. J. Six Sigma Compet. Advant. 2020, 12, 83–95. [Google Scholar] [CrossRef]
- Nadar, D. Manufacturing Facility Layout Design and Performance Analysis for a Greenfield Project using DES and AHP: A Multi-Criteria Decision Making for Qualitative and Quantitative Parameters. Master’s thesis, University of Twente, Enschede, The Netherlands, 2021. [Google Scholar]
- Dunke, F.; Nickel, S. Simulation-based multi-criteria decision making: An interactive method with a case study on infectious disease epidemics. Ann. Oper. Res. 2021, 1–30. [Google Scholar] [CrossRef] [PubMed]
- Moradi, S.; Sierpiński, G.; Masoumi, H. System dynamics modeling and fuzzy MCDM approach as support for assessment of sustainability management on the example of transport sector company. Energies 2022, 15, 4917. [Google Scholar] [CrossRef]
- Samala, T.; Manupati, V.K.; Machado, J.; Khandelwal, S.; Antosz, K. A systematic simulation-based multi-criteria decision-making approach for the evaluation of semi–fully flexible machine system process parameters. Electronics 2022, 11, 233. [Google Scholar] [CrossRef]
- Kazimieras Zavadskas, E.; Antucheviciene, J.; Chatterjee, P. Multiple-criteria decision-making (MCDM) techniques for business processes information management. Information 2018, 10, 4. [Google Scholar] [CrossRef] [Green Version]
- Zavadskas, E.K.; Turskis, Z. A new additive ratio assessment (ARAS) method in multicriteria decision-making. Technol. Econ. Dev. Econ. 2010, 16, 159–172. [Google Scholar] [CrossRef]
- Esfandabadi, Z.S.; Ranjbari, M.; Scagnelli, S.D. Prioritizing risk-level factors in comprehensive automobile insurance management: A hybrid multi-criteria decision-making Model. Glob. Bus. Rev. 2020. [CrossRef]
- Wang, C.N.; Yang, F.C.; Vo, N.T.; Nguyen, V.T.T. Wireless communications for data security: Efficiency assessment of cybersecurity industry—A promising application for UAVs. Drones 2022, 6, 363. [Google Scholar] [CrossRef]
- Dang, T.T.; Nguyen, N.A.T.; Nguyen, V.T.T.; Dang, L.T.H. A two-stage multi-criteria supplier selection model for sustainable automotive supply chain under uncertainty. Axioms 2022, 11, 228. [Google Scholar] [CrossRef]
- Shokri, H.; Ashjari, B.; Saberi, M.; Yoon, J.H. An integrated AHP-VIKOR methodology for facility layout design. Ind. Eng. Manag. Syst. 2013, 12, 389–405. [Google Scholar] [CrossRef] [Green Version]
- Heragu, S.S. Facilities Design; CRC Press: Boca Raton, FL, USA, 2018. [Google Scholar]
- Lin, Q.; Wang, D. Facility layout planning with SHELL and fuzzy AHP method based on human reliability for operating theatre. J. Healthc. Eng. 2019, 2019, 8563528. [Google Scholar] [CrossRef] [PubMed]
- Sriniketha, D.; Diwakar Reddy, V.; Naga Phaneendra, A. Plant location selection by using MCDM methods. Int. J. Eng. Res. Appl. 2014, 4, 110–116. [Google Scholar]
- Pérez-Gosende, P.; Mula, J.; Díaz-Madroñero, M. Facility layout planning. An extended literature review. Int. J. Prod. Res. 2021, 59, 3777–3816. [Google Scholar] [CrossRef]
- Sadjadi, S.; Karimi, M. Best-worst multi-criteria decision-making method: A robust approach. Decis. Sci. Lett. 2018, 7, 323–340. [Google Scholar] [CrossRef]
- Rezaei, J. Best-worst multi-criteria decision-making method. Omega 2015, 53, 49–57. [Google Scholar] [CrossRef]
- Ranjbari, M.; Shams Esfandabadi, Z.; Scagnelli, S.D.; Siebers, P.O.; Quatraro, F. Recovery agenda for sustainable development post COVID-19 at the country level: Developing a fuzzy action priority surface. Environ. Dev. Sustain. 2021, 23, 16646–16673. [Google Scholar] [CrossRef]
- Demircioğlu, S.N.; Ozceylan, E. Multi-Criteria Decision Making Approaches for Warehouse Layout and Design: A Literature Survey. Honor. Chair 2021, 12. [Google Scholar] [CrossRef]
- Kore, N.B.; Ravi, K.; Patil, S.B. A simplified description of fuzzy TOPSIS method for multi criteria decision making. Int. Res. J. Eng. Technol. (IRJET) 2017, 4, 2047–2050. [Google Scholar]
- Phruksaphanrat, B. Layout Selection by AHP-TOPSIS and Performance Analysis by Computer Simulation. In Proceedings of the APCEAS, Bali, Indonesia, 27–29 August 2017; pp. 1–12. [Google Scholar]
- Torfi, F.; Farahani, R.Z.; Rezapour, S. Fuzzy AHP to determine the relative weights of evaluation criteria and Fuzzy TOPSIS to rank the alternatives. Appl. Soft Comput. 2010, 10, 520–528. [Google Scholar] [CrossRef]
- Mardani, A.; Jusoh, A.; Nor, K.; Khalifah, Z.; Zakwan, N.; Valipour, A. Multiple criteria decision-making techniques and their applications–a review of the literature from 2000 to 2014. Econ. Res. Ekon. Istraživanja 2015, 28, 516–571. [Google Scholar] [CrossRef]
- Breckle, T.; Kiefer, J.; Schlüter, C.; Groß, N. Multi-criteria evaluation within concept planning phase of assembly system design. Procedia CIRP 2021, 97, 296–301. [Google Scholar] [CrossRef]
- Abdul-Hamid, Y.; Kochhar, A.; Khan, M.E. An analytic hierarchy process approach to the choice of manufacturing plant layout. J. Eng. Manuf. 1999, 213, 397–406. [Google Scholar] [CrossRef]
- Vadivel, S.; Sequeira, A. A hybrid method for the selection of facility layout using experimental design and grey relational analysis: A case study. Int. J. Hybrid Intell. Syst. 2019, 15, 101–110. [Google Scholar] [CrossRef]
- Tayal, A.; Singh, S.P. Integrated SA-DEA-TOPSIS-based solution approach for multi objective stochastic dynamic facility layout problem. Int. J. Bus. Syst. Res. 2017, 11, 82–100. [Google Scholar] [CrossRef]
- Jannat, S.; Khaled, A.A.; Paul, S.K. Optimal solution for multi-objective facility layout problem using genetic algorithm. In Proceedings of the 2010 International Conference on Industrial Engineering and Operations Management, Xiamen, China, 29–31 October 2010; pp. 1–6. [Google Scholar]
- Nghiem, T.B.H.; Chu, T.C. Evaluating Lean Facility Layout Designs Using a BWM-Based Fuzzy ELECTRE I Method. Axioms 2022, 11, 447. [Google Scholar] [CrossRef]
- Qamar, A.M.; Meanazel, O.T.; Alalawin, A.H.; Almomani, H.A. Optimization of plant layout in Jordan light vehicle manufacturing company. J. Inst. Eng. (India) Ser. C 2020, 101, 721–728. [Google Scholar] [CrossRef]
- Azimi, P.; Charmchi, H.R. A New Optimization via Simulation Approach for Dynamic Facility Layout Problem with Budget Constraints. Model. Simul. Eng. 2012, 2012, 1–9. [Google Scholar] [CrossRef] [Green Version]
- Eraslan, E.; Güneşli, İ.; Khatib, W. The evaluation of appropriate office layout design with MCDM techniques. SN Appl. Sci. 2020, 2, 388. [Google Scholar] [CrossRef] [Green Version]
- Dhake, R.; Rajhans, N.R.; Gujar, N.; Deshmukh, M. Comparison of MADM Methods for Layout Evaluation & Selection. In Proceedings of the National Conference on, Modeling, Optimization and Control, Pune, India, 4–6 March 2015. [Google Scholar]
- Alsyouf, I.; Al-Araidah, O.; Tates, M.; Ciganovic, R. A multi-criteria decision-making framework for assessing the quality and cost of facility layout alternatives: A case study. Proc. Inst. Mech. Eng. Part B J. Eng. Manuf. 2011, 226, 353–364. [Google Scholar] [CrossRef]
- Abedi, M.R. Selection of a layout configuration for reconfigurable manufacturing systems using the AHP. In Proceedings of the 2005 International Symposium on AHP, Honolulu, HI, USA, 8–10 July 2005; pp. 8–10. [Google Scholar]
- Besbes, M.; Affonso, R.C.; Zolghadri, M.; Masmoudi, F.; Haddar, M. Multi-criteria decision making for the selection of a performant manual workshop layout: A case study. IFAC-PapersOnLine 2017, 50, 12404–12409. [Google Scholar] [CrossRef]
- Jafari, H.; Ehsanifar, M.; Sheykhan, A. Finding optimum facility’s layout by developed simulated annealing algorithm. Int. J. Res. Ind. Eng. 2020, 9, 172–182. [Google Scholar]
- Garcia, E.F.; Zúñiga, E.R.; Bruch, J.; Moris, M.U.; Syberfeldt, A. Simulation-based Optimization for Facility Layout Design in Conditions of High Uncertainty. Procedia CIRP 2018, 72, 334–339. [Google Scholar] [CrossRef]
- Pourhassan, M.R.; Raissi, S. An integrated simulation-based optimization technique for multi-objective dynamic facility layout problem. J. Ind. Inf. Integr. 2017, 8, 49–58. [Google Scholar] [CrossRef]
- Ruiz Zúñiga, E. Facility Layout Design with Simulation-Based Optimization: A Holistic Methodology Including Process, Flow, and Logistics Requirements in Manufacturing. Ph.D. Thesis, University of Skövde, Skövde, Sweden, 2020. [Google Scholar]
- Tzeng, G.H.; Huang, J.J. Multiple Attribute Decision Making: Methods and Applications; CRC Press: Boca Raton, FL, USA, 2011. [Google Scholar]
- Belhadi, A.; Touriki, F.E.; El Fezazi, S. Prioritizing the solutions of lean implementation in SMEs to overcome its barriers: An integrated fuzzy AHP-TOPSIS approach. J. Manuf. Technol. Manag. 2017, 28, 1115–1139. [Google Scholar] [CrossRef]
- Ataei, E.; Branch, A. Application of TOPSIS and fuzzy TOPSIS methods for plant layout design. World Appl. Sci. J. 2013, 24, 908–913. [Google Scholar]
- Durmusoglu, Z.D. A TOPSIS-based approach for sustainable layout design: Activity relation chart evaluation. Kybernetes 2018, 47, 2012–2024. [Google Scholar] [CrossRef]
- Kacprzak, D. Fuzzy TOPSIS method for group decision making. Mult. Criteria Decis. Mak. 2018, 13, 116–132. [Google Scholar] [CrossRef]
- Stephens, M.P.; Meyers, F.E. Manufacturing Facilities Design and Material Handling; Purdue University Press: West Lafayette, IN, USA, 2013. [Google Scholar]
- Garbie, H.I. Performance analysis and measurement of reconfigurable manufacturing systems. J. Manuf. Technol. Manag. 2014, 25, 934–957. [Google Scholar] [CrossRef]
- Groover, M.P. Automation, Production Systems, and Computer-Integrated Manufacturing; Pearson Education India: Bengaluru, Indian, 2016. [Google Scholar]
- Prajapat, N.; Waller, T.; Young, J.; Tiwari, A. Layout optimization of a repair facility using discrete event simulation. Procedia CIRP 2016, 56, 574–579. [Google Scholar] [CrossRef] [Green Version]
- Render, B.; Stair, R.M., Jr. Quantitative Analysis for Management, 12th ed.; Pearson Education India: Bengaluru, Indian, 2016. [Google Scholar]


| Author | Title | Criteria for Evaluation | Findings |
|---|---|---|---|
| [19] | An integrated AHP-VIKOR methodology for facility layout design | Flexibility, accessibility, maintenance, and material handling distance, adjacency score ratio | The fuzzy set comparisons show good reliability of the selection of optimal FLD alternatives |
| [33] | An AHP approach to the choice of manufacturing plant layout | Flexibility, Cost, and production volume | The AHP- KBS produced much more supporting evidence to justify the layout choice. |
| [34] | A hybrid method for the selection of facility layout experimental design and grey relational analysis: A case study | Flow distance, space utilisation, and shape ratio | The results of the study show that the DoE-GRA method is robust, calculations are quick and it is practical. |
| [8] | Selection of multi-criteria plant layout design by combining AHP and DEA | Distance, cost, flexibility, safety utilisation | The DEA model was useful in finding global priorities amongst the layout designs |
| [3] | A fuzzy AHP approach for optimal selection of manufacturing layout | Productivity, Initial investment, Flexibility, and Ease of maintenance | The criteria productivity was more preferred followed by the initial investment |
| [35] | Integrated SA-DEA-TOPSIS based solution approach for multi objective stochastic dynamic facility layout problem | Cost, Distance, Maintenance, Flow | This was found to be a unique method for ranking layouts were objective and subjective criteria were merged to find a solution |
| [36] | Optimal solution for multi-objective facility layout problem using a genetic algorithm | Material handling cost, and Closeness rating score | The algorithm developed was useful in finding the initial optimal solution |
| [37] | Evaluating Lean Facility Layout Designs Using a BWM-Based Fuzzy ELECTREI Methodology | Cycle Time, Cost, Productivity, WIP, Quality, and Distance | The proposed hybrid method could overcome the problem of missing information in numerical comparison |
| [38] | Optimization of plant layout in Jordan Light Vehicles Manufacturing Company | Travelling distance, Space usage, Activity relationship | AHP was successful in evaluating five layout designs with a consistency ratio of 8.33% |
| [39] | A New Optimization via Simulation Approach for Dynamic Facility Layout Problem with Budget Constraints | Cost and distance | The proposed model integrates computer simulation, ANN, and H-NSGA-II to overcome the limitations of traditional layout optimization methods |
| [40] | The evaluation of office layout design with MCDM techniques | Safety, Motion, and Comfort | AHP and Permutation methods yielded the same results |
| Evaluating Facilities Layout Design using Fuzzy MCDM method | Investment, size, distance, and Quality | Subjective and Objective criteria are used to evaluate layouts | |
| [29] | Layout Selection by AHP-TOPSIS and Performance Analysis by Computer Simulation | Flexibility, Distance, Route, Activity Relationship | AHP was used to determine the weights and TOPSIS was used to outrank the options |
| [41] | Comparison of MADM Methods for Layout Evaluation Selection | Volume, Distance, Utilisation, and Quality | Four methods resulted in the selection of the same layout |
| [42] | A multi-criteria decision-making framework for assessing the quality and cost of facility layout alternatives: a case study | Investment, Maintenance, Operational and Disposal Cost, and Quality | The developed framework accounts for quantitative and qualitative factors in selecting layouts |
| [43] | Selection of a layout configuration for reconfigurable manufacturing system using the AHP | Layout reconfiguration, Cost, Quality, and Reliability | The sensitivity analysis indicated that layout reconfigurability is the most important |
| [44] | Multi criteria decision making for the selection of a performant manual workshop layout: a case study | Accessibility, Flexibility, Area utilisation, Noise, Labour utilisation | AHP and TOPSIS were most applicable techniques for layout selection |
| [45,46] | Finding optimum Facility Layout by Developed Simulated Annealing Algorithm | Distance and Costs | Proper of layout facilities has a direct relationship with the cost goods manufactured |
| The Intensity of the Fuzzy Scale | Definition of Linguistic Variable | Fuzzy Number | User-Defined |
|---|---|---|---|
| Similar importance (SI) | (_,1,_) | ||
| Moderate importance (MI) | (_,3,_) | ||
| Intense importance (II) | (_,5,_) | ||
| Demonstrated importance (DI) | (_,7,_) | ||
| Extreme importance (EI) | (_,9,_) | ||
| Intermediate values | (_,_,_) |
| Alternatives | ||||
|---|---|---|---|---|
| Alternatives | Concept 1 | Concept 2 | Concept 3 | Concept 4 |
|---|---|---|---|---|
| Operators | 16 | 19 | 19 | 19 |
| Production output | 288 | 330 | 567 | 566 |
| Productivity | 18 | 17.37 | 29.84 | 29.79 |
| Line Balancing Efficiency | 72.85% | 61.58% | 61.58% | 57.30% |
| Utilisation | 52 | 46 | 69.4 | 75.7 |
| Crisp Scale | Fuzzy Scale | Meaning |
|---|---|---|
| 1 | (1,1,1) | Equally preferred |
| 2 | (1,2,3) | Equally to moderately preferred |
| 3 | (2,3,4) | Moderately preferred |
| 4 | (3,4,5) | Moderately to strongly preferred |
| 5 | (4,5,6) | Strongly preferred |
| 6 | (5,6,7) | Strongly to very strongly preferred |
| 7 | (6,7,8) | Very strongly preferred |
| 8 | (7,8,9) | Very to extremely strongly preferred |
| 9 | (9,9,9) | Very extremely preferred |
| Criteria. | Flexibility | LBE | Utilisation | Cost | Productivity |
|---|---|---|---|---|---|
| Flexibility | (1,1,1) | (0.11,0,13,0.14) | (0.25,0.33,0.5) | (5,6,7) | (0.11,0.11,0.11) |
| LBE | (7,8,9) | (1,1,1) | (7,8,9) | (9,9,9) | (0.11,0.11,0.11) |
| Utilisation | (2,3,4) | (0.11,0.13,0.14) | (1,1,1) | (2,3,4) | (0.11,0.11,0.11) |
| Cost | (0.14,0.17,0.2) | (0.11,0.11,0.11) | (0.25,0.33,0.5) | (1,1,1) | (0.11,0.11,0.11) |
| Productivity | (9,9,9) | (9,9,9) | (9,9,9) | (9,9,9) | (1,1,1) |
| Criteria | Fuzzy Geometric Mean | ||
|---|---|---|---|
| Flexibility | 0.43402145 | 0.48728118 | 0.56097746 |
| LBE | 2.17747067 | 2.29693705 | 2.40774285 |
| Utilisation | 0.54769804 | 0.65962195 | 0.7602489 |
| Cost | 0.21229648 | 0.23372643 | 0.2618962 |
| Productivity | 5.79954613 | 5.79954613 | 5.79954613 |
| Sum | 9.17103278 | 9.47711274 | 9.79041154 |
| Crisp Scale | Fuzzy Number | Linguistic Terms for Alternative Assessment |
|---|---|---|
| 1 | (1,1,3) | Very Poor (VP) |
| 2 | (1,3,5) | Poor (P) |
| 3 | (3,5,7) | Fair (F) |
| 4 | (5,7,9) | Good (G) |
| 5 | (7,9,9) | Very Good (VG) |
| Criteria | Scale | |||
|---|---|---|---|---|
| Cost | Productivity | Utilisation | LBE | |
| More than ZAR 3 million | 15–20 | 40–50 | 50–60 | 1 |
| ZAR 2.6 to 3 million | 21–25 | 51–60 | 61–70 | 2 |
| ZAR 2.1 to 2.5 million | 26–30 | 61–70 | 71–80 | 3 |
| ZAR 1.6 to 2 million | 31–35 | 71–80 | 81–90 | 4 |
| ZAR 1 to 1.5 million | More than 36 | More than 81 | More than 91 | 5 |
| Criteria | Alternative Concepts | |||
|---|---|---|---|---|
| A1 | A2 | A3 | A4 | |
| Cost | (7,9,9) | (1,3,5) | (1,3,5) | (1,1,3) |
| Flexibility | (1,1,3) | (5,7,9) | (5,7,9) | (3,5,7) |
| Line Balancing Efficiency (LBE) | (1,3,5) | (1,3,5) | (1,3,5) | (1,1,3) |
| Utilisation | (1,3,5) | (1,1,3) | (3,5,7) | (5,7,9) |
| Productivity | (1,1,3) | (1,1,3) | (3,5,7) | (3,5,7) |
| Criteria | Alternative Concepts | |||
|---|---|---|---|---|
| A1 | A2 | A3 | A4 | |
| Cost | (0.11,0.11,0.14) | (0.20,0.33,0.10) | (0.20,0.33,0.10) | (0.33,1.00,1.00) |
| Flexibility | (0.11,0.11,0.33) | (0.56,0.78,1.00) | (0.56,0.78,1.00) | (0.33,0.56,0.78) |
| LBE | (0.43,0.71,1.00) | (0.14,0.43,0.71) | (0.14,0.43,0.71) | (0.14,1.00,0.43) |
| Utilisation | (0.11,0.33,0.56) | (0.11,0.11,0.33) | (0.33,0.56,0.78) | (0.56,0.78,1.00) |
| Productivity | (0.14,0.14,0.43) | (0.14,0.14,0.43) | (0,43,0.71,1.00) | (0.43,0.71,1.00) |
| Criteria | Alternative Concepts | |||
|---|---|---|---|---|
| A1 | A2 | A3 | A4 | |
| Cost | (0.005,0.005,0.009) | (0.009,0.017,0.061) | (0.009,0.017,0.061) | (0.015,0.051,0.061) |
| Flexibility | (0.025,0.027,0.088) | (0.124,0.189,0.263) | (0.124,0.0189,0.263) | (0.124,0.189,0.263) |
| LBE | (0.024,0.050,0.083) | (0.008,0.030,0.060) | (0.030,0.030,0.060) | (0.080,0.007,0.040) |
| Utilisation | (0.002,0.008,0.016) | (0.002,0.003,0.010) | (0.007,0.014,0.022) | (0.012,0.019,0.029) |
| Productivity | (0.085,0.087,0.271) | (0.085,0.087,0.271) | (0.254,0.437,0.632) | (0.254,0.437,0.632) |
| Criteria | Distance of Each Criteria to the FPIS and FNIS | |
|---|---|---|
| A+ | A− | |
| Cost | (0.015,0.051,0.061) | (0.005,0.006,0.009) |
| Flexibility | (0.124,0.189,0.263) | (0.025,0.027,0.089) |
| LBE | (0.024,0.070,0.083) | (0.008,0.030,0.036) |
| Utilisation | (0.012,0.019,0.029) | (0.002,0.003,0.010) |
| Productivity | (0.254,0.437,0.632 | (0.085,0.085,0.271) |
| Criteria | Fuzzy Positive Ideal Solution for Alternative Concepts | |||
|---|---|---|---|---|
| A1 | A2 | A3 | A4 | |
| Cost | 0.040557693 | 0.020082487 | 0.020082487 | 0 |
| Flexibility | 0.148898449 | 0 | 0 | 0.053997909 |
| LBE | 0.011481352 | 0.028274251 | 0.028274251 | 0.028863817 |
| Utilisation | 0.011167007 | 0.015552503 | 0.005583504 | 0 |
| Productivity | 0.306325637 | 0.306325637 | 0 | 0 |
| di* | 0.518430138 | 0.370234878 | 0.053940242 | 0.08286173 |
| Criteria | Fuzzy Negative Ideal Solution for Alternative Concepts | |||
|---|---|---|---|---|
| A1 | A2 | A3 | A4 | |
| Cost | 0 | 0.031064214 | 0.031064214 | 0.040557693 |
| Flexibility | 0 | 0.148898449 | 0.148898449 | 0.096022732 |
| LBE | 0.031063506 | 0.013674459 | 0.013674459 | 0.022962705 |
| Utilisation | 0.004841039 | 0 | 0.010073852 | 0.015552503 |
| Productivity | 0 | 0 | 0.306325637 | 0.306325637 |
| d- | 0.035904545 | 0.193637122 | 0.510036611 | 0.481421269 |
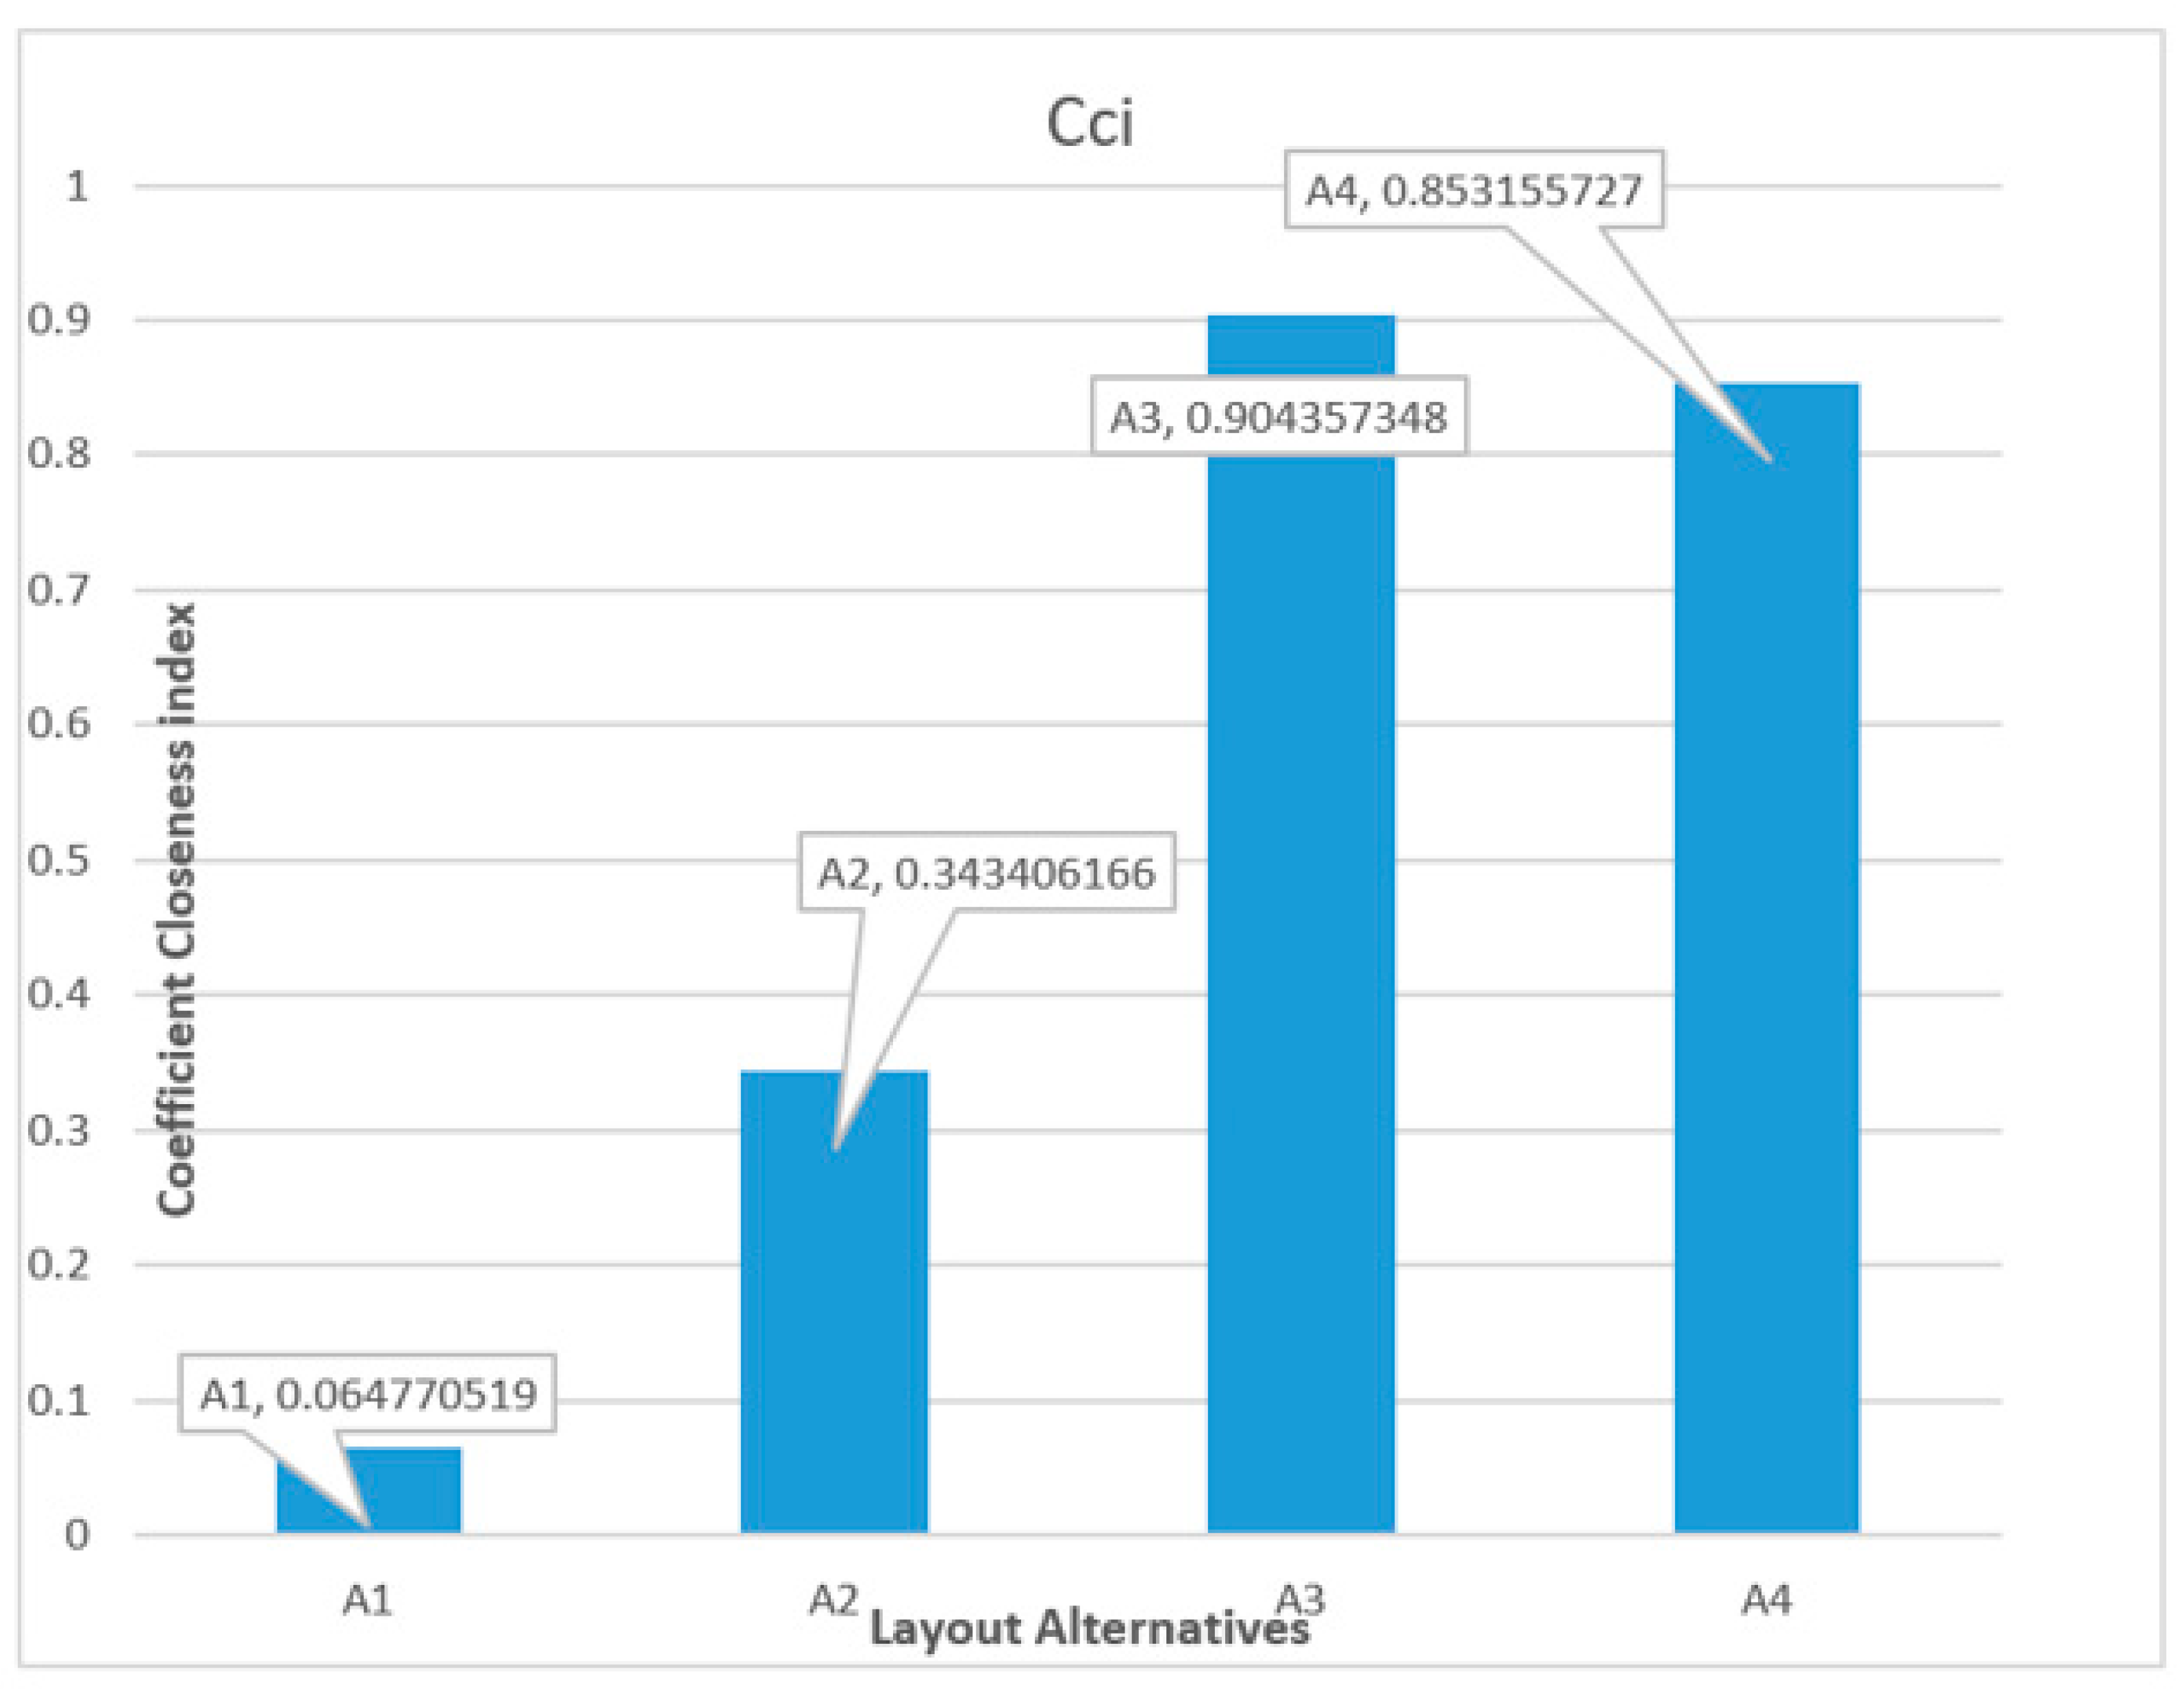
| Alternatives | di*+di− | Cci | Rank |
|---|---|---|---|
| Concept 1 | 0.554334683 | 0.064770519 | 3 |
| Concept 2 | 0.563872001 | 0.343406166 | 4 |
| Concept 3 | 0.563976853 | 0.904357348 | 1 |
| Concept 4 | 0.564282996 | 0.853155727 | 2 |
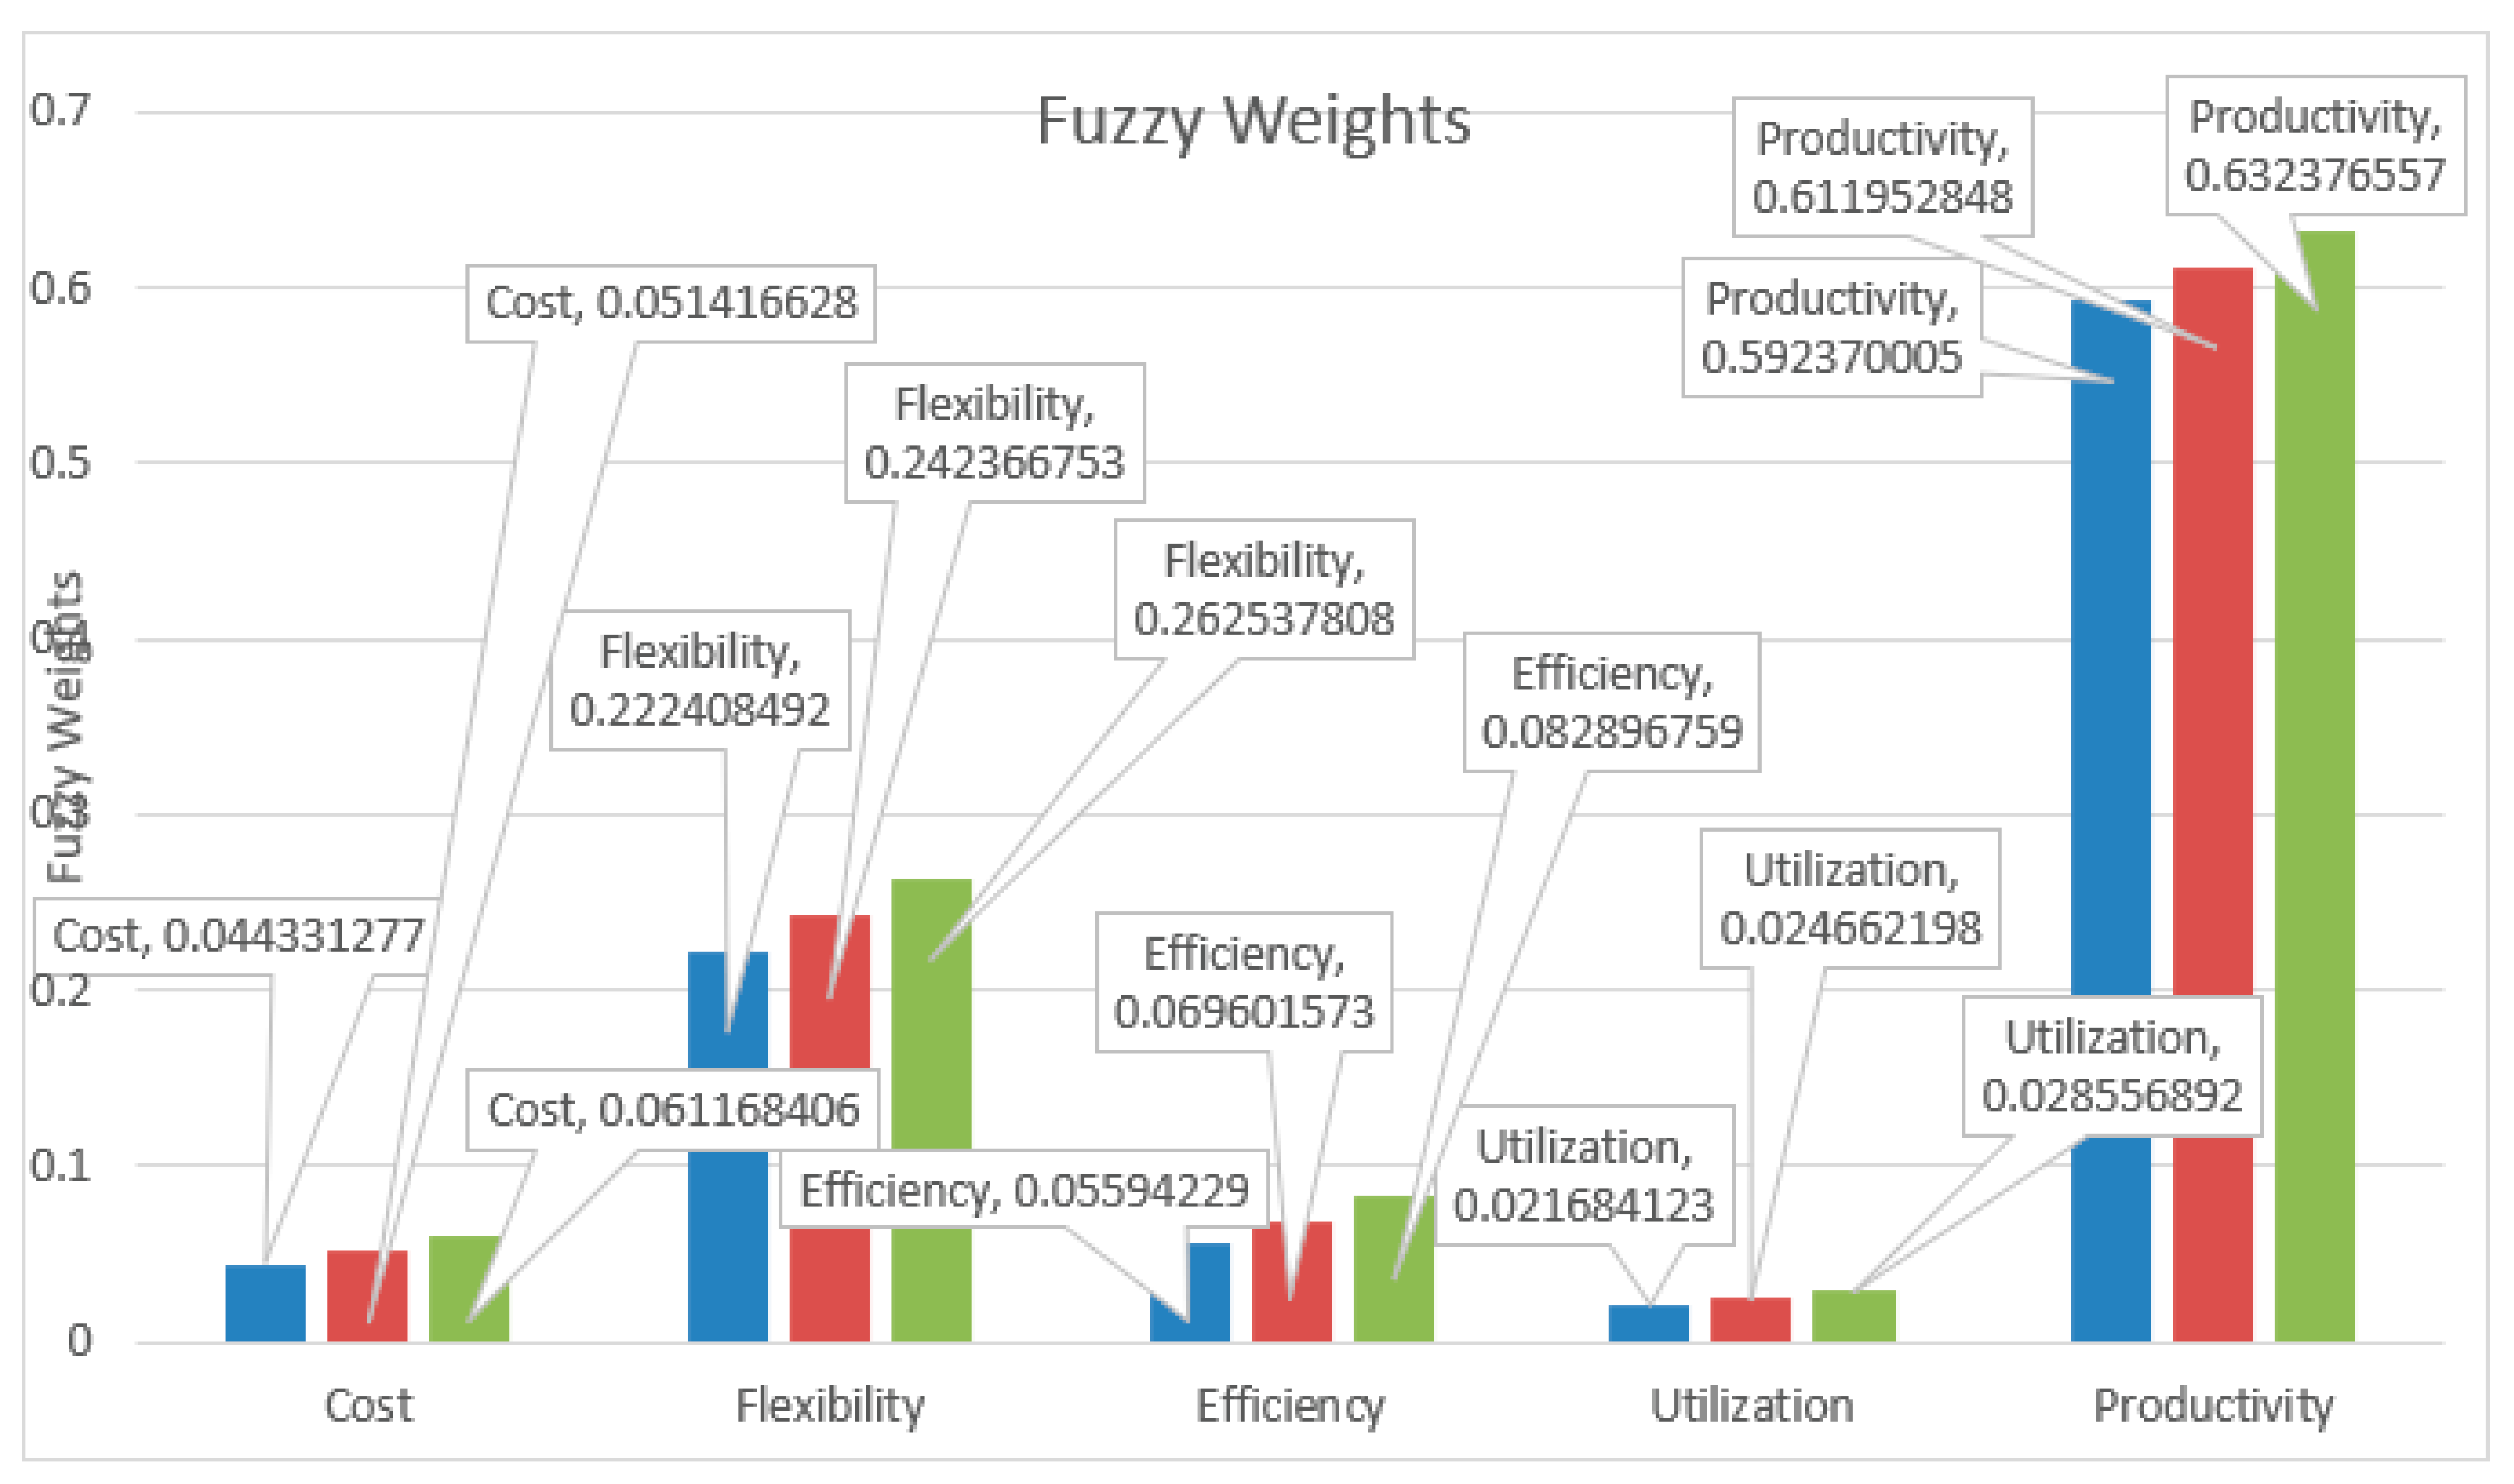
| Criteria Weights | Flexibility | Efficiency | Utilisation | Cost | Productivity | Weights |
|---|---|---|---|---|---|---|
| Flexibility | 1 | 0.13 | 0.33 | 6 | 0.11 | 0.07442 |
| Efficiency | 8 | 1 | 8 | 9 | 0.11 | 0.26168 |
| Utilisation | 3 | 0.13 | 1 | 3 | 0.11 | 0.078374 |
| Cost | 0.17 | 0.11 | 0.33 | 1 | 0.17 | 0.03074 |
| Productivity | 9 | 9 | 9 | 9 | 1 | 0.554785 |
| Sum | 21.16667 | 10.36111 | 18.66667 | 28 | 1.5 |
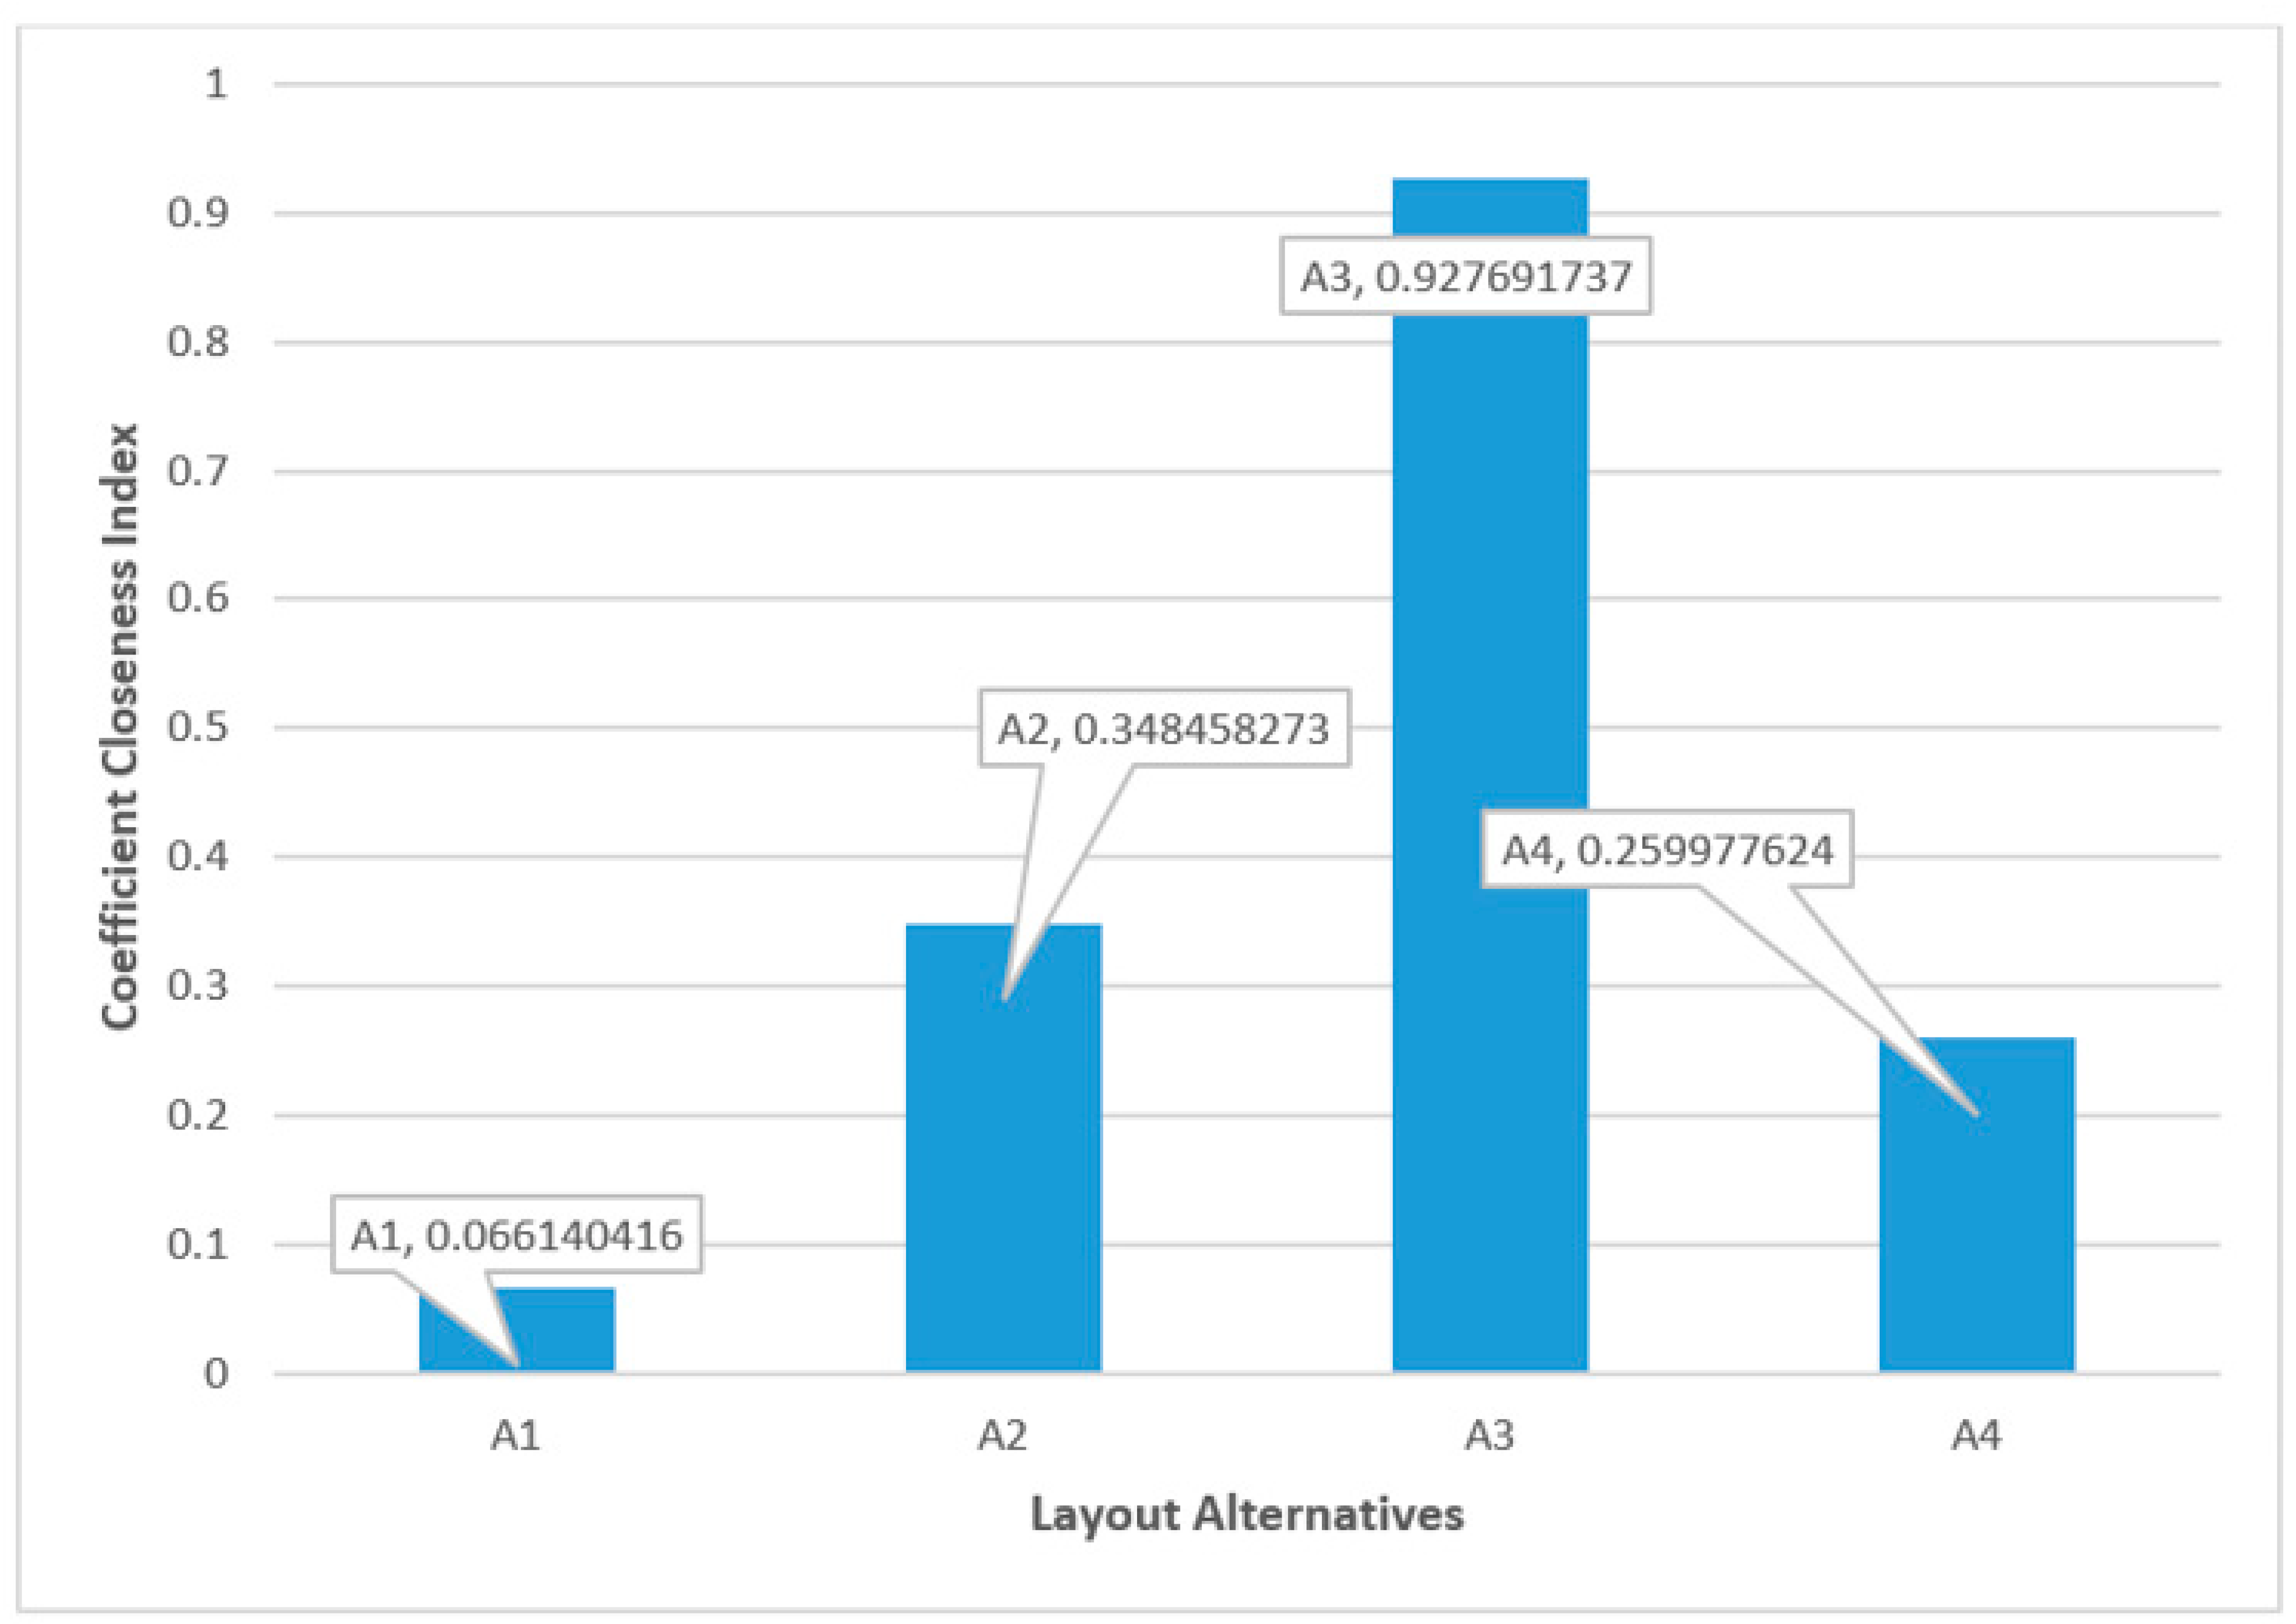
| Layout Alternatives | ||||
|---|---|---|---|---|
| Criteria | A1 | A2 | A3 | A4 |
| Cost | 0.01 | 0.04 | 0.04 | 0.07 |
| Flexibility | 0.13 | 0.26168 | 0.26168 | 0.19626 |
| Efficiency | 0.052249 | 0.052249 | 0.052249 | 0.078374 |
| Utilisation | 0.020493 | 0.010247 | 0.03074 | 0.03074 |
| Productivity | 0.277393 | 0.277393 | 0.554785 | 0.554785 |
| Performance Score | 0.50 | 0.64 | 0.94 | 0.93 |
| Ranking | 4 | 3 | 1 | 2 |
Disclaimer/Publisher’s Note: The statements, opinions and data contained in all publications are solely those of the individual author(s) and contributor(s) and not of MDPI and/or the editor(s). MDPI and/or the editor(s) disclaim responsibility for any injury to people or property resulting from any ideas, methods, instructions or products referred to in the content. |
© 2023 by the authors. Licensee MDPI, Basel, Switzerland. This article is an open access article distributed under the terms and conditions of the Creative Commons Attribution (CC BY) license (https://creativecommons.org/licenses/by/4.0/).
Share and Cite
Nenzhelele, T.; Trimble, J.A.; Swanepoel, J.A.; Kanakana-Katumba, M.G. MCDM Model for Evaluating and Selecting the Optimal Facility Layout Design: A Case Study on Railcar Manufacturing. Processes 2023, 11, 869. https://doi.org/10.3390/pr11030869
Nenzhelele T, Trimble JA, Swanepoel JA, Kanakana-Katumba MG. MCDM Model for Evaluating and Selecting the Optimal Facility Layout Design: A Case Study on Railcar Manufacturing. Processes. 2023; 11(3):869. https://doi.org/10.3390/pr11030869
Chicago/Turabian StyleNenzhelele, Tshifhiwa, John Alfred Trimble, Jan Andriaan Swanepoel, and Mukondeleli Grace Kanakana-Katumba. 2023. "MCDM Model for Evaluating and Selecting the Optimal Facility Layout Design: A Case Study on Railcar Manufacturing" Processes 11, no. 3: 869. https://doi.org/10.3390/pr11030869