
25OHVitamin D Levels in a Canarian Pediatric Population with and without Type 1 Diabetes: The Role of Acidosis
 , ,
, ,
Abstract
:1. Introduction
2. Materials and Methods
2.1. Study Design
- Cases: Patients under 15 years of age diagnosed with T1D in Gran Canaria between 2016 and 2022 and in whom 25OHVitamin D levels were determined at onset (in a minority of patients, 25OHVitamin D levels were not determined). American Diabetes Association (ADA) criteria were used for the diagnosis of T1D [12].
- Controls: Patients followed in our center’s pediatric endocrinology outpatient clinic between 2016 and 2022, excluding those diagnosed with obesity, T1D, and skeletal and phosphocalcic metabolism disorders.
2.2. Data Collection
2.3. Laboratory Analyses
2.4. Statistical Analyses
3. Results
4. Discussion
4.1. 25OHVitamin D and T1D
- Effect on the appearance of Insulin antibodies: some reports show a reduced risk of developing anti-insulin anti-antibodies in children with higher 25OHVitamin D levels (including TEDDY [17]), whereas other prospective studies such as DAISY and DIADIMMUNE do not confirm the relationship.
- Risk of developing T1D: Interestingly, Finnish studies report reduced relative risk for T1D in children receiving >2000 units of vitamin D/day compared to children receiving <2000 units/day during their first year of life [18]. Furthermore, Stene LC et al. reported a bigger reduction in the risk of developing T1D when supplementation occurs from 7 to 12 months of age compared to supplementation from birth to 6 months of age [8]. Other studies draw attention to the role of polymorphisms in genes involved in vitamin D metabolism. Single nucleotide polymorphisms (SNPs) in CYP2R1 (25-hydroxylase), CYP27B1 (1α-hydroxylase), and Vitamin D receptor (VDR) genes have been associated with T1D susceptibility [19]. Results from the Spanish population with T1D point in the same direction. In 2005, San Pedro et al. reported a higher frequency of the haplotype “fBAt” in the VDR in Basque patients with T1D compared to healthy controls [20]. Similar results were reported by Martí et al. with patients from Barcelona and Navarra, with certain polymorphisms of the VDR presenting more frequently in patients with T1D compared to controls [21].
- Preservation of residual β cell function: a role for 25OHVitamin D has been suggested in preserving residual β cell function and improving metabolic control in children with recent T1D onset. Panjiyar et al. reported a slower decline in C-peptide and improved metabolic control after 1 year of supplementation with 3000 units of cholecalciferol in children aged 6–12 years in a non-randomized, controlled trial [22]. Gregoriou et al. reported similar results in their systematic review of randomized controlled trials evaluating the effects of Vitamin D supplementation in newly diagnosed T1D patients [4]. They concluded that treatment with alphacalcidol (1-OHVitaminD) and cholecalciferol (but not so with calcitriol) had a positive effect on the daily insulin dose (lower in Vitamin D supplemented T1D patients) and fasting C peptide (higher in Vitamin D supplemented patients). It is important to take into consideration that the follow-up of the studies included in the review ranged from 6 to only 24 months. Additionally, it is important to take into account that other authors have not reproduced these results [19].
- Impact of 25OHVitamin D levels on metabolic control: studies show a correlation between 25OHVitamin D levels, metabolic control, and total insulin dose. Savastio et al. reported a significant correlation between 25OHVitamin D insufficiency and deficiency and HbA1c, with significant improvement in metabolic control after supplementation with 1000 IU/day [9]. However, not all studies report the same results. In a recent systematic review performed by Folino-Nascimento et al., only 50% of the studies included in the review reported significant improvement in glycemic control after vitamin D supplementation [23].
4.2. Prevalence of 25OHVitamin D Deficiency
4.3. Effect of Acidosis on 25OHVitamin D
Supplementary Materials
Author Contributions
Funding
Institutional Review Board Statement
Informed Consent Statement
Data Availability Statement
Conflicts of Interest
References
- Wang, Z.; Xie, Z.; Lu, Q.; Chang, C.; Zhou, Z. Beyond Genetics: What Causes Type 1 Diabetes. Clin. Rev. Allergy Immunol. 2017, 52, 273–286. [Google Scholar] [CrossRef] [PubMed]
- Zittermann, A.; Gummert, J.F. Nonclassical Vitamin D Actions. Nutrients 2010, 2, 408–425. [Google Scholar] [CrossRef] [PubMed] [Green Version]
- Saggese, G.; Vierucci, F.; Boot, A.M.; Czech-Kowalska, J.; Weber, G.; Camargo, C.A.; Mallet, E.; Fanos, M.; Shaw, N.J.; Holick, M.F. Vitamin D in childhood and adolescence: An expert position statement. Eur. J. Pediatr. 2015, 174, 565–576. [Google Scholar] [CrossRef] [PubMed]
- Gregoriou, E.; Mamais, I.; Tzanetakou, I.; Lavranos, G.; Chrysostomou, S. The Effects of Vitamin D Supplementation in Newly Diagnosed Type 1 Diabetes Patients: Systematic Review of Randomized Controlled Trials. Rev. Diabet. Stud. 2017, 14, 260–268. [Google Scholar] [CrossRef] [Green Version]
- Munns, C.F.; Shaw, N.; Kiely, M.; Specker, B.L.; Thacher, T.D.; Ozono, K.; Michigami, T.; Tiosano, D.; Mughal, M.Z.; Mäkitie, O.; et al. Global Consensus Recommendations on Prevention and Management of Nutritional Rickets. J. Clin. Endocrinol. Metab. 2016, 101, 394–415. [Google Scholar] [CrossRef]
- Voortman, T.; van den Hooven, E.H.; Heijboer, A.C.; Hofman, A.; Jaddoe, V.W.; Franco, O.H. Vitamin D Deficiency in School-Age Children Is Associated with Sociodemographic and Lifestyle Factors. J. Nutr. 2015, 145, 791–798. [Google Scholar] [CrossRef] [Green Version]
- Quinn, L.M.; Wong, F.S.; Narendran, P. Environmental Determinants of Type 1 Diabetes: From Association to Proving Causality. Front. Immunol. 2021, 12, 737964. [Google Scholar] [CrossRef]
- Stene, L.C.; Joner, G. Use of cod liver oil during the first year of life is associated with lower risk of childhood-onset type 1 diabetes: A large, population-based, case-control study. Am. J. Clin. Nutr. 2003, 78, 1128–1134. [Google Scholar] [CrossRef] [Green Version]
- Savastio, S.; Cadario, F.; Genoni, G.; Bellomo, G.; Bagnati, M.; Secco, G.; Picchi, R.; Giglione, E.; Bona, G. Vitamin D Deficiency and Glycemic Status in Children and Adolescents with Type 1 Diabetes Mellitus. PLoS ONE 2016, 11, e0162554. [Google Scholar] [CrossRef] [Green Version]
- Castano, L.; Madariaga, L.; Grau, G.; García-Castaño, A. 25(OH)Vitamin D Deficiency and Calcifediol Treatment in Pediatrics. Nutrients 2022, 14, 1854. [Google Scholar] [CrossRef]
- Choe, Y.; Lee, Y.J.; Kim, J.H.; Lee, K.; Shin, C.H.; Lee, Y.A.; Song, J. Free, bioavailable 25-hydroxyvitamin D levels and their association with diabetic ketoacidosis in children with type 1 diabetes at diagnosis. Front. Endocrinol. 2022, 13, 997631. [Google Scholar] [CrossRef] [PubMed]
- Guillen-Guio, B.; Lorenzo-Salazar, J.M.; Gonzalez-Montelongo, R.; De Usera, A.D.; Marcelino-Rodrıguez, I.; Corrales, A.; De Leon, A.C.; Alonso, S.; Flores, C. Genomic analyses of human European diversity at the southwestern edge: Isolation, African influence and disease associations in the Canary Islands. Mol. Biol. Evol. 2018, 35, 3010–3026. [Google Scholar] [CrossRef] [PubMed] [Green Version]
- Available online: https://www.ine.es/daco/daco42/bme/c19.pdf (accessed on 15 March 2023).
- Bakay, M.; Pandey, R.; Grant, S.F.A.; Hakonarson, H. The Genetic Contribution to Type 1 Diabetes. Curr. Diab. Rep. 2019, 19, 116. [Google Scholar] [CrossRef]
- Andersen, R.; Brot, C.; Jakobsen, J.; Mejborn, H.; Mølgaard, C.; Skovgaard, L.T.; Trolle, E.; Tetens, I.; Ovesen, L. Seasonal changes in vitamin D status among Danish adolescent girls and elderly women: The influence of sun exposure and vitamin D intake. Eur. J. Clin. Nutr. 2013, 67, 270–274. [Google Scholar] [CrossRef]
- Li, F.; Li, Y.-Y.; Liu, M.-J.; Fang, L.-Q.; Dean, N.E.; Wong, G.W.K.; Yang, X.-B.; Longini, I.; Halloran, M.E.; Wang, H.-J.; et al. Household transmission of SARS-CoV-2 and risk factors for susceptibility and infectivity in Wuhan: A retrospective observational study. Lancet Infect. Dis. 2021, 21, 617–628. [Google Scholar] [CrossRef] [PubMed]
- Norris, J.M.; Lee, H.-S.; Frederiksen, B.; Erlund, I.; Uusitalo, U.; Yang, J.; Lernmark, Å.; Simell, O.; Toppari, J.; Rewers, M.; et al. Plasma 25-Hydroxyvitamin D Concentration and Risk of Islet Autoimmunity. Diabetes 2018, 67, 146–154. [Google Scholar] [CrossRef] [Green Version]
- Hyppönen, E.; Läärä, E.; Reunanen, A.; Järvelin, M.-R.; Virtanen, S.M. Intake of vitamin D and risk of type 1 diabetes: A birth-cohort study. Lancet 2001, 358, 1500–1503. [Google Scholar] [CrossRef]
- Infante, M.; Ricordi, C.; Sanchez, J.; Clare-Salzler, M.J.; Padilla, N.; Fuenmayor, V.; Chavez, C.; Alvarez, A.; Baidal, D.; Alejandro, R.; et al. Influence of Vitamin D on Islet Autoimmunity and Beta-Cell Function in Type 1 Diabetes. Nutrients 2019, 11, 2185. [Google Scholar] [CrossRef] [Green Version]
- Pedro, J.I.S.-; Bilbao, J.R.; Perez de Nanclares, G.; Vitoria, J.C.; Martul, P.; Castaño, L. Heterogeneity of vitamin D receptor gene association with celiac disease and type 1 diabetes mellitus. Autoimmunity 2005, 38, 439–444. [Google Scholar] [CrossRef]
- Martí, G.; Audí, L.; Esteban, C.; Oyarzábal, M.; Chueca, M.; Gussinyé, M.; Yeste, D.; Fernández-Cancio, M.; Andaluz, P.; Carrascosa, A. Asociación de los polimorfismos del gen del receptor de la vitamina D con la diabetes mellitus tipo 1 en dos poblaciones españolas. Med. Clin. 2004, 123, 286–290. [Google Scholar] [CrossRef]
- Panjiyar, R.P.; Dayal, D.; Attri, S.V.; Sachdeva, N.; Sharma, R.; Bhalla, A.K. Sustained serum 25-hydroxyvitamin D concentrations for one year with cholecalciferol supplementation improves glycaemic control and slows the decline of residual β cell function in children with type 1 diabetes. Pediatr. Endocrinol. Diabetes Metab. 2018, 24, 111–117. [Google Scholar] [CrossRef] [PubMed]
- Nascimento, B.F.; Moreira, C.F.F.; da Fonseca, E.R.; Fedeszen, P.M.K.; de Paula, T.P.; de Sena, A.S.S.; de Almeida, N.F.A.; Bandeira Filho, O.C.d.S.; Curval, D.R.; Padilha, P. de C. Effects of vitamin D supplementation on glycemic control of children and adolescents with type 1 diabetes mellitus: A systematic review. J. Pediatr. Endocrinol. Metab. 2022, 35, 973–988. [Google Scholar] [CrossRef] [PubMed]
- Bierschenk, L.; Alexander, J.; Wasserfall, C.; Haller, M.; Schatz, D.; Atkinson, M. Vitamin D levels in subjects with and without type 1 diabetes residing in a solar rich environment. Diabetes Care 2009, 32, 1977–1979. [Google Scholar] [CrossRef] [PubMed] [Green Version]
- Chen, X.; Fu, J.; Qian, Y.; Zhi, X.; Pu, L.; Gu, C.; Shu, J.; Lv, L.; Cai, C. Vitamin D levels and Vitamin D-related gene polymorphisms in Chinese children with type 1 diabetes. Front. Pediatr. 2022, 10, 965296. [Google Scholar] [CrossRef] [PubMed]
- Greer, R.M.; Portelli, S.L.; Hung, B.S.-M.; Cleghorn, G.J.; McMahon, S.K.; Batch, J.A.; Conwell, L.S. Serum vitamin D levels are lower in Australian children and adolescents with type 1 diabetes than in children without diabetes. Pediatr. Diabetes 2013, 14, 31–41. [Google Scholar] [CrossRef]
- Svoren, B.M.; Volkening, L.K.; Wood, J.R.; Laffel, L.M.B. Significant Vitamin D Deficiency in Youth with Type 1 Diabetes Mellitus. J. Pediatr. 2009, 154, 132–134. [Google Scholar] [CrossRef] [Green Version]
- Available online: https://www.aemet.es/es/serviciosclimaticos/datosclimatologicos/valoresclimatologicos#tab2 (accessed on 10 January 2023).
- Bener, A.; Al-Ali, M.; Hoffmann, G.F. Vitamin D deficiency in healthy children in a sunny country: Associated factors. Int. J. Food Sci. Nutr. 2009, 60, 60–70. [Google Scholar] [CrossRef]
- Pulungan, A.; Soesanti, F.; Tridjaja, B.; Batubara, J. Vitamin D insufficiency and its contributing factors in primary school-aged children in Indonesia, a sun-rich country. Ann. Pediatr. Endocrinol. Metab. 2021, 26, 92–98. [Google Scholar] [CrossRef]
- Brody, J.; Pinhas-Hamiel, O.; Landau, Z.; Adar, A.; Bistritzer, T.; Rachmiel, M. Vitamin D status in Israeli pediatric type 1 diabetes patients: The AWeSoMe Study Group experience and literature review. J. Pediatr. Endocrinol. Metab. 2020, 33, 323–330. [Google Scholar] [CrossRef]
- Blarduni Cardón, E.; Arrospide, A.; Angulo Ugarte, H.; Urrutia Etxebarria, I.; Castaño González, L.; Etxebarria, I.; Mar, J. La dieta como factor de riesgo de hipovitaminosis D en la población pediátrica española. Rev. Osteoporos. y Metab. Miner. 2021, 13, 122–129. [Google Scholar] [CrossRef]
- Zakharova, I.; Klimov, L.; Kuryaninova, V.; Nikitina, I.; Malyavskaya, S.; Dolbnya, S.; Kasyanova, A.; Atanesyan, R.; Stoyan, M.; Todieva, A.; et al. Vitamin D insufficiency in overweight and obese children and adolescents. Front. Endocrinol. 2019, 10, 103. [Google Scholar] [CrossRef] [PubMed] [Green Version]
- Barreiro-Bautista, M.Y.; Nóvoa Medina, O.G.J.; Tercedor, C.V.; Zamorano, G.Z.; Monzón, R.J.; Quintana, L.P.; Delgado, Y.G.; Hernández, R.M.S.; Dávila-Batista, Y.V. Prevalencia de sobrepeso y obesidad infantil en población escolar de gran canaria. Endocrinol Diabetes Nutr. 2022, 69, 124. [Google Scholar]
- Al Khalifah, R.; Al Khalifah, R.; Alsheikh, R.; Alnasser, Y.; Alnasser, Y.; Alnasser, Y.; Alsheikh, R.; Alhelali, N.; Naji, A.; Al Backer, N.; et al. The impact of vitamin D food fortification and health outcomes in children: A systematic review and meta-regression. Syst. Rev. 2020, 9, 144. [Google Scholar] [CrossRef] [PubMed]
- Al-Zubeidi, H.; Leon-Chi, L.; Newfield, R.S. Low vitamin D level in pediatric patients with new onset type 1 diabetes is common, especially if in ketoacidosis. Pediatr. Diabetes 2016, 17, 592–598. [Google Scholar] [CrossRef]
- Devidayal; Singh, M.K.; Sachdeva, N.; Singhi, S.; Attri, S.V.; Jayashree, M.; Bhalla, A.K. Vitamin D levels during and after resolution of ketoacidosis in children with new onset Type 1 diabetes. Diabet. Med. 2013, 30, 829–834. [Google Scholar] [CrossRef]
- Huynh, T.; Greer, R.M.; Nyunt, O.; Bowling, F.; Cowley, D.; Leong, G.M.; Cotterill, A.M.; Harris, M. The association between ketoacidosis and 25(OH)-vitamin D 3 levels at presentation in children with type 1 diabetes mellitus. Pediatr. Diabetes 2009, 10, 38–43. [Google Scholar] [CrossRef]


| T1D | Control | p-Value | |
|---|---|---|---|
| N | 146 | 346 | |
| Age (years) | 8.4 (3.9) | 10 (2.7) | <0.001 |
| Sex (% female) | 43 | 57 | 0.006 |
| 25OHVitamin D (ng/mL) | 29.4 (10.4) | 30.8 (10.4) | 0.17 |
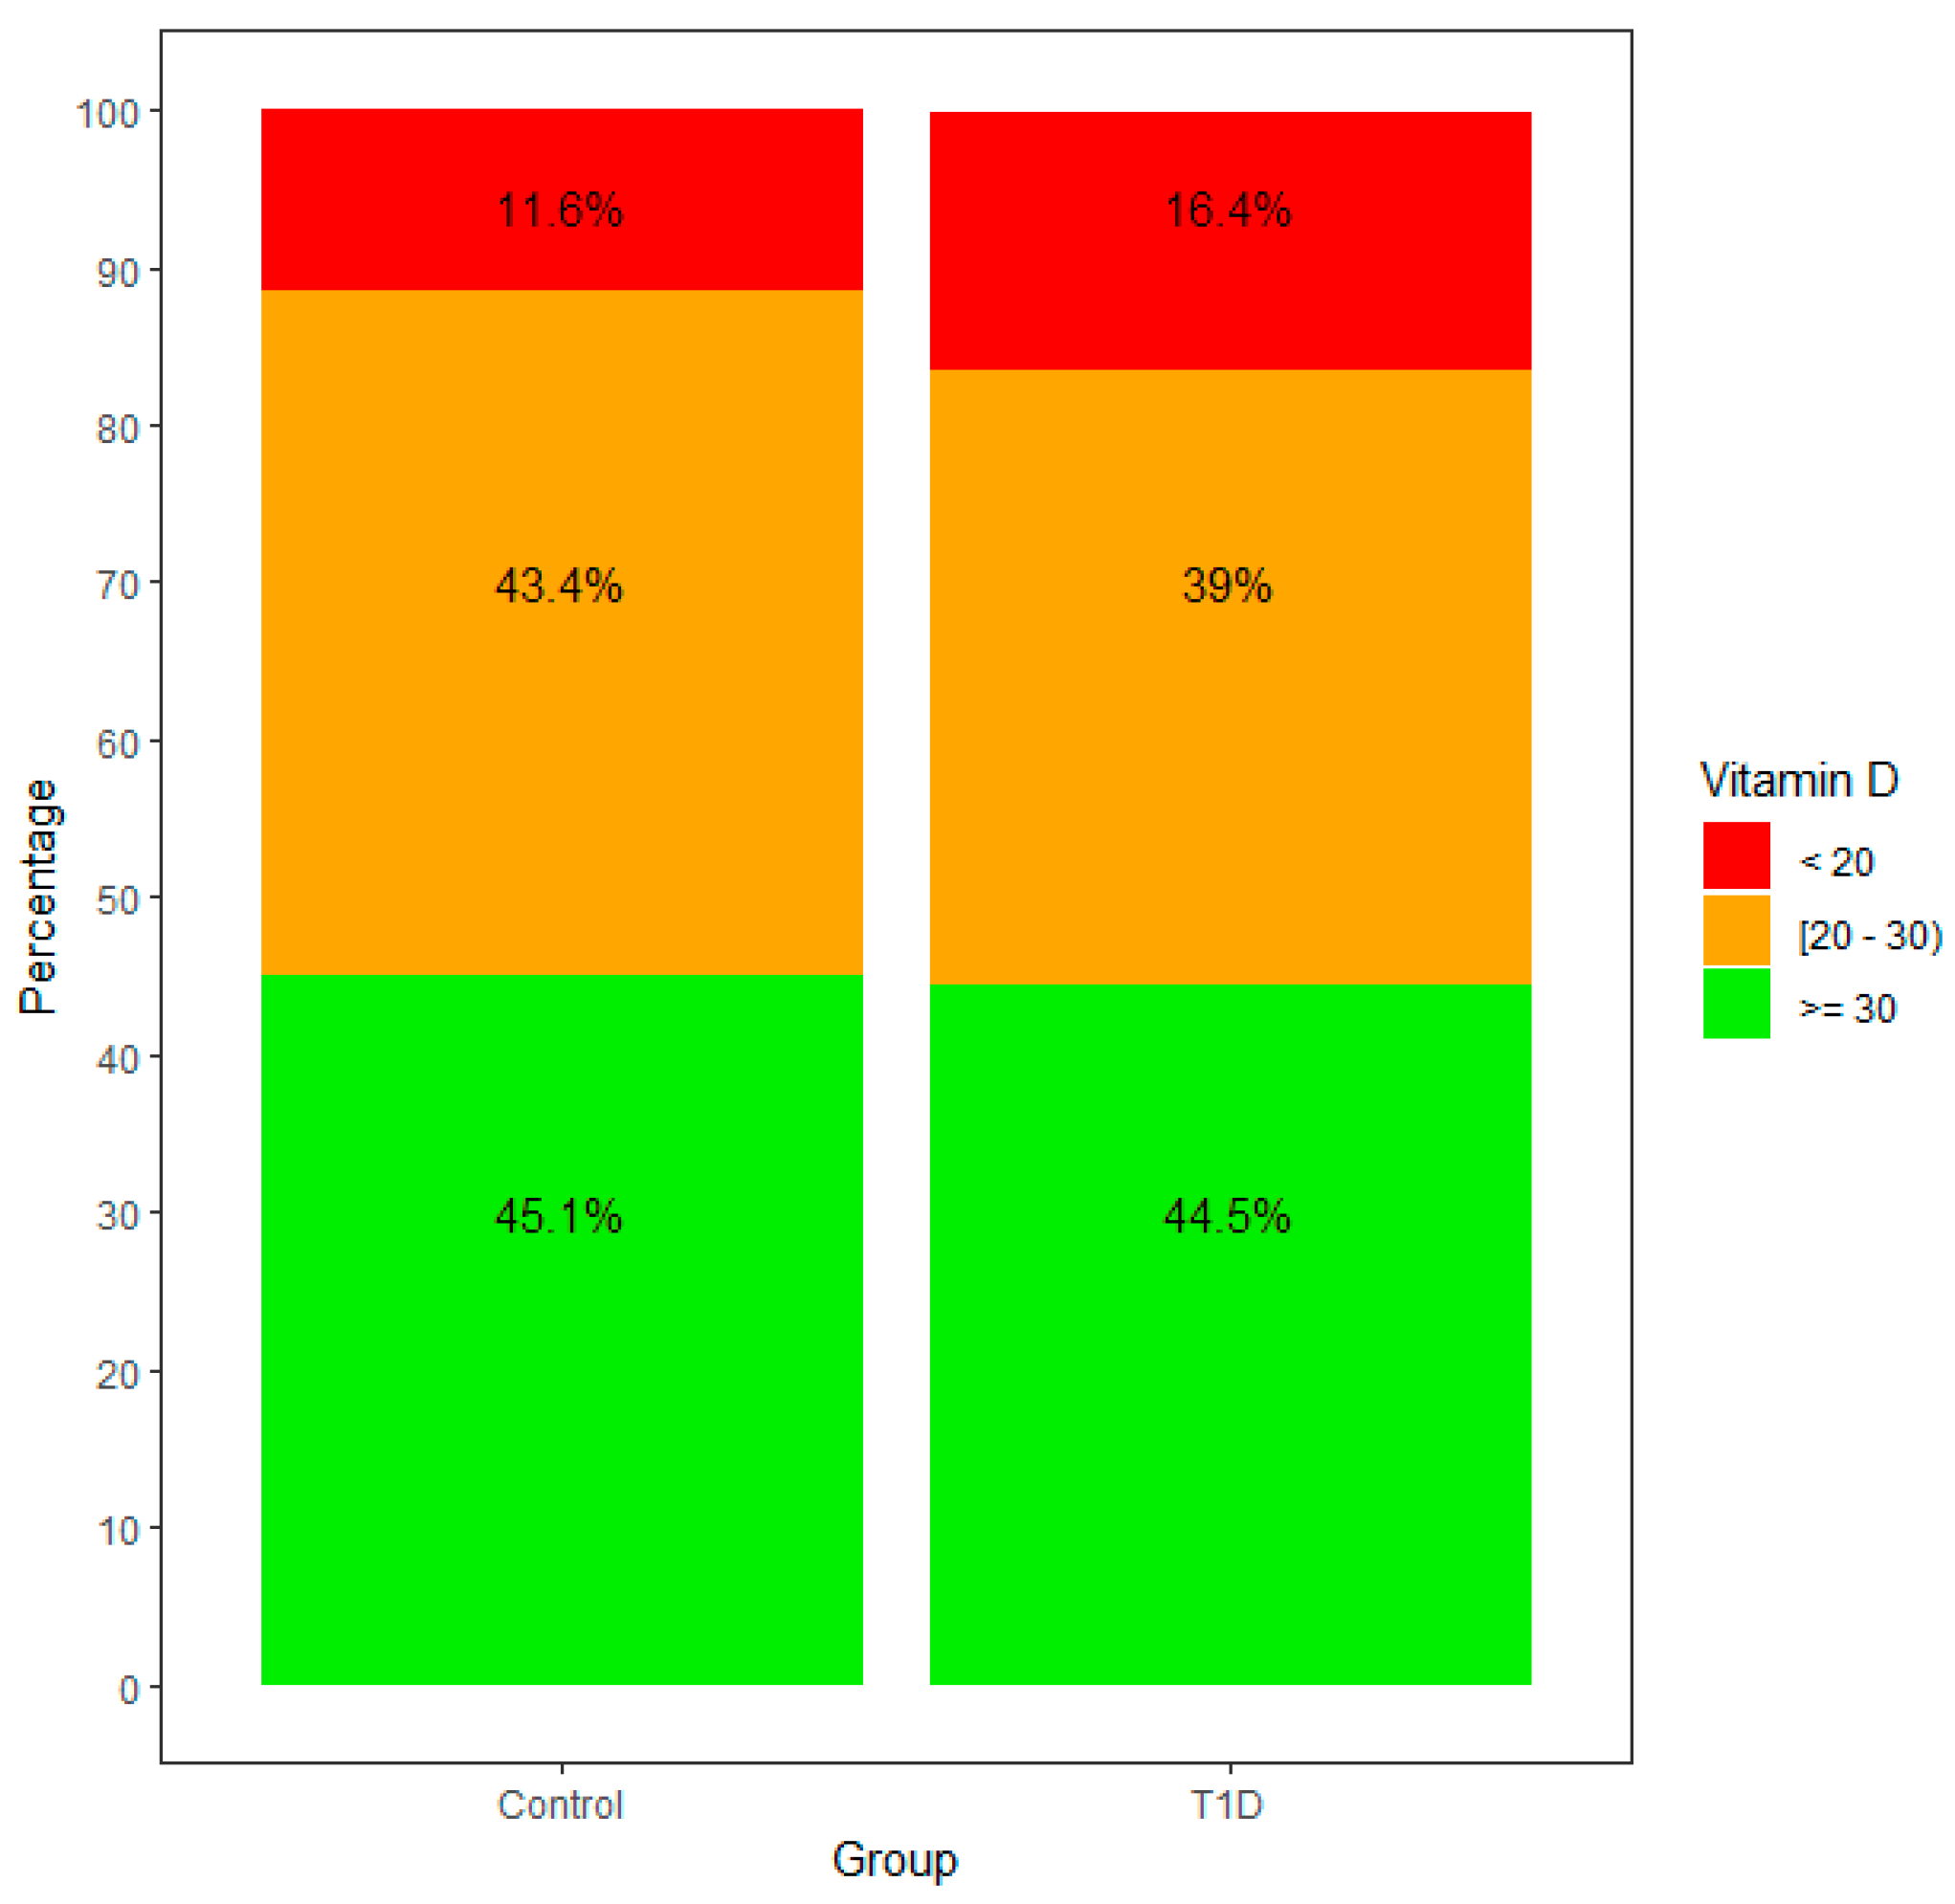
| 25OHVitamin D (%>30/<20ng/mL) | 44.5/11.6 | 45.1/16.4 | |
| BMI (Kg/m2) (median(IQR)) | 17.3 (4.5) | 17.6(6.1) | 0.8 * |
| Diagnosis | N |
|---|---|
| Short stature | 103 |
| Precocious Puberty and other pubertal disorders | 94 |
| Congenital Adrenal Hyperplasia | 25 |
| Thyroid disorders | 28 |
| Isolated non-diabetic hyperglycemia | 18 |
| Hypoglycemia | 3 |
| Gender dysphoria | 4 |
| Hypercholesterolemia | 5 |
| No endocrine disorder | 16 |
| Others | 21 |
| Variables | Multivariate Analysis | |||
|---|---|---|---|---|
| b | B | CI (95%) | pval | |
| Intercept | 31.37 | - | 27.62–35.13 | <000.1 |
| Age | −0.35 | −0.11 | −0.64–−0.07 | 0.01 |
| Sex: F | −1.34 | −0.06 | −3.13–0.46 | 0.14 |
| Group: T1D | −2.18 | −0.1 | −4.17–−0.2 | 0.03 |
| Season: Winter | (ref) | |||
| Season: Spring | 0.92 | 0.04 | −1.55–3.4 | 0.46 |
| Season: Summer | 8.34 | 0.37 | 5.9–10.77 | <000.1 |
| Season: Autumn | 5.11 | 0.2 | 2.46–7.76 | <000.1 |
| AIC | 3643.33 | |||
| Adjusted R2 | 0.12 | |||
| Variables | Multivariate Analisis (All Variables) | ||||
|---|---|---|---|---|---|
| b | EE | B | IC (95%) | pval | |
| Intercept | 31.57 | 1.91 | - | 27.8–35.3 | <000.1 |
| Age | −0.38 | 0.15 | −0.12 | −0.6–−0.09 | 0.009 |
| Sex: F | −1.14 | 0.91 | −0.06 | −2.9–0.6 | 0.207 |
| Control group | (ref) | ||||
| T1D with acidosis (N = 59) | −5.31 | 1.41 | −0.17 | −8–−2.5 | <000.1 |
| T1D without acidosis (N = 79) | −0.63 | 1.23 | −0.02 | −3–1.78 | 0.608 |
| Season: Winter | (ref) | ||||
| Season: Spring | 0.77 | 1.25 | 0.03 | −1.6–3.2 | 0.54 |
| Season: Summer | 8.4 | 1.22 | 0.37 | 6–10.8 | <000.1 |
| Season: Autumn | 4.95 | 1.34 | 0.19 | 2.3–7.5 | <000.1 |
| AIC | 3567.15 | ||||
| Adjusted R2 | 0.14 | ||||
Disclaimer/Publisher’s Note: The statements, opinions and data contained in all publications are solely those of the individual author(s) and contributor(s) and not of MDPI and/or the editor(s). MDPI and/or the editor(s) disclaim responsibility for any injury to people or property resulting from any ideas, methods, instructions or products referred to in the content. |
© 2023 by the authors. Licensee MDPI, Basel, Switzerland. This article is an open access article distributed under the terms and conditions of the Creative Commons Attribution (CC BY) license (https://creativecommons.org/licenses/by/4.0/).
Share and Cite
Nóvoa-Medina, Y.; Barreiro-Bautista, M.; Perdomo-Quinteiro, M.; González-Martín, J.M.; Quinteiro-González, S.; Domínguez, Á.; Cabrera, M.; López, S.; Pavlovic, S.; Wägner, A.M. 25OHVitamin D Levels in a Canarian Pediatric Population with and without Type 1 Diabetes: The Role of Acidosis. Nutrients 2023, 15, 3067. https://doi.org/10.3390/nu15133067
Nóvoa-Medina Y, Barreiro-Bautista M, Perdomo-Quinteiro M, González-Martín JM, Quinteiro-González S, Domínguez Á, Cabrera M, López S, Pavlovic S, Wägner AM. 25OHVitamin D Levels in a Canarian Pediatric Population with and without Type 1 Diabetes: The Role of Acidosis. Nutrients. 2023; 15(13):3067. https://doi.org/10.3390/nu15133067
Chicago/Turabian StyleNóvoa-Medina, Yeray, Marta Barreiro-Bautista, Marta Perdomo-Quinteiro, Jesús María González-Martín, Sofía Quinteiro-González, Ángela Domínguez, María Cabrera, Sara López, Svetlana Pavlovic, and Ana M. Wägner. 2023. "25OHVitamin D Levels in a Canarian Pediatric Population with and without Type 1 Diabetes: The Role of Acidosis" Nutrients 15, no. 13: 3067. https://doi.org/10.3390/nu15133067