
Nanoparticle Size Threshold for Magnetic Agglomeration and Associated Hyperthermia Performance


Instituto de Investigacións Tecnolóxicas and Applied Physics Department, Universidade de Santiago de Compostela, 15782 Santiago de Compostela, Spain
*
Author to whom correspondence should be addressed.
Nanomaterials 2021, 11(11), 2786; https://doi.org/10.3390/nano11112786
Submission received: 30 September 2021
/
Revised: 15 October 2021
/
Accepted: 16 October 2021
/
Published: 21 October 2021
(This article belongs to the Special Issue Interactions Effects in Nanoscaled Magnetic Assemblies)
Abstract
:The likelihood of magnetic nanoparticles to agglomerate is usually estimated through the ratio between magnetic dipole-dipole and thermal energies, thus neglecting the fact that, depending on the magnitude of the magnetic anisotropy constant (K), the particle moment may fluctuate internally and thus undermine the agglomeration process. Based on the comparison between the involved timescales, we study in this work how the threshold size for magnetic agglomeration () varies depending on the K value. Our results suggest that small variations in K-due to, e.g., shape contribution, might shift by a few nm. A comparison with the usual superparamagnetism estimation is provided, as well as with the energy competition approach. In addition, based on the key role of the anisotropy in the hyperthermia performance, we also analyse the associated heating capability, as non-agglomerated particles would be of high interest for the application.
1. Introduction
Based on the possibility to achieve local actuation by a harmless remote magnetic field, magnetic nanoparticles (MNPs) are very attractive candidates for novel medical applications [1,2]. Particularly iron oxides, based on their good biocompatibility [3], have been the subject of intense research in recent years, for example for magnetic hyperthermia cancer therapy [4,5] or drug release [6,7]. A key aspect defining the performance of the MNPs under external magnetic fields is their magnetic anisotropy, as it allows them to transform the absorbed electromagnetic energy into the required physical stimuli to promote specific cell behaviours, acting, in practice, as medical nanorobots [8].
Another key aspect to consider when dealing with magnetic nanoparticles for biomedical applications is the agglomeration likelihood, as it could affect not only the metabolising process but also the magnetic properties by changing the interparticle interactions [9]. Considering for example magnetic hyperthermia, it is known that the particles tend to agglomerate when internalized by the cells and such may lead to a decrease of the heating performance [10]. However, the opposite behaviour has also been reported, with an increase of the heat release if the particles form chains [11]. The problem is that while accounting for the effect of interparticle dipolar interactions is of primary importance for a successful application [12], the usual estimate of agglomeration likelihood, i.e., the ratio between the dipolar energy of parallel-aligned moments and thermal energy [13,14],
in the limit case of touching particles (i.e., ), does not consider the magnetic anisotropy despite its key role in governing the magnetisation behaviour. In Equation (1), Tm/A is the permeability of free space, the saturation magnetisation, and the center to center interparticle distance. In this work we suggest an approach to consider the magnetic anisotropy into the agglomeration likelihood based on the comparison of characteristic relaxation times.
The complex role of the interparticle interactions often prompts researchers to the use of superparamagnetic (SPM) particles, with the idea that the rapid internal fluctuation of the particles’ magnetic moments shall prevent their agglomeration. Thus, at the first approximation one could be tempted to consider that agglomeration will not occur for particles with blocking temperature () below the desired working temperature, since for the particles are in the SPM state (i.e., they behave as giant paramagnetic-like supermoments). However, it must be kept in mind that behaving SPM-like is not an absolute term, but it is defined by the experimental timescale. Thus, regarding agglomeration, a particle could be referred to as SPM if its Néel relaxation time, , is smaller than the characteristic timescales that allow agglomeration, i.e., diffusion () and rotation () [15]. For the simplest case of uniaxial anisotropy, can be estimated as [16]
where the prefactor usually ranges between and s, K is the uniaxial anisotropy constant, V the particle volume, and the Boltzmann constant. The diffusion time can be expressed as
where is the mean square displacement for a translating Brownian particle [17], the viscosity of the embedding media, and is the hydrodynamic radius, defined by the particle size plus a nonmagnetic coating of thickness . For simplicity we consider spherical particles of diameter d. The rotation time (also referred as Debye [18] or Brownian time [19]) is expressed as
where is the hydrodynamic volume. Extensive details about the different relaxation mechanisms can be found in Coffey et al. [20].
The objective of this work is to estimate the size threshold for magnetic agglomeration, (i.e., size for which , so that agglomeration is likely) in terms of K. Focusing on magnetite-like parameters based on its primary importance for bioapplications, we will consider different effectiveK values, which can be ascribed to dominance of shape anisotropy over the magnetocrystalline one [21,22]. Comparison will be made with the usual estimate of agglomeration likelihood, Equation (1). Then, the hyperthermia properties for the obtained will be studied. It must be recalled here the double role of K in the heating performance, as it determines both the maximum achievable heating [23,24] and the effectiveness in terms of field amplitude [25]; for completeness, this double role of K will also be briefly summarized. Please note that we are using “agglomeration” referring to a reversible process, distinct from the irreversible “aggregation” [26].
2. Results and Discussion
2.1. Size Threshold for Magnetic Agglomeration,
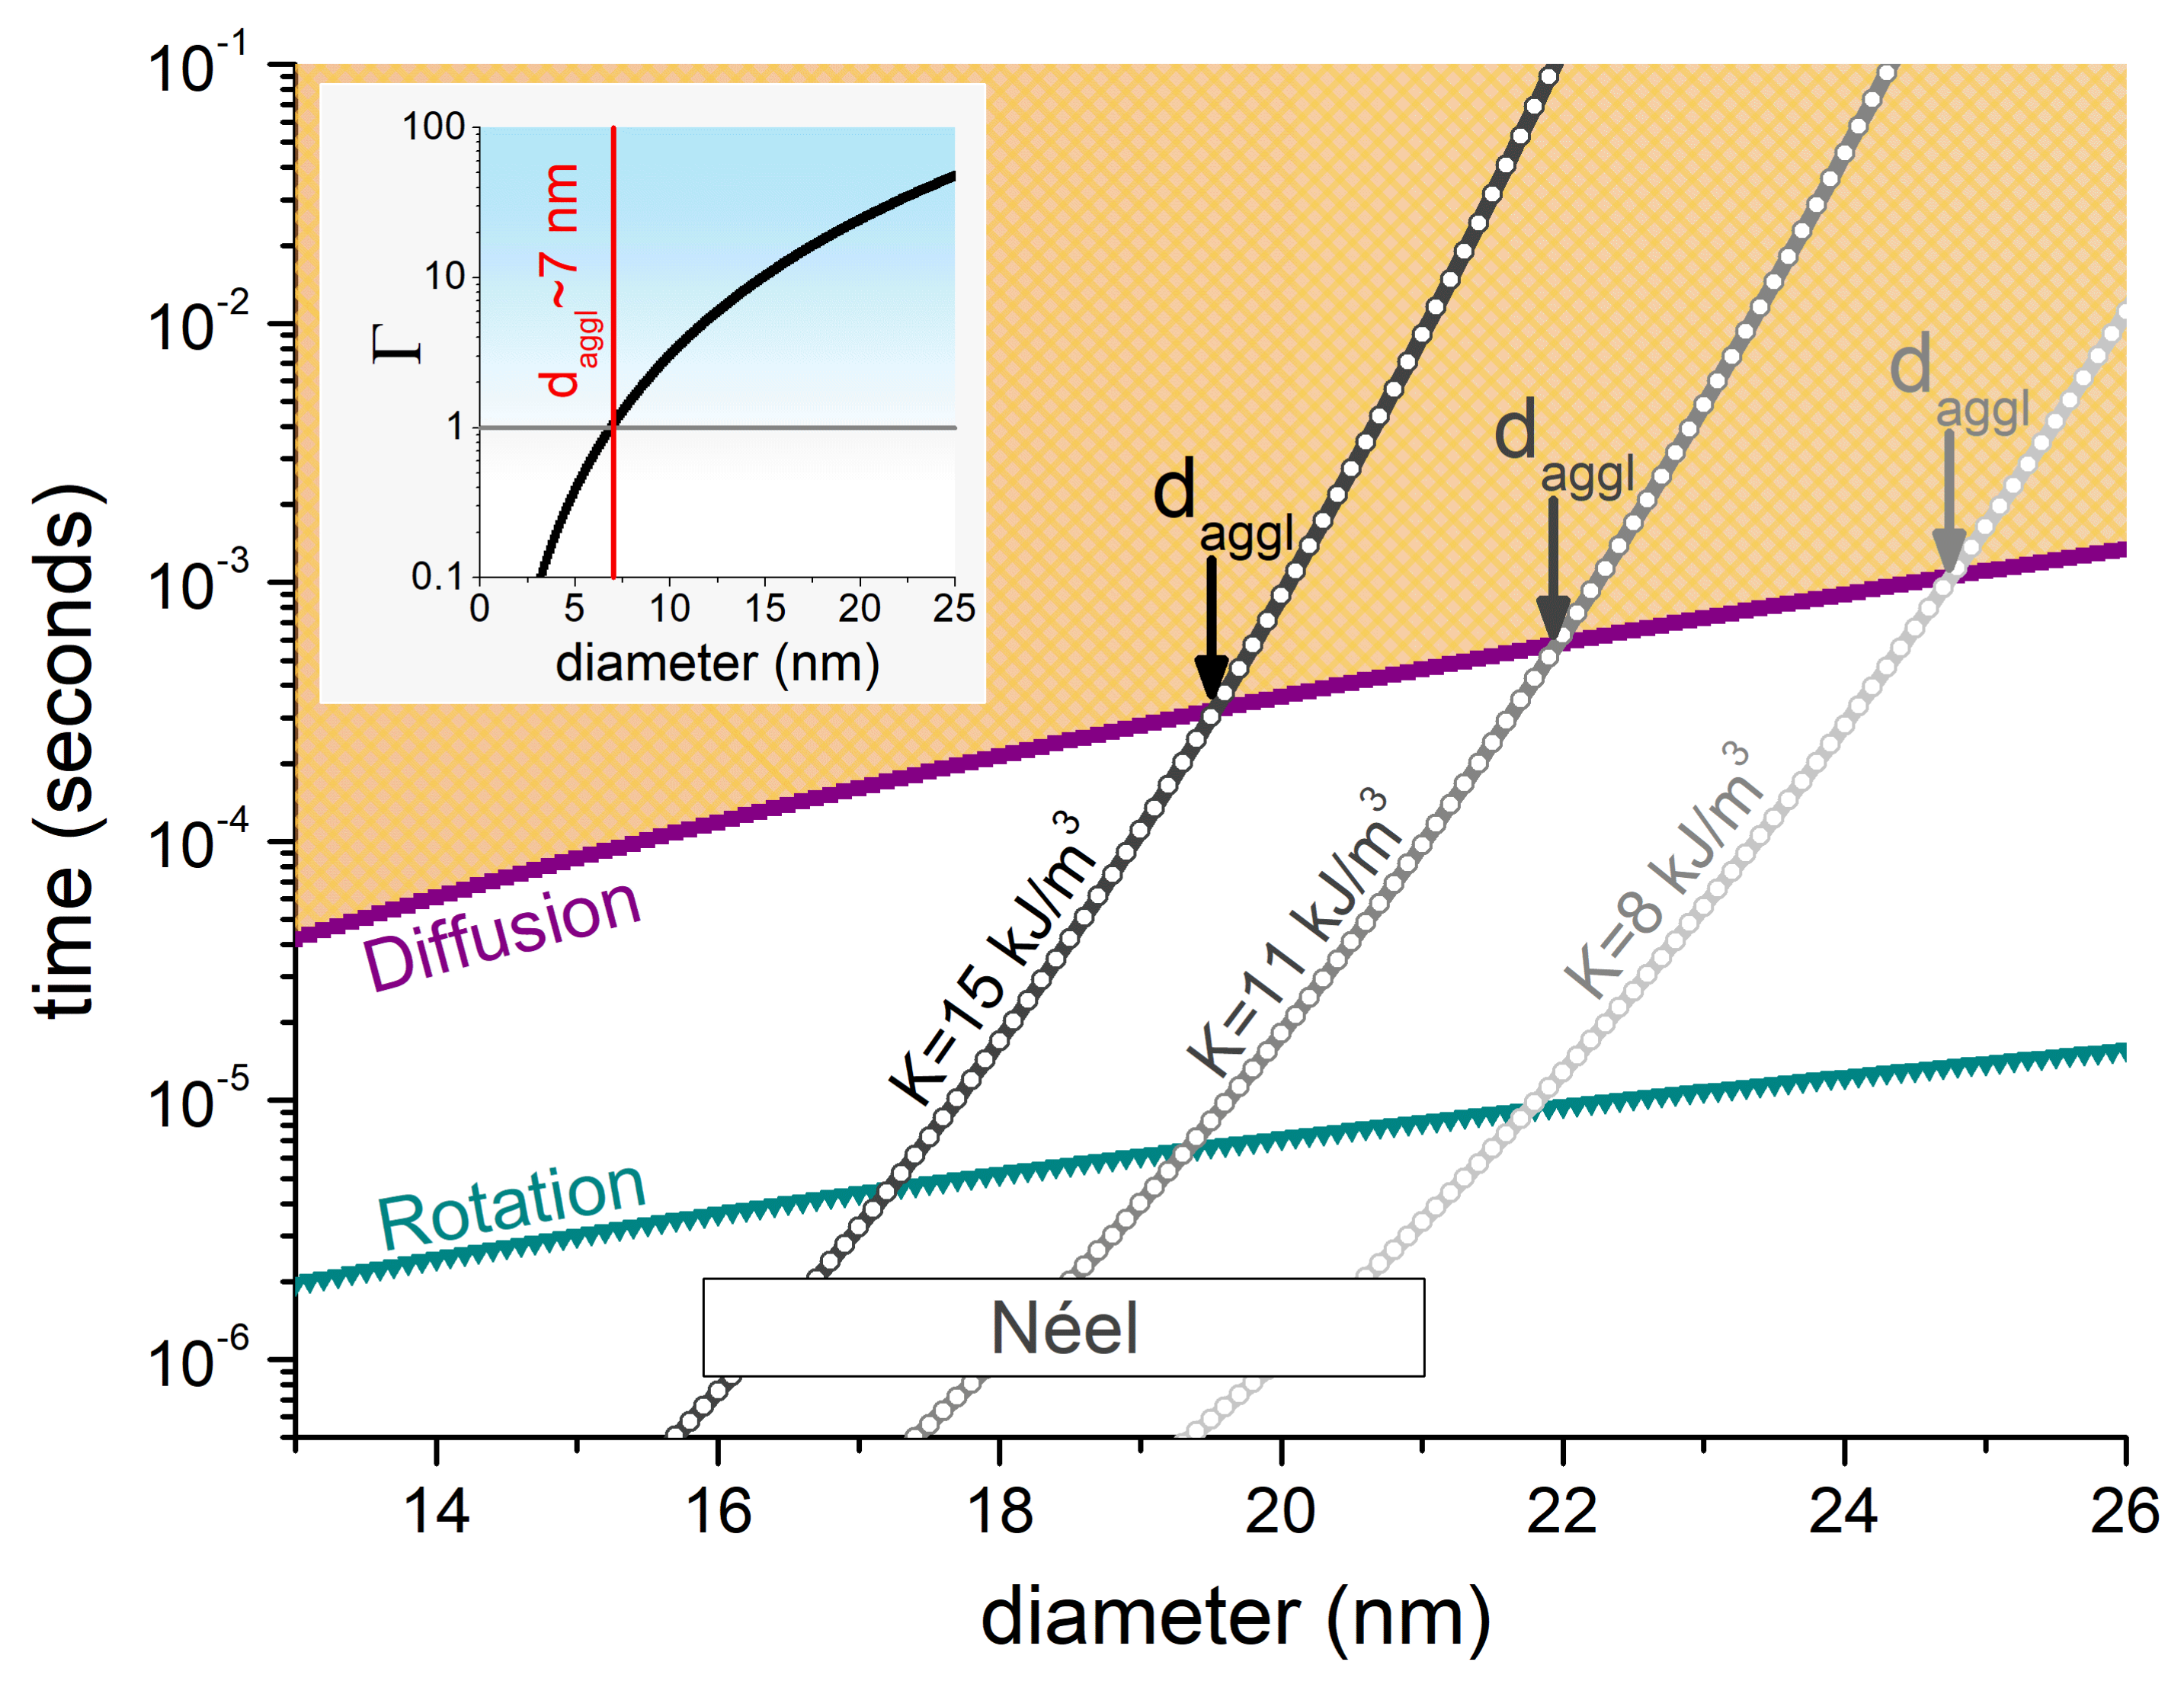
To estimate we followed the same approach as we did in Ref. [15]: to compare the characteristic Néel, diffusion, and rotation times, to obtain as the size for which . In Equations (3) and (4) we have at first set , and used kg/m·s, as in Ref. [19], which is comparable to that of HeLa cells for nm-scale dimensions [27]. We considered three cases for Equation (2): , and 15 kJ/m, i.e., values of the order found in the literature for magnetite particles [15,28,29]. The diffusion distance in Equation (3) is set as the interparticle distance at which the magnetostatic energy dominates over the thermal one, i.e., [15], so that:
Note that while we have chosen to have a well defined criterion, agglomeration usually requires higher values [30]. That is to say, we are searching for the lower boundary. With the same spirit, in Equation (1) we used A/m, i.e., the upper value for magnetite so that the interaction is, most likely, overestimated. The relaxation times as a function of the particle size are shown in Figure 1.
In Figure 1 it is clearly observed how increasing K leads to more stable moments, thus favouring agglomeration at smaller sizes (from nm for kJ/m, to nm for kJ/m). The inset shows the size dependence of , which i) does not distinguish among particle characteristics (in terms of K, as previously mentioned), and; ii) predicts the dominance of the dipolar energy for much smaller particle sizes, with nm. It is worth noting that the threshold value obtained for the kJ/m case, , is slightly bigger than the one previously reported in Ref. [15], for which nm. This is due to the larger value used here, which enhances the diffusion time (through the diffusion distance, Equation (5)). Nevertheless, the great similarity despite the different values emphasizes the key role of the anisotropy in the agglomeration likelihood. The fact that so far we are not considering a nonmagnetic coating has a minor effect, as discussed next.
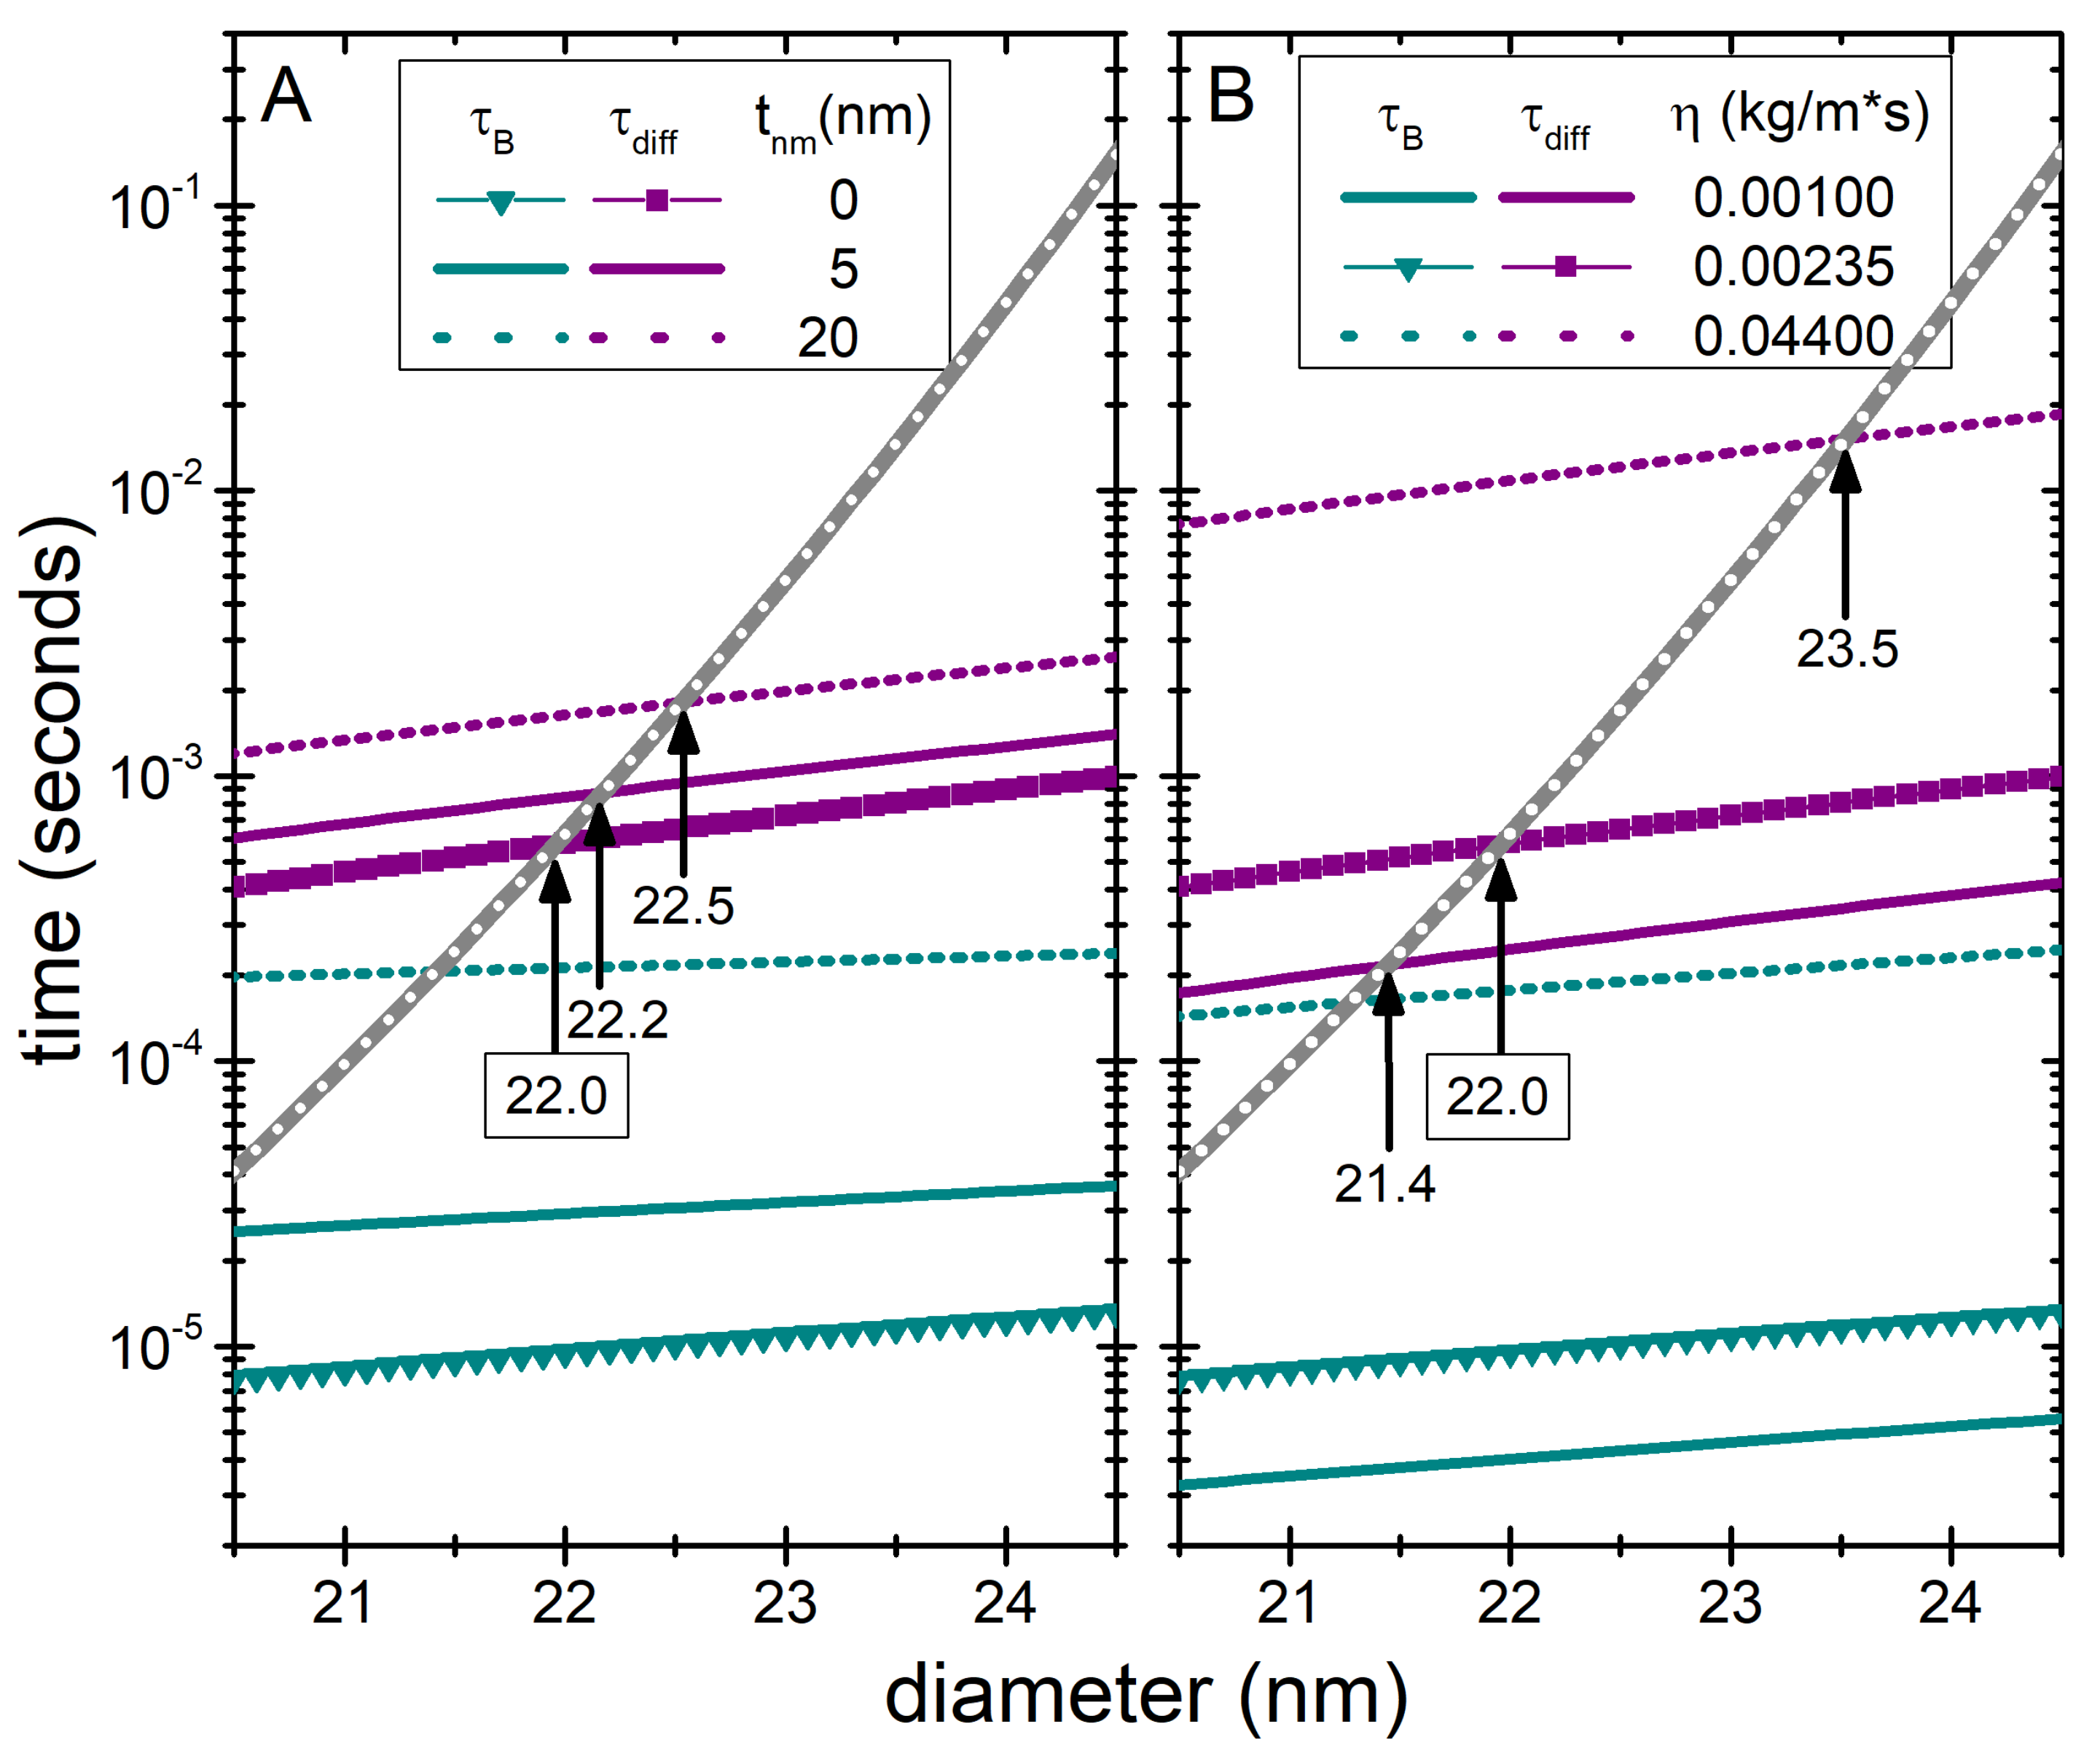
While we considered in order to determine the boundary where clustering might appear, biomedical applications will always require a biocompatible nonmagnetic coating and therefore it is important to consider its role. That being said, the analysis shows that including a non-magnetic coating does not significantly modify the obtained threshold values: if considering nm, increases just by ∼0.2 nm; and by ∼0.5 nm if nm. This is illustrated in Figure 2A.
A slightly larger influence is that of the viscosity of the embedding media, as illustrated in Figure 2B. Considering for example that of water, kg/m·s, it is observed a nm decrease from the average size. This value of viscosity is very significant because of being very similar to that of the cell’s cytoplasm, although it must be kept in mind that large variations can be observed within the same cell type and among different types of cells [31]. A much higher viscosity would have a more significant effect, as illustrated for example with the macroscopic value of HeLa cells, kg/m·s; nevertheless this values would be unrealistically high for the current particles, as such large would correspond to much bigger sizes (over ∼86 nm for HeLa cells) because of the size-dependent viscosity at the microscale [27].
It is important to note that for the anisotropy values considered here, in all cases the size threshold is always defined by the competition between diffusion and Néel times, as for all cases shown in Figure 2.
Next we will compare the predictions from the relaxation times with those obtained from zero field cooling/field cooling (ZFC/FC) measurements, the common way to estimate SPM behaviour (and thus likely non-agglomeration). Thus, if associating the onset of SPM behaviour to the blocking temperature, estimated as [32], the corresponding threshold size, , is readily obtained. The comparison between the agglomeration thresholds predicted by both approaches at room temperature (i.e., setting K) is summarized in Table 1.
Table 1 shows that, on average, the ZFC/FC approach predicts agglomeration to occur for sizes ∼ nm bigger than the ones predicted by the relaxation times approach. In fact, the obtained values correspond to a lower boundary, as they were estimated considering the limit case of no applied field, which is not possible in real ZFC/FC experiments. In general, applying the field during the measurements will result in lower [33,34,35], which would correspond to larger (at least for the monodisperse case considered here; polydispersity might result in more complex scenarios [36,37,38]).
2.2. Associated Heating Performance
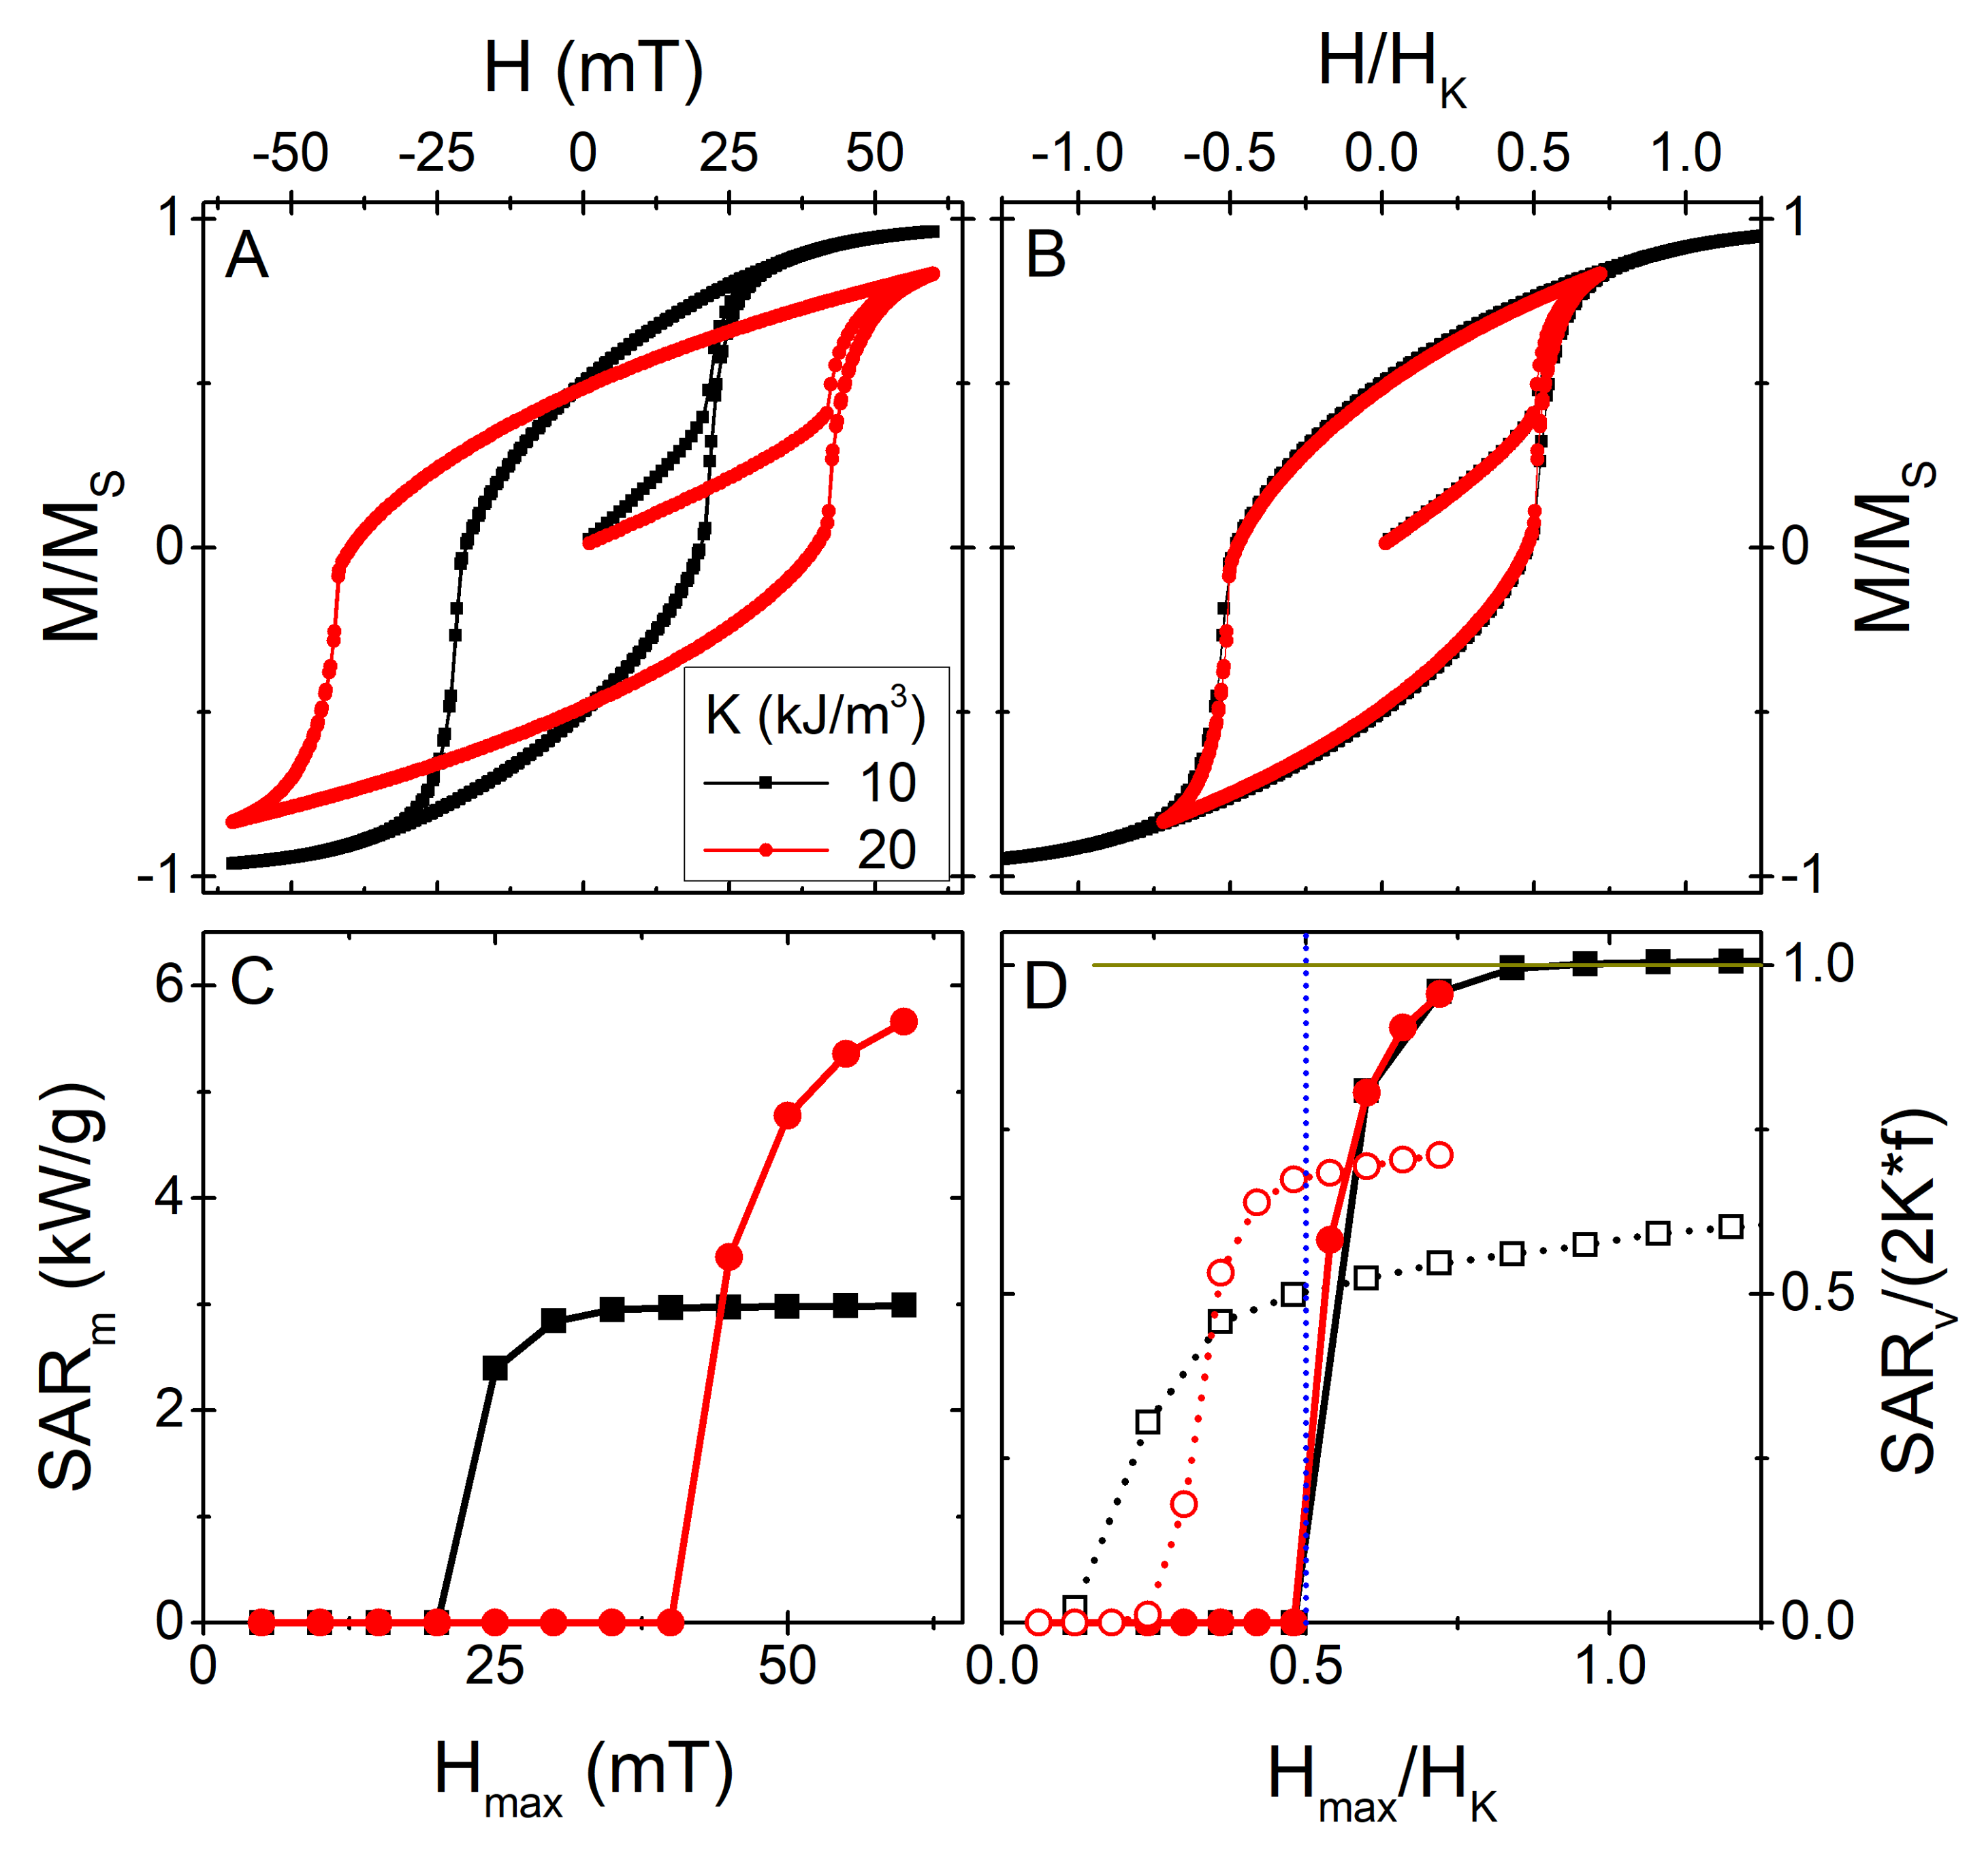
Similar to its importance on the agglomeration likelihood, the anisotropy plays a principal role in defining the hyperthermia performance. On the one hand, it defines the maximum energy that can be dissipated [4,39]: it is easy to see that for aligned easy axes the maximum hysteresis losses per loop are [40] ( for the random easy axes distribution [24]). On the other hand, it settles the response to the applied field (of amplitude ) through the anisotropy field, defined as [25,39]. This double key-role is illustrated in Figure 3, where the heating performance is reported in terms of the usual Specific Absorption Rate parameter, SAR, as , where A stands for the area of the loop (hysteresis losses), and f is the frequency of the AC field. The simulations were performed in the same way as in Ref. [15]: we considered a random dispersion of monodisperse non-interacting nanoparticles (with the easy axes directions also randomly distributed), and simulated their response under a time varying magnetic field by using the standard Landau-Lifshitz-Gilbert equation of motion within the OOMMF software package [41]; for the random thermal noise (to account for finite temperature) we used the extension module thetaevolve [42].
The results displayed in Figure 3 show how, similar to how the apparently different hysteresis loops (A panel) are scaled by the anisotropy field (B panel), the apparently different SAR vs. trends scale if plotting vs. (the factor is just for normalisation). Note, however, that those results correspond to the Stoner-Wohlfarth-like case at K [43]. In real systems with finite temperature, K also defines—as previously discussed—the stability of the magnetization within the particle. Thus, the ideal K situation may vary significantly due to the effect of thermal fluctuations, as shown by the open symbols in Figure 3D, which correspond to the K case for the two particle types considered. It is clearly observed how the strict threshold does not hold, and that the SAR is much smaller than the maximum possible.
The results shown in Figure 3 illustrate well the double role of the anisotropy on the heating performance. What is more, it must be kept in mind that the magnetic anisotropy is the only reason why small particles, such as the ones considered here of typical hyperthermia experiments (well described by the macrospin approximation) release heat under the AC field: if no anisotropy were to exist, there would be no heating (at least not for the frequencies and fields considered). This applies both to Néel and Brown heating, as with no anisotropy the magnetization would not transfer torque to the particle for its physical reorientation. Of course, larger sizes could display different heating mechanisms (due to non-coherent magnetization behaviour [44] or even eddy currents [45]), but that is not the present case.
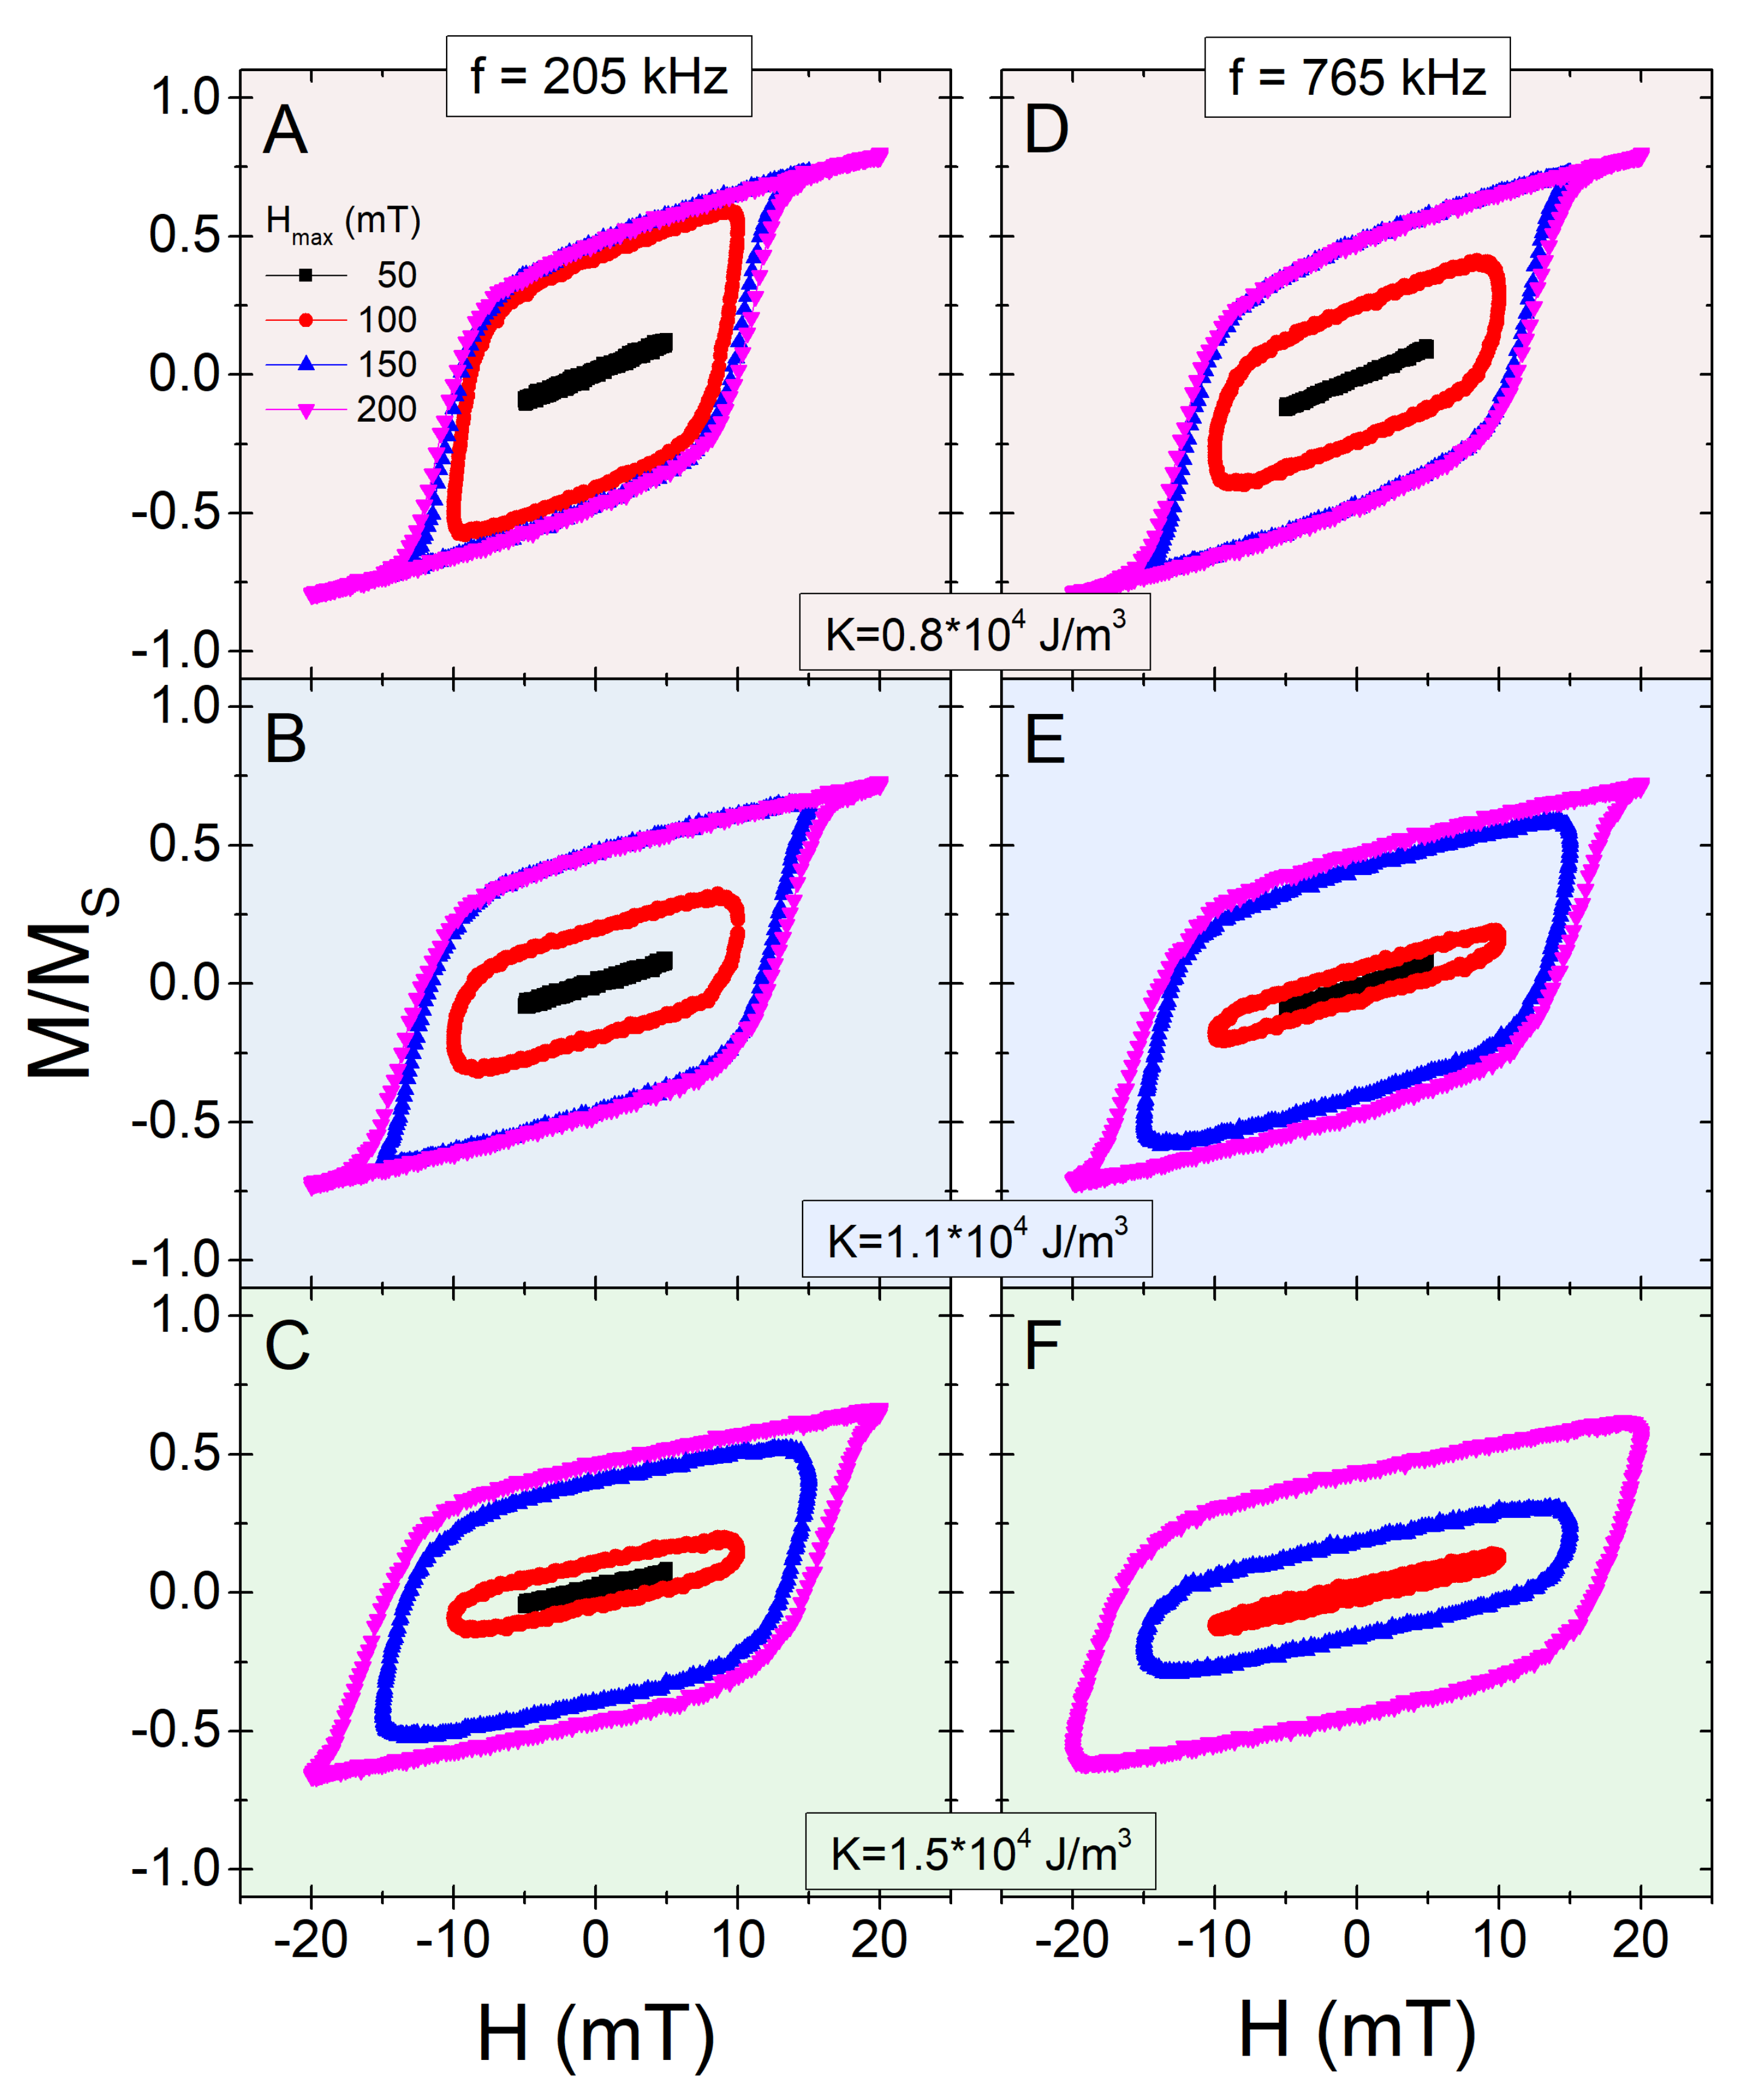
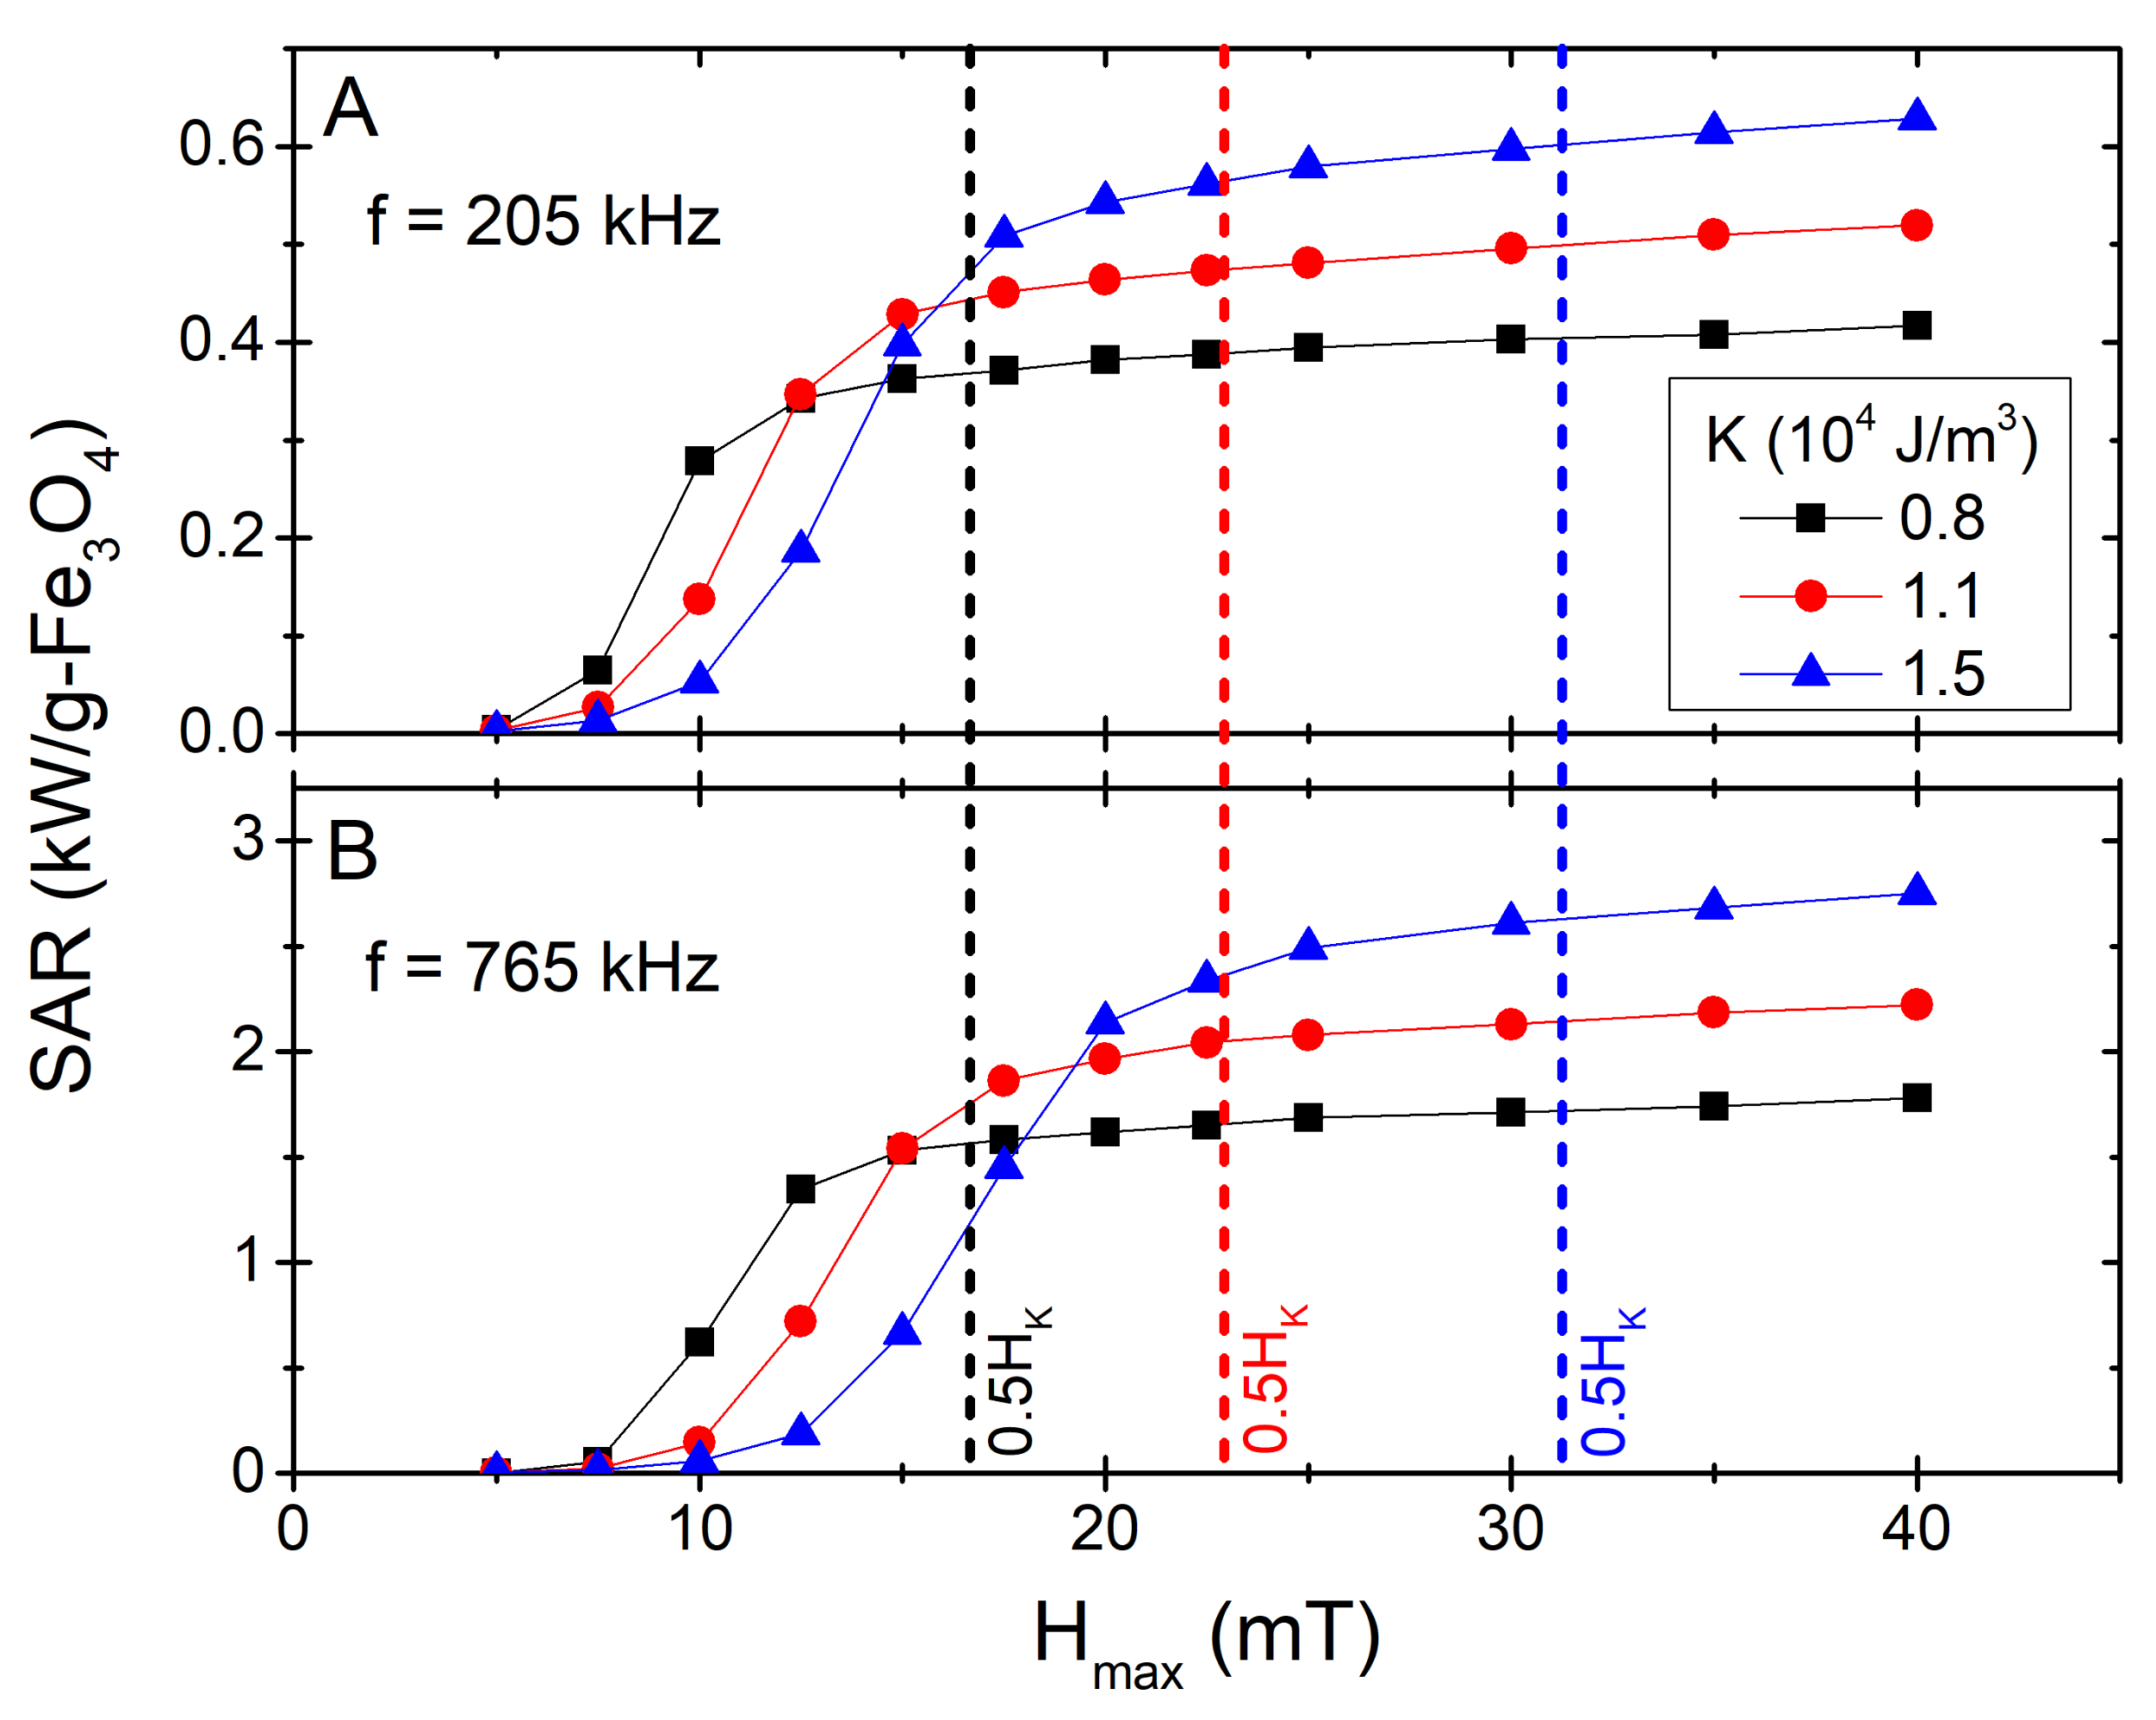
We will analyse now the hyperthermia properties of the obtained threshold sizes for the different K values. Since the roles of surface coating and media viscosity are not very significant in relation to , we have focused, for simplicity, on the pairs summarized on Table 1, which would set an ideal limit. Thus, we simulated the dynamic hysteresis loops for the three cases considered, to then evaluate the heating capability. Some representative hysteresis loops are shown in Figure 4, for a small (205 kHz) and a large (765 kHz) frequency, as reported in experimental works [11,39,46]. Note that for simplicity we have considered a random easy-axes distribution, but depending on the specific experimental conditions (particle shape and properties of the embedding media, mainly), it might occur as an easy-axes reorientation leading to different hyperthermia performance [46,47,48,49].
The results displayed in Figure 4 show large differences depending on the value of , illustrative of the minor-major loops competition [24,25]. This is further emphasized by the fact that a higher frequency results in narrower loops for the small fields, but wider for the larger ones. The differences between the different K cases are due to the different ratios, as discussed in Figure 4. This is systematically analysed through the associated SAR values, shown in Figure 5.
The results plotted in Figure 5 nicely fit within the general scenario discussed previously discussed (Figure 3): larger K allows higher SAR, provided enough field amplitude is reached (see corresponding values—vertical dashed lines—for reference); for small values, however, it may occur that smaller-K particles result in higher SAR due to the minor/major loops conditions, as discussed elsewhere [25]. This is an important aspect to consider regarding the variation in local heating due to size and/or anisotropy polydispersity [25,50]), as the difference between blocked and SPM particles would be the highest and thus also the locally released heat [25,51]. The results are also clearly divergent from the linear response theory model [19], for which ; this is not surprising as we are far from its applicability conditions (see e.g., Refs. [52,53] for a detailed discussion).
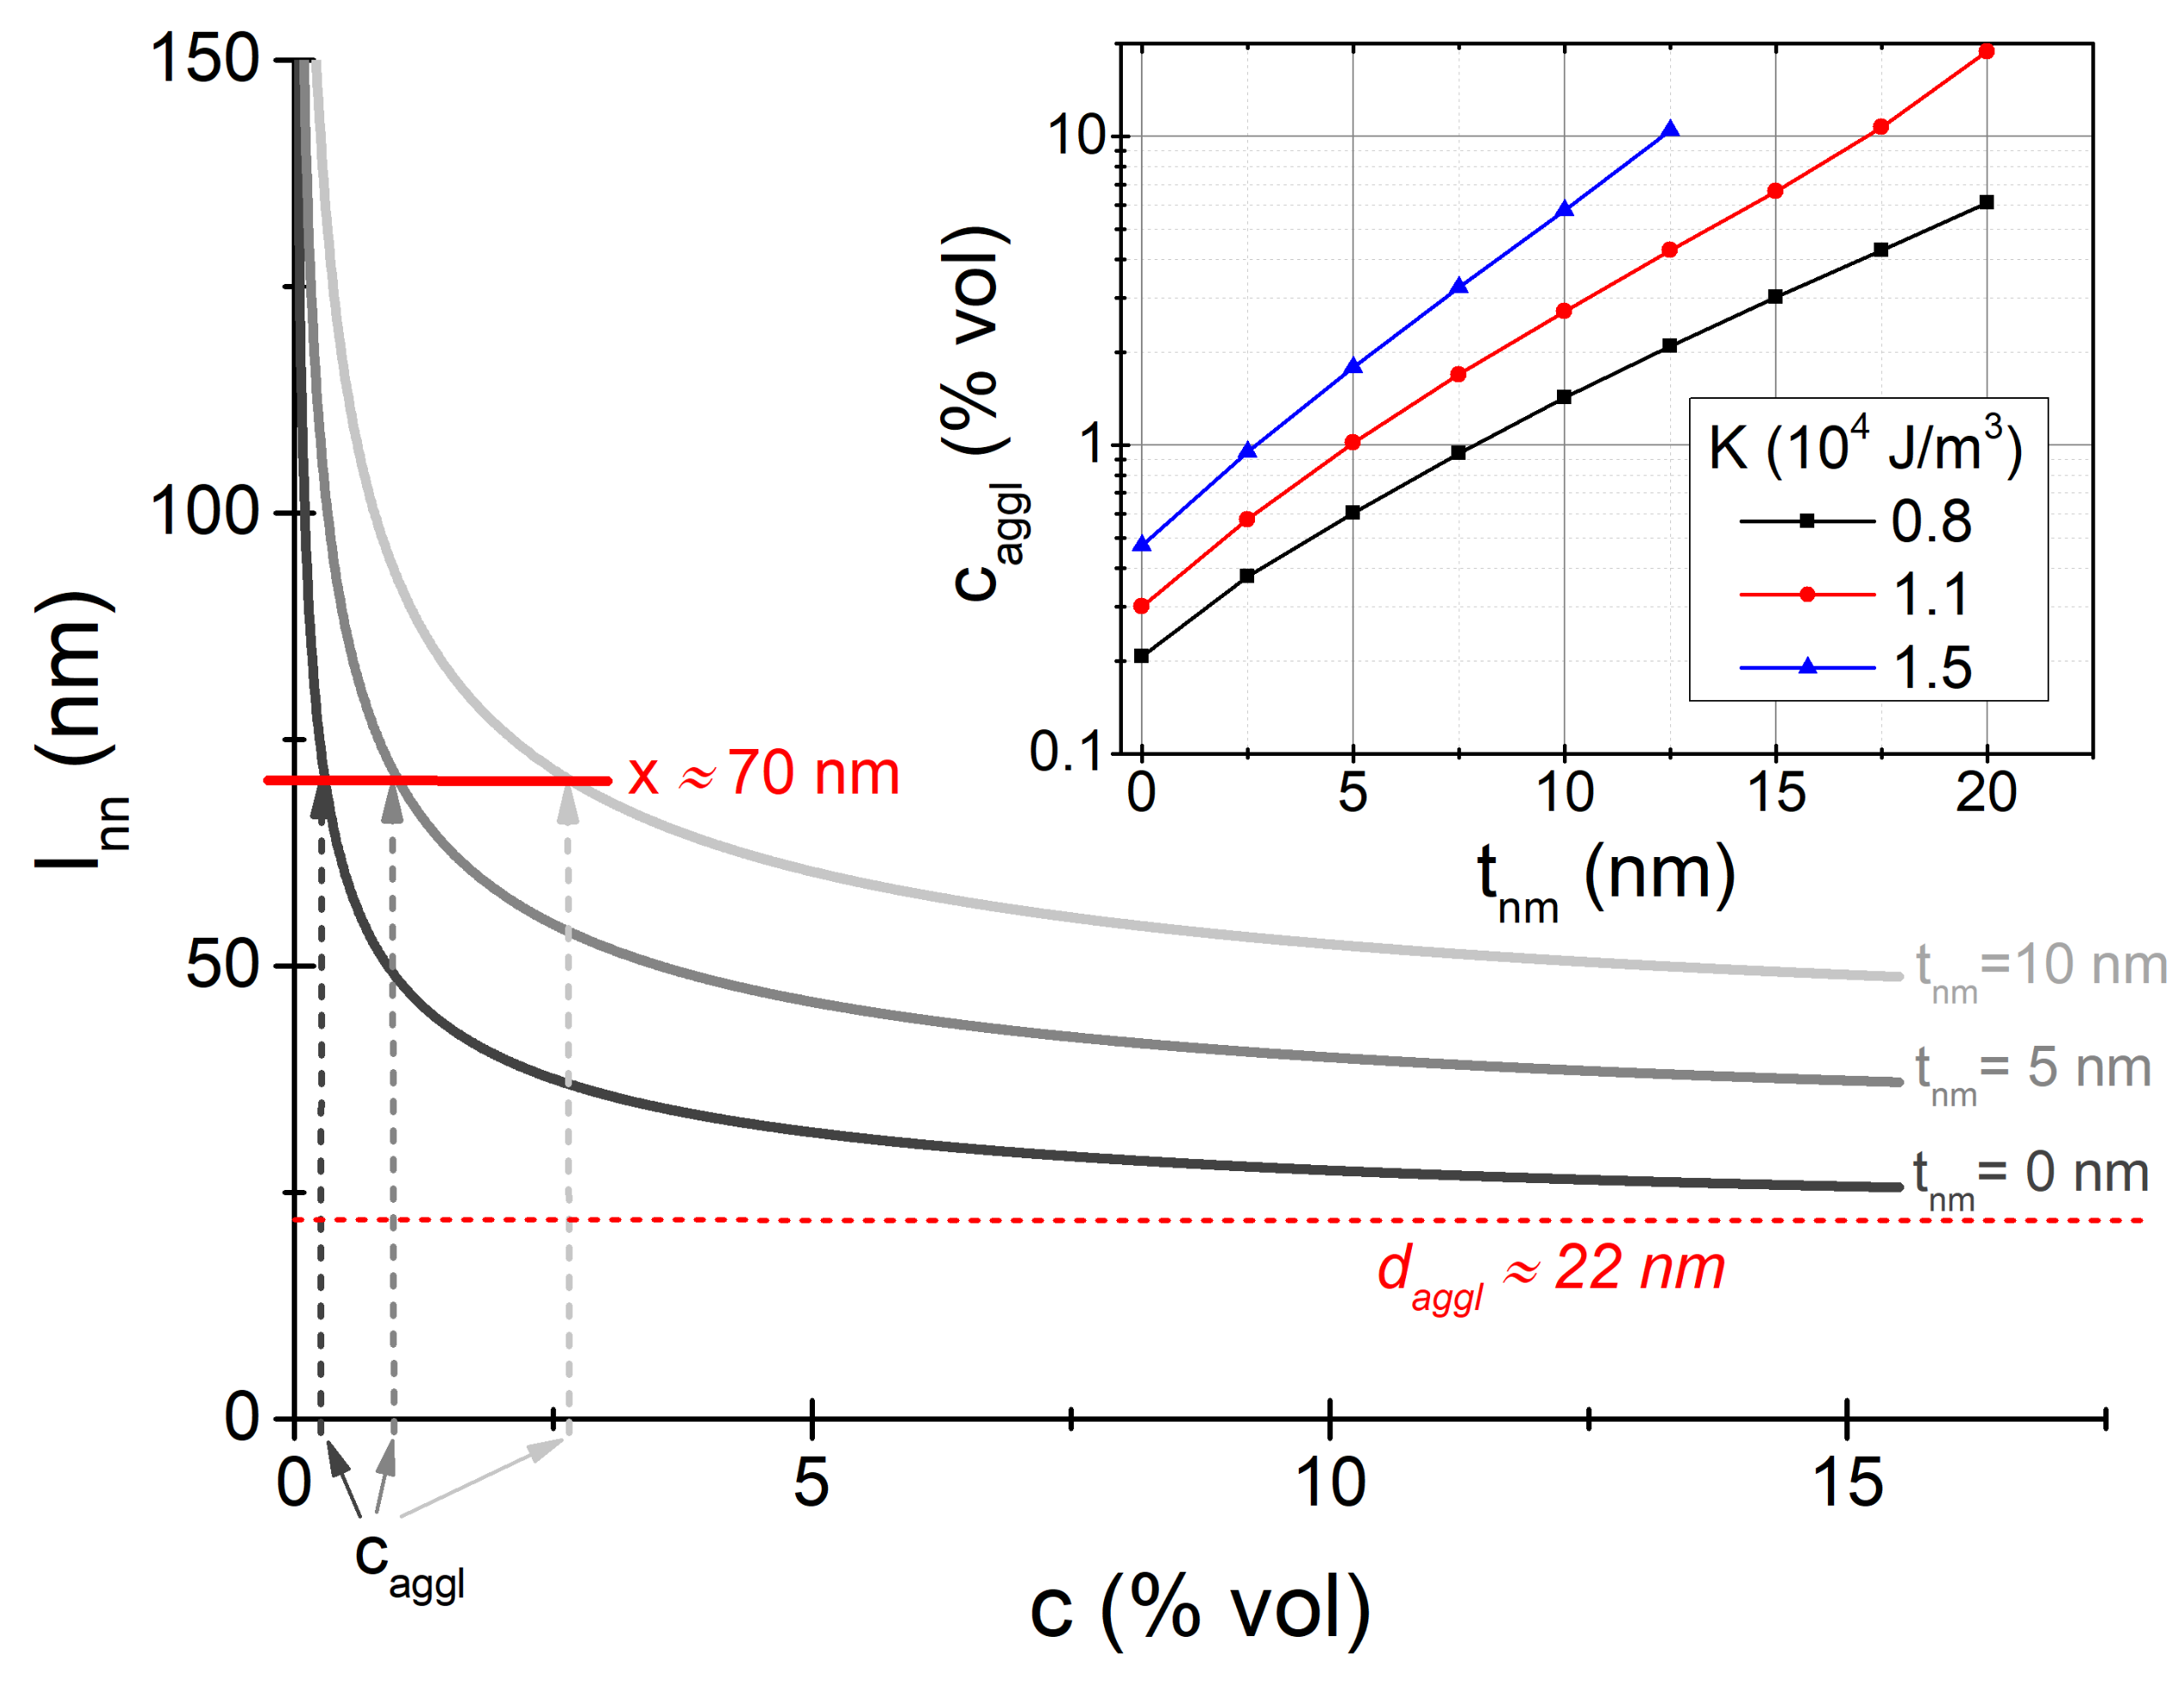
The predicted SAR values are quite large, implying that those particles would make efficient heat mediators. However, it is important to recall here that, so far, we made no considerations to the role of sample concentration. While this may appear reasonable as an initial approach, the fact is that the sample concentration is a key parameter to determine: first, because it defines the amount of deliverable heat; and second, because interparticle interactions (even without agglomeration) may significantly change the heating performance [11,24,29,39,54]. To provide some hint on how the sample concentration, c (% volume fraction), relates to the assumptions made, we can consider it through the nearest-neighbors interparticle distance, . Following Tewari and Gokhale [55], for a random distribution of monodisperse particles we can approximate as [24]
Thus, by equating to the diffusion distance (Equation (5)) of the different values, we can obtain the related sample concentration threshold, . This is shown in Figure 6.
The results shown in Figure 6 indicate that for bare particles ( nm) the applicability of the discussed arguments would be limited to very small concentrations, with for the J/m case. However, the presence of a nonmagnetic coating significantly enlarges , as illustrated in the main panel for the cases of and 10 nm. This trend is systematically summarized within the inset for the different values of K. It is observed that a coating of a few nanometers allows extending the applicability of our arguments within the 1–10% range. It is interesting to notice how with higher K this trend occurs with thinner , as expected due to the smaller sizes. At this point it is worth noting that for iron oxides it has been reported the existence of an essentially non-interacting regime at low concentrations [56,57], characteristics that are very attractive for the application viewpoint as it would allow discarding the complex role of interparticle interactions. Nevertheless, it would be clearly interesting to consider the role of interparticle interactions in a more accurate way (e.g., by considering their role on the Néel relaxation time [58]), but unfortunately such an approach is difficult to carry out for a randomly distributed system.
3. Conclusions
We have presented an estimation of the threshold sizes for magnetic agglomeration of magnetite-like nanoparticles, depending on their magnetic anisotropy. Our approach was based on the consideration that K determines the stability of the particle magnetization and thus the likelihood of magnetic agglomeration, which involves physical translation and rotation of the particles themselves. By comparing the associated timescales, we have obtained that magnetite particles with usual anisotropy values should be relatively stable against agglomeration up to sizes in the range ∼20–25 nm in diameter. Then, we evaluated the associated hyperthermia performance, and found it to be relatively large (hundreds to thousands of W/g) for usual field/frequency conditions. The role of the nonmagnetic surface coating and that of the media viscosity appears secondary in determining the threshold sizes for agglomeration.
The initial estimates were made with no considerations about sample concentration, despite being a critical parameter for the application. In this regard, simple estimates indicate that the assumptions would be strictly valid only for very diluted conditions. However, the presence of a nonmagnetic coating might significantly extend the validity of the approximations to higher concentrations (up to about volume fraction), showing that in this sense the nonmagnetic coating would play a key role.
It is important to recall that we have focused here on purely magnetic agglomeration, i.e., an ideal assumption which does not consider the complex situation often found experimentally, where other forces—of electrostatic nature—often play a central role in the agglomeration [59,60,61] and lead to agglomeration at smaller sizes [12]. Including those falls, however, is out of the scope of the present work, as it would result in a scenario that is too complicated. We have neither considered other important system characteristics such as polydispersity in size (both regarding aggregation [15] and heating [50]), and in anisotropy. The latter is expected to play a key role based on its primary importance both for agglomeration and heating, as discussed here. However, to the best of our knowledge its role has only been investigated regarding heating performance [25], but not regarding agglomeration likelihood. Considering the combined influence of those parameters clearly constitutes a challenging task for future works.
Finally, it is necessary to recall the conceptual character of the present work: while we have considered magnetite-like values for K and as a representative example, for simplicity those were taken as independent of size and temperature. However, it is well known that those may vary significantly within the size range of interest [62], and therefore the accurate determination of the agglomeration likelihood and hyperthermia performance would require including also those dependencies, together with the role of the nonmagnetic coating [63].
References and Note
Author Contributions
D.S. conceived the work, did the simulations and wrote the initial draft. D.B. discussed the results, contributed to their interpretation and to the final writing of the manuscript. All authors have read and agreed to the published version of the manuscript.
Funding
This research was funded by the Spanish Agencia Estatal de Investigación (project PID2019-109514RJ-100).
Data Availability Statement
The reported data is available upon reasonable request to the authors.
Acknowledgments
The authors acknowledge valuable discussions and feedback from Roy Chantrell, Ondrej Hovorka, Lucía Gutiérrez, and Robert Ivkov. This work used the computational facilities at the Centro de Supercomputacion de Galicia (CESGA).
Conflicts of Interest
The authors declare no conflict of interest.
References
- Wu, K.; Su, D.; Liu, J.; Saha, R.; Wang, J.P. Magnetic nanoparticles in nanomedicine: A review of recent advances. Nanotechnology 2019, 30, 502003. [Google Scholar] [CrossRef] [Green Version]
- Colombo, M.; Carregal-Romero, S.; Casula, M.F.; Gutiérrez, L.; Morales, M.P.; Bohm, I.B.; Heverhagen, J.T.; Prosperi, D.; Parak, W.J. Biological applications of magnetic nanoparticles. Chem. Soc. Rev. 2012, 41, 4306–4334. [Google Scholar] [CrossRef] [PubMed]
- Ling, D.; Hyeon, T. Chemical Design of Biocompatible Iron Oxide Nanoparticles for Medical Applications. Small 2013, 9, 1450–1466. [Google Scholar] [CrossRef] [PubMed]
- Soetaert, F.; Korangath, P.; Serantes, D.; Fiering, S.; Ivkov, R. Cancer therapy with iron oxide nanoparticles: Agents of thermal and immune therapies. Adv. Drug Deliv. Rev. 2020, 163–164, 65–83. [Google Scholar] [CrossRef] [PubMed]
- Abenojar, E.C.; Wickramasinghe, S.; Bas-Concepcion, J.; Samia, A.C.S. Structural effects on the magnetic hyperthermia properties of iron oxide nanoparticles. Prog. Nat. Sci. Mater. Int. 2016, 26, 440–448. [Google Scholar] [CrossRef] [Green Version]
- Fortes Brollo, M.E.; Domínguez-Bajo, A.; Tabero, A.; Domínguez-Arca, V.; Gisbert, V.; Prieto, G.; Johansson, C.; Garcia, R.; Villanueva, A.; Serrano, M.C.; et al. Combined Magnetoliposome Formation and Drug Loading in One Step for Efficient Alternating Current-Magnetic Field Remote-Controlled Drug Release. ACS Appl. Mater. Interfaces 2020, 12, 4295–4307. [Google Scholar] [CrossRef] [PubMed]
- Thorat, N.D.; Bohara, R.A.; Noor, M.R.; Dhamecha, D.; Soulimane, T.; Tofail, S.A.M. Effective Cancer Theranostics with Polymer Encapsulated Superparamagnetic Nanoparticles: Combined Effects of Magnetic Hyperthermia and Controlled Drug Release. ACS Biomater. Sci. Eng. 2017, 3, 1332–1340. [Google Scholar] [CrossRef]
- Martel, S. Magnetic nanoparticles in medical nanorobotics. J. Nanopart. Res. 2015, 17, 75. [Google Scholar] [CrossRef]
- Rojas, J.M.; Gavilán, H.; del Dedo, V.; Lorente-Sorolla, E.; Sanz-Ortega, L.; da Silva, G.B.; Costo, R.; Perez-Yague, S.; Talelli, M.; Marciello, M.; et al. Time-course assessment of the aggregation and metabolization of magnetic nanoparticles. Acta Biomater. 2017, 58, 181–195. [Google Scholar] [CrossRef]
- Mejías, R.; Hernández Flores, P.; Talelli, M.; Tajada-Herráiz, J.L.; Brollo, M.E.; Portilla, Y.; Morales, M.P.; Barber, D.F. Cell-Promoted Nanoparticle Aggregation Decreases Nanoparticle-Induced Hyperthermia under an Alternating Magnetic Field Independently of Nanoparticle Coating, Core Size, and Subcellular Localization. ACS Appl. Mater. Interfaces 2019, 11, 340–355. [Google Scholar] [CrossRef]
- Serantes, D.; Simeonidis, K.; Angelakeris, M.; Chubykalo-Fesenko, O.; Marciello, M.; Morales, M.d.P.; Baldomir, D.; Martinez-Boubeta, C. Multiplying Magnetic Hyperthermia Response by Nanoparticle Assembling. J. Phys. Chem. C 2014, 118, 5927–5934. [Google Scholar] [CrossRef]
- Gutiérrez, L.; de la Cueva, L.; Moros, M.; Mazarío, E.; de Bernardo, S.; de la Fuente, J.M.; Morales, M.P.; Salas, G. Aggregation effects on the magnetic properties of iron oxide colloids. Nanotechnology 2019, 30, 112001. [Google Scholar] [CrossRef] [PubMed] [Green Version]
- Andreu, J.S.; Camacho, J.; Faraudo, J. Aggregation of superparamagnetic colloids in magnetic fields: The quest for the equilibrium state. Soft Matter 2011, 7, 2336–2339. [Google Scholar] [CrossRef] [Green Version]
- Satoh, A.; Chantrell, R.W.; Kamiyama, S.I.; Coverdale, G.N. Three Dimensional Monte Carlo Simulations of Thick Chainlike Clusters Composed of Ferromagnetic Fine Particles. J. Colloid Interf. Sci. 1996, 181, 422–428. [Google Scholar] [CrossRef]
- Balakrishnan, P.B.; Silvestri, N.; Fernandez-Cabada, T.; Marinaro, F.; Fernandes, S.; Fiorito, S.; Miscuglio, M.; Serantes, D.; Ruta, S.; Livesey, K.L.; et al. Exploiting unique alignment of cobalt ferrite nanoparticles, mild hyperthermia, and controlled intrinsic cobalt toxicity for cancer therapy. Adv. Mater. 2020, 32, 2003712. [Google Scholar] [CrossRef]
- Brown, W.F. Thermal Fluctuations of a Single-Domain Particle. Phys. Rev. 1963, 130, 1677–1686. [Google Scholar] [CrossRef]
- Coffey, W.; Kalmykov, Y.P. The Langevin Equation: With Applications to Stochastic Problems in Physics, Chemistry and Electrical Engineering; World Scientific: Singapore, 2012; Volume 27. [Google Scholar]
- Debye, P.J.W. Polar Molecules; Chemical Catalog Co., Inc.: New York, NY, USA, 1929. [Google Scholar]
- Rosensweig, R. Heating magnetic fluid with alternating magnetic field. J. Magn. Magn. Mater. 2002, 252, 370–374. [Google Scholar] [CrossRef]
- Coffey, W.T.; Kalmykov, Y.P.; Titov, S.V. Thermal Fluctuations and Relaxation Processes in Nanomagnets; World Scientific: Singapore, 2020. [Google Scholar]
- Usov, N.A. Low frequency hysteresis loops of superparamagnetic nanoparticles with uniaxial anisotropy. J. Appl. Phys. 2010, 107, 123909. [Google Scholar] [CrossRef]
- Vallejo-Fernandez, G.; O’Grady, K. Effect of the distribution of anisotropy constants on hysteresis losses for magnetic hyperthermia applications. Appl. Phys. Lett. 2013, 103, 142417. [Google Scholar] [CrossRef]
- Dennis, C.L.; Krycka, K.L.; Borchers, J.A.; Desautels, R.D.; van Lierop, J.; Huls, N.F.; Jackson, A.J.; Gruettner, C.; Ivkov, R. Internal Magnetic Structure of Nanoparticles Dominates Time-Dependent Relaxation Processes in a Magnetic Field. Adv. Funct. Mater. 2015, 25, 4300–4311. [Google Scholar] [CrossRef]
- Conde-Leboran, I.; Baldomir, D.; Martinez-Boubeta, C.; Chubykalo-Fesenko, O.; Morales, M.P.; Salas, G.; Cabrera, D.; Camarero, J.; Teran, F.J.; Serantes, D. A Single Picture Explains Diversity of Hyperthermia Response of Magnetic Nanoparticles. J. Phys. Chem. C 2015, 119, 15698–15706. [Google Scholar] [CrossRef]
- Munoz-Menendez, C.; Serantes, D.; Ruso, J.M.; Baldomir, D. Towards improved magnetic fluid hyperthermia: Major-loops to diminish variations in local heating. Phys. Chem. Chem. Phys. 2017, 19, 14527–14532. [Google Scholar] [CrossRef] [Green Version]
- Gutiérrez, L.; Costo, R.; Gruttner, C.; Westphal, F.; Gehrke, N.; Heinke, D.; Fornara, A.; Pankhurst, Q.A.; Johansson, C.; Veintemillas-Verdaguer, S.; et al. Synthesis methods to prepare single- and multi-core iron oxide nanoparticles for biomedical applications. Dalton Trans. 2015, 44, 2943–2952. [Google Scholar] [CrossRef] [PubMed]
- Kalwarczyk, T.; Ziebacz, N.; Bielejewska, A.; Zaboklicka, E.; Koynov, K.; Szymański, J.; Wilk, A.; Patkowski, A.; Gapiński, J.; Butt, H.J.; et al. Comparative Analysis of Viscosity of Complex Liquids and Cytoplasm of Mammalian Cells at the Nanoscale. Nano Lett. 2011, 11, 2157–2163. [Google Scholar] [CrossRef] [PubMed]
- Nguyen, L.; Oanh, V.; Nam, P.; Doan, D.; Truong, N.; Ca, N.; Phong, P.; Hong, L.; Lam, T. Increase of magnetic hyperthermia efficiency due to optimal size of particles: Theoretical and experimental results. J. Nanopart. Res. 2020, 22, 1–16. [Google Scholar] [CrossRef]
- Niculaes, D.; Lak, A.; Anyfantis, G.C.; Marras, S.; Laslett, O.; Avugadda, S.K.; Cassani, M.; Serantes, D.; Hovorka, O.; Chantrell, R.; et al. Asymmetric Assembling of Iron Oxide Nanocubes for Improving Magnetic Hyperthermia Performance. ACS Nano 2017, 11, 12121–12133. [Google Scholar] [CrossRef] [PubMed]
- Santiago-Quinones, D.; Raj, K.; Rinaldi, C. A comparison of the magnetorheology of two ferrofluids with different magnetic field-dependent chaining behavior. Rheol. Acta 2013, 52, 719–726. [Google Scholar] [CrossRef]
- Wang, K.; Sun, X.H.; Zhang, Y.; Zhang, T.; Zheng, Y.; Wei, Y.C.; Zhao, P.; Chen, D.Y.; Wu, H.A.; Wang, W.H.; et al. Characterization of cytoplasmic viscosity of hundreds of single tumour cells based on micropipette aspiration. R. Soc. Open Sci. 2019, 6, 181707. [Google Scholar] [CrossRef] [PubMed] [Green Version]
- Livesey, K.L.; Ruta, S.; Anderson, N.R.; Baldomir, D.; Chantrell, R.W.; Serantes, D. Beyond the blocking model to fit nanoparticle ZFC/FC magnetisation curves. Sci. Rep. 2018, 8, 11166. [Google Scholar] [CrossRef] [PubMed] [Green Version]
- Goya, G.F.; Morales, M.P. Field Dependence of Blocking Temperature in Magnetite Nanoparticles. J. Metast. Nanocryst. Mater. 2004, 20–21, 673. [Google Scholar] [CrossRef] [Green Version]
- Nunes, W.C.; Socolovsky, L.M.; Denardin, J.C.; Cebollada, F.; Brandl, A.L.; Knobel, M. Role of magnetic interparticle coupling on the field dependence of the superparamagnetic relaxation time. Phys. Rev. B 2005, 72, 212413. [Google Scholar] [CrossRef] [Green Version]
- Balaev, D.; Semenov, S.; Dubrovskiy, A.; Yakushkin, S.; Kirillov, V.; Martyanov, O. Superparamagnetic blocking of an ensemble of magnetite nanoparticles upon interparticle interactions. J. Magn. Magn. Mater. 2017, 440, 199–202. [Google Scholar] [CrossRef] [Green Version]
- Chantrell, R.W.; Walmsley, N.; Gore, J.; Maylin, M. Calculations of the susceptibility of interacting superparamagnetic particles. Phys. Rev. B 2000, 63, 024410. [Google Scholar] [CrossRef]
- Kachkachi, H.; Coffey, W.T.; Crothers, D.S.F.; Ezzir, A.; Kennedy, E.C.; Noguès, M.; Tronc, E. Field dependence of the temperature at the peak of the zero-field-cooled magnetization. J. Phys. Condens. Matter 2000, 12, 3077–3090. [Google Scholar] [CrossRef] [Green Version]
- Usov, N.A. Numerical simulation of field-cooled and zero field-cooled processes for assembly of superparamagnetic nanoparticles with uniaxial anisotropy. J. Appl. Phys. 2011, 109, 023913. [Google Scholar] [CrossRef]
- Serantes, D.; Baldomir, D.; Martinez-Boubeta, C.; Simeonidis, K.; Angelakeris, M.; Natividad, E.; Castro, M.; Mediano, A.; Chen, D.X.; Sanchez, A.; et al. Influence of dipolar interactions on hyperthermia properties of ferromagnetic particles. J. Appl. Phys. 2010, 108, 073918. [Google Scholar] [CrossRef]
- For a square loop, the coercive field is equal to the anisotropy field, HC=HK. Thus, since HK=2K/MS, the area is A=(2HK)*(2MS)=8K.
- Donahue, M.; Porter, D. OOMMF User’s Guide, Version 1.0, Interagency Report NISTIR 6376; National Institute of Standards and Technology: Gaithersburg, MD, USA, 2018. Available online: http://math.nist.gov/oommf (accessed on 1 September 2021).
- Lemcke, O. Models Finite Temperature via a Differential Equation of the Langevin Type. 2018. Available online: http://www.nanoscience.de/group_r/stm-spstm/projects/temperature/download.shtml (accessed on 1 September 2021).
- Lacroix, L.M.; Malaki, R.B.; Carrey, J.; Lachaize, S.; Respaud, M.; Goya, G.F.; Chaudret, B. Magnetic hyperthermia in single-domain monodisperse FeCo nanoparticles: Evidences for Stoner–Wohlfarth behavior and large losses. J. Appl. Phys. 2009, 105, 023911. [Google Scholar] [CrossRef]
- Usov, N.A.; Nesmeyanov, M.S.; Tarasov, V.P. Magnetic Vortices as Efficient Nano Heaters in Magnetic Nanoparticle Hyperthermia. Sci. Rep. 2018, 8, 1224. [Google Scholar] [CrossRef] [PubMed]
- Morales, I.; Archilla, D.; de la Presa, P.; Hernando, A.; Marin, P. Colossal heating efficiency via eddy currents in amorphous microwires with nearly zero magnetostriction. Sci. Rep. 2020, 10, 1–10. [Google Scholar]
- Simeonidis, K.; Morales, M.P.; Marciello, M.; Angelakeris, M.; de La Presa, P.; Lazaro-Carrillo, A.; Tabero, A.; Villanueva, A.; Chubykalo-Fesenko, O.; Serantes, D. In-situ particles reorientation during magnetic hyperthermia application: Shape matters twice. Sci. Rep. 2016, 6, 1–11. [Google Scholar] [CrossRef] [Green Version]
- Shah, S.A.; Reeves, D.B.; Ferguson, R.M.; Weaver, J.B.; Krishnan, K.M. Mixed Brownian alignment and Néel rotations in superparamagnetic iron oxide nanoparticle suspensions driven by an ac field. Phys. Rev. B 2015, 92, 094438. [Google Scholar] [CrossRef] [Green Version]
- Usov, N.A.; Liubimov, B.Y. Dynamics of magnetic nanoparticle in a viscous liquid: Application to magnetic nanoparticle hyperthermia. J. Appl. Phys. 2012, 112, 023901. [Google Scholar] [CrossRef]
- Mamiya, H.; Jeyadevan, B. Hyperthermic effects of dissipative structures of magnetic nanoparticles in large alternating magnetic fields. Sci. Rep. 2011, 1, 1–7. [Google Scholar] [CrossRef] [Green Version]
- Munoz-Menendez, C.; Conde-Leboran, I.; Baldomir, D.; Chubykalo-Fesenko, O.; Serantes, D. The role of size polydispersity in magnetic fluid hyperthermia: Average vs. local infra/over-heating effects. Phys. Chem. Chem. Phys. 2015, 17, 27812–27820. [Google Scholar] [CrossRef] [Green Version]
- Aquino, V.R.R.; Vinícius-Araújo, M.; Shrivastava, N.; Sousa, M.H.; Coaquira, J.A.H.; Bakuzis, A.F. Role of the Fraction of Blocked Nanoparticles on the Hyperthermia Efficiency of Mn-Based Ferrites at Clinically Relevant Conditions. J. Phys. Chem. C 2019, 123, 27725–27734. [Google Scholar] [CrossRef]
- Dennis, C.L.; Ivkov, R. Physics of heat generation using magnetic nanoparticles for hyperthermia. Int. J. Hyperth. 2013, 29, 715–729. [Google Scholar] [CrossRef]
- Carrey, J.; Mehdaoui, B.; Respaud, M. Simple models for dynamic hysteresis loop calculations of magnetic single-domain nanoparticles: Application to magnetic hyperthermia optimization. J. Appl. Phys. 2011, 109, 083921. [Google Scholar] [CrossRef]
- Branquinho, L.; Carriao, M.; Costa, A.; Zufelato, N.; Sousa, M.H.; Miotto, R.; Ivkov, R.; Bakuzis, A.F. Effect of magnetic dipolar interactions on nanoparticle heating efficiency: Implications for cancer hyperthermia. Sci. Rep. 2013, 3, 2887. [Google Scholar] [CrossRef] [PubMed] [Green Version]
- Tewari, A.; Gokhale, A. Nearest-neighbor distances between particles of finite size in three-dimensional uniform random microstructures. Mater. Sci. Eng. C 2004, 385, 332–341. [Google Scholar] [CrossRef]
- Serantes, D.; Baldomir, D.; Pereiro, M.; Hoppe, C.E.; Rivadulla, F.; Rivas, J. Nonmonotonic evolution of the blocking temperature in dispersions of superparamagnetic nanoparticles. Phys. Rev. B 2010, 82, 134433. [Google Scholar] [CrossRef] [Green Version]
- Beola, L.; Asín, L.; Roma-Rodrigues, C.; Fernández-Afonso, Y.; Fratila, R.M.; Serantes, D.; Ruta, S.; Chantrell, R.W.; Fernandes, A.R.; Baptista, P.V.; et al. The Intracellular Number of Magnetic Nanoparticles Modulates the Apoptotic Death Pathway after Magnetic Hyperthermia Treatment. ACS Appl. Mater. Interfaces 2020, 12, 43474–43487. [Google Scholar] [CrossRef]
- Kalmykov, Y.P.; Titov, S.V.; Byrne, D.J.; Coffey, W.T.; Zarifakis, M.; Al Bayyari, M.H. Dipole-dipole and exchange interaction effects on the magnetization relaxation of two macrospins: Compared. J. Magn. Magn. Mater. 2020, 507, 166814. [Google Scholar] [CrossRef]
- Faraudo, J.; Andreu, J.S.; Camacho, J. Understanding diluted dispersions of superparamagnetic particles under strong magnetic fields: A review of concepts, theory and simulations. Soft Matter 2013, 9, 6654–6664. [Google Scholar] [CrossRef] [Green Version]
- Bakuzis, A.F.; Branquinho, L.C.; Luiz e Castro, L.; de Amaral e Eloi, M.T.; Miotto, R. Chain formation and aging process in biocompatible polydisperse ferrofluids: Experimental investigation and Monte Carlo simulations. Adv. Colloid Interface Sci. 2013, 191-192, 1–21. [Google Scholar] [CrossRef]
- Valleau, J.P.; Ivkov, R.; Torrie, G.M. Colloid stability: The forces between charged surfaces in an electrolyte. J. Chem. Phys. 1991, 95, 520–532. [Google Scholar] [CrossRef]
- Demortiere, A.; Panissod, P.; Pichon, B.P.; Pourroy, G.; Guillon, D.; Donnio, B.; Bégin-Colin, S. Size-dependent properties of magnetic iron oxide nanocrystals. Nanoscale 2011, 3, 225–232. [Google Scholar] [CrossRef] [PubMed]
- Roca, A.G.; Marco, J.F.; Morales, M.d.P.; Serna, C.J. Effect of Nature and Particle Size on Properties of Uniform Magnetite and Maghemite Nanoparticles. J. Phys. Chem. C 2007, 111, 18577–18584. [Google Scholar] [CrossRef]
Figure 1.
Diffusion (; purple line), rotation (; green line), and Néel relaxation time (; grey lines), as a function of the particle diameter. The distinct curves correspond to the different K values indicated. The dashed light-orange area indicates the range where agglomeration can be expected. The inset shows the size dependence of the , which predicts agglomeration for sizes nm.

Figure 2.
Diffusion (; purple line), rotation (; green line), and Néel relaxation time (; grey line), as a function of the particle diameter, as in Figure 1, but considering different thickness of the nonmagnetic coating (A), or viscosity of the medium (B). For simplicity, the results are focused on the kJ/m and the original curves from Figure 1 are reproduced for guidance. The variations of and are shown with solid and dotted lines, for the values displayed within each panel. The arrows and attached numbers indicate , with the reference one (22.0 nm) highlighted.

Figure 3.
(A): Illustrative Mvs.H hysteresis loops of two systems of particles of the same size ( nm) and kA/m, but different K (10 and 20 kJ/m, respectively), at K and for mT. (B): Same data as in (A), replotted in terms of . (C): SAR vs. for the two different particles, for kHz, at K. (D): Same data as in panel (C), replotted in terms of and ; the curves with open symbols correspond to the K case. The vertical blue dotted line stands for the ∼ threshold of the random distribution [39], and the horizontal solid dark-yellow line indicates the normalized maximum = 1 limit case.

Figure 4.
hysteresis loops, for different values, as indicated by the labels in panel (A). Left and right columns correspond to and 765 kHz, respectively. Each pair of colour panels (A,D), (B,E), and (C,F), corresponds to a different K value (indicated within the figure) and its corresponding (Table 1).

Figure 5.
vs. for the three K values (at corresponding ), for and 765 kHz ((A) and (B) panels, respectively). The vertical lines stand for half of the anisotropy field of each K value (of same colour).
Figure 5.
vs. for the three K values (at corresponding ), for and 765 kHz ((A) and (B) panels, respectively). The vertical lines stand for half of the anisotropy field of each K value (of same colour).

Figure 6.
vs. c curves for different values, for the J/m case. The short (solid) horizontal line indicates the interparticle distance predicted by Equation (5), whereas the long (short-dashed) one indicates the value, to which tends asymptotically. The vertical arrows indicate the corresponding values. The inset shows vs. for the different values of K considered.


Table 1.
Agglomeration size thresholds obtained through the relaxation times approach () and through the ZFC/FC one (), at room temperature for the three anisotropy cases of Figure 1.
Table 1.
Agglomeration size thresholds obtained through the relaxation times approach () and through the ZFC/FC one (), at room temperature for the three anisotropy cases of Figure 1.
| K (kJ/m) | (nm) | (nm) |
|---|---|---|
| 8 | 24.8 | 29.2 |
| 11 | 22.0 | 26.2 |
| 15 | 19.5 | 23.6 |
Publisher’s Note: MDPI stays neutral with regard to jurisdictional claims in published maps and institutional affiliations. |
© 2021 by the authors. Licensee MDPI, Basel, Switzerland. This article is an open access article distributed under the terms and conditions of the Creative Commons Attribution (CC BY) license (https://creativecommons.org/licenses/by/4.0/).
Share and Cite
MDPI and ACS Style
Serantes, D.; Baldomir, D. Nanoparticle Size Threshold for Magnetic Agglomeration and Associated Hyperthermia Performance. Nanomaterials 2021, 11, 2786. https://doi.org/10.3390/nano11112786
AMA Style
Serantes D, Baldomir D. Nanoparticle Size Threshold for Magnetic Agglomeration and Associated Hyperthermia Performance. Nanomaterials. 2021; 11(11):2786. https://doi.org/10.3390/nano11112786
Chicago/Turabian StyleSerantes, David, and Daniel Baldomir. 2021. "Nanoparticle Size Threshold for Magnetic Agglomeration and Associated Hyperthermia Performance" Nanomaterials 11, no. 11: 2786. https://doi.org/10.3390/nano11112786
Note that from the first issue of 2016, this journal uses article numbers instead of page numbers. See further details here.