Photoexcitation Processes in Oligomethine Cyanine Dyes for Dye-Sensitized Solar Cells—Synthesis and Computational Study

 ,
, 
Abstract
:1. Introduction
2. Materials and Methods
2.1. Materials—Synthesis of Oligomethine Cyanine Dyes
- (i)
- 5-carboxy-2-(7-(4-diphenylphospho)phenyl)ethynyl-1,1,3-trimethyl-1H-benzo[e]indol-2(3H)-yliedene)prop-1-ene-1-yl)-5-carboxy-1,3,3,-trimethyl-3H-indolium iodide (OMCD1),
- (ii)
- 7-(4-diphenylphosho)phenyl)ethynyl-3-yne-(7(1,1,3-trimethyl-1H-benzo[e]indol-2(3H)-yliedene)prop-1-ene-1-yl)-5-carboxy-1,3,3,-trimethyl-3H-indol-1-ium iodide-phenothiazine 11 (OMCD2),
- (iii)
- 4,7-bis(5--(4-diphenylphospho)phenyl)ethynyl-5-yne-thiophene-2,2--diyl)(1,1,3-trimethyl-1H-benzo[e]indol-2(3H)-yliedene)prop-1-ene-1-yl)-5-carboxy-1,3,3,-trimethyl-3H-indol-1-ium iodide-4,7-dithienyl-benzo[c][2,1,3]thiadiazol (OMCD3),
- (iv)
- 2-cyano-5-(1,1,6,6-tetramethyl-10-oxo-2,3,5,6-tetrahydro-1H,4H,10H-11-oxa-3a-aza-benzo[de]anthracen-9-yl)-penta-2,4-dienoic acid (NKX-2311).
2.2. Computational Details
2.3. Quantities Relevant to Device Performance
3. Results
3.1. Isolated Dye—Structural, Optical and Electronic Properties
3.2. Dye on Substrate—Structural, Optical and Electronic Properties
4. Discussion
4.1. Structure-Property Correlations—The Influence of the Molecular Building Blocks
4.2. Comparative Analysis of the Oligomethine Dyes
5. Conclusions
Supplementary Materials
Author Contributions
Funding
Conflicts of Interest
References
- Trancik, J.E.; Cross-Call, D. Energy technologies evaluated against climate targets using a cost and carbon trade-off curve. Environ. Sci. Technol. 2013, 47, 6673–6680. [Google Scholar] [CrossRef] [PubMed]
- Kavlak, G.; McNerney, J.; Trancik, J.E. Evaluating the causes of cost reduction in photovoltaic modules. Energy Policy 2018, 123, 700–710. [Google Scholar] [CrossRef] [Green Version]
- Green, M.A. Photovoltaic technology and visions for the future. Prog. Energy 2019, 1, 013001. [Google Scholar] [CrossRef]
- O’Regan, B.; Grätzel, M. A low-cost, high-efficiency solar cell based on dye-sensitized colloidal TiO2 films. Nature 1991, 353, 737–740. [Google Scholar] [CrossRef]
- Grätzel, M. Photoelectrochemical cells. Nature 2001, 414, 338–344. [Google Scholar] [CrossRef]
- Gong, J.; Sumathy, K.; Qiao, Q.; Zhou, Z. Review on dye-sensitized solar cells (DSSCs): Advanced techniques and research trends. Renew. Sustain. Energy Rev. 2018, 68, 234–246. [Google Scholar] [CrossRef]
- Ahn, K.S.; Yoo, S.J.; Kang, M.S.; Lee, J.W.; Sung, Y.E. Tandem dye-sensitized solar cell-powered electrochromic devices for the photovoltaic-powered smart window. J. Power Sources 2007, 168, 533–536. [Google Scholar] [CrossRef]
- Baetens, R.; Jelle, B.P.; Gustavsen, A. Properties, requirements and possibilities of smart windows for dynamic daylight and solar energy control in buildings: A state-of-the-art review. Sol. Energy Mater. Sol. Cells 2010, 94, 87–105. [Google Scholar] [CrossRef] [Green Version]
- Freitag, M.; Teuscher, J.; Saygili, Y.; Zhang, X.; Giordano, F.; Liska, P.; Hua, J.; Zakeeruddin, S.M.; Moser, J.-E.; Grätzel, M.; et al. Dye-sensitized solar cells for efficient power generation under ambient lighting. Nat. Photonics 2017, 11, 372–379. [Google Scholar] [CrossRef]
- Hagfeldt, A.; Boschloo, G.; Sun, L.; Kloo, L.; Pettersson, H. Dye-Sensitized Solar Cells. Chem. Rev. 2010, 110, 6595–6663. [Google Scholar] [CrossRef]
- Nazeeruddin, M.K.; Pechy, P.; Renouard, T.; Zakeeruddin, S.M.; Humphry-Baker, R.; Comte, P.; Liska, P.; Cevey, L.; Costa, E.; Shklover, V.; et al. Engineering of efficient panchromatic sensitizers for nanocrystalline TiO(2)-based solar cells. J. Am. Chem. Soc. 2001, 123, 1613–1624. [Google Scholar] [CrossRef] [PubMed]
- Nazeeruddin, M.K.; De Angelis, F.; Fantacci, S.; Selloni, A.; Viscardi, G.; Liska, P.; Ito, S.; Bessho, T.; Grätzel, M. Combined Experimental and DFT-TDDFT Computational Study of Photoelectrochemical Cell Ruthenium Sensitizers. J. Am. Chem. Soc. 2005, 127, 16835–16847. [Google Scholar] [CrossRef] [PubMed]
- Xie, Y.; Tang, Y.; Wu, W.; Wang, Y.; Liu, J.; Li, X.; Tian, H.; Zhu, W.-H. Porphyrin Cosensitization for a Photovoltaic Efficiency of 11.5%: A Record for Non-Ruthenium Solar Cells Based on Iodine Electrolyte. J. Am. Chem. Soc. 2015, 137, 14055–14058. [Google Scholar] [CrossRef] [PubMed]
- Yella, A.; Lee, H.W.; Tsao, H.N.; Yi, C.; Chandiran, A.K.; Nazeeruddin, M.K.; Diau, E.W.G.; Yeh, C.Y.; Zakeeruddin, S.M.; Grätzel, M. Porphyrin-sensitized solar cells with cobalt (II/III)–based redox electrolyte exceed 12 percent efficiency. Science 2011, 334, 629–634. [Google Scholar] [CrossRef] [PubMed]
- Mathew, S.; Yella, A.; Gao, P.; Humphry-Baker, R.; Curchod, B.F.E.; Ashari-Astani, N.; Tavernelli, I.; Rothlisberger, U.; Nazeeruddin, M.K.; Grätzel, M. Dye-sensitized solar cells with 13% efficiency achieved through the molecular engineering of porphyrin sensitizers. Nat. Chem. 2014, 6, 242–247. [Google Scholar] [CrossRef] [PubMed] [Green Version]
- Kakiage, K.; Aoyama, Y.; Yano, T.; Oya, K.; Kyomen, T.; Hanaya, M. Fabrication of a high-performance dye-sensitized solar cell with 12.8% conversion efficiency using organic silyl-anchor dyes. Chem. Commun. 2015, 51, 6315–6317. [Google Scholar] [CrossRef]
- Yao, Z.; Wu, H.; Li, Y.; Wang, J.; Zhang, J.; Zhang, M.; Guo, Y.; Wang, P. Dithienopicenocarbazole as the kernel module of low-energy-gap organic dyes for efficient conversion of sunlight to electricity. Energy Environ. Sci. 2015, 8, 3192–3197. [Google Scholar] [CrossRef]
- Eom, Y.K.; Kang, S.H.; Choi, I.T.; Yoo, Y.; Kim, J.; Kim, H.K. Significant light absorption enhancement by a single heterocyclic unit change in the p-bridge moiety from thieno[3,2-b]benzothiophene to thieno[3,2-b]indole for high performance dye-sensitized and tandem solar cells. J. Mater. Chem. 2017, 5, 2297–2308. [Google Scholar] [CrossRef]
- Zhang, L.; Yang, X.; Wang, W.; Gurzadyan, G.G.; Li, J.; Li, X.; An, J.; Yu, Z.; Wang, H.; Cai, B.; et al. 13.6% efficient organic dye-sensitized solar cells by minimizing energy losses of the excited state. ACS Energy Lett. 2019, 4, 943–951. [Google Scholar] [CrossRef]
- Hamann, T.W.; Jensen, R.A.; Martinson, A.B.F.; van Ryswyk, H.; Hupp, J.T. Advancing beyond current generation dye-sensitized solar cells. Energy Environ. Sci. 2008, 1, 66–78. [Google Scholar] [CrossRef]
- O’Regan, B.C.; Durrant, J.R. Kinetic and energetic paradigms for dye-sensitized solar cells: Moving from the ideal to the real. Acc. Chem. Res. 2009, 42, 1799–1808. [Google Scholar] [CrossRef] [PubMed]
- Snaith, H.J. Estimating the Maximum Attainable Efficiency in Dye-Sensitized Solar Cells. Adv. Funct. Mater. 2010, 20, 13–19. [Google Scholar] [CrossRef]
- Peter, L.M. The Grätzel cell: Where next? J. Phys. Chem. Lett. 2011, 2, 1861–1867. [Google Scholar] [CrossRef] [Green Version]
- Mishra, A.; Fischer, M.K.; Bauerle, P. Metal-free organic dyes for dye-sensitized solar cells: From structure: Property relationships to design rules. Angew. Chem. Int. Ed. 2009, 48, 2474–2499. [Google Scholar] [CrossRef] [PubMed]
- Imahori, H.; Umeyama, T.; Ito, S. Large pi-aromatic molecules as potential sensitizers for highly efficient dye-sensitized solar cells. Acc. Chem. Res. 2009, 42, 1809–1818. [Google Scholar] [CrossRef] [PubMed]
- Clifford, J.N.; Martinez-Ferrero, E.; Viterisi, A.; Palomares, E. Sensitizer molecular structure-device efficiency relationship in dye sensitized solar cells. Chem. Soc. Rev. 2011, 40, 1635–1646. [Google Scholar] [CrossRef] [PubMed]
- Wu, Y.; Zhu, W. Organic sensitizers from D-pi-A to D-A-pi-A: Effect of the internal electron-withdrawing units on molecular absorption, energy levels and photovoltaic performances. Chem. Soc. Rev. 2013, 42, 2039–2058. [Google Scholar] [CrossRef]
- Sayama, K.; Hara, K.; Ohga, Y.; Shinpou, A.; Suga, S.; Arakawa, H. Significant effects of the distance between the cyanine dye skeleton and the semiconductor surface on the photoelectrochemical properties of dye-sensitized porous semiconductor electrodes. New J. Chem. 2001, 25, 200–202. [Google Scholar] [CrossRef]
- Matsui, M.; Hashimoto, Y.; Funabiki, K.; Jin, J.Y.; Yoshida, T.; Minoura, H. Application of near-infrared absorbing heptamethine cyanine dyes as sensitizers for zinc oxide solar cell, Synth. Metals 2005, 148, 147–153. [Google Scholar]
- Otsuka, A.; Funabiki, K.; Sugiyama, N.; Mase, H.; Yoshida, T.; Minoura, H.; Matsui, M. Design and synthesis of near-infrared-active heptamethine-cyanine dyes to suppress aggregation in a dye-sensitized porous zinc oxide solar cell. Chem. Lett. 2008, 37, 176–177. [Google Scholar] [CrossRef]
- Ono, T.; Yamaguchi, T.; Arakawa, H. Study on dye sensitized solar cell using novel infrared dye. Sol. Energy Mater. Sol. Cells 2009, 93, 831–835. [Google Scholar] [CrossRef]
- Funabiki, K.; Mase, H.; Hibino, A.; Tanaka, N.; Mizuhata, N.; Sakuragi, Y.; Nakashima, A.; Yoshida, T.; Kubota, Y.; Matsui, M. Synthesis of a novel heptamethine-cyanine dye for use in near-infrared active dye sensitized solar cells with porous zinc oxide prepared at low temperature. Energy Environ. Sci. 2011, 4, 2186–2192. [Google Scholar] [CrossRef]
- McArthur, E.A.; Godbe, J.M.; Tice, D.B.; Weiss, E.A. A study of the binding of cyanine dyes to colloidal quantum dots using spectral signatures of dye aggregation. J. Phys. Chem. C 2012, 116, 6136–6142. [Google Scholar] [CrossRef]
- Hohenberg, P.; Kohn, W. Inhomogeneous electron gas. Phys. Rev. 1964, 136, B864–B871. [Google Scholar] [CrossRef] [Green Version]
- Kohn, W.; Sham, L.J. Self-consistent equations including exchange and correlation effects. Phys. Rev. 1965, 140, A1133–A1138. [Google Scholar] [CrossRef] [Green Version]
- Parr, R.G.; Yang, W. Density-Functional Theory of Atoms and Molecules; Oxford University Press: New York, NY, USA, 1989. [Google Scholar]
- Casida, M.E.; Jamorski, C.; Casida, K.C.; Salahub, D.R. Molecular excitation energies to high-lying bound states from time-dependent Density-Functional Response theory: Characterization and correlation of the time dependent local density approximation ionization threshold. J. Chem. Phys. 1998, 108, 4439–4449. [Google Scholar] [CrossRef]
- De Angelis, F.; Fantacci, S.; Selloni, A.; Grätzel, M.; Nazeeruddin, M.K. Influence of the sensitizer adsorption mode on the open-circuit potential of dye-sensitized solar cells. Nano Lett. 2007, 7, 3189–3195. [Google Scholar] [CrossRef]
- De Angelis, F.; Fantacci, S.; Mosconi, E.; Nazeeruddin, M.K.; Grätzel, M. First-Principles Modeling of the Adsorption Geometry and Electronic Structure of Ru(II) Dyes on Extended TiO2 Substrates for Dye-Sensitized Solar Cell Applications. J. Phys. Chem. C 2010, 114, 6054–6061. [Google Scholar] [CrossRef]
- Oprea, C.I.; Dumbrava, A.; Enache, I.; Lungu, J.; Georgescu, A.; Moscalu, F.; Oprea, C.; Gîrţu, M.A. Role of energy level alignment in solar cells sensitized with a metal free organic dye: A combined experimental and theoretical approach. Phys. Status Solidi A 2011, 208, 2467–2477. [Google Scholar] [CrossRef]
- Oprea, C.I.; Dumbrava, A.; Enache, I.; Georgescu, A.; Gîrţu, M.A. A combined experimental and theoretical study of natural betalain pigments used in dye-sensitized solar cells. J. Photochem. Photobiol. A Chem. 2012, 240, 5–13. [Google Scholar] [CrossRef]
- Oprea, C.I.; Panait, P.; Cimpoesu, F.; Ferbinteanu, M.; Gîrţu, M.A. Density Functional Theory (DFT) Study of Coumarin-based Dyes Adsorbed on TiO2 Nanoclusters—Applications to Dye-Sensitized Solar Cells. Materials 2013, 6, 2372–2392. [Google Scholar] [CrossRef] [PubMed] [Green Version]
- Hara, K.; Sayama, K.; Arakawa, H.; Ohga, Y.; Shinpo, A.; Suga, S. A coumarin-derivative dye sensitized nanocrystalline TiO2 solar cell having a high solar-energy conversion efficiency up to 5.6%. Chem. Commun. 2001, 569–570. [Google Scholar] [CrossRef]
- Hara, K.; Sato, T.; Katoh, R.; Furube, A.; Ohga, Y.; Shinpo, A.; Suga, S.; Sayama, K.; Sugihara, H.; Arakawa, H. Molecular design of coumarin dyes for efficient dye-sensitized solar cells. J. Phys. Chem. B 2003, 107, 597–606. [Google Scholar] [CrossRef]
- Pirotte, G.; Agarkar, S.; Xu, B.; Zhang, J.; Lutsen, L.; Vanderzande, D.; Yan, H.; Pollet, P.; Reynolds, J.R.; Maes, W.; et al. Molecular weight tuning of low bandgap polymers by continuous flow chemistry: Increasing the applicability of PffBT4T for organic photovoltaics. J. Mater. Chem. A 2017, 5, 18166–18175. [Google Scholar] [CrossRef]
- Wu, Y.; Guo, H.; Shao, J.; Zhang, X.; Ji, S.; Zhao, J. Synthesis of Ethynylated Phenothiazine Based Fluorescent Boronic Acid Probes. J. Fluoresc. 2011, 21, 1143–1154. [Google Scholar] [CrossRef]
- Miyaura, N.; Suzuki, A. Palladium-Catalyzed Cross-Coupling Reactions of Organoboron Compounds. Chem. Rev. 1995, 95, 2457–2483. [Google Scholar] [CrossRef] [Green Version]
- Stille, J.K. The Palladium-Catalyzed Cross-Coupling Reactions of Organotin Reagents with Organic Electrophiles [New Synthetic Methods (58)]. Angew. Chem. Int. Ed. Engl. 1986, 25, 508–524. [Google Scholar] [CrossRef]
- Becke, A.D. Density-functional thermochemistry. III. The role of exact exchange. J. Chem. Phys. 1993, 98, 5648–5652. [Google Scholar] [CrossRef] [Green Version]
- Lee, C.; Yang, W.; Parr, R.G. Development of the colle-salvetti correlation-energy formula into a functional of the electron density. Phys. Rev. B 1988, 37, 785–789. [Google Scholar] [CrossRef] [Green Version]
- Godbout, N.; Salahub, D.R.; Andzelm, J.; Wimmer, E. Optimization of Gaussian-type basis sets for local spin density functional calculations. Part I. Boron through neon, optimization technique and validation. Can. J. Chem. 1992, 70, 560–571. [Google Scholar] [CrossRef] [Green Version]
- Persson, P.; Lundqvist, M.J. Calculated Structural and Electronic Interactions of the Ruthenium Dye N3 with a Titanium Dioxide Nanocrystal. J. Phys. Chem. B 2005, 109, 11918–11924. [Google Scholar] [CrossRef] [PubMed]
- De Angelis, F.; Fantacci, S.; Selloni, A. Alignment of the dye’s molecular levels with the TiO2 band edges in dye-sensitized solar cells: A DFT-TDDFT study. Nanotechnology 2008, 19, 424002. [Google Scholar] [CrossRef]
- Oprea, C.I.; Gîrțu, M.A. Structure and Electronic Properties of TiO2 Nanoclusters and Dye–Nanocluster Systems Appropriate to Model Hybrid Photovoltaic or Photocatalytic Applications. Nanomaterials 2019, 9, 357. [Google Scholar] [CrossRef] [PubMed] [Green Version]
- Oprea, C.I.; Panait, P.; AbdelAal, R.M.; Gîrțu, M.A. DFT Calculations of Structure and Optical Properties in Wide Band-Gap Semiconductor Clusters for Dye-Sensitized Solar Cells. In Proceedings of the IEEE Proceedings International Semiconductor Conference (CAS), Sinaia, Romania, 9–11 October 2018; pp. 17–26. [Google Scholar]
- Hay, P.J.; Wadt, W.R. Ab initio effective core potentials for molecular calculations. Potentials for K to Au including the outermost core orbitals. J. Chem. Phys. 1985, 82, 299–311. [Google Scholar] [CrossRef]
- Barone, V.; Cossi, M. Quantum calculation of molecular energies and energy gradients in solution by a conductor solvent model. J. Phys. Chem. A 1998, 102, 1995–2001. [Google Scholar] [CrossRef]
- Tomasi, J.; Mennucci, B.; Cammi, R. Quantum mechanical continuum solvation models. Chem. Rev. 2005, 105, 2999–3093. [Google Scholar] [CrossRef]
- Frisch, M.J.; Trucks, G.W.; Schlegel, H.B.; Scuseria, G.E.; Robb, M.A.; Cheeseman, J.R.; Scalmani, G.; Barone, V.; Petersson, G.A.; Nakatsuji, H.; et al. Gaussian 09, Revision A.02; Gaussian, Inc.: Wallingford, UK, 2016. [Google Scholar]
- Peter, J.M. Dye-sensitized nanocrystalline solar cells. Phys. Chem. Chem. Phys. 2007, 9, 2630–2642. [Google Scholar] [CrossRef]
- Ferber, J.; Stangl, R.; Luther, J. An electrical model of the dye-sensitized solar cell. Sol. Energy Mater Sol. Cells 1998, 53, 29–54. [Google Scholar] [CrossRef]
- Marinado, T.; Nonomura, K.; Nissfolk, J.; Karlsson, M.K.; Hagberg, D.P.; Sun, L.; Sun, L.; Hagfekdt, A. How the nature of triphenylamine-polyene dyes in dye-sensitized solar cells affects the open-circuit voltage and electron lifetimes. Langmuir 2010, 26, 2592–2598. [Google Scholar] [CrossRef]
- Katoh, R.; Furube, A.; Barzykin, A.V.; Arakawa, H.; Tachiya, M. Kinetics mechanism of electron injection and charge recombination in dye-sensitized nanocrystalline semiconductors. Coord. Chem. Rev. 2004, 248, 1195–1213. [Google Scholar] [CrossRef]
- Rühle, S.; Greenshtein, M.; Chen, S.G.; Merson, A.; Pizem, H.; Sukenik, C.S.; Cahen, D.; Zaban, A. Molecular adjustment of the electronic properties of nanoporous electrodes in dye-sensitized solar cells. J. Phys. Chem. B 2005, 109, 18907–18913. [Google Scholar] [CrossRef] [PubMed]
- Zhang, C.R.; Liu, Z.J.; Chen, Y.H.; Chen, H.S.; Wu, Y.Z.; Feng, W.; Wang, D.B. DFT and TD-DFT study on structure and properties of organic dye sensitizer TA-St-CA. Curr. Appl. Phys. 2010, 10, 77–83. [Google Scholar] [CrossRef]
- Sang-aroon, W.; Kunmuak, K.; Tontapha, S.; Chaiamornnugool, P.; Saekow, S.; Amornkitbamrung, V. Theoretical insight into electronic and photoelectrochemical 3 properties of orcein dyes relevant to dye-sensitized solar cells. Monatsh. Chem. 2014, 145, 1529–1537. [Google Scholar] [CrossRef]
- Hasanein, A.A.; Elmarassi, Y.R.; Kassem, E.N. TD-DFT investigation of D-π-A organic dyes with thiophene moieties as π-spacers for use as sensitizers in DSSCs. J. Mol. Model. 2016, 22, 115. [Google Scholar] [CrossRef] [PubMed]
- Liang, G.; Yuan, Y.; Wang, D.; Zhong, Z.; Xu, J. Tuning the electronic structures and related properties of phenothiazine-based donor-π-acceptor dyes for dye-sensitized solar cells: A theoretical study. Monatsh. Chem. 2014, 145, 1737–1744. [Google Scholar] [CrossRef]
- Fitri, A.; Benjelloun, A.T.; Benzakour, M.; Mcharfi, M.; Hamidi, M.; Bouachrine, M. Theoretical investigation of new thiazolothiazole-based D-π-A organic dyes for efficient dye-sensitized solar cell. Spectrochim. Acta A 2014, 124, 646–654. [Google Scholar] [CrossRef]
- Arkan, F.; Izadyar, M.; Nakhaeipour, A. A quantum chemistry study on the performance of porphyrin-based solar cell sensitisers; Zinc and anchor group position effects. Mol. Phys. 2015, 113, 3815–3825. [Google Scholar] [CrossRef]
- Mohr, T.; Aroulmoji, Z.; Ravindran, R.S.; Muller, M.; Ranjitha, S.; Rajaranjan, G.; Anbarasan, P.M. DFT and TD-DFT study on geometries, electronic structures and electronic absorption of some metal free dye sensitizers for dye sensitized solar cells. Spectrochim. Acta A 2015, 135, 1066–1073. [Google Scholar] [CrossRef]
- Mahmood, A.; Tahir, M.H.; Irfan, A.; Al-Sehemi, A.G.; Al-Assiri, M.S. Heterocyclic azo dyes for dye sensitized solar cells: A quantum chemical study. Comput. Theor. Chem. 2015, 1066, 94–99. [Google Scholar] [CrossRef]
- Ren, X.-F.; Kang, G.-J.; He, Q.-Q. Triphenylamine-based indoline derivatives for dye-sensitized solar cells: A density functional theory investigation. J. Mol. Model. 2016, 22, 8. [Google Scholar] [CrossRef]
- Li, Y.; Mi, L.; Wang, H.; Li, Y.; Liang, J. Design, Electron Transfer Process, and Opto-Electronic Property of Solar Cell Using Triphenylamine-Based D-π-A Architectures. Materials 2019, 12, 193. [Google Scholar] [CrossRef] [PubMed] [Green Version]
- Matthews, D.; Infelta, P.; Grätzel, M. Calculation of the photocurrent-potential characteristic for regenerative, sensitized semiconductor electrodes. Sol. Energy Mater Sol. Cells 1996, 44, 119–155. [Google Scholar] [CrossRef]
- Pazoki, M.; Cappel, U.B.; Johansson, E.M.J.; Hagfeldt, A.; Boschloo, G. Characterization techniques for dye-sensitized solar cells. Energy Environ. Sci. 2017, 10, 672–709. [Google Scholar] [CrossRef]
- Nazeeruddin, M.K.; Kay, A.; Rodicio, I.; Humphry-Baker, R.; Mueller, E.; Liska, P.; Vlachopoulos, N.; Graetzel, M. Conversion of light to electricity by cis-X2bis (2, 2′-bipyridyl-4, 4′-dicarboxylate) ruthenium (II) charge-transfer sensitizers (X= Cl-, Br-, I-, CN-, and SCN-) on nanocrystalline titanium dioxide electrodes. J. Am. Chem. Soc. 1993, 115, 6382–6390. [Google Scholar] [CrossRef]
- Xie, X.; Liu, Z.-H.; Bai, F.-Q.; Zhang, H.-X. Performance Regulation of Thieno[3,2-b]benzothiophene p-Spacer-Based D-p-A Organic Dyes for Dye-Sensitized Solar Cell Applications: Insights From Computational Study. Front. Chem. 2019, 6, 676. [Google Scholar] [CrossRef] [Green Version]
- National Renewable Energy Laboratory. American Society for Testing and Materials (ASTM), ASTM G-173-03 (2012) Standard Tables for Reference Solar Spectral Irradiances: Direct Normal and Hemispherical on 37° Tilted Surfaces. Available online: https://www.nrel.gov/grid/solar-resource/spectra-am1.5.html (accessed on 27 March 2020).
- He, L.J.; Wei, W.; Chen, J.; Jia, R.; Wang, J.; Zhang, H.X. The effect of D–[D e–π–A] n (n= 1, 2, 3) type dyes on the overall performance of DSSCs: A theoretical investigation. J. Mater. Chem. C 2017, 5, 7510–7520. [Google Scholar] [CrossRef]
- Shi, X.; Yang, Y.; Wang, L.; Li, Y. Introducing Asymmetry Induced by Benzene Substitution in a Rigid Fused π Spacer of D−π−A-Type Solar Cells: A Computational Investigation. J. Phys. Chem. C 2019, 123, 4007–4021. [Google Scholar] [CrossRef]
- Zhao, D.; Lu, Q.; Su, R.; Li, Y.; Zhao, M. Light Harvesting and Optical-Electronic Properties of Two Quercitin and Rutin Natural Dyes. Appl. Sci. 2019, 9, 2567. [Google Scholar] [CrossRef] [Green Version]
- Ma, W.; Jiao, Y.; Meng, S. Predicting Energy Conversion Efficiency of Dye Solar Cells from First Principles. J. Phys. Chem. C 2014, 118, 16447–16457. [Google Scholar] [CrossRef]
- Ren, P.; Sun, C.; Shi, Y.; Song, P.; Yang, Y.; Li, Y. Global performance evaluation of solar cells using two models: From charge-transfer and recombination mechanisms to photoelectric properties. J. Mater. Chem. C 2019, 7, 1934. [Google Scholar] [CrossRef]
- Scott, A.P.; Radom, L. Harmonic vibrational frequencies: An evaluation of Hartree−Fock, Møller−Plesset, quadratic configuration interaction, density functional theory, and semiempirical scale factors. J. Phys. Chem. 1996, 100, 16502. [Google Scholar] [CrossRef]
- Anderson, N.A.; Lian, T. Ultrafast electron injection from metal polypyridyl complexes to metal-oxide nanocrystalline thin films. Coord. Chem. Rev. 2004, 248, 1231–1246. [Google Scholar] [CrossRef]
- Zhang, X.; Zhang, J.-J.; Xia, Y.-Y. Molecular design of coumarin dyes with high efficiency in dye- sensitized solar cells. J. Photochem. Photobiol. A Chem. 2008, 194, 167–172. [Google Scholar] [CrossRef]
- Martsinovich, N.; Troisi, A. High-throughput computational screening of chromophores for dye-sensitized solar cells. J. Phys. Chem. C 2011, 115, 11781–11792. [Google Scholar] [CrossRef]
- Anderson, S.; Constable, E.C.; Dare-Edwards, M.P.; Goodenough, J.B.; Hamnett, A.; Seddon, K.R.; Wright, R.D. Chemical modification of a titanium (IV) oxide electrode to give stable dye sensitisation without a supersensitiser. Nature 1979, 280, 571–573. [Google Scholar] [CrossRef]


| Parameter | OMCD1 | OMCD2 | OMCD3 | OMCD1 | OMCD2 | OMCD3 |
|---|---|---|---|---|---|---|
| on Ti24O50H4 | ||||||
| r(Ca-Ci) | 1.483 | 1.483 | 1.483 | 1.472 | 1.474 | 1.472 |
| <(O-C-O)a | 121.8 | 121.8 | 121.8 | 121.5 | 121.6 | 121.6 |
| <(COOH-ind) | 0.2 | 0.0 | 0.5 | 7.0 | 1.5 | 2.3 |
| r1(Ci-Cbi) | 1.394 | 1.394 | 1.394 | 1.397 | 1.398 | 1.396 |
| r2(Ci-Cbi) | 1.406 | 1.407 | 1.407 | 1.414 | 1.414 | 1.416 |
| r3(Ci-Cbi) | 1.397 | 1.398 | 1.397 | 1.403 | 1.404 | 1.402 |
| r4(Ci-Cbi) | 1.403 | 1.404 | 1.403 | 1.409 | 1.409 | 1.409 |
| r(Ci-Cbi) | 5.066 | 5.066 | 5.067 | 5.071 | 5.076 | 5.093 |
| <(ind-benzoind) | 15.5 | 14.7 | 12.2 | 26.9 | 21.5 | 1.3 |
| r1(Cbi-Cr) | 1.428 | 1.429 | 1.425 | 1.432 | 1.436 | 1.428 |
| r2(Cbi-Cr) | 1.221 | 1.221 | 1.223 | 1.229 | 1.229 | 1.231 |
| r3(Cbi-Cr) | 1.429 | 1.428 | 1.408 | 1.433 | 1.435 | 1.406 |
| r(Cbi-Cr) | 4.078 | 4.076 | 4.055 | 4.094 | 4.099 | 4.065 |
| <(benzoind-ring) | 2.5 | 21.1 | 13.6 | 11.5 | 88.1 | 4.5 |
| r(I-Ni) | 4.966 | 5.141 | 5.034 | 4.421 | 4.465 | 5.020 |
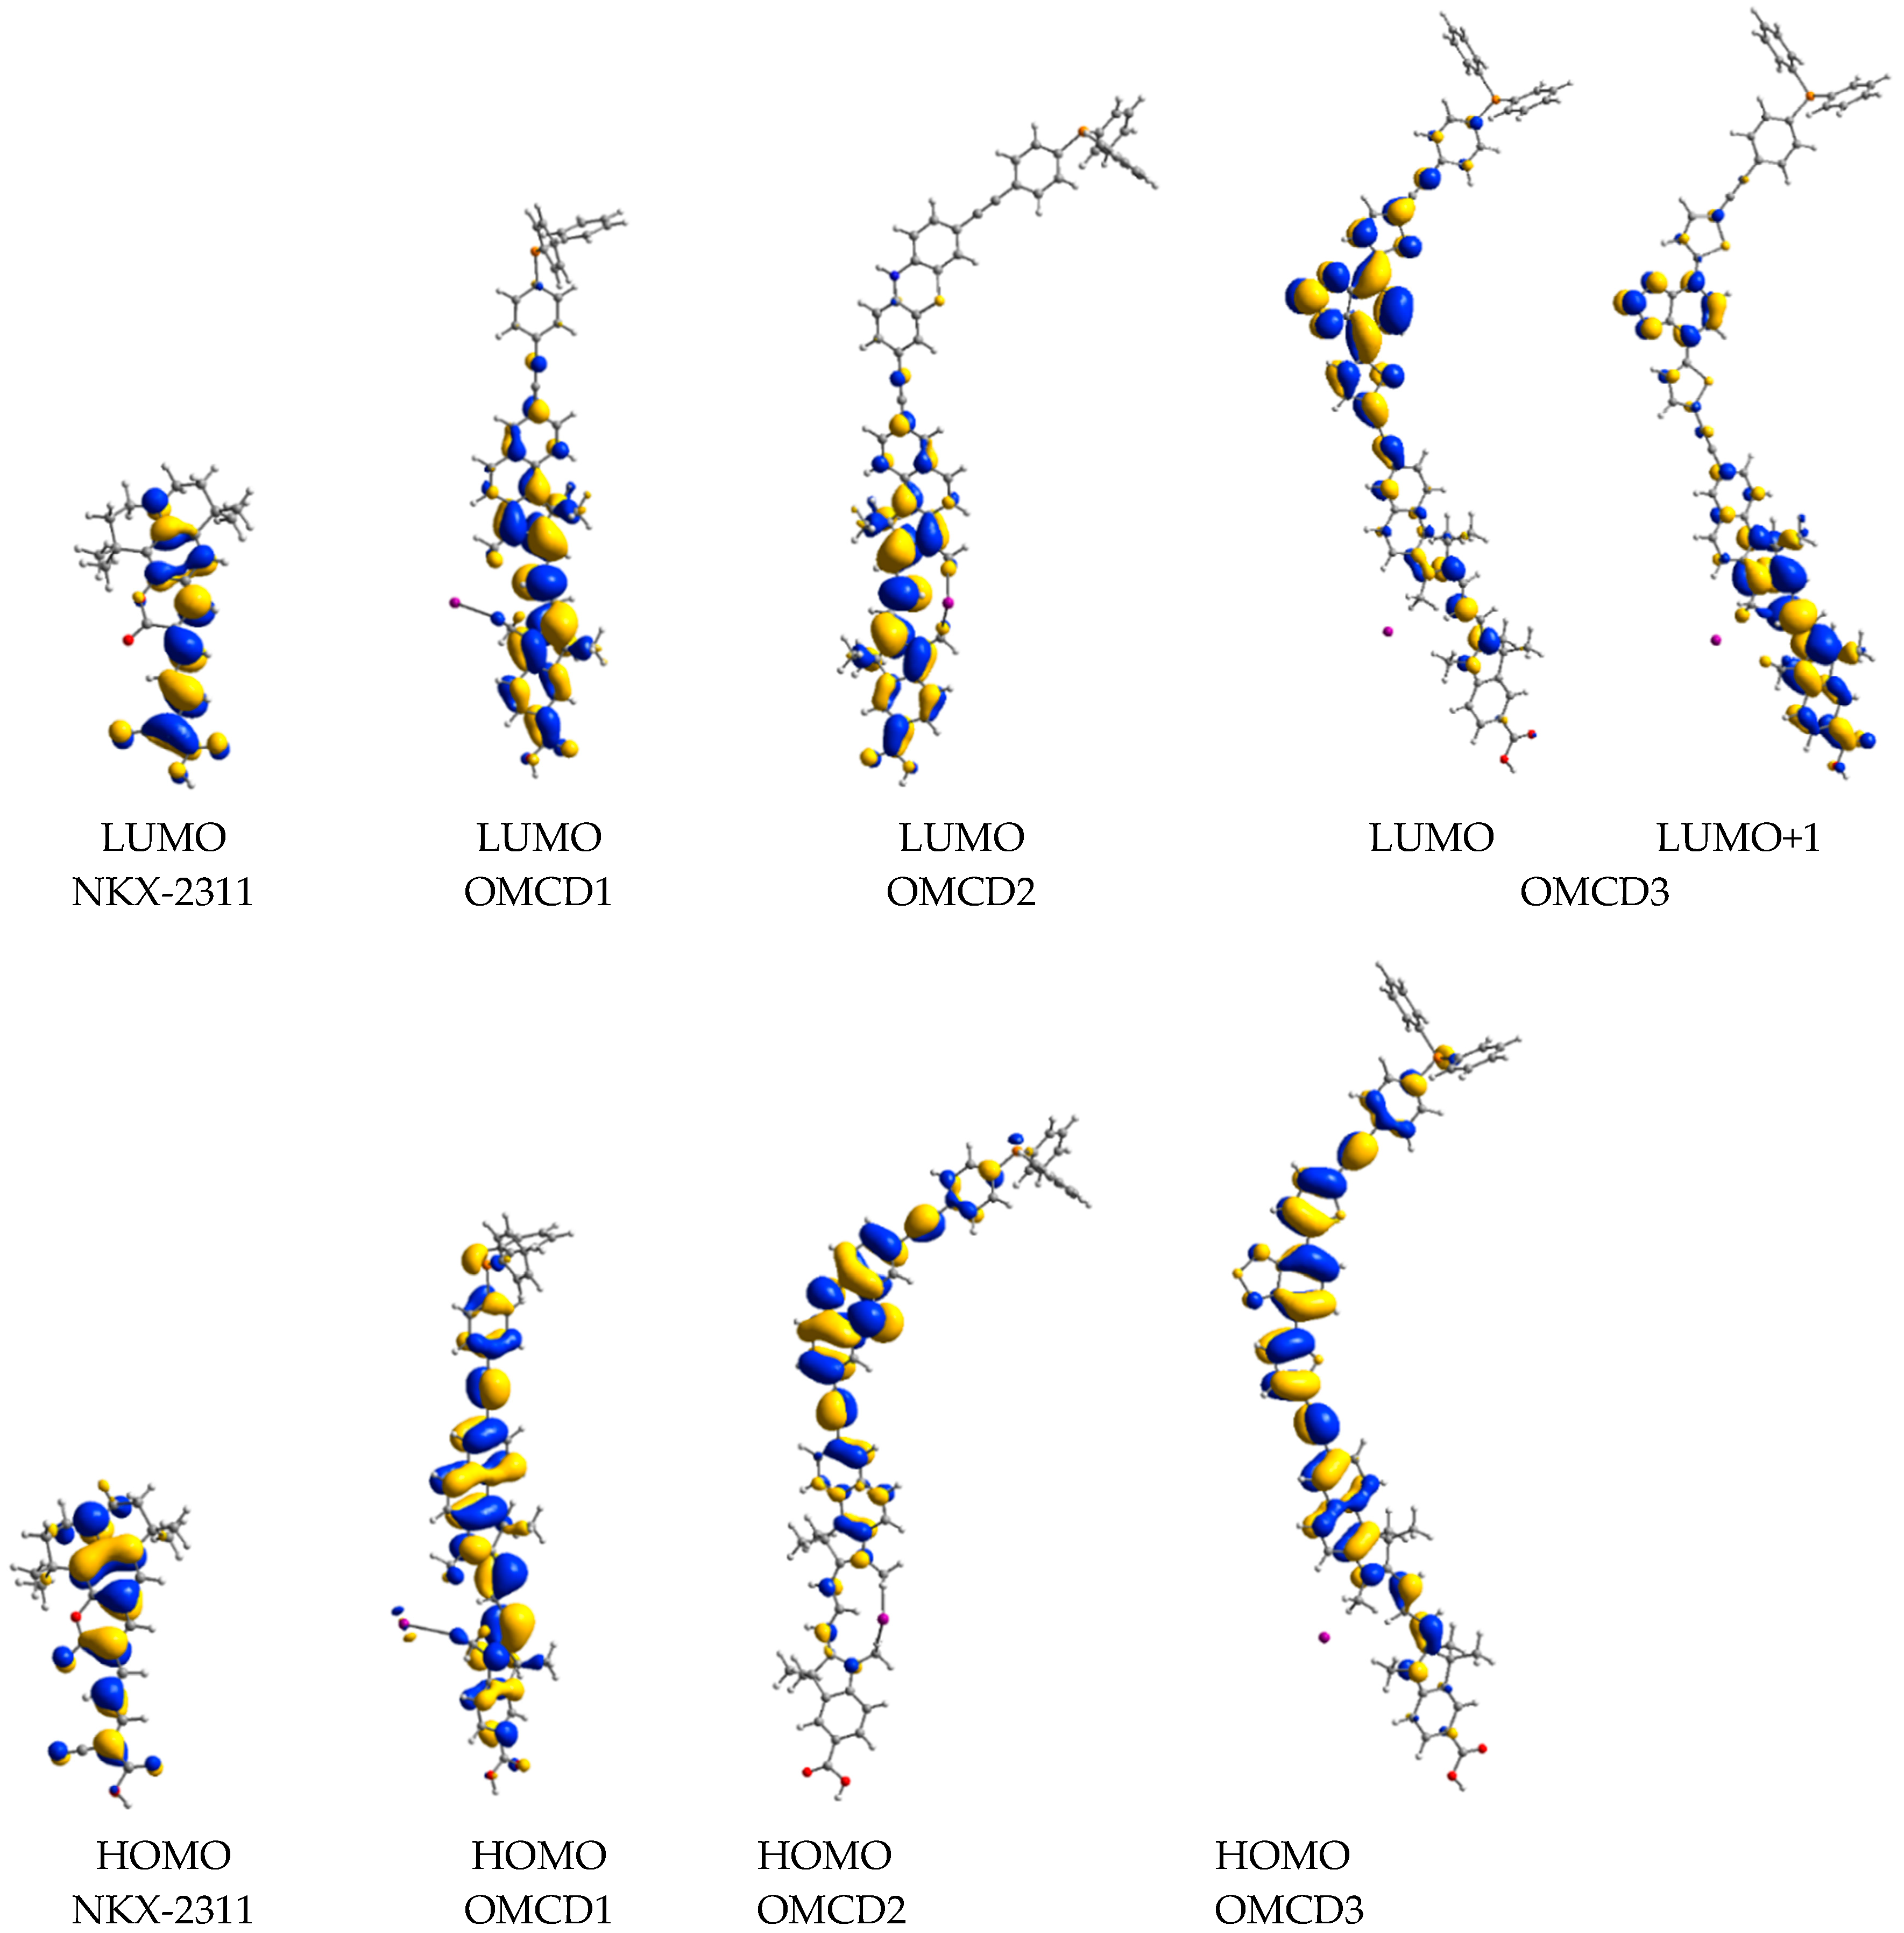
| Dye | MO | Donor unit (%) | π-bridge unit (%) | Acceptor unit (%) |
|---|---|---|---|---|
| NKX-2311 | LUMO | 40 | 38 | 22 |
| HOMO | 78 | 10 | 12 | |
| OMCD1 | LUMO | 1 | 1 | 98 |
| HOMO | 11 | 8 | 80 | |
| OMCD2 | LUMO | 2 | 38 | 60 |
| HOMO | 85 | 11 | 4 | |
| OMCD3 | LUMO+1 | 0 | 16 | 84 |
| LUMO | 2 | 81 | 17 | |
| HOMO | 7 | 67 | 26 |
| Dye | OMCD1 | OMCD2 | OMCD3 | NKX-2311 |
|---|---|---|---|---|
| Isolated dye | 4.107 | 5.588 | 7.112 | 2.591 |
| Adsorbed dye | 4.746 | 5.307 | 7.837 | 3.552 |
| Parameter | OMCD1/Ti24O50H4 | OMCD2/Ti24O50H4 | OMCD3/Ti24O50H4 | NKX-2311/Ti24O50H4 |
|---|---|---|---|---|
| r(Ti-O) | 1.876 | 1.899 | 1.877 | 1.891 |
| σr(Ti-O) | 0.104 | 0.115 | 0.106 | 0.116 |
| r(O1-Ti) | 2.082 | 2.067 | 2.085 | 2.094 |
| r(O2-Ti) | 1.942 | 1.994 | 1.941 | 1.987 |
| <(O-C-C-C) | 4.8 | 2.0 | 2.7 | 3.7 |
| <(Phenyl;3Ti) | 75.6 | 76.9 | 86.4 | 86.0 |
| Dye | MO | Donor (%) | Bridge (%) | Acceptor (%) | Cluster (%) |
|---|---|---|---|---|---|
| NKX-2311 /Ti24O50H4 | LUMO+1 | 9 | 10 | 6 | 75 |
| LUMO | 0 | 1 | 1 | 98 | |
| HOMO | 77 | 11 | 12 | 0 | |
| OMCD1 /Ti24O50H4 | LUMO+1 | 0 | 0 | 24 | 76 |
| LUMO | 0 | 0 | 1 | 99 | |
| HOMO | 12 | 8 | 80 | 0 | |
| OMCD2 /Ti24O50H4 | LUMO+4 | 0 | 0 | 20 | 80 |
| LUMO | 0 | 0 | 1 | 99 | |
| HOMO | 96 | 3 | 1 | 0 | |
| HOMO-1 | 8 | 57 | 35 | 0 | |
| OMCD3 /Ti24O50H4 | LUMO+2 | 0 | 2 | 23 | 75 |
| LUMO+1 | 2 | 87 | 7 | 4 | |
| LUMO | 0 | 3 | 1 | 96 | |
| HOMO | 6 | 69 | 25 | 0 |
© 2020 by the authors. Licensee MDPI, Basel, Switzerland. This article is an open access article distributed under the terms and conditions of the Creative Commons Attribution (CC BY) license (http://creativecommons.org/licenses/by/4.0/).
Share and Cite
Oprea, C.I.; Panait, P.; Essam, Z.M.; Abd El-Aal, R.M.; Gîrțu, M.A. Photoexcitation Processes in Oligomethine Cyanine Dyes for Dye-Sensitized Solar Cells—Synthesis and Computational Study. Nanomaterials 2020, 10, 662. https://doi.org/10.3390/nano10040662
Oprea CI, Panait P, Essam ZM, Abd El-Aal RM, Gîrțu MA. Photoexcitation Processes in Oligomethine Cyanine Dyes for Dye-Sensitized Solar Cells—Synthesis and Computational Study. Nanomaterials. 2020; 10(4):662. https://doi.org/10.3390/nano10040662
Chicago/Turabian StyleOprea, Corneliu I., Petre Panait, Zahraa M. Essam, Reda M. Abd El-Aal, and Mihai A. Gîrțu. 2020. "Photoexcitation Processes in Oligomethine Cyanine Dyes for Dye-Sensitized Solar Cells—Synthesis and Computational Study" Nanomaterials 10, no. 4: 662. https://doi.org/10.3390/nano10040662