Structure and Electronic Properties of TiO2 Nanoclusters and Dye–Nanocluster Systems Appropriate to Model Hybrid Photovoltaic or Photocatalytic Applications


Abstract
:
1. Introduction
2. Materials and Methods
3. Results
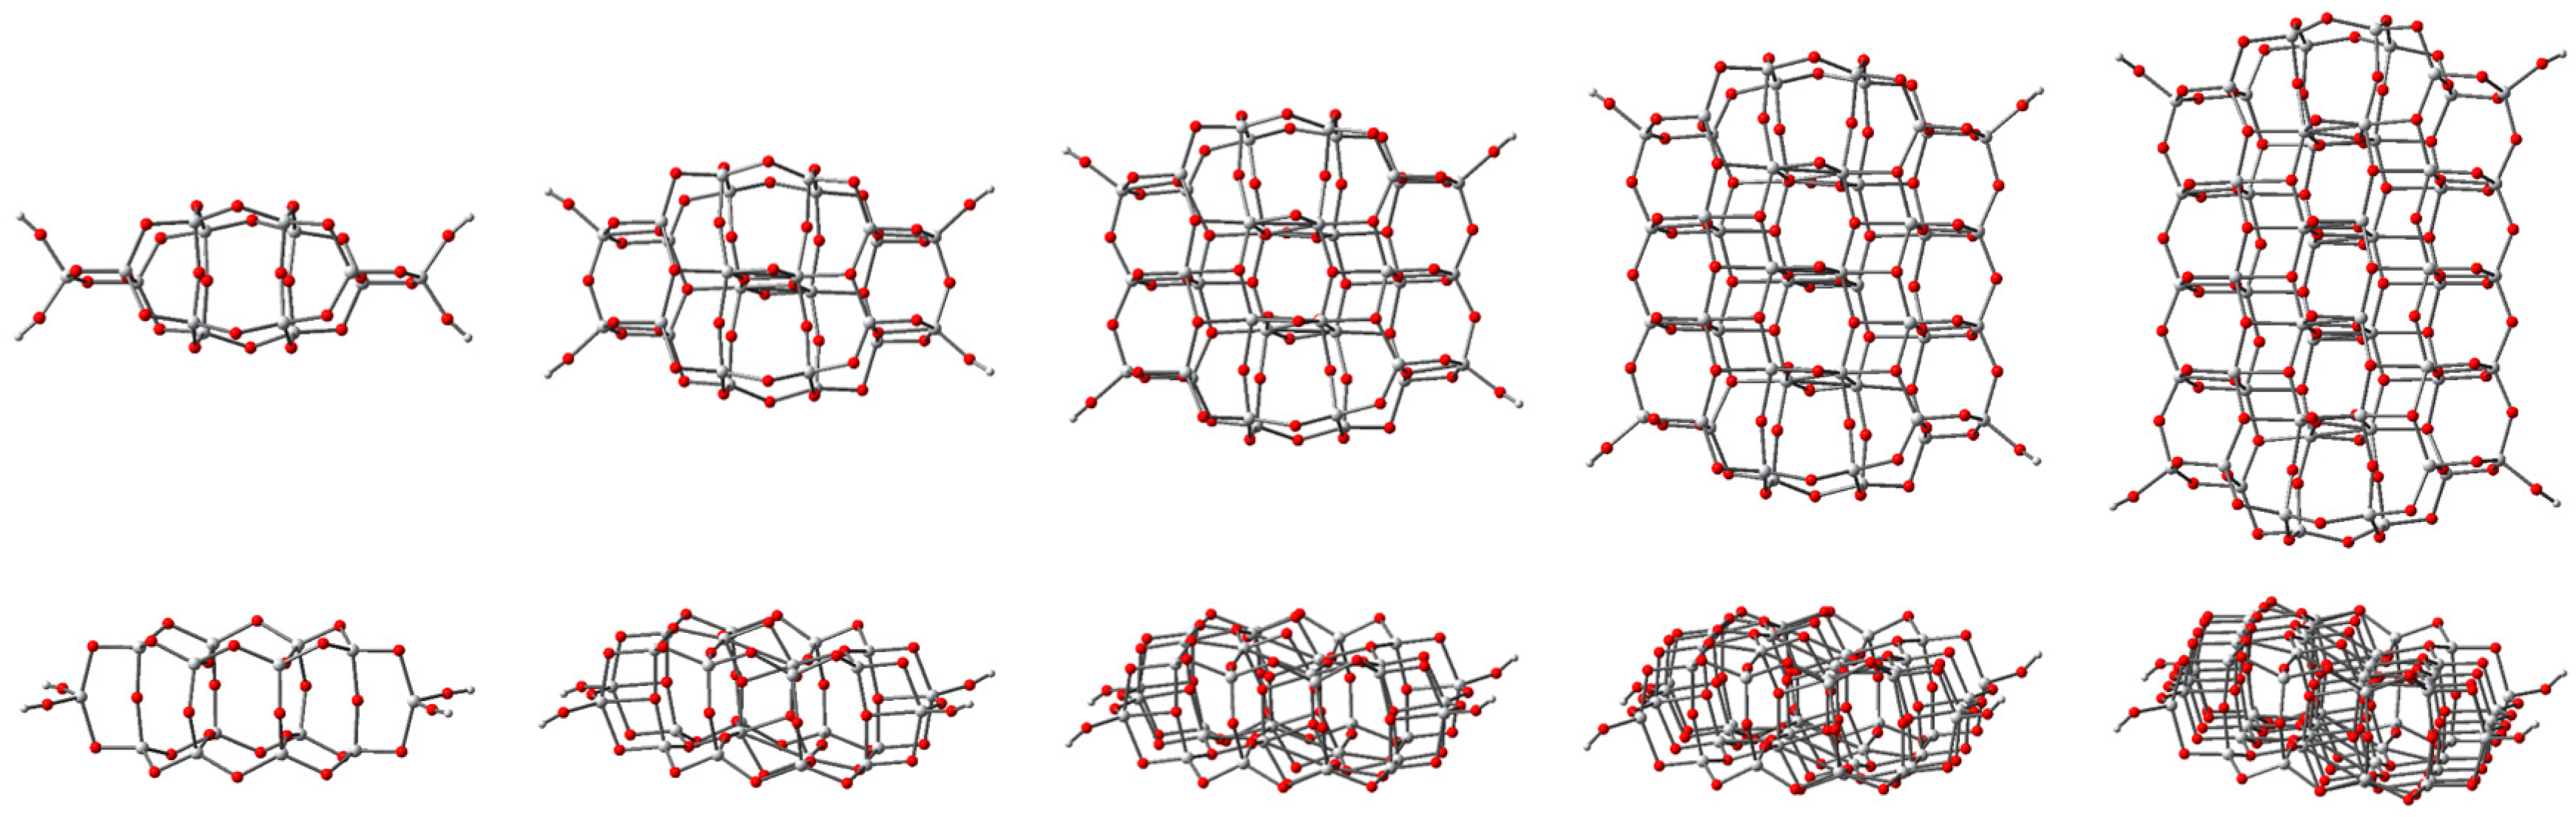
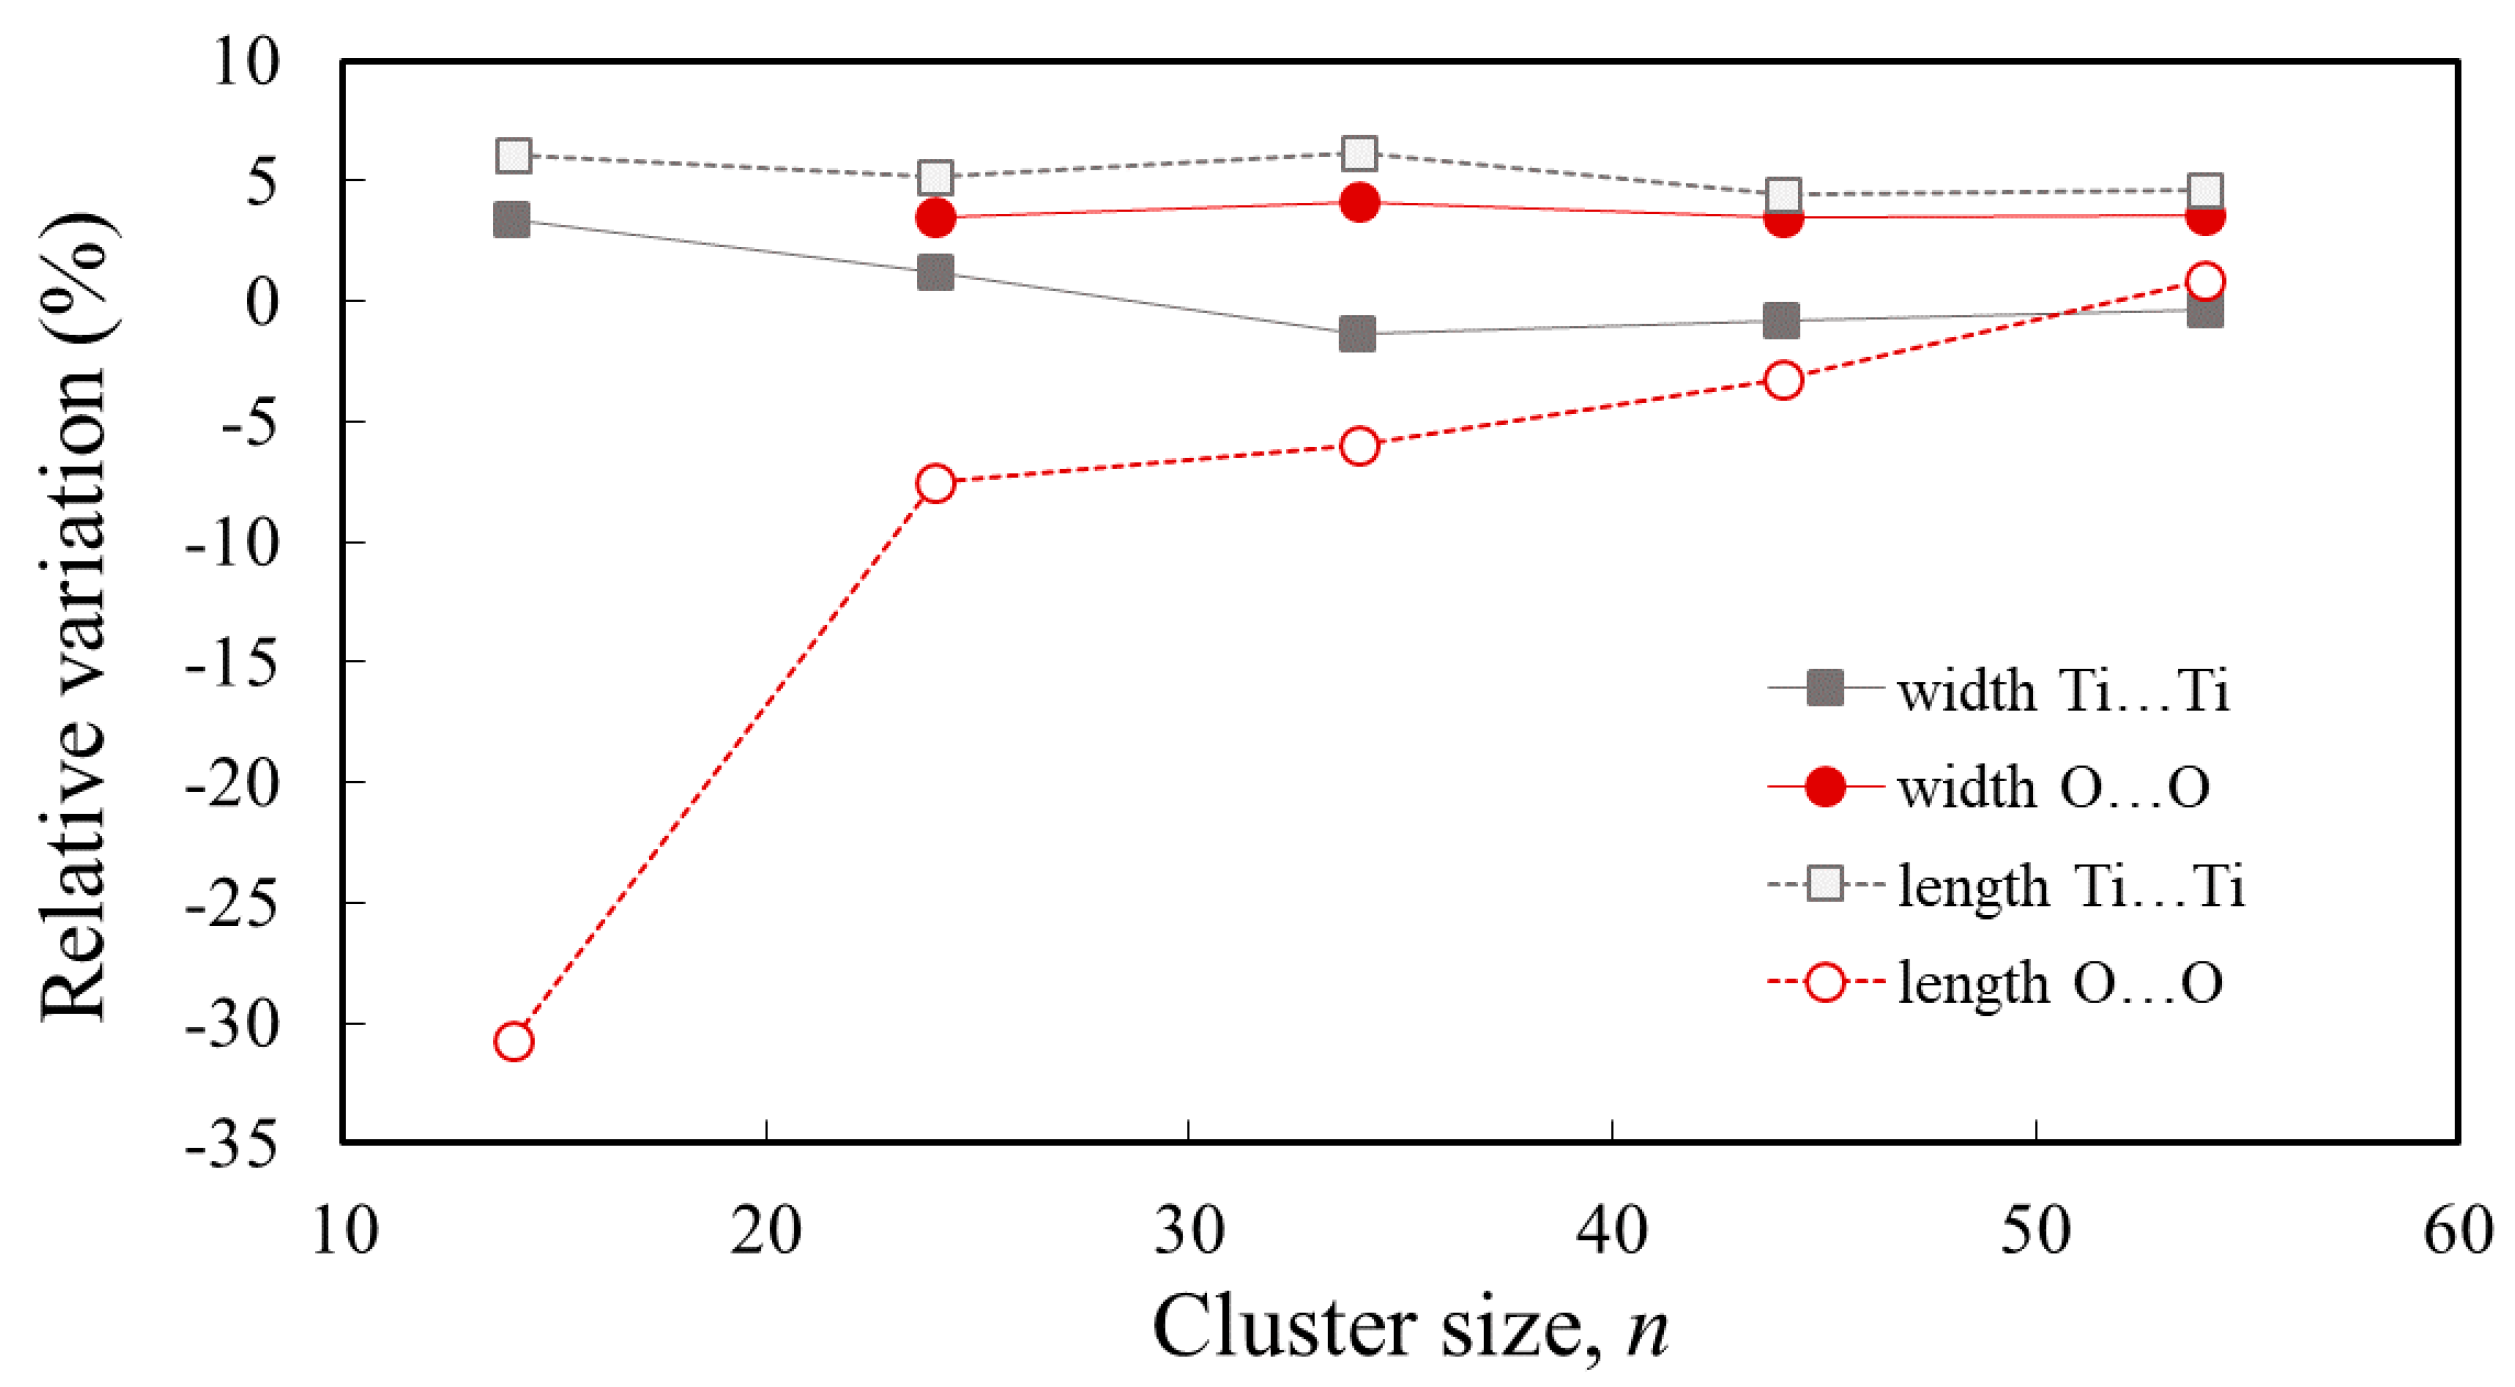
3.1. Structure and Properties of TiO2 Nanoclusters
3.2. Structure and Properties of TiO2 Nanoclusters with Rigid Adsorbed Molecules
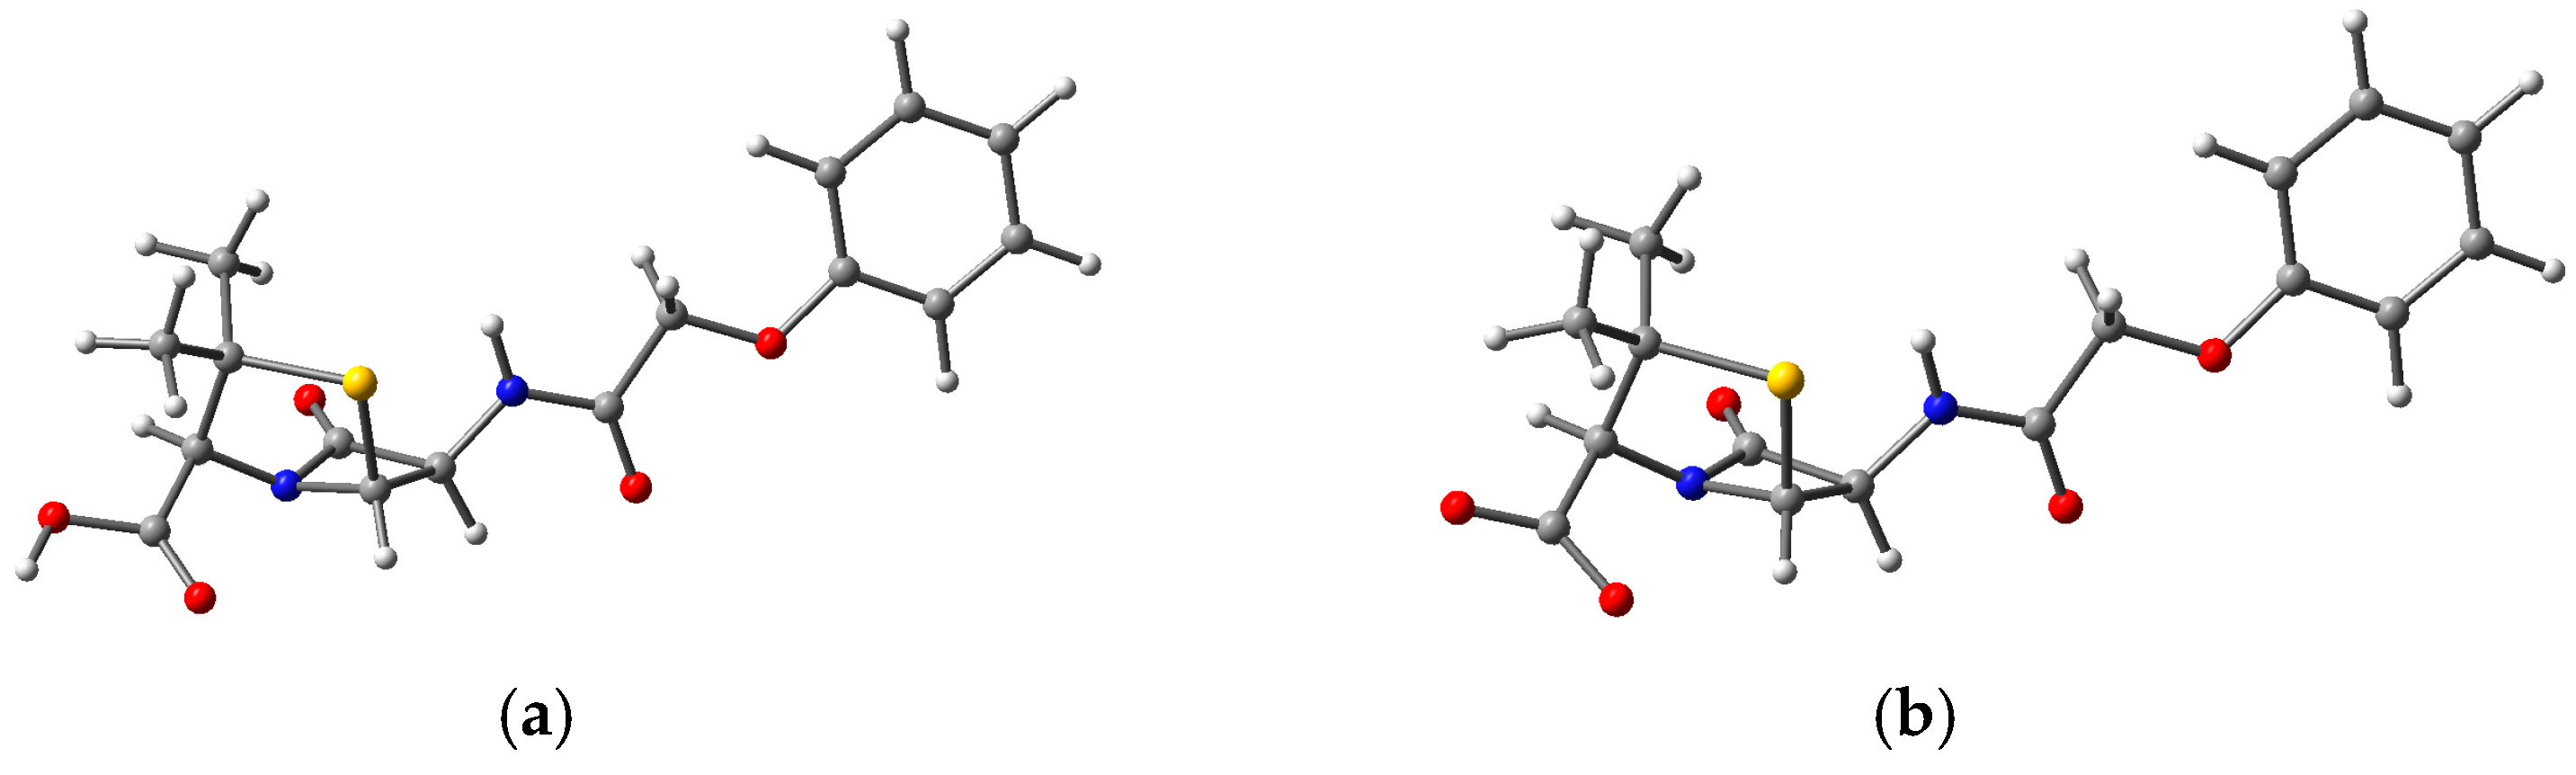
3.2.1. Structure and Properties of TiO2 Nanoclusters with a Small Rigid Adsorbed Molecule
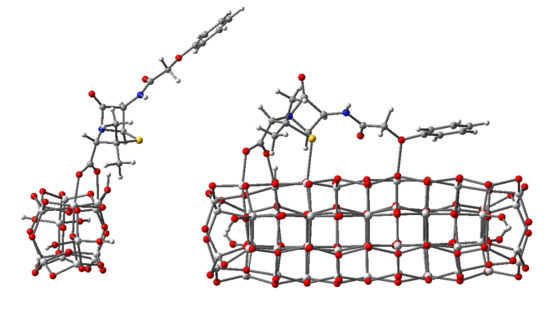
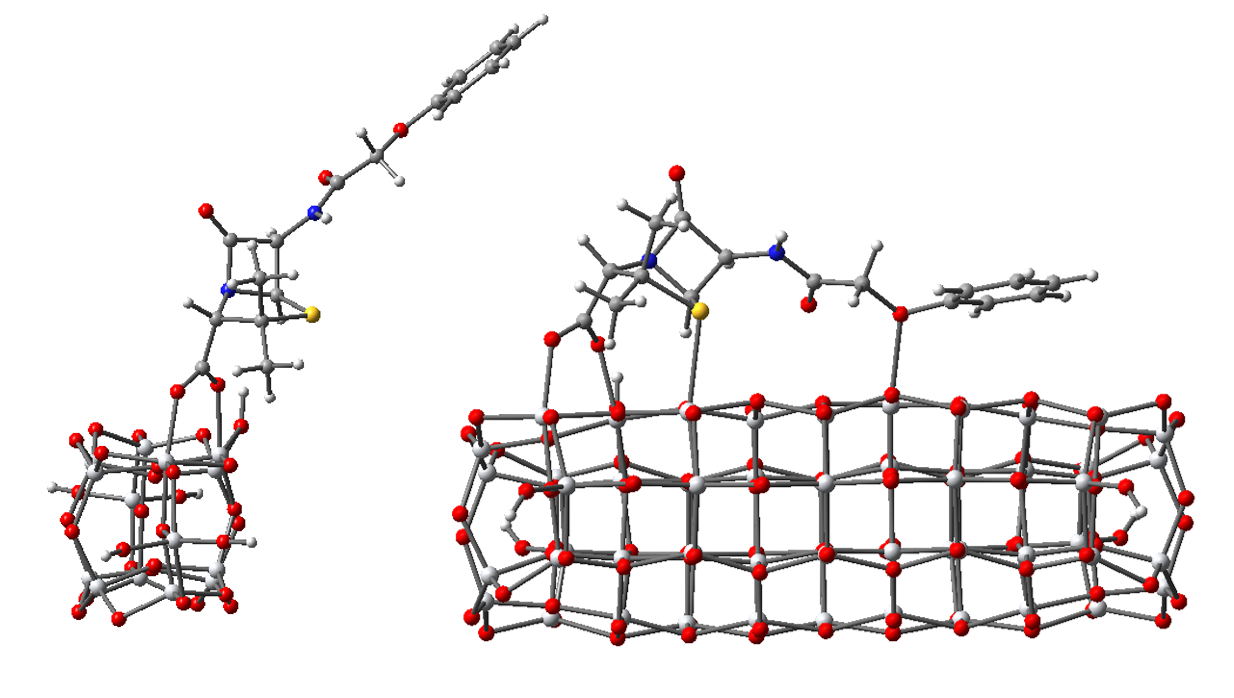
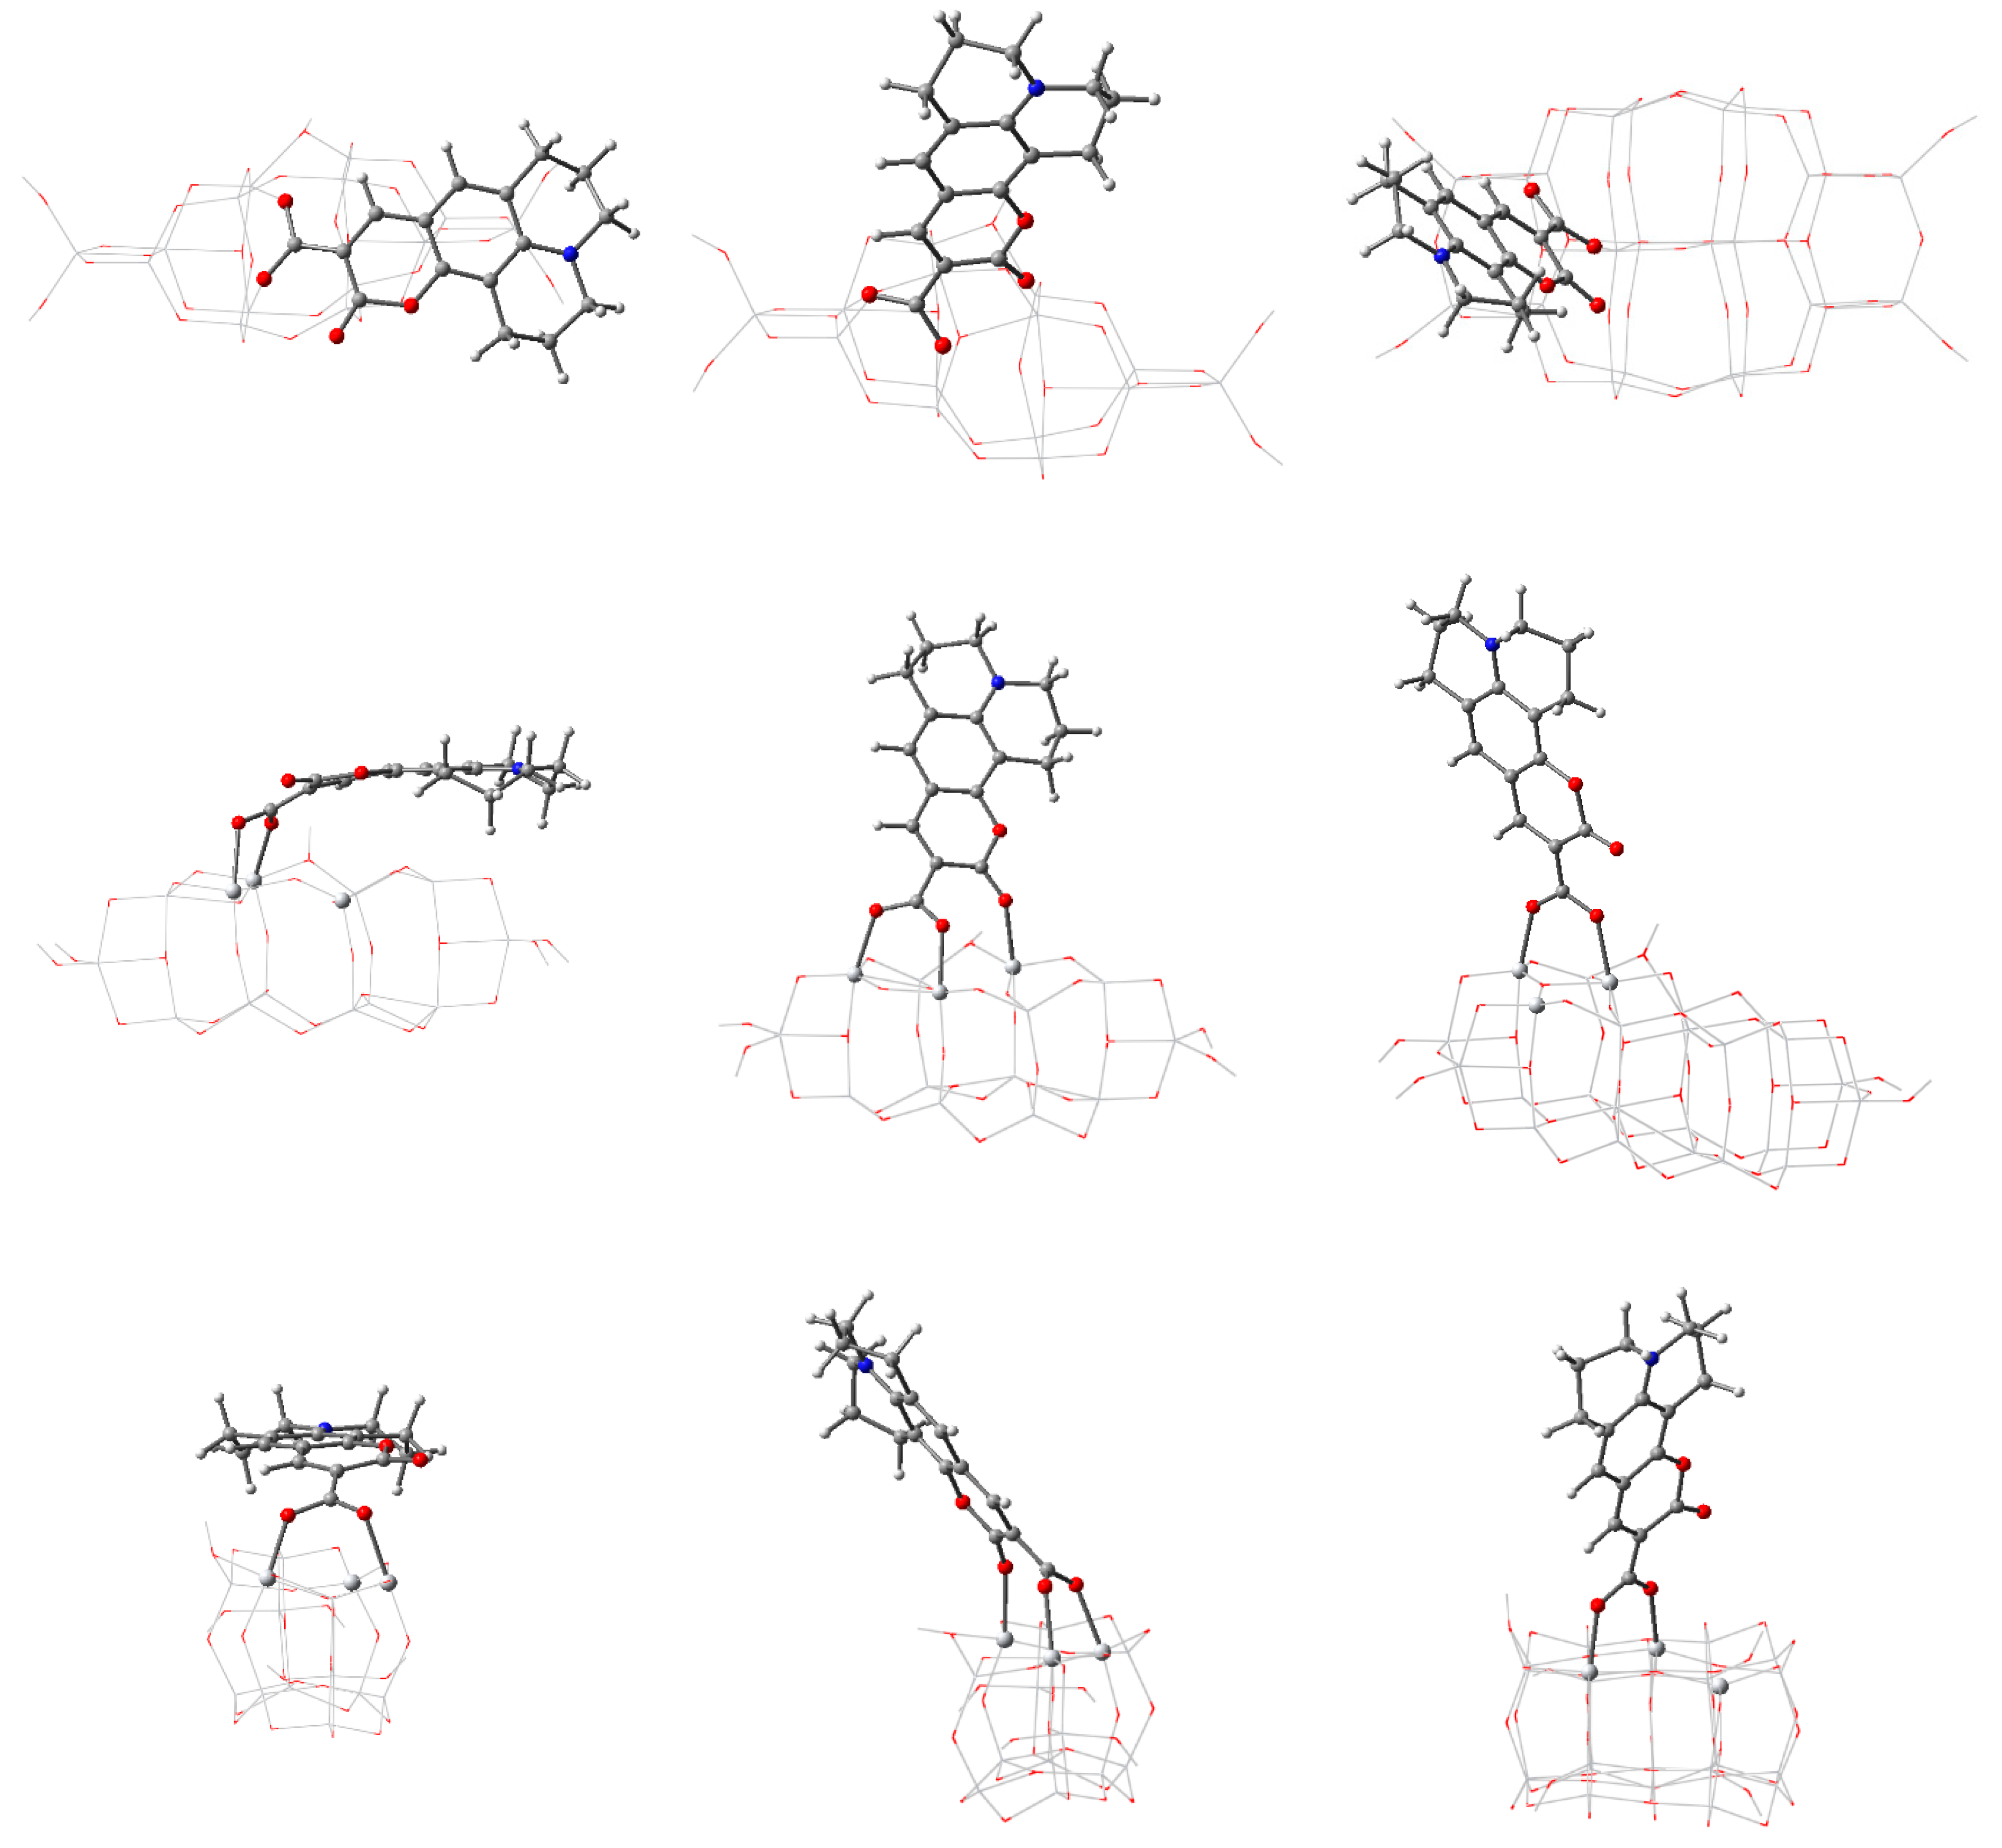
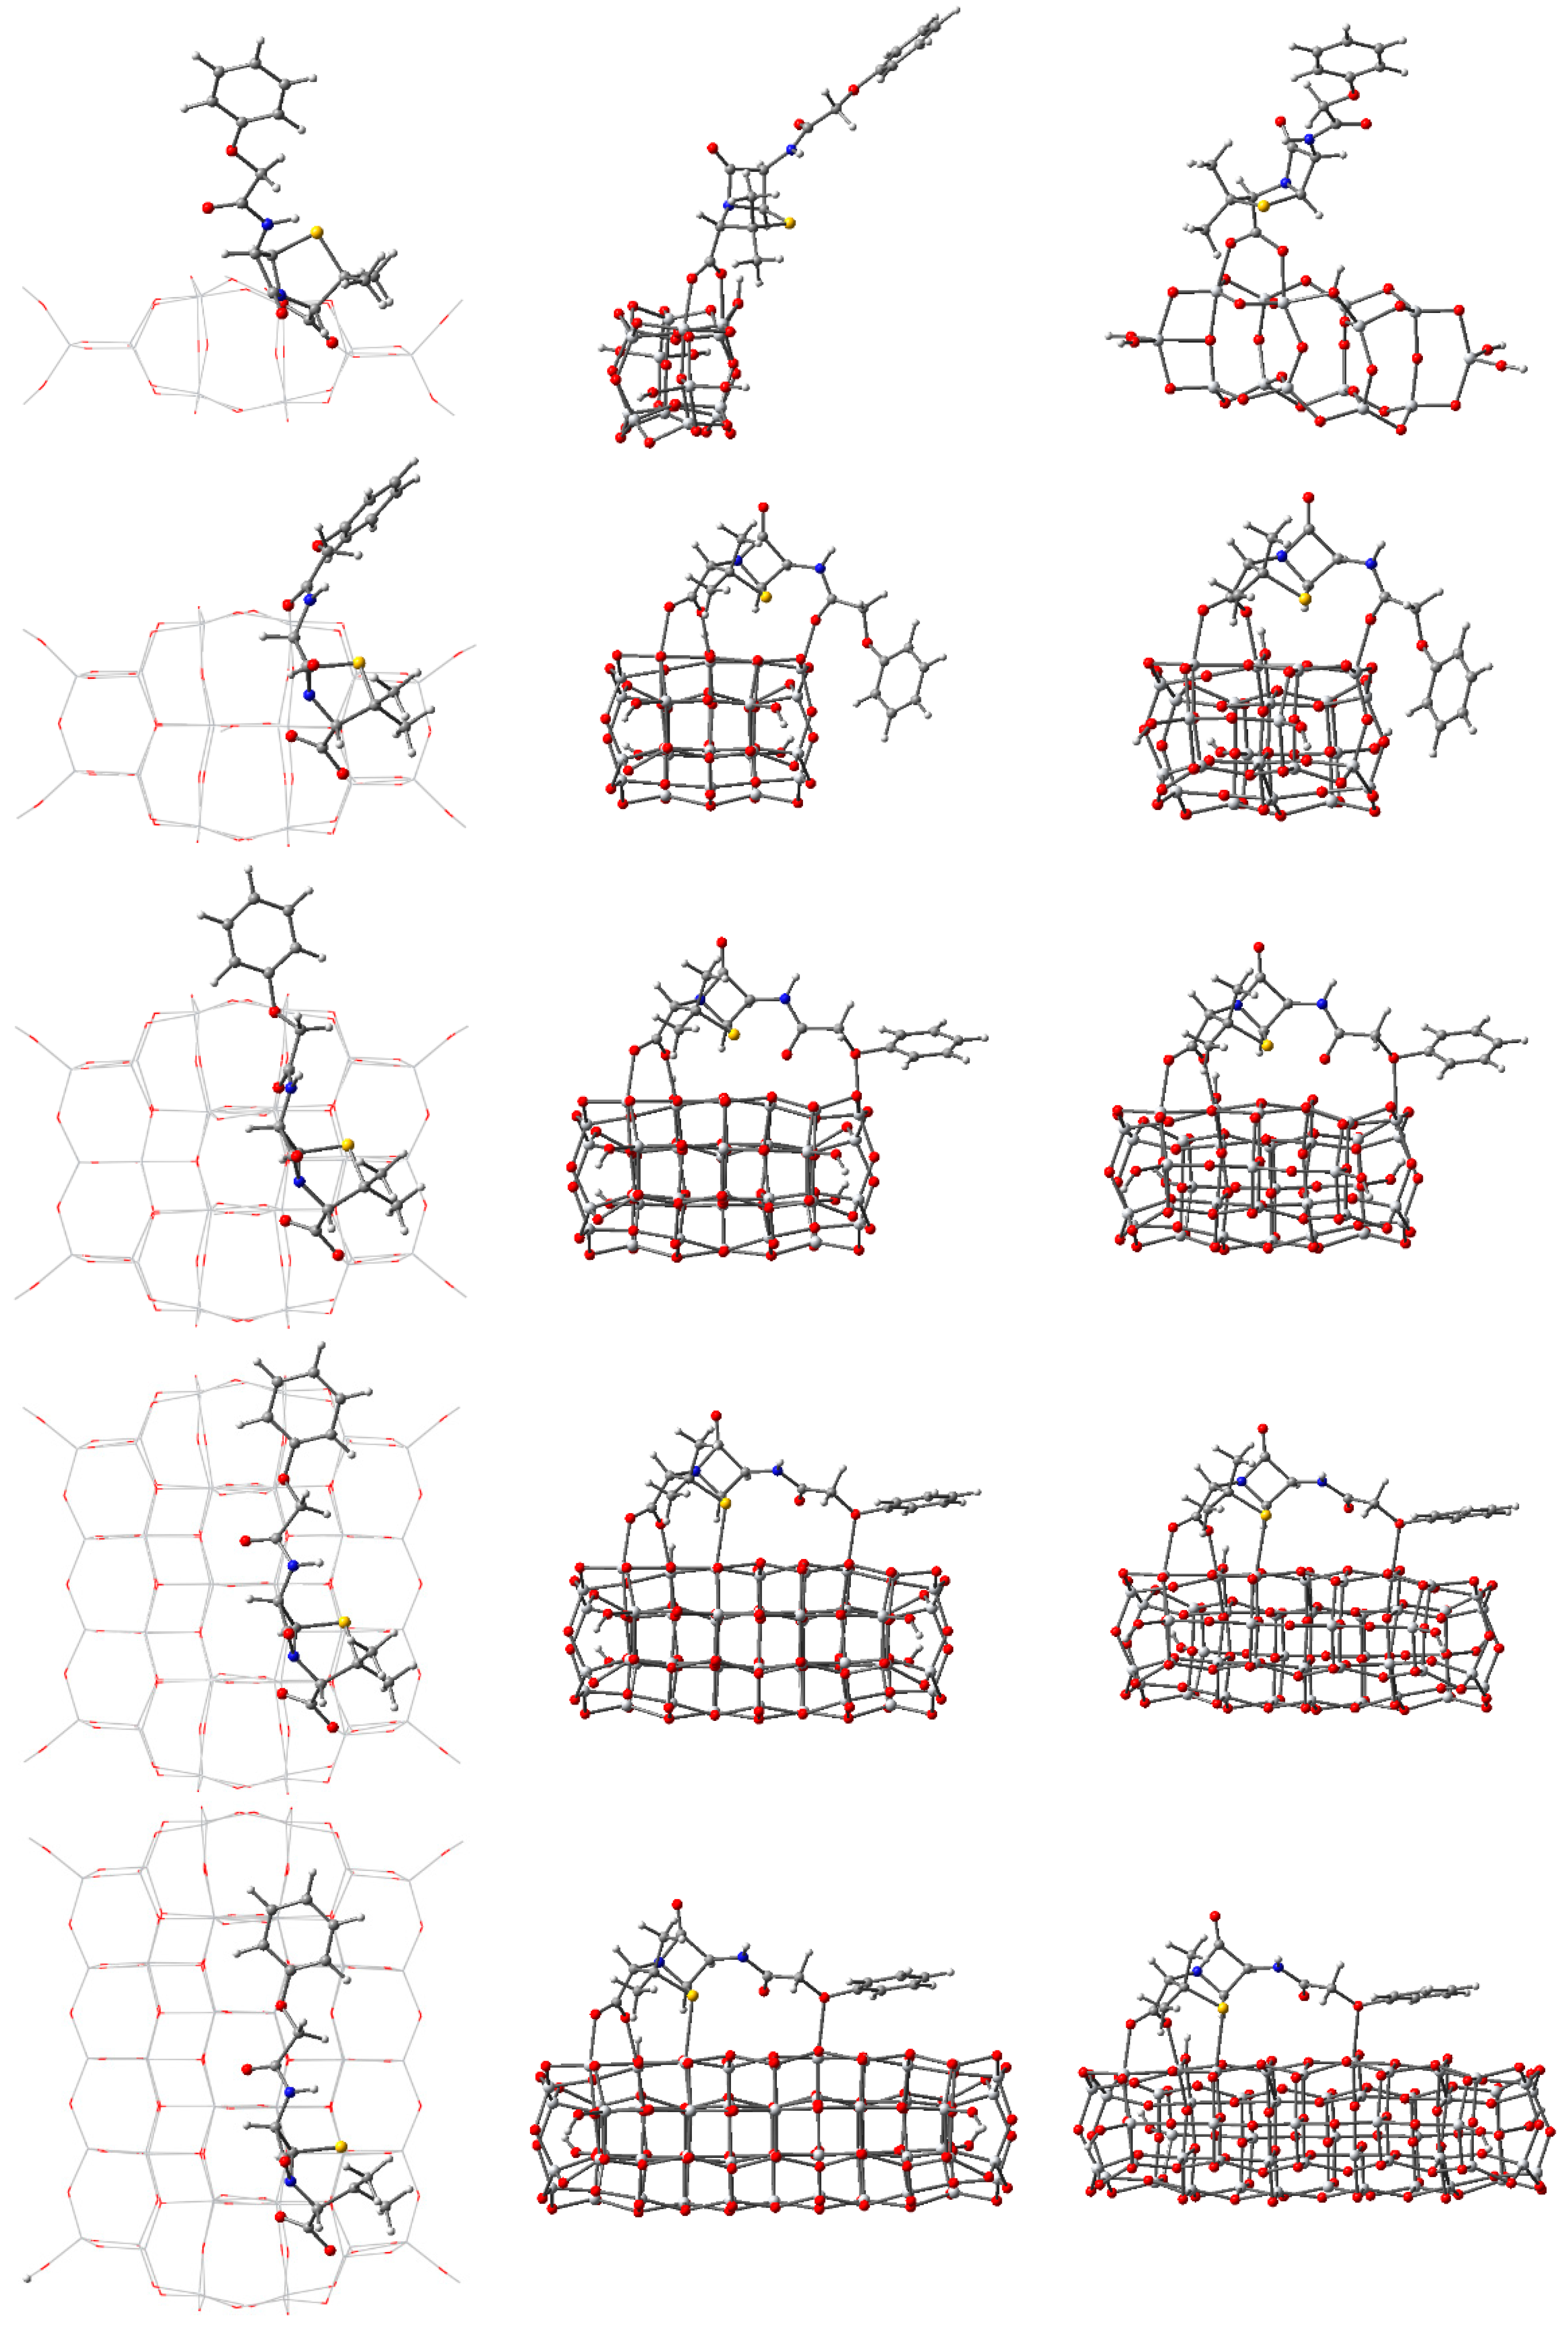
3.2.2. Structure and Properties of TiO2 Nanoclusters with a Large Rigid Adsorbed Molecule
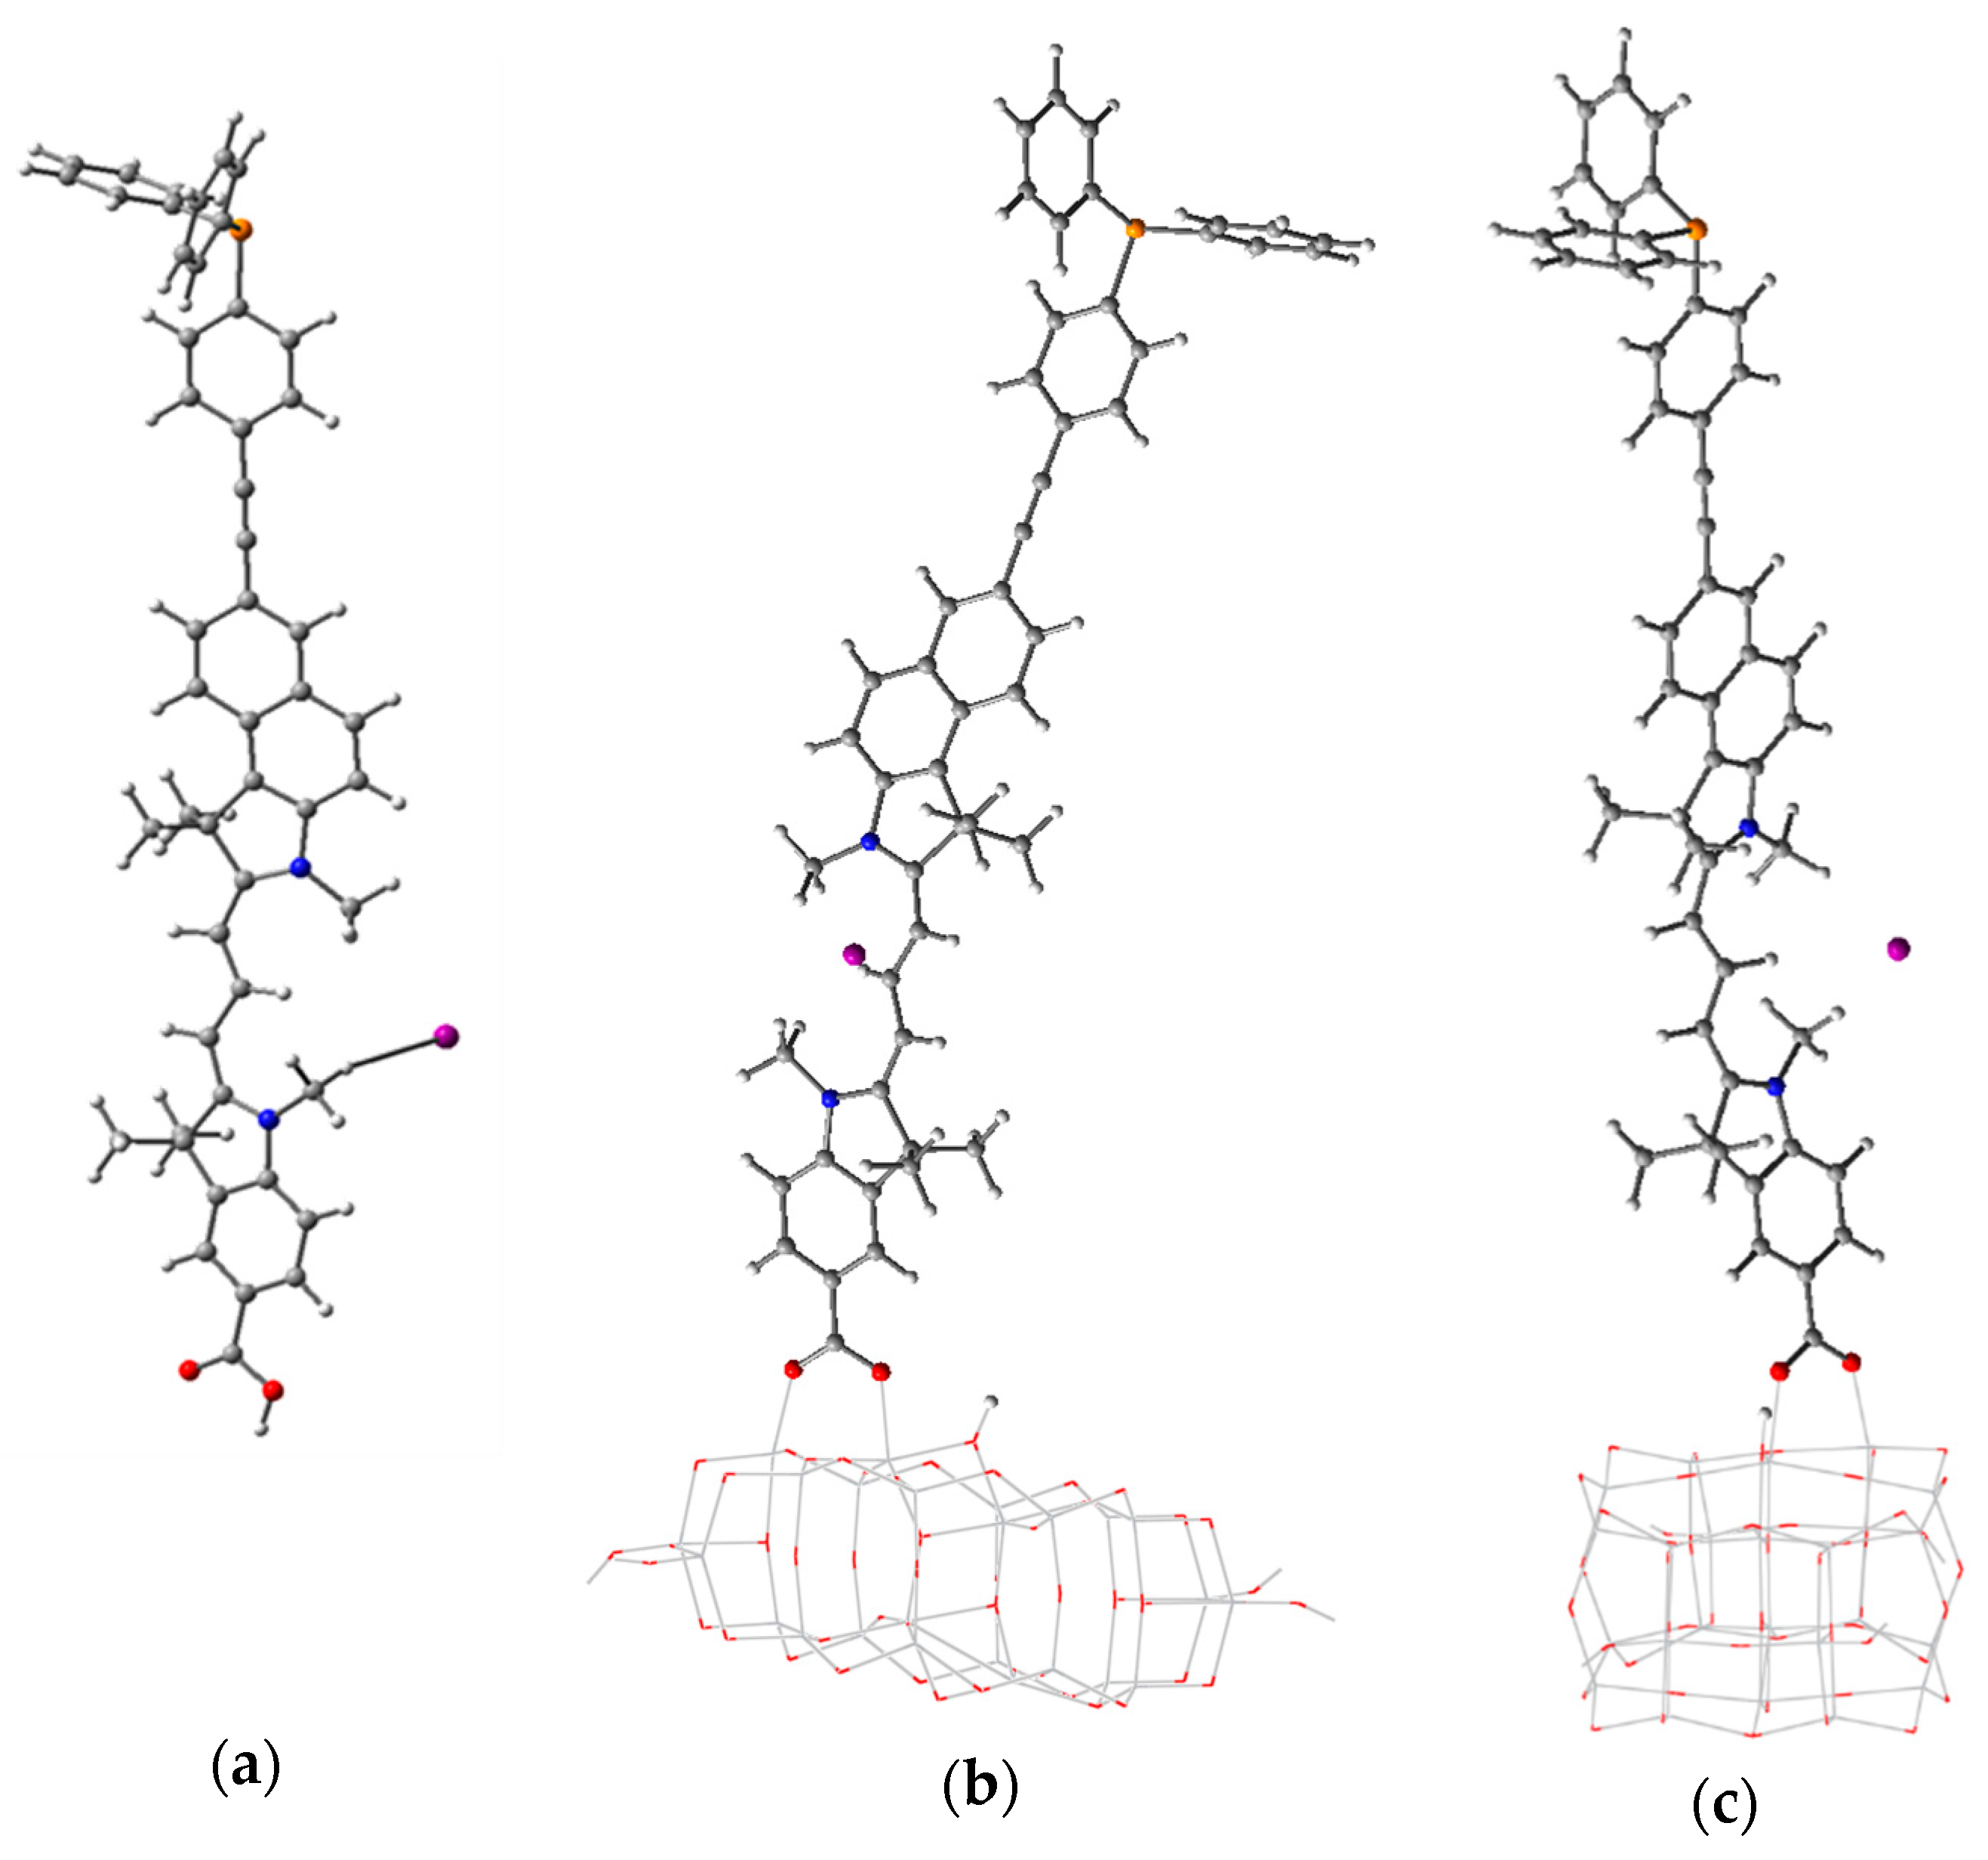
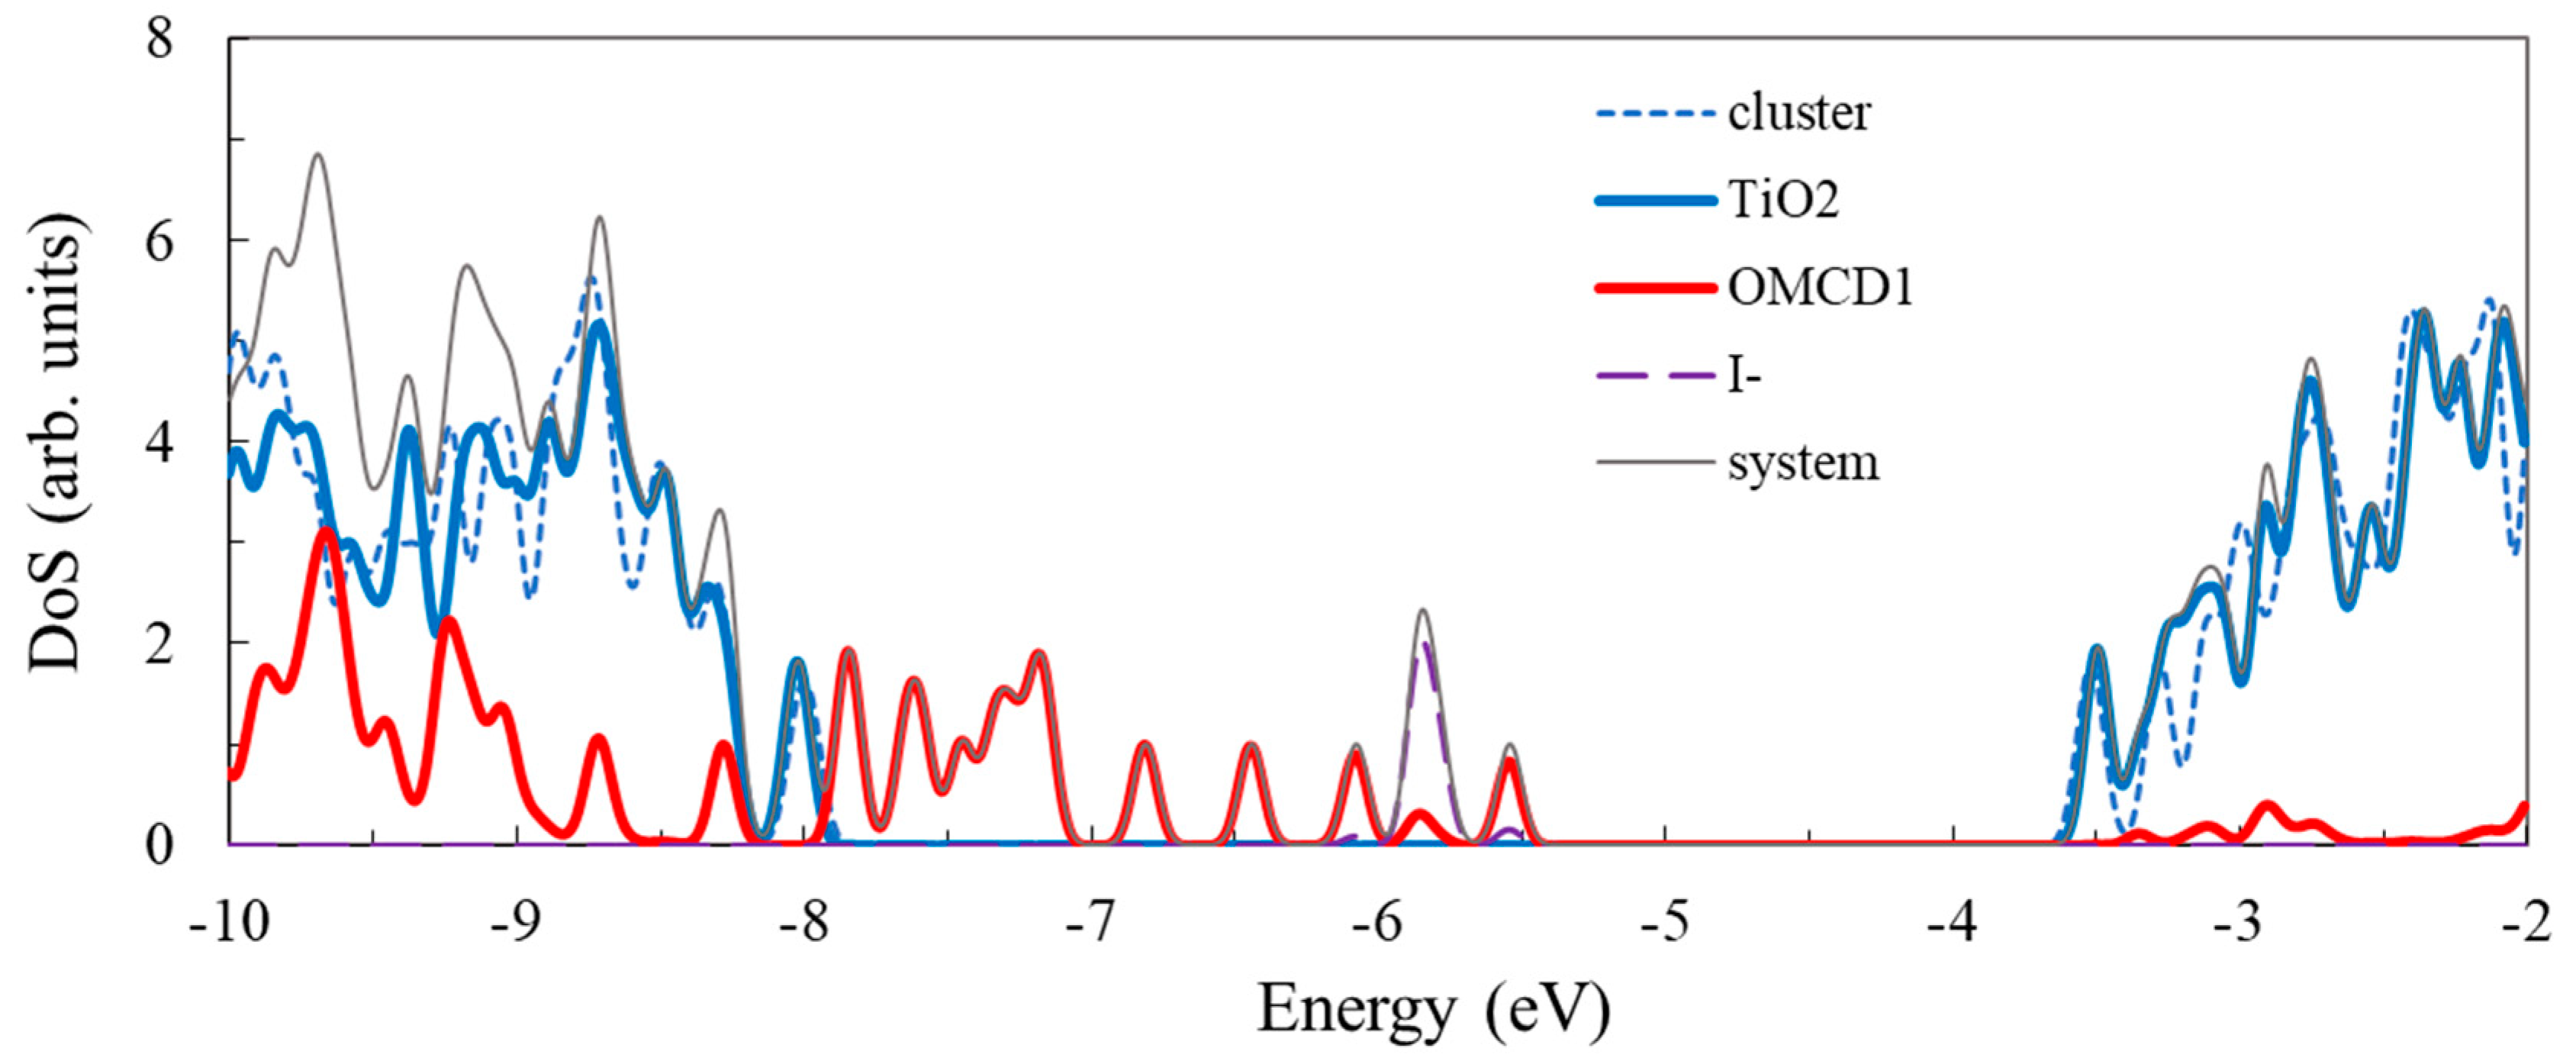
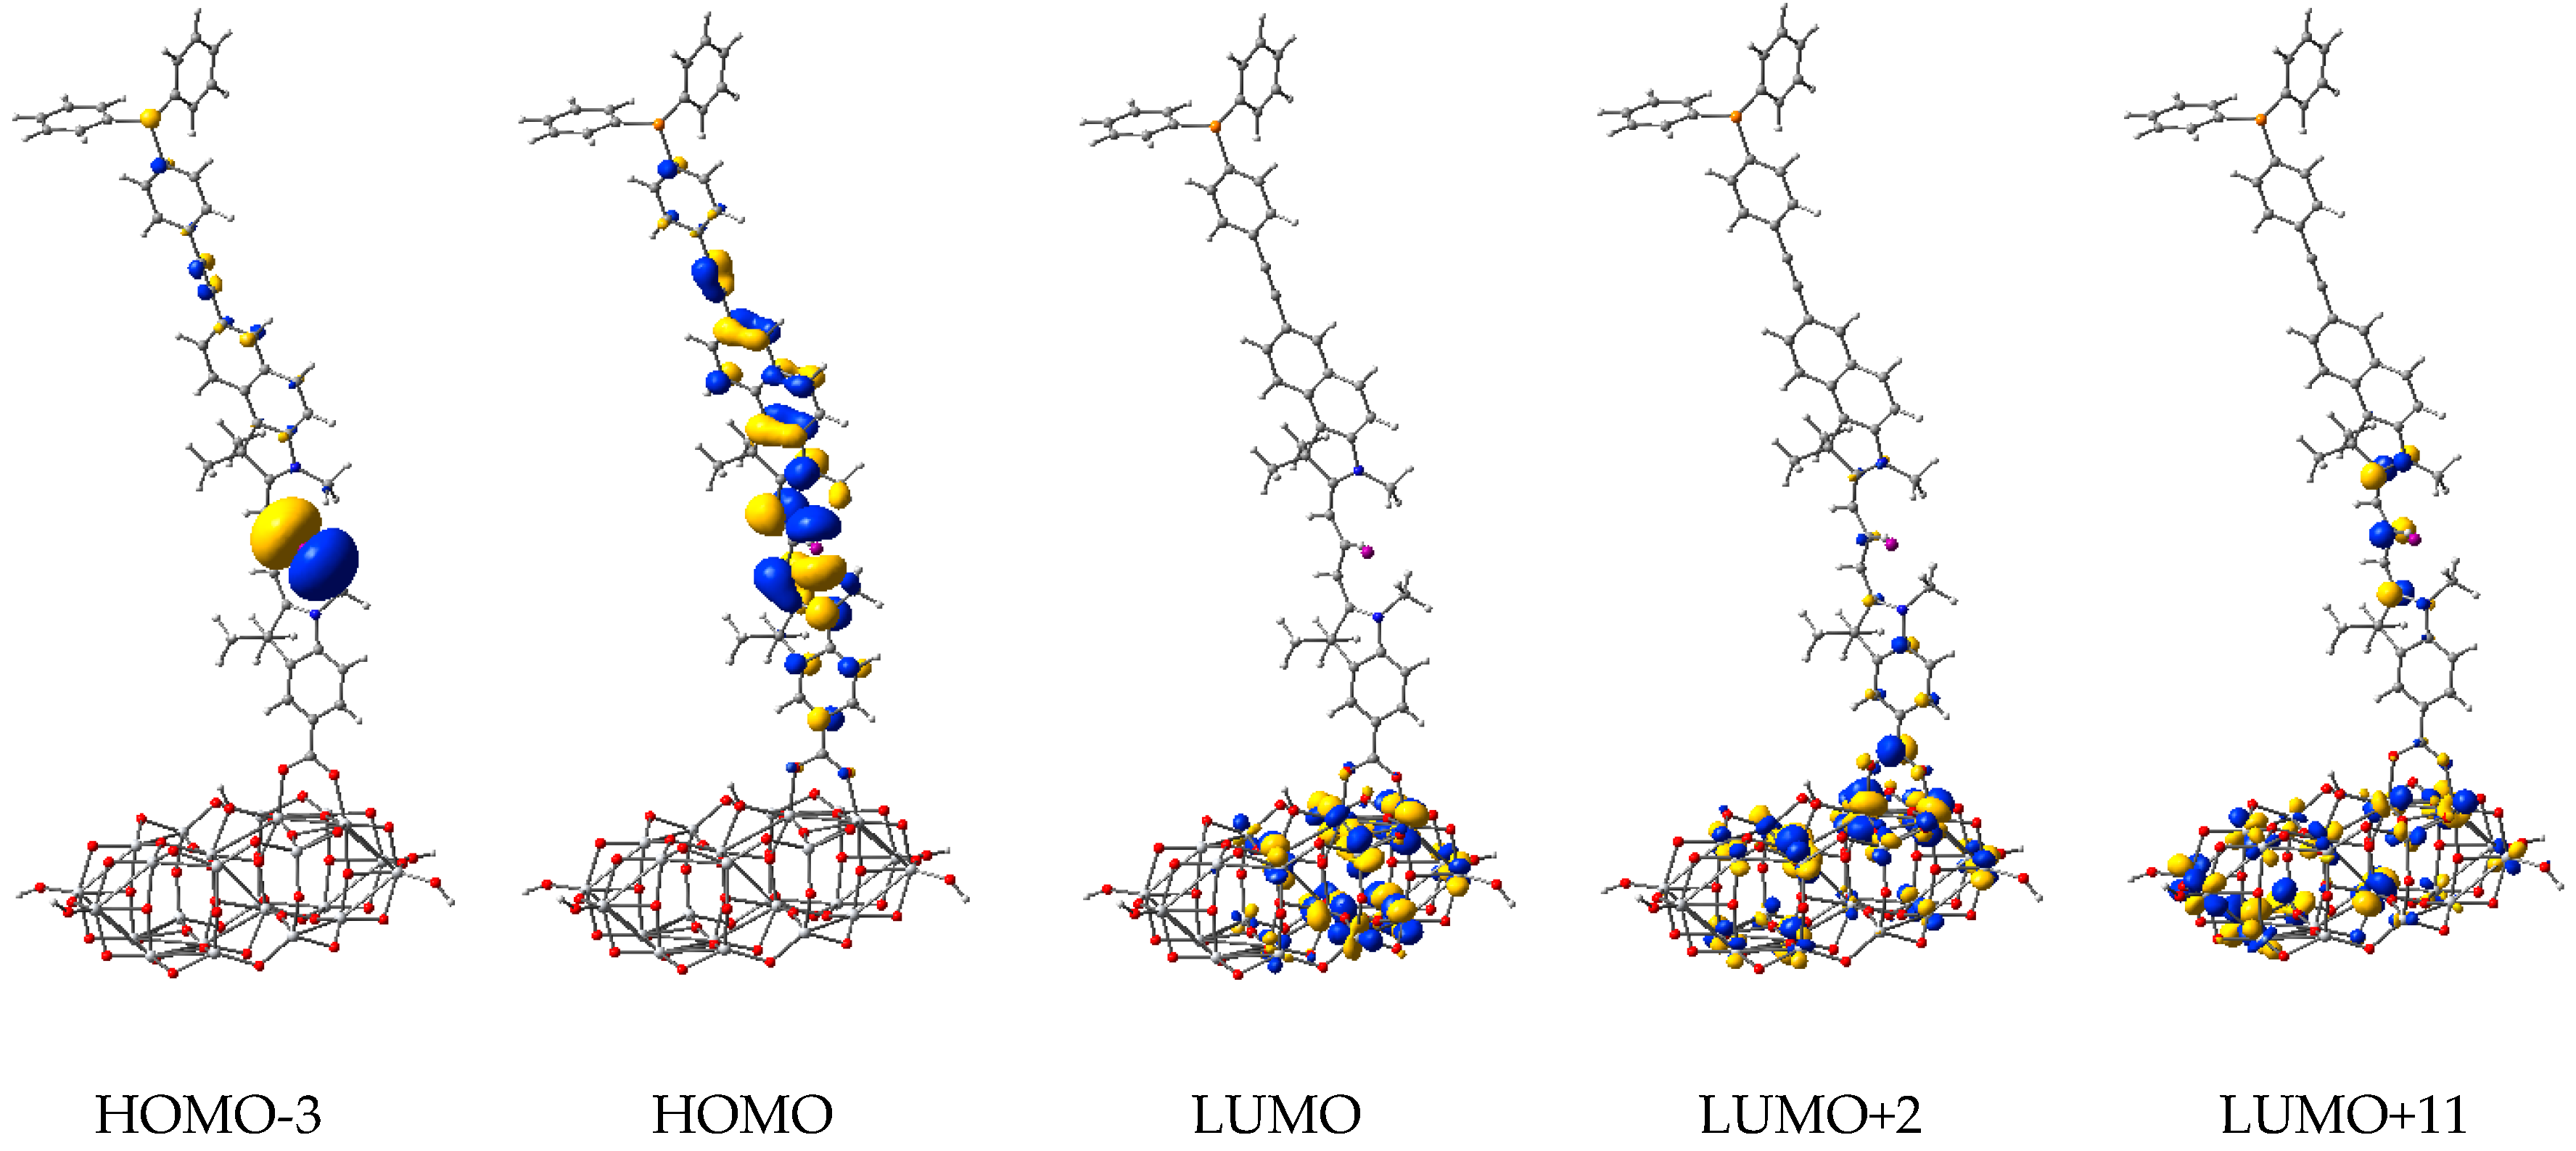
3.3. Structure and Properties of TiO2 Nanoclusters with Flexible Adsorbed Molecules
4. Discussion
5. Conclusions
Supplementary Materials
Author Contributions
Funding
Acknowledgments
Conflicts of Interest
References
- Chen, X.; Selloni, A. Introduction: Titanium Dioxide (TiO2) Nanomaterials. Chem. Rev. 2014, 114, 9281–9282. [Google Scholar] [CrossRef] [PubMed]
- Fujishima, A.; Honda, K. Electrochemical Photolysis of Water at a Semiconductor Electrode. Nature 1972, 238, 37–38. [Google Scholar] [CrossRef] [PubMed]
- Schneider, J.; Matsuoka, M.; Takeuchi, M.; Zhang, J.; Horiuchi, Y.; Anpo, M.; Bahnemann, D.W. Understanding TiO2 Photocatalysis: Mechanisms and Materials. Chem. Rev. 2014, 114, 9919–9986. [Google Scholar] [CrossRef] [PubMed]
- Ma, Y.; Wang, X.; Jia, Y.; Chen, X.; Han, H.; Li, C. Titanium Dioxide-Based Nanomaterials for Photocatalytic Fuel Generations. Chem. Rev. 2014, 114, 9987–10043. [Google Scholar] [CrossRef] [PubMed]
- Bai, Y.; Mora-Seró, I.; De Angelis, F.; Bisquert, J.; Wang, P. Titanium Dioxide Nanomaterials for Photovoltaic Applications. Chem. Rev. 2014, 114, 10095–10130. [Google Scholar] [CrossRef] [PubMed] [Green Version]
- Kapilashrami, M.; Zhang, Y.; Liu, Y.-S.; Hagfeldt, A.; Guo, J. Probing the Optical Property and Electronic Structure of TiO2 Nanomaterials for Renewable Energy Applications. Chem. Rev. 2014, 114, 9662–9707. [Google Scholar] [CrossRef] [PubMed]
- Bai, J.; Zhou, B. Titanium Dioxide Nanomaterials for Sensor Applications. Chem. Rev. 2014, 114, 10131–10176. [Google Scholar] [CrossRef] [PubMed]
- Liu, G.; Yang, H.G.; Pan, J.; Yang, Y.Q.; Lu, G.Q.; Cheng, H.-M. Titanium Dioxide Crystals with Tailored Facets. Chem. Rev. 2014, 114, 9559–9612. [Google Scholar] [CrossRef] [PubMed]
- Rajh, T.; Dimitrijevic, N.M.; Bissonnette, M.; Koritarov, T.; Konda, V. Titanium Dioxide in the Service of the Biomedical Revolution. Chem. Rev. 2014, 114, 10177–10216. [Google Scholar] [CrossRef] [PubMed]
- Cargnello, M.; Gordon, T.R.; Murray, C.B. Solution-Phase Synthesis of Titanium Dioxide Nanoparticles and Nanocrystals. Chem. Rev. 2014, 114, 9319–9345. [Google Scholar] [CrossRef] [PubMed]
- Fattakhova-Rohlfing, D.; Zaleska, A.; Bein, T. Three-Dimensional Titanium Dioxide Nanomaterials. Chem. Rev. 2014, 114, 9487–9558. [Google Scholar] [CrossRef] [PubMed]
- Kohn, W.; Sham, L.J. Self-consistent equations including exchange and correlation effects. Phys. Rev. 1965, 140, A1133–A1138. [Google Scholar] [CrossRef]
- Geerlings, P.; De Proft, F.; Langenaeker, W. Conceptual Density Functional Theory. Chem. Rev. 2003, 103, 1793. [Google Scholar] [CrossRef] [PubMed]
- Cohen, A.J.; Mori-Sánchez, P.; Yang, W. Challenges for Density Functional Theory. Chem. Rev. 2011, 112, 289. [Google Scholar] [CrossRef] [PubMed]
- Onida, G.; Reining, L.; Rubio, A. Electronic excitations: Density-functional versus many-body Green’s-function approaches. Rev. Mod. Phys. 2002, 74, 601. [Google Scholar] [CrossRef]
- Catlow, C.R.A.; Bromley, S.T.; Hamad, S.; Mora-Fonz, M.; Sokol, A.A.; Woodley, S.M. Modelling nano-clusters and nucleation. Phys. Chem. Chem. Phys. 2010, 12, 786–811. [Google Scholar] [CrossRef] [PubMed]
- De Angelis, F.; Di Valentin, C.; Fantacci, S.; Vittadini, A.; Selloni, A. Theoretical Studies on Anatase and Less Common TiO2 Phases: Bulk, Surfaces, and Nanomaterials. Chem. Rev. 2014, 114, 9708–9753. [Google Scholar] [CrossRef] [PubMed]
- Carp, O.; Huisman, C.L.; Reller, A. Photoinduced reactivity of titanium dioxide. Prog. Solid State Chem. 2004, 32, 33–177. [Google Scholar] [CrossRef]
- Conesa, J.C. The Relevance of Dispersion Interactions for the Stability of Oxide Phases. J. Phys. Chem. C 2010, 114, 22718–22726. [Google Scholar] [CrossRef]
- Kavan, L.; Grätzel, M.; Gilbert, S.E.; Klemenz, C.; Scheel, H.J. Electrochemical and Photoelectrochemical Investigation of Single-Crystal Anatase. J. Am. Chem. Soc. 1996, 118, 6716–6723. [Google Scholar] [CrossRef]
- Selloni, A. Anatase shows its reactive side. Nature Mater. 2008, 7, 613–615. [Google Scholar] [CrossRef] [PubMed]
- De Angelis, F. Modeling Materials and Processes in Hybrid/Organic Photovoltaics: From Dye-Sensitized to Perovskite Solar Cells. Acc. Chem. Res. 2014, 47, 3349–3360. [Google Scholar] [CrossRef] [PubMed]
- Peng, B.; Yang, S.; Li, L.; Cheng, F.; Chen, J. A density functional theory and time-dependent density functional theory investigation on the anchor comparison of triarylamine-based dyes. J. Chem. Phys. 2010, 132, 034305–034309. [Google Scholar] [CrossRef] [PubMed]
- Zhang, J.; Li, H.B.; Sun, S.L.; Geng, Y.; Wu, Y.; Su, Z.M. Density functional theory characterization and design of high-performance diarylamine-fluorene dyes with different pi spacers for dye-sensitized solar cells. J. Mater. Chem. 2012, 22, 568. [Google Scholar] [CrossRef]
- Pastore, M.; De Angelis, F. Computational modelling of TiO2 surfaces sensitized by organic dyes with different anchoring groups: Adsorption modes, electronic structure and implication for electron injection/recombination. Phys. Chem. Chem. Phys. 2012, 14, 920–928. [Google Scholar] [CrossRef] [PubMed]
- Chen, J.; Bai, F.-Q.; Wang, J.; Hao, L.; Xie, Z.-F.; Pan, Q.-J.; Zhang, H.-X. Theoretical studies on spectroscopic properties of ruthenium sensitizers absorbed to TiO2 film surface with connection mode for DSSC. Dyes Pigm. 2012, 94, 459–468. [Google Scholar] [CrossRef]
- Wang, J.; Li, H.; Ma, N.N.; Yan, L.K.; Su, Z.M. Theoretical studies on organoimido-substituted hexamolybdates dyes for dye-sensitized solar cells (DSSC). Dyes Pigm. 2013, 99, 440. [Google Scholar] [CrossRef]
- Mendizabal, F.; Lopéz, A.; Arratia-Pérez, R.; Zapata-Torres, G. Interaction of LD14 and TiO2 in dye-sensitized solar-cells (DSSC): A density functional theory study. Comput. Theor. Chem. 2015, 1070, 117–125. [Google Scholar] [CrossRef]
- Manzoor, T.; Asmi, S.; Niaz, S.; Pandith, A.H. Computational studies on optoelectronic and charge transfer properties of some perylene-based donor-p-acceptor systems for dye sensitized solar cell applications. Int. J. Quantum Chem. 2017, 117, e25332. [Google Scholar] [CrossRef]
- Sanchez-de-Armas, R.; Oviedo, J.; San Miguel, M.A.; Ordejon, P.; Pruneda, M.; Sanz, J.F. Real-Time TD-DFT Simulations in Dye Sensitized Solar Cells: The Electronic Absorption Spectrum of Alizarin Supported on TiO2 Nanoclusters. J. Chem. Theory Comput. 2010, 6, 2856. [Google Scholar] [CrossRef] [PubMed]
- Sanchez-de-Armas, R.; San-Miguel, M.A.; Oviedo, J.; Marquez, A.; Sanz, J.F. Direct vs Indirect Mechanisms for Electron Injection in Dye-Sensitized Solar Cells. Phys. Chem. Chem. Phys. 2012, 14, 225–233. [Google Scholar] [CrossRef] [PubMed]
- Sanchez-de-Armas, R.; San-Miguel, M.A.; Oviedo, J.; Marquez, A.; Sanz, J.F. Electronic structure and optical spectra of catechol on TiO2 nanoparticles from real time TD-DFT simulations. Phys. Chem. Chem. Phys. 2011, 13, 1506–1514. [Google Scholar] [CrossRef] [PubMed]
- Persson, P.; Bergstrom, R.; Lunell, S. Quantum Chemical Study of Photoinjection Processes in Dye-Sensitized TiO2 Nanoparticles. J. Phys. Chem. B 2000, 104, 10348–10351. [Google Scholar] [CrossRef]
- Persson, P.; Gebhardt, J.C.M.; Lunell, S. The Smallest Possible Nanocrystals of Semiionic Oxides. J. Phys. Chem. B 2003, 107, 3336–3339. [Google Scholar] [CrossRef]
- Persson, P.; Lundqvist, M.J. Calculated Structural and Electronic Interactions of the Ruthenium Dye N3 with a Titanium Dioxide Nanocrystal. J. Phys. Chem. B 2005, 109, 11918–11924. [Google Scholar] [CrossRef] [PubMed]
- Lundqvist, M.J.; Nilsing, M.; Persson, P.; Lunell, S. DFT Study of Bare and Dye-Sensitized TiO2 Clusters and Nanocrystals. Int. J. Quantum Chem. 2006, 106, 3214–3234. [Google Scholar] [CrossRef]
- Lundqvist, M.J.; Nilsing, M.; Lunell, S.; Akermark, B.; Persson, P. Spacer and Anchor Effects on the Electronic Coupling in Ruthenium-bis-Terpyridine Dye-Sensitized TiO2 Nanocrystals Studied by DFT. J. Phys. Chem. B 2006, 110, 20513–20525. [Google Scholar] [CrossRef] [PubMed]
- Fredin, L.A.; Wärnmark, K.; Sundström, V.; Persson, P. Molecular and Interfacial Calculations of Iron(II) Light Harvesters. ChemSusChem 2016, 9, 667–675. [Google Scholar] [CrossRef] [PubMed]
- Gałynska, M.; Persson, P. Emerging Polymorphism in Nanostructured TiO2: Quantum Chemical Comparison of Anatase, Rutile, and Brookite Clusters. Int. J. Quantum Chem. 2013, 113, 2611–2620. [Google Scholar] [CrossRef]
- Homann, T.; Bredow, T.; Jug, K. Adsorption of small molecules on the anatase (100) surface. Surf. Sci. 2004, 555, 135–144. [Google Scholar] [CrossRef]
- De Angelis, F.; Tilocca, A.; Selloni, A. Time-Dependent DFT Study of [Fe(CN)6]4- Sensitization of TiO2 Nanoparticles. J. Am. Chem. Soc. 2004, 126, 15024–15025. [Google Scholar] [CrossRef] [PubMed]
- Dualeh, A.; De Angelis, F.; Fantacci, S.; Moehl, T.; Yi, C.; Kessler, F.; Baranoff, E.; Nazeeruddin, M.K.; Gräzel, M. Influence of Donor Groups of Organic D-π-A Dyes on Open-Circuit Voltage in Solid-State Dye-Sensitized Solar Cells. J. Phys. Chem. C 2012, 116, 1572–1578. [Google Scholar] [CrossRef]
- Ronca, E.; Pastore, M.; Belpassi, L.; Tarantelli, F.; De Angelis, F. Influence of the dye molecular structure on the TiO2 conduction band in dye-sensitized solar cells: Disentangling charge transfer and electrostatic effects. Energy Environ. Sci. 2013, 6, 183–193. [Google Scholar] [CrossRef]
- De Angelis, F.; Fantacci, S.; Mosconi, E.; Nazeeruddin, M.K.; Grätzel, M. First-Principles Modeling of the Adsorption Geometry and Electronic Structure of Ru(II) Dyes on Extended TiO2 Substrates for Dye-Sensitized Solar Cell Applications. J. Phys. Chem. C 2010, 114, 6054–6061. [Google Scholar] [CrossRef]
- De Angelis, F.; Fantacci, S.; Mosconi, E.; Nazeeruddin, M.K.; Grätzel, M. Absorption Spectra and Excited State Energy Levels of the N719 Dye on TiO2 in Dye-Sensitized Solar Cell Models. J. Phys. Chem. C 2011, 115, 8825–8831. [Google Scholar] [CrossRef]
- Lasser, L.; Ronca, E.; Pastore, M.; De Angelis, F.; Cornil, J.; Lazzaroni, R.; Beljonne, D. Energy Level Alignment at Titanium Oxide−Dye Interfaces: Implications for Electron Injection and Light Harvesting. J. Phys. Chem. C 2015, 119, 9899–9909. [Google Scholar] [CrossRef]
- Pastore, M.; De Angelis, F. Intermolecular Interactions in Dye-Sensitized Solar Cells: A Computational Modeling Perspective. J. Phys. Chem. Lett. 2013, 4, 956–974. [Google Scholar] [CrossRef] [PubMed]
- Li, Y.-F.; Liu, Z.-P. Particle Size, Shape and Activity for Photocatalysis on Titania Anatase Nanoparticles in Aqueous Surroundings. J. Am. Chem. Soc. 2011, 133, 15743–15752. [Google Scholar] [CrossRef] [PubMed]
- Nunzi, F.; Mosconi, E.; Storchi, L.; Ronca, E.; Selloni, A.; Grätzel, M.; De Angelis, F. Inherent electronic trap states in TiO2 nanocrystals: Effect of saturation and sintering. Energy Environ. Sci. 2013, 6, 1221–1229. [Google Scholar] [CrossRef]
- Grätzel, M. Photoelectrochemical cells. Nature 2001, 414, 338–344. [Google Scholar] [CrossRef] [PubMed]
- Hagfeldt, A.; Boschloo, G.; Sun, L.; Kloo, L.; Pettersson, H. Dye-sensitized solar cells. Chem. Rev. 2010, 110, 6595–6663. [Google Scholar] [CrossRef] [PubMed]
- Oprea, C.I.; Panait, P.; Cimpoesu, F.; Ferbinteanu, M.; Gîrţu, M.A. Density Functional Theory (DFT) Study of Coumarin-based Dyes Adsorbed on TiO2 Nanoclusters—Applications to Dye-Sensitized Solar Cells. Materials 2013, 6, 2372–2392. [Google Scholar] [CrossRef] [PubMed]
- Oprea, C.I.; Panait, P.; Lungu, J.; Stamate, D.; Dumbravă, A.; Cimpoesu, F.; Gîrţu, M.A. DFT study of binding and electron transfer from a metal-free dye with carboxyl, hydroxyl and sulfonic anchors to a titanium dioxide nanocluster. Int. J. Photoenergy 2013, 2013, 893850. [Google Scholar] [CrossRef]
- Oprea, C.I.; Panait, P.; AbdelAal, R.M.; Gîrțu, M.A. DFT Calculations of Structure and Optical Properties in Wide Band-Gap Semiconductor Clusters for Dye-Sensitized Solar Cells. In Proceedings of the IEEE International Semiconductor Conference (CAS), Sinaia, Romania, 9–11 October 2018; pp. 17–26. [Google Scholar]
- Oprea, C.I.; Panait, P.; Gîrțu, M.A. DFT study of binding and electron transfer from colorless aromatic pollutants to a TiO2 nanocluster: Application to photocatalytic degradation under visible light irradiation. Beilstein J. Nanotechnol. 2014, 5, 1016–1030. [Google Scholar]
- Oprea, C.I.; Petcu, L.C.; Gîrțu, M.A. DFT Study of Binding and Electron Transfer from Penicillin to a TiO2 Nanocluster: Applications to Photocatalytic Degradation. In Proceedings of the IEEE E-Health and Bioengineering Conference (EHB), Iași, Romania, 19–21 November 2015; pp. 1–4. [Google Scholar]
- Panait, P.; Oprea, C.I.; Essam, Z.M.; Lungu, J.; Georgescu, A.; Dumbravă, A.; AbdelAal, R.M.; Gîrțu, M.A. Photoexcitation processes in dye-sensitized solar cells based on oligomethine cyanine dyes—A combined experimental and theoretical study. J. Photochem. Photobiol. A-Chem. 2019. under review. [Google Scholar]
- Horn, M.; Schwerdtfeger, C.F.; Meagher, E.P. Refinement of the structure of anatase at several temperatures. Z. Krist. 1972, 136, 273–281. [Google Scholar] [CrossRef]
- Qu, Z.-W.; Kroes, G.-J. Theoretical Study of Stable, Defect-Free (TiO2)n Nanoparticles with n = 10–16. J. Phys. Chem. C 2007, 111, 16808–16817. [Google Scholar] [CrossRef]
- Iacomino, A.; Cantele, G.; Ninno, D.; Marri, I.; Ossicini, S. Structural, electronic, and surface properties of anatase TiO2 nanocrystals from first principles. Phys. Rev. B 2008, 78, 075405. [Google Scholar] [CrossRef]
- Becke, A.D. Density-functional exchange-energy approximation with correct asymptotic behavior. Phys. Rev. A 1988, 38, 3098–3100. [Google Scholar] [CrossRef]
- Lee, C.; Yang, W.; Parr, R.G. Development of the colle-salvetti correlation-energy formula into a functional of the electron density. Phys. Rev. B 1988, 37, 785–789. [Google Scholar] [CrossRef]
- Becke, A.D. Density-functional thermo-chemistry. III. The role of exact exchange. J. Chem. Phys. 1993, 98, 5648–5652. [Google Scholar] [CrossRef]
- Pietro, W.J.; Francl, M.M.; Hehre, W.J.; Defrees, D.J.; Pople, J.A.; Binkley, J.S. Self-Consistent Molecular Orbital Methods. 24. Supplemented small split-valence basis-sets for 2nd-row elements. J. Am. Chem. Soc. 1982, 104, 5039–5048. [Google Scholar] [CrossRef]
- Dobbs, K.D.; Hehre, W.J. Molecular-orbital theory of the properties of inorganic and organometallic compounds. 5. Extended basis-sets for 1st-row transition-metals. J. Comp. Chem. 1987, 8, 861–879. [Google Scholar] [CrossRef]
- Hay, P.J.; Wadt, W.R. Ab initio effective core potentials for molecular calculations. Potentials for K to Au including the outermost core orbitals. J. Chem. Phys. 1985, 82, 299–311. [Google Scholar] [CrossRef]
- Barone, V.; Cossi, M. Quantum calculation of molecular energies and energy gradients in solution by a conductor solvent model. J. Phys. Chem. A 1998, 102, 1995–2001. [Google Scholar] [CrossRef]
- Tomasi, J.; Mennucci, B.; Cammi, R. Quantum mechanical continuum solvation models. Chem. Rev. 2005, 105, 2999–3093. [Google Scholar] [CrossRef] [PubMed]
- Casida, M.E.; Jamorski, C.; Casida, K.C.; Salahub, D.R. Molecular excitation energies to high-lying bound states from time-dependent density-functional response theory: Characterization and correlation of the time dependent local density approximation ionization threshold. J. Chem. Phys. 1998, 108, 4439–4449. [Google Scholar] [CrossRef]
- Frisch, M.J.; Trucks, G.W.; Schlegel, H.B.; Scuseria, G.E.; Robb, M.A.; Cheeseman, J.R.; Scalmani, G.; Barone, V.; Petersson, G.A.; Nakatsuji, H.; et al. GAUSSIAN 09, Revision A.02. Available online: http://gaussian.com/g09citation/ (accessed on 22 June 2018).
- O’Boyle, N.M.; Tenderholt, A.L.; Langner, K.M. Cclib: A library for package-independent computational chemistry algorithms. J. Comp. Chem. 2008, 29, 839–845. [Google Scholar]
- Lazzeri, M.; Vittadini, A.; Selloni, A. Structure and energetics of stoichiometric TiO2 anatase surfaces. Phys. Rev. B 2011, 63, 155409. [Google Scholar] [CrossRef]
- Scanlon, D.O.; Dunnill, C.W.; Buckeridge, J.; Shevlin, S.A.; Logsdail, A.J.; Woodley, S.M.; Catlow, C.R.A.; Powell, J.M.; Palgrave, R.G.; Parkin, I.P.; et al. Band alignment of rutile and anatase TiO2. Nat. Mater. 2013, 12, 798–801. [Google Scholar] [CrossRef] [PubMed]
- Zhang, Y.F.; Lin, W.; Li, Y.; Ding, K.N.; Li, J.Q. A Theoretical Study on the Electronic Structures of TiO2: Effect of Hartree−Fock Exchange. J. Phys. Chem. B 2005, 109, 19270–19277. [Google Scholar] [CrossRef] [PubMed]
- Tang, H.; Lévy, F.; Berger, H.; Schmid, P.E. Urbach tail of anatase TiO2. Phys. Rev. B 1995, 52, 7771–7774. [Google Scholar] [CrossRef]
- Hara, K.; Sato, T.; Katoh, R.; Furube, A.; Ohga, Y.; Shinpo, A.; Suga, S.; Sayama, K.; Sugihara, H.; Arakawa, H. Molecular design of coumarin dyes for efficient dye-sensitized solar cells. J. Phys. Chem. B 2003, 107, 597–606. [Google Scholar] [CrossRef]
- Mosconi, E.; Selloni, A.; De Angelis, F. Solvent Effects on the Adsorption Geometry and Electronic Structure of Dye-Sensitized TiO2: A First-Principles Investigation. J. Phys. Chem. C 2012, 116, 5932–5940. [Google Scholar] [CrossRef]
- Francl, M.M.; Pietro, W.J.; Hehre, W.J.; Binkley, J.S.; DeFrees, D.J.; Pople, J.A.; Gordon, M.S. Self-Consistent Molecular Orbital Methods. 23. A polarization-type basis set for 2nd-row elements. J. Chem. Phys. 1982, 77, 3654–3665. [Google Scholar] [CrossRef]
- Schottel, B.L.; Chifotides, H.T.; Dunbar, K.R. Anion-π interactions. Chem. Soc. Rev. 2008, 37, 68–83. [Google Scholar] [CrossRef] [PubMed]
- Ko, K.C.; Lee, J.Y.; Illas, F. Modeling realistic titania nanoparticles. In Frontiers of Nanoscience, Computational Modelling of Nanoparticles; Bromley, S.T., Woodley, S.M., Eds.; Elsevier: Amsterdam, The Netherlands, 2018; Volume 12, pp. 205–238. [Google Scholar]
- Chen, M.; Dixon, D.A. Modeling the formation of TiO2 ultra-small nanoparticles. Nanoscale 2017, 9, 7143–7162. [Google Scholar] [CrossRef] [PubMed]
- Vorontsov, A.V. Effect of the Structure of Small Anatase Nanoparticles on the Localization of Photogenerated Charge Carriers. Kinet. Catal. 2017, 58, 688–694. [Google Scholar] [CrossRef]
- Vorontsov, A.V.; Smirniotis, P.G. Size and surface groups effects in decahedral anatase nanoparticles for photocatalytic applications. J. Photochem. Photobiol. Chem. 2018, 363, 51–60. [Google Scholar] [CrossRef]
- Xu, Z.; Li, Y.; Zhang, W.; Yuan, S.; Hao, L.; Xu, T.; Lu, X. DFT/TD-DFT study of novel T shaped phenothiazine-based organic dyes for dye-sensitized solar cells applications. Spectrochim. Acta. A Mol. Biomol. Spectrosc. 2019, 212, 272–280. [Google Scholar] [CrossRef] [PubMed]
- Lu, T.-F.; Li, W.; Chen, J.; Tang, J.; Bai, F.-Q.; Zhang, H.-X. Promising pyridinium ylide based anchors towards high-efficiency dyes for dye-sensitized solar cells applications: Insights from theoretical investigations. Electrochim. Acta 2018, 283, 1798–1805. [Google Scholar] [CrossRef]
- Feng, S.; Sun, Z.-Z.; Li, Q. How to screen a promising anchoring group from heterocyclic components in dye sensitized solar cell:A theoretical investigation. Electrochim. Acta 2019, 296, 545–554. [Google Scholar] [CrossRef]
- Zhu, H.-C.; Zhang, J.; Wang, Y.-L. Adsorption orientation effects of porphyrin dyes on the performance of DSSC: Comparison of benzoic acid and tropolone anchoring groups binding onto the TiO2 anatase (101) surface. Appl. Surf. Sci. 2018, 433, 1137–1147. [Google Scholar] [CrossRef]
- Zhu, H.-C.; Li, C.-F.; Fu, Z.-H.; Wei, S.-S.; Zhu, X.-F.; Zhang, J. Increasing the open-circuit voltage and adsorption stability of squaraine dye binding onto the TiO2 anatase (1 0 1) surface via heterocyclic anchoring groups used for DSSC. Appl. Surf. Sci. 2018, 455, 1095–1105. [Google Scholar] [CrossRef]
- Zhang, J.; Zhu, H.-C.; Zhong, R.-L.; Wang, L.; Su, Z.-M. Promising heterocyclic anchoring groups with superior adsorption stability and improved IPCE for high-efficiency noncarboxyl dye sensitized solar cells: A theoretical study. Org. Electron. 2018, 54, 104–113. [Google Scholar] [CrossRef]


| Parameter | Ti14O30H4 | Ti24O50H4 | Ti34O70H4 | Ti44O90H4 | Ti54O110H4 | TiO2 |
|---|---|---|---|---|---|---|
| r(Ti–O) | 1.834 | 1.876 | 1.889 | 1.896 | 1.901 | 1.950 |
| σr(Ti–O) | 0.074 | 0.100 | 0.100 | 0.103 | 0.105 | 0.022 |
| Width (Ti…Ti) | 12.45 | 12.18 | 11.87 | 11.94 | 12.00 | 12.04 |
| Width (O…O) | - | 13.28 | 13.36 | 13.28 | 13.29 | 12.83 |
| Length (Ti…Ti) | 3.55 | 7.20 | 10.67 | 14.47 | 18.05 | |
| Length (O…O) | 4.94 | 8.16 | 12.05 | 15.63 | 18.76 | |
| Length bulk (Ti…Ti) | 3.78 | 7.59 | 11.37 | 15.14 | 18.92 |
| Parameter | Ti14O30H4 | Ti24O50H4 | Ti34O70H4 | Ti44O90H4 | Ti54O110H4 | TiO2 (Bulk) |
|---|---|---|---|---|---|---|
| Ti, 6x | 0 | 2 | 4 | 6 | 8 | all Ti atoms |
| Ti, 5x | 6 | 14 | 22 | 30 | 38 | 0 |
| Ti, 4x | 8 | 8 | 8 | 8 | 8 | 0 |
| O, 3x | 6 | 18 | 30 | 42 | 54 | all O atoms |
| O, 2x | 20 | 28 | 36 | 44 | 52 | 0 |
| O, 1x | 4 | 4 | 4 | 4 | 4 | 0 |
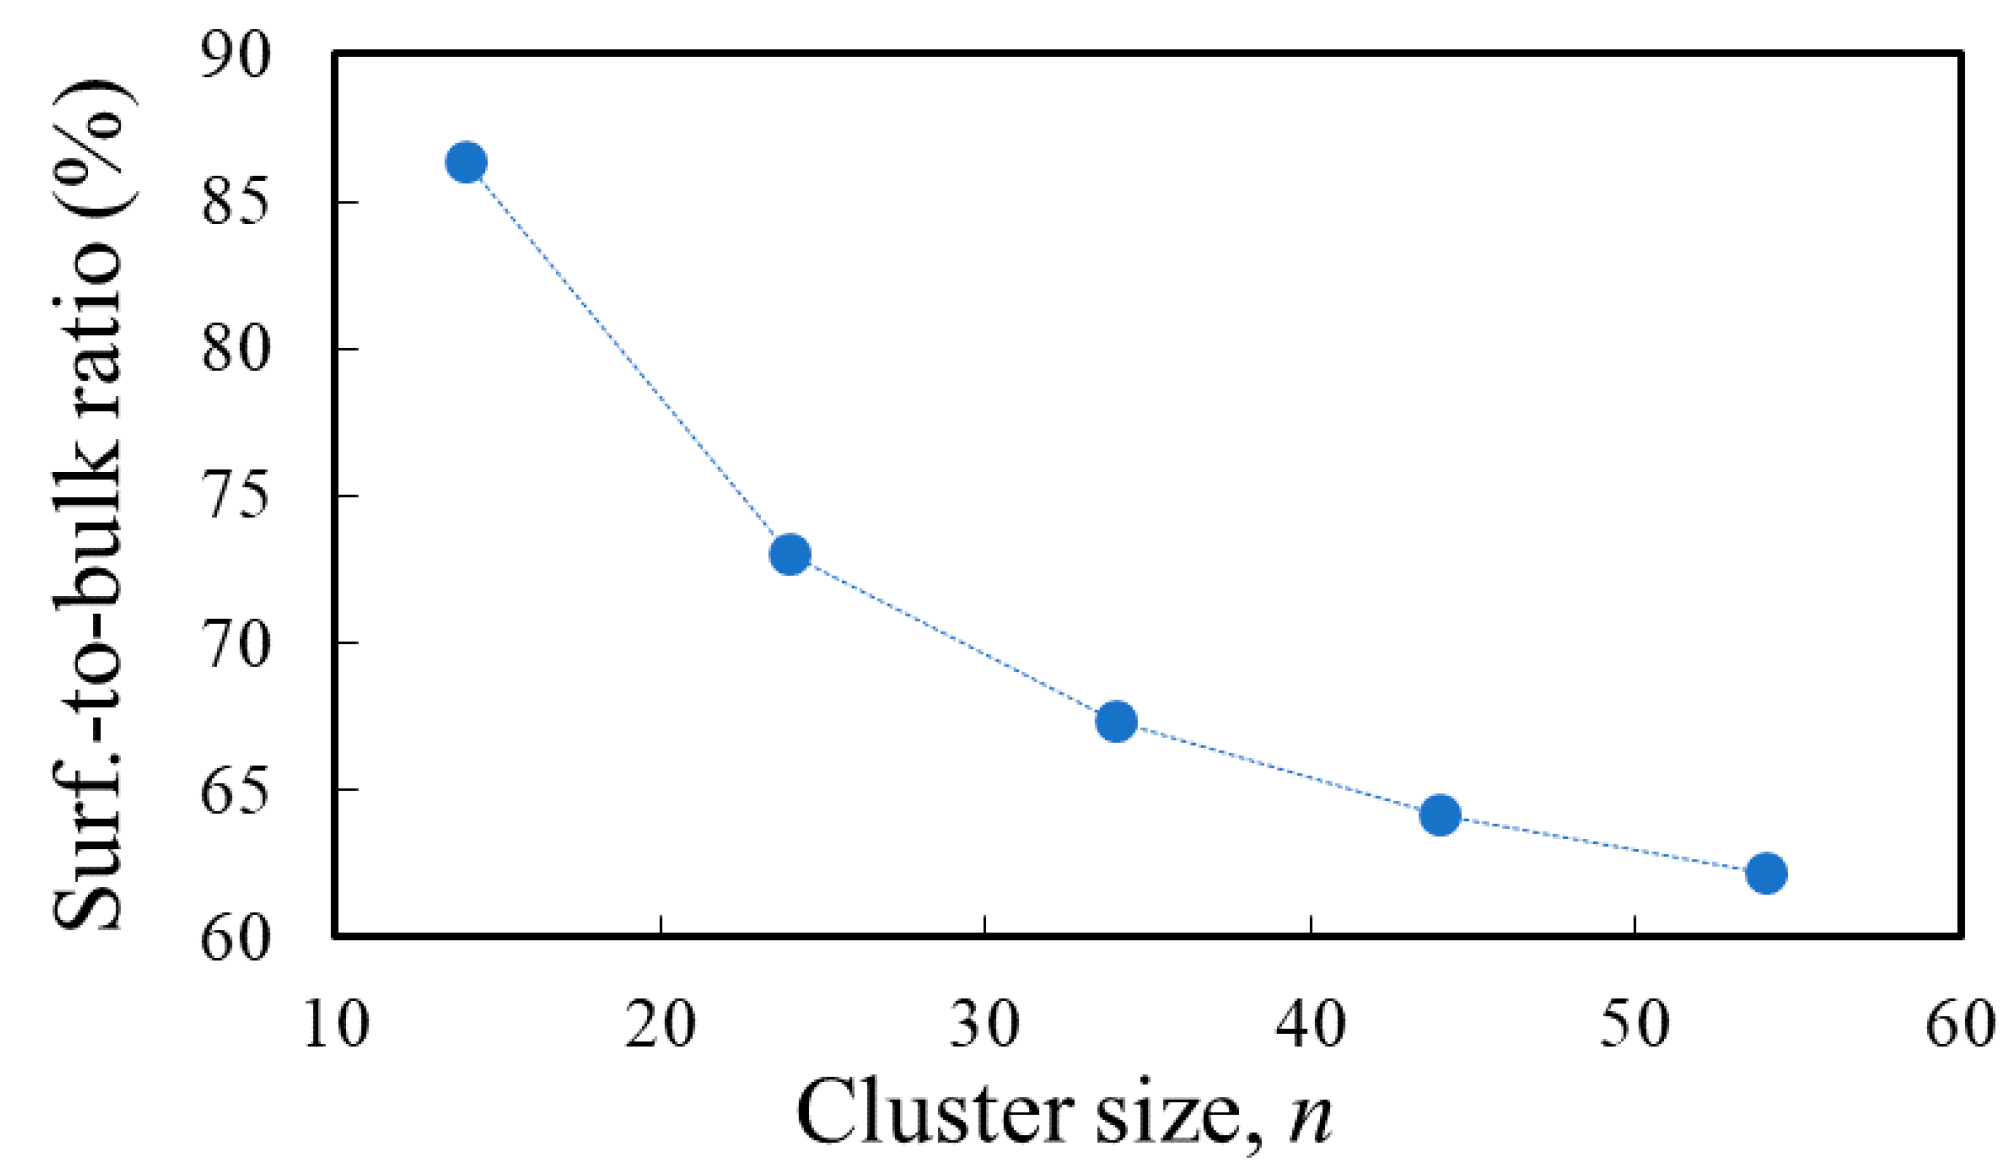
| s/b (%) | 86.4 | 73.0 | 67.3 | 64.2 | 62.2 | 0 |
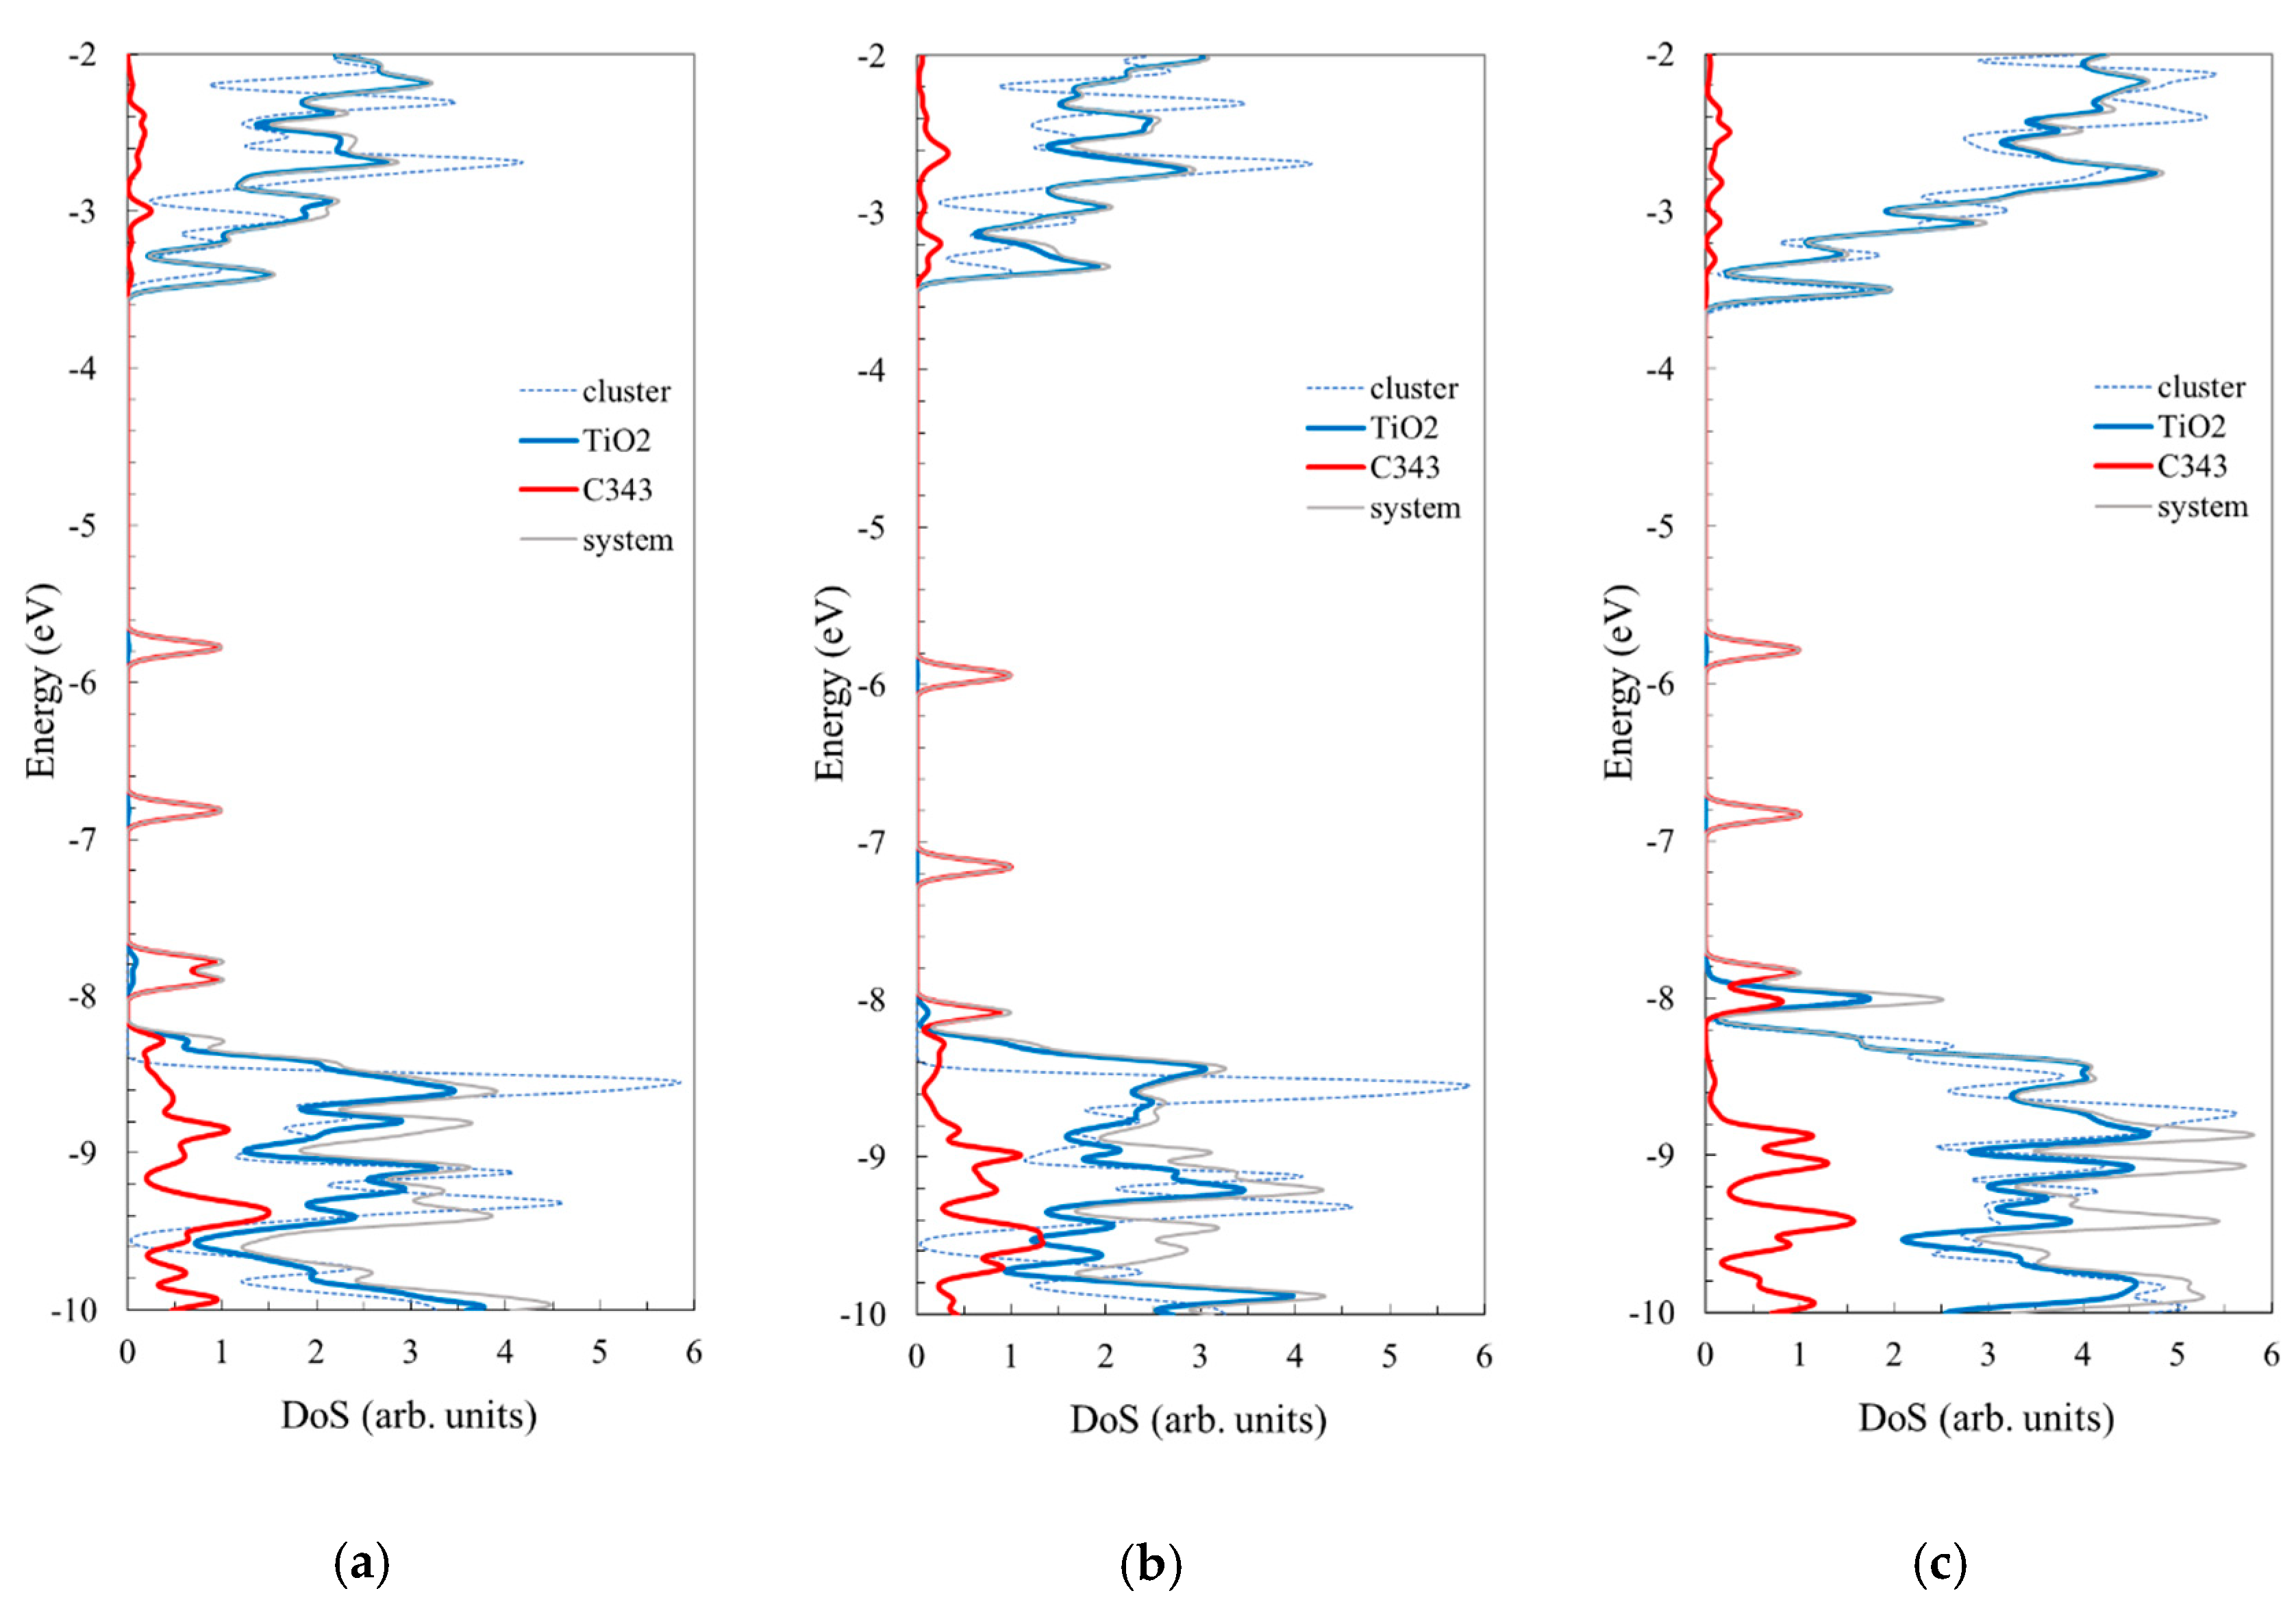
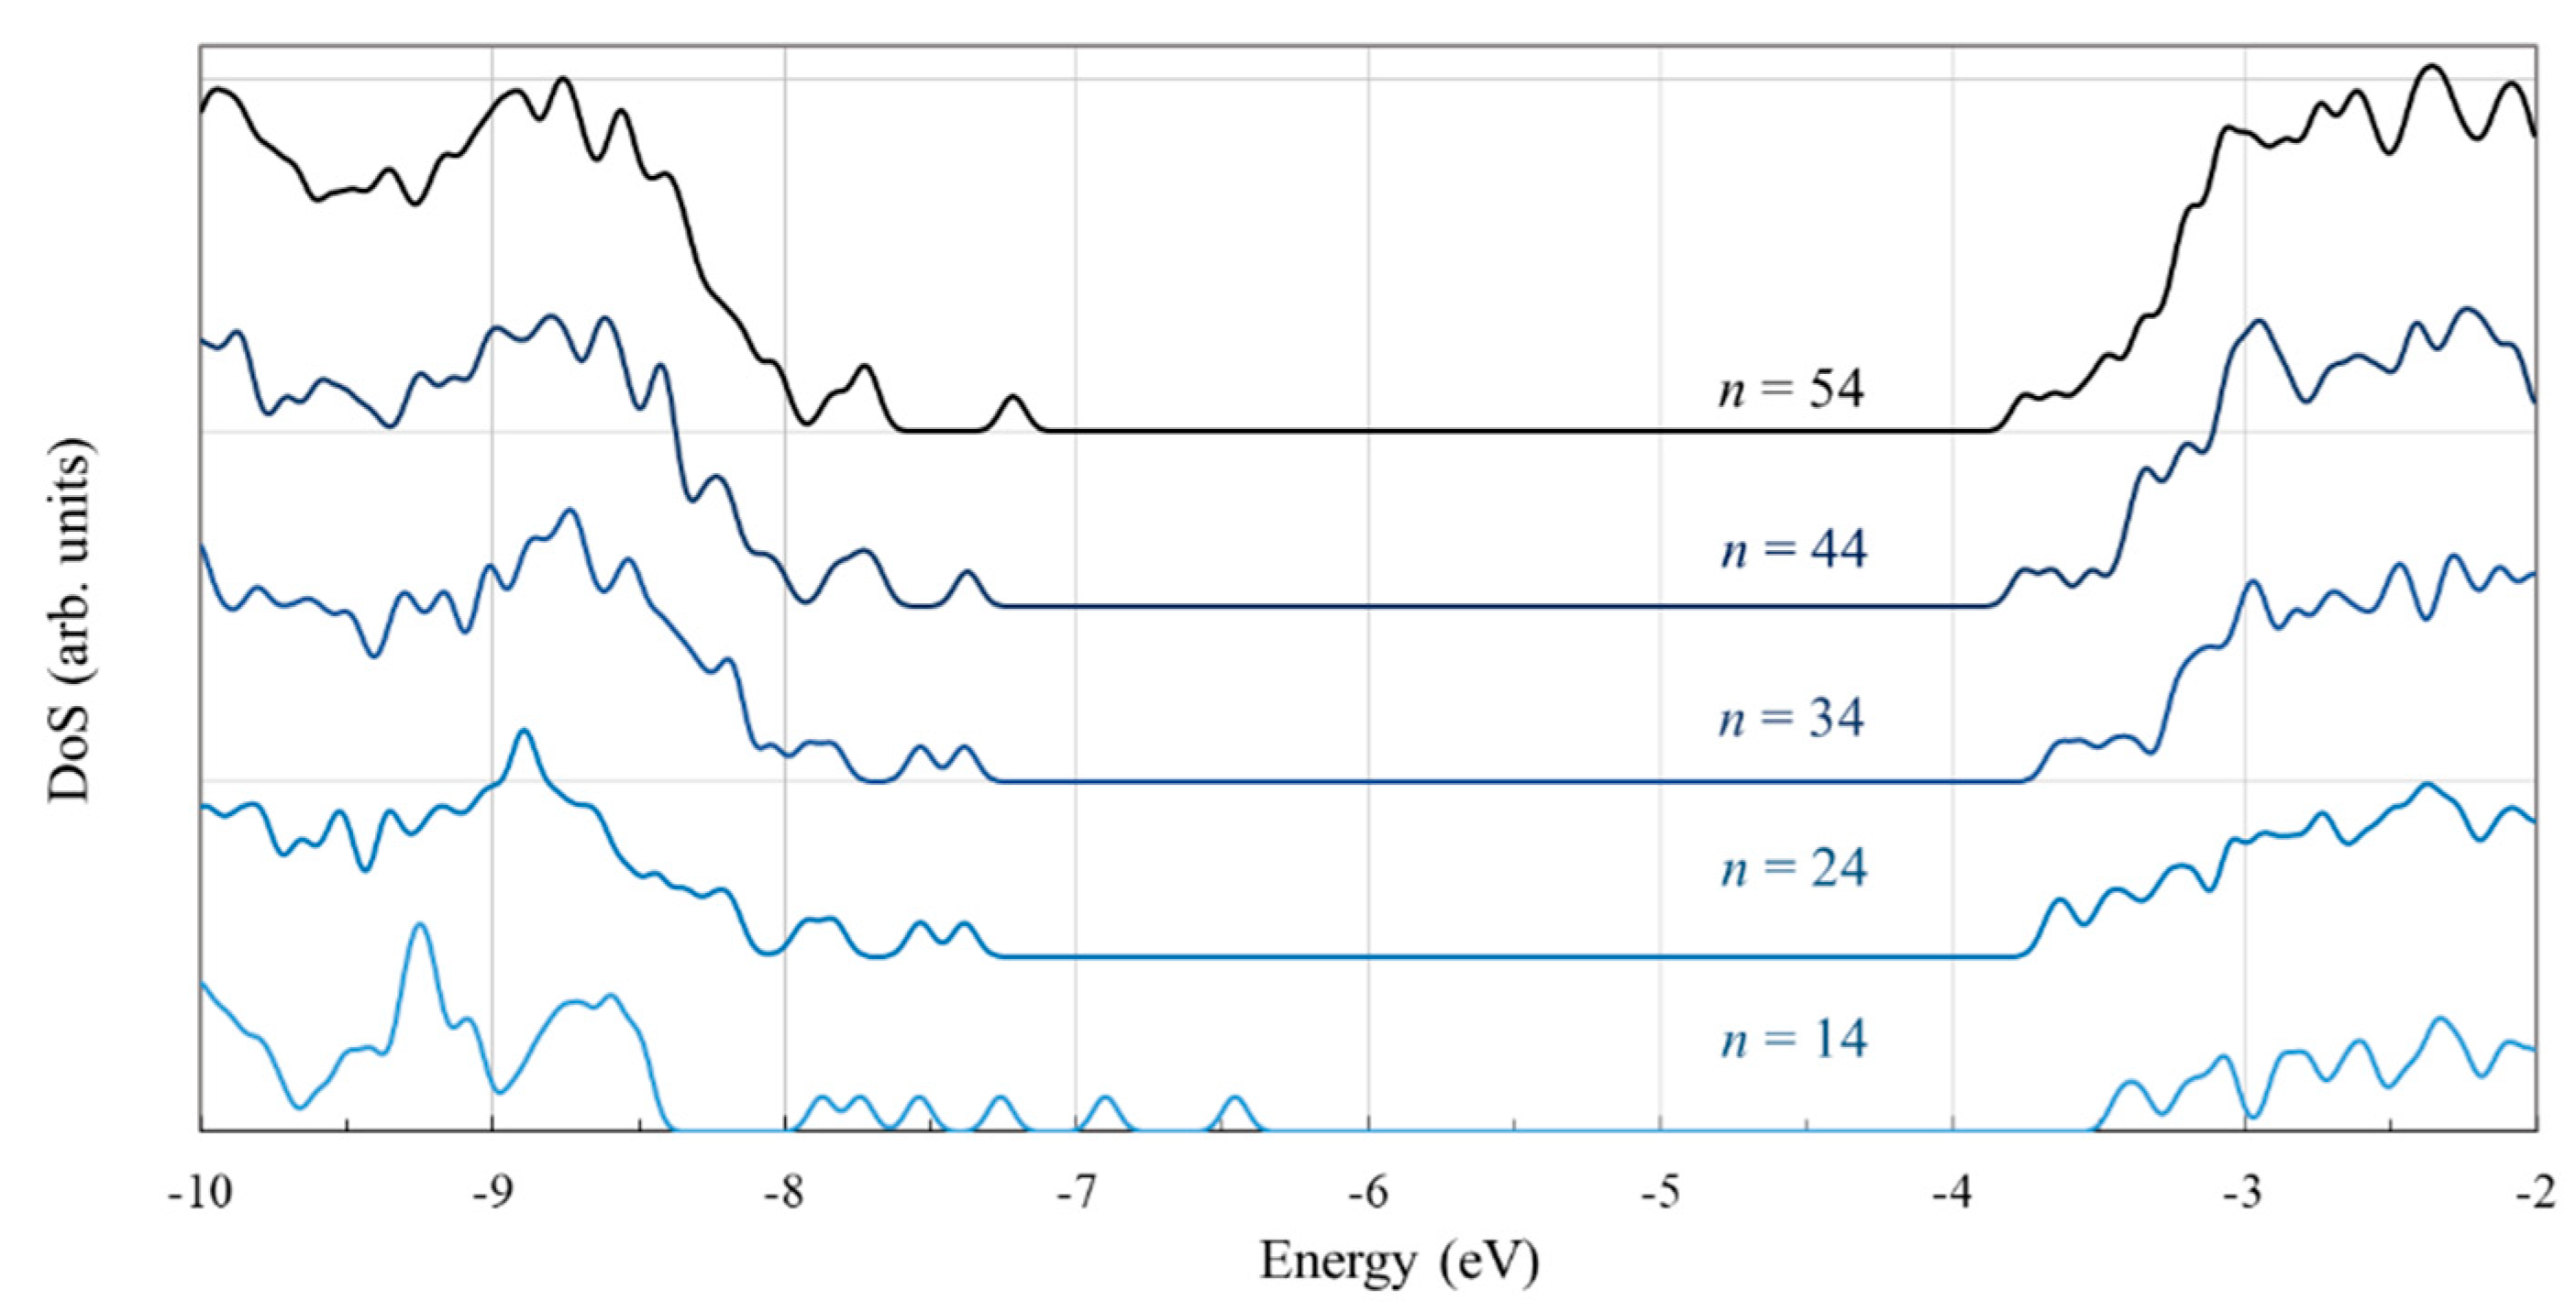
| Cluster | EVB HOMO | ECB LUMO | ECB − EVB HL Gap | E0-0 Optical Gap | CBOP EVB + E0-0 |
|---|---|---|---|---|---|
| Ti14O30H4 | −8.52 | −3.37 | 5.15 | 4.23 | −4.29 |
| Ti24O50H4 | −7.97 | −3.53 | 4.44 | 3.66 | −4.31 |
| Ti34O70H4 | −8.21 | −3.70 | 4.52 | 3.81 | −4.41 |
| Ti44O90H4 | −8.17 | −3.77 | 4.40 | 3.75 | −4.42 |
| Ti54O110H4 | −8.17 | −3.79 | 4.38 | 3.75 | −4.42 |
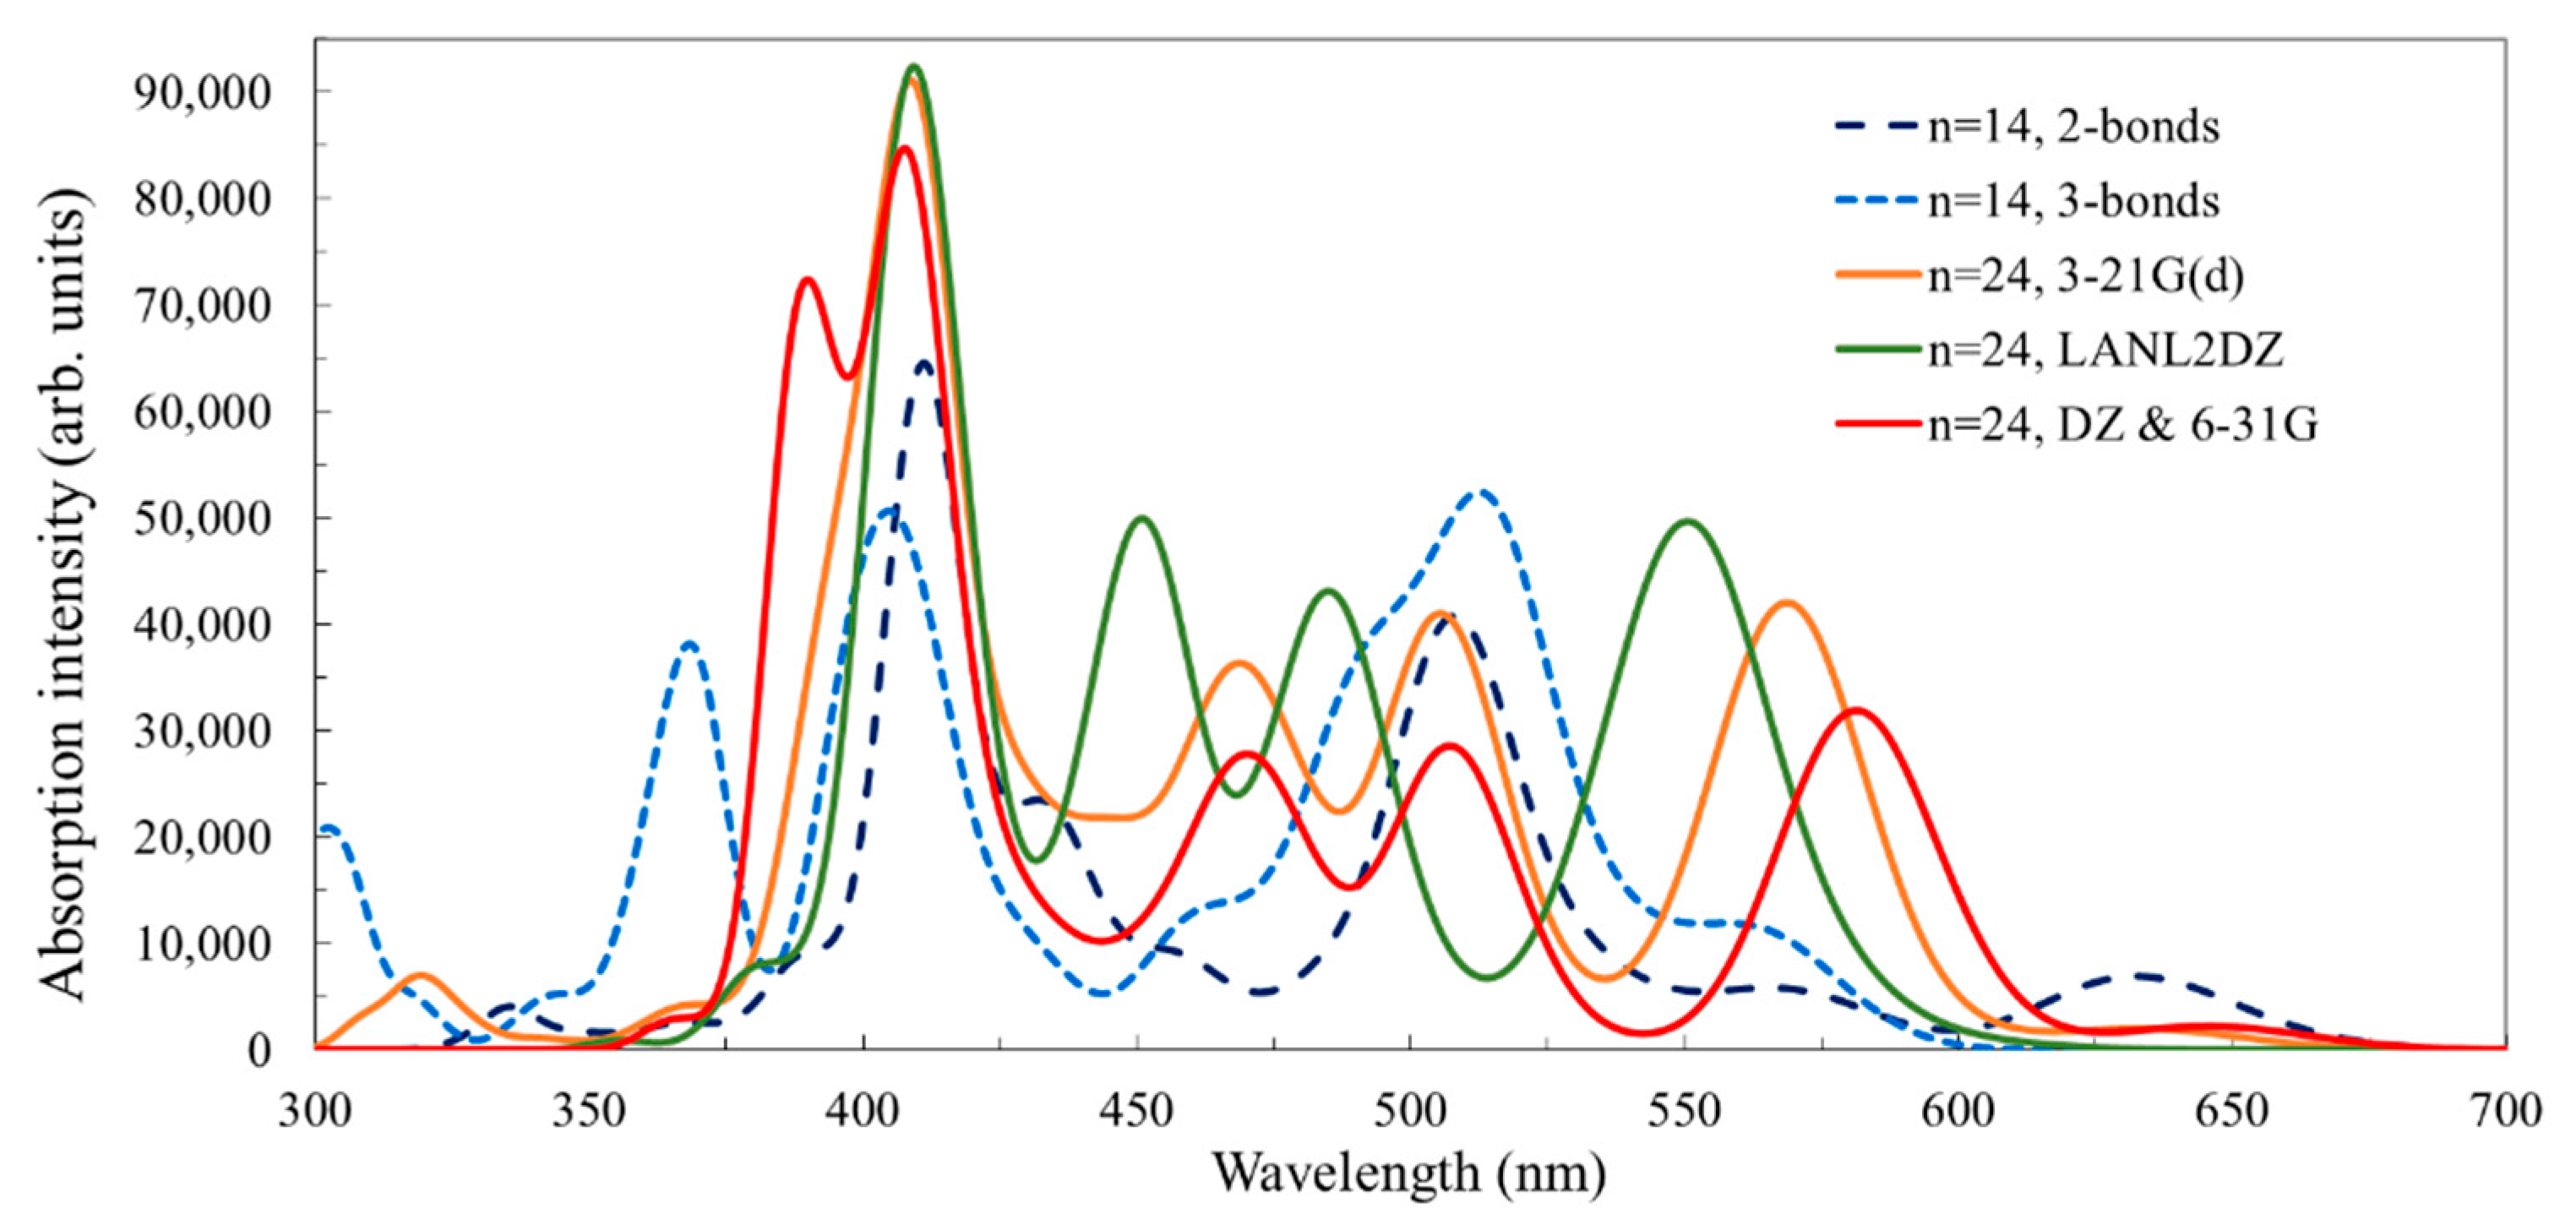
| Parameter | C343 on Ti14O30H4 (Two Bonds) | C343 on Ti14O30H4 (Three Bonds) | C343 on Ti24O50H4 | ||
|---|---|---|---|---|---|
| 3-21G(d) | LANL2DZ | DZ&6-31G † | |||
| r(Ti–O) | 1.852 | 1.880 | 1.887 | 1.891 | 1.891 |
| σr(Ti–O) | 0.090 | 0.119 | 0.108 | 0.121 | 0.116 |
| Width (Ti…Ti) | 12.41 | 12.07 | 11.98 | 12.44 | 12.23 |
| Width (O…O) | - | - | 13.13 | 13.41 | 13.49 |
| Length (Ti…Ti) | 3.48 | 3.75 | 7.25 | 7.26 | 7.30 |
| Length (O…O) | 5.09 | 5.64 | 8.28 | 8.36 | 8.35 |
| r(O1–Ti) | 2.128 | 2.068 | 1.972 | 1.951 | 1.956 |
| r(O2–Ti) | 1.976 | 2.039 | 1.999 | 2.053 | 2.058 |
| r(O3–Ti) | - | 2.096 | - | - | - |
| <(O–C–C–C) | 2.0 | 31.8 | −4.3 | 0.2 | −1.3 |
| <(C343;3Ti) | 8.3 | 52.2 | 81.7 | 88.8 | 85.8 |
| Method | C343-Ti14O30H4, Two-Bonds | C343-Ti14O30H4, Three-Bonds | C343-Ti24O50H4 |
|---|---|---|---|
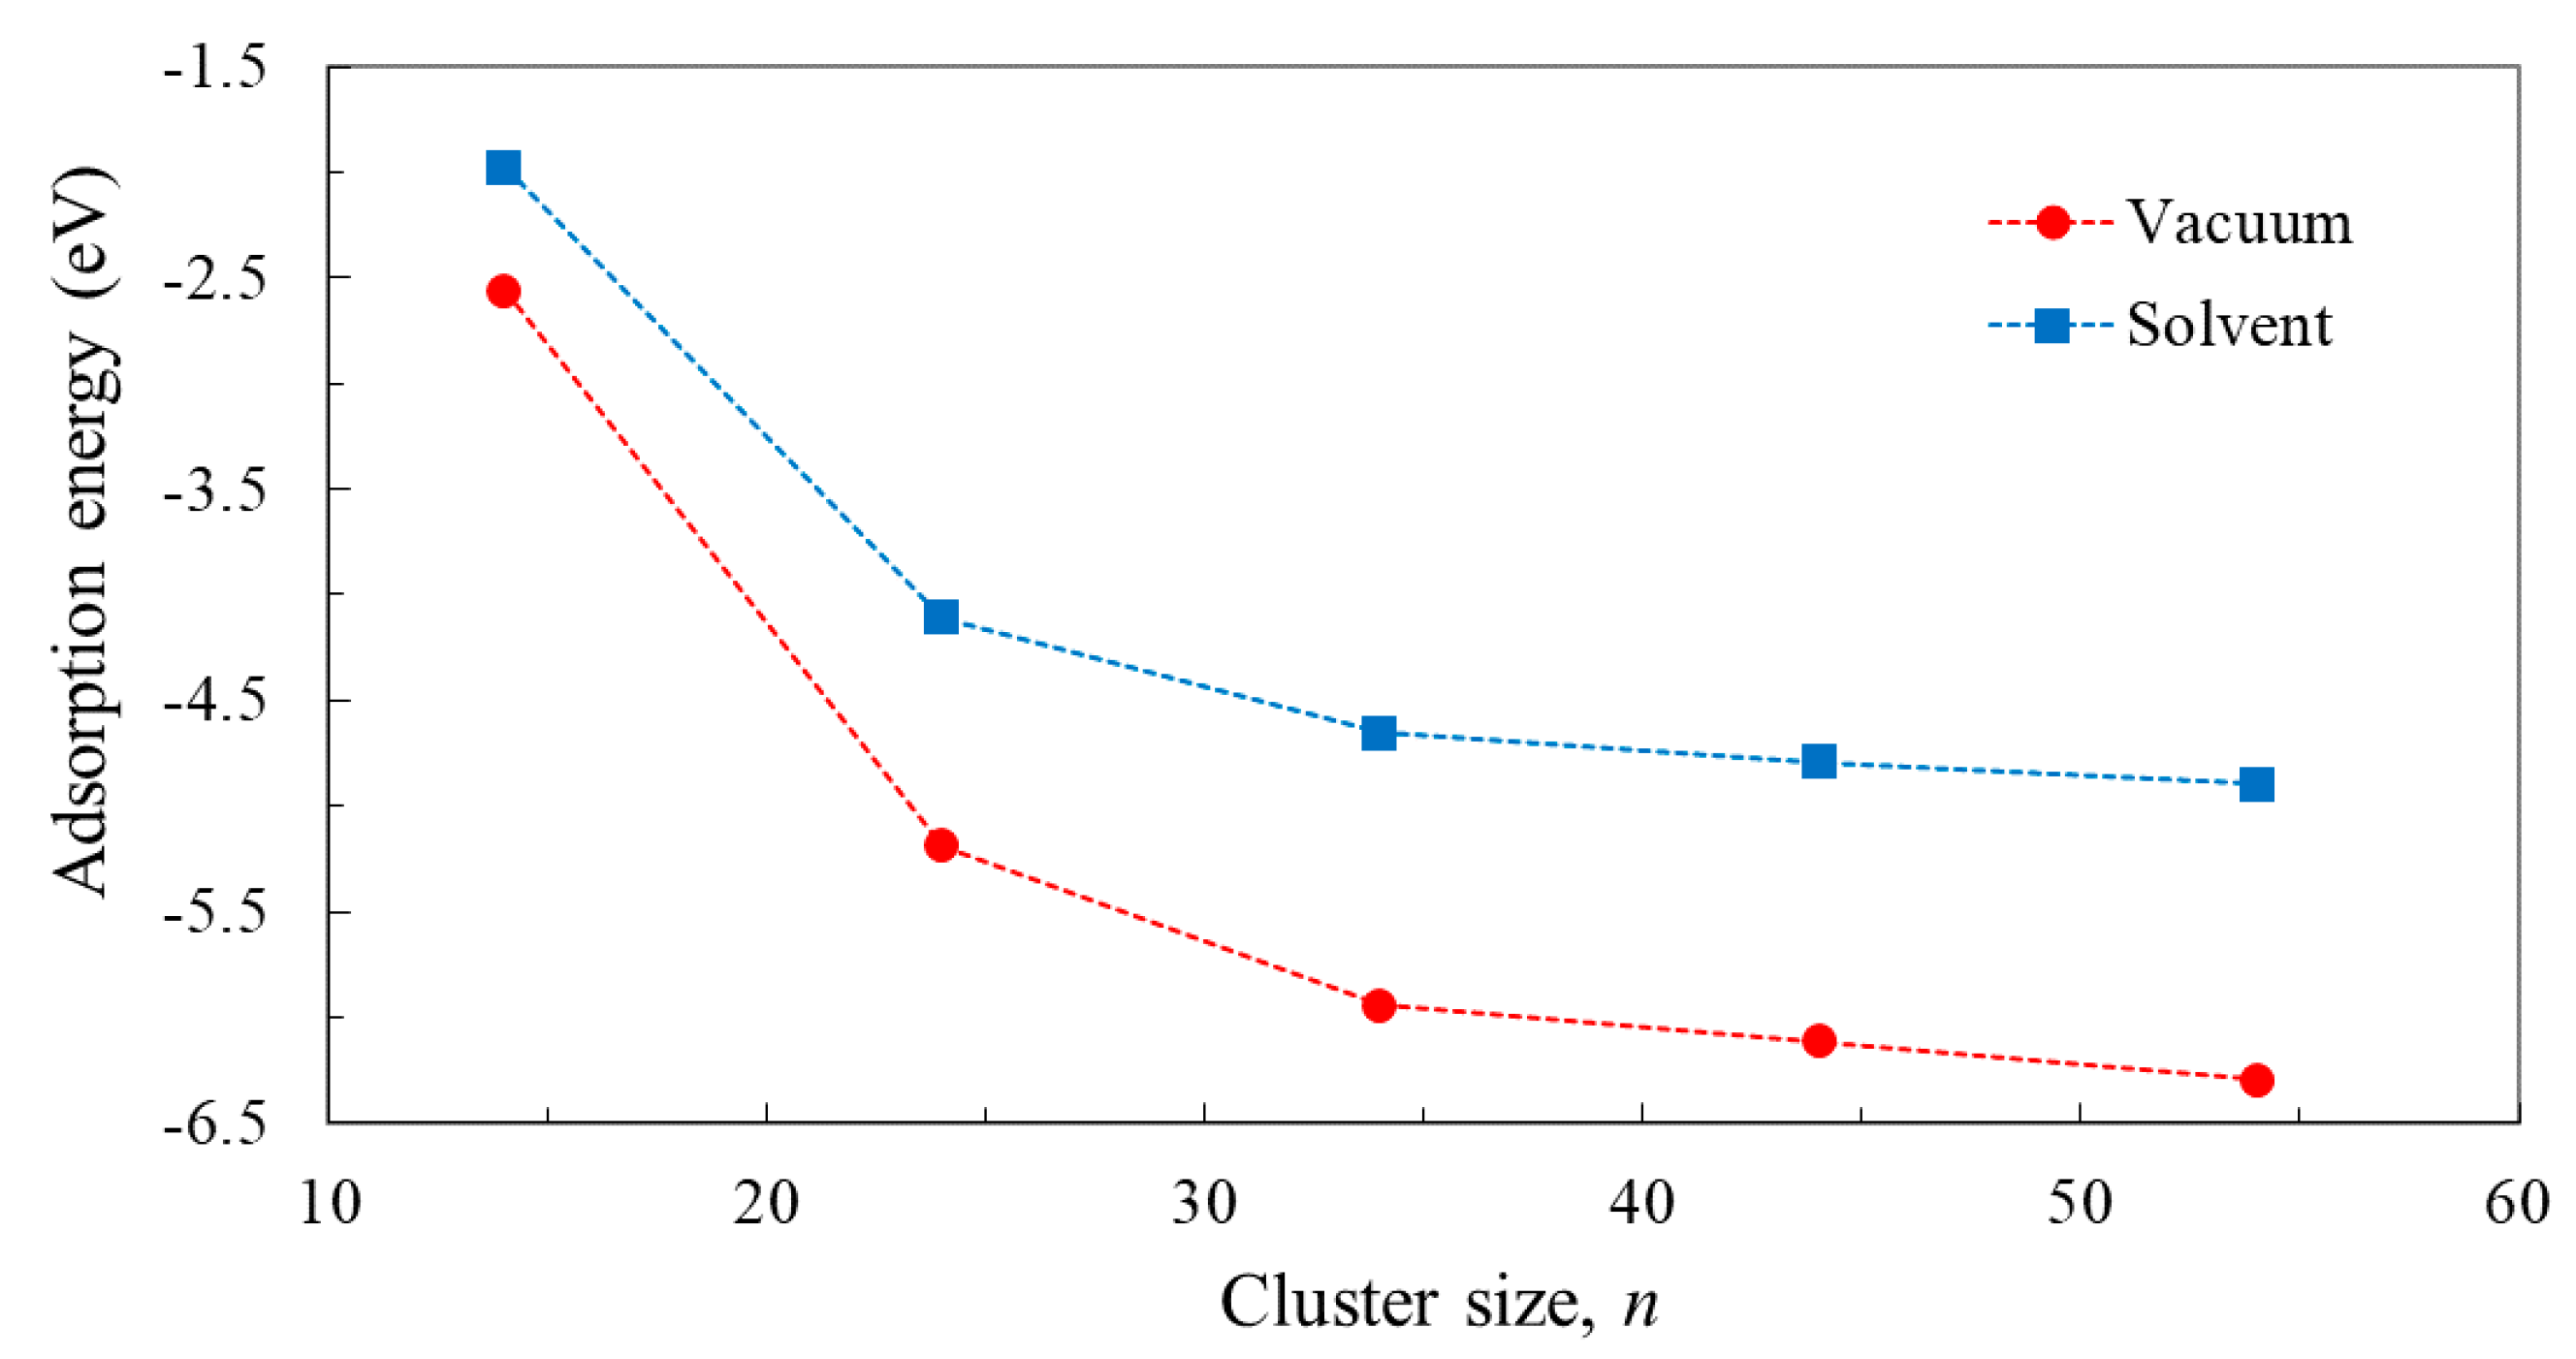
| B3LYP/3-21G(d) vacuum | −2.473 | −3.075 | −3.254 |
| B3LYP/3-21G(d) solvent | −1.961 | −2.574 | −2.835 |
| B3LYP/LANL2DZ solvent | 0.429 | −0.242 | −1.188 |
| Parameter | OMCD1 on Ti24O50H4 | Ti24O50H4 |
|---|---|---|
| r(Ti–O) | 1.880 | 1.876 |
| σr(Ti–O) | 0.102 | 0.100 |
| Width (Ti…Ti) | 12.20 | 12.18 |
| Width (O…O) | 13.22 | 13.28 |
| Length (Ti…Ti) | 7.21 | 7.20 |
| Length (O…O) | 8.15 | 8.16 |
| r(O1–Ti) | 2.012 | - |
| r(O2–Ti) | 1.989 | - |
| <(O–C–C–C) | −4.2 | - |
| <(Phenyl;3Ti) | 87.2 | - |
| Parameter | PV on Ti14O30H4 | PV on Ti24O50H4 | PV on Ti34O70H4 | PV on Ti44O90H4 | PV on Ti54O110H4 |
|---|---|---|---|---|---|
| r(Ti–O) | 1.822 | 1.884 | 1.896 | 1.900 | 1.903 |
| σr(Ti–O) | 0.180 | 0.104 | 0.104 | 0.103 | 0.107 |
| Width (Ti…Ti) | 12.34 | 12.21 | 11.87 | 11.95 | 12.01 |
| Width (O…O) | 13.27 | 13.34 | 13.35 | 13.32 | |
| Length (Ti…Ti) | 3.63 | 7.40 | 10.90 | 14.53 | 18.11 |
| Length (O…O) | 4.81 | 8.82 | 11.64 | 15.30 | 18.80 |
| r(O1–Ti) | 2.040 | 2.073 | 2.077 | 2.041 | 2.044 |
| r(O2–Ti) | 2.035 | 2.102 | 2.100 | 2.119 | 2.110 |
| <(Ti–O–C–C) | 159.4 | 129.1 | 129.7 | 130.0 | 130.4 |
| <(O–C–C–N) | 25.7 | 0.8 | 1.0 | −0.8 | −0.5 |
| <(C–C–O–C) | 0.6 | −30.4 | 79.9 | 47.4 | 42.3 |
© 2019 by the authors. Licensee MDPI, Basel, Switzerland. This article is an open access article distributed under the terms and conditions of the Creative Commons Attribution (CC BY) license (http://creativecommons.org/licenses/by/4.0/).
Share and Cite
Oprea, C.I.; Gîrțu, M.A. Structure and Electronic Properties of TiO2 Nanoclusters and Dye–Nanocluster Systems Appropriate to Model Hybrid Photovoltaic or Photocatalytic Applications. Nanomaterials 2019, 9, 357. https://doi.org/10.3390/nano9030357
Oprea CI, Gîrțu MA. Structure and Electronic Properties of TiO2 Nanoclusters and Dye–Nanocluster Systems Appropriate to Model Hybrid Photovoltaic or Photocatalytic Applications. Nanomaterials. 2019; 9(3):357. https://doi.org/10.3390/nano9030357
Chicago/Turabian StyleOprea, Corneliu I., and Mihai A. Gîrțu. 2019. "Structure and Electronic Properties of TiO2 Nanoclusters and Dye–Nanocluster Systems Appropriate to Model Hybrid Photovoltaic or Photocatalytic Applications" Nanomaterials 9, no. 3: 357. https://doi.org/10.3390/nano9030357