
Remote Sensing, Petrological and Geochemical Data for Lithological Mapping in Wadi Kid, Southeast Sinai, Egypt


 , ,
, ,  ,
,  ,
, 

Abstract
:1. Introduction
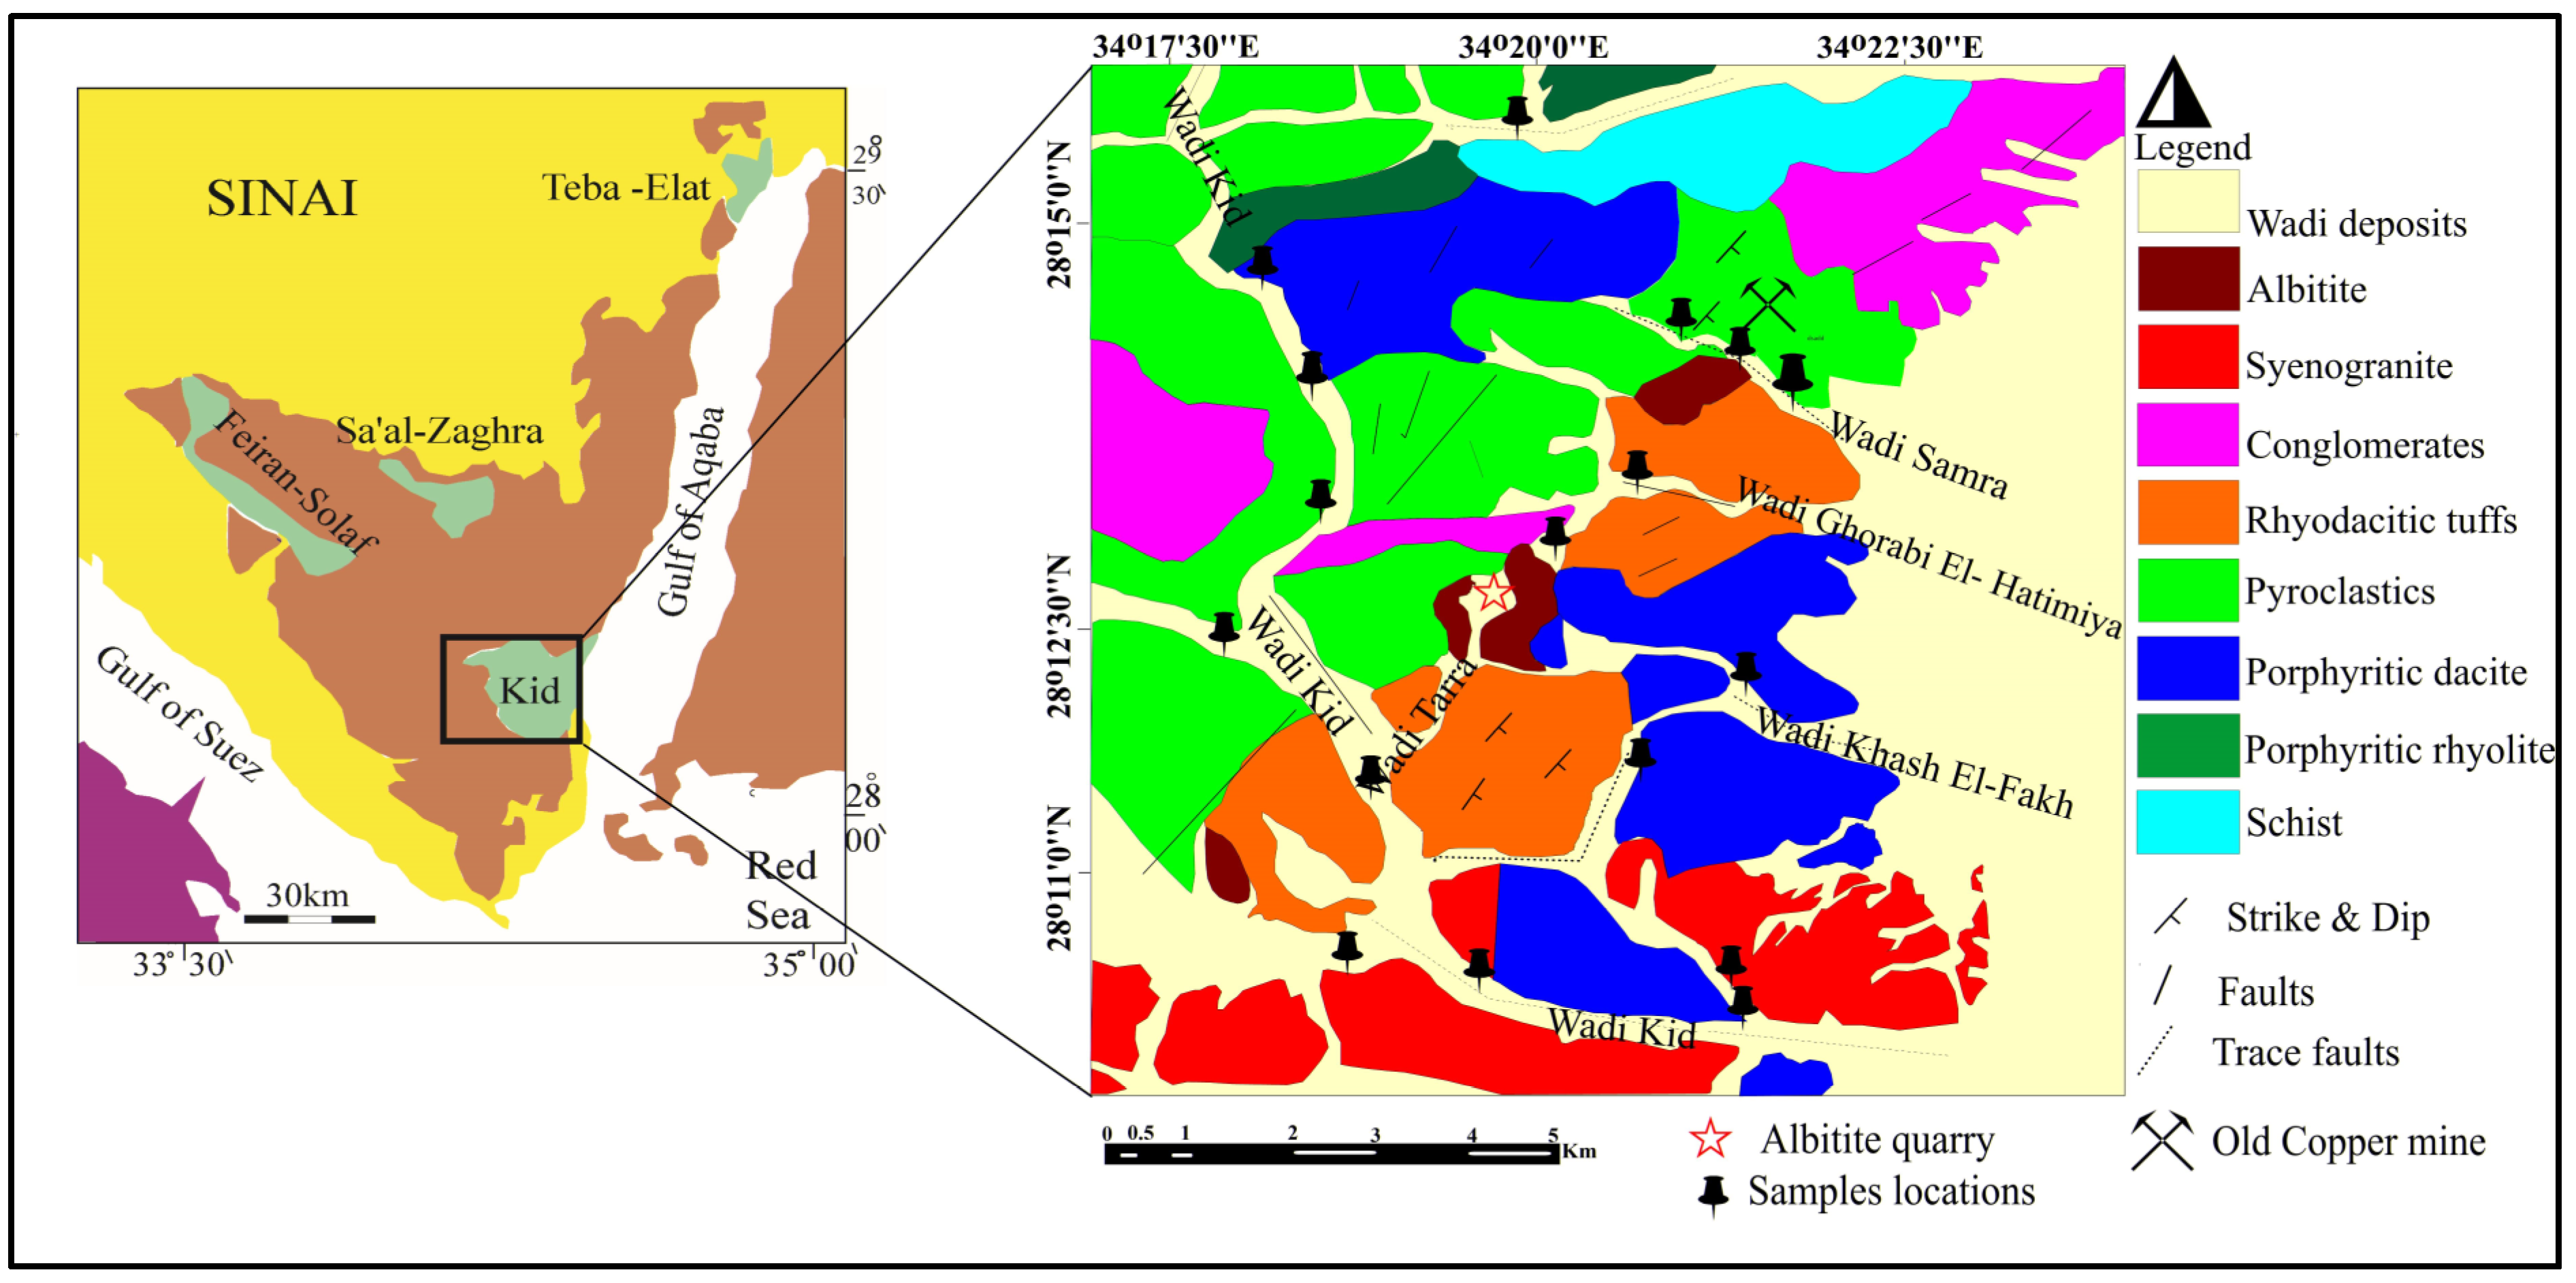
2. Geological Background
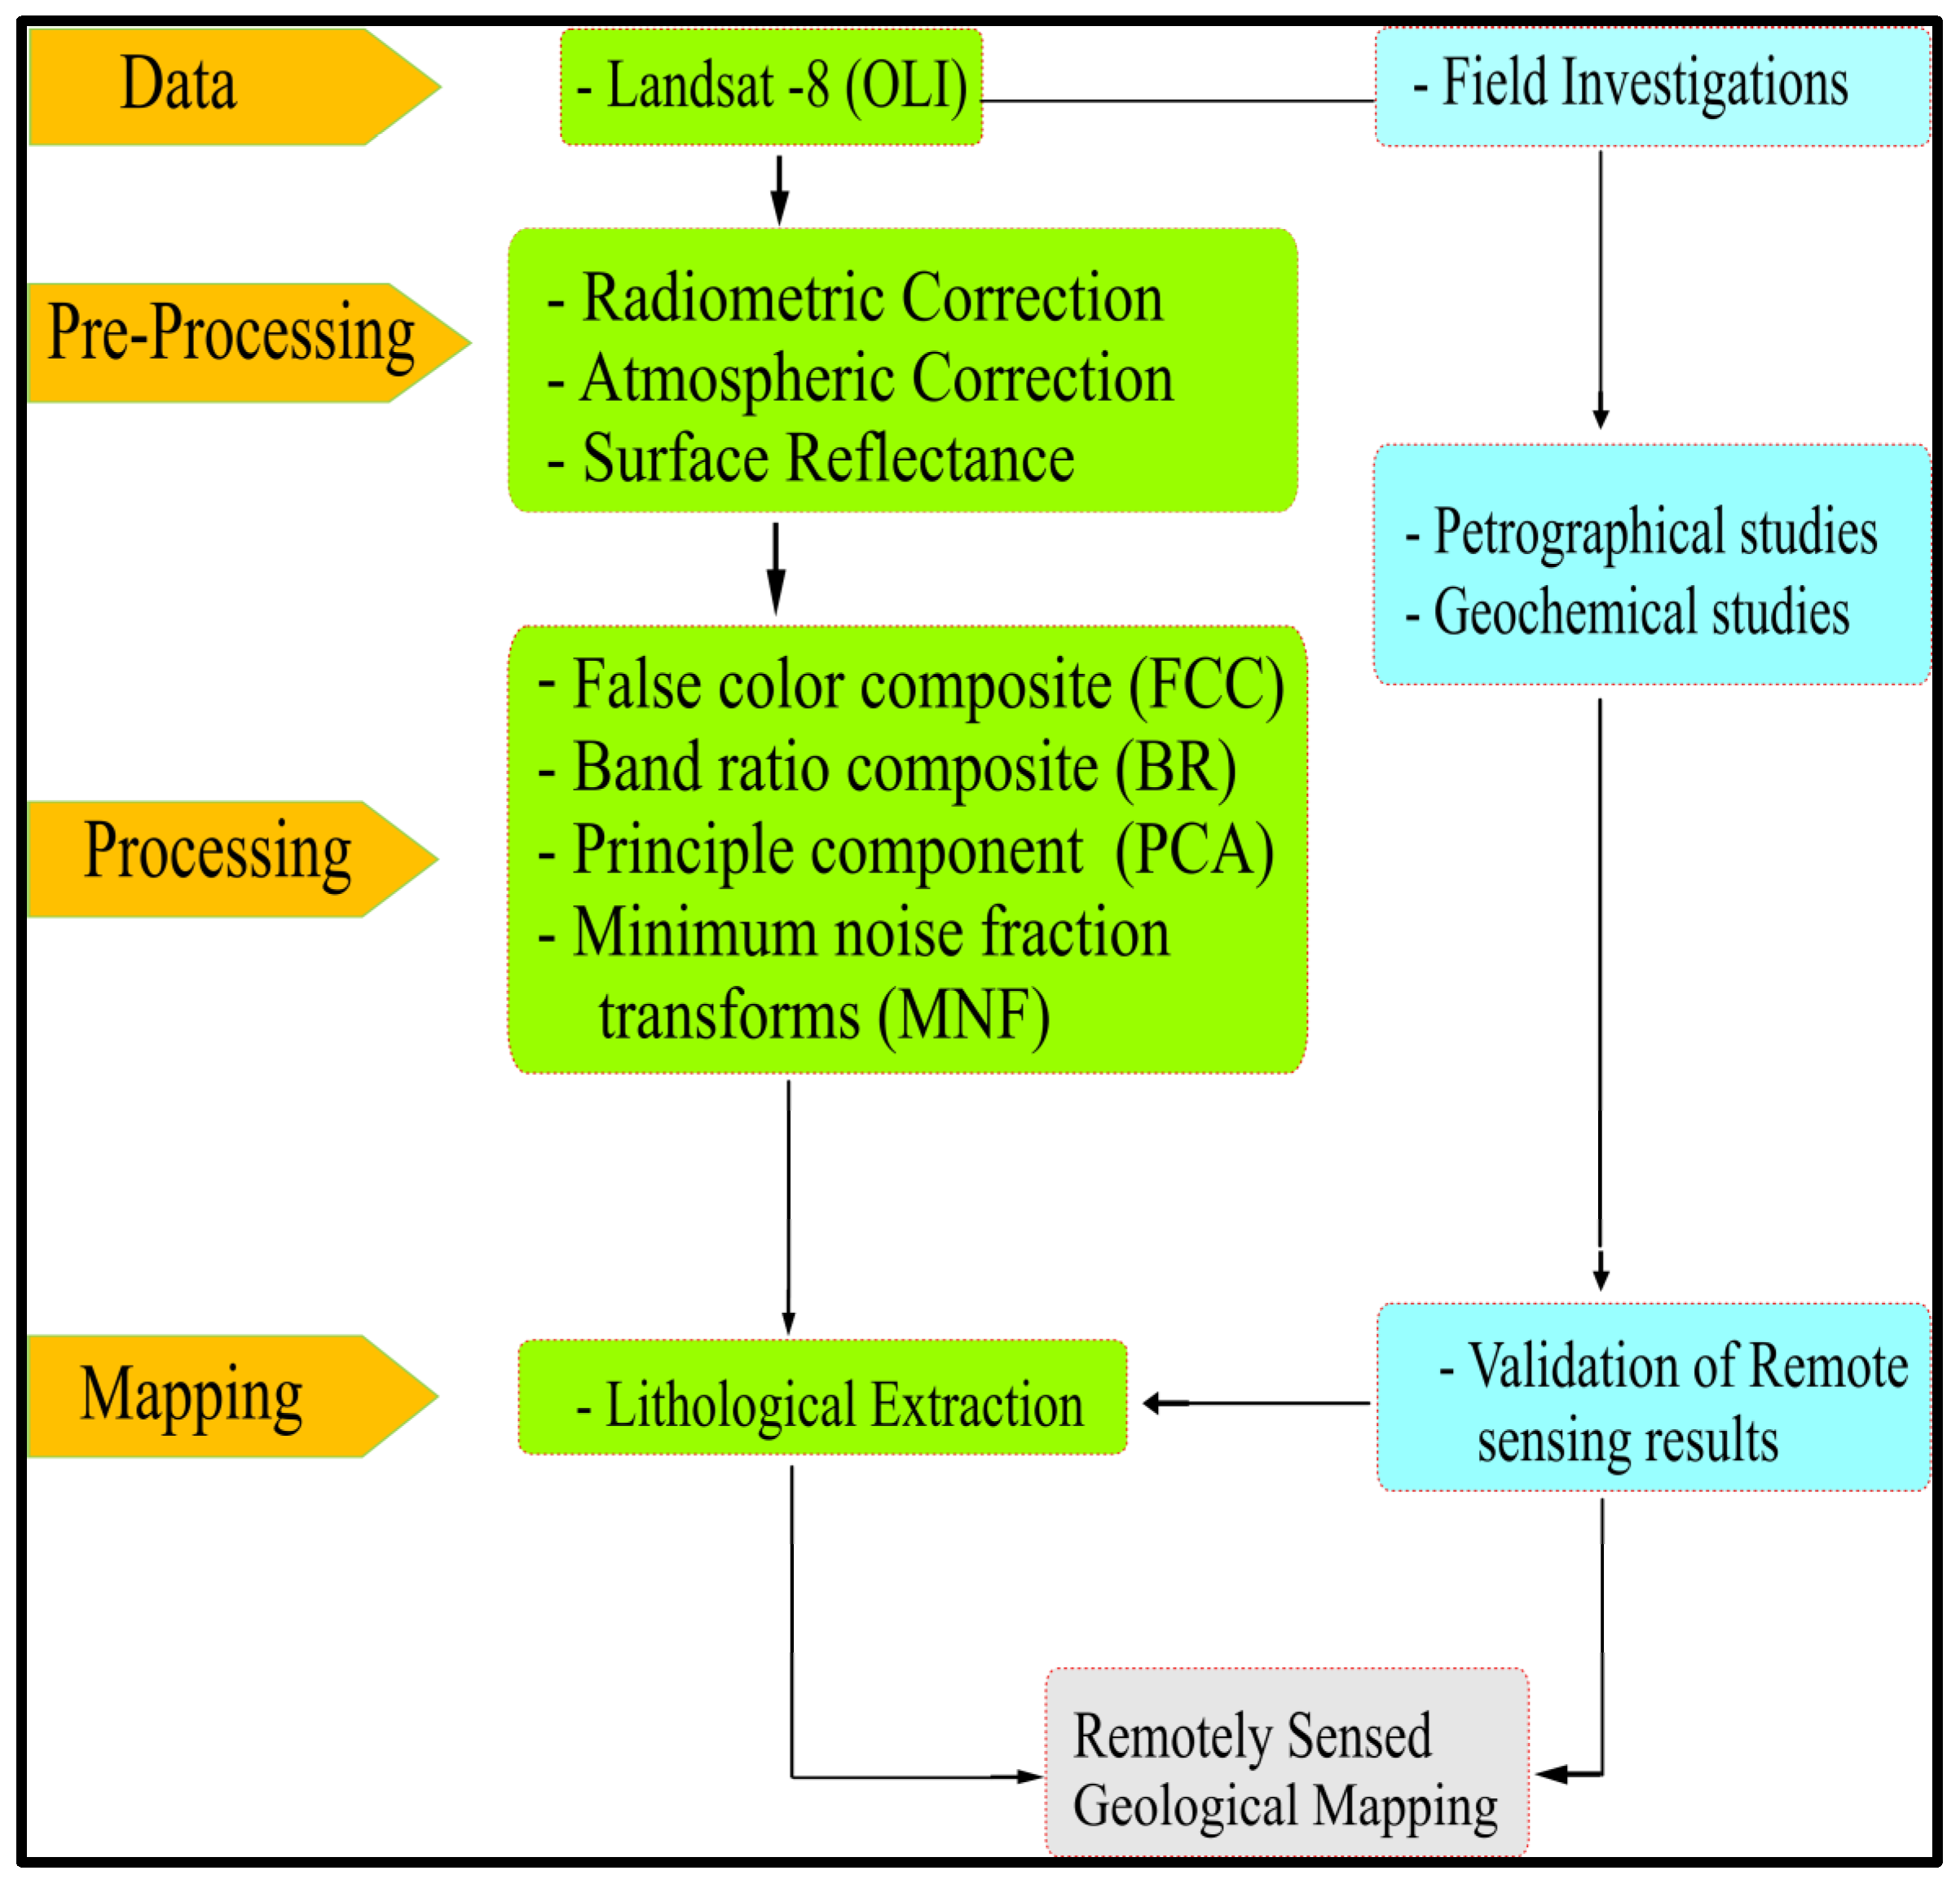
3. Materials and Methods
3.1. Remote Sensing Data
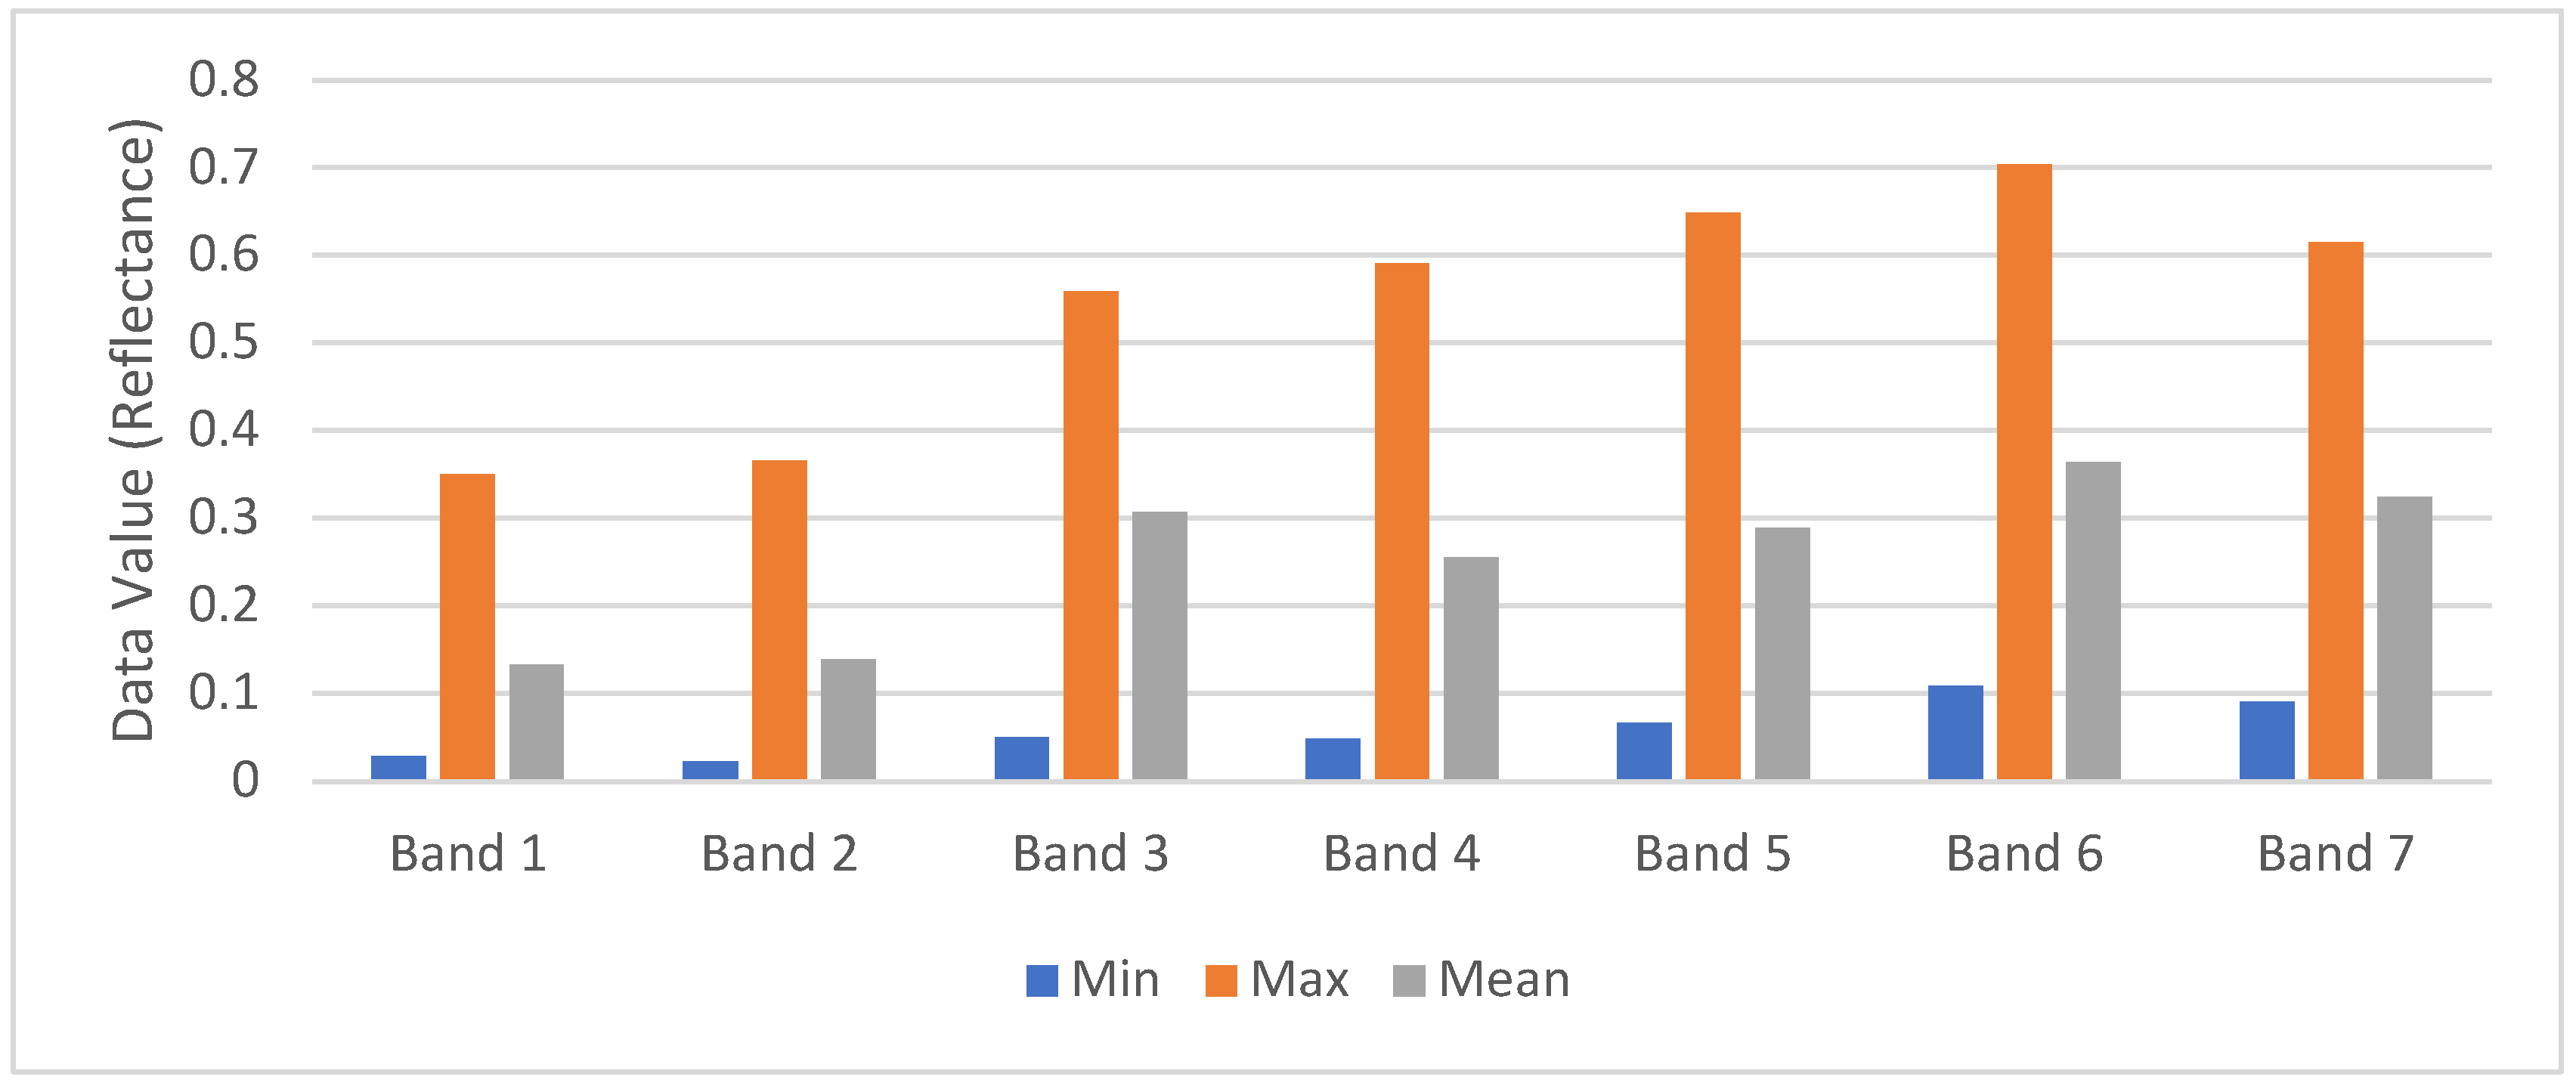
3.1.1. Preprocessing
3.1.2. Image Processing Techniques
3.2. Field and Laboratory Investigations
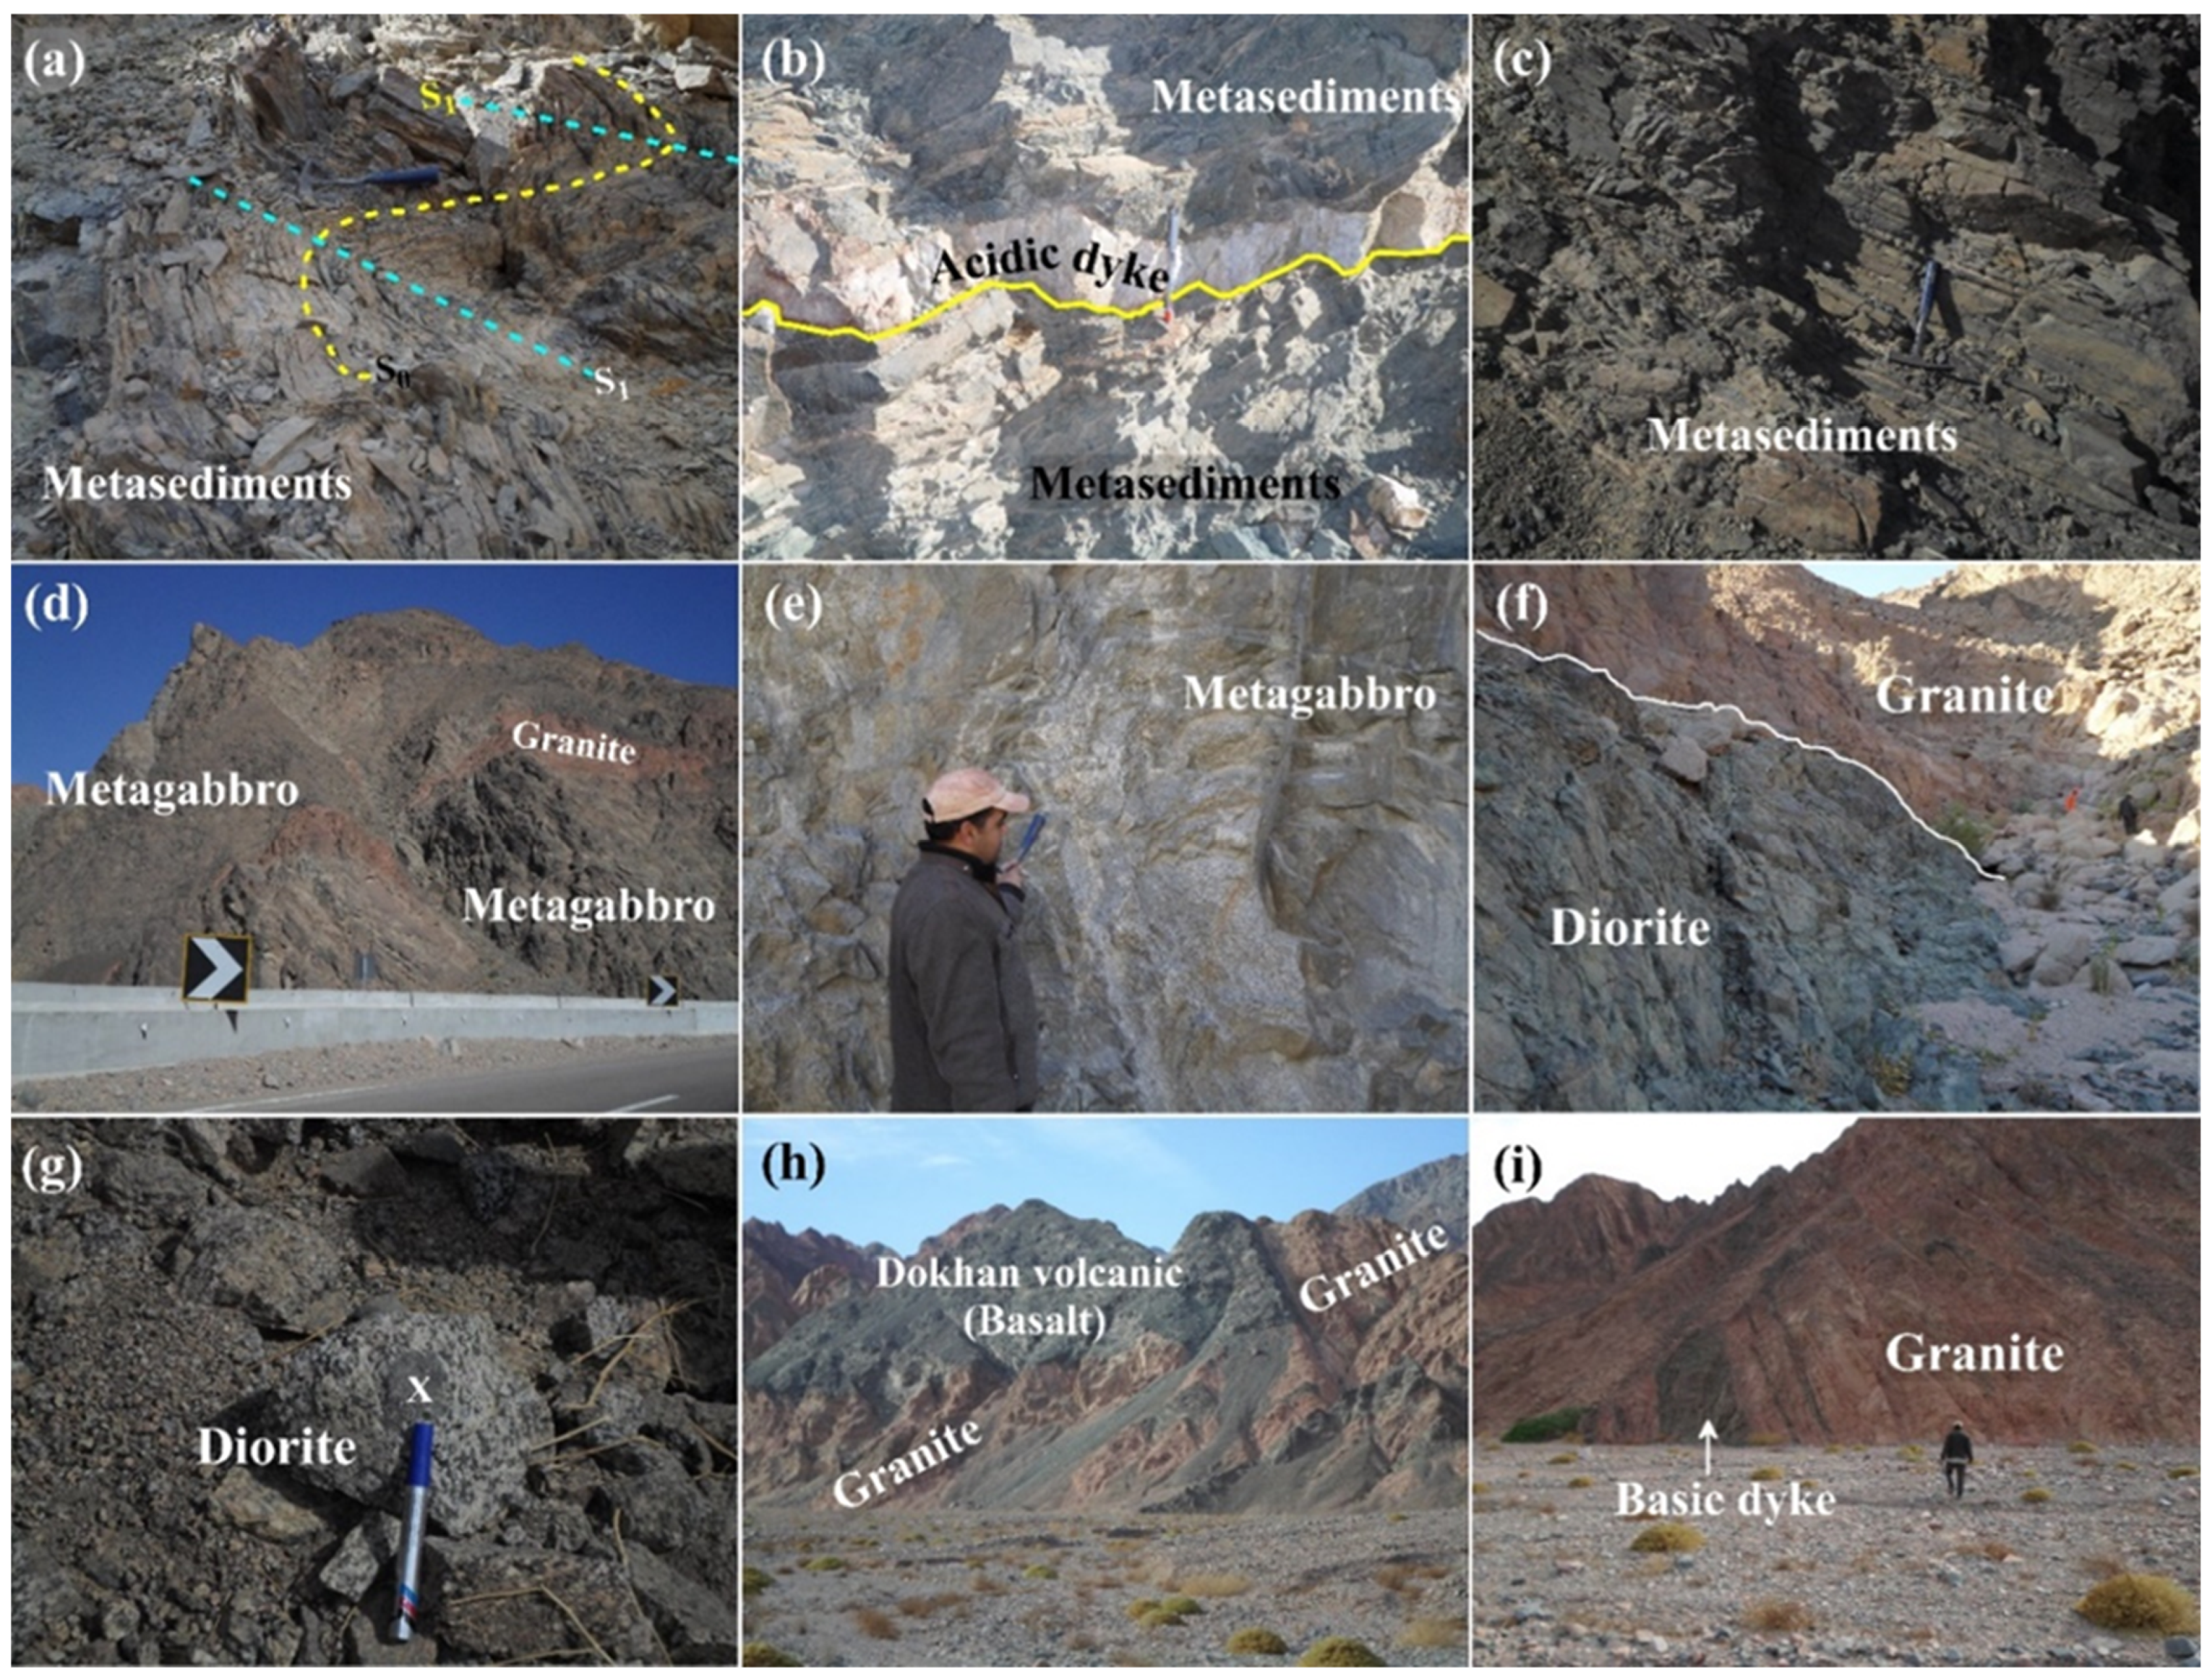
- Fieldwork conducted during the field investigation (which lasted seven days) included sampling and description of field relations and structural settings of the rock units exposed in the study area, particularly metasediments, Shahira gabbros, diorites, granitic rocks, albitites, and aplitic dykes.
- The assessment of the lithology of the different rock units in the study district was based on petrographical studies of about 35 thin sections using the polarizing microscope at the Laboratories of Al-Azhar University.
- Eighteen representative rock samples were chemically analyzed for major and trace elements at the laboratories of the National Research Center, Dokki, Egypt. In the study area, the samples were procured from 5 samples of diorite, 6 samples of granite, 2 samples of albitite, and 5 samples of metasediments. Following a lithium metaborate/tetraborate fusion and diluted nitric digestion, a 0.2 g sample was analyzed by ICP-OES to determine the total abundances of the main oxides and a number of minor elements. Common oxides for each element were used to express them, such as Al2O3, CaO, Fe2O3, K2O, MgO, MnO, Na2O, P2O5, and TiO2. One gram of each sample was heated for 90 min at 950 °C to determine the loss on ignition (L.O.I.), and the weight loss that occurred during this procedure was converted to L.O.I. ICP-OES was used to determine the trace elements (Cr, Co, Sr, Zr, Nb, Cu, Pb, Zn, Y, Ga, and Ce). The categorization, nomenclature, magma type, and tectonic setting of the studied rocks in the research region were ascertained using the geochemistry (Minpet) program and the current data.
4. Results and Discussion
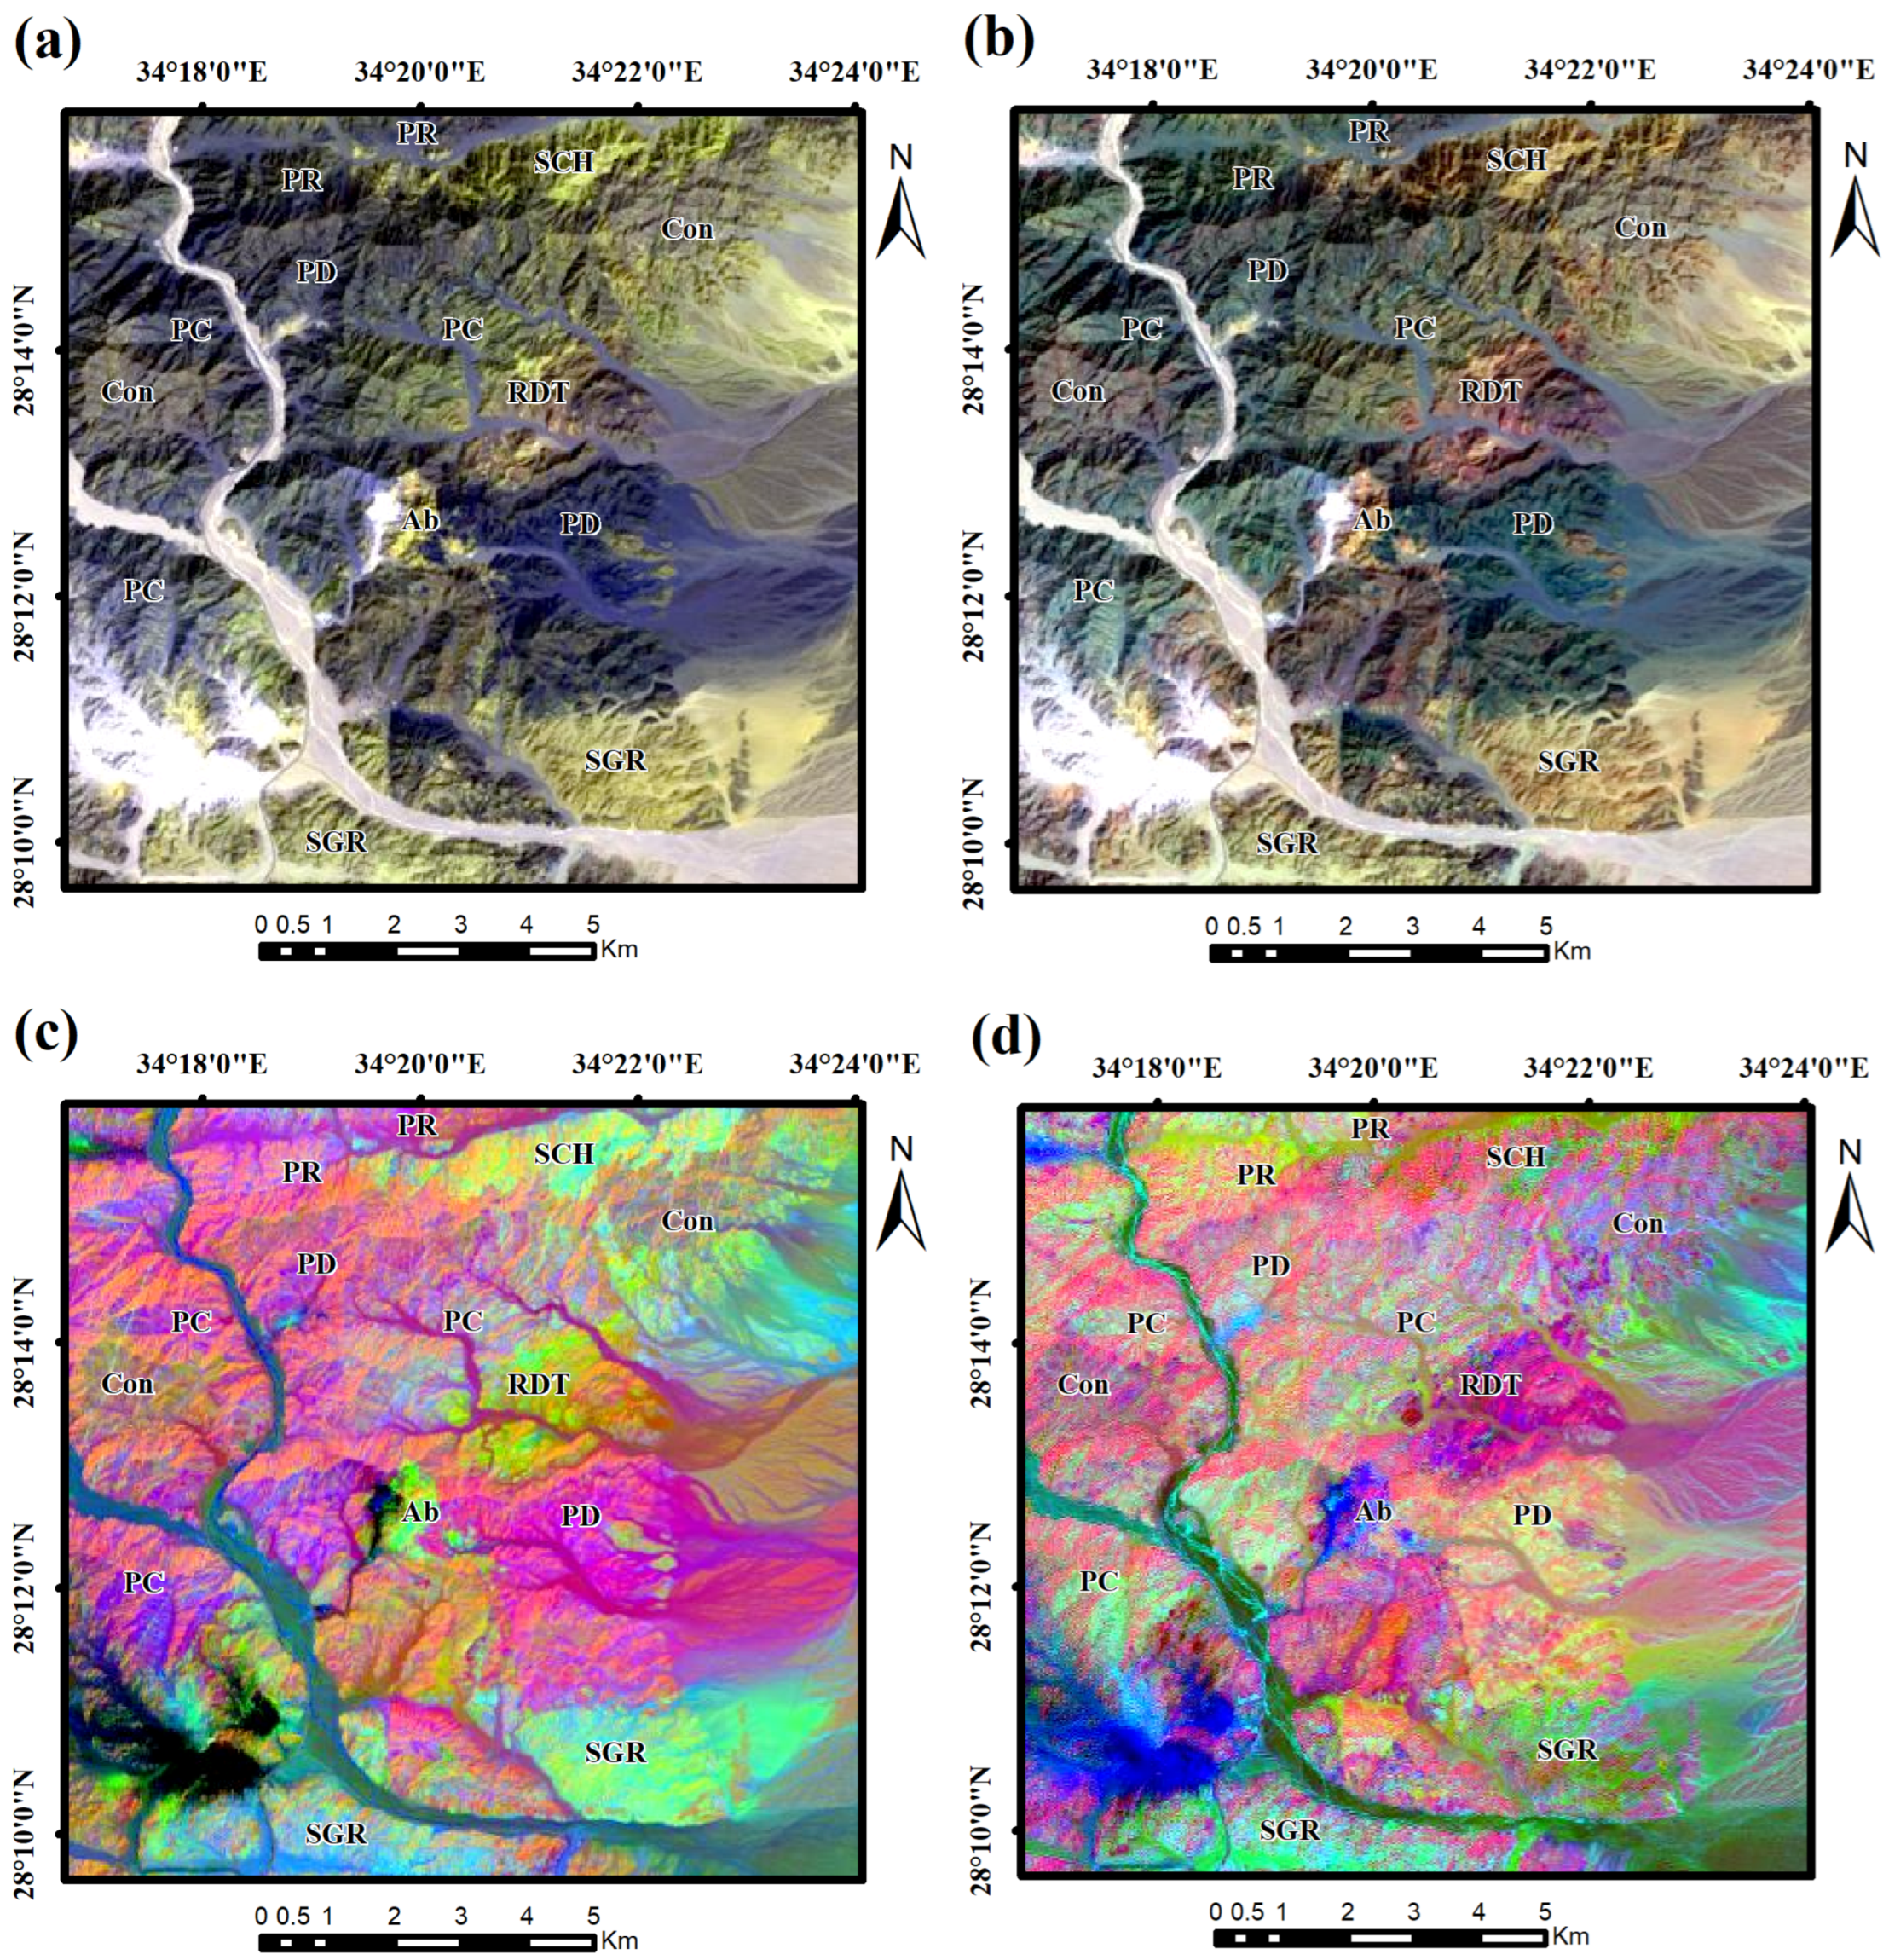
4.1. Remote Sensing
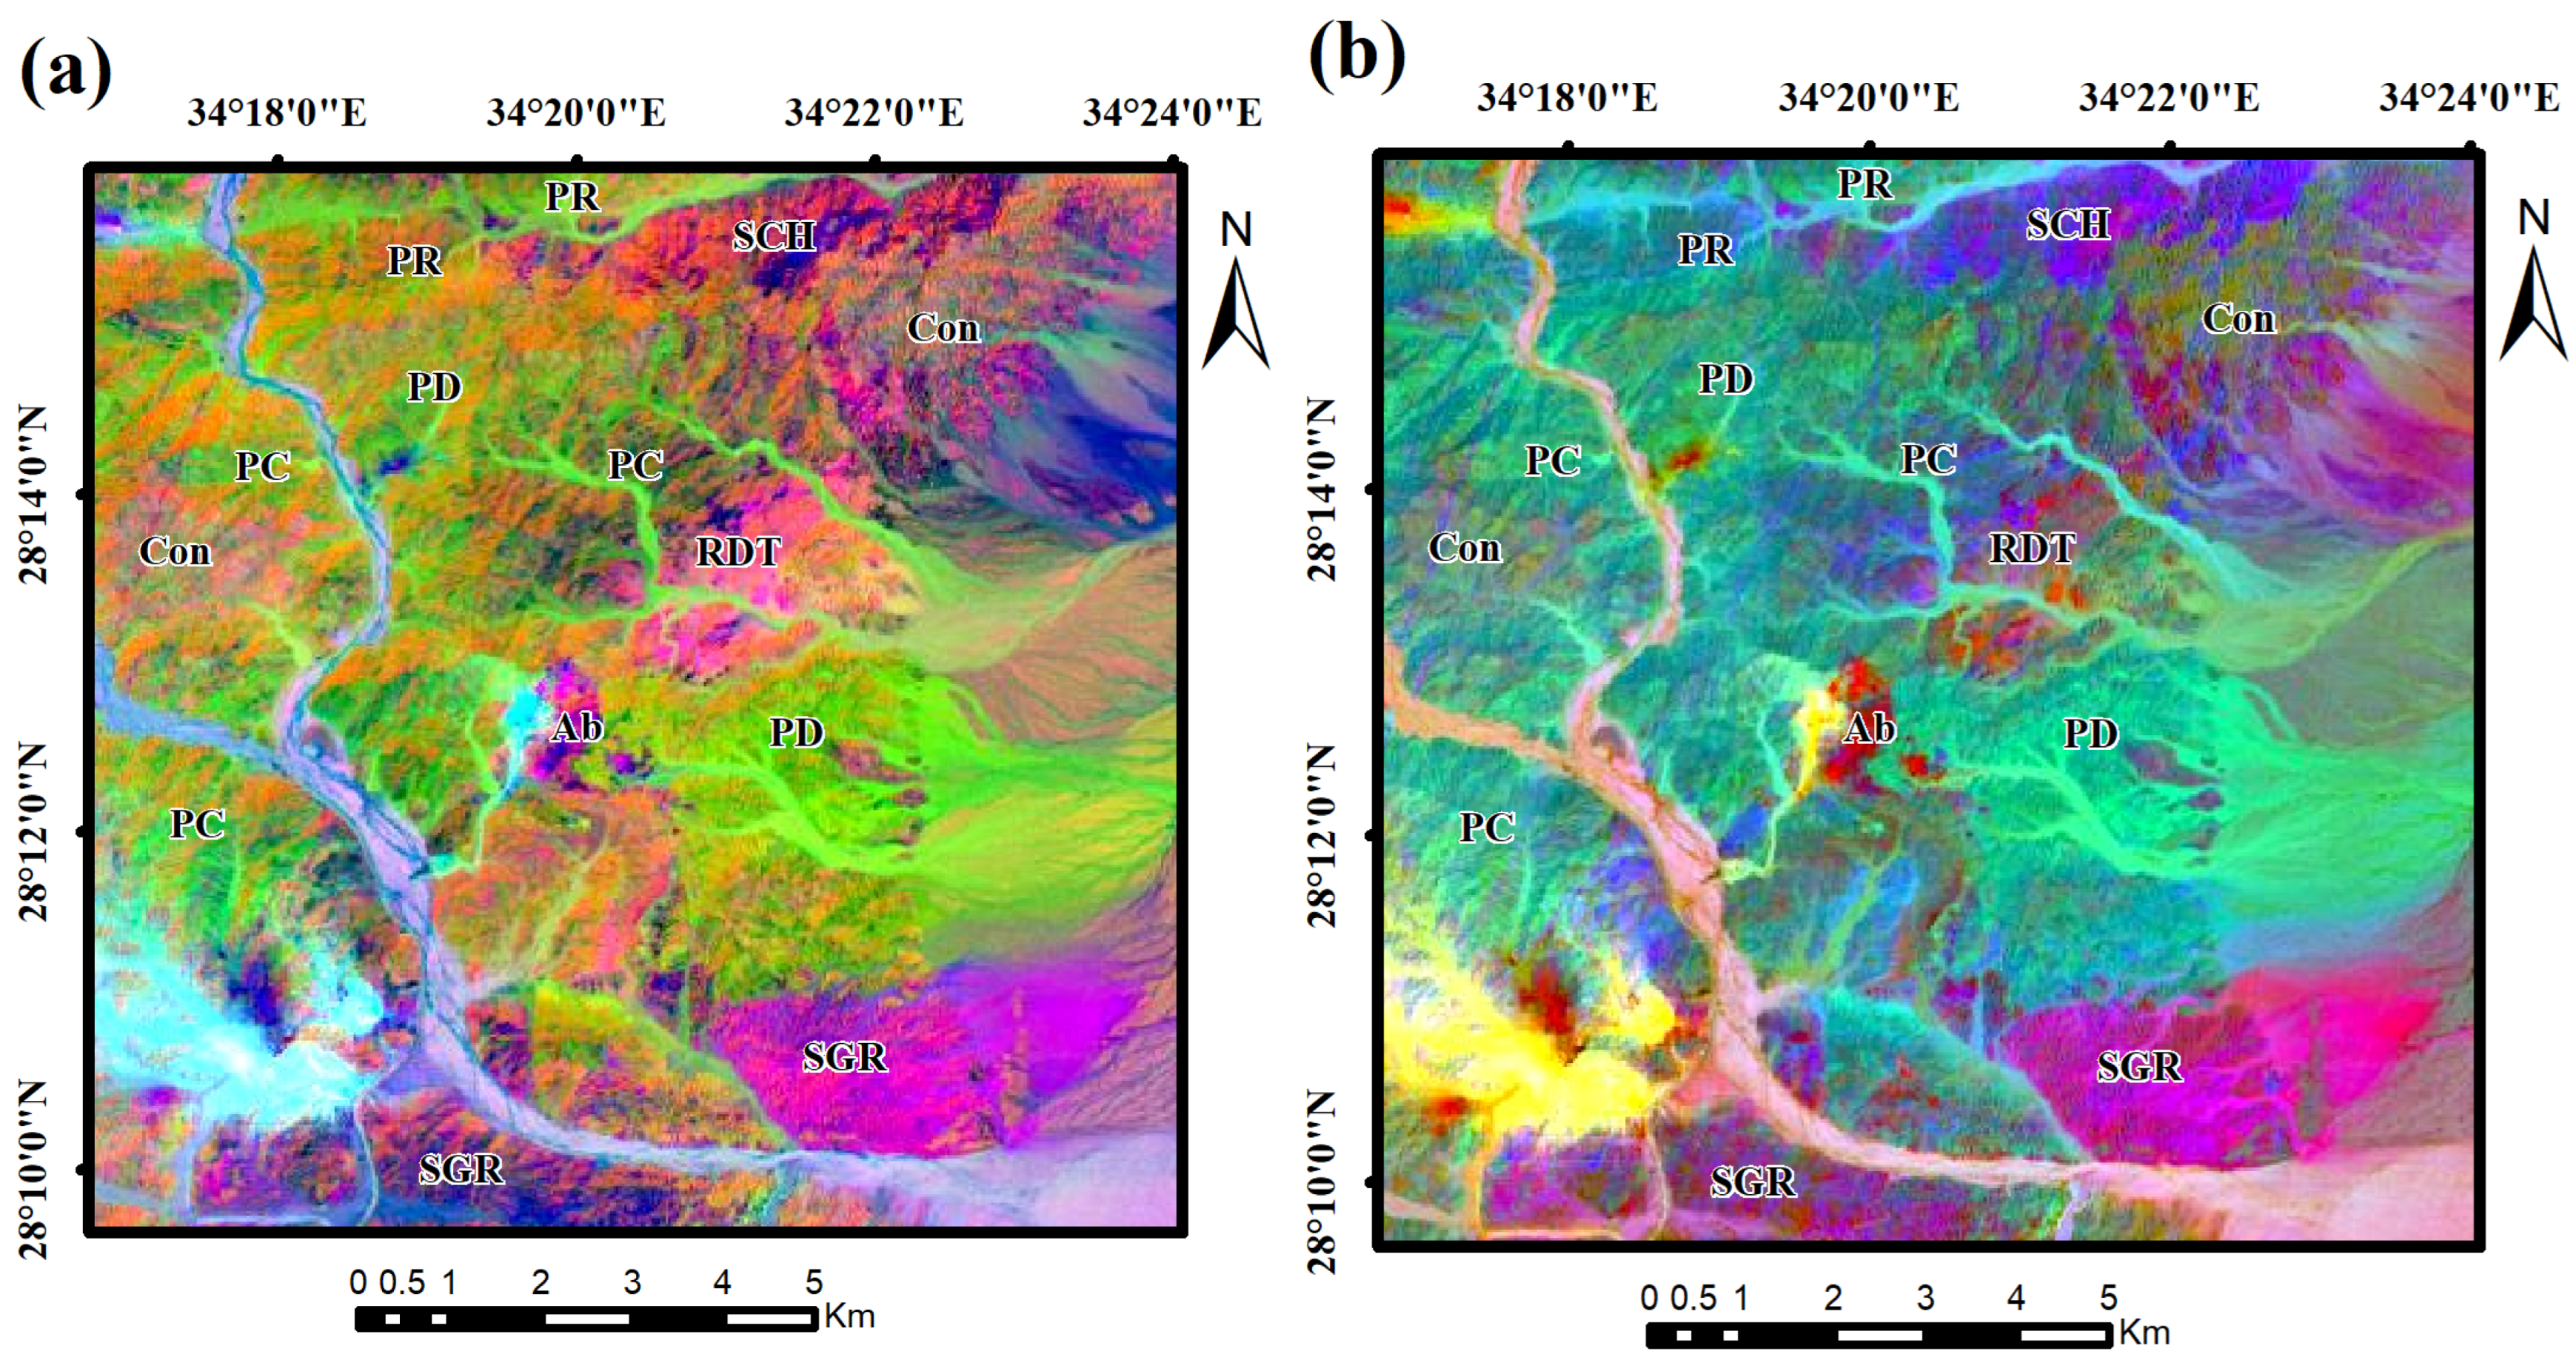
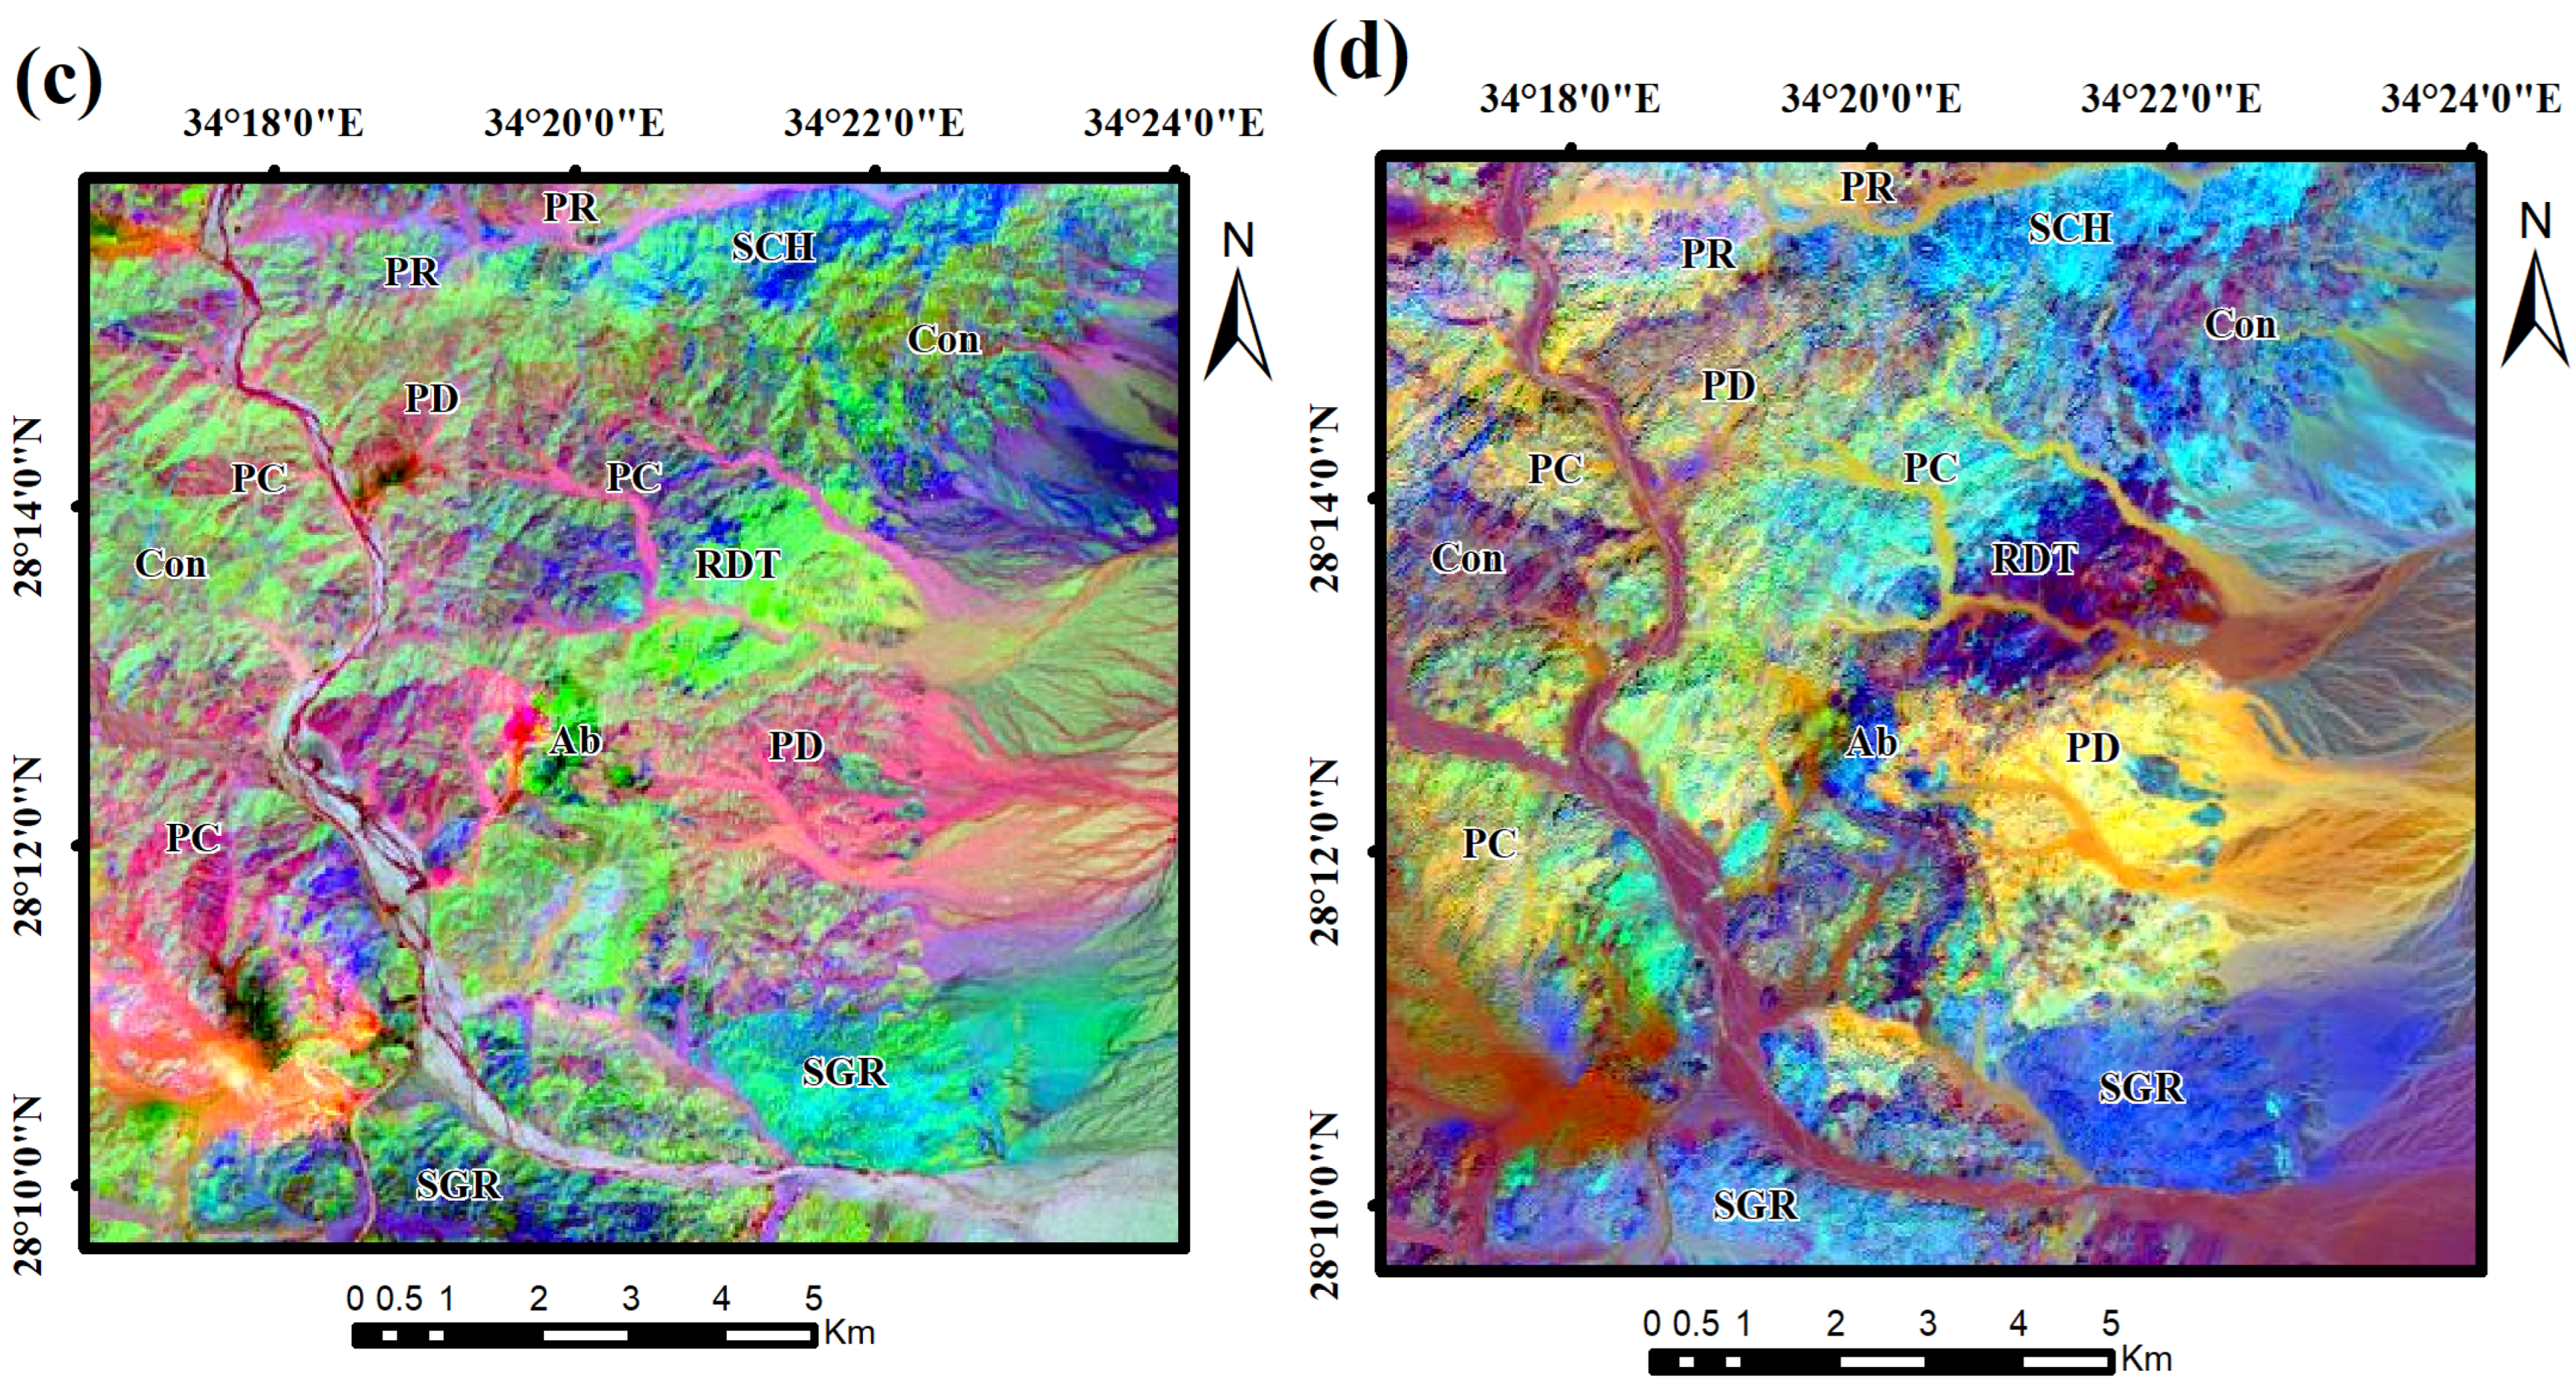
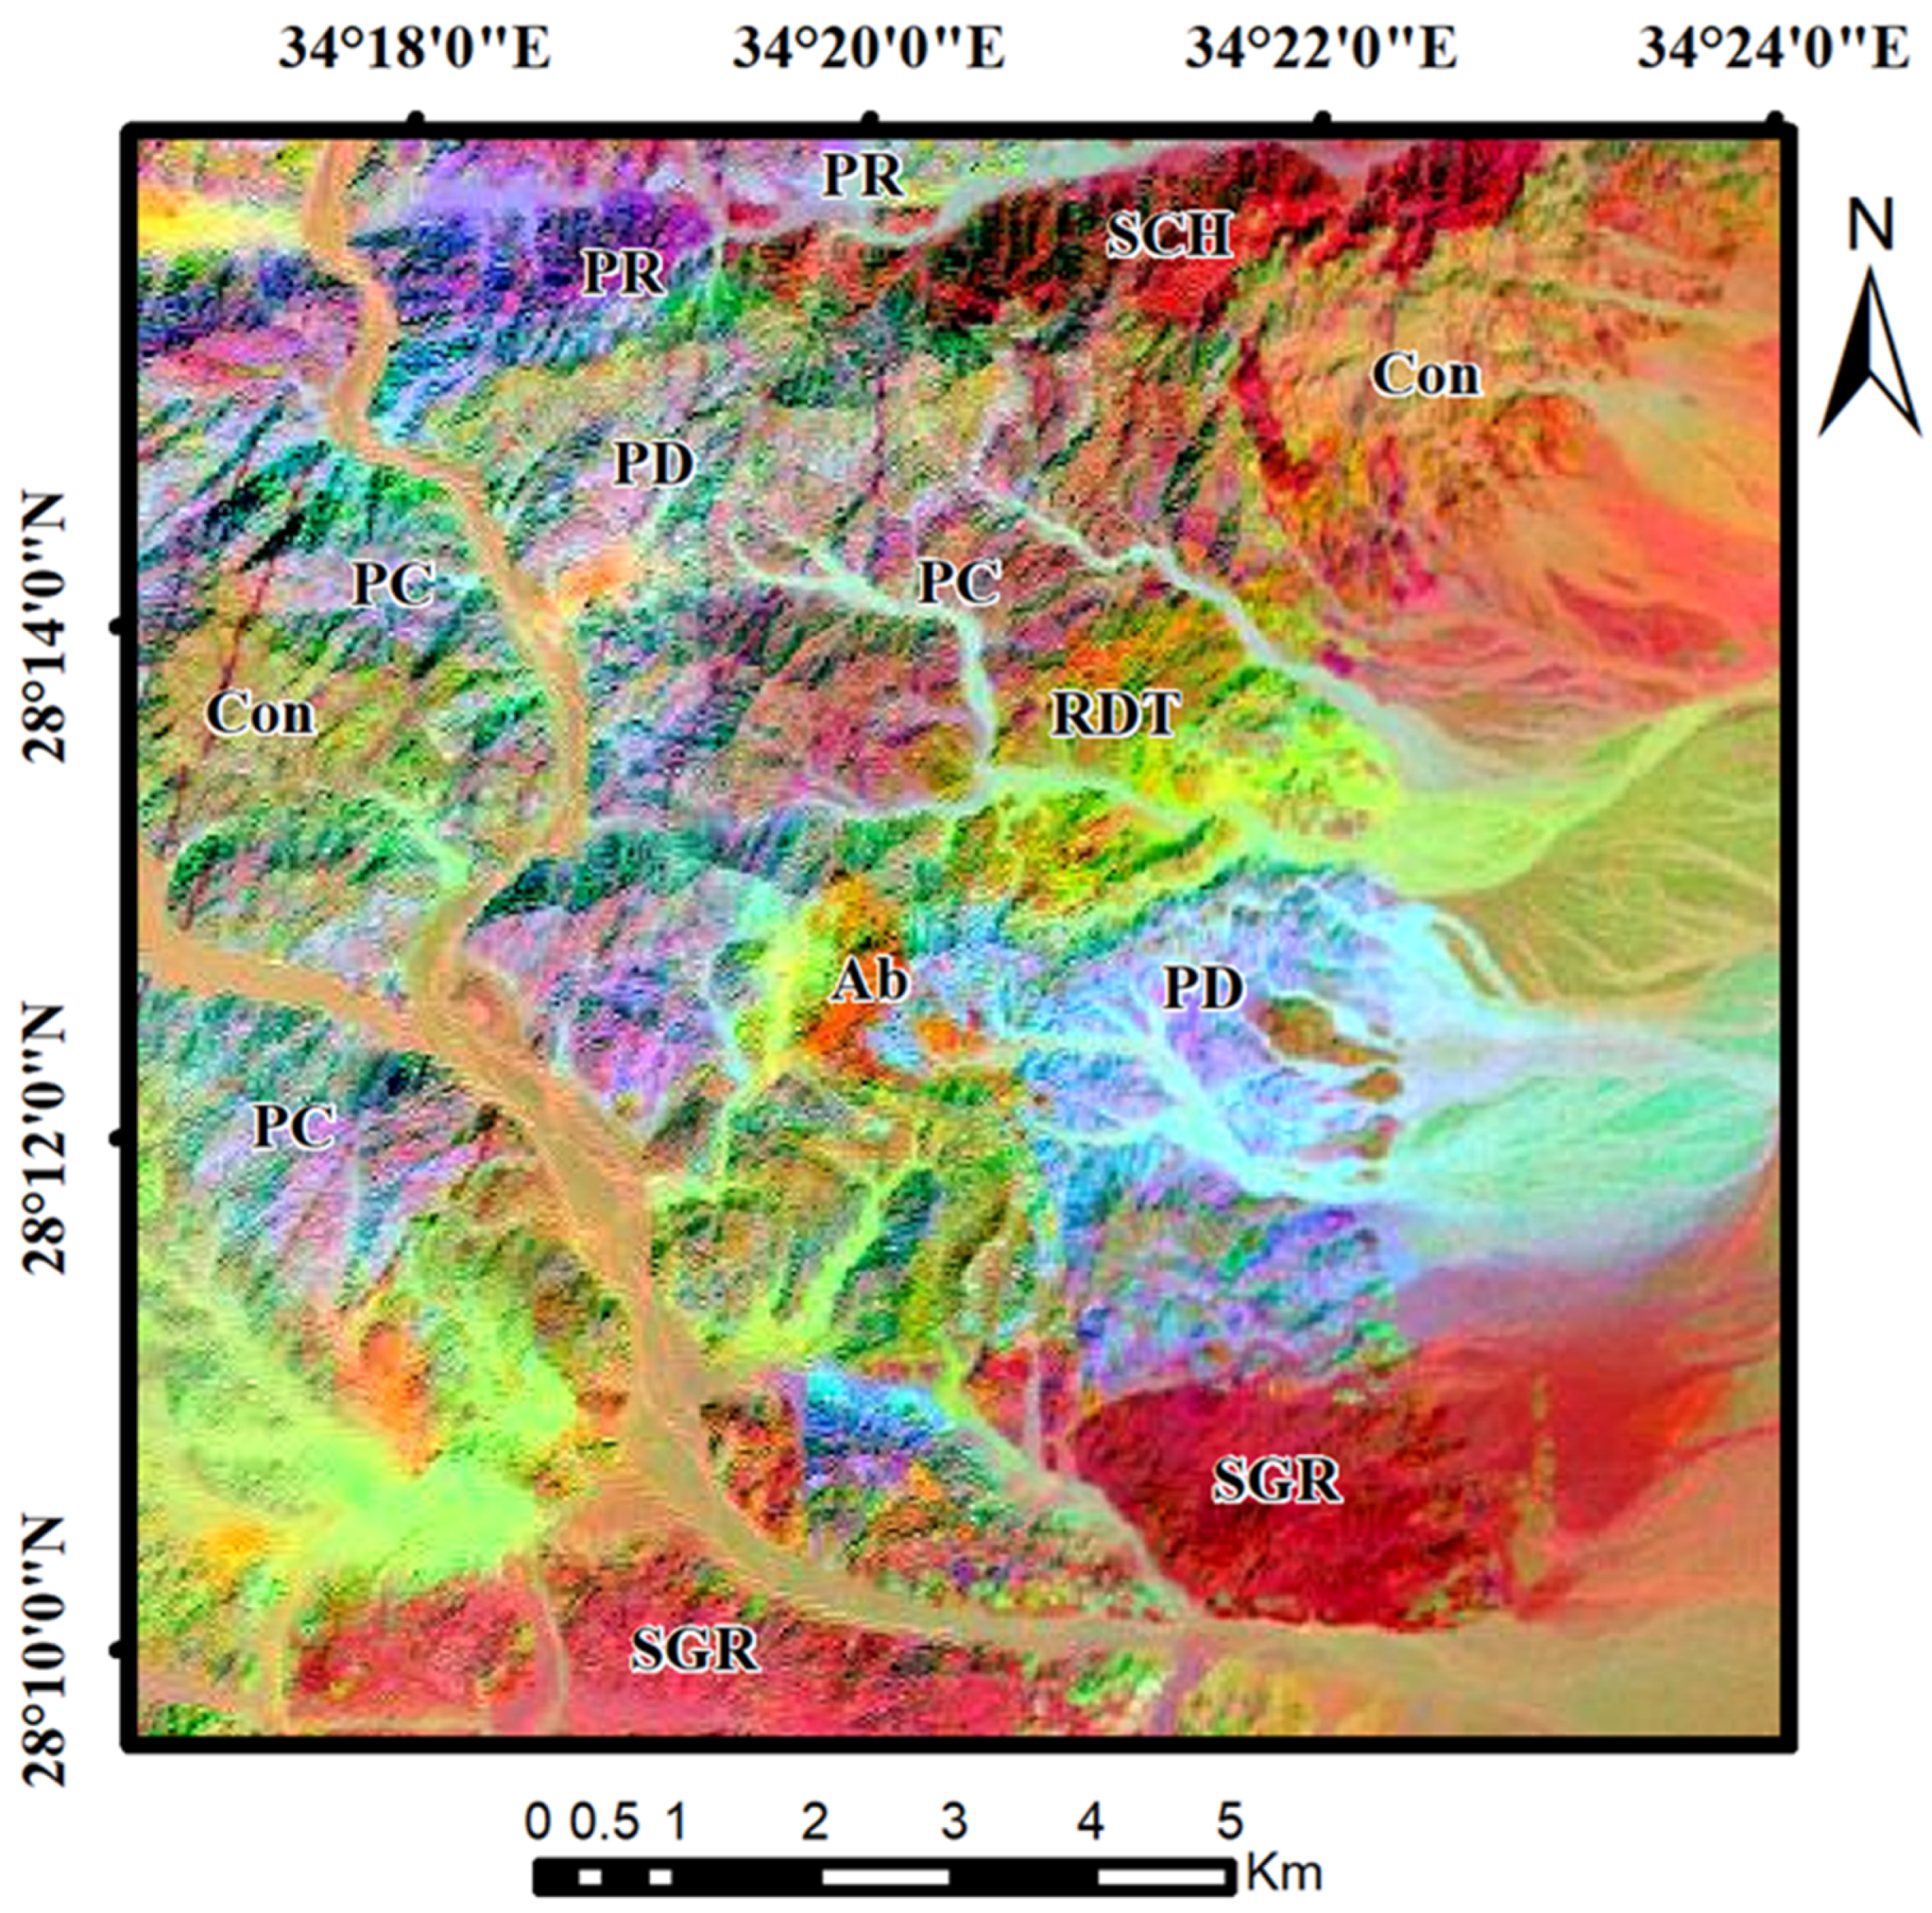
4.1.1. False Color Composite (FCC)
4.1.2. Principal Component Analysis (PCA)
4.1.3. Minimum Noise Fraction (MNF) Transforms
4.1.4. Band Ratio (BR)
4.2. Fieldwork and Analytical Techniques
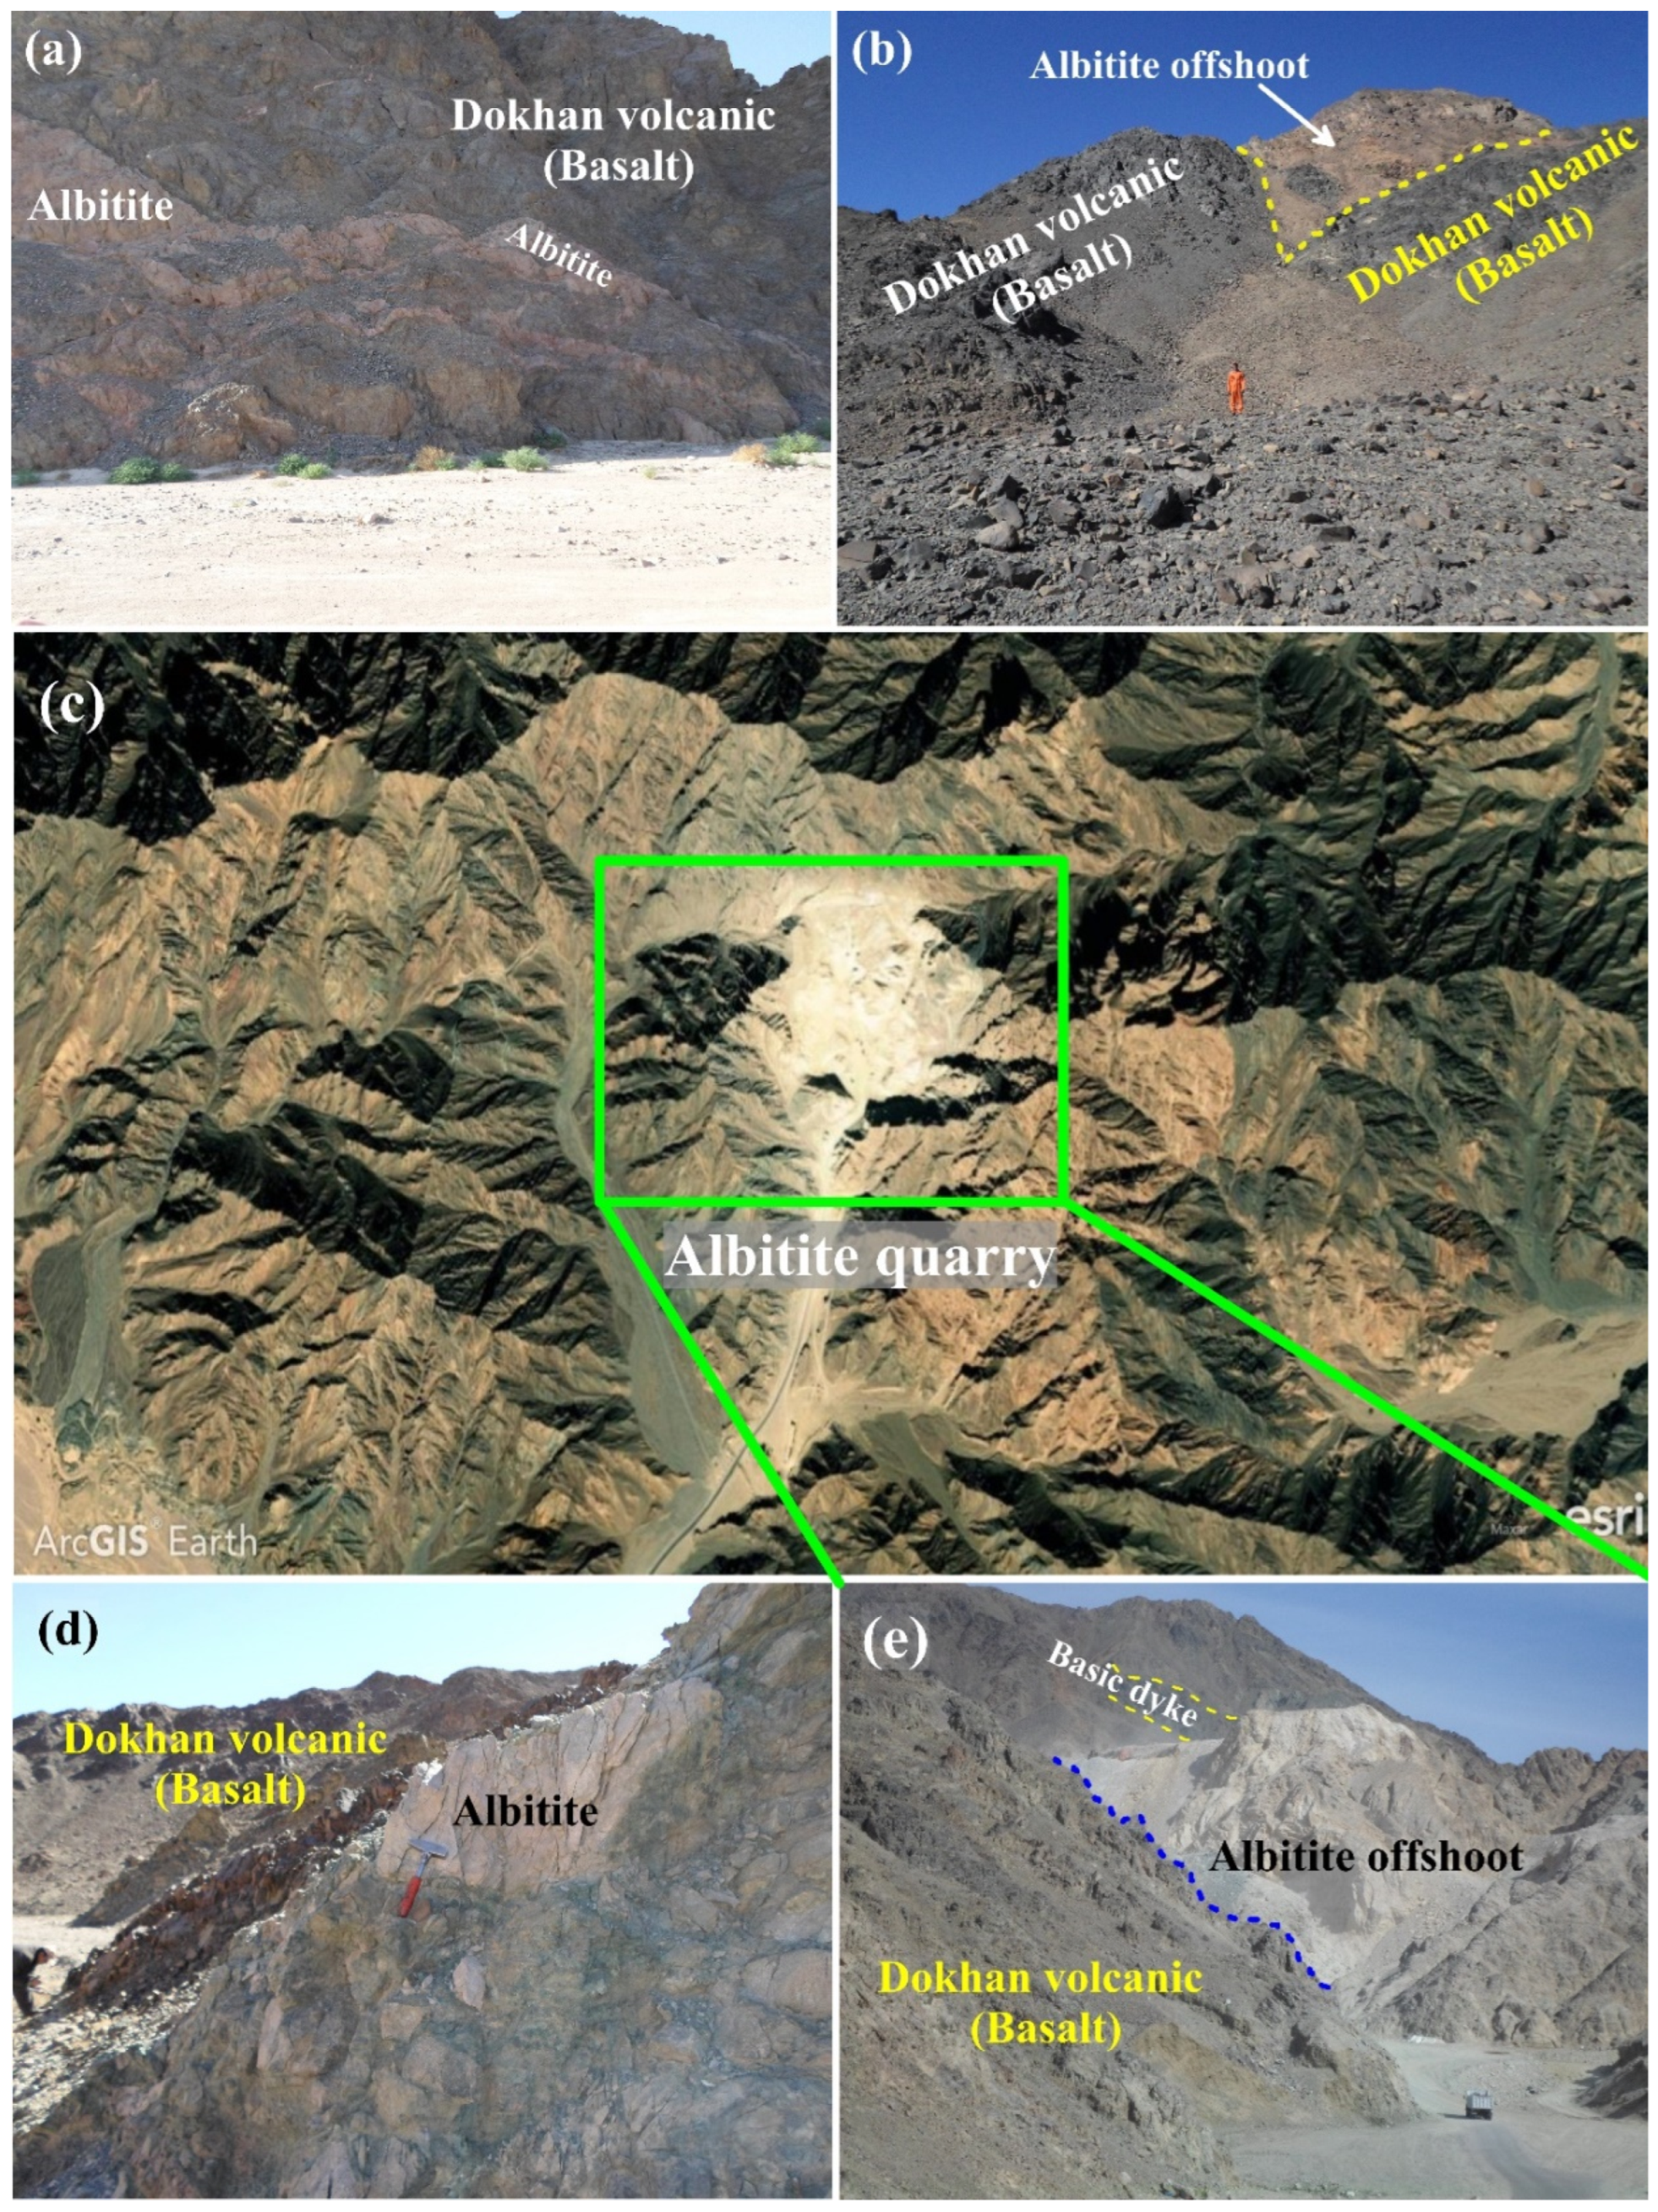
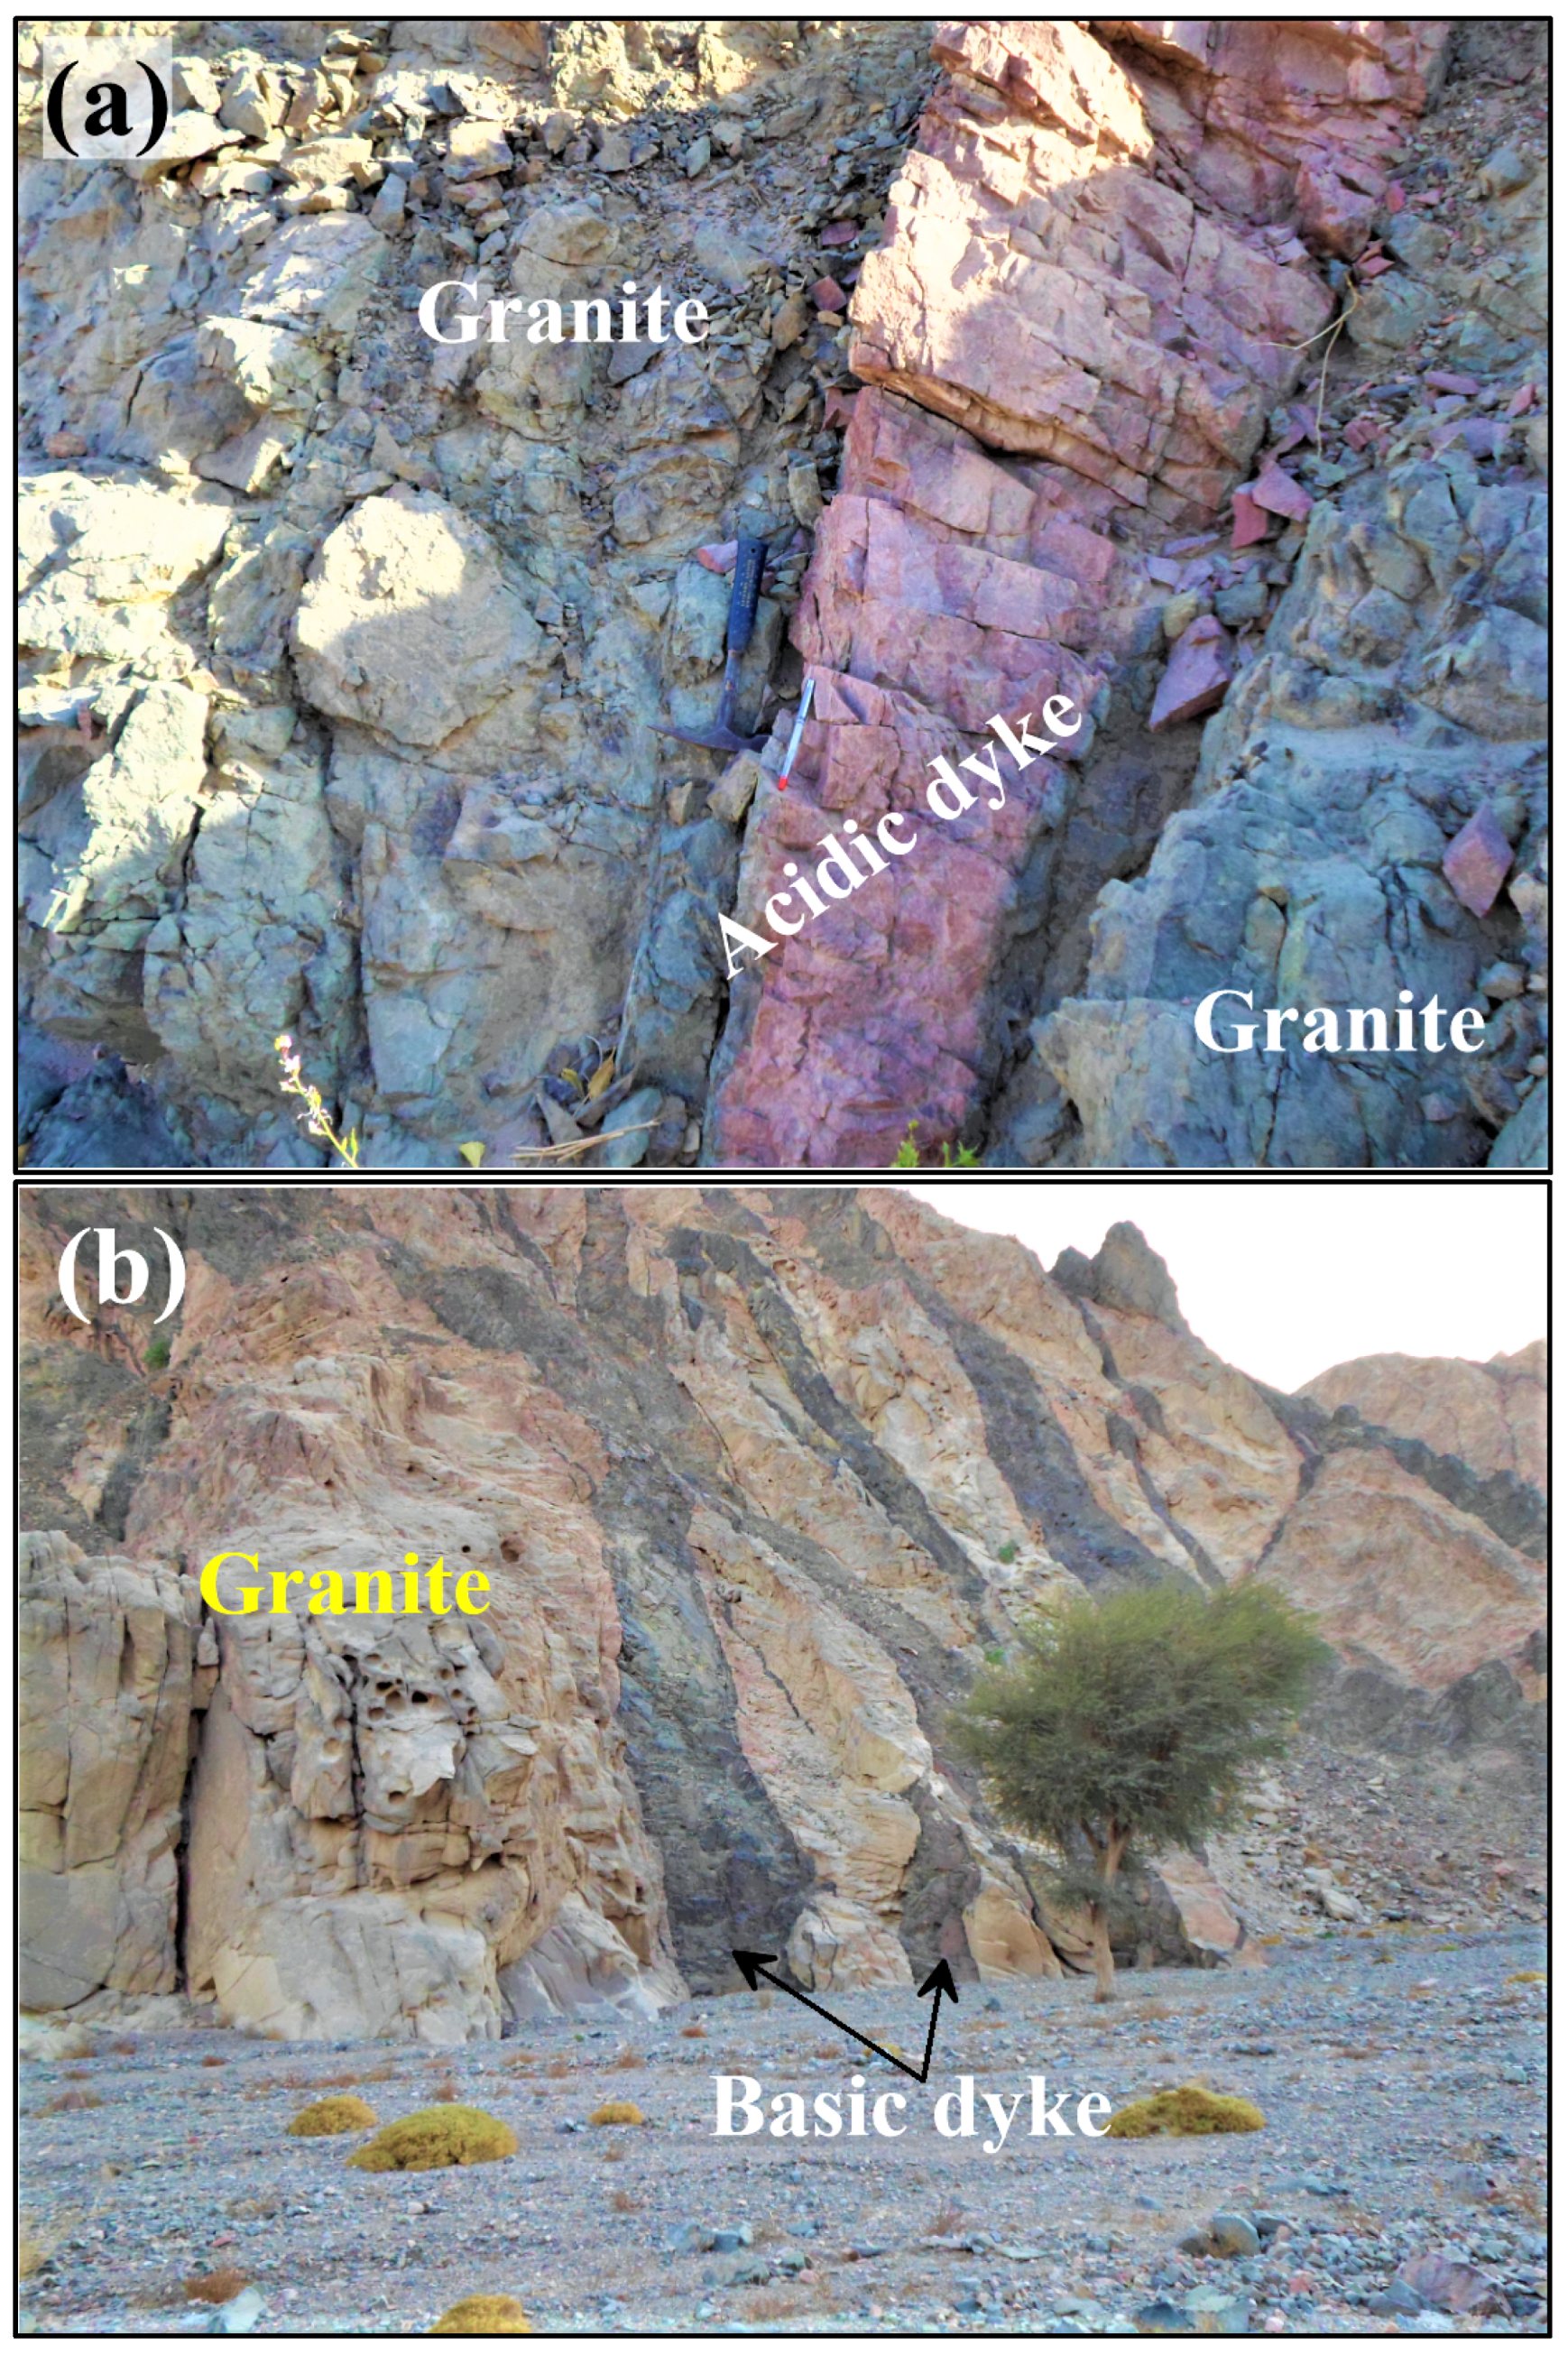
4.2.1. Fieldwork
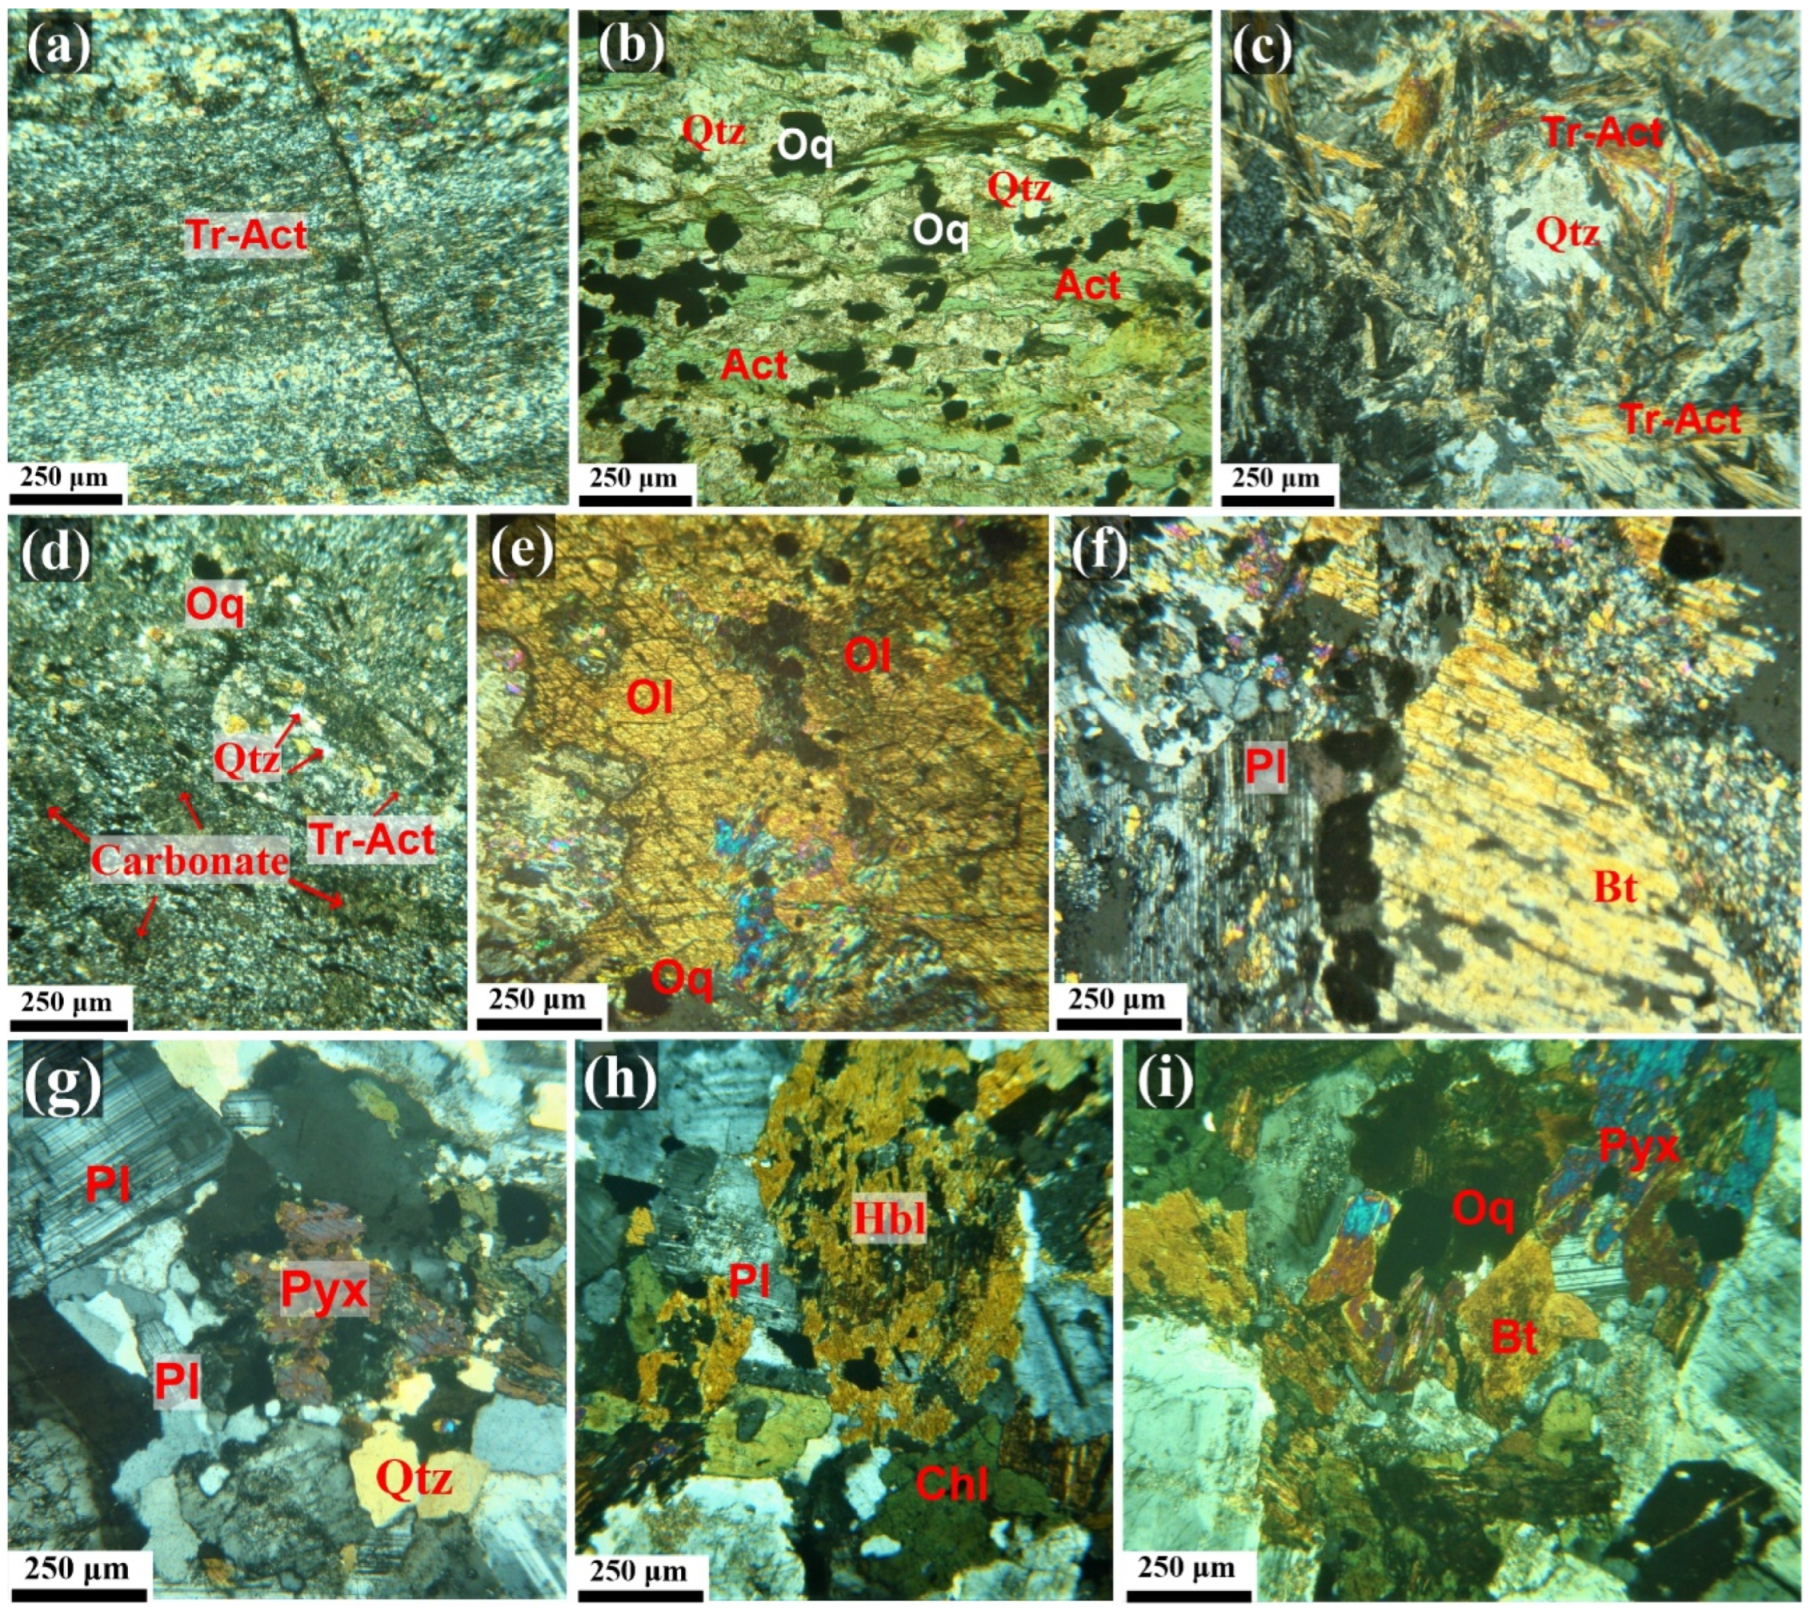
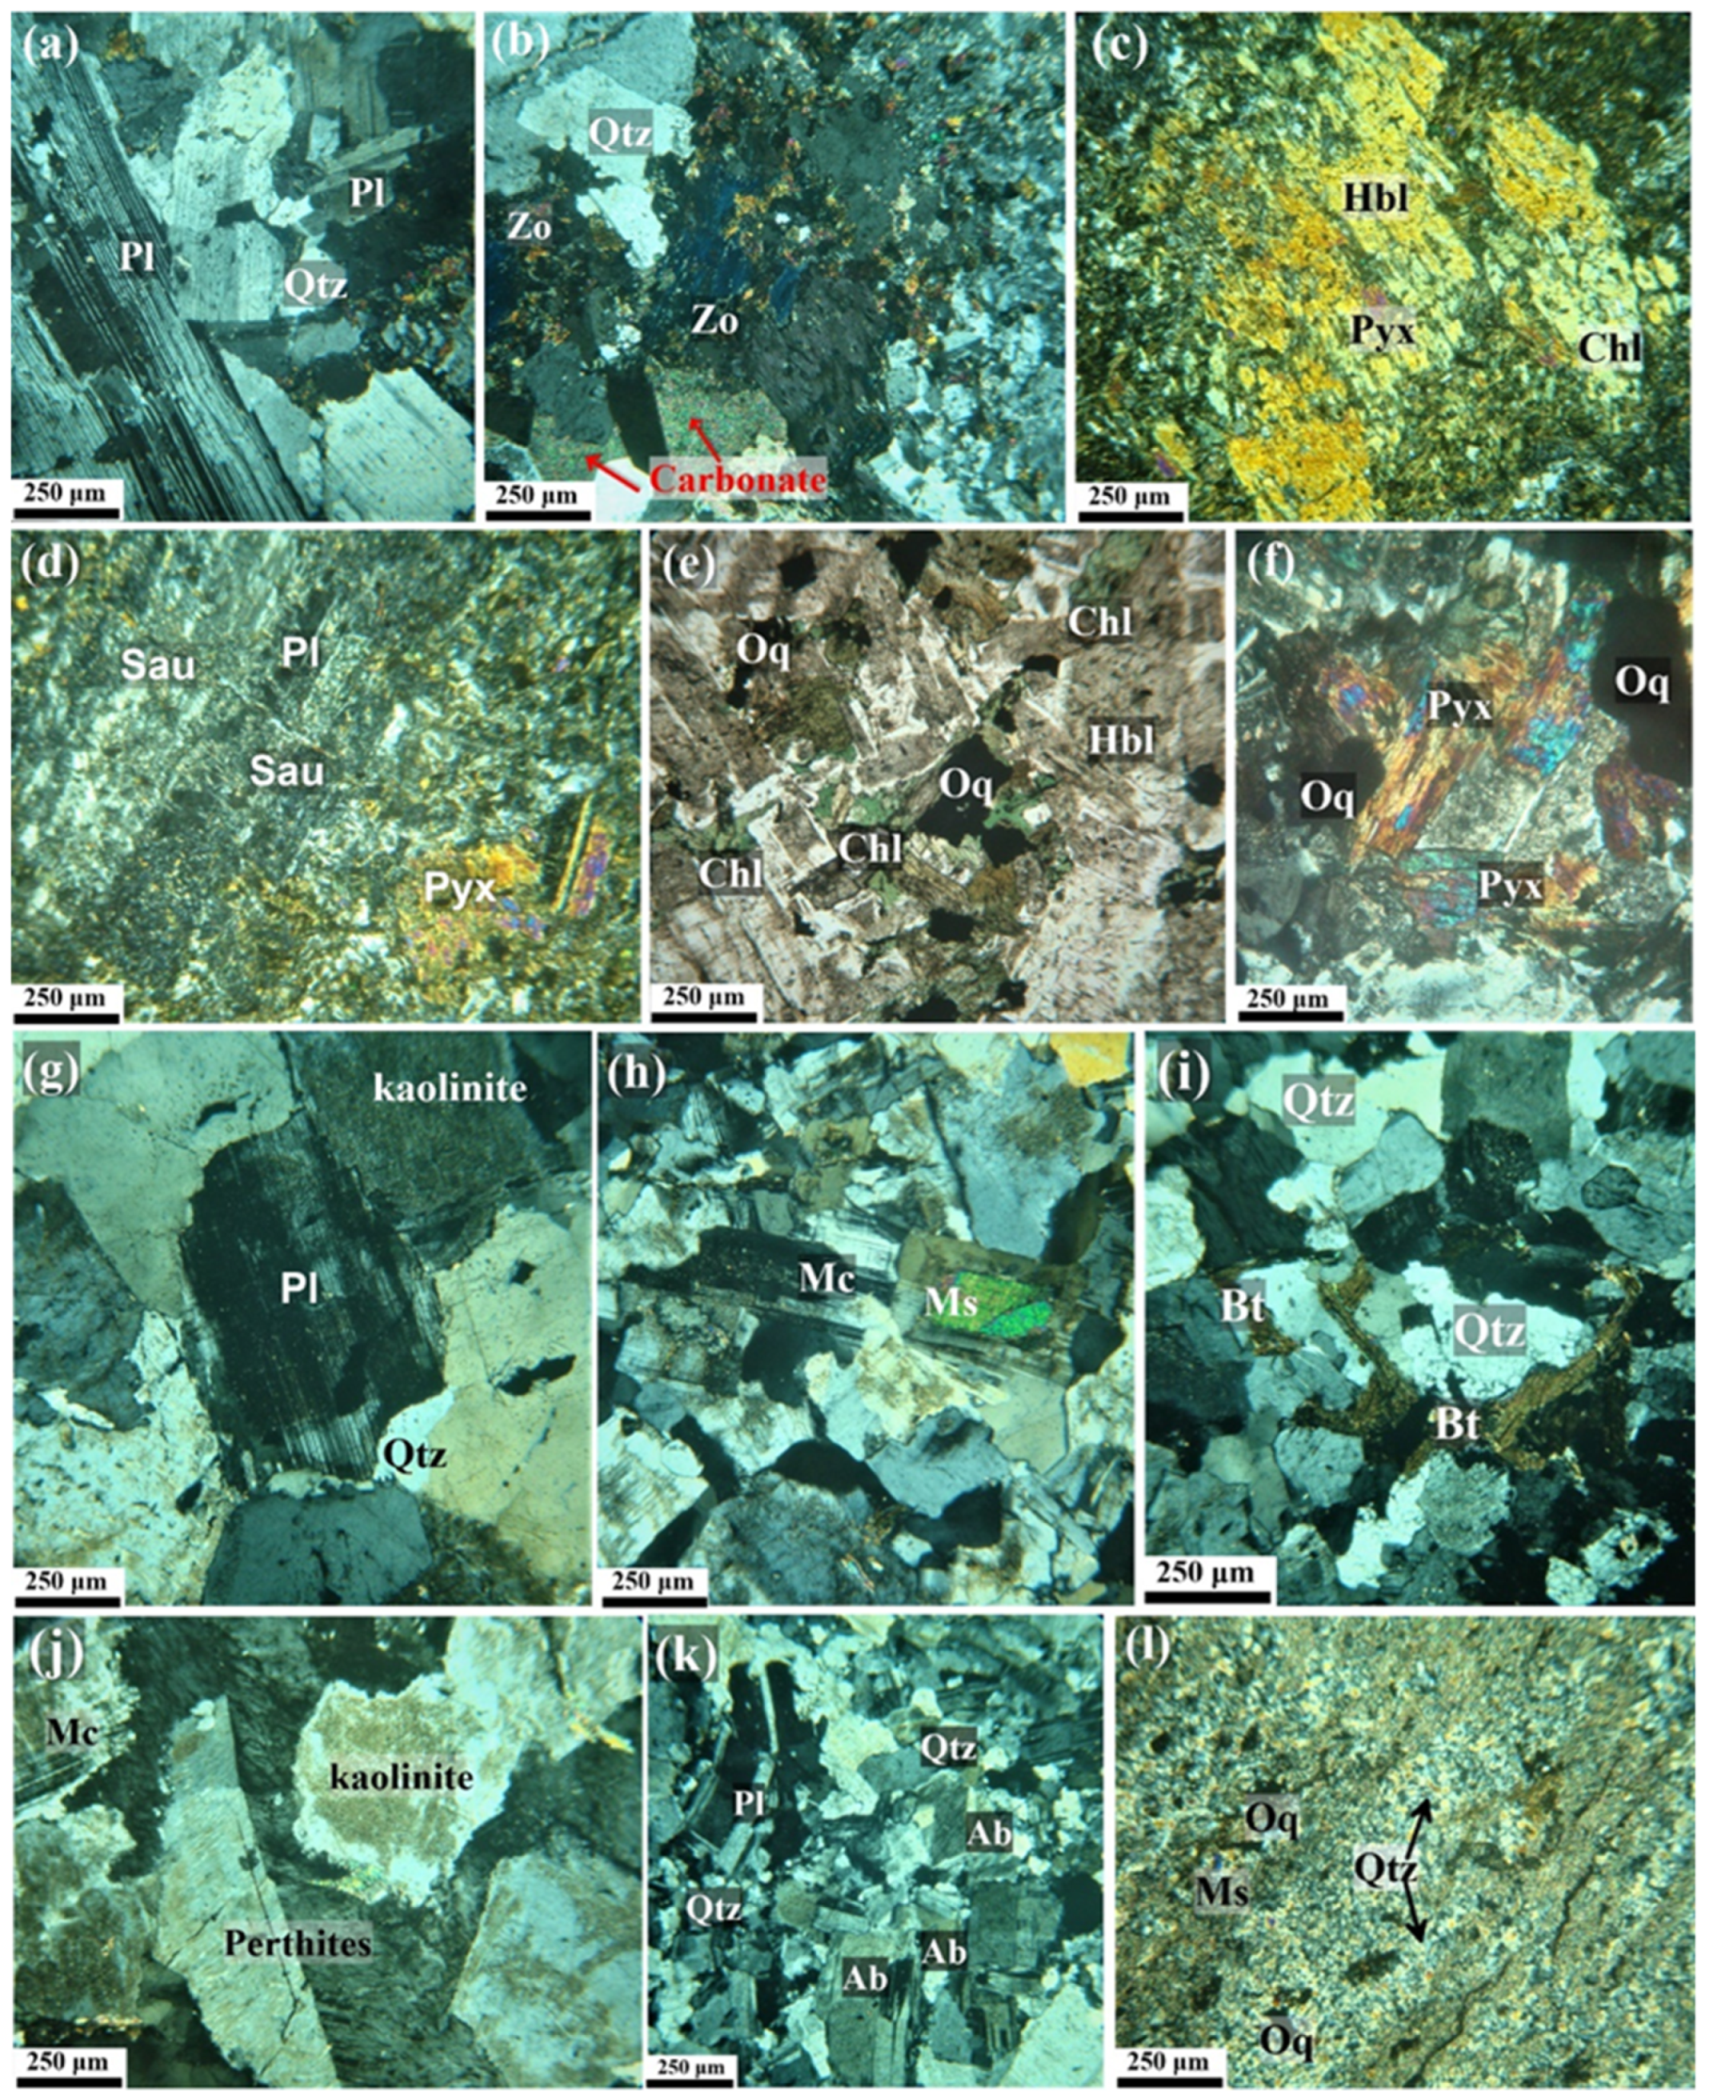
4.2.2. Petrographic Studies
4.2.3. Metasediment Rocks (Tremolite–Actinolite Schists)
4.2.4. Plutonic Rocks
- (A)
- Shahira gabbros
- (B)
- Diorites
- (C)
- Syenogranites
- (D)
- Albitites
4.3. Geochemical Studies
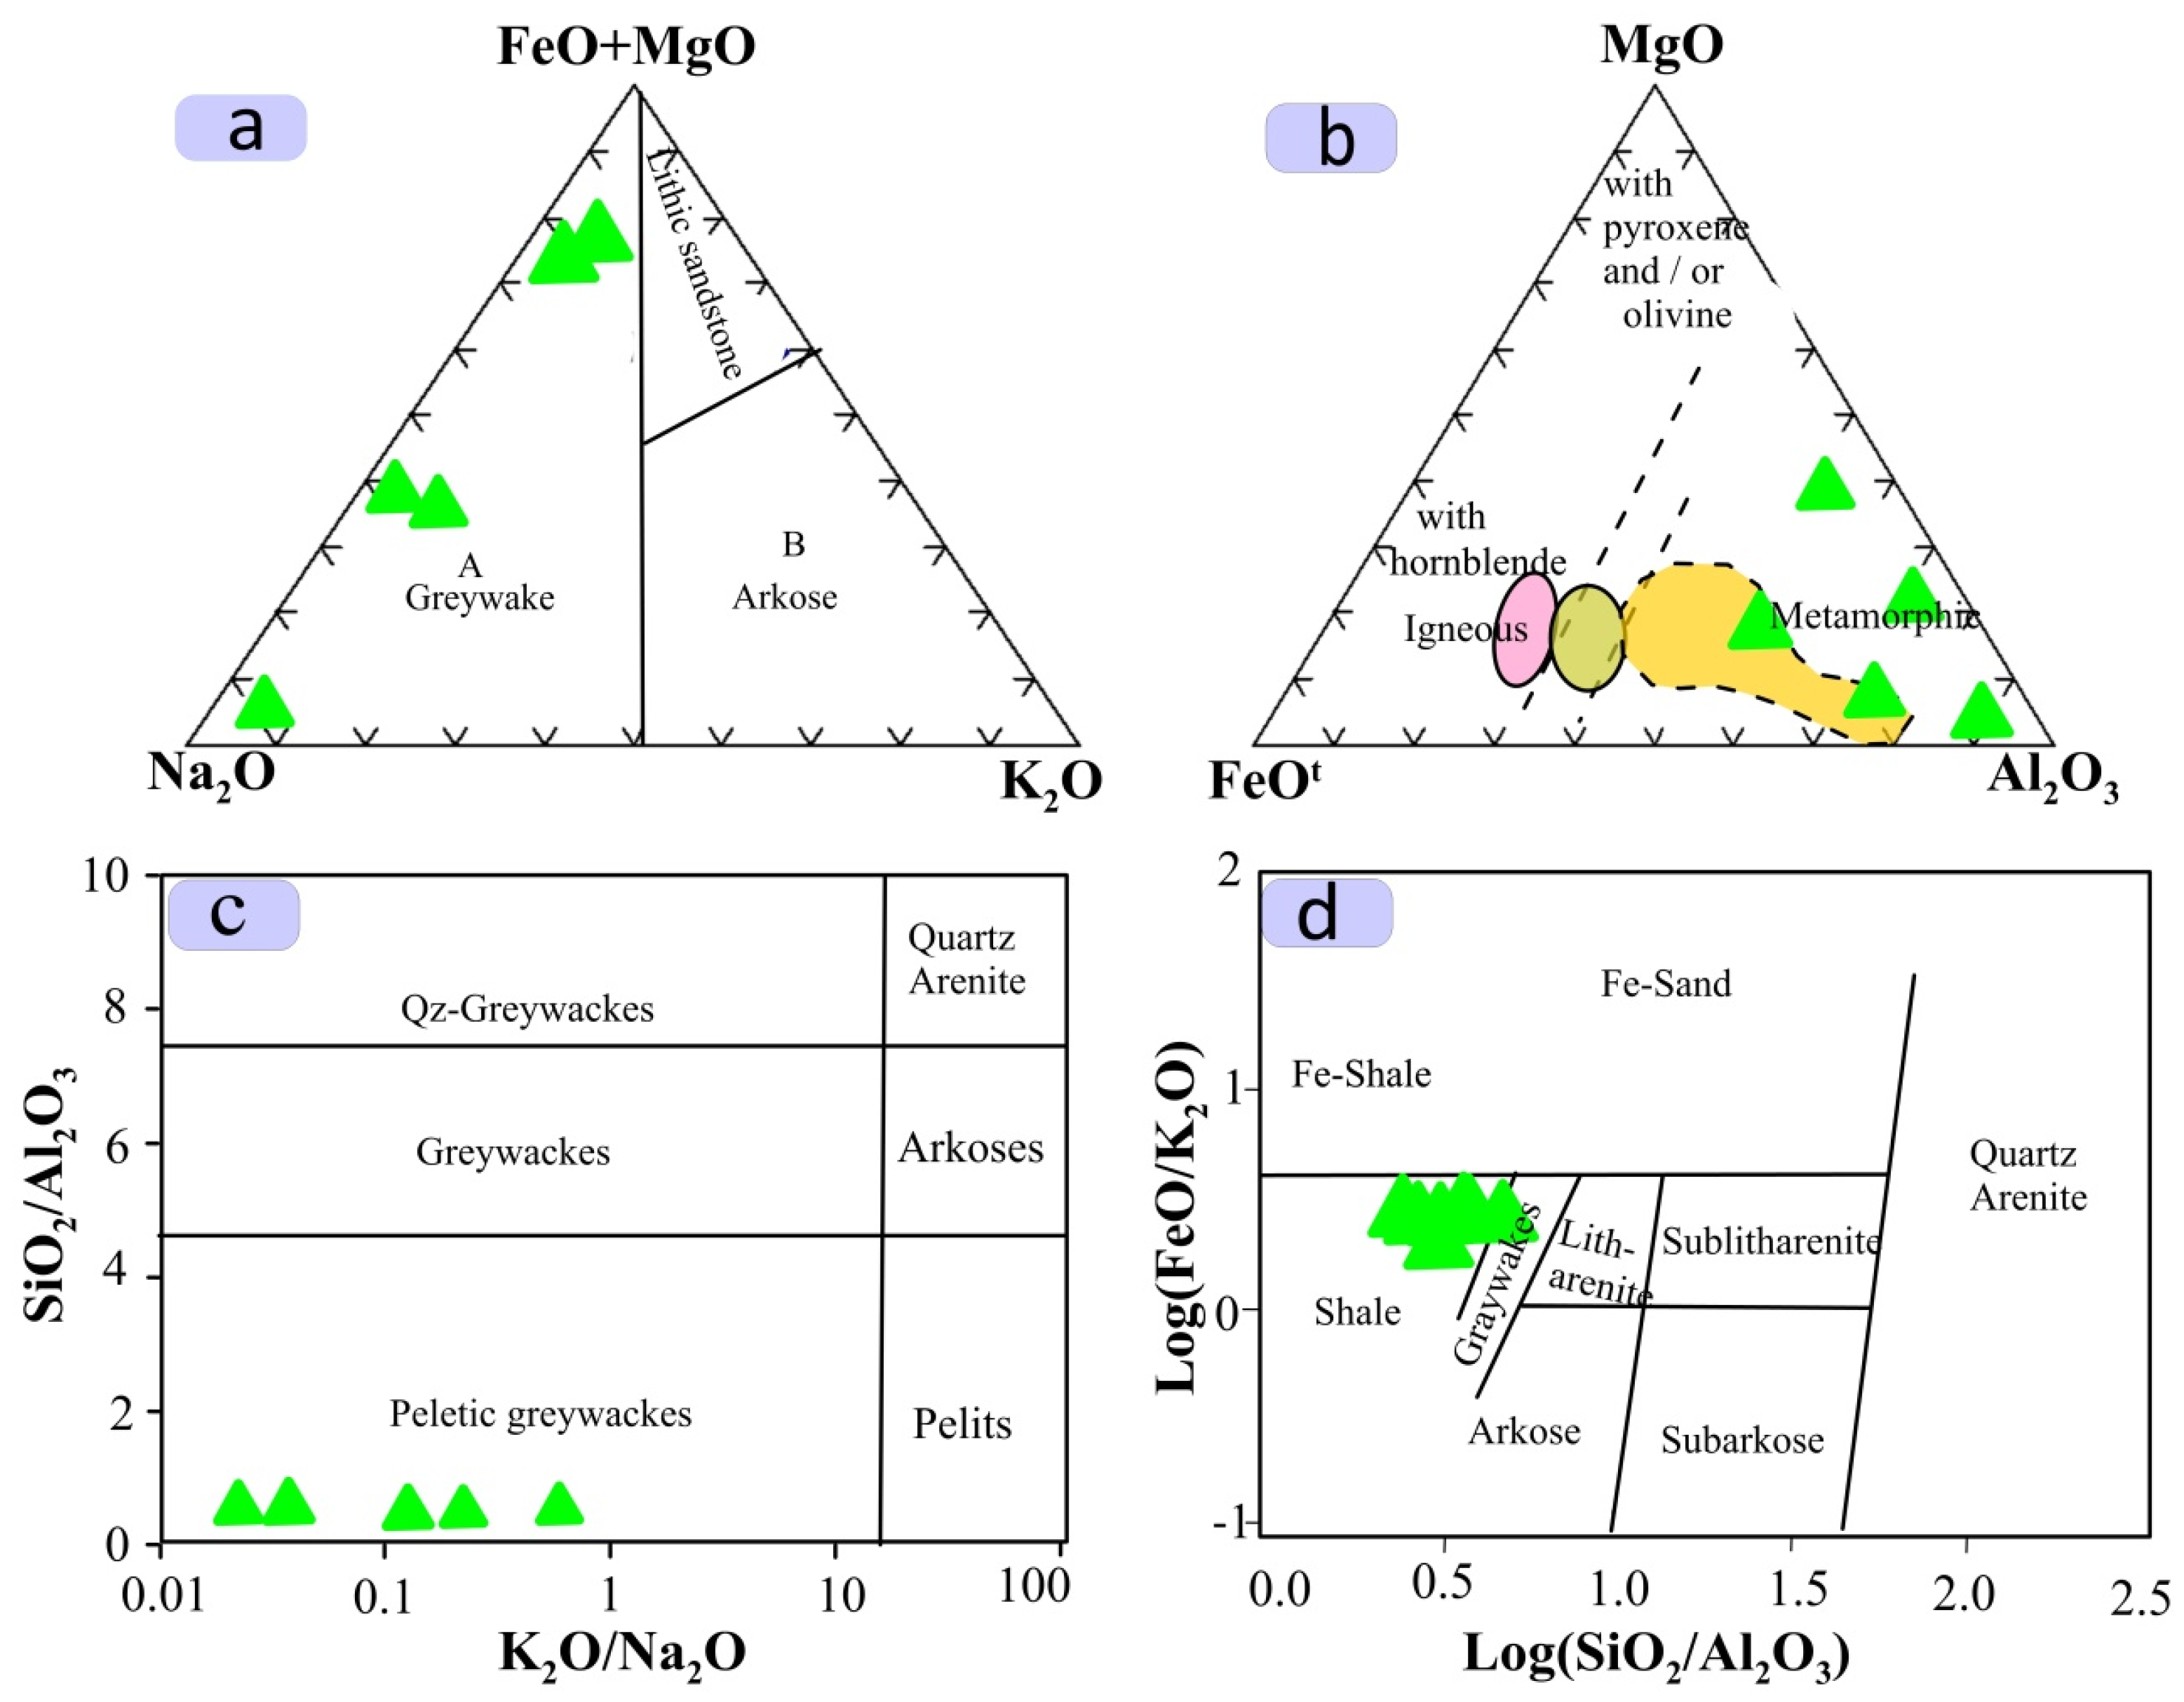
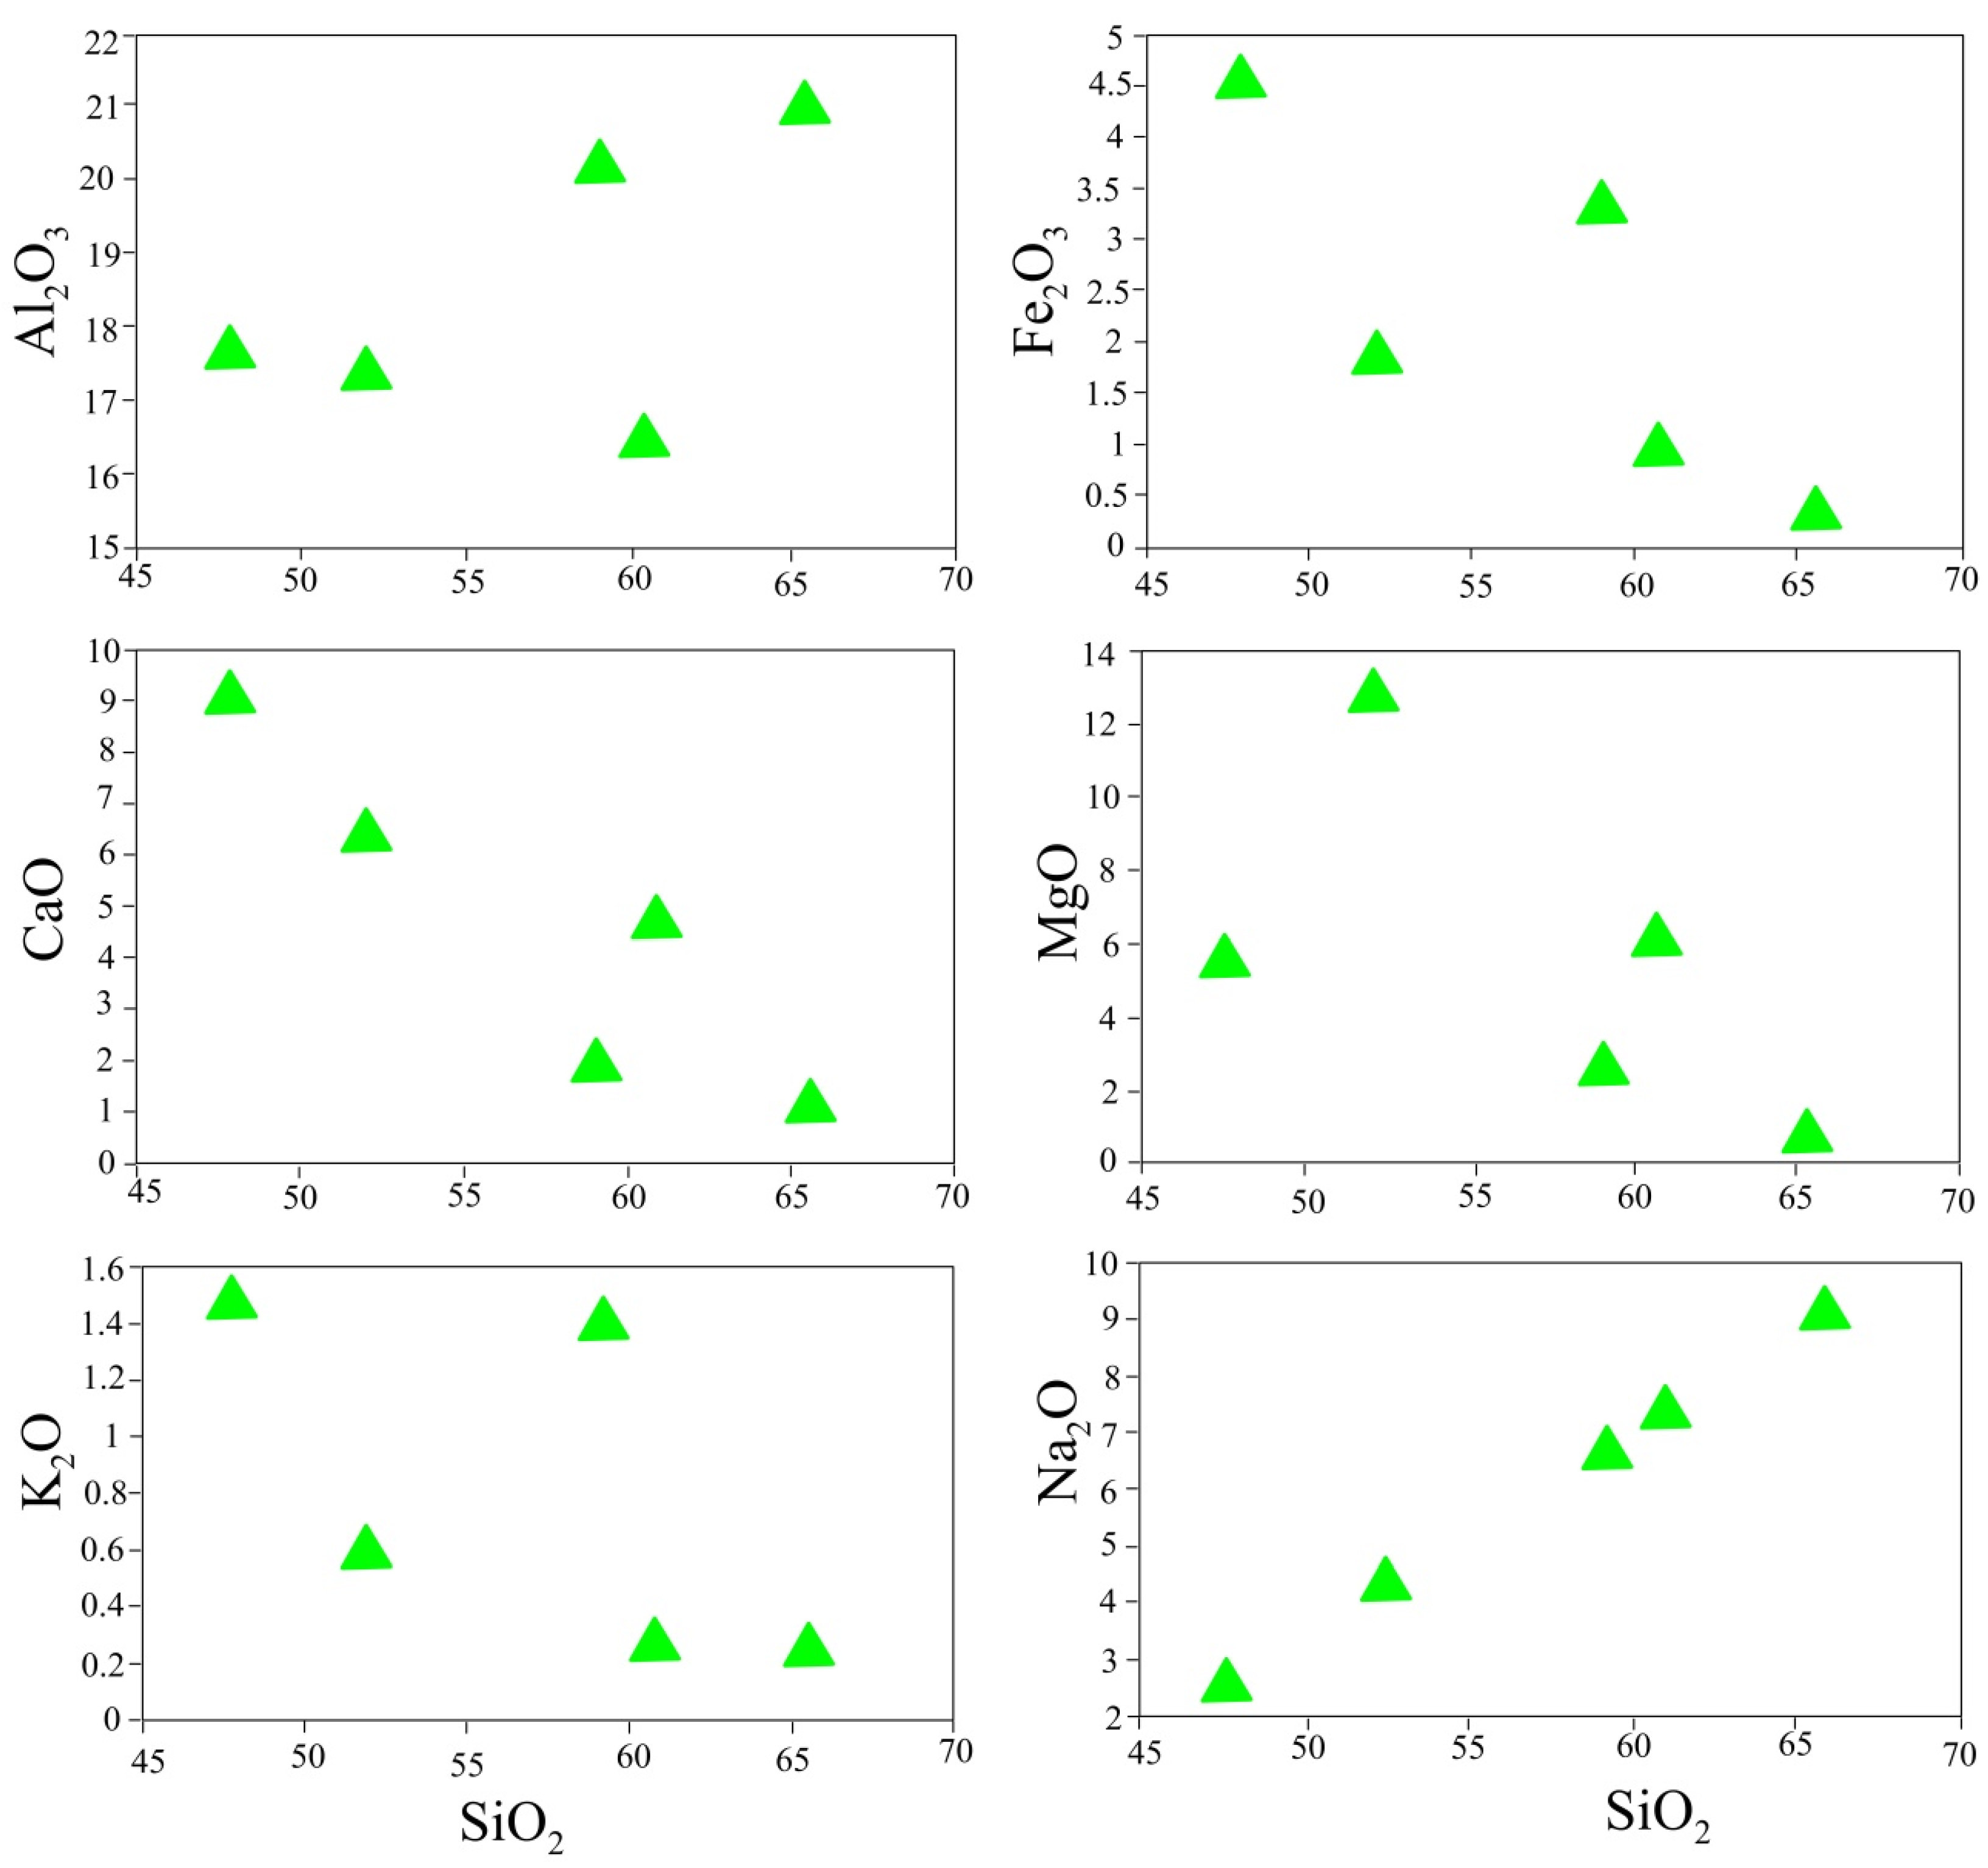
4.3.1. Metasediments
- (a)
- Major and Trace Elements
- (b)
- Geochemical Origin of the Metasediments
- (c)
- Harker Diagrams
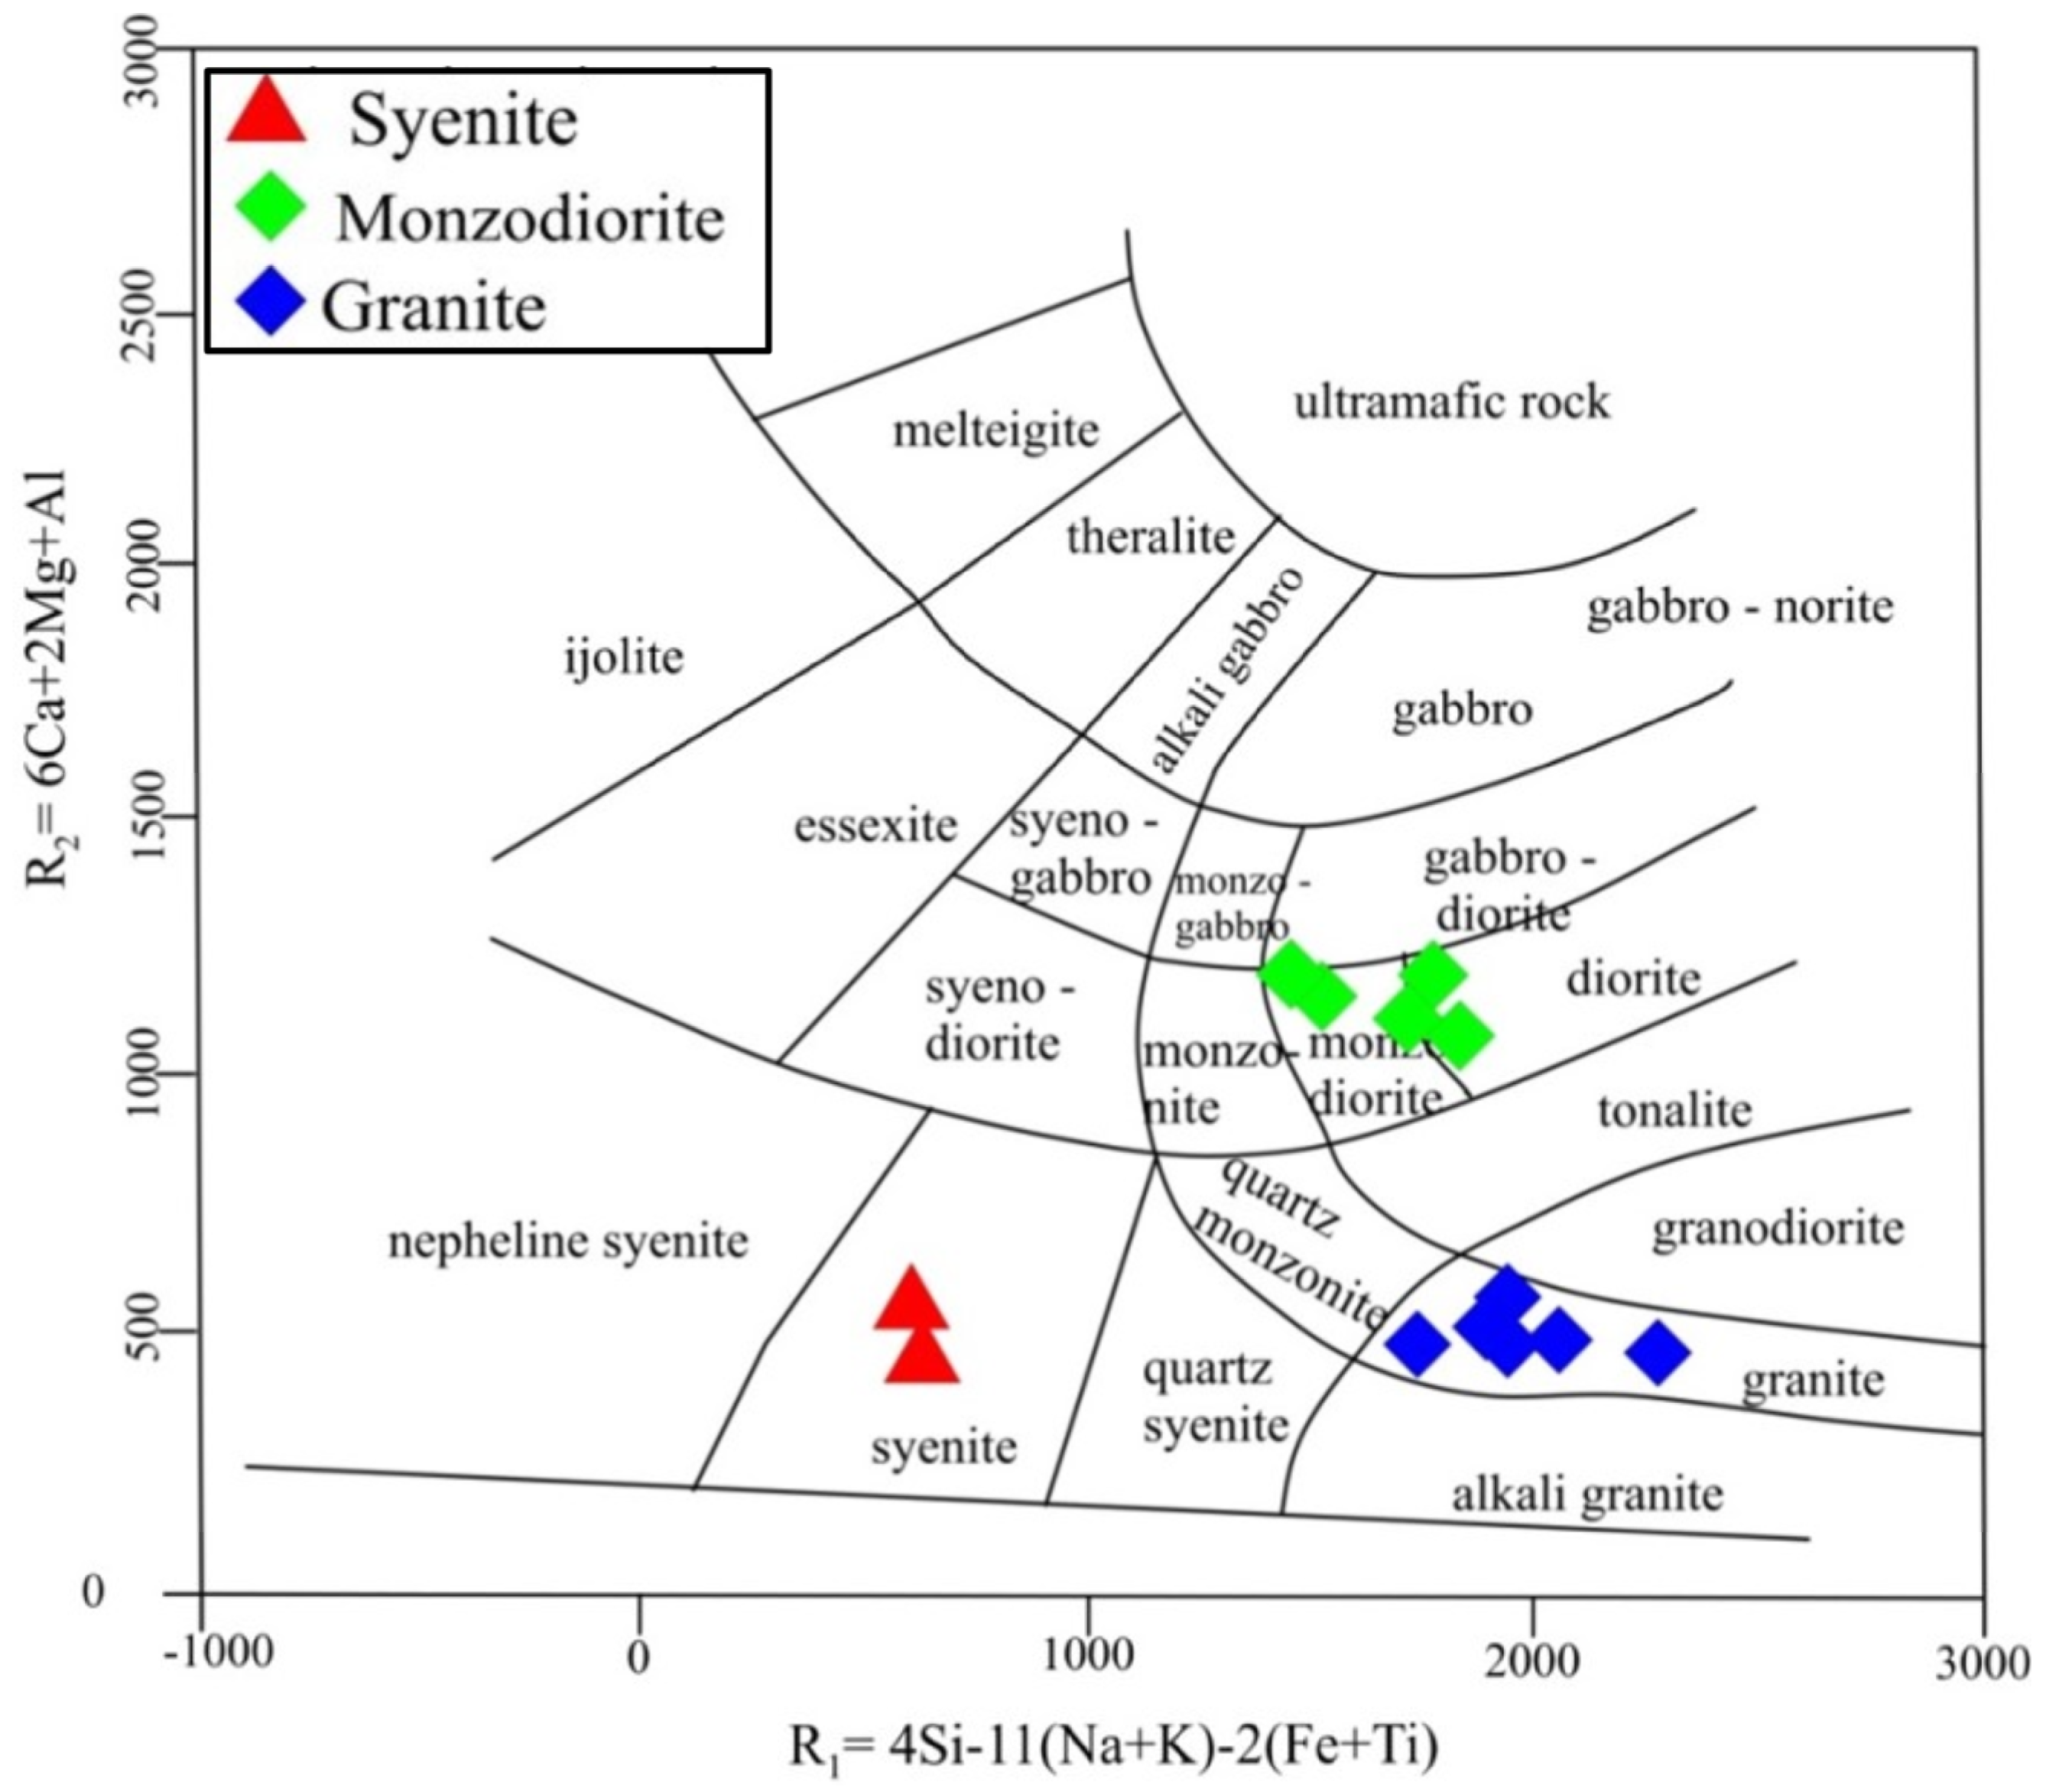
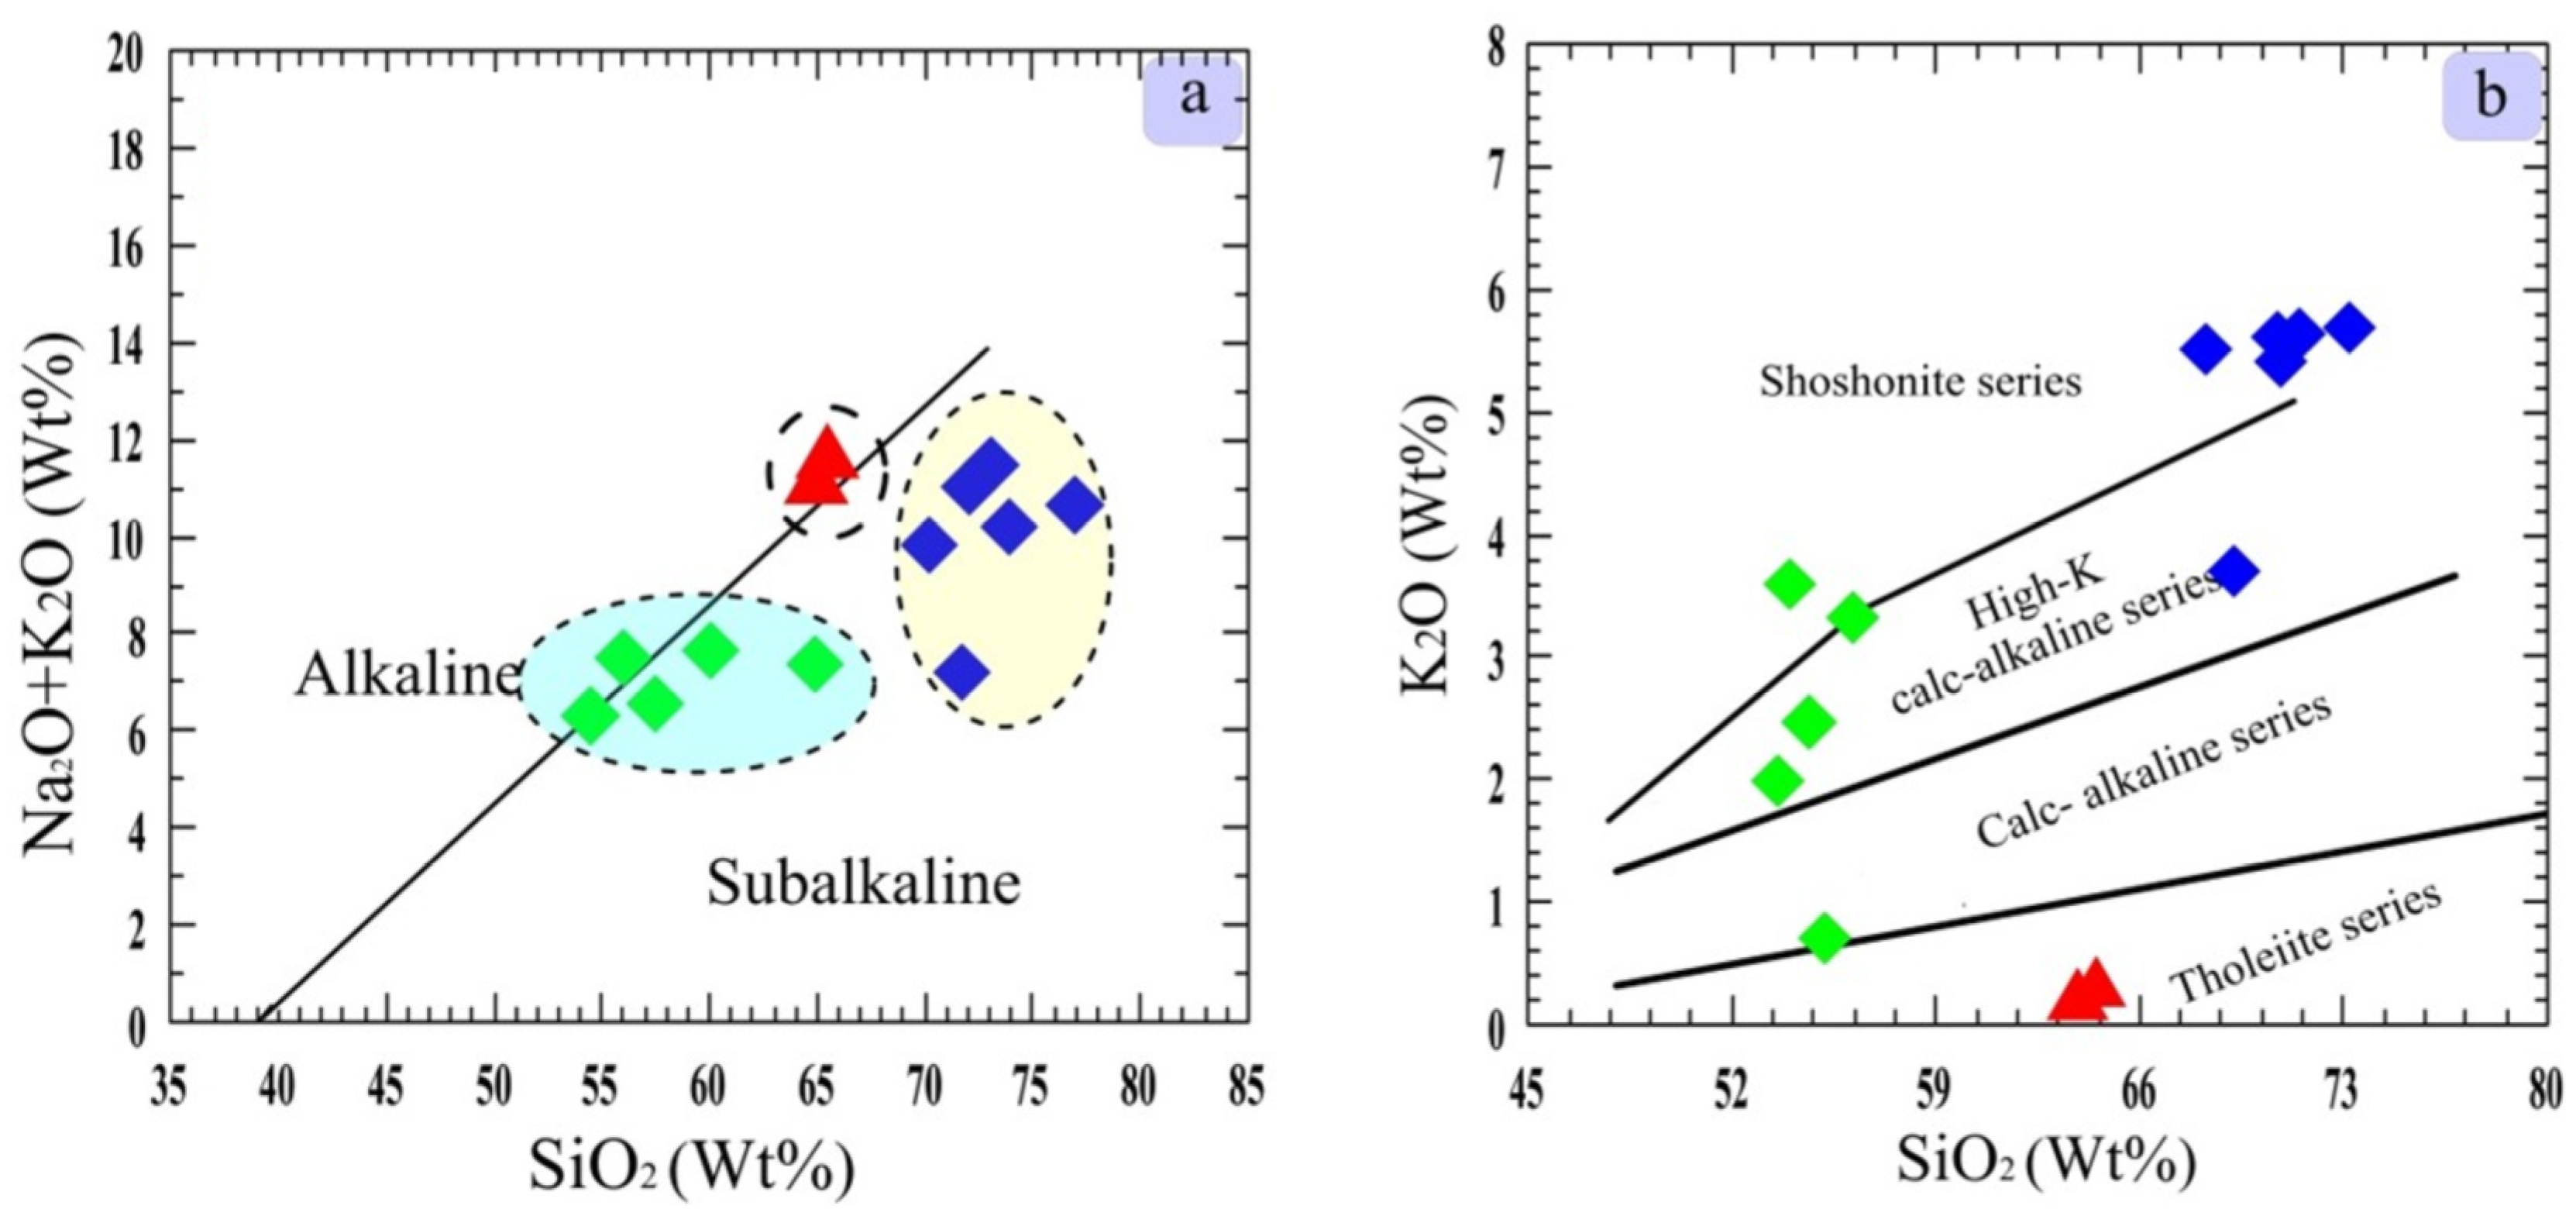
4.3.2. Intrusive Rocks
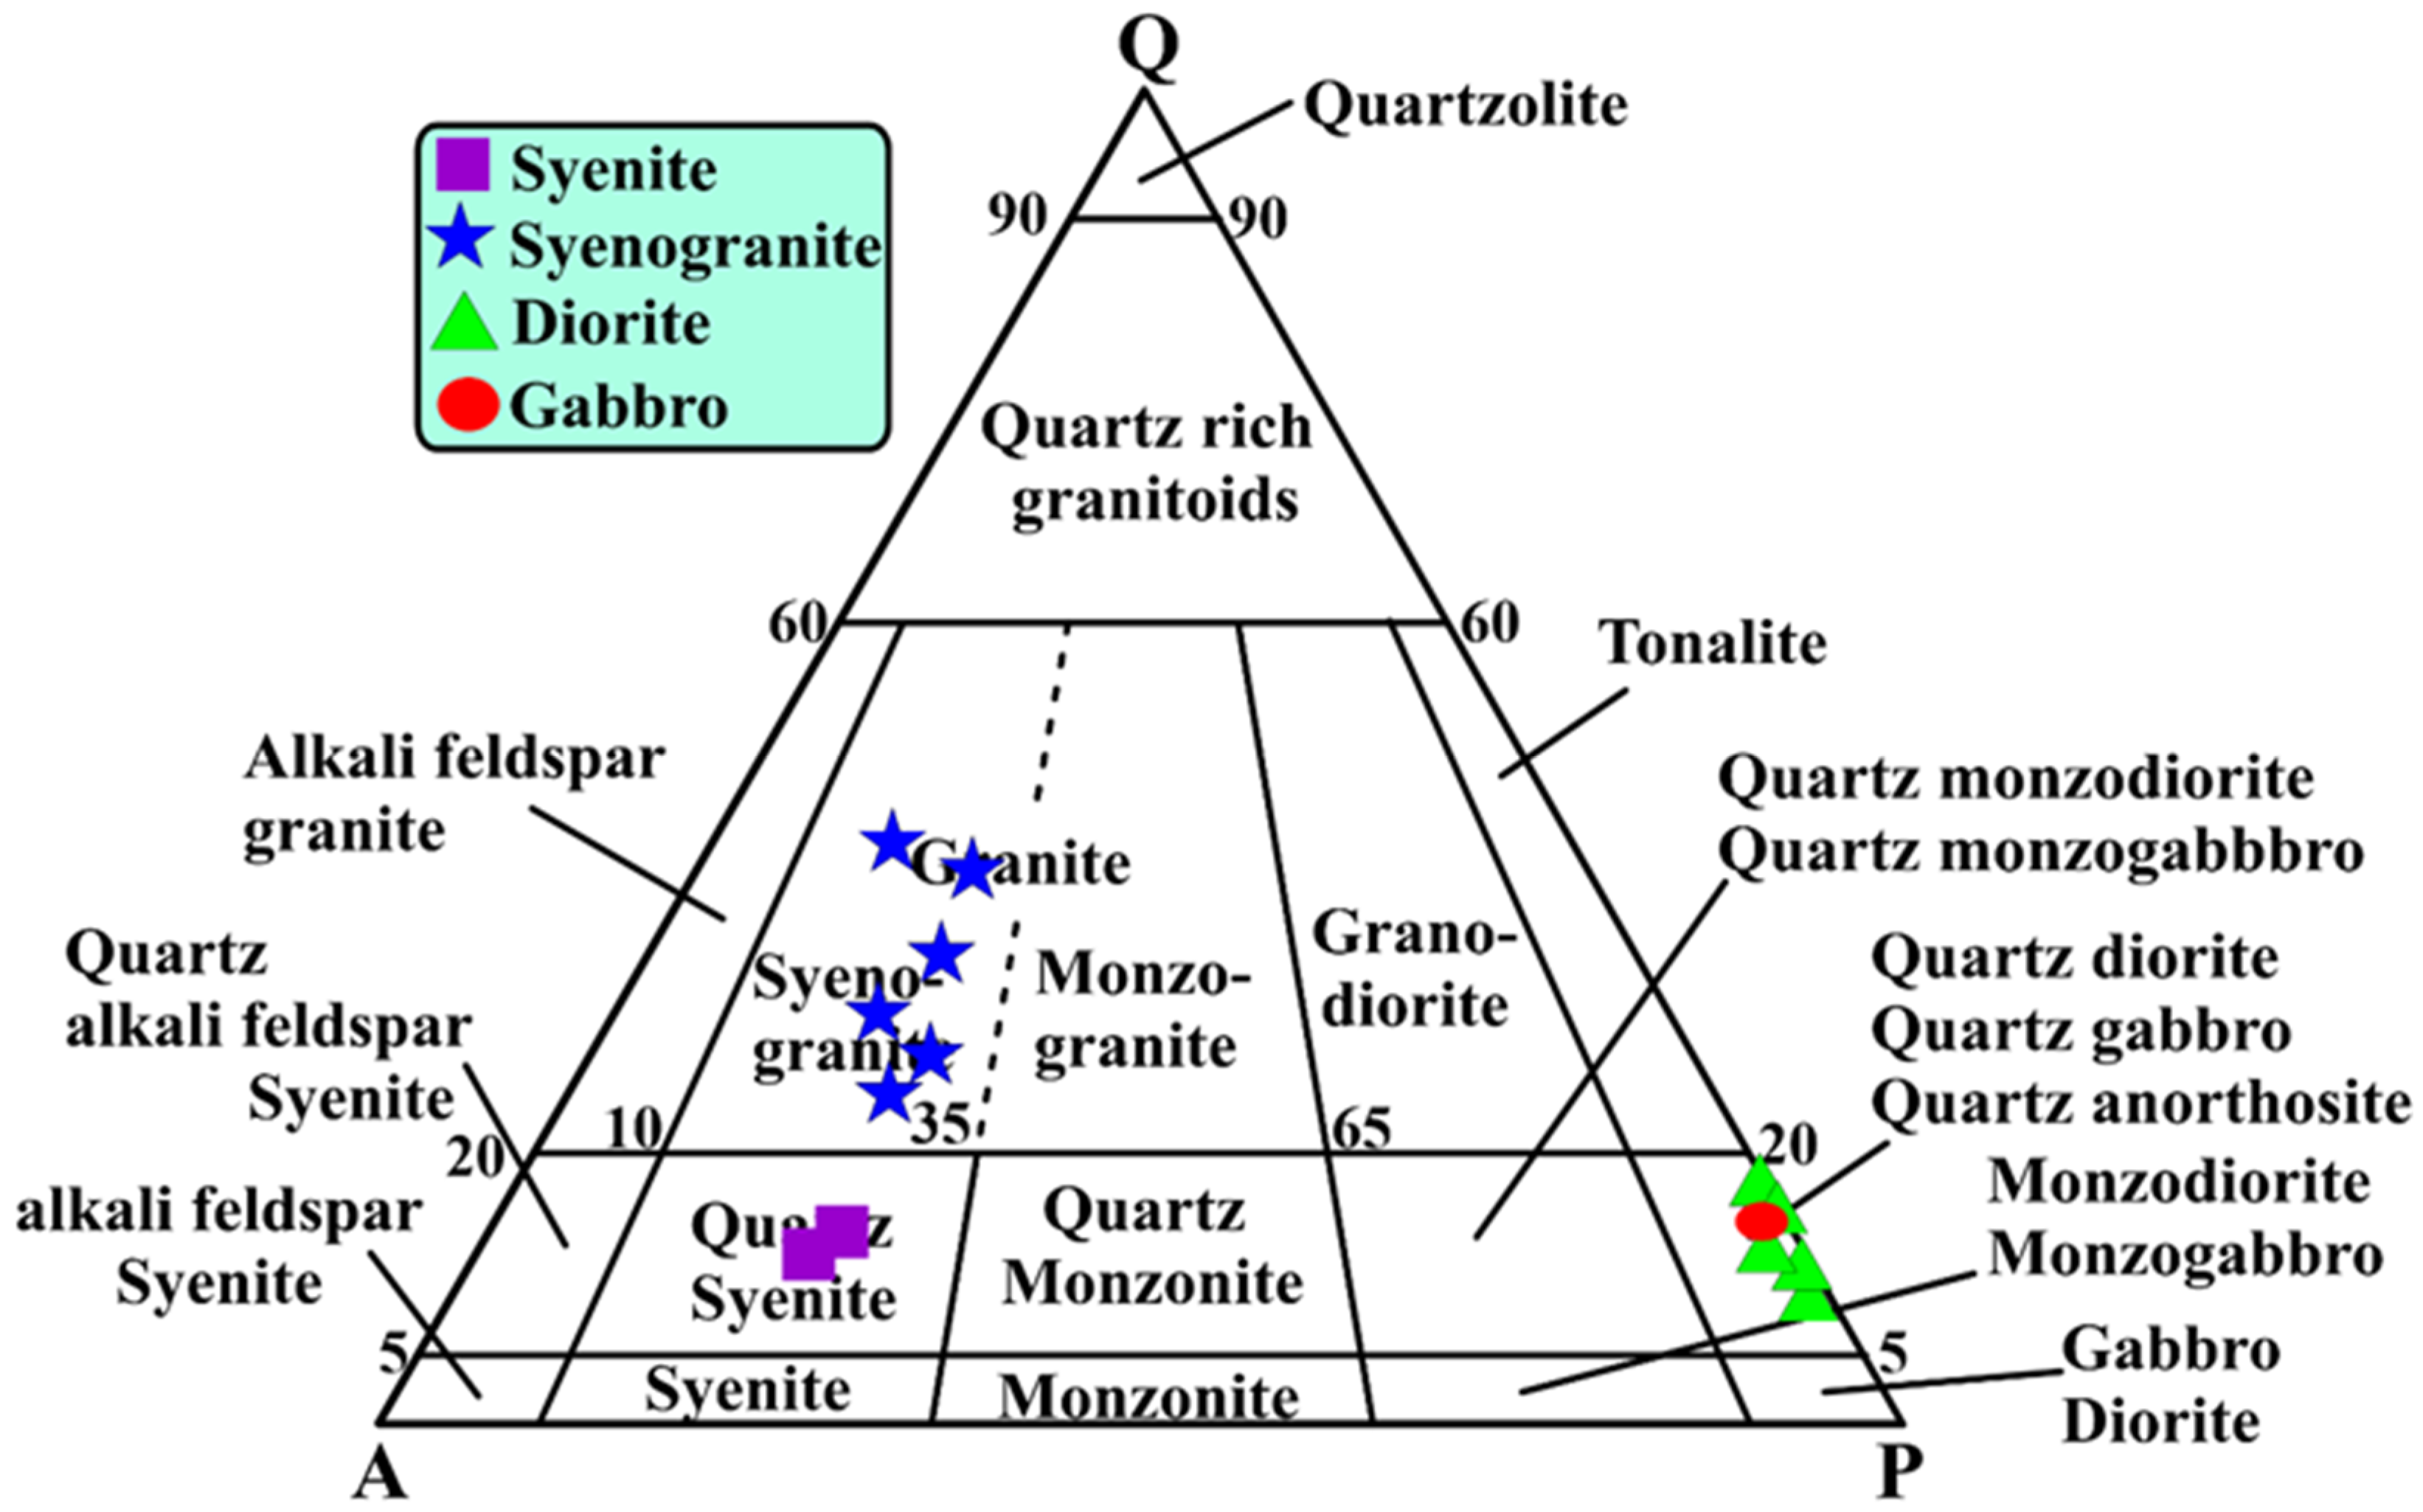
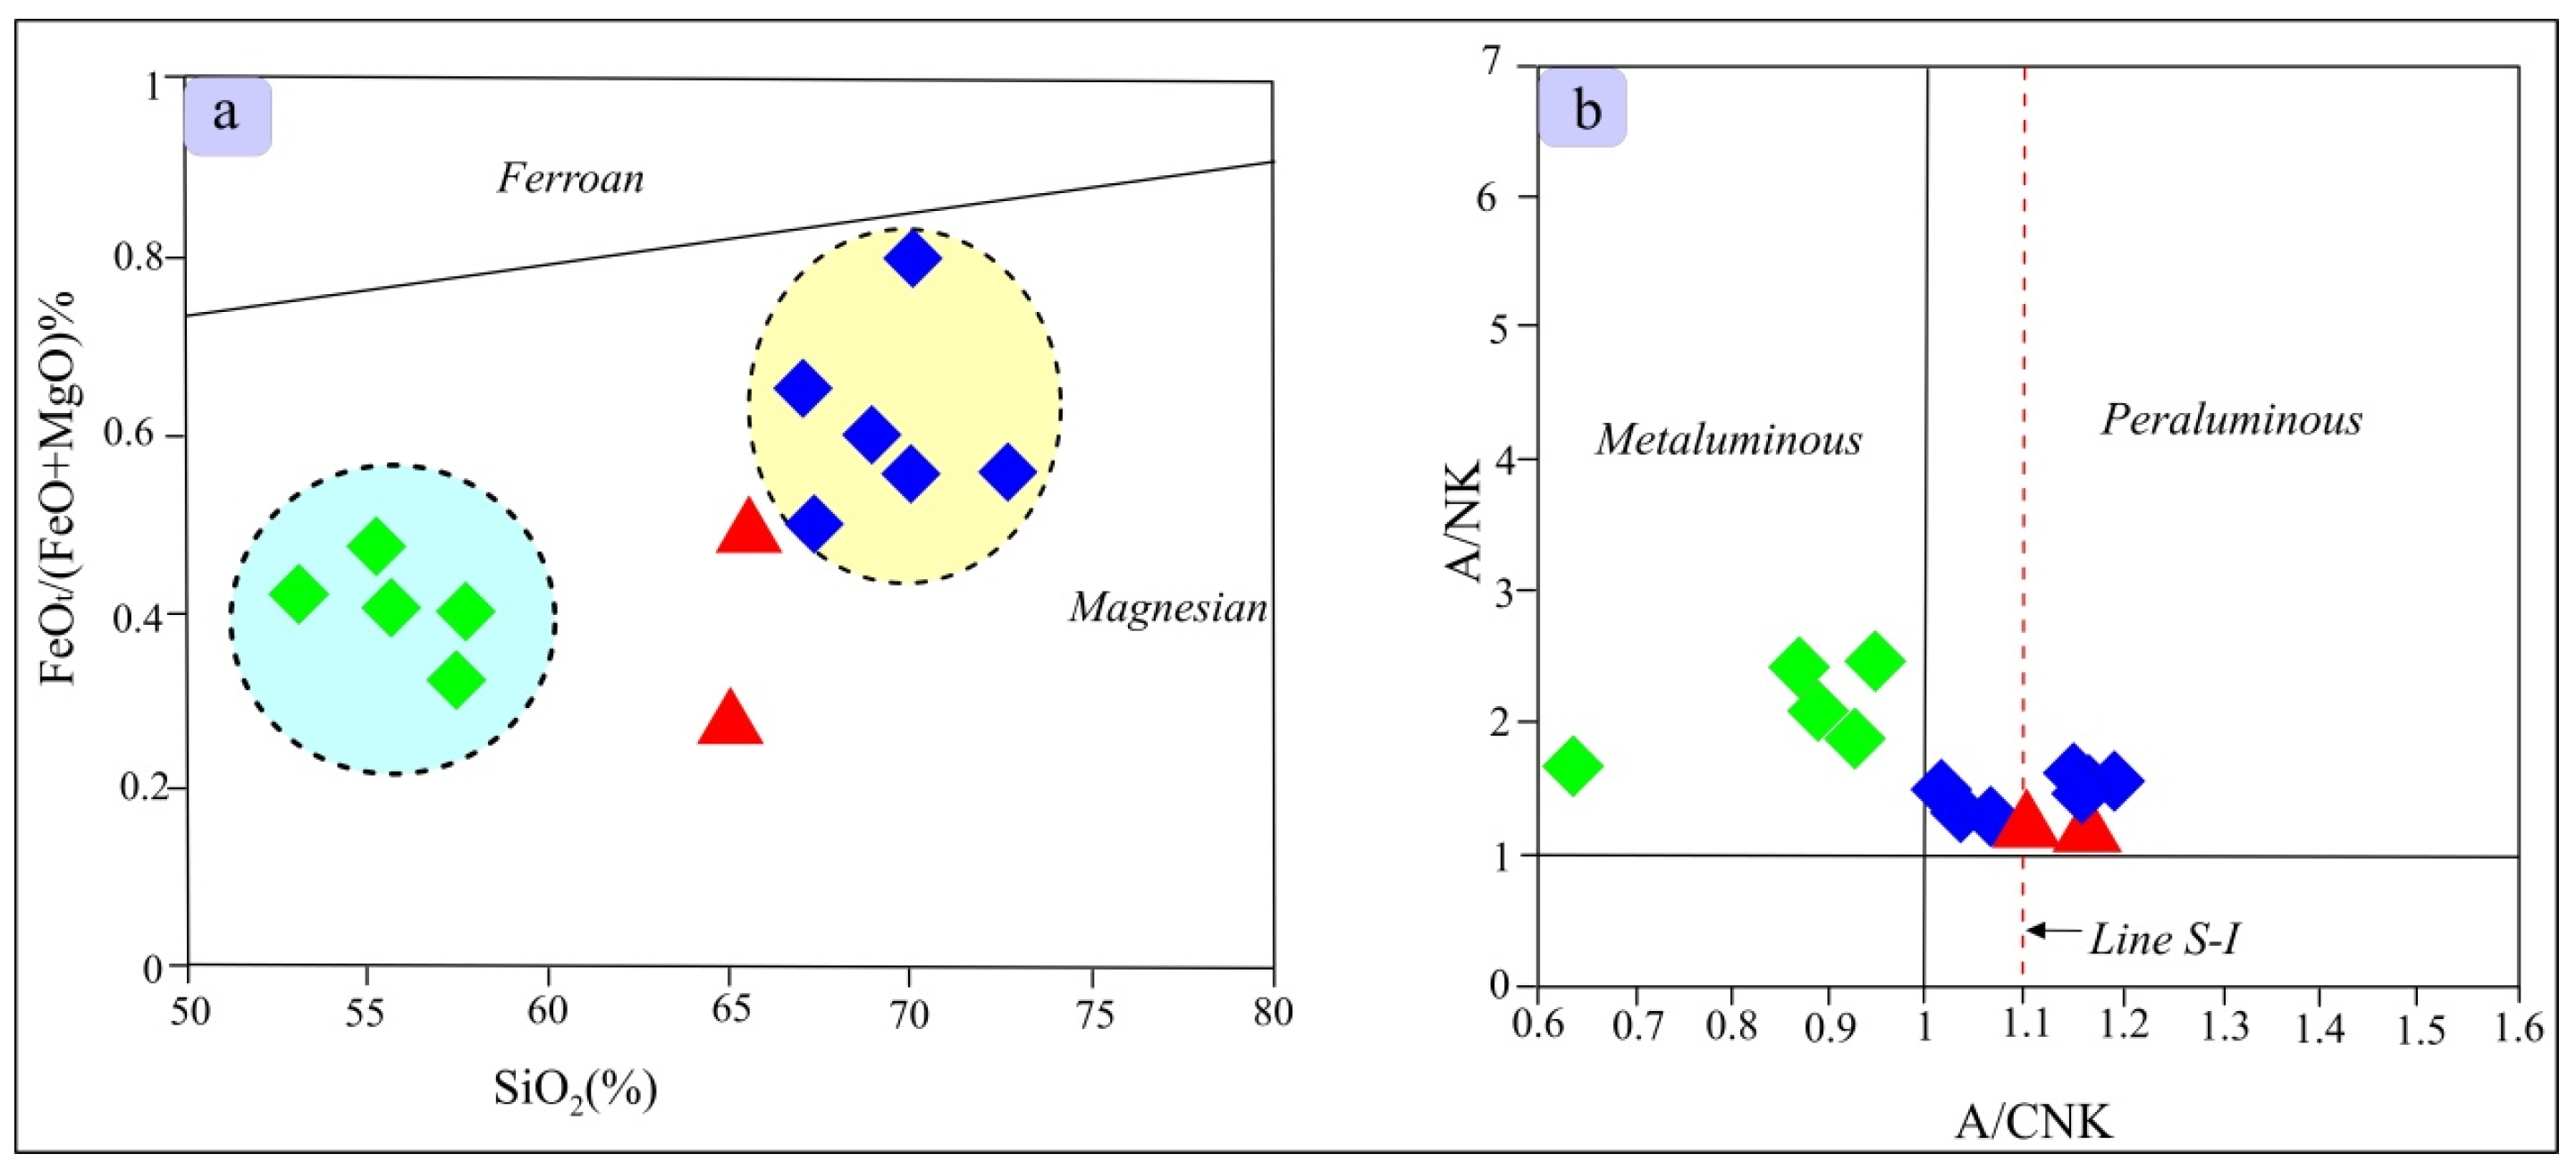
- (a)
- Classification and Magma Type
- (b)
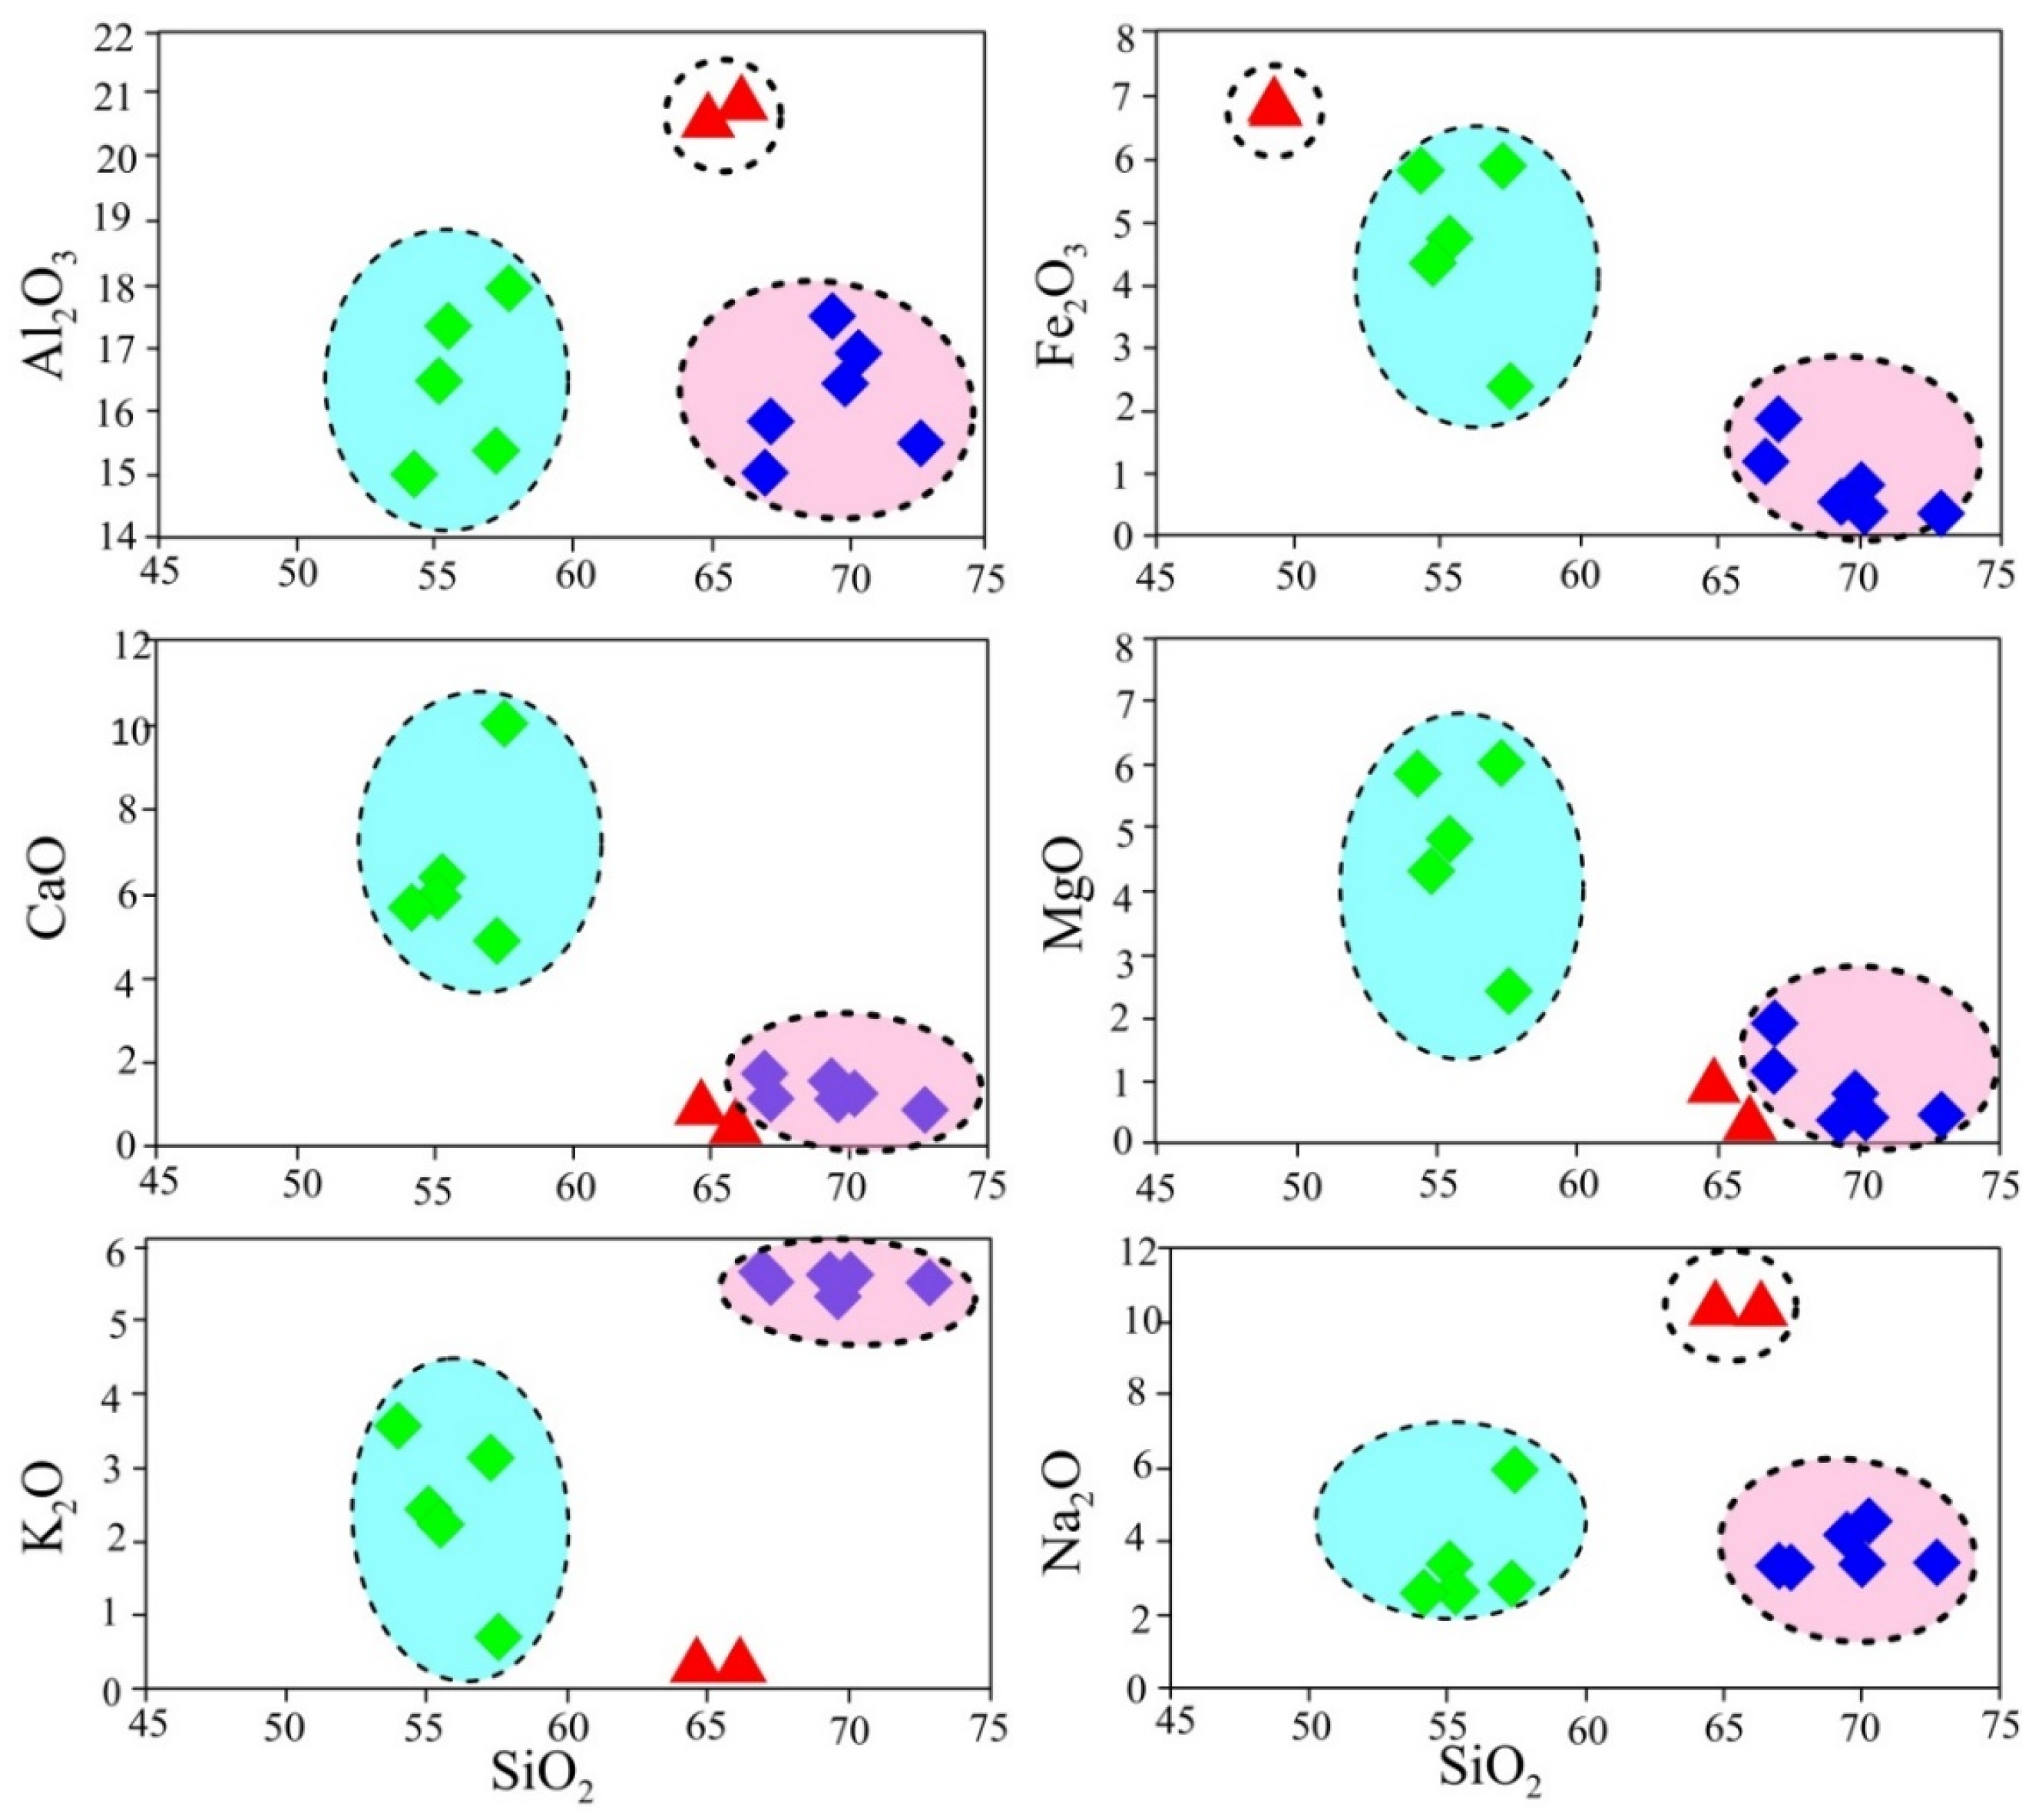
- Harker Diagrams
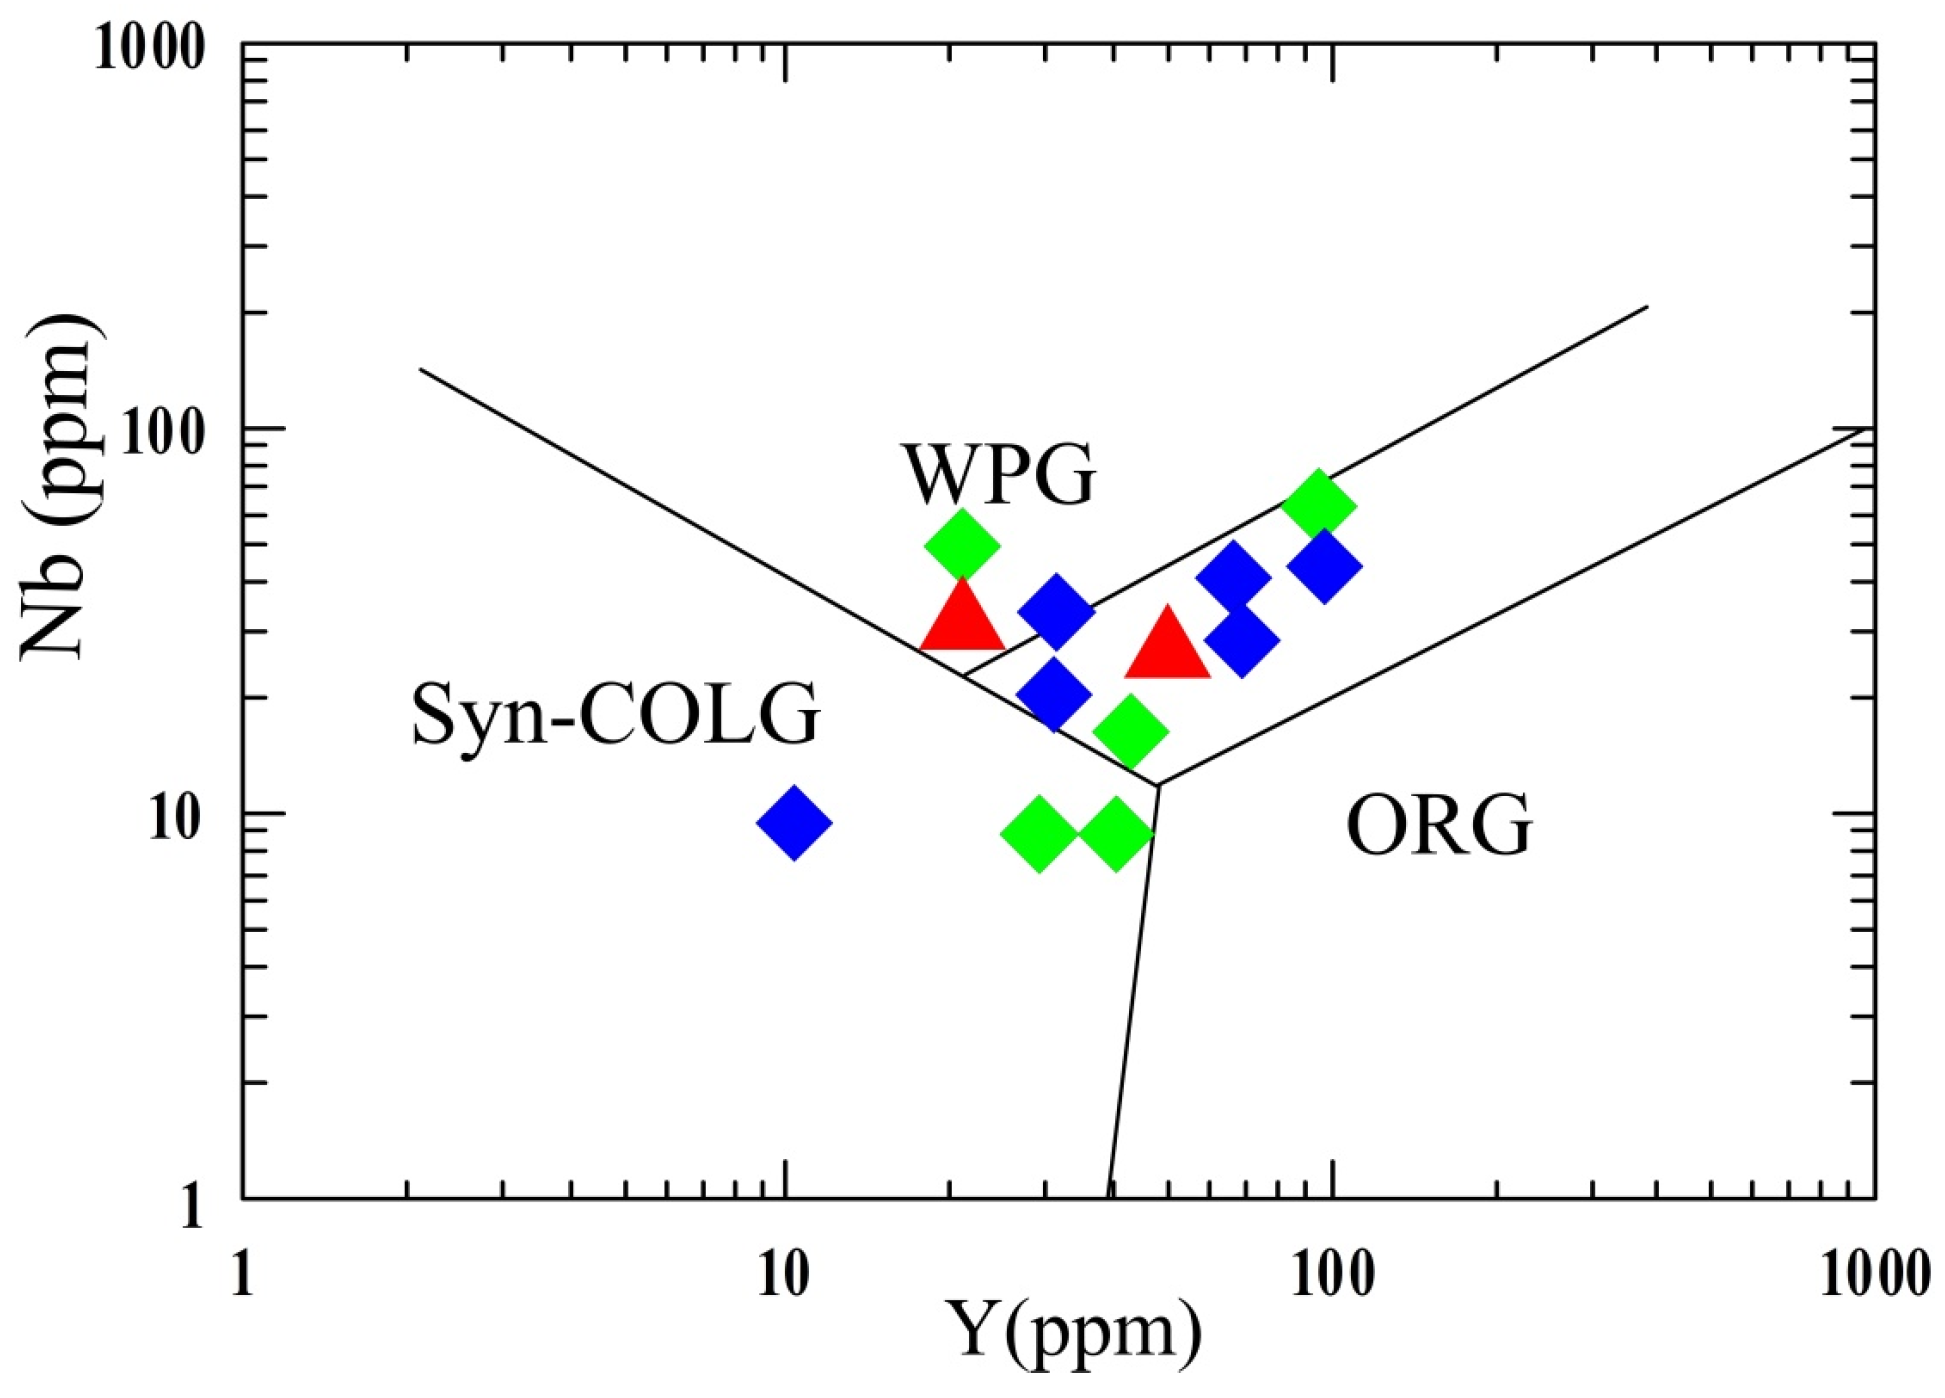
- (c)
- Tectonic Environment
5. Conclusions
Author Contributions
Funding
Conflicts of Interest
References
- Ninomiya, Y.; Fu, B.; Cudahy, T.J. Detecting lithology with Advanced Spaceborne Thermal Emission and Reflection Radiometer (ASTER) multispectral thermal infrared “radiance-at-sensor” data. Remote Sens. Environ. 2005, 99, 127–139. [Google Scholar] [CrossRef]
- Safari, M.; Maghsoudi, A.; Pour, A.B. Application of Landsat-8 and ASTER satellite remote sensing data for porphyry copper exploration: A case study from Shahr-e-Babak, Kerman, south of Iran. Geocarto Int. 2018, 33, 1186–1201. [Google Scholar] [CrossRef]
- Bachri, I.; Hakdaoui, M.; Raji, M.; Teodoro, A.C.; Benbouziane, A. Machine learning algorithms for automatic lithological mapping using remote sensing data: A case study from Souk Arbaa Sahel, Sidi Ifni Inlier, western anti-Atlas. Moroc. Int. J. Geoinf. 2019, 8, 248. [Google Scholar] [CrossRef]
- Beiranvand Pour, A.; Park, Y.; Crispini, L.; Läufer, A.; Kuk Hong, J.; Park, T.Y.; Zoheir, B.; Pradhan, B.; Muslim, A.M.; Hossain, M.S.; et al. Mapping listvenite occurrences in the damage zones of Northern Victoria Land, Antarctica using ASTER satellite remote sensing data. Remote Sens. 2019, 11, 1408. [Google Scholar] [CrossRef]
- Mushore, T.D.; Odindi, J.; Dube, T.; Matongera, T.N.; Mutanga, O. Remote sensing applications in monitoring urban growth impacts on in-and-out door thermal conditions: A review. Remote Sens. Appl. Soc. Environ. 2017, 8, 83–93. [Google Scholar] [CrossRef]
- Zhang, X.; Li, P. Lithological mapping from hyperspectral data by improved use of spectral angle mapper. Int. J. Appl. Earth Obs. Geoinf. 2014, 31, 95–109. [Google Scholar] [CrossRef]
- Masoumi, F.; Eslamkish, T.; Abkar, A.A.; Honarmand, M.; Harris, J.R. Integration of spectral, thermal, and textural features of ASTER data using Random Forests classification for lithological mapping. J. Afr. Earth Sci. 2017, 129, 445–457. [Google Scholar] [CrossRef]
- Pour, A.B.; Hashim, M.; Park, Y.; Hong, J.K. Mapping alteration mineral zones and lithological units in Antarctic regions using spectral bands of ASTER remote sensing data. Geocarto Int. 2018, 33, 1281–1306. [Google Scholar] [CrossRef]
- Zoheir, B.; El-Wahed, M.A.; Pour, A.B.; Abdelnasser, A. Orogenic gold in transpression and transtension zones: Field and remote sensing studies of the barramiya–mueilha sector, Egypt. Remote Sens. 2019, 11, 2122. [Google Scholar] [CrossRef]
- Zamyad, M.; Afzal, P.; Pourkermani, M.; Nouri, R.; Jafari, M.R. Determination of hydrothermal alteration zones using remote sensing methods in Tirka Area, Toroud, NE Iran. J. Indian Soc. Remote Sens. 2019, 47, 1817–1830. [Google Scholar] [CrossRef]
- Zoheir, B.; Emam, A. Field and ASTER imagery data for the setting of gold mineralization in Western Allaqi–Heiani belt, Egypt: A case study from the Haimur deposit. J. Afr. Earth Sci. 2014, 99, 150–164. [Google Scholar] [CrossRef]
- Sadek, M.F.; Ali-Bik, M.W.; Hassan, S.M. Late Neoproterozoic basement rocks of Kadabora-Suwayqat area, Central Eastern Desert, Egypt: Geochemical and remote sensing characterization. Arab. J. Geosci. 2015, 8, 10459–10479. [Google Scholar] [CrossRef]
- Kamel, M.; Abu El Ella, E.S.M. Integration of Remote Sensing & GIS to Manage the Sustainable Development in the Nile Valley desert fringes of assiut-sohag governorates, upper Egypt. J. Indian Soc. Remote Sens. 2016, 44, 759–774. [Google Scholar]
- Aboelkhair, H.; Abdelhalim, A.; Hamimi, Z.; Al-Gabali, M. Reliability of using ASTER data in lithologic mapping and alteration mineral detection of the basement complex of West Berenice, Southeastern Desert. Egypt. Arab. J. Geosci. 2020, 13, 287. [Google Scholar] [CrossRef]
- Hamimi, Z.; Hagag, W.; Kamh, S.; El-Araby, A. Application of remote-sensing techniques in geological and structural mapping of Atalla Shear zone and environs, central Eastern Desert. Egypt. Arab. J. Geosci. 2020, 13, 414. [Google Scholar] [CrossRef]
- Ali-Bik, M.W.; Hassan, S.M.; Sadek, M.F. Volcanogenic talc-copper deposits of Darhib-Abu Jurdi area, Egypt: Petrogenesis and remote sensing characterization. Geol. J. 2020, 55, 5330–5354. [Google Scholar] [CrossRef]
- Asran, A.M.; Hassan, S.M. Remote sensing-based geological mapping and petrogenesis of Wadi Khuda Precambrian rocks, South Eastern Desert of Egypt with emphasis on leucogranite. Egypt. J. Remote Sens. Space Sci. 2021, 24, 15–27. [Google Scholar] [CrossRef]
- Shokry, M.M.; Sadek, M.F.; Osman, A.F.; El Kalioubi, B.A. Precambrian basement rocks of Wadi-Khuda-Shut area, South Eastern Desert of Egypt: Geology and remote sensing analysis. Egypt. J. Remote Sens. Space Sci. 2021, 24, 59–75. [Google Scholar] [CrossRef]
- Shebl, A.; Abdellatif, M.; Hissen, M.; Abdelaziz, M.I.; Csamer, A. Lithological mapping enhancement by integrating Sentinel 2 and gamma-ray data utilizing support vector machine: A case study from Egypt. Int. J. Appl. Earth Obs. Geoinf. 2021, 105, 102619. [Google Scholar] [CrossRef]
- Soliman, N.M.; El-Desoky, H.M.; Heikal, M.A.; Abdel-Rahman, A.M. Using ASTER images and field work data for geological mapping around Wadi Umm Ashira and Wadi Tilal Al-Qulieb, Northwestern part of Wadi Allaqi, South Eastern Desert, Egypt. Arab. J. Geosci. 2021, 14, 1826. [Google Scholar] [CrossRef]
- EEl-Desoky, H.M.; Tende, A.W.; Abdel-Rahman, A.M.; Ene, A.; Awad, H.A.; Fahmy, W.; El-Awny, H.; Zakaly, H.M. Hydrothermal alteration mapping using landsat 8 and ASTER data and geochemical characteristics of Precambrian rocks in the Egyptian shield: A Case Study from Abu Ghalaga, Southeastern Desert, Egypt. Remote Sens. 2022, 14, 3456. [Google Scholar] [CrossRef]
- Khedr, M.Z.; Abo Khashaba, S.M.; El-Shibiny, N.H.; El-Arafy, R.A.; Takazawa, E.; Azer, M.K.; Pallin, M. Remote sensing techniques and geochemical constraints on the formation of the Wadi El-Hima mineralized granites, Egypt: New insights into the genesis and accumulation of garnets. Int. J. Earth Sci. 2022, 111, 2409–2443. [Google Scholar] [CrossRef]
- Khashaba, S.M.A.; El-Shibiny, N.H.; Hassan, S.M.; Takazawa, E.; Khedr, M.Z. Application of remote sensing data integration in detecting mineralized granitic zones: A case study of the Gabal Al-Ijlah Al-Hamra, Central Eastern Desert, Egypt. J. Afr. Earth Sci. 2023, 200, 104855. [Google Scholar] [CrossRef]
- Zhang, T.; Yi, G.; Li, H.; Wang, Z.; Tang, J.; Zhong, K.; Li, Y.; Wang, Q.; Bie, X. Integrating Data of ASTER and Landsat-8 OLI (AO) for Hydrothermal Alteration Mineral Mapping in Duolong Porphyry Cu-Au Deposit, Tibetan Plateau, China. Remote Sens. 2016, 8, 890. [Google Scholar] [CrossRef]
- Bouwafoud, A.; Mouflih, M.; Benbouziane, A. Lithological Mapping Using Landsat 8 OLI in the Meso-Cenozoic Tarfaya Laayoune Basin (South of Morocco): Comparison between ANN and SID Classification. Open J. Geol. 2021, 11, 658–681. [Google Scholar] [CrossRef]
- Patchett, P.J.; Chase, C.G. Role of transform continental margins in major crustal growth episodes. Geology 2002, 30, 39–42. [Google Scholar] [CrossRef]
- Stern, R.J. Arc assembly and continental collision in the Neoproterozoic East African Orogen: Implications for the consolidation of Gondwanaland. Annu. Rev. Earth Planet Sci. 1994, 22, 319–351. [Google Scholar] [CrossRef]
- Stern, R.J. Crustal evolution in the East African Orogen: A neodymium isotopic perspective. J. Afr. Earth Sci. 2002, 34, 109–117. [Google Scholar] [CrossRef]
- Stern, R.J. Subduction zones. Rev. Geophys. 2002, 40, 3–38. [Google Scholar] [CrossRef]
- Stern, R.J. Neoproterozoic crustal growth: The solid earth system during a critical episode of Earth history. Gondwana Res. 2008, 14, 33–50. [Google Scholar] [CrossRef]
- Hargrove, U.S.; Stern, R.J.; Kimura, J.I.; Manton, W.I.; Johnson, P.R. How juvenile is the Arabian-Nubian Shield? Evidence from Nd isotopes and pre-Neoproterozoic inherited zircon in the Bi’r Umq suture zone, Saudi Arabia. Earth Planet Sci. Lett. 2006, 252, 308–326. [Google Scholar] [CrossRef]
- Vaughan, A.P.M.; Pankhurst, R.J. Tectonic overview of the West Gondwana margin. Gondwana Res. 2008, 13, 150–162. [Google Scholar] [CrossRef]
- Avigad, D.; Gvirtzman, Z. Late Neoproterozoic Arabian—Rise and fall of the northern Nubian Shield: The role of lithospheric mantle delamination and subsequent thermal subsidence. Tectonophysics 2009, 477, 217–228. [Google Scholar] [CrossRef]
- Johnson, P.R.; Andresen, A.; Collins, A.S.; Fowler, A.R.; Fritz, H.; Ghebreab, W.; Kusky, T.; Stern, R.J. Late Cryogenian-Ediacaran history of the Arabian-Nubian Shield: A review of depositional, plutonic, structural, and tectonic events in the closing stages of the northern East African Orogen. J. Afr. Earth Sci. 2011, 61, 167–232. [Google Scholar] [CrossRef]
- Be’eri-Shlevin, Y.; Eyal, M.M.; Eyal, Y.; Whitehouse, M.J.; Litvinovsky, B. The Sa’al volcano-sedimentary complex (Sinai, Egypt), a latest Mesoproterozoic volcanic arc in the northern Arabian-Nubian Shield. Geology 2012, 40, 403–406. [Google Scholar] [CrossRef]
- Fritz, H.; Abdelsalam, M.; Ali, K.A.; Bingen, B.; Collins, A.S.; Fowler, A.R.; Ghebreab, W.; Hauzenberger, C.A.; Johnson, P.R.; Kusky, T.M.; et al. Orogen styles in the East African Orogen: A review of the Neoproterozoic to Cambrian tectonic evolution. J. Afr. Earth Sci. 2013, 86, 65–106. [Google Scholar] [CrossRef] [PubMed]
- El-Bialy, M.Z.; Hassen, I.S. The late Ediacaran (580–590 Ma) onset of anorogenic alkaline magmatism in the Arabian-Nubian Shield: Katherina A-type rhyolites of Gabal Ma’ain, Sinai, Egypt. Precambrian Res. 2012, 216, 1–22. [Google Scholar] [CrossRef]
- Azer, M.K.; Obeid, M.A.; Gahlan, H.A. Late Neoproterozoic layered mafic intrusion of arc-affinity in the Arabian-Nubian Shield: A case study from the Shahira layered mafic intrusion, southern Sinai, Egypt. Geol. Acta Int. Earth Sci. J. 2016, 14, 237–259. [Google Scholar]
- El-Bialy, M.Z.; Shata, A.E. Geochemistry, petrogenesis and radioactive mineralization of two coeval Neoproterozoic post-collisional calc-alkaline and alkaline granitoid suites from Sinai, Arabian Nubian Shield. Chem. Erde 2018, 78, 15–39. [Google Scholar] [CrossRef]
- Fowler, A.; Hassen, I.S.; Hassan, M. The Feiran-Solaf metamorphic complex, Sinai, Egypt: Evidence for orthogonal or oblique tectonic convergence? J. Afr. Earth Sci. 2017, 146, 48–65. [Google Scholar] [CrossRef]
- Azer, M.K.; Gahlan, H.A.; Asimow, P.D.; Al-Kahtany, K.M. The common origin and alteration history of the hypabyssal and volcanic phases of the Wadi Tarr Albitite Complex, southern Sinai, Egypt. Lithos 2019, 324, 821–841. [Google Scholar] [CrossRef]
- Morad, A.E.; Abdelrahman, H.B.; Ali, M.S.; Ali, S. Metamorphic conditions and igneous activity in the Um Zariq area, East Sinai, Egypt: Mineralogical and petrological evidences for the transformation from collisional to an extensional regime in the Arabian-Nubian shield. J. Afr. Earth Sci. 2021, 182, 104302. [Google Scholar] [CrossRef]
- Helmy, M.H.; Morad, E.A.; Abdel Rahman, B.H. Um Zariq formation, southeast sinai, Egypt: A new record of the Sturtian Snowball Earth event in the Arabian Nubian Shield. J. Afr. Earth Sci. 2021, 173, 104048. [Google Scholar] [CrossRef]
- El-Desoky, H.M.; Abdel-Rahman, A.M.; Fahmy, W.; Khalifa, I.; Mohamed, S.A.; Shirazi, A.; Hezarkhani, A.; Shirazy, A.; Pour, A.B. Ore Genesis of the Abu Ghalaga Ferro-Ilmenite Ore Associated with Neoproterozoic Massive-Type Gabbros, South-Eastern Desert of Egypt: Evidence from Texture and Mineral Chemistry. Minerals 2023, 13, 307. [Google Scholar] [CrossRef]
- Moussa, E.M.; Stern, R.J.; Manton, W.I.; Ali, K.A. SHRIMP zircon dating and Sm/Nd isotopic investigations of Neoproterozoic granitoids, Eastern Desert, Egypt. Precambrian Res. 2008, 160, 341–356. [Google Scholar] [CrossRef]
- El-Sayed, M.M.; Mohamed, F.H.; Furnes, H.; Kanisawa, S. Geochemistry and petrogenesis of the Neoproterozoic granitoids in the Central Eastern Desert, Egypt. Chem. Erde 2002, 62, 317–346. [Google Scholar] [CrossRef]
- Farahat, E.S.; Mohamed, H.A.; Ahmed, A.F.; El Mahallawi, M.M. Origin of I-and A-type granitoids from the Eastern Desert of Egypt: Implications for crustal growth in the northern Arabian–Nubian Shield. J. Afr. Earth Sci. 2007, 49, 43–58. [Google Scholar] [CrossRef]
- Abdel-Rahman AF, M.; Martin, R.F. The Mount Gharib A-type granite, Nubian Shield: Petrogenesis and role of metasomatism at the source. Contrib. Mineral. Petrol. 1990, 104, 173–183. [Google Scholar] [CrossRef]
- Abdel-Rahman, A.M.; El-Kibbi, M.M. Anorogenic magmatism: Chemical evolution of the Mount El-Sibai A-type complex (Egypt), and implications for the origin of within-plate felsic magmas. Geol. Mag. 2001, 138, 67–85. [Google Scholar] [CrossRef]
- Mohamed, F.H.; El-Sayed, M.M. Post-orogenic and anorogenic A-type fluorite-bearing granitoids, Eastern Desert, Egypt: Petrogenetic and geotectonic implications. Chem. Erde 2008, 68, 431–450. [Google Scholar] [CrossRef]
- Be’eri-Shlevin, Y.; Katzir, Y.; Valley, J.W. Crustal evolution and recycling in a juvenile continent: Oxygen isotope ratio of zircon in the northern Arabian Nubian Shield. Lithos 2009, 107, 169–184. [Google Scholar] [CrossRef]
- Eyal, M.; Litvinovsky, B.; Jahn, B.M.; Zanvilevich, A.; Katzir, Y. Origin and evolution of post-collisional magmatism: Coeval Neoproterozoic calc-alkaline and alkaline suites of the Sinai Peninsula. Chem. Geol. 2010, 269, 153–179. [Google Scholar] [CrossRef]
- El-Bialy, M.Z.; Omar, M.M. Spatial association of Neoproterozoic continental arc I-type and post-collision A-type granitoids in the Arabian-Nubian Shield: The Wadi Al-Baroud Older and younger granites, North Eastern Desert. Egypt. J. Afr. Earth Sci. 2015, 103, 1–29. [Google Scholar] [CrossRef]
- Shimron, A.E. Late phase deformation and mylonite belts in Sinai: Pan African thrust fault tectonics. Geol. Surv. Isr. 1980, 1, 75–80. [Google Scholar]
- Furnes, H.; Shimron, A.E.; Roberts, D. Geochemistry of Pan-African volcanic arc sequences in southeastern Sinai Peninsula and plate tectonic implications. Precambrian Res. 1985, 29, 359–382. [Google Scholar] [CrossRef]
- Blasband, B.; Brooijmans, P.; Dirks, P.; Visser, W.; White, S. A Pan-African core complex in the Sinai, Egypt. Geol. Mijnb. 1997, 76, 247–266. [Google Scholar] [CrossRef]
- Blasband, B.; White, S.; Brooijmans, P.; De Boorder, H.; Visser, W. Late Proterozoic extensional collapse in the Arabian-Nubian shield. J. Geol. Soc. 2000, 157, 615–628. [Google Scholar] [CrossRef]
- Brooijmans, P.; Blasband, B.; White, S.H.; Visser, W.J.; Dirks, P. Geothermobarometric evidence for a metamorphic core complex in Sinai, Egypt. Precambrian Res. 2003, 123, 249–268. [Google Scholar] [CrossRef]
- Bentor, Y.K.; Bogosh, R.; Eyal, M.; Garfunkel, Z.; Shimron, A. Geological Map of Sinai, Jebel Sabbagh Sheet, 1:100,000 Scale; Academy of Science and Humanities: Jerusalem, Israel, 1974. [Google Scholar]
- Shimron, A.E.; Arkin, Y. Precambrian Geology of Wadi Kid-Wadi Umm Adawi Area, Eastern Sinai. Reconnaissance Map 1:25,000 and Explanatory Notes; Rep. No. MM/1/78; Geological survey of Israel: Jerusalem, Israel, 1978. [Google Scholar]
- El-Shafei, M.K.; Kusky, T. Structural and tectonic evolution of the Neoproterozoic Feiran–Solaf metamorphic belt Sinai Peninsula: Implications for the closure of the Mozambique Ocean. Precambrian Res. 2003, 123, 269–293. [Google Scholar] [CrossRef]
- Blasy, M.; El-Baroudy, A.F.; Kharbish, S.M. Geochemical characteristics of Wadi Tarr albitite, southeastern Sinai, Egypt. Egypt. J. Geol. 2001, 45, 767–780. [Google Scholar]
- Fowler, A.; Hassen, I.S.; Osman, A.F. Neoproterozoic structural evolution of SE Sinai, Egypt: II. Convergent tectonic history of the continental arc Kid Group. J. Afr. Earth Sci. 2010, 58, 526–546. [Google Scholar] [CrossRef]
- Abu El-Enen, M.M.; Makroum, F.M. Tectonometamorphic evolution of the northeastern Kid Belt, Southeast Sinai, Egypt. Ann. Geol. Surv. Egypt 2003, VXXVI, 19–37. [Google Scholar]
- Shimron, A. The Dahab mafic–ultramafic complex, southern Sinai Peninsula: A probable ophiolite of Late Proterozoic (Pan-African) age. Ofioliti 1981, 6, 161–164. [Google Scholar]
- Shimron, A.E. The Tarr Complex revisited folding, thrusts and mélanges in the southern Wadi Kid region, Sinai Peninsula. Isr. J. Earth Sci. 1983, 32, 123–148. [Google Scholar]
- Halpern, M.; Tristan, N. Geochronology of the Arabian-Nubian Shield in southern Israel and eastern Sinai. J. Geology. 1981, 89, 639–648. [Google Scholar] [CrossRef]
- Bielski, M. Stages in the Arabian–Nubian Massif in Sinai. unpublished. Ph.D. Thesis, Hebrew University, Jerusalem, Israel, 1982; p. 155. [Google Scholar]
- Moghazi, A.-K.M.; Ali, K.A.; Wilde, S.A.; Zhou, Q.; Andersen, T.; Andresen, A.; Abu El-Enen, M.M.; Stern, R.J. Geochemistry, geochronology, and Sr–Nd isotopes of the late Neoproterozoic Wadi Kid volcano-sedimentary rocks, Southern Sinai, Egypt: Implications for tectonic setting and crustal evolution. Lithos 2012, 154, 147–165. [Google Scholar] [CrossRef]
- Green, A.A.; Berman, M.; Switzer, P.; Craig, M.D. A transformation for ordering multispectral data in terms of image quality with implications for noise removal. IEEE Trans. Geosci. Remote Sens. 1988, 26, 65–74. [Google Scholar] [CrossRef]
- Roy, D.P.; Wulder, M.A.; Loveland, T.R.; Woodcock, C.E.; Allen, R.G.; Anderson, M.C.; Helder, D.; Irons, J.R.; Johnson, D.M.; Kennedy, R.; et al. Landsat-8: Science and product vision for terrestrial global change research. Remote Sens. Environ. 2014, 145, 154–172. [Google Scholar] [CrossRef]
- Shebl, A.; Csamer, A. Reappraisal of DEMs, radar and optical datasets in lineaments extraction with emphasis on the spatial context. Remote Sens. Appl. Soc. Environ. 2021, 24, 100617. [Google Scholar] [CrossRef]
- Chavez, P.S., Jr.; Berlin, G.L.; Sowers, L.B. Statistical method for selecting Landsat MSS ratios. J. Appl. Photogr. Eng. 1982, 8, 23–30. [Google Scholar]
- Richards, J.A. Remote Sensing Digital Image Analysis; Springer: Berlin/Heidelberg, Germany, 1999; p. 3. [Google Scholar]
- Boardman, J.W.; Kruse, F.A. Automatic spectral analysis: A geological example using AVIRIS data, North Grapevine mountain, Nevada. In Proceedings of the 10th Thematic Conference on Geologic Remote Sensing, San Antonio, TX, USA, 9–12 May 1994; pp. 407–418. [Google Scholar]
- Gupta, R.P. Remote Sensing Geology, 2nd ed.; Springer: Berlin/Heidelberg, Germany, 2003; p. 655. [Google Scholar]
- Drury, S.A. Image Interpretation in Geology, 1st ed.; Allen&Unwin: London, UK, 1987; p. 243. [Google Scholar]
- Crane, R.B. Processing techniques to reduce atmospheric and sensorvariability in multispectral scanner data. In Proceedings of the 7th International Symposium on Remote Sensing of Environment. Ann. Arbor. 1971, 2, 1345–1355. [Google Scholar]
- Vincent, R.K. Fundamentals of Geological and Environmental Remote Sensing; Prentice-Hall, Inc.: Upper Saddle River, NJ, USA, 1997. [Google Scholar]
- Shabani, A.; Ziaii, M.; Monfared, M.S.; Shirazy, A.; Shirazi, A. Multi-Dimensional Data Fusion for Mineral Prospectivity Mapping (MPM) Using Fuzzy-AHP Decision-Making Method, Kodegan-Basiran Region, East Iran. Minerals 2022, 12, 1629. [Google Scholar] [CrossRef]
- Aali, A.A.; Shirazy, A.; Shirazi, A.; Pour, A.B.; Hezarkhani, A.; Maghsoudi, A.; Hashim, M.; Khakmardan, S. Fusion of Remote Sensing, Magnetometric, and Geological Data to Identify Polymetallic Mineral Potential Zones in Chakchak Region, Yazd, Iran. Remote Sens. 2022, 14, 6018. [Google Scholar] [CrossRef]
- Dohuee, M.; Khosravi, V.; Shirazi, A.; Shirazy, A.; Nazerian, H.; Pour, A.B.; Hezarkhani, A.; Pradhan, B. Alteration Detections Using ASTER Remote Sensing data and Fractal Geometry for Mineral prospecting in Hemich Area, NE Iran. In Proceedings of the IGARSS 2022–2022 IEEE International Geoscience and Remote Sensing Symposium, Kuala Lumpur, Malaysia, 17–22 July 2022; pp. 5520–5523. [Google Scholar]
- Sabins, F.F. Remote Sensing for mineral exploration. Ore Geol. Rev. 1999, 14, 157–183. [Google Scholar] [CrossRef]
- Lillesand, T.M.; Kiefer, R.W. Remote Sensing and Image Interpretation, 3rd ed.; Wiley: New York, NY, USA, 1994; p. 750. [Google Scholar] [CrossRef]
- Shirazi, A.; Hezarkhani, A.; Beiranvand Pour, A.; Shirazy, A.; Hashim, M. Neuro-Fuzzy-AHP (NFAHP) Technique for Copper Exploration Using Advanced Spaceborne Thermal Emission and Reflection Radiometer (ASTER) and Geological Datasets in the Sahlabad Mining Area, East Iran. Remote Sens. 2022, 14, 5562. [Google Scholar] [CrossRef]
- Azer, M.K.; Stern, R.J.; Kimura, J.I. Origin of a late Neoproterozoic (605_13 Ma) intrusive carbonate albitite complex in southern Sinai, Egypt. Int. J. Earth Sci. 2010, 99, 245–267. [Google Scholar] [CrossRef]
- El-Nisr, S.A.; Surour, A.A.; Moufti, A.M.B. Geochemistry and petrogenesis of dyke swarms in NWSinai, Egypt: A case of transition fromcompressional to extensional regimes during the late Neoproterozoic. J. Tethys 2014, 2, 160–177. [Google Scholar]
- Streckeisen, A. Plutonic rocks: Classification and nomenclature recommended by the IVGS sub-commission on the systematic of igneous rocks. Geotimes 1976, 18, 26–30. [Google Scholar]
- Pettijohn, F.J.; Potter, P.E.; Siever, R. Sands and Sandstones; Springer: New York, NY, USA, 1972; p. 618. [Google Scholar]
- Wimmenauer, W. Das prävaristische Kristallin im Schwarzwald. Fortschr. Miner. Beih. 1984, 62, 69–186. [Google Scholar]
- Nockolds, S.R. The relation between chemical composition and paragenesis in the biotites of micas of igneous rocks. Am. J. Sci 1947, 245, 401–420. [Google Scholar] [CrossRef]
- Herron, M.M. Geochemical classification of terrigenous sands and shales from core or log data. J. Sediment. Res. 1988, 58, 820–829. [Google Scholar]
- Peccerillo, A.; Taylor, S.R. Geochemistry of Eocene calc-alkaline volkanic rocks from Kastamonu area, Northern Turkey. Contrib. Mineral. Petrol. 1976, 58, 63–81. [Google Scholar] [CrossRef]
- Abd El Ghaffar, N.I.; El-Bagoury, H.; Ghabrial, D.S.; Abdelwahab, W.; Ismail, A.I. Discrimination of Neoproterozoic granitic-phases in Southern-Sinai, Egypt. Remote sensing, petrography, and geochemistry. Egypt. J. Remote Sens. Space Sci. 2021, 24, 231–246. [Google Scholar] [CrossRef]
- Nedelec, A.; Grujic, D. Un nouvel exemple de magmatisme potassique à ultrapotassique: Les syénites de l’Andringitra (Madagascar). Earth Planet. Sci. 2001, 332, 739–745. [Google Scholar]
- De La Roche, H.; Leterrier, J.; Grondclaude, P.; Marchal, M. A classification of volcanic and plutonic rock using R1-R2 diagrams and major element analyses; Its relationships and current nomenclature. Chem. Geol. 1980, 29, 183–210. [Google Scholar] [CrossRef]
- Frost, B.R.; Barnes, C.G.; Collins, W.J.; Arculus, R.J.; Ellis, D.J.; Frost, C.D. A geochemical classification for granitic rocks. J. Petrol. 2001, 42, 2033–2048. [Google Scholar] [CrossRef]
- Maniar, P.A.; Piccoli, P.M. Tectonic discrimination of granitoids. Ball. Geol. Soc. Am. 1989, 101, 635–643. [Google Scholar] [CrossRef]
- Pearce, J.A.; Harris, N.B.W.; Tindle, A.G. Trace element discrimination diagrams for the tectonic interpretation of granitic rocks. J. Petrol. 1984, 25, 956–983. [Google Scholar] [CrossRef]
- Eby, G.N. The A-type granitoids: A review of their occurrence and chemical characteristics and speculations on their petrogenesis. Lithos 1990, 26, 115–134. [Google Scholar] [CrossRef]
- Eby, N. Chemical subdivision of the A-type granitoids: Petrogenetic and tectonic implications. Geology 1992, 20, 641–644. [Google Scholar] [CrossRef]


| Rank | Band Triplet | % |
|---|---|---|
| 1 | 7,5,1 | 72.17 |
| 2 | 7,6,1 | 72.15 |
| 3 | 7,6,2 | 71.63 |
| 4 | 7,2,1 | 71.35 |
| 5 | 7,3,1 | 70.81 |
| 6 | 7,5,2 | 70.62 |
| Eigenvector | Band 1 | Band 2 | Band 3 | Band 4 | Band 5 | Band 6 | Band 7 | Eigenvalues % |
|---|---|---|---|---|---|---|---|---|
| PC 1 | 0.9318 | −0.3512 | 0.08086 | −0.0438 | 0.0002 | −0.0004 | 0.00142 | 96.71 |
| PC 2 | −0.29157 | 0.8543 | −0.4064 | −0.1015 | 0.09809 | 0.00198 | −0.0049 | 2.27 |
| PC 3 | 0.19939 | −0.2991 | 0.87965 | −0.2182 | 0.22019 | 0.02908 | −0.0056 | 0.51 |
| PC 4 | −0.025 | 0.15422 | −0.1403 | −0.9642 | −0.1612 | −0.0116 | 0.01049 | 0.23 |
| PC 5 | −0.0712 | −0.16038 | −0.1694 | −0.0889 | −0.75793 | 0.53086 | −0.1187 | 0.14 |
| PC 6 | 0.03617 | −0.0867 | 0.07753 | −0.04854 | −0.5231 | 0.77822 | −0.3218 | 0.11 |
| PC 7 | 0.00777 | −0.0169 | 0.0097 | 0.01441 | −0.0748 | 0.33403 | −0.93924 | 0.03 |
| Rock Type | Metasediments | ||||
|---|---|---|---|---|---|
| Sa. No. | 4T | 14 Kh | 2 Sam | 9 Kh | 1 Gh |
| Major oxides (wt.%) | |||||
| SiO2 | 65.517 | 52.058 | 60.792 | 47.632 | 58.973 |
| TiO2 | 0.326 | 0.288 | 0.928 | 1.564 | 0.904 |
| Al2O3 | 21.147 | 17.423 | 16.499 | 17.685 | 20.254 |
| FeO | 0.318 | 2.868 | 0.958 | 8.258 | 3.413 |
| Fe2O3 | 0.394 | 1.906 | 0.944 | 4.643 | 3.364 |
| MnO | 0.011 | 0.175 | 0.034 | 0.177 | 0.035 |
| MgO | 0.766 | 12.995 | 6.261 | 5.546 | 2.54 |
| CaO | 1.287 | 6.615 | 4.837 | 9.257 | 1.896 |
| Na2O | 9.243 | 4.395 | 7.491 | 2.562 | 6.736 |
| K2O | 0.225 | 0.632 | 0.272 | 1.523 | 1.386 |
| P2O5 | 0.477 | 0.247 | 0.777 | 0.796 | 0.278 |
| SO3 | 0.068 | 0.144 | 0.044 | 0.024 | 0.031 |
| Cl | 0.031 | 0.075 | 0.049 | 0.027 | 0.053 |
| Total | 100 | 100 | 100 | 100 | 100 |
| Trace elements (ppb) | |||||
| Zn | 0 | 9 | 0 | 20 | 5 |
| Sr | 30 | 43 | 11 | 99 | 17 |
| Ba | 30 | 22 | 50 | 44 | 16 |
| Co | - | 30 | 20 | 25 | 14 |
| Cr | - | - | 27 | 17 | 16 |
| Cu | 80 | 20 | 6 | 16 | 5 |
| Y | 6 | 3 | 7 | 4 | 4 |
| Zr | 66 | 63 | 30 | 38 | 23 |
| Nb | 3 | 2 | 2 | 3 | 4 |
| Sr | 30 | 43 | 11 | 99 | 17 |
| Ba | 90 | 22 | 80 | 44 | 16 |
| Ce | - | - | - | 38 | 19 |
| Ga | 3 | - | 4 | 2 | 2 |
| Pb | 2 | - | - | - | - |
| SiO2/Al2O3 | 0.491 | 0.475 | 0.566 | 0.430 | 0.464 |
| Fe2O3/K2O | 0.243 | 0.479 | 0.540 | 0.484 | 0.385 |
| K2O/Na2O | 0.024 | 0.144 | 0.036 | 0.594 | 0.206 |
| CaO+Na2O | 10.530 | 11.010 | 12.328 | 11.819 | 8.632 |
| SiO2/Al2O3 | 0.491 | 0.475 | 0.566 | 0.430 | 0.464 |
| Rock Type | Diorite | Granite | Albitite | ||||||||||
|---|---|---|---|---|---|---|---|---|---|---|---|---|---|
| S. No. | 30 Qe | 26 Qe | 2KD | 7 Qe | 1 Qe | 15 Qe | 21 Qe | 1KD | 18 Qe | 2KF | 35 Qe | 13 Kh | 1T |
| Major oxides (wt.%) | |||||||||||||
| SiO2 | 55.335 | 55.052 | 57.538 | 54.191 | 57.298 | 69.825 | 70.059 | 67.023 | 69.365 | 72.741 | 66.917 | 64.861 | 65.828 |
| TiO2 | 1.215 | 1.255 | 0.511 | 1.503 | 1.263 | 0.279 | 0.132 | 0.669 | 0.223 | 0.172 | 0.546 | 0.93 | 0.32 |
| Al2O3 | 17.307 | 16.499 | 17.947 | 14.969 | 15.38 | 16.46 | 16.814 | 15.869 | 17.427 | 15.441 | 15.04 | 20.562 | 20.872 |
| FeO | 5.264 | 5.852 | 2.140 | 5.815 | 4.244 | 0.825 | 0.429 | 1.698 | 0.562 | 0.444 | 2.121 | 0.307 | 0.206 |
| Fe2O3 | 3.722 | 4.362 | 1.820 | 4.433 | 3.362 | 1.053 | 0.611 | 2.032 | 0.765 | 0.598 | 2.539 | 0.411 | 0.285 |
| MnO | 0.19 | 0.21 | 0.125 | 0.13 | 0.127 | 0.047 | 0.048 | 0.107 | 0.026 | 0.088 | 0.114 | 0.008 | 0.165 |
| MgO | 4.748 | 4.42 | 2.45 | 5.833 | 5.911 | 0.715 | 0.333 | 1.857 | 0.45 | 0.426 | 1.173 | 0.977 | 0.256 |
| CaO | 6.188 | 5.806 | 9.958 | 5.576 | 4.821 | 1.298 | 1.187 | 1.353 | 0.943 | 0.886 | 1.635 | 0.866 | 0.379 |
| Na2O | 2.804 | 3.369 | 5.992 | 2.628 | 2.827 | 3.55 | 4.61 | 3.153 | 4.182 | 3.543 | 3.261 | 10.282 | 10.264 |
| K2O | 2.277 | 2.35 | 0.734 | 3.508 | 3.142 | 5.418 | 5.545 | 5.634 | 5.582 | 5.481 | 5.551 | 0.179 | 0.367 |
| P2O5 | 0.521 | 0.41 | 0.225 | 0.628 | 0.56 | 0.125 | 0.044 | 0.271 | 0.112 | 0.043 | 0.271 | 0.46 | 0.052 |
| SO3 | 0.047 | 0.095 | 0.149 | 0.146 | 0.315 | 0.064 | 0.005 | 0.032 | 0.047 | 0.022 | 0.419 | 0.038 | 0.019 |
| Cl | 0.028 | 0.03 | 0.064 | 0.121 | 0.383 | 0.056 | 0.016 | 0.06 | 0.058 | 0.027 | 0.081 | 0.049 | 0.056 |
| Total | 100 | 100 | 100 | 100 | 100 | 100 | 100 | 100 | 100 | 100 | 100 | 100 | 100 |
| Trace elements (ppb) | |||||||||||||
| Zn | 16 | 17 | 15 | 0 | 10 | 6 | 0 | 11 | 7 | 0 | 0 | 3 | - |
| Sr | 103 | 82 | 24 | 97 | 199 | 115 | 44 | 27 | 76 | 8 | 97 | 12 | 15 |
| Ba | 75 | 53 | 76 | 103 | 15 | 104 | 65 | 75 | 94 | 12 | 103 | 30 | 40 |
| Co | 18 | 23 | 10 | 20 | 30 | 20 | 10 | 10 | 20 | 20 | 20 | 20 | - |
| Cr | - | - | - | 26 | - | 7 | - | - | - | - | 26 | 12 | - |
| Cu | 11 | 10 | 5 | 9 | 10 | 5 | 10 | 4 | 8 | 3 | 9 | 4 | 4 |
| Y | 3 | 4 | 9 | 5 | 6 | 4 | 3 | 9 | 1 | 3 | 5 | 6 | 2 |
| Zr | 43 | 38 | 88 | 65 | 87 | 16 | 20 | 63 | 28 | 24 | 65 | 25 | 51 |
| Nb | 1 | 1 | 7 | 3 | 3 | 2 | 2 | 5 | 1 | 3 | 3 | 4 | 5 |
| Sr | 103 | 82 | 24 | 97 | 199 | 115 | 44 | 27 | 76 | 8 | 97 | 12 | 15 |
| Ba | 75 | 53 | 76 | 103 | 15 | 104 | 65 | 75 | 94 | 12 | 103 | 39 | 30 |
| Ce | 51 | 45 | 44 | 71 | - | 0 | 0 | - | 0 | - | 71 | - | |
| Ga | 4 | 4 | 5 | 3 | 4 | 4 | 5 | 3 | 5 | 2 | 3 | 3 | 4 |
| Pb | 3 | 0 | 6 | 3 | 4 | 4 | 4 | 2 | 9 | 6 | 3 | 3 | 2 |
| Na2O+K2O | 5.081 | 5.719 | 6.726 | 6.136 | 5.969 | 8.968 | 10.155 | 8.787 | 9.764 | 9.024 | 8.812 | 10.461 | 10.631 |
| Mg | 61.653 | 57.380 | 67.115 | 64.134 | 71.285 | 60.698 | 58.057 | 66.097 | 58.782 | 63.111 | 49.647 | 85.018 | 68.893 |
| K2O/Na2O | 0.812 | 0.698 | 0.122 | 1.335 | 1.111 | 1.526 | 1.203 | 1.787 | 1.335 | 1.547 | 1.702 | 0.017 | 0.036 |
Disclaimer/Publisher’s Note: The statements, opinions and data contained in all publications are solely those of the individual author(s) and contributor(s) and not of MDPI and/or the editor(s). MDPI and/or the editor(s) disclaim responsibility for any injury to people or property resulting from any ideas, methods, instructions or products referred to in the content. |
© 2023 by the authors. Licensee MDPI, Basel, Switzerland. This article is an open access article distributed under the terms and conditions of the Creative Commons Attribution (CC BY) license (https://creativecommons.org/licenses/by/4.0/).
Share and Cite
Fahmy, W.; El-Desoky, H.M.; Elyaseer, M.H.; Ayonta Kenne, P.; Shirazi, A.; Hezarkhani, A.; Shirazy, A.; El-Awny, H.; Abdel-Rahman, A.M.; Khalil, A.E.; et al. Remote Sensing, Petrological and Geochemical Data for Lithological Mapping in Wadi Kid, Southeast Sinai, Egypt. Minerals 2023, 13, 1160. https://doi.org/10.3390/min13091160
Fahmy W, El-Desoky HM, Elyaseer MH, Ayonta Kenne P, Shirazi A, Hezarkhani A, Shirazy A, El-Awny H, Abdel-Rahman AM, Khalil AE, et al. Remote Sensing, Petrological and Geochemical Data for Lithological Mapping in Wadi Kid, Southeast Sinai, Egypt. Minerals. 2023; 13(9):1160. https://doi.org/10.3390/min13091160
Chicago/Turabian StyleFahmy, Wael, Hatem M. El-Desoky, Mahmoud H. Elyaseer, Patrick Ayonta Kenne, Aref Shirazi, Ardeshir Hezarkhani, Adel Shirazy, Hamada El-Awny, Ahmed M. Abdel-Rahman, Ahmed E. Khalil, and et al. 2023. "Remote Sensing, Petrological and Geochemical Data for Lithological Mapping in Wadi Kid, Southeast Sinai, Egypt" Minerals 13, no. 9: 1160. https://doi.org/10.3390/min13091160