Electrochemical Study of Galena Weathering in NaCl Solution: Kinetics and Environmental Implications

1
College of Chemistry and Materials Engineering, Guiyang University, Guiyang 550005, China
2
Key Laboratory of High-Temperature and High-Pressure Study of the Earth’s Interior, Institute of Geochemistry, Chinese Academy of Sciences, Guiyang 550081, China
*
Author to whom correspondence should be addressed.
Minerals 2020, 10(5), 416; https://doi.org/10.3390/min10050416
Submission received: 2 April 2020
/
Revised: 3 May 2020
/
Accepted: 5 May 2020
/
Published: 8 May 2020
(This article belongs to the Section Mineral Processing and Extractive Metallurgy)
Abstract
:Exploitation of seafloor massive sulfide deposits exposes galena and other metal sulfides to weathering factors. Galena weathering process leads to release of toxic metals into the water column. Although galena weathering has an impact on the environment, the mechanisms and kinetics of galena oxidation under seawater conditions are rarely studied. In this work, several electrochemical experimental methods were combined to examine the kinetics of galena weathering in NaCl solution to simulate the effects of Cl− in seawater, and the effects of sodium chloride concentration and pH on it were studied. The results show that galena weathering can lead to mineral surface passivation. More chloride ions can accelerate the dissolution of galena. Higher acidity and alkalinity promote the dissolution of galena in NaCl solution. Galena will release Pb2+ at a rate of 2.849 × 10⁻² g m−2 d−1 in the near neutral NaCl mediums, and the amount increases to 5.705 × 10⁻² g m−2 d−1 at pH 1.0 and even up to 7.569 × 10⁻¹ g m−2 d−1 at pH 13.0. The results of polarization curves are consistent with the impedance spectrum data. Based on the dissolution kinetics of galena, the environmental significance of galena weathering is proposed.
1. Introduction
Galena (PbS) is one of the most common metallic sulfide minerals, and widely exists in terrestrial deposits and seafloor massive sulfide (SMS) deposits [1]. The oxidative dissolution of galena plays an important role in environmental and geochemical processes. Under the influence of mining activities or specific geochemical processes, the oxidation and dissolution of galena will be accompanied by the release of lead and other toxic heavy metal ions (such as zinc and cadmium), which threatens human health and affects the ecosystems [2,3]. The principal secondary minerals formed by the oxidation of galena are anglesite (PbSO4) and cerussite (PbCO3) [4,5]. They have higher solubility and biological accessibility than galena, which promotes the migration of lead and increases its toxicity [5]. Therefore, studying the dissolution behavior of galena in different solutions is conducive to understanding the migration and transformation of lead in the environment, and can provide theoretical guidance for the pollution treatment caused by galena oxidation.
It is well known that galena weathering is an electrochemical reaction in nature [6]. Therefore, electrochemical techniques are often used to study the electrochemical behavior of galena, for instance open circuit potential (OCP) [7], polarization curves [7,8,9,10,11,12], cyclic voltammetry (CV) [5,6,7,8,11,13,14,15,16], electrochemical impedance spectra (EIS) [9,10,12,16,17], and chronoamperometry (CA) [5,6,15]. Besides, the surface products generated on galena from its dissolution have been investigated using many surface analysis methods, such as scanning electron microscopy (SEM) [5,6,7,18], Raman spectroscopy [5,7,12,19], X-ray photoelectron spectroscopy (XPS) [5,20,21,22], Fourier transformation infrared (FTIR) spectroscopy [5,12,23,24,25]. Initially, focused researches on the oxidation behavior of galena were mainly applied in the mining industry. The electrochemical behavior of galena is an important factor in the process of leaching and flotation. There have been many studies in this area [16,18,26,27,28]. Recently, great interests have focused on the oxidation behavior of galena in terms of environmental impacts. Many researchers have investigated the weathering of galena under various simulated natural geological environments. Liu et al. assessed the effect of humic acids (HA) during galena weathering [12]. Lara et al. discussed galena weathering under simulated calcareous soil conditions [5]. Zheng et al. studied galena weathering behaviors under simulated acid rain [7].
However, these researches did not consider the physical and chemical conditions encountered in a seafloor context. Although SMS mining is still in the exploration and prospecting stage, the exploitation of the Western Pacific SMS deposits may occur in the next few years [29]. Deep sea mining processes have the potential to expose fresh sulfide minerals with a high surface area to corrosive seawater, resulting in additional oxidative dissolution [1]. According to our current knowledge, the oxidation and dissolution process of seafloor sulfide minerals in seawater conditions during natural weathering and artificial mining is not clear. Therefore, it is necessary to investigate the weathering process of submarine sulfide deposits, including how this process affects their economic value and the geochemical characteristics of the subsequent oxidation products.
Considering the above reasons, in this work the electrochemical dissolution of galena in sodium chloride solutions was studied to simulate the weathering of galena in a seawater context. The Cl− and Na+ ions are used to simulate the most abundant species in the seawater involved in sulfide mineral mining activities. During the mining process, local seawater may be diluted or concentrated to varying degrees. Moreover, NaCl is also the most common substance in geological fluids, is mostly present in the mine water, and the dissolution of galena also may occur in this case [30]. In addition, mining activities and acid mine drainage from the oxidation of other sulfide minerals can cause galena to be exposed to varying pH values. In present, complex sulfide ore processing remains very challenging, because the activation and dissolution of unwanted sulfide minerals can complicate the selective flotation of complex sulfides [31]. The study of the dissolution behavior of galena in alkaline conditions of pH up to 13.0 is of guiding significance for the flotation of complex sulfide ore due to the flotation of sulfide ores is typically done between pH 10 and 11. Electrochemical techniques including OCP, potentiodynamic polarization (PDP) and EIS were used to investigate galena weathering under different concentrations of NaCl and different pH values. The objective of this study is therefore to (1) reveal the galena electrochemical behaviors in the presences of NaCl and (2) quantitatively determine how NaCl concentration and pH affect galena weathering.
2. Materials and Methods
Electrochemical measurements were performed using a traditional three-electrodes system. All the three electrodes were placed in a three-necked flask at ambient temperature. A platinum foil electrode was used as the auxiliary electrode (REX 213-01). A saturated calomel electrode (SCE) was used as the reference electrode. All the potentials in this research are relative to SCE, except when specifically mentioned. A self-made solid galena electrode acted as the working electrode. The chemical composition (wt.%) of the galena used in this work is: 86.33Pb, 13.61S. The bulk elemental analysis for Pb and S comes from Inductively Coupled Plasma-Atomic Emission Spectrometry (ICP-AES, ARCOS II, SPECTRO, Kleve, Germany) and Carbon and Sulfur Analyzer (CS-206, BAOYING TECHNOLOGY, Shanghai, China), respectively. The preparation methods of the working electrode are as follows: a high purity dense galena block was ground into a cylinder with a diameter of 6 mm, then one side was connected to the copper wire with conductive adhesive, and at last encapsulated with epoxy resin, leaving one side of the sample as working surface in contact with solution. Before the experiment, the samples were gradually polished to 1500 mesh with silicon carbide sandpaper, and then rinsed with pure water after being ultrasonically cleaned with alcohol and acetone, and finally air-dried naturally for standby. In this work, 0.60 M NaCl solution was chosen as the electrolyte to simulate the effects of Cl− in seawater, because the content of sodium chloride in seawater is about 3.5% (wt.), which is equivalent to 0.60 M in molar mass. All solutions were prepared with analytical grade reagents and ultrapure water, and the initial pH value of solution was adjusted with hydrochloric and sodium hydroxide. The pH value of sodium chloride solutions with different concentrations is 6.7.
All the electrochemical tests were performed on a Princeton electrochemical workstation (PAR-2263) connected to a computer. During the experiment, the change of OCP was firstly monitored, and the subsequent PDP curves, and EIS were measured after the OCP value stabilized. EIS was performed with a sinusoidal excitation signal with an amplitude of 10 mV to sweep from 100k Hz to 10m Hz and eight points per decade. The PDP curves were scanned from −0.25 V vs. OCP to 1.60 V, and the scanning rate is 1 mV/s. In order to obtain good reproducibility, each group of experiments was repeated at least three times.
3. Results and Discussion
3.1. OCP Study
3.1.1. Effect of NaCl Concentration
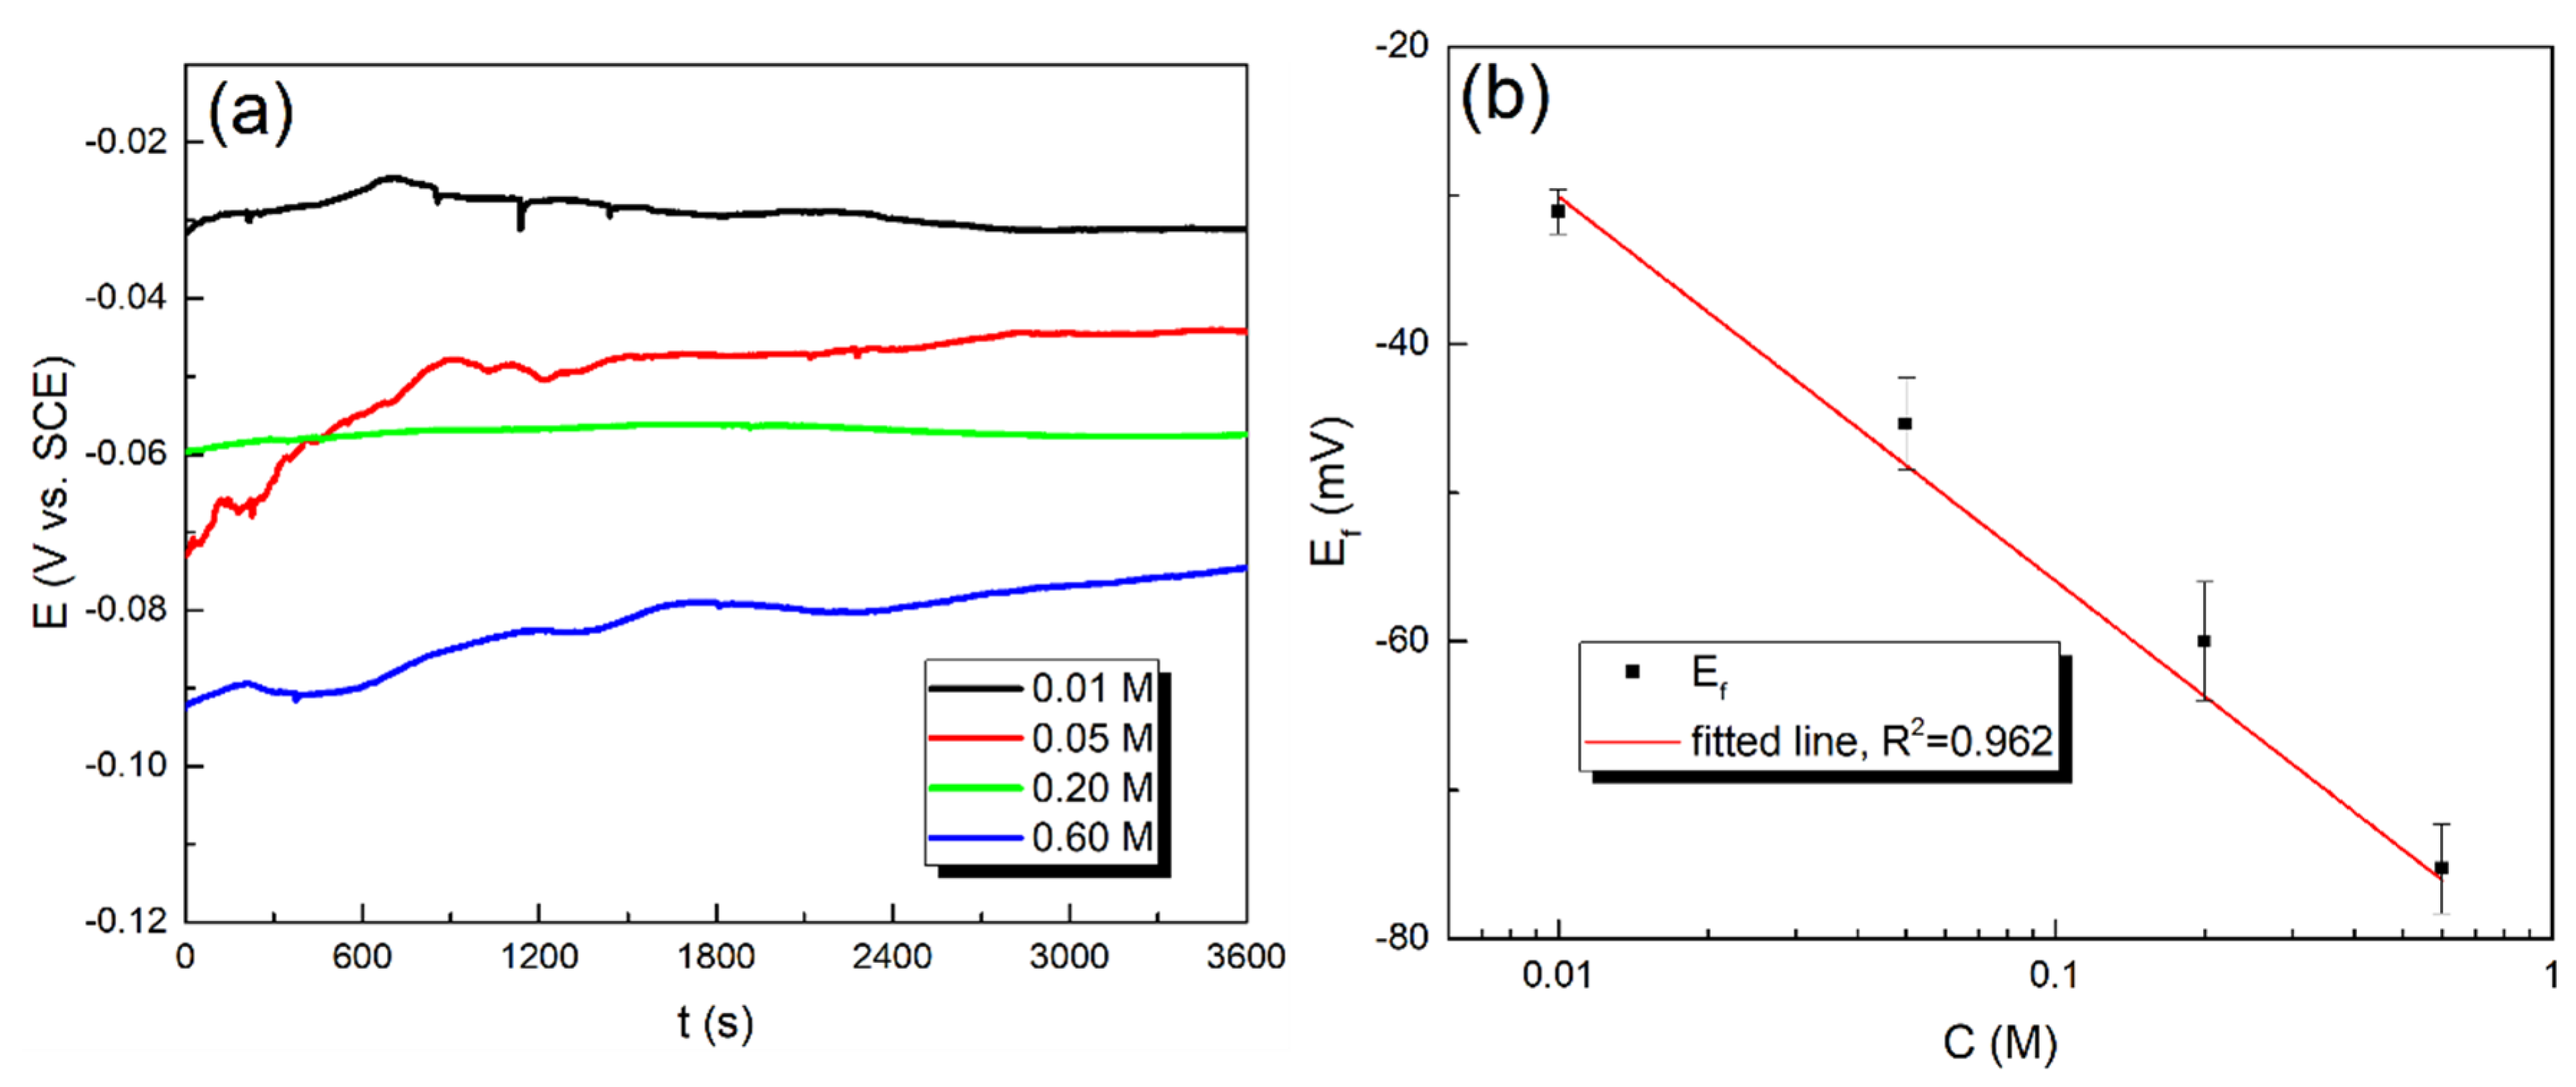
The OCP reflects the electrochemical state between the galena electrode and electrolyte solution interface. Monitoring changes in OCP is to evaluate whether the electrode/solution system has reached a quasi-steady state [32]. The evolution of OCP of galena with time in NaCl solutions of different concentrations (range from 0.01 to 0.60 M) is shown in Figure 1. The potential-time curves show that the potential increases with time initially followed by a gradual stabilization. All the potentials stabilize within a period of half an hour immersion in solutions. This may be due to the formation and development of a passive layer on the galena electrodes surface.
In addition, it is observed in Figure 1b that the final OCP (Ef) value is concentration dependent. As the concentration of sodium chloride solution increases, the Ef value shifts to the negative direction, typically decreasing from −31.1 mV at 0.01 M to −75.3 mV at 0.60 M. It is worth noting that, in sodium chloride solutions, the final OCP values decrease exponentially with increasing concentration. Through software fitting, it is found that the final OCP value and the solution concentration (C) satisfy the following equation:
where, A and B are fitting constants, C is the concentration of sodium chloride solutions, Ef is the final OCP value. The larger the concentration of sodium chloride, the more aggressive the Cl− ions to be adsorbed on the galena electrode surface, which will greatly reduce the Ef value, because the protection of the corrosion product film is reduced [33]. The results show that the deterioration of passive film increases with the increase in NaCl concentration. In other words, galena is more susceptible to corrosion at higher NaCl concentrations. In this way, more Pb2+ ions are released into the solution system. According to the Nernst equation, changes in ion concentration in the solution will affect the electrode potential, and the increasing Pb2+ will definitely reduce the electrode potential of galena. Therefore, the Ef shifts to the negative direction as the concentration of NaCl solution increases. This is consistent with the relationship between Ef and C presented in Equation (1).
However, the same phenomenon has been observed in other sulfide minerals. When sodium chloride solution is used as electrolyte, the OCP of pyrite and pyrrhotite will be reduced [34]. They attribute the decrease of OCP to the increase in electrochemical activity of minerals and the acceleration of oxidation-reduction process of minerals due to the presence of chloride ions.
3.1.2. Effect of pH
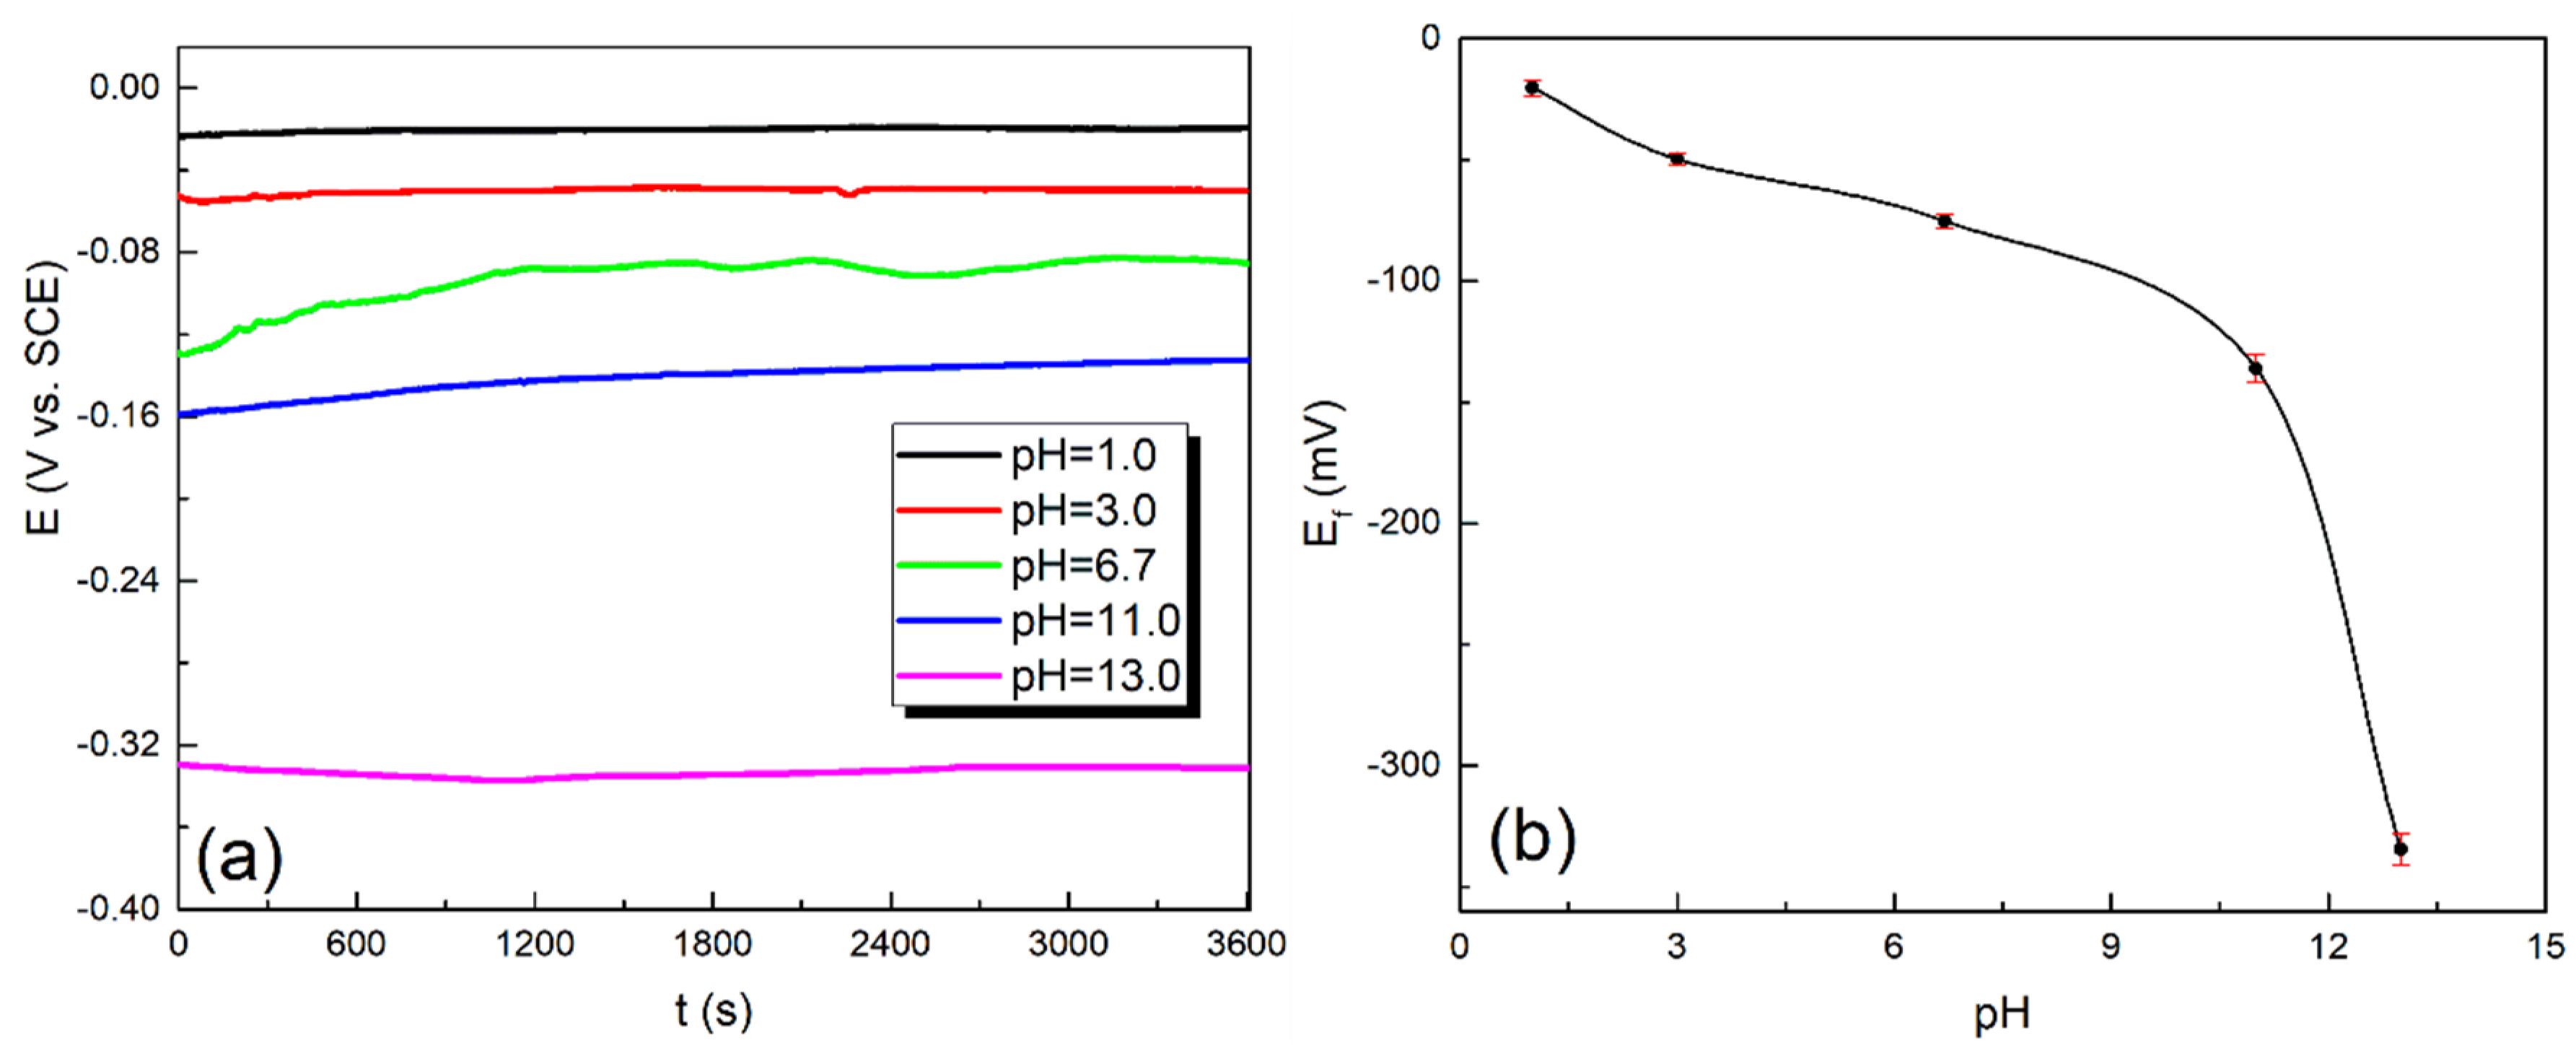
The evolution of OCP of galena with time in 0.60 M NaCl solutions of different pH values (range from 1.0 to 13.0) are shown in Figure 2. Obviously, the pH value of sodium chloride solution has an important influence on the electrochemical reaction of galena. It can be found that the OCP can reach a quasi-stable state quickly in both acidic and alkaline solutions. This indicates that galena has undergone certain highly intense electrochemical reactions at these pH values. Comparing the time-varying curves of open-circuit potentials at five different pH values, the potentials measured at alkaline conditions are lower than the potentials at acidic conditions, with the highest potential at pH = 1.0 and the lowest potential when pH = 13.0.
In addition, it is observed in Figure 2b that the final OCP (Ef) value is closely dependent on pH value. Figure 2b illustrates that there is an inverse relation between pH and potential and with increasing in pH (passing from acidic to alkaline conditions); the Ef value shifts to the negative direction. In acidic solutions, the acidity increases when pH decreases, the Ef increases from −49.8 mV at pH = 3.0 to −20.4 mV at pH = 1.0. While in alkaline solutions, the alkalinity increases when pH increases, the Ef decreases from −136.2 mV at pH = 11.0 to −334.5 mV at pH = 13.0. It seems that the increase in pH value causes the increase in the electrochemical activity of galena. However, the OCP is a mixed potential, which is affected by both the anode reactions and cathode reactions. In general, the cathode reaction may be concerned with hydrogen evolution or oxygen reduction [35]. Based on the general Nernst equation, the equilibrium electrode potential of oxygen reduction is higher than the equilibrium electrode potential of hydrogen evolution, and the two potential values decrease with the increase in pH value [36]. The cathode reaction for galena in no-deaerated solutions is dominated by oxygen reduction, and the related electrode potential of the reaction decreases with the increase in pH value. Moreover, the anodic reaction in the corrosion process of galena is attributed to the oxidation of S element in PbS. Based on the thermodynamic analysis of the Pb-S-H2O system [14,37], the equilibrium electrode potential of S oxidation degrades with the increase in pH value. Therefore, the anode reaction also results in the decrease of Ef value. In conclusion, when the redox atmosphere of the solution does not change significantly, the final OCP of galena will decrease with increasing pH value.
3.2. PDP Study
The OCP method can conveniently measure and judge the corrosion probability and tendency of materials or minerals, but it cannot estimate the corrosion rate and corrosion situation. The accurate judgement method is based on the dynamic data. In this section, the corrosion kinetics of galena in sodium chloride solutions was studied by using PDP technique.
3.2.1. Effect of NaCl Concentration
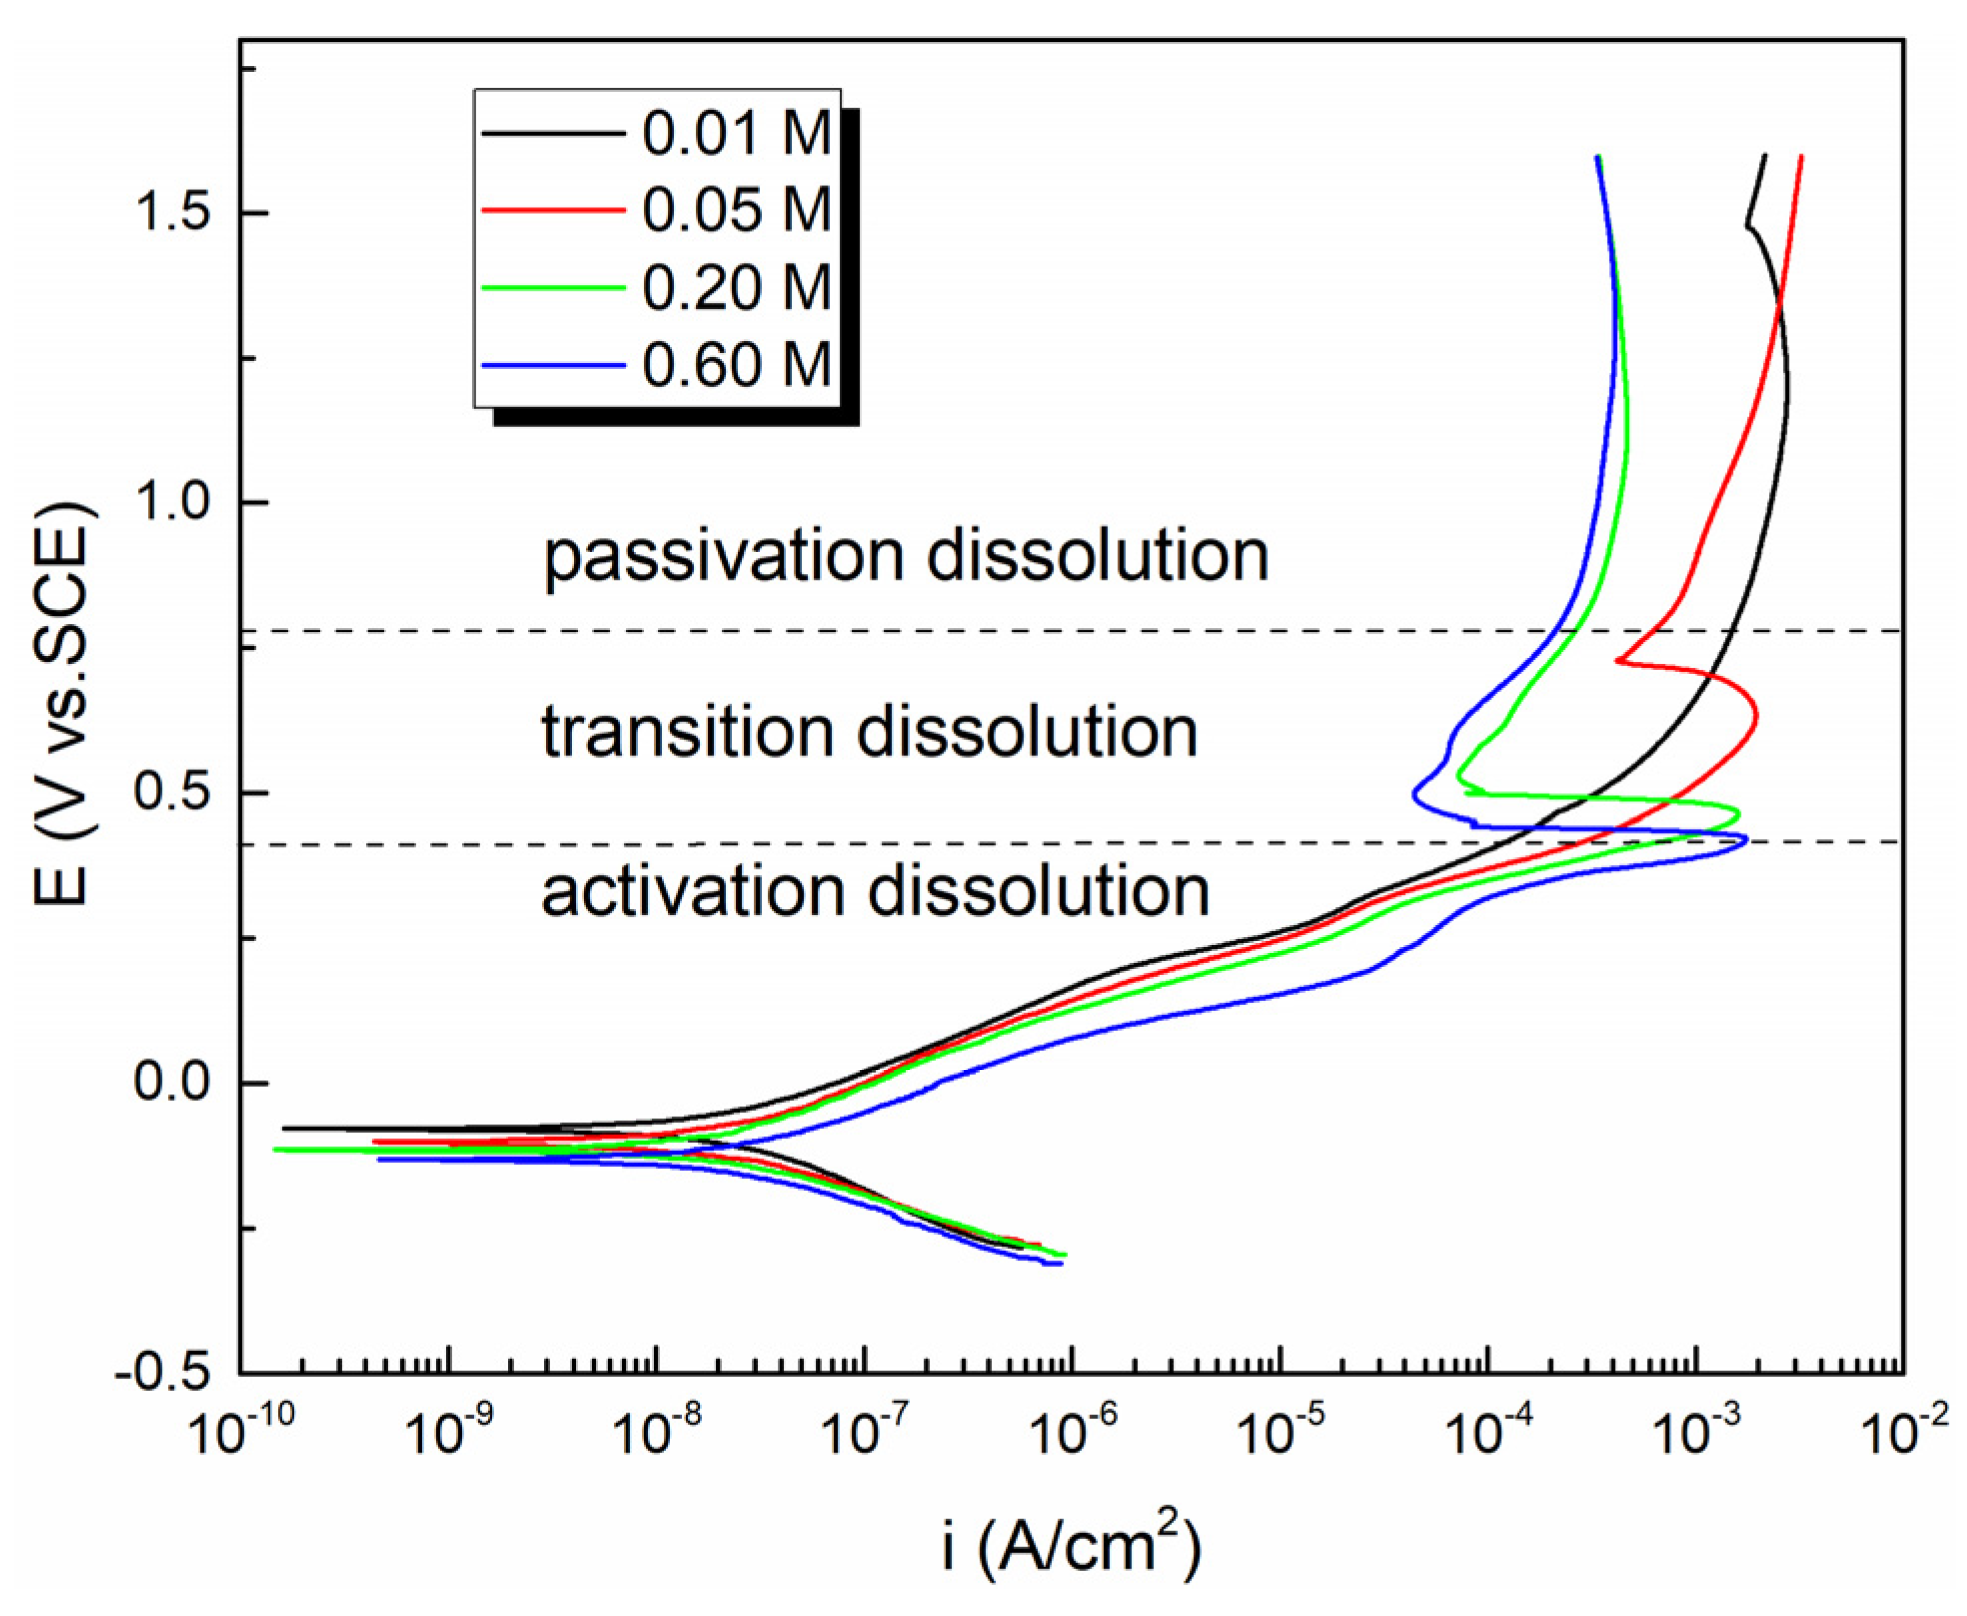
The PDP curves of galena in different concentrations of sodium chloride solutions are shown in Figure 3. It is observed that the four polarization curves in Figure 3 show similar change profiles, indicating the same electrochemical corrosion mechanism. The anode branch of polarization curves consists of three sections, as approximately divided by the dotted lines. The first part refers to the active dissolution region. Beyond the corrosion potential, the current density increases rapidly with the positive-going sweep of potential. The second part refers to the transition dissolution zone. As the positive shift of the potential, the current density drops sharply, this seems to be more pronounced at higher concentrations, such as the 0.20 M and 0.60 M curve. In this part, the surface state of the mineral changes abruptly, and a protective film begins to be formed. The surface product is most likely elemental sulfur (Reaction (2)). The sulfur (S0) is unstable and oxidation will continue with the formation of thiosulfate and sulfate according to Reactions (3) and (4) [11,38]. The last part refers to the passivation dissolution region. The current density is basically independent of the scanning potential. The electrode surface may form a stable barrier layer. It should be emphasized here that these reactions that occur in the above three regions are only preliminary speculations. According to the research work of Urbano et al. [39], the surface characterization (e.g., SEM-EDX, FTIR, or XPS) of the working electrodes polarized in those three regions will be helpful for deduction. Because current work pays more attention to kinetics research, there is not much discussion about surface characterization here.
For the mineral electrodes tested, the corrosion parameters including the corrosion potential (Ecorr), the corrosion current density (icorr), the cathode and anode Tafel slopes (βc and βa), as a function of sodium chloride solution concentration are listed in Table 1. Corrosion parameters such as Ecorr and icorr were obtained by Tafel linear extrapolation. In order to ensure that the polarization curve fitting is in the strong polarization region, the straight-line region beyond 50 mV above and below the corrosion potential is selected as the fitting section in this study.
It is found that there is a lower corrosion potential Ecorr in the solution with higher NaCl concentration, it declines from −79.03 mV in 0.01 M to −132.02 mV in 0.60 M. This indicates that the presence of more chloride ions increases the surface activity of galena electrode, thus galena is more susceptible to corrosion. The corrosion potential value is slightly lower than the final OCP at the same concentration, because the polarization curve starts from a relatively negative reduction potential. Ecorr shifts towards negative direction, which is consistent with the decrease of Ef with the increasing concentration. The reason for this change is the same as Ef, which will not be explained in detail here.
However, the corrosion current density icorr increases with the increase in concentration. It rises from 2.13 × 10⁻⁸ A/cm2 in 0.01 M to 3.06 × 10⁻⁸ A/cm2 in 0.60 M, which indicates that galena has a higher corrosion rate at high concentrations, that is, the presence of more aggressive chloride ions can accelerate the electrochemical dissolution of galena. The anode and cathode Tafel slopes βa and βc are also affected by the concentration changes. When the concentration of NaCl solution increases from 0.01 M to 0.60 M, βa decreases from 177.85 mV/dec to 138.59 mV/dec, indicating that the increase in chloride ions is beneficial to the anode reaction. The passive film on the surface of galena is deteriorated, and its protective property is reduced, thereby accelerating the anodic oxidation of galena. Meanwhile, when the concentration of NaCl solution increases from 0.01 M to 0.60 M, βc decreases from 167.11 mV/dec to 125.52 mV/dec, indicating that the increasing NaCl is also beneficial to the cathode reaction. The conductivity of the electrolyte will undoubtedly increase due to the presence of more Na+ and Cl− in the solution. The stronger solution conductivity will prolong the path of reaction current, which will lead to the charge generated by anodic oxidation reaction on the galena electrode surface being consumed by the redox reaction far away from the surface of galena [40]. Namely, increasing conductivity leads to an increase in the region that can support oxygen reduction, and thus leads to an increase in the oxygen reduction current, eventually resulting in an increase in the cathodic reaction rate.
3.2.2. Effect of pH
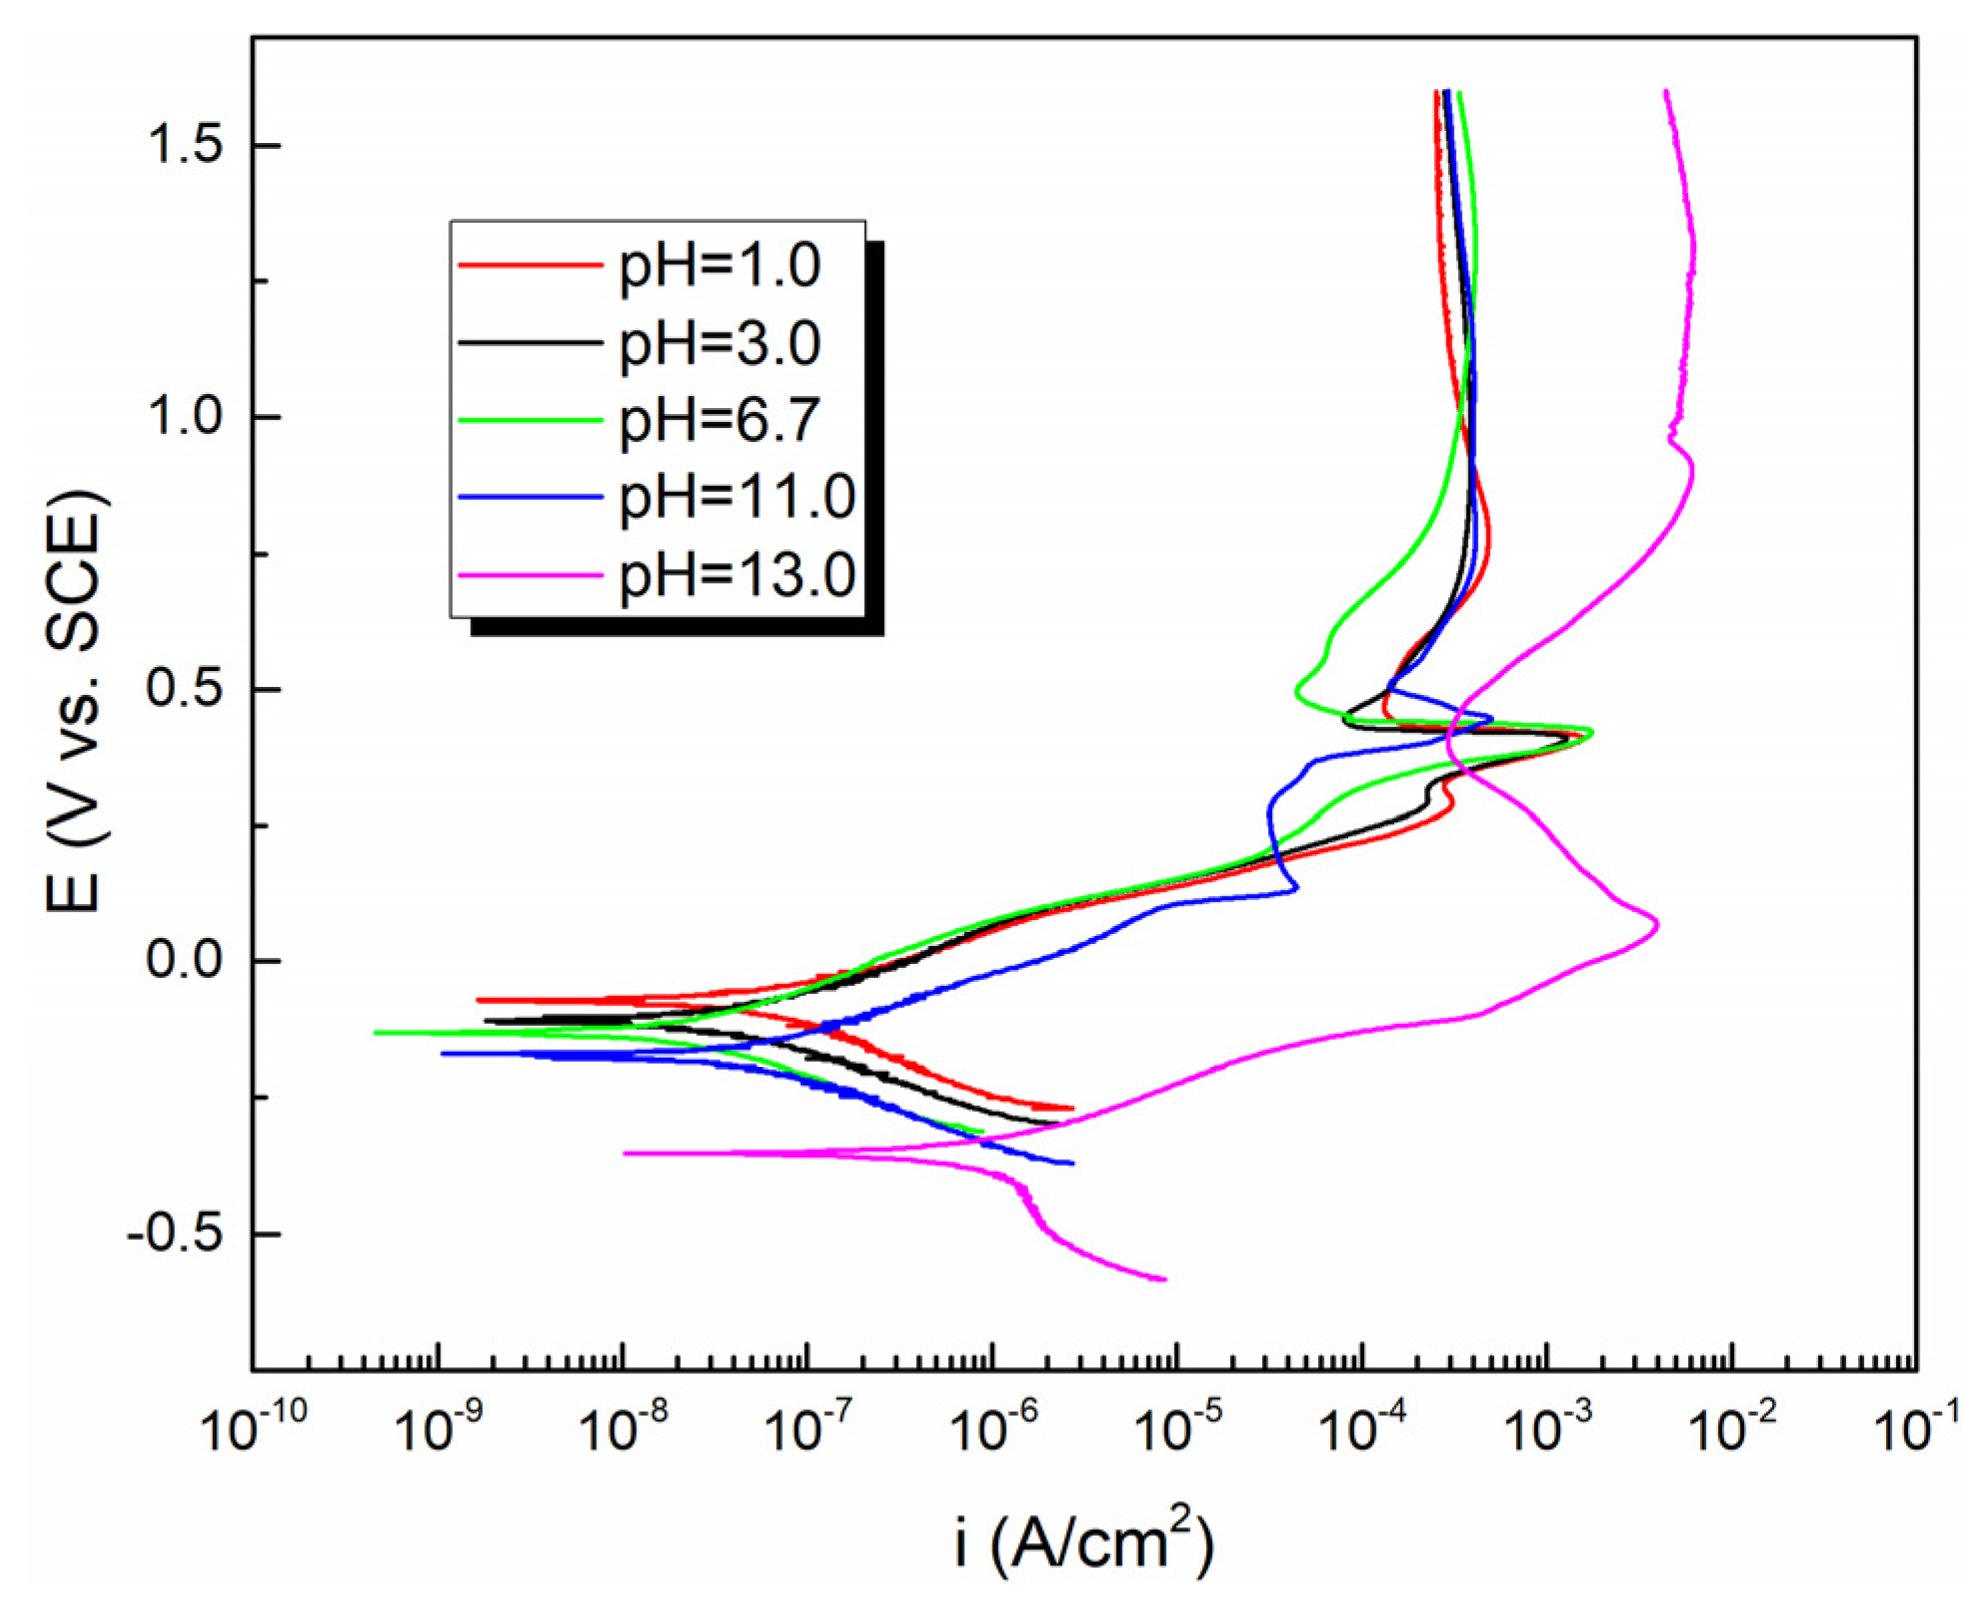
The PDP curves of galena in 0.60 M NaCl solutions of different pH values (range from 1.0 to 13.0) are shown in Figure 4. In acidic solutions, the polarization curves present a similar profile, indicating the same electrochemical reaction mechanism. However, in alkaline solutions, the polarization curves obviously move towards the lower right, showing an increasing current density and a decreasing potential, which suggests that the corrosion of galena is intensified under higher alkalinity.
The corrosion parameters including the corrosion potential (Ecorr), the corrosion current density (icorr), the anode and cathode Tafel slopes, βa and βc, as a function of pH value of NaCl solution are listed in Table 2. The corrosion potential value is slightly lower than the final OCP at the same pH, because the polarization curve starts from a relatively negative reduction potential. It is found that there is a lower corrosion potential Ecorr in the NaCl solution with higher pH. Ecorr shifts towards negative direction, which is consistent with the decrease of Ef with the increasing pH value. In acidic solutions, the acidity increases when pH decreases, the Ecorr increases from −106.83 mV at pH = 3.0 to −70.94 mV at pH = 1.0. While in alkaline solutions, the alkalinity increases when pH increases, the Ecorr decreases from −174.17 mV at pH = 11.0 to −349.73 mV at pH = 13.0. The reason for this change is the same as Ef, which will not be mentioned repeatedly here.
When galena is in acidic NaCl solutions, the icorr increases from 3.06 × 10⁻⁸ A/cm2 to 6.15 × 10⁻⁸ A/cm2 with decreasing pH from 6.7 to 1.0, showing that higher acidity in favor of galena dissolution. This means that higher acidity accelerates the rate of corrosion reaction of galena. The reasons for this phenomenon are listed as below. Under acidic conditions, in the anode galena is oxidized according to Reaction (2), S0 is generated and absorbed onto the surface of galena electrode. Oxygen is reduced at the cathode according to Reaction (5). Higher acidity is beneficial to S0 dissolution and O2 reduction. Therefore, the higher acidity leads to the decrease in the Tafel slope of anode and cathode, as shown in Table 2.
When galena is in alkaline NaCl solutions, the icorr increases from 5.21 × 10⁻⁸ A/cm2 to 8.16 × 10⁻⁷ A/cm2 with an increasing pH from 11.0 to 13.0, showing that higher alkalinity is also in favor of galena dissolution. This means that higher alkalinity accelerates the rate of corrosion reaction of galena. Unlike in acidic solutions, the anode Tafel slope decreases while the cathode Tafel slope increases in alkaline solution. In alkaline conditions, oxygen reduction at the cathode is represented by Reaction (6). When the basicity is enhanced, that is, an increase in the OH− concentration is not conducive to the Reaction (6), the larger the cathode Tafel slope will become. The absence of βc in pH = 13.0 is attributed to no significant linear region in the cathode branch of the polarization curve. For potentials further from Ecorr the shape of each branch eventually becomes an accurate representation of the kinetics of the anodic and cathodic corrosion reactions. When the overpotential is greater than about 50 mV both branches are under activation control and exhibit linearity in accord with the Tafel relationship. However, in this work the solution is stationary and when the pH is higher, the presence of more OH− hinders the Reaction (6), the diffusion of oxygen will be slow, and concentration polarization can act to shorten the cathodic linear Tafel region. In the extreme case, linearity may disappear altogether, with the cathodic reduction reaction under combined activation and diffusion control. However, higher OH− concentration is in favor of the anodic oxidation reaction process via Reactions (7) and (8), which results in a decreasing βa value. Liu and Jin et al. also obtained similar results when galena was in an alkaline medium [9,12].
3.3. EIS Study
3.3.1. Effect of NaCl Concentration
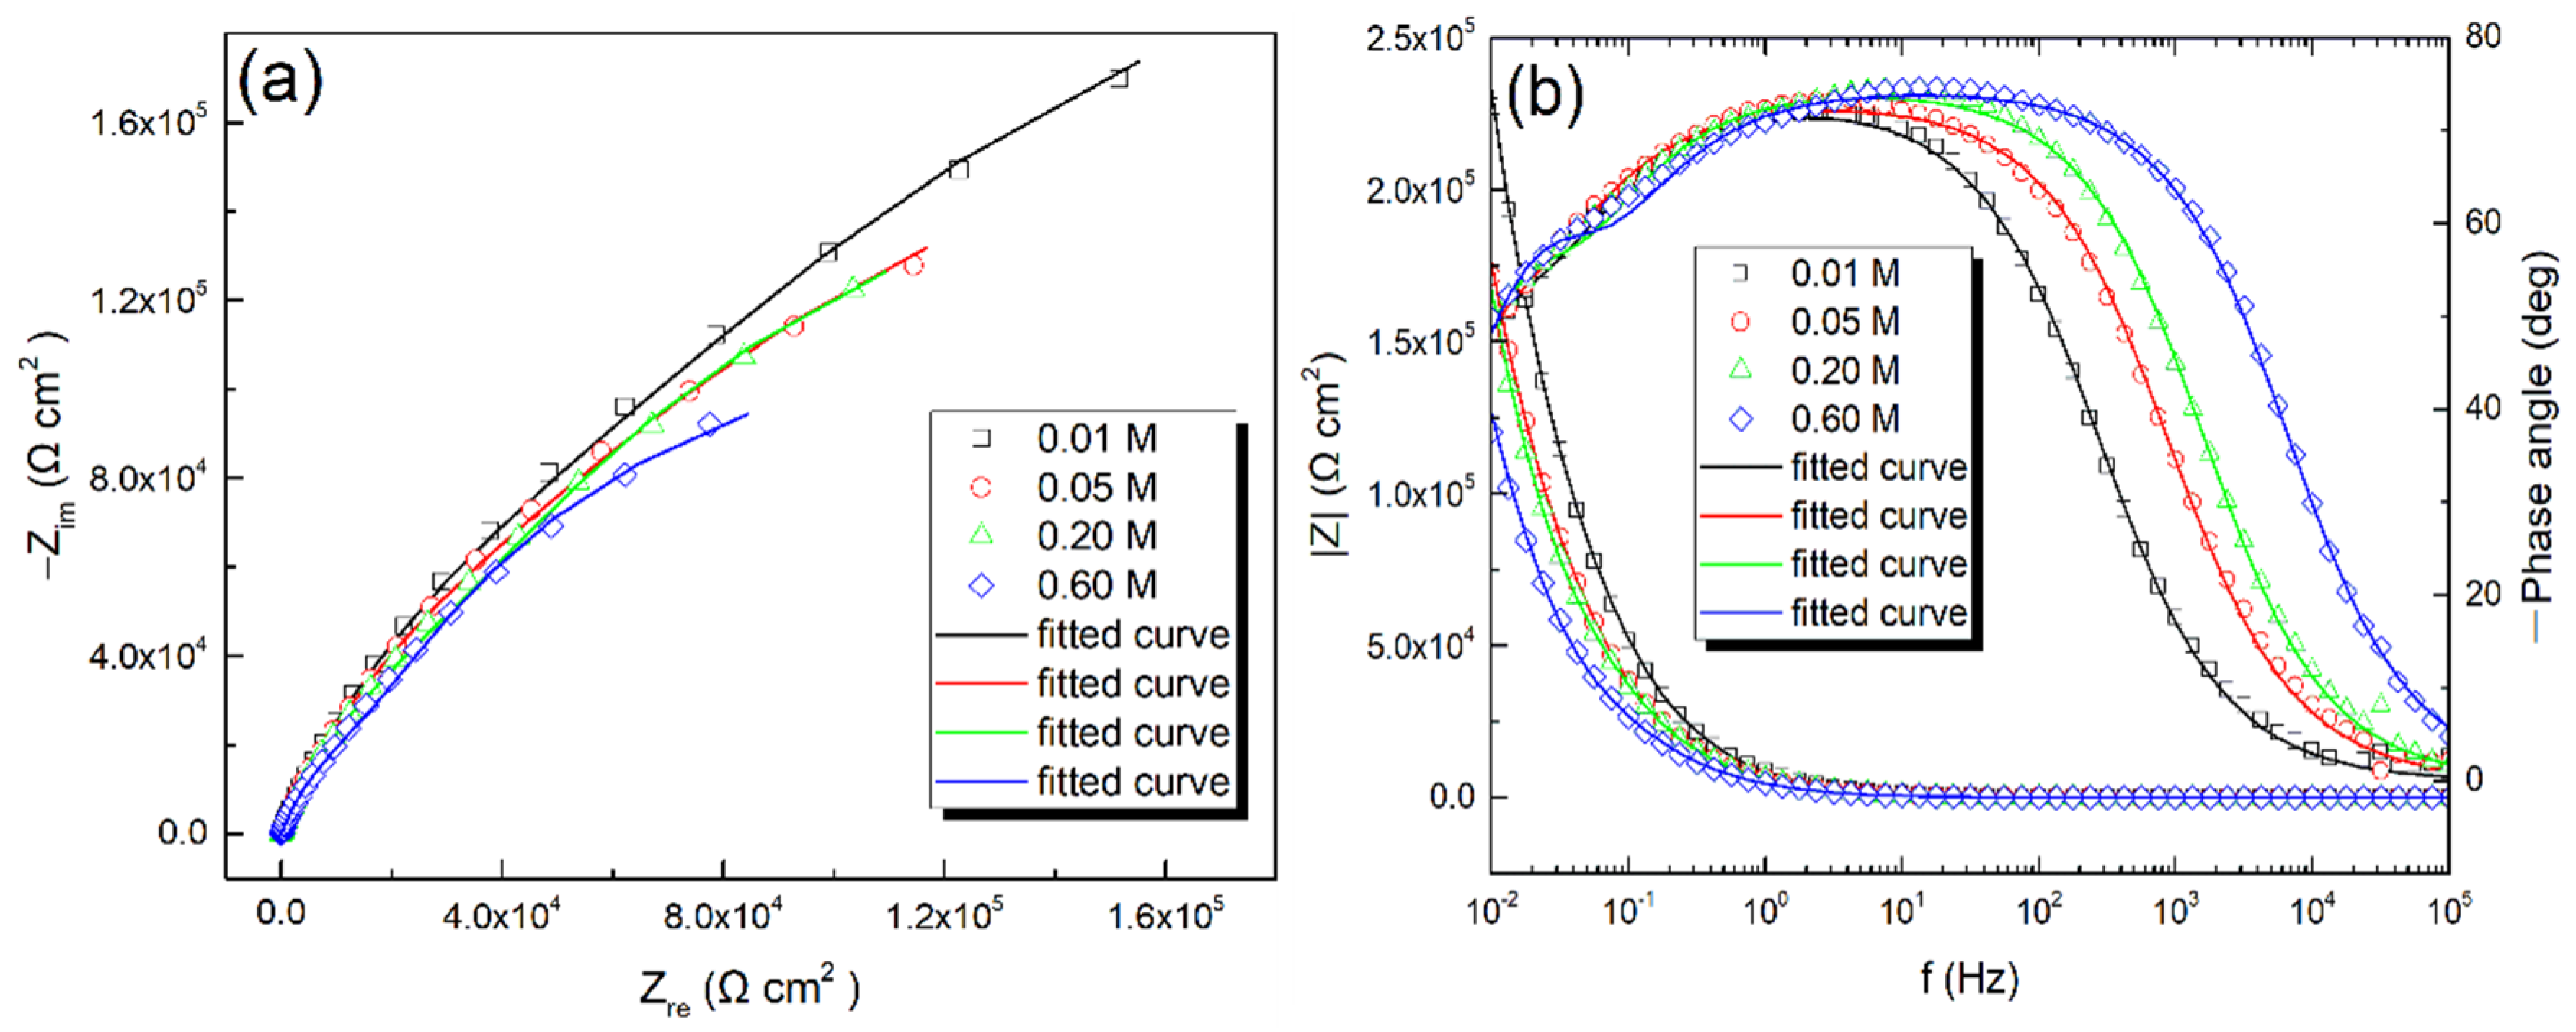
EIS can provide more information about the structure of the electrode/solution interface and electrode process kinetics. Figure 5 shows the experimental EIS of galena in different concentrations of NaCl. In four different concentrations of the tested solution, both the Nyquist and Bode plots have a similar profile, indicating that galena has the same corrosion mechanism in the tested solutions. In Bode plots, the phase angles show a broad peak from low to medium high frequency regions, and are accompanied by a large maximum phase angle, approaching 80°. It suggests that a passive layer may form under these situations. In the measured frequency range, higher modulus values are obtained at lower concentrations. As presented in Nyquist plots, they appear as a depressed semi-circular arc in the impedance complex plane, and the radius decreases as the concentration of the solution increases. The behavior for this deviation from an ideal semicircle is attributed to the frequency dispersion and the inhomogeneities of the passive layer surface [35]. Considering these effects, when using the equivalent circuit method to analysis the experimental EIS data, a constant phase element (CPE) is usually introduced into the proposed equivalent circuit to replace the idea capacitor to represent the non-ideal behavior of the capacitive element [41].
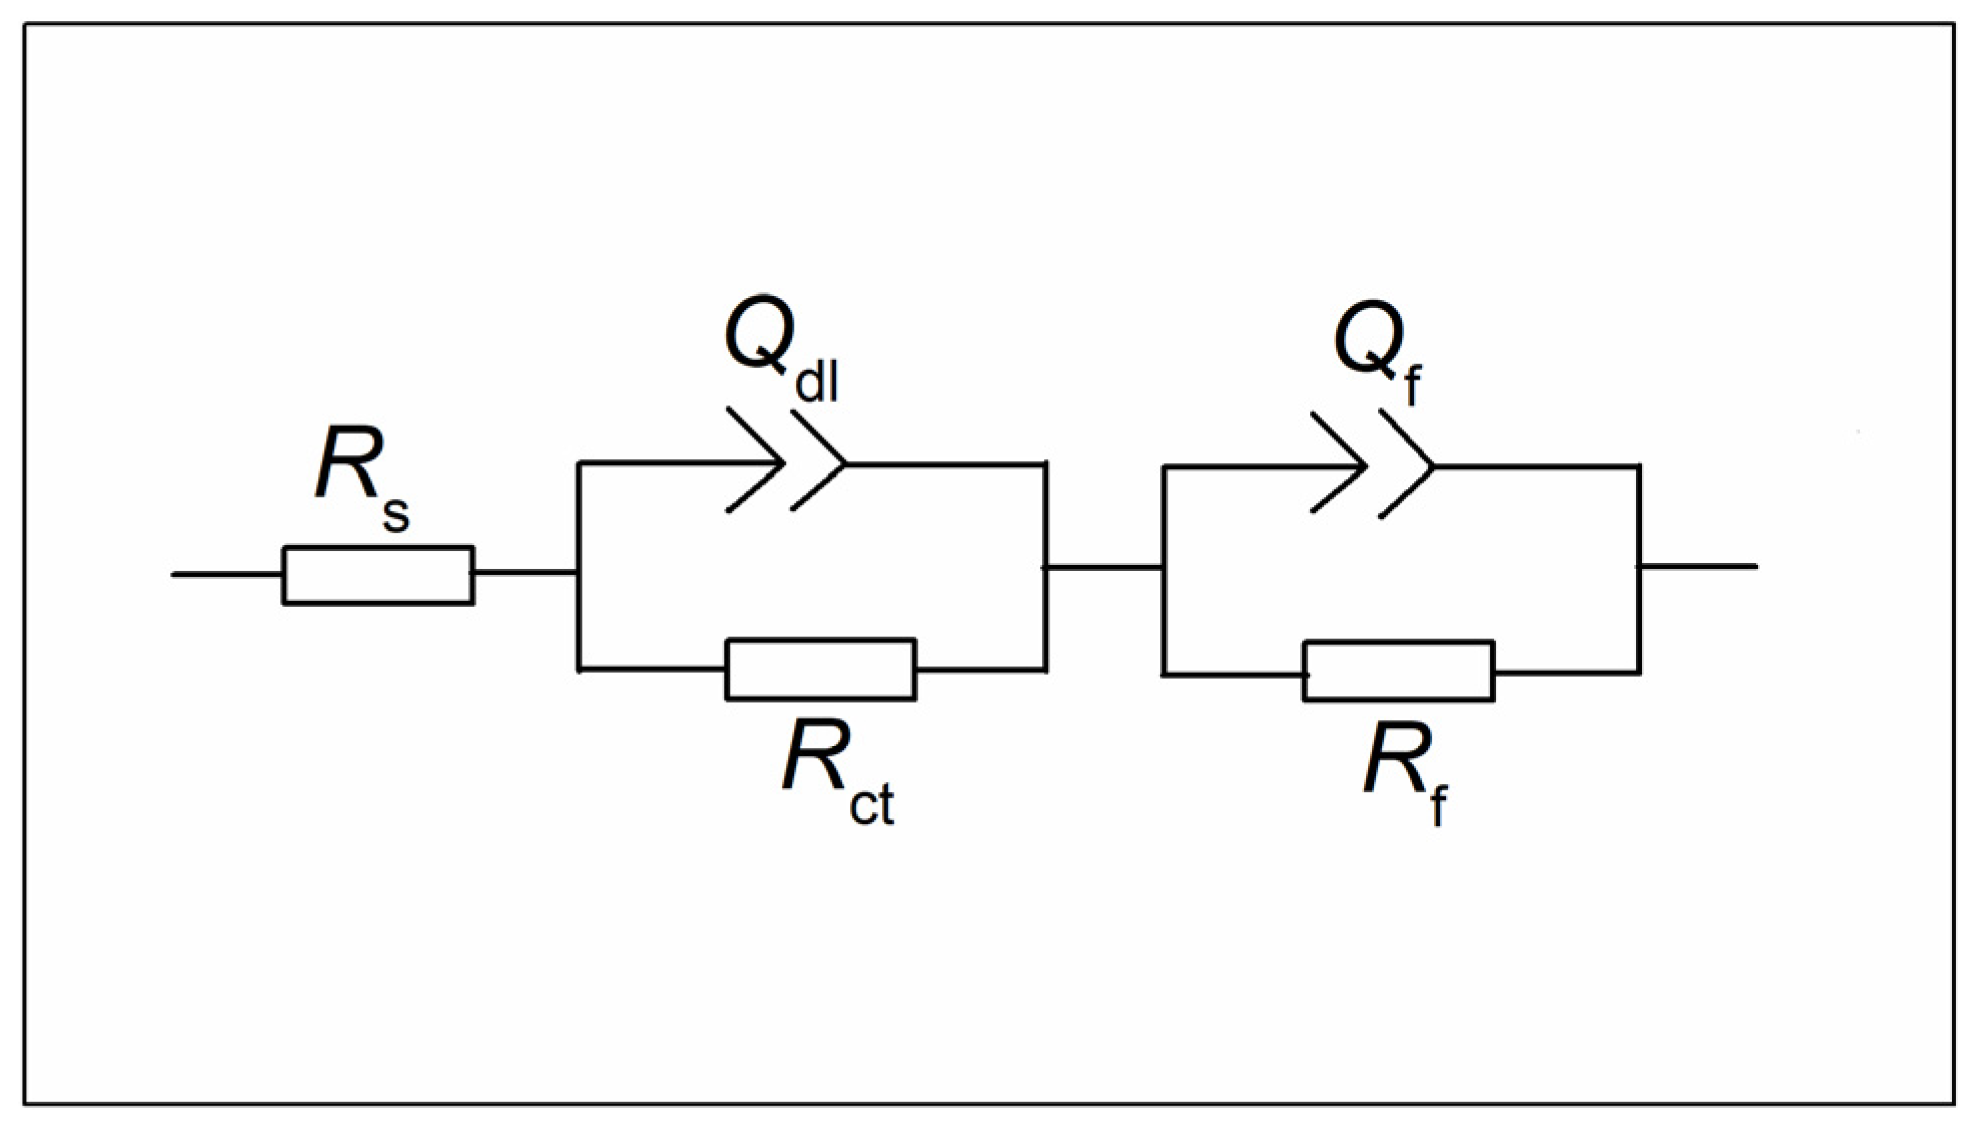
The equivalent circuit model, as shown in Figure 6, is employed to analyse the experimental EIS data. The fitting results are also present in Figure 5, which shows a good fit. Zheng et al. used this model to simulate the pyrite oxidation under simulated acid rain weathering conditions [42]. In this model, Rs is the solution resistance between the galena electrode and auxiliary electrode, Rf corresponds to the passive film resistance and Qf is the CPE used to describe the capacitance behavior of the passive layer, Rct is the charge transfer resistance, Qdl is used to represent capacitive behavior of the electrical double layer.
The fitted impedance parameters are presented in Table 3. A very small chi square (χ2) value with an order of magnitude of 10−4 indicates that the fitting results are reliable [43]. When the sodium chloride content in the electrolyte increases from 0.01 M to 0.60 M, the Rs correspondingly changes from 88.48 Ω cm2 to 3.36 Ω cm2. The decrease in the Rs values is due to the increase in the conductivity of the electrolyte as the solution concentration increases, for the electrolyte contains only sodium chloride. The corrosion rate of galena can be characterized by the charge transfer resistance Rct in a sense, and also the lower Rct the higher the corrosion rate. As NaCl solutions concentration increases from 0.01 M to 0.60 M, Rct exhibits a downward tendency and the Rct value ranges from 9.109 × 10⁴ Ω cm2 to 4.361 × 10⁴ Ω cm2. The decrease of Rct values suggests that the electron/charge can be easily transferred at the electrode/solution interface, and the increase in Cdl can be attributed to the increase in the local dielectric constant of the double layer [12]. The characteristics of low resistance and large capacitance for the double layer suggest that the electrochemical oxidation of galena will be enhanced by increasing the concentration of NaCl solution, which is consistent with the results of the polarization curve studies, that is, higher concentrations can accelerate the electrochemical corrosion of galena.
For the corrosion products layer formed on the surface of galena electrodes, increasing the concentration results in a decrease in Rf and an increase in Cf. In this work, the Cf and Cdl are determined based on the Brug’s formula [44]. The higher Cf values suggest the smaller thickness of the passive film formed on galena electrode surface. The CPE parameter n values are all less than 1, indicating the inhomogeneity of the passivation film. Since Rf corresponds to the resistance of the passive film, the Rf values lower also means that the thickness of film is reduced and the barrier properties are deteriorated. In summary, the changes of Rf and Rct are attributed to the presence of aggressive anion Cl− with a very small ion radius. The presence of more Cl− has two functions, one is to promote the electrochemical reaction, and the other is to deteriorate the passive layer covering the surface of galena.
3.3.2. Effect of pH
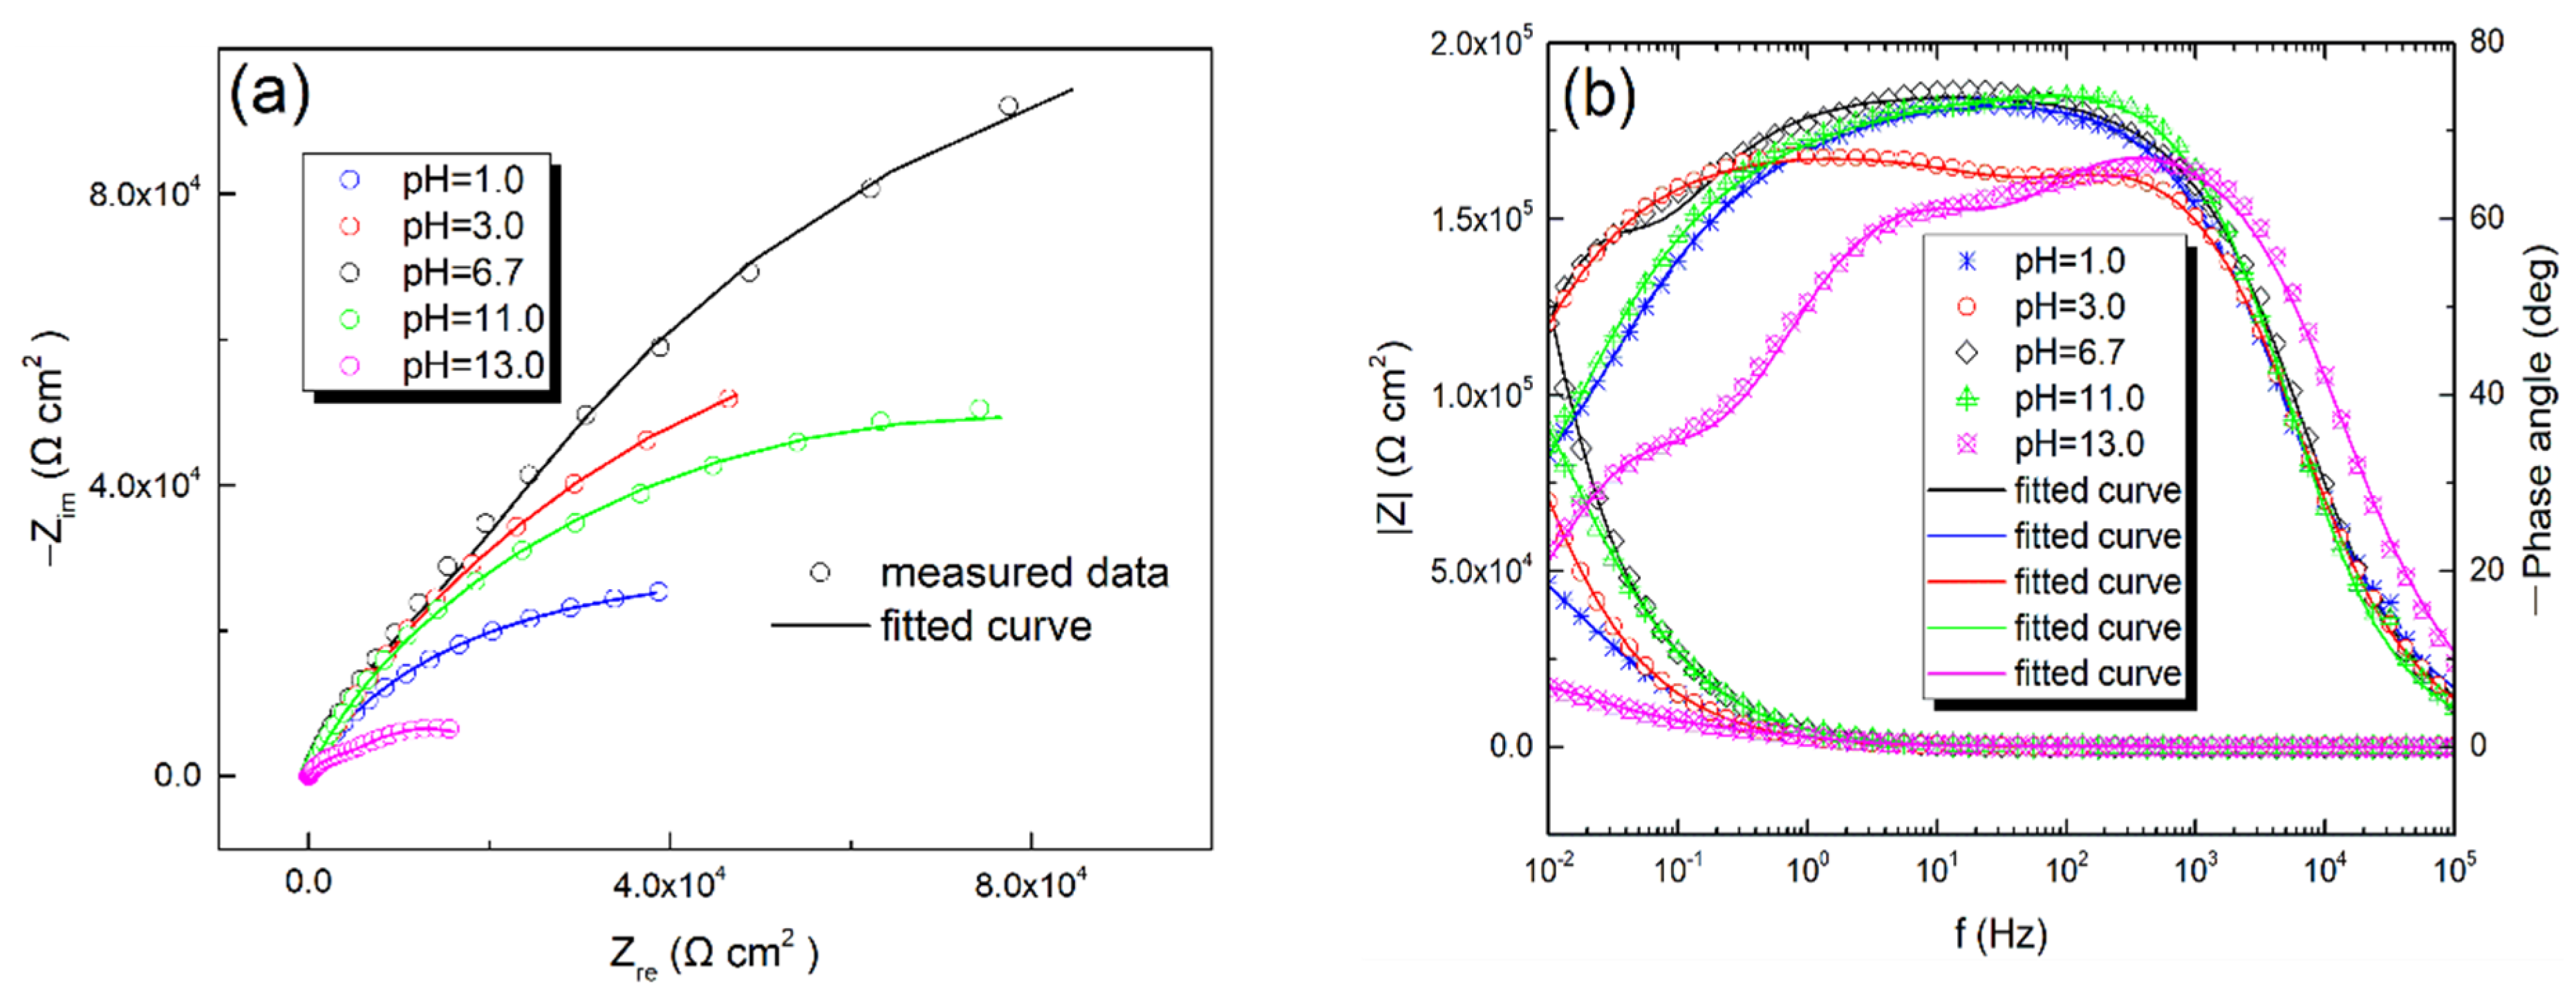
Figure 7 shows the EIS (a) Nyquist and (b) Bode plots for galena in 0.60 M NaCl solution as a function of pH value. It is observed that the Nyquist plots presented flattened semi-circles in NaCl solutions of different pH values. The radius of the semi-circular arc becomes larger as the pH increases in the acidic solution, while the radius of the arc decreases when the pH increases in the alkaline solution. It is preliminarily judged in this work whether stronger acidity or stronger alkalinity is beneficial to the corrosion reaction of galena. In Figure 7b, the phase angle observed at pH 13.0 shows a different aspect compared to those measured at other pH values. It shows a peak at mid to high frequencies and a shoulder peak at a lower frequency at pH 13.0, thus, two time constants can be clearly observed. While at other pH values, only one broad peak can be observed in the entire frequency range. This is because there are two overlapping time constants coupled together in these plots. In addition, it is likely that in Figure 7a, the Nyquist plot at pH 13.0 also showed a different profile from those at other pH values. This is also due to the coupling effect of time constant, which is shown as a widened capacitive reactance arc on the Nyquist plot at other pH values. The equivalent circuit shown in Figure 6 is also used to simulate the EIS data of galena in 0.60 M NaCl with different pH values. The fitted results are also presented in Figure 7, and the fitted parameters are listed in Table 4.
When galena is in acidic NaCl solutions, the Rct decreases from 4.361 × 10⁴ Ω cm2 to 2.945 × 10⁴ Ω cm2 and pH decreases from 6.7 to 1.0; when galena is in the electrolyte of alkaline condition, the Rct decreases from 3.834 × 10⁴ Ω cm2 to 0.569 × 10⁴ Ω cm2 while pH increases from 11.0 to 13.0. This means that higher acidity (alkalinity) accelerates the rate of corrosion reaction of galena, because the charge transfer is facilitated at the double layer. This is evidenced by the increasing Cdl when galena is exposed to higher acidity and alkalinity. It is consistent with the experimental results of polarization curve. On the other hand, for the passive layer formed on galena surface, increasing the acidity (alkalinity) results in a decrease in the Rf values and an increasing tendency towards the Cf. This indicates that the deterioration of passive film generated by galena dissolution will be aggravated in higher acidic and alkaline sodium chloride solutions.
3.4. Environmental Risk Assessment
Mining activities in SMS deposits can cause local seawater to be diluted or concentrated to varying degrees, and the pH of peripheral seawater also will be affected and changed. In these cases, the electrochemical corrosion kinetics of galena in seawater context is undoubtedly influenced by NaCl concentration and pH value. In order to assess the potential impact of SMS mining, particularly on the release of heavy metal ion Pb2+, so that appropriate management strategies can be designed and implemented, the rate of galena weathering is calculated based on the following equation [45]:
where R refers to dissolution rate, g m−2 d−1, K is a constant and K = 8.953 × 10⁻³ g cm2 μA−1 m−2 d−1 [45], Ew = W/n, is considered dimensionless in calculation, W is atomic weight of the element, and n is the valence of the element, icorr is corrosion current density, μA/cm2. In the 0.60 M NaCl solution with pH = 6.7, the icorr is 3.06 × 10⁻⁸ A/cm2 for galena, suggesting the Pb2+ release rate is 2.849 × 10⁻² g m−2 d−1, that is, when the area of galena is 1 m2, it will release 10.399 g Pb2+ to the surrounding region in one year. When the solution pH decreases to 1.0, the icorr is 5.07 × 10⁻⁸ A/cm2, the released Pb2+ increases to 20.823 g per year. Significantly, in alkaline conditions of pH = 13.0, up to 276.269 g Pb2+ are released. Therefore, adjusting the pH of the galena mining environment can reduce the impact of lead ion pollution. Acero et al. studied the dissolution rate of galena in HCl solutions with pH 1–3 using flow-through experiments, and the rate for lead was about 10−10 mol m−2 s−1 [22]. While in this work the obtained rate is in the order of 10−9 mol m−2 s−1, the differences may be due to different experimental conditions. This difference may be attributed to solution state, galena sample preparation, and duration. In this work, the solid galena samples are immersed in static solutions. While, their flow-through experiments used powder galena mineral samples. However, the main cause of the difference must be the shorter duration (less than 5 h) of the experiments in this work compared with the longer experimental (1200–1800 h) runs in the flow-through experiments.
4. Conclusions
In this work, the weathering behavior of galena was studied in NaCl solution to simulate the effects of Cl− in seawater context. The kinetics of galena oxidation was studied by in situ electrochemical methods. The galena weathering process undergoes an activation-passivation transition in the sodium chloride solutions, and forms a passive film on the galena surface. The OCP results indicate that the presence of chloride ions increases the electrochemical activity of the galena surface. As the concentration of sodium chloride increases, the corrosion current density increases, and the dissolution of galena is accelerated, which is mainly due to the promotion of the electrochemical reaction and the deterioration of the passivation film on its surface. Higher acidity or alkalinity stimulates galena electrochemical dissolution. Concretely, the corrosion current density increases from 3.06 × 10⁻⁸ to 6.15 × 10⁻⁸ A/cm2 when the pH decreases from 6.7 to 1.0, and from 5.21 × 10⁻⁸ to 8.16 × 10⁻⁷ A/cm2 when the pH increases from 11.0 to 13.0. These phenomena are attributed to the existence of a large amount of H+ or OH−, which decreases the charge transfer resistance of the double layer and reduces the passive film resistance at the electrode surface, although the interaction mechanism in the cathode is different.
Author Contributions
Conceptualization, N.W. and H.L.; methodology, L.Z.; resources, L.Z.; writing—original draft preparation, L.Z.; writing—review and editing, L.Z.; project administration, N.W. and H.L.; funding acquisition, H.L. All authors have read and agreed to the published version of the manuscript.
Funding
This research was funded by the National Key Research and Development Plan, grant number 2016YFC0600104 and the ‘‘135” Program of the Institute of Geochemistry, Chinese Academy of Sciences (CAS).
Conflicts of Interest
The authors declare no conflict of interest.
References
- Fallon, E.K.; Petersen, S.; Brooker, R.A.; Scott, T.B. Oxidative dissolution of hydrothermal mixed-sulphide ore: An assessment of current knowledge in relation to seafloor massive sulphide mining. Ore Geol. Rev. 2017, 86, 309–337. [Google Scholar] [CrossRef] [Green Version]
- Johnson, A.W.; Gutiérrez, M.; Gouzie, D.; McAliley, L.R. State of remediation and metal toxicity in the Tri-State Mining District, USA. Chemosphere 2016, 144, 1132–1141. [Google Scholar] [CrossRef]
- Gutiérrez, M.; Mickus, K.; Camacho, L.M. Abandoned PbZn mining wastes and their mobility as proxy to toxicity: A review. Sci. Total Environ. 2016, 565, 392–400. [Google Scholar] [CrossRef]
- Chen, J.; Chen, Y.; Long, X.; Li, Y. DFT study of coadsorption of water and oxygen on galena (PbS) surface: An insight into the oxidation mechanism of galena. Appl. Surf. Sci. 2017, 420, 714–719. [Google Scholar] [CrossRef]
- Lara, R.H.; Briones, R.; Monroy, M.G.; Mullet, M.; Humbert, B.; Dossot, M.; Naja, G.M.; Cruz, R. Galena weathering under simulated calcareous soil conditions. Sci. Total Environ. 2011, 409, 3971–3979. [Google Scholar] [CrossRef]
- Flores-Álvarez, J.M.; ddElizondo-Álvarez, M.A.; Dávila-Pulido, G.I.; Guerrero-Flores, A.D.; Uribe-Salas, A. Electrochemical behavior of galena in the presence of calcium and sulfate ions. Miner. Eng. 2017, 111, 158–166. [Google Scholar] [CrossRef]
- Zheng, K.; Li, H.P.; Wang, L.Y.; Wen, X.Y.; Liu, Q.Y. Galena weathering under simulated acid rain conditions: Electrochemical processes and environmental assessments. Environ. Sci. Processes Impacts 2018, 20, 822–832. [Google Scholar] [CrossRef]
- Johnson, J.W.; Chang, J.; Narasagoudar, R.A.; O’Keefe, T.J. Anodic dissolution of galena concentrate in perchloric acid. J. Appl. Electrochem. 1978, 8, 25–32. [Google Scholar] [CrossRef]
- Jin, G.H.; Wang, L.Y.; Zheng, K.; Li, H.P.; Liu, Q.Y. Influence of pH, Pb2+, and temperature on the electrochemical dissolution of galena: Environmental implications. Ionics 2016, 22, 975–984. [Google Scholar] [CrossRef]
- Liu, Q.Y.; Jin, G.H.; Zheng, K.; Wen, X.Y.; Li, H.P. Influence of temperature and potential on the electrochemical dissolution of galena in HNO3 at pH 2.0. Int. J. Electrochem. Sci. 2017, 12, 7004–7016. [Google Scholar] [CrossRef]
- Güler, T. Redox behavior of galena in alkaline condition. Ionics 2018, 24, 221–227. [Google Scholar] [CrossRef]
- Liu, Q.Y.; Li, H.P.; Jin, G.H.; Zheng, K.; Wang, L.Y. Assessing the influence of humic acids on the weathering of galena and its environmental implications. Ecotox. Environ. Saf. 2018, 158, 230–238. [Google Scholar] [CrossRef]
- Paul, R.L.; Nicol, M.J.; Diggle, J.W.; Saunders, A.P. The electrochemical behaviour of galena (lead sulphide)—I. Anodic dissolution. Electrochim. Acta 1978, 23, 625–633. [Google Scholar] [CrossRef]
- Nicol, M.J.; Paul, R.L.; Diggle, J.W. The electrochemical behaviour of galena (lead sulphide)—II. Cathodic reduction. Electrochim. Acta 1978, 23, 635–639. [Google Scholar] [CrossRef]
- Nava, J.L.; Oropeza, M.T.; González, I. Electrochemical characterisation of sulfur species formed during anodic dissolution of galena concentrate in perchlorate medium at pH 0. Electrochim. Acta 2002, 47, 1513–1525. [Google Scholar] [CrossRef]
- Moreno-Medrano, E.D.; Casillas, N.; Cruz, R.; Lara-Castro, R.H.; Barcena-Soto, M.; Larios-Duran, E.R. Impedance study during anodic oxidation of native galena in a highlyconcetrated xanthate solution. Int. J. Electrochem. Sci. 2011, 6, 6319–6331. [Google Scholar]
- Moreno-Medrano, E.D.; Casillas, N.; Cruz, R.; Lara-Castro, R.H.; Larios-Duran, R.; Barcena-Soto, M. EIS evaluation of kinetics parameters for the oxidation of galena in presence of xanthate. ECS Trans. 2013, 47, 173–179. [Google Scholar] [CrossRef]
- Elizondo-Alvarez, M.A.; Davila-Pulido, G.I.; Bello-Teodoro, S.; Uribe-Salas, A. Role of pH on the adsorption of xanthate and dithiophosphinate onto galena. Can. Metall. Q. 2019, 58, 107–115. [Google Scholar] [CrossRef]
- Shapter, J.G.; Brooker, M.H.; Skinner, W.M. Observation of the oxidation of galena using Raman spectroscopy. Int. J. Miner. Process. 2000, 60, 199–211. [Google Scholar] [CrossRef]
- Nowak, P.; Laajalehto, K. Oxidation of galena surface—An XPS study of the formation of sulfoxy species. Appl. Surf. Sci. 2000, 157, 101–111. [Google Scholar] [CrossRef]
- De Giudici, G.; Rossi, A.; Fanfani, L.; Lattanzi, P. Mechanisms of galena dissolution in oxygen-saturated solutions: Evaluation of pH effect on apparent activation energies and mineral-water interface. Geochim. Cosmochim. Acta 2005, 69, 2321–2331. [Google Scholar] [CrossRef]
- Acero, P.; Cama, J.; Ayora, C. Rate law for galena dissolution in acidic environment. Chem. Geol. 2007, 245, 219–229. [Google Scholar] [CrossRef]
- Chernyshova, I.V. Anodic processes on a galena (PbS) electrode in the presence of n-butyl xanthate studied FTIR-spectroelectrochemically. J. Phys. Chem. B 2001, 105, 8185–8191. [Google Scholar] [CrossRef]
- Chernyshova, I.V. Anodic oxidation of galena (PbS) studied FTIR-spectroelectrochemically. J. Phys. Chem. B 2001, 105, 8178–8184. [Google Scholar] [CrossRef]
- Chernyshova, I.V. In situ FTIR-spectroelectrochemical study of the anodic processes on a galena (PbS) electrode under open-air conditions in the absence and presence of n-butyl xanthate. Langmuir 2002, 18, 6962–6968. [Google Scholar] [CrossRef]
- Ralston, J. The chemistry of galena flotation: Principles & practice. Miner. Eng. 1994, 7, 715–735. [Google Scholar]
- Chen, J.; Ke, B.; Lan, L.; Li, Y. Influence of Ag, Sb, Bi and Zn impurities on electrochemical and flotation behaviour of galena. Miner. Eng. 2015, 72, 10–16. [Google Scholar] [CrossRef]
- Wu, Z.H.; Dreisinger, D.B.; Urch, H.; Fassbender, S. The kinetics of leaching galena concentrates with ferric methanesulfonate solution. Hydrometallurgy 2014, 142, 121–130. [Google Scholar] [CrossRef]
- Boschen, R.E.; Rowden, A.A.; Clark, M.R.; Gardner, J.P.A. Mining of deep-sea seafloor massive sulfides: A review of the deposits, their benthic communities, impacts from mining, regulatory frameworks and management strategies. Ocean Coast. Manag. 2013, 84, 54–67. [Google Scholar] [CrossRef] [Green Version]
- Ferreira da Silva, E.; Bobos, I.; Xavier Matos, J.; Patinha, C.; Reis, A.P.; Cardoso Fonseca, E. Mineralogy and geochemistry of trace metals and REE in volcanic massive sulfide host rocks, stream sediments, stream waters and acid mine drainage from the Lousal mine area (Iberian Pyrite Belt, Portugal). Appl. Geochem. 2009, 24, 383–401. [Google Scholar] [CrossRef]
- Aikawa, K.; Ito, M.; Segawa, T.; Jeon, S.; Park, I.; Tabelin, C.B.; Hiroyoshi, N. Depression of lead-activated sphalerite by pyrite via galvanic interactions: Implications to the selective flotation of complex sulfide ores. Miner. Eng. 2020, 152, 106367. [Google Scholar] [CrossRef]
- Cisneros-González, I.; Oropeza-Guzmán, M.T.; González, I. Cyclic voltammetry applied to the characterisation of galena. Hydrometallurgy 1999, 53, 133–144. [Google Scholar] [CrossRef]
- Leckie, H.P.; Uhlig, H.H. Environmental factors affecting the critical potential for pitting in 18–8 Stainless Steel. J. Electrochem. Soc. 1966, 113, 1262–1267. [Google Scholar] [CrossRef]
- Moslemi, H.; Shamsi, P.; Habashi, F. Pyrite and pyrrhotite open circuit potentials study: Effects on flotation. Miner. Eng. 2011, 24, 1038–1045. [Google Scholar] [CrossRef]
- Sun, H.; Wu, X.; Han, E.-H.; Wei, Y. Effects of pH and dissolved oxygen on electrochemical behavior and oxide films of 304SS in borated and lithiated high temperature water. Corros. Sci. 2012, 59, 334–342. [Google Scholar] [CrossRef]
- Liu, X.; Wu, X.; Han, E.-H. Influence of Zn injection on characteristics of oxide film on 304 stainless steel in borated and lithiated high temperature water. Corros. Sci. 2011, 53, 3337–3345. [Google Scholar] [CrossRef]
- Kobayashi, M.; Kametani, H. The Eh-pH diagram of the Pb-S-H2O systems and its correlation with lattice imperfection and electronic charge carriers in PbS. Hydrometallurgy 1989, 22, 141–157. [Google Scholar] [CrossRef]
- Hemmingsen, T. The electrochemical reaction of sulphur—Oxygen compounds—Part I. A review of literature on the electrochemical properties of sulphur/sulphur—Oxygen compounds. Electrochim. Acta 1992, 37, 2775–2784. [Google Scholar] [CrossRef]
- MacDonald, D.D.; Urquidi-MacDonald, M. A coupled environment model for stress corrosion cracking in sensitized type 304 stainless steel in LWR environments. Corros. Sci. 1991, 32, 51–81. [Google Scholar] [CrossRef]
- Urbano, G.; Reyes, V.E.; Veloz, M.A.; González, I.; Cruz, J. Pyrite—arsenopyrite galvanic interaction and electrochemical reactivity. J. Phys. Chem. C 2008, 112, 10453–10461. [Google Scholar] [CrossRef]
- Ries, L.A.S.; Da Cunha Belo, M.; Ferreira, M.G.S.; Muller, I.L. Chemical composition and electronic structure of passive films formed on Alloy 600 in acidic solution. Corros. Sci. 2008, 50, 676–686. [Google Scholar] [CrossRef]
- Zheng, K.; Li, H.; Wang, L.; Wen, X.; Liu, Q. Pyrite oxidation under simulated acid rain weathering conditions. Environ. Sci. Pollut. Res. 2017, 24, 21710–21720. [Google Scholar] [CrossRef]
- de Assis, S.L.; Wolynec, S.; Costa, I. Corrosion characterization of titanium alloys by electrochemical techniques. Electrochim. Acta 2006, 51, 1815–1819. [Google Scholar] [CrossRef]
- Brug, G.J.; van den Eeden, A.L.G.; Sluyters-Rehbach, M.; Sluyters, J.H. The analysis of electrode impedances complicated by the presence of a constant phase element. J. Electroanal. Chem. 1984, 176, 275–295. [Google Scholar] [CrossRef]
- ASTM G 102-89. Standard Practice for Calculation of Corrosion Rates and Related Information from Electrochemical Measurements; 100 Barr Harbor Drive: West Conshohocken, PA, USA, 1989. [Google Scholar]
Figure 1.
The variation of open circuit potential (OCP) with time for galena in different concentrations of NaCl solutions at pH 6.7 (a), and (b) the relationship between Ef and concentration.
Figure 1.
The variation of open circuit potential (OCP) with time for galena in different concentrations of NaCl solutions at pH 6.7 (a), and (b) the relationship between Ef and concentration.

Figure 2.
The variation of OCP for galena with time in NaCl solutions with different pH (a), and (b) the relationship between Ef and pH.
Figure 2.
The variation of OCP for galena with time in NaCl solutions with different pH (a), and (b) the relationship between Ef and pH.

Figure 3.
The potentiodynamic polarization (PDP) curves of galena in different concentrations of NaCl solutions at pH 6.7.
Figure 3.
The potentiodynamic polarization (PDP) curves of galena in different concentrations of NaCl solutions at pH 6.7.

Figure 4.
The PDP curves of galena in of NaCl solutions with different pH values.

Figure 5.
Typical electrochemical impedance spectra (EIS) (a) Nyquist diagram, and (b) Bode diagram for galena in NaCl solutions of different concentrations at pH 6.7.
Figure 5.
Typical electrochemical impedance spectra (EIS) (a) Nyquist diagram, and (b) Bode diagram for galena in NaCl solutions of different concentrations at pH 6.7.

Figure 6.
The equivalent circuit of the EIS for galena in NaCl solutions of different concentrations at pH 6.7.
Figure 6.
The equivalent circuit of the EIS for galena in NaCl solutions of different concentrations at pH 6.7.

Figure 7.
Typical EIS (a) Nyquist diagram, and (b) Bode diagram for galena in NaCl solution of different pH values.
Figure 7.
Typical EIS (a) Nyquist diagram, and (b) Bode diagram for galena in NaCl solution of different pH values.


Table 1.
The corrosion parameters obtained from the PDP measurements for the galena electrode in NaCl solutions of different concentrations.
Table 1.
The corrosion parameters obtained from the PDP measurements for the galena electrode in NaCl solutions of different concentrations.
| C (M) | Ecorr (mV) | icorr (A/cm2) | βa (mV/dec) | βc (mV/dec) |
|---|---|---|---|---|
| 0.01 | −79.03 | 2.13 × 10⁻⁸ | 177.85 | 167.11 |
| 0.05 | −102.12 | 2.41 × 10⁻⁸ | 155.55 | 142.89 |
| 0.20 | −115.16 | 2.88 × 10⁻⁸ | 153.83 | 138.28 |
| 0.60 | −132.02 | 3.06 × 10⁻⁸ | 138.59 | 125.52 |
Table 2.
The corrosion parameters obtained from the PDP measurements for the galena electrode in NaCl solutions of different pH values.
Table 2.
The corrosion parameters obtained from the PDP measurements for the galena electrode in NaCl solutions of different pH values.
| pH | Ecorr (mV) | icorr (A/cm2) | βa (mV/dec) | βc (mV/dec) |
|---|---|---|---|---|
| 1.0 | −70.94 | 6.15 × 10⁻⁸ | 105.08 | 119.57 |
| 3.0 | −106.83 | 4.95 × 10⁻⁸ | 118.22 | 121.25 |
| 6.7 | −132.02 | 3.06 × 10⁻⁸ | 138.59 | 125.52 |
| 11.0 | −174.17 | 5.21 × 10⁻⁸ | 120.95 | 126.58 |
| 13.0 | −349.73 | 8.16 × 10⁻⁷ | 111.88 | - 1 |
1 The absence of βc in pH = 13.0.
Table 3.
Fitted impedance parameters for galena in NaCl solutions with different concentrations.
| C (M) | Rs (Ω cm2) | Y0, dl × 105 | n | Cdl × 105 | Rct × 10−4 | Y0,f × 105 | n | Cf × 105 | Rf × 10−5 | χ2 × 10⁴ |
|---|---|---|---|---|---|---|---|---|---|---|
| (S sn cm−2) | (F cm−2) | (Ω cm2) | (S sn cm−2) | (F cm−2) | (Ω cm2) | |||||
| 0.01 | 88.48 | 4.514 | 0.8269 | 6.069 | 9.109 | 3.691 | 0.8216 | 6.959 | 5.026 | 2.92 |
| 0.05 | 25.37 | 5.411 | 0.8225 | 7.435 | 8.059 | 4.274 | 0.7957 | 9.054 | 4.354 | 2.82 |
| 0.20 | 7.53 | 6.026 | 0.8109 | 8.006 | 5.612 | 4.614 | 0.8032 | 9.193 | 3.613 | 3.56 |
| 0.60 | 3.36 | 6.490 | 0.7988 | 8.434 | 4.361 | 6.839 | 0.8668 | 10.490 | 2.369 | 1.81 |
Table 4.
Fitted impedance parameters for galena in NaCl solutions with different pH values.
| pH | Rs | Y0, dl × 105 | n | Cdl × 105 | Rct × 10−4 | Y0, f × 105 | n | Cf × 105 | Rf × 10−5 | χ2 × 10⁴ |
|---|---|---|---|---|---|---|---|---|---|---|
| (Ω cm2) | (S sn cm−2) | (F cm−2) | (Ω cm2) | (S sn cm−2) | (F cm−2) | (Ω cm2) | ||||
| 1.0 | 2.28 | 7.538 | 0.8138 | 9.047 | 2.945 | 11.02 | 0.7904 | 19.080 | 0.719 | 4.54 |
| 3.0 | 3.21 | 7.038 | 0.8120 | 8.794 | 3.719 | 8.035 | 0.7799 | 16.680 | 1.656 | 3.05 |
| 6.7 | 3.36 | 6.490 | 0.7988 | 8.434 | 4.361 | 6.839 | 0.8668 | 10.490 | 2.369 | 1.81 |
| 11.0 | 3.17 | 6.825 | 0.8084 | 8.573 | 3.834 | 7.932 | 0.8283 | 13.710 | 1.767 | 3.29 |
| 13.0 | 2.25 | 13.080 | 0.7629 | 11.940 | 0.569 | 15.18 | 0.7849 | 22.760 | 0.289 | 5.75 |
© 2020 by the authors. Licensee MDPI, Basel, Switzerland. This article is an open access article distributed under the terms and conditions of the Creative Commons Attribution (CC BY) license (http://creativecommons.org/licenses/by/4.0/).
Share and Cite
MDPI and ACS Style
Zha, L.; Li, H.; Wang, N. Electrochemical Study of Galena Weathering in NaCl Solution: Kinetics and Environmental Implications. Minerals 2020, 10, 416. https://doi.org/10.3390/min10050416
AMA Style
Zha L, Li H, Wang N. Electrochemical Study of Galena Weathering in NaCl Solution: Kinetics and Environmental Implications. Minerals. 2020; 10(5):416. https://doi.org/10.3390/min10050416
Chicago/Turabian StyleZha, Lei, Heping Li, and Ning Wang. 2020. "Electrochemical Study of Galena Weathering in NaCl Solution: Kinetics and Environmental Implications" Minerals 10, no. 5: 416. https://doi.org/10.3390/min10050416
Note that from the first issue of 2016, this journal uses article numbers instead of page numbers. See further details here.