Article

Training-Induced Increase in V·O2max and Critical Power, and Acceleration of V·O2 on-Kinetics Result from Attenuated Pi Increase Caused by Elevated OXPHOS Activity

by
Bernard Korzeniewski
BioSimulation Center, PL 30-110 Kraków, Poland
Metabolites 2023, 13(11), 1111; https://doi.org/10.3390/metabo13111111
Submission received: 22 August 2023 / Revised: 16 September 2023 / Accepted: 21 September 2023 / Published: 27 October 2023
(This article belongs to the Special Issue Metabolomic Advances in Promoting Exercise-Induced Metabolic Changes)

Abstract

:
Computer simulations using a dynamic model of the skeletal muscle bioenergetic system, involving the Pi-double-threshold mechanism of muscle fatigue, demonstrate that the training-induced increase in  V · O2max, increase in critical power (CP) and acceleration of primary phase II of the  V · O2 on kinetics (decrease in t0.63) is caused by elevated OXPHOS activity acting through a decrease in and slowing of the Pi (inorganic phosphate) rise during the rest-to-work transition. This change leads to attenuation of the reaching by Pi of Pipeak, peak Pi at which exercise is terminated because of fatigue. The delayed (in time and in relation to  V · O2 increase) Pi rise for a given power output (PO) in trained muscle causes Pi to reach Pipeak (in very heavy exercise) after a longer time and at a higher  V · O2; thus, exercise duration is lengthened, and  V · O2max is elevated compared to untrained muscle. The diminished Pi increase during exercise with a given PO can cause Pi to stabilize at a steady state less than Pipeak, and exercise can continue potentially ad infinitum (heavy exercise), instead of rising unceasingly and ultimately reaching Pipeak and causing exercise termination (very heavy exercise). This outcome means that CP rises, as the given PO is now less than, and not greater than CP. Finally, the diminished Pi increase (and other metabolite changes) results in, at a given PO (moderate exercise), the steady state of fluxes (including  V · O2) and metabolites being reached faster; thus, t0.63 is shortened. This effect of elevated OXPHOS activity is possibly somewhat diminished by the training-induced decrease in Pipeak.

Graphical Abstract

1. Introduction

The maximal oxygen consumption ( V · O2max), critical power (CP) and  V · O2 on-kinetics are key properties of skeletal muscle and the whole-body bioenergetic system in humans.  V · O2max determines the maximal capacity of oxidative phosphorylation (OXPHOS) for the ATP supply under given conditions; CP corresponds to the maximal work intensity at which a steady state of fluxes (including  V · O2) and metabolites can be achieved and above which short-term fatigue is initiated; the characteristic transition time t0.63 of the primary phase II of the  V · O2 on-kinetics (time to reach 63% of the  V · O2 amplitude) describes how fast the system responds to the rest-to-work transition; and the slow component of the  V · O2 on-kinetics corresponds to an increasing inefficiency of the system related to muscle fatigue that ultimately leads to the termination of exercise.  V · O2max and CP are higher, t0.63 is shorter, and the slow component is lower in physically active/trained individuals than in sedentary/untrained individuals and especially in older individuals and patients with mitochondrial myopathies and cardiovascular diseases. Therefore, these properties constitute a good and convenient measure of the efficiency of the human bioenergetic system.
Numerous experimental studies have demonstrated that endurance training affects several system properties at the physiological level, for example, increasing the maximal oxygen consumption rate  V · O2max [1,2,3,4,5,6,7,8,9,10,11,12,13,14] and augmenting critical power CP [3,4,5], and accelerating primary phase II of  V · O2 on-kinetics (shortening the transition time t0.63) [7,11,13,14,15]. Endurance training also diminishes the  V · O2 slow component [2,9,11,16].
On the other hand, endurance training also enhances the bioenergetic system at the skeletal muscle cell level, namely elevating the amount/activity of OXPHOS enzymes and whole mitochondria. In particular, training increases total mitochondrial protein [17,18], elevates the amount of enzymes involved in mitochondrial bioenergetics [17,18,19,20], increases the skeletal muscle oxidative/respiratory capacity [19,20,21], augments the OXPHOS activity in mitochondria [10,22], increases the activity of mitochondrial enzymes (complex II, complex III, cytochrome oxidase (COX, complex IV), complex V (ATP synthase), citrate synthase (CS) and ATP/ADP carrier (ANT)) [10,13,14,22,23,24] and increases the mitochondrial volume density [1,8,13,14,23,24,25]. In some cases, the last property is not affected [24].
It was also shown that end-exercise Pi at work termination because of fatigue is more than twice lower in trained, compared to untrained, rowers [26], while end-exercise Pi, H+ and H2PO4- in exhausting exercise are lower in younger individuals than in older people, who can be regarded in a sense as “detrained” individuals [27].
The “Pi double-threshold” mechanism of muscle fatigue was postulated recently [28,29]. This mechanism assumes that: (1) the additional ATP usage, underlying the slow component of the  V · O2 and metabolites on-kinetics, begins when Pi exceeds a critical value, Picrit [28]; (2) muscle work is terminated because of fatigue when Pi reaches a peak value, Pipeak [30]; and (3) the increases in Pi and additional ATP usage reciprocally stimulate each other, creating a positive feedback loop (self-driving mechanism) [28]. In sufficiently intense exercise, Pi ultimately reaches Pipeak (and  V · O2 reaches  V · O2max), and exercise is terminated because of exhaustion. The first threshold, corresponding to Picrit (point 1), the second threshold, corresponding to Pipeak (point 2), and positive feedback (point 3) were introduced previously in relation to an abstract fatigue factor F, representing various fatigue-related metabolites: H+, NH4+, IMP, AMP, ADP, Pi, etc. [31].
The “Pi double-threshold” mechanism is able to generate numerous different, apparently unrelated properties of the skeletal muscle bioenergetic system: time courses of relevant variables, including of muscle (and pulmonary)  V · O2, cytosolic ADP, pH, PCr and Pi during the rest–work transition; the constancy of these variable values at the end of exercise at various power outputs above critical power, the hyperbolic power–duration curve with an asymptote in the form of critical power and the decrease or increase in CP and  V · O2max and increase or decrease in t0.63 caused by hypoxia or hyperoxia, respectively [28].
The discussed mechanism also allows for consideration of the effect of mutations in mitochondrial and nuclear DNA, leading to impairment of OXPHOS in mitochondrial myopathy (MM) patients regarding the skeletal muscle bioenergetic system and exercise tolerance [32].
The discussed mechanism can also explain the changes in  V · O2max, CP and  V · O2 on-kinetics (decrease in t0.63 and the slow component) induced by endurance training in healthy persons [29] and MM patients [33]. Computer simulations have predicted that these effects are caused by the training-induced increase in OXPHOS activity. When it is assumed that the increase in OXPHOS activity in vivo corresponds quantitatively to the increase in mitochondria volume density and/or OXPHOS (enzymes) activity in vitro, slightly too great quantitative effects on  V · O2max and CP were predicted [29]. Therefore, the possibility was postulated that training also leads to a decrease in Pipeak, which diminishes the effect of the increase in OXPHOS activity and improves the metabolite (ADP, Pi, PCr, H+) homeostasis [29,33]. However, alternatively, the increase in the activity of OXPHOS (complexes) measured in a given muscle (e.g., gastrocnemius or quadriceps) in vitro may not be representative of the rise in the (mean) OXPHOS activity in the whole working muscle group (including gluteus, biceps femoris, quadriceps, gastrocnemius and soleus) in vivo [34]. If a smaller training-induced increase in OXPHOS activity in power-generating muscles in vivo is assumed, the training-induced increases in  V · O2max and CP encountered in experimental studies can be accounted for quantitatively without the need to decrease Pipeak. This problem will have to be resolved by future experimental studies, in particular directed toward the measurement of the effect of training on the end-exercise concentrations of Pi and other metabolites (particularly H2PO4 and H+).
The present study is intended to demonstrate how (by which mechanism) the training-induced increase in OXPHOS activity and likely the decrease in Pipeak determine the rises in  V · O2max and CP and fall in t0.63. It is hypothesized that these changes occur through a delay and decrease in the Pi increase during the rest-to-work transition that leads to attenuation of the reaching of Pipeak by Pi (the effect of elevated OXPHOS activity on  V · O2max and CP) and faster reaching of a new steady state (the effect of elevated OXPHOS activity on t0.63) through an accelerated reaching of Pipeak by Pi (the effect of lowered Pipeak on  V · O2max and CP). It is clearly demonstrated and explicated exactly how this mechanism works.

2. Theoretical Methods

2.1. Ethical Approval

This study was purely theoretical and did not involve any experiments on humans or animals.

2.2. Computer Model

The dynamic computer model of the skeletal muscle bioenergetic system developed previously was used in the present study [28,34,35,36,37,38]. The model involves the each-step activation (ESA) (parallel activation) mechanism of the stimulation of different elements of the bioenergetic system in the cell during work transitions. According to this mechanism, all OXPHOS complexes, NADH supply and glycolysis/glycogenolysis are directly activated by some cytosolic factor/mechanism (which probably involves cytosolic Ca2+ ions and possibly protein phosphorylation/dephosphorylation) in parallel with ATP usage activation by Ca2+ ions during rest-to-work or low-to-high-work transitions in skeletal muscle, heart and other tissues [39,40,41,42]. Fell and Thomas postulated a similar mechanism, called “multi-site stimulation”, for the regulation of glycolysis and TCA (tricarboxylic acid) cycles [43,44]. The complete model description was published previously [30] and is available on the author’s personal website: http://bernardkorzeniewski.pl (accessed on 22 September 2023).
A general, simplified scheme of the bioenergetic system in skeletal muscle addressed in the present study is shown in Figure 1. The components of the system that appear explicitly within the model are shown. The two main parts of the model are the set of kinetic equations describing the dependence of the rate of particular enzymatic reactions and processes on metabolite concentrations and the set of ordinary differential equations describing the dependence of the rates of the changes in particular metabolite concentrations on the rates of reactions and processes. In each simulation step (very short time interval), new reaction rates are calculated on the basis of current metabolite concentrations, and new metabolite concentrations are calculated on the basis of current reaction rates.
The action of Ca2+ ions and the still unknown additional factor “?” in the system is not involved explicitly in the model but is expressed implicitly as the activity of the regular ATP usage (AUT) and activation by ESA of OXPHOS (AOX) and glycolysis (AGL) (see below).
This model is able to generate a wide range of various kinetic properties and explain many aspects of the functioning of the skeletal muscle bioenergetic system (see [42] for a review and [28,29,30,32,33,46]).

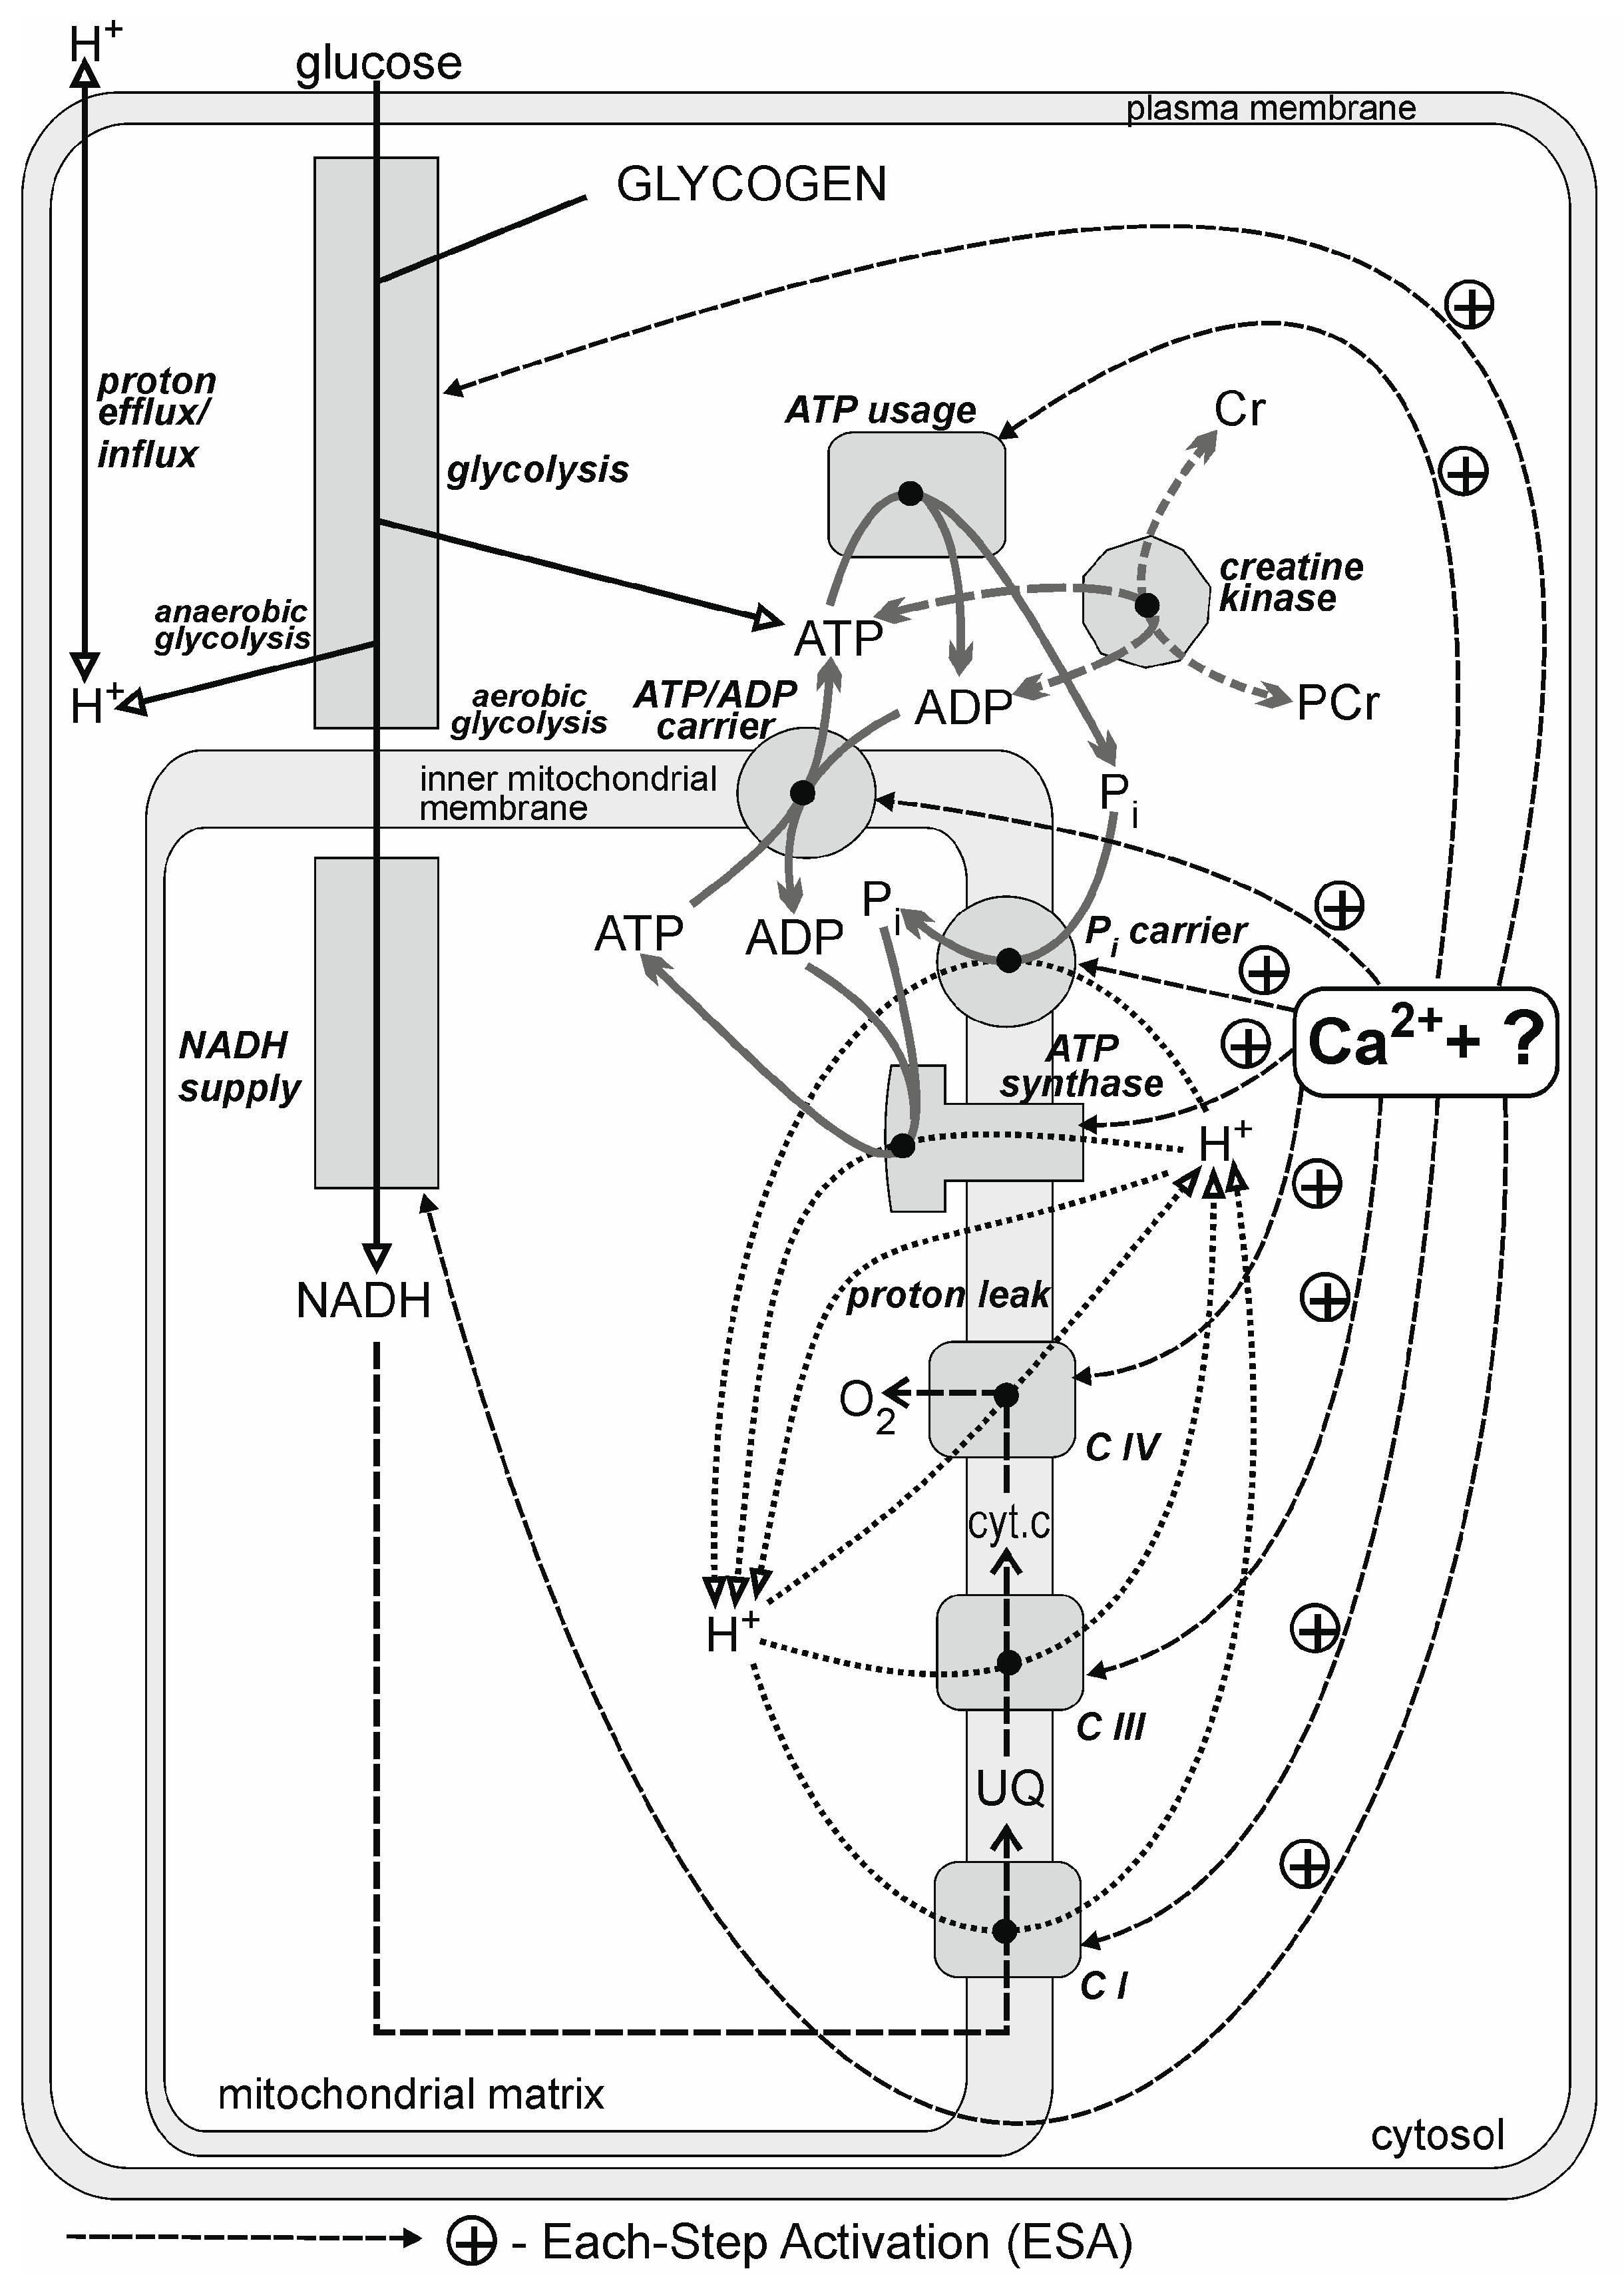
2.3. Bioenergetic Molecular Sequence of Events during Rest-to-Work Transition

The model is intended to reproduce the real behavior of the elements of the system presented in Figure 1. During the rest-to-work transition, the subsequent chain (sequence) of biochemical–molecular events in the skeletal muscle cell bioenergetic system is initiated. Neural myocyte stimulation by an appropriate motor unit leads to a release of Ca2+ ions from sarcoplasmic reticulum cisterns. Calcium ions activate actomyosin-ATPase (muscle contraction) and Ca2+-ATPase (SERCA; taking up of Ca2+ ions during muscle relaxation). As a result, intense hydrolysis of ATP to ADP and Pi takes place, and the concentrations of ADP and Pi increase. The level of ATP remains almost constant, as the resting ATP/ADP ratio is very high (several hundreds), unless the total adenine nucleotide pool is reduced by AMP deamination. Simultaneously, most cytosolic and mitochondrial elements of the system are directly stimulated by some still unknown factor/mechanism, which probably involves (mostly cytosolic) Ca2+ and possibly calmodulin-like proteins presenting Ca2+ ions to different enzymes and carriers and/or phosphorylation or dephosphorylation of proteins. The direct stimulation of the ATP supply by ESA attenuates the increases in ADP and Pi [40]. Because OXPHOS (together with glycolysis and substrate dehydrogenation) is significantly activated by this mechanism, less accumulation of ADP and Pi is needed to stimulate the oxidative and glycolytic ATP supply to match the greatly increased ATP usage for muscle contraction. The equilibrium of the very fast reaction catalyzed by creatine kinase (CK) is shifted as a result of the moderate ADP increase. Consequently, a moderate fall in PCr, rise in Cr, consumption of protons (transient initial pH increase) and further moderate rise in Pi (resulting from the co-operation of creatine kinase and ATP usage) take place. The rises in ADP and Pi further drive OXPHOS, resulting in augmentation of  V · O2, which is simultaneously stimulated through the direct OXPHOS activation by ESA. As the changes in metabolite concentrations, especially PCr, Cr and Pi, are only moderate, the characteristic transition time of primary phase II of the  V · O2 (and metabolites) on-kinetics (t0.63) is rather short. The increases in ADP and AMP (and other metabolites not considered explicitly within the model) additionally stimulate (anaerobic) glycolysis. The production of H+ ions by anaerobic glycolysis leads to a decrease in pH to less than its resting value. The magnitude of this acidification depends on exercise intensity: the greater that the power output is, the stronger that the acidification is. However, accumulating H+ ions inhibit (anaerobic) glycolysis, preventing further significant cytosol acidification (self-limiting process). In the moderate exercise intensity domain, the system ultimately reaches a steady state (see [45] for more details).
In heavy, very heavy and severe exercise intensity domains [47] additional biochemical–molecular events in the muscle bioenergetic system form a causal chain (sequence) supplementing the processes occurring in the primary phase II on-kinetics of the system. In particular, the slow component of the  V · O2 and metabolite on-kinetics appears. A sufficiently high work intensity (ATP usage activity) causes Pi to exceed Picrit, which starts the additional ATP usage (as opposed to the regular ATP usage related to power generation). This increase is associated with additional rises in ADP and Pi, and Pi further enhances the additional ATP usage, leading to the formation of a positive feedback loop (self-driving phenomenon). The additional increase in ADP further affects the creatine kinase equilibrium and results in an additional fall in PCr and rise in Cr. The further elevated ADP and AMP additionally enhance anaerobic glycolysis, leading to greater cytosolic acidification. Accumulating protons in turn recursively inhibit (anaerobic) glycolysis. ADP and Pi rise continuously, further stimulating OXPHOS and leading to an additional increase in  V · O2. Consequently, the slow component of the on-kinetics of oxygen consumption and metabolites appears. The mutual stimulation of the rise in Pi and additional ATP usage in heavy exercise are not intense enough to reach Pipeak by Pi and to reach of  V · O2max by  V · O2. Consequently, exercise is not terminated because of fatigue, and the system finally approaches a steady state, although a higher one than that achieved without the presence of the additional ATP usage and  V · O2 and metabolites’ slow components. The heavy/very heavy exercise border constitutes an emerging property of the system that separates work intensities/AUTs, for which this feedback loop leads to Pi stabilization at less than Pipeak from those for which it does not. This border represents the critical ATP usage activity (AUTcrit) at the muscle level and critical power (CP) at the whole-body level. With very heavy and severe exercise, the reciprocal driving of the rises in Pi and additional ATP usage is intense enough to prevent reaching of a steady state. Metabolites change, and oxygen consumption increases continuously. Finally, when Pi reaches Pipeak, and  V · O2 reaches  V · O2max, muscle work is terminated because of exhaustion (see [45] for more details).
It should be emphasized that the  V · O2 kinetics constitute a result of this sequence of events; therefore, it cannot be a cause of any system property. On the contrary, it is an epiphenomenon (emergent property of the system) that can serve as a non-invasive indicator of the biochemical/kinetic properties/events originating in the muscle, especially of total OXPHOS activity ([45,46]; see below).

2.4. Computer Simulations
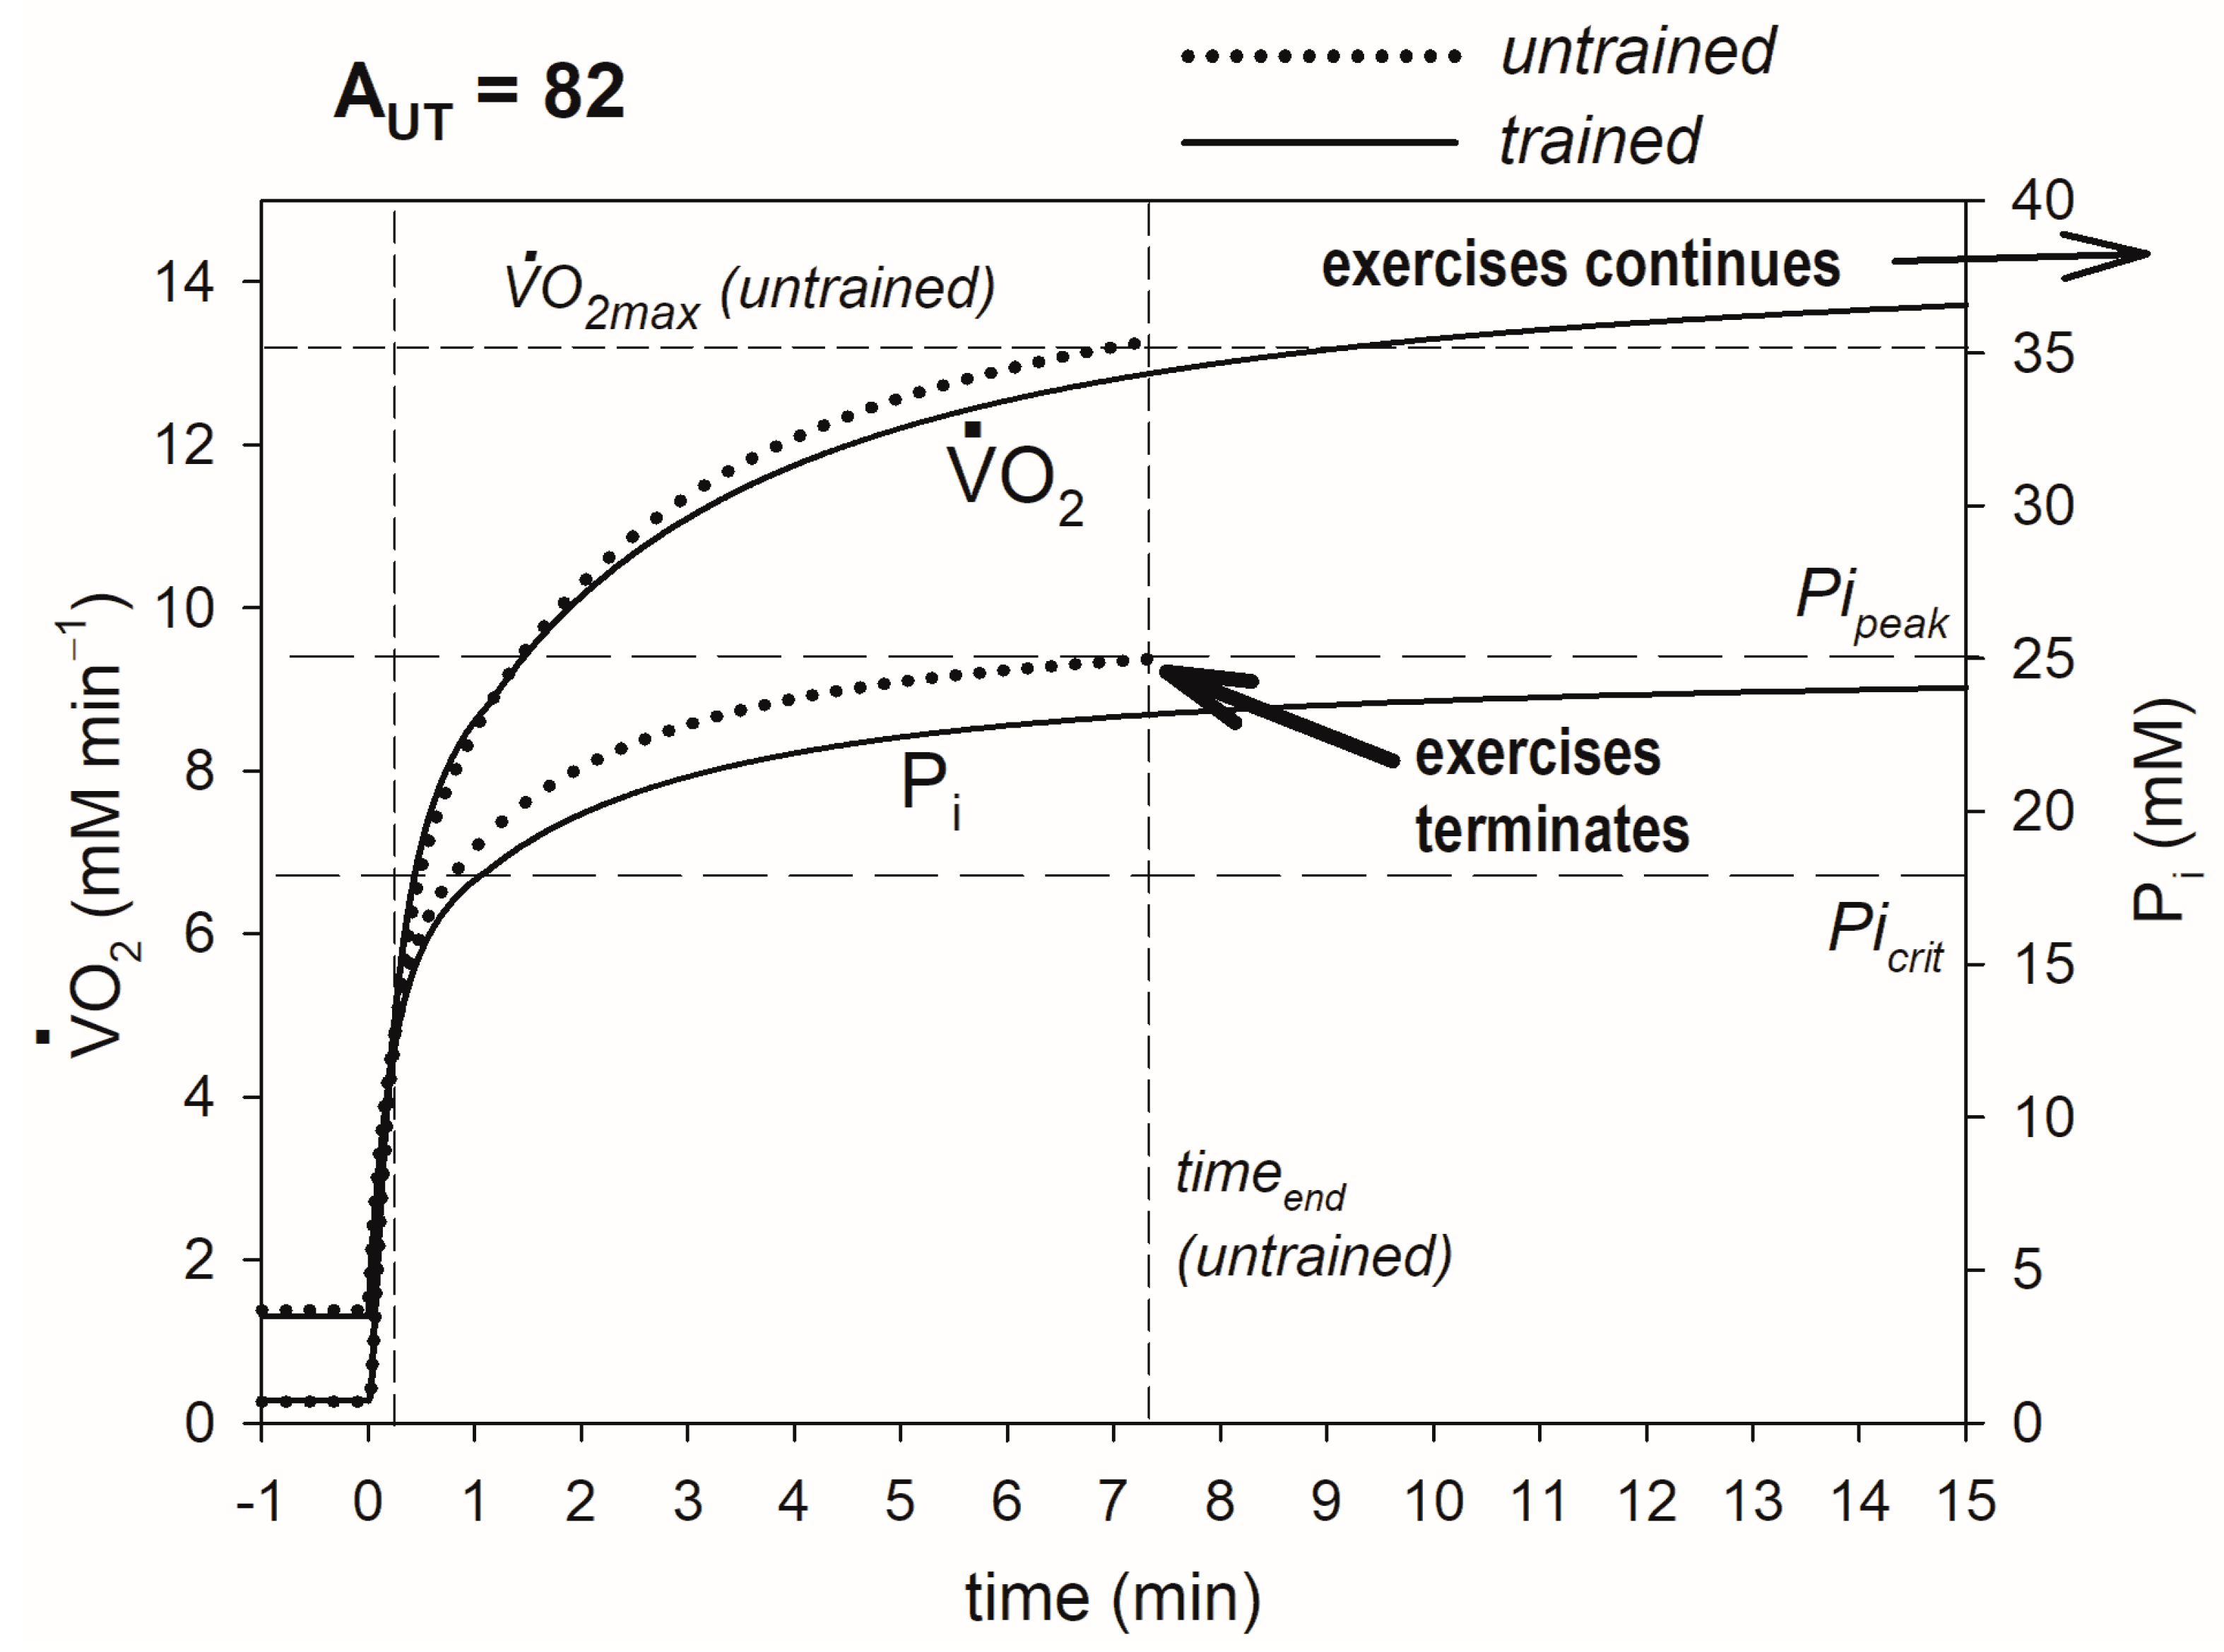
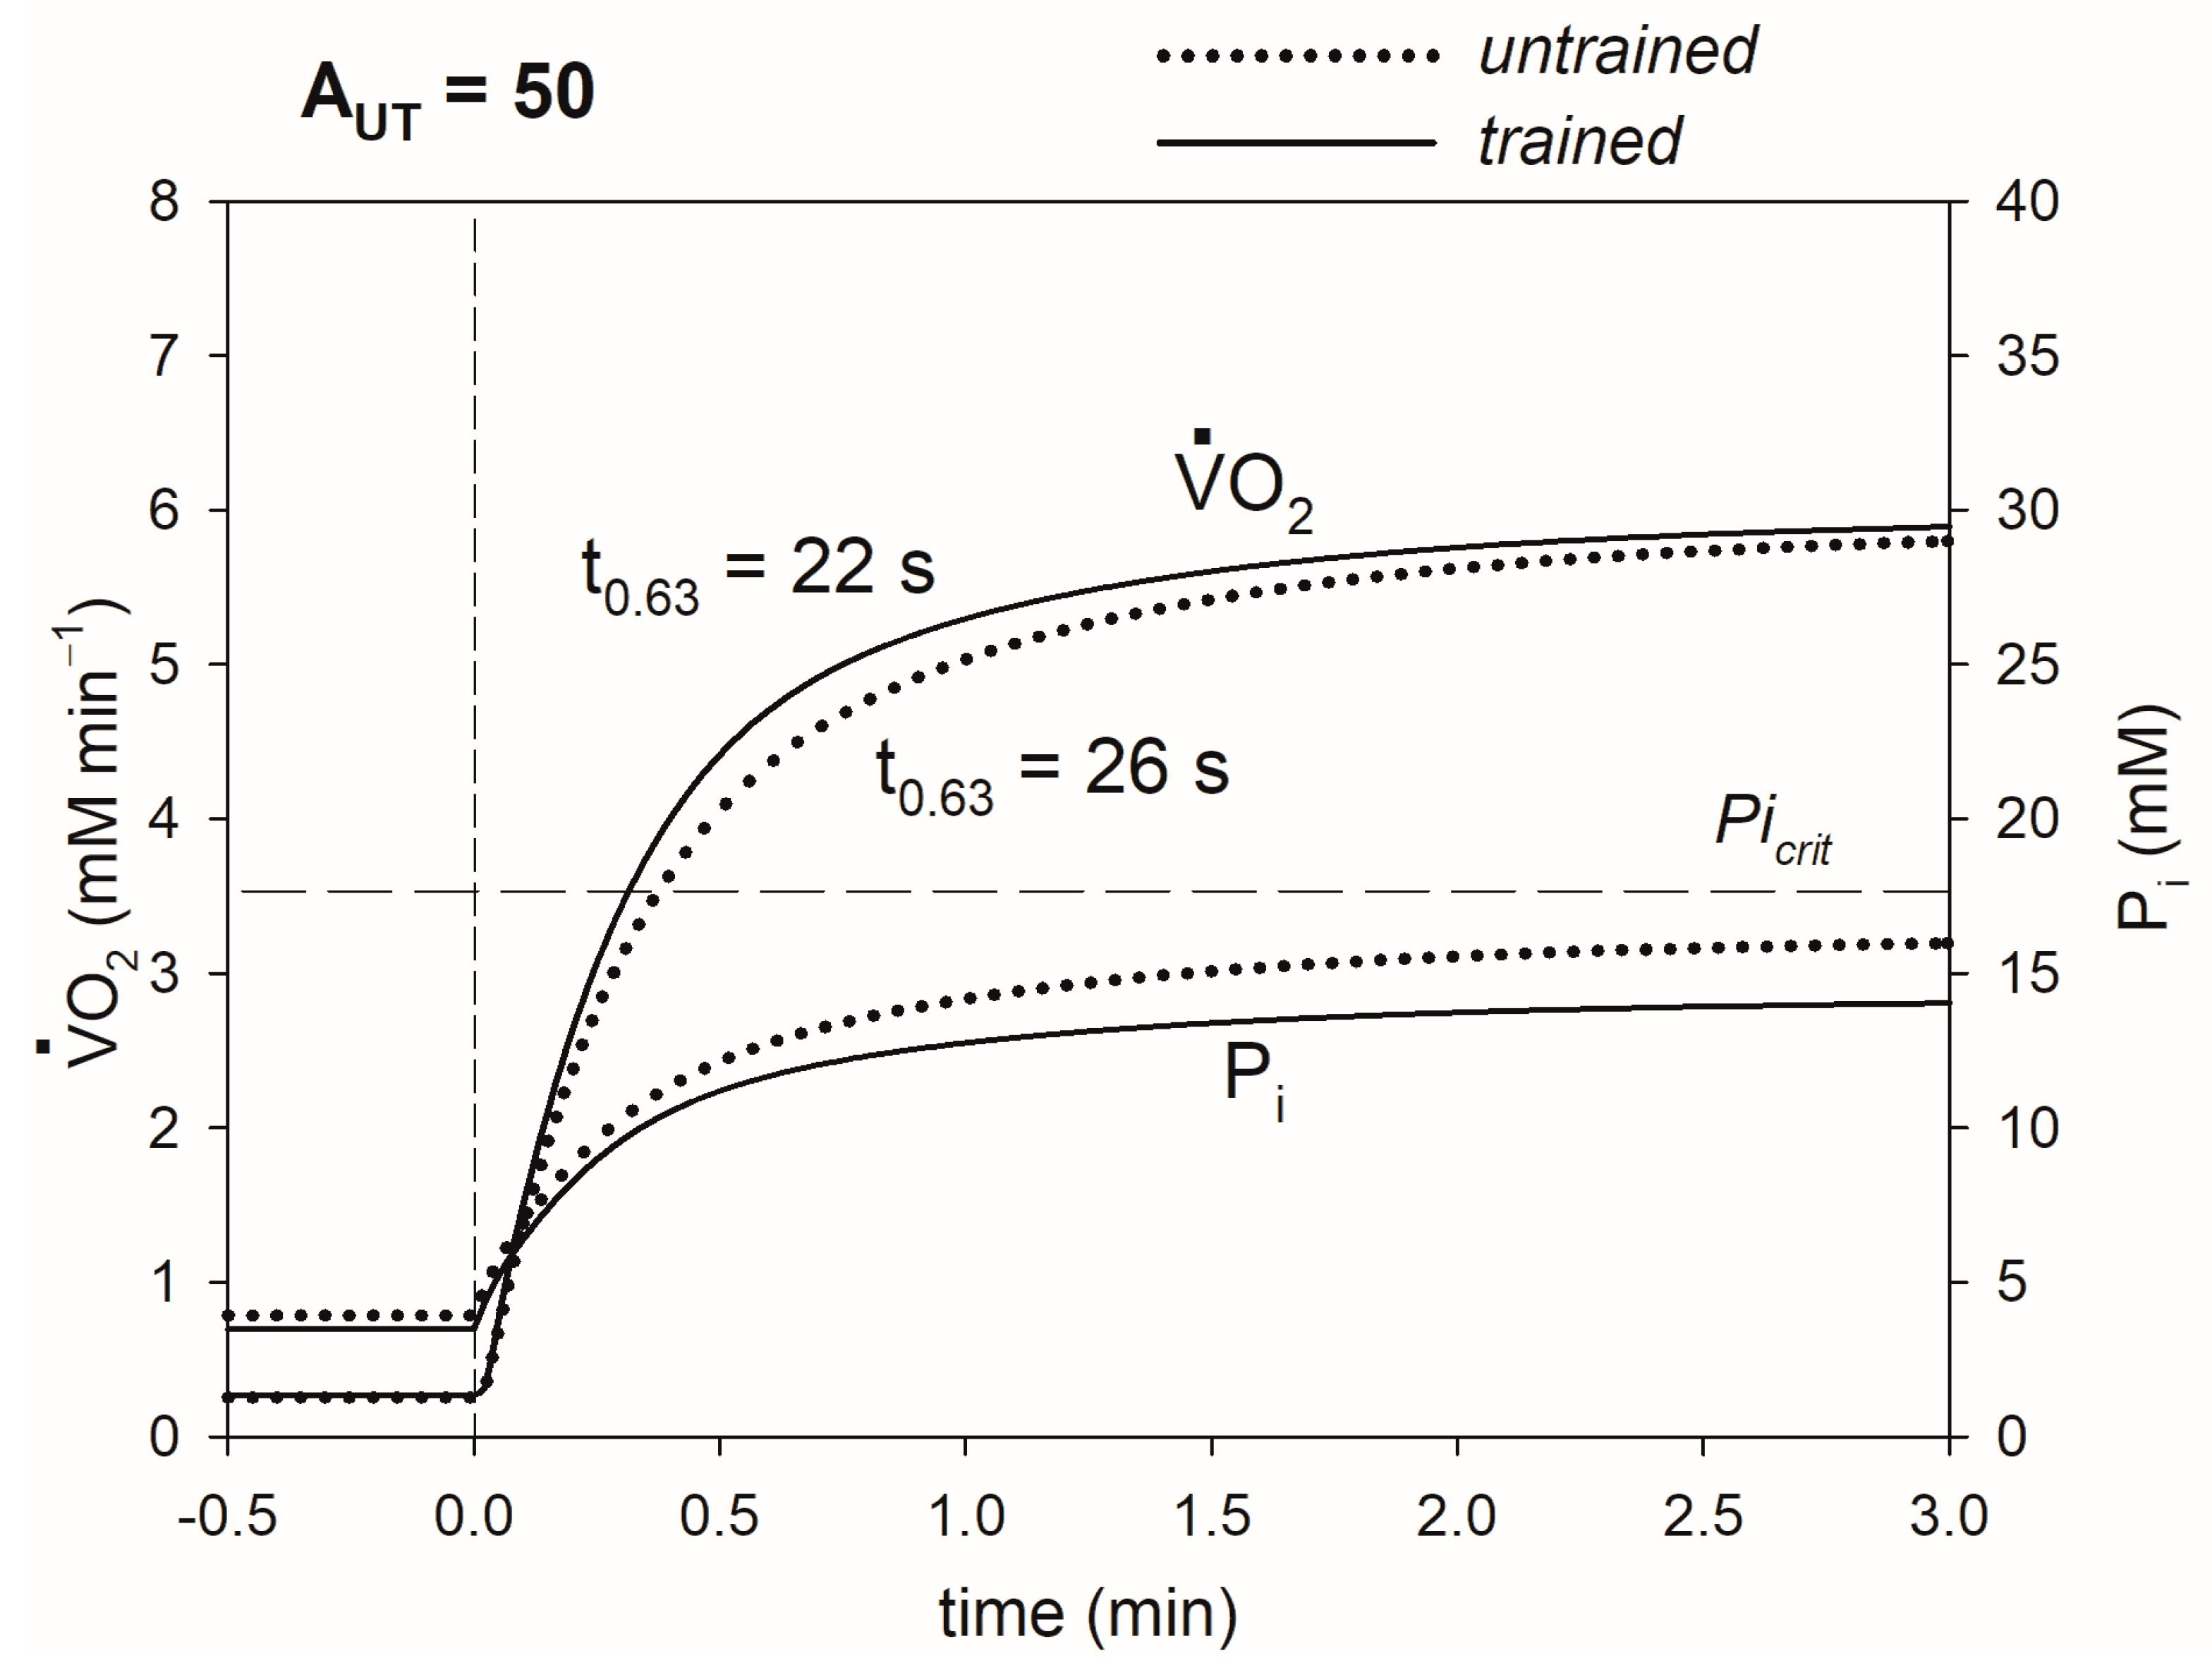
The ATP usage activity (AUT, proportional to power output) is scaled to 1 at rest. This regular ATP usage differs from the additional ATP usage, which underlies the slow component of  V · O2 and metabolites. At the onset of constant-power exercise, it is elevated instantaneously to a determined value, for example, 100 for intense exercise. One AUT unit is an equivalent of roughly 3 W (2–4 W depending, for instance, on working muscle mass) in whole-body exercise, such as cycling or running.
Rate constants for OXPHOS complexes and NADH supply block present in kinetic equations in the computer model can be represented as a single rate constant of OXPHOS (kOX), representing the OXPHOS activity. This rate constant is scaled to 1 in the “standard” version of the model for young, physically active individuals. At the onset of exercise, this “default” OXPHOS activity (at rest and during work) is multiplied by the ESA intensity AOX, being a saturating function of ATP usage activity AUT [37,38]. This activity can be called the “work-induced” OXPHOS activity (present only during work). Therefore, the total OXPHOS activity = default OXPHOS activity × induced OXPHOS activity (ESA intensity). During work, OXPHOS is additionally moderately stimulated by the ADP and Pi increases. AOX is elevated through an increase in the parameter AOXmax, which can be called the ESA rate constant, at the onset of exercise. OXPHOS complexes, NADH supply block and glycolysis are activated by ESA with some delay in parallel with ATP usage, the activity of which is elevated step-wise (see, e.g., [36,39,40,41,42]).
Within the model, the “Pi double-threshold” mechanism of muscle fatigue is expressed by a fixed Picrit = 18 mM, Pipeak = 25 mM (in the “standard” version of the model for young physically-active individuals) and kinetic equation for the additional ATP usage (for Pi > Picrit), in which the additional ATP usage flux is proportional to the current Pi−Picrit difference [28,47]. The kinetic equation for the intensity of the additional ATP usage has the following form:
v a d d = k a d d · v U T · ( P i P i c r i t ) 0.5 · e t a / t a d d
where vadd is the rate of additional ATP usage (mM min−1), kadd = 0.2 mM−0.5 is the activity (“rate constant”) of the additional ATP usage, vUT is the rate of the regular (as opposed to additional) ATP usage (mM min−1), Pi is the current inorganic phosphate concentration (mM), ta = 2 min is the characteristic time of the activation of the additional ATP usage, and tadd is the time after the onset of exercise.
The computer model involves a constant capillary O2 concentration during exercise equal to 30 μM in the standard model version.
In the present study, the following simulations demonstrating the effect of endurance training on the key variables of the skeletal muscle bioenergetic system were performed.
In the simulations of the effect of training on  V · O2max, the activity of ATP usage (work intensity) AUT = 90 was used, representing the very heavy exercise-intensity domain both before and after training. The “default” activity of OXPHOS was augmented by 10% (kOX: 1.0 → 1.1), while ESA intensity (“work-induced” OXPHOS activity) was assumed to be unchanged. The “standard” value of Pipeak = 25 mM was used.
In the simulations of the effect of training on the critical ATP usage activity (AUTcrit, analogous to CP) the activity of ATP usage (work intensity) AUT = 82 was used, which represented the very heavy exercise-intensity domain before training and heavy exercise-intensity domain after training. The “default” activity of OXPHOS was augmented by 10% (kOX: 1.0 → 1.1), while ESA intensity (“work-induced” OXPHOS activity) was assumed to be unchanged. The “standard” value of Pipeak = 25 mM was used.
In the simulations of the effect of training on t0.63, the activity of ATP usage (work intensity) AUT = 50 was used, representing the moderate exercise-intensity domain both before and after training. The “default” activity of OXPHOS was augmented by 22% (kOX: 0.9 → 1.1), while ESA intensity (“work-induced” OXPHOS activity) was assumed to be unchanged. The “standard” value of Pipeak = 25 mM was used.
In the simulations of the effect of the Pipeak decrease in trained muscle on  V · O2max, the activity of ATP usage (work intensity) AUT = 90 was used, representing the very heavy exercise-intensity domain. The “trained” OXPHOS activity was used (kOX = 1.1), and Pipeak was decreased: 25 mM → 22.5 mM.
In the simulations of the effect of the Pipeak decrease in trained muscle on CP, the activity of ATP usage (work intensity) AUT = 82 was used, representing the heavy exercise-intensity domain without Pipeak decrease and very heavy exercise-intensity domain with Pipeak decrease. The “trained” OXPHOS activity was used (kOX = 1.1), and Pipeak was decreased: 25 mM → 22 mM.
The values of the parameters AUT, kOX and Pipeak and their changes were chosen arbitrarily to enable a clear presentation.

3. Results

Muscle training, leading to an increase in OXPHOS activity, elevates  V · O2max and lengthens the duration of exercise in very heavy exercise. This outcome is demonstrated if Figure 2. It occurs through attenuation (delay and decrease in relation of  V · O2) of the Pi rise during exercise. As a result, in trained muscle, Pi reaches Pipeak, and exercise is terminated because of fatigue after a longer time and at a higher  V · O2 ( V · O2max) than in untrained muscle. Thus, at a given work intensity (regular ATP usage activity),  V · O2max is augmented, and the duration of exercise is lengthened.
The training-induced increase in OXPHOS activity also elevates AUTcrit (critical ATP usage activity proportional to critical power, CP) and can lead to the transition of exercise of a given intensity (power output) from the very heavy-intensity domain to heavy-intensity domain. This outcome is demonstrated if Figure 3. It occurs because of a decrease in the Pi rise during exercise. Before training, Pi was unceasingly rising and ultimately reached Pi and thus caused exercise termination because of fatigue at this power output (PO), while after training, Pi was increasing at a slower pace and finally stabilized at a steady-state value less than Pipeak, and exercise could be continued potentially ad infinitum. As a result, in trained muscle,  V · O2 does not reach  V · O2max and stabilizes at a steady-state value less than it, in opposition to the situation taking place in untrained muscle. Thus, as the result of training, CP is elevated, and PO, which was greater than CP in untrained muscle, can be less than CP in trained muscle.
The elevated OXPHOS activity as the result of training shortens the transition time of primary phase II of the  V · O2 on-kinetics t0.63, which is best seen in the moderate exercise-intensity domain, where the  V · O2 slow component and the additional ATP usage underlying it are absent. This outcome is demonstrated in Figure 4. This effect is mostly caused by the decrease in the Pi increase (associated with a smaller PCr decrease/Cr increase) (e.g., the smaller training-induced increase in ADP plays a minor role, as the ADP concentration is in the micromolar range; see Discussion). Here, both before and after training, exercise is within the moderate-intensity domain. However, for some power outputs, muscle training can bring the system from the (very) heavy exercise-intensity domain to the moderate exercise-intensity domain (see [29], Figure 6 therein).
The possible training-induced decrease in Pipeak weakens the rise in  V · O2 caused by the OXPHOS activity increase. This outcome is demonstrated in Figure 5. In the presence of the diminished Pipeak, Pi simply reaches Pipeak, and exercise is terminated because of fatigue earlier after the onset of exercise and at a lower  V · O2. Therefore, timeend and  V · O2max decrease. For this reason, generally, the training-induced increases in  V · O2max and timeend are smaller than they would be if only OXPHOS activity increased, and Pipeak did not decrease. Nevertheless, exercise remains in the very heavy-intensity domain.
The possible training-induced decrease in Pipeak diminishes the increase in CP caused by the OXPHOS activity increase. This outcome is demonstrated in Figure 6. In the presence of the diminished Pipeak at a given power output, Pi does not stabilize at a steady state less than Pipeak but reaches Pipeak, and exercise does not continue potentially ad infinitum but is terminated because of fatigue at timeend. PO, which was less than CP in the absence of the Pipeak decrease, is now greater than (diminished) CP when Pipeak falls. Therefore, generally, the training-induced increase in CP is smaller than it would be if only OXPHOS activity increased, and Pipeak did not decrease. Exercise of a given intensity passes from the heavy-intensity domain to the very heavy-intensity domain.
The decrease in Pipeak does not affect t0.63, as the primary phase II of  V · O2 on-kinetics does not depend on Pipeak.

4. Discussion

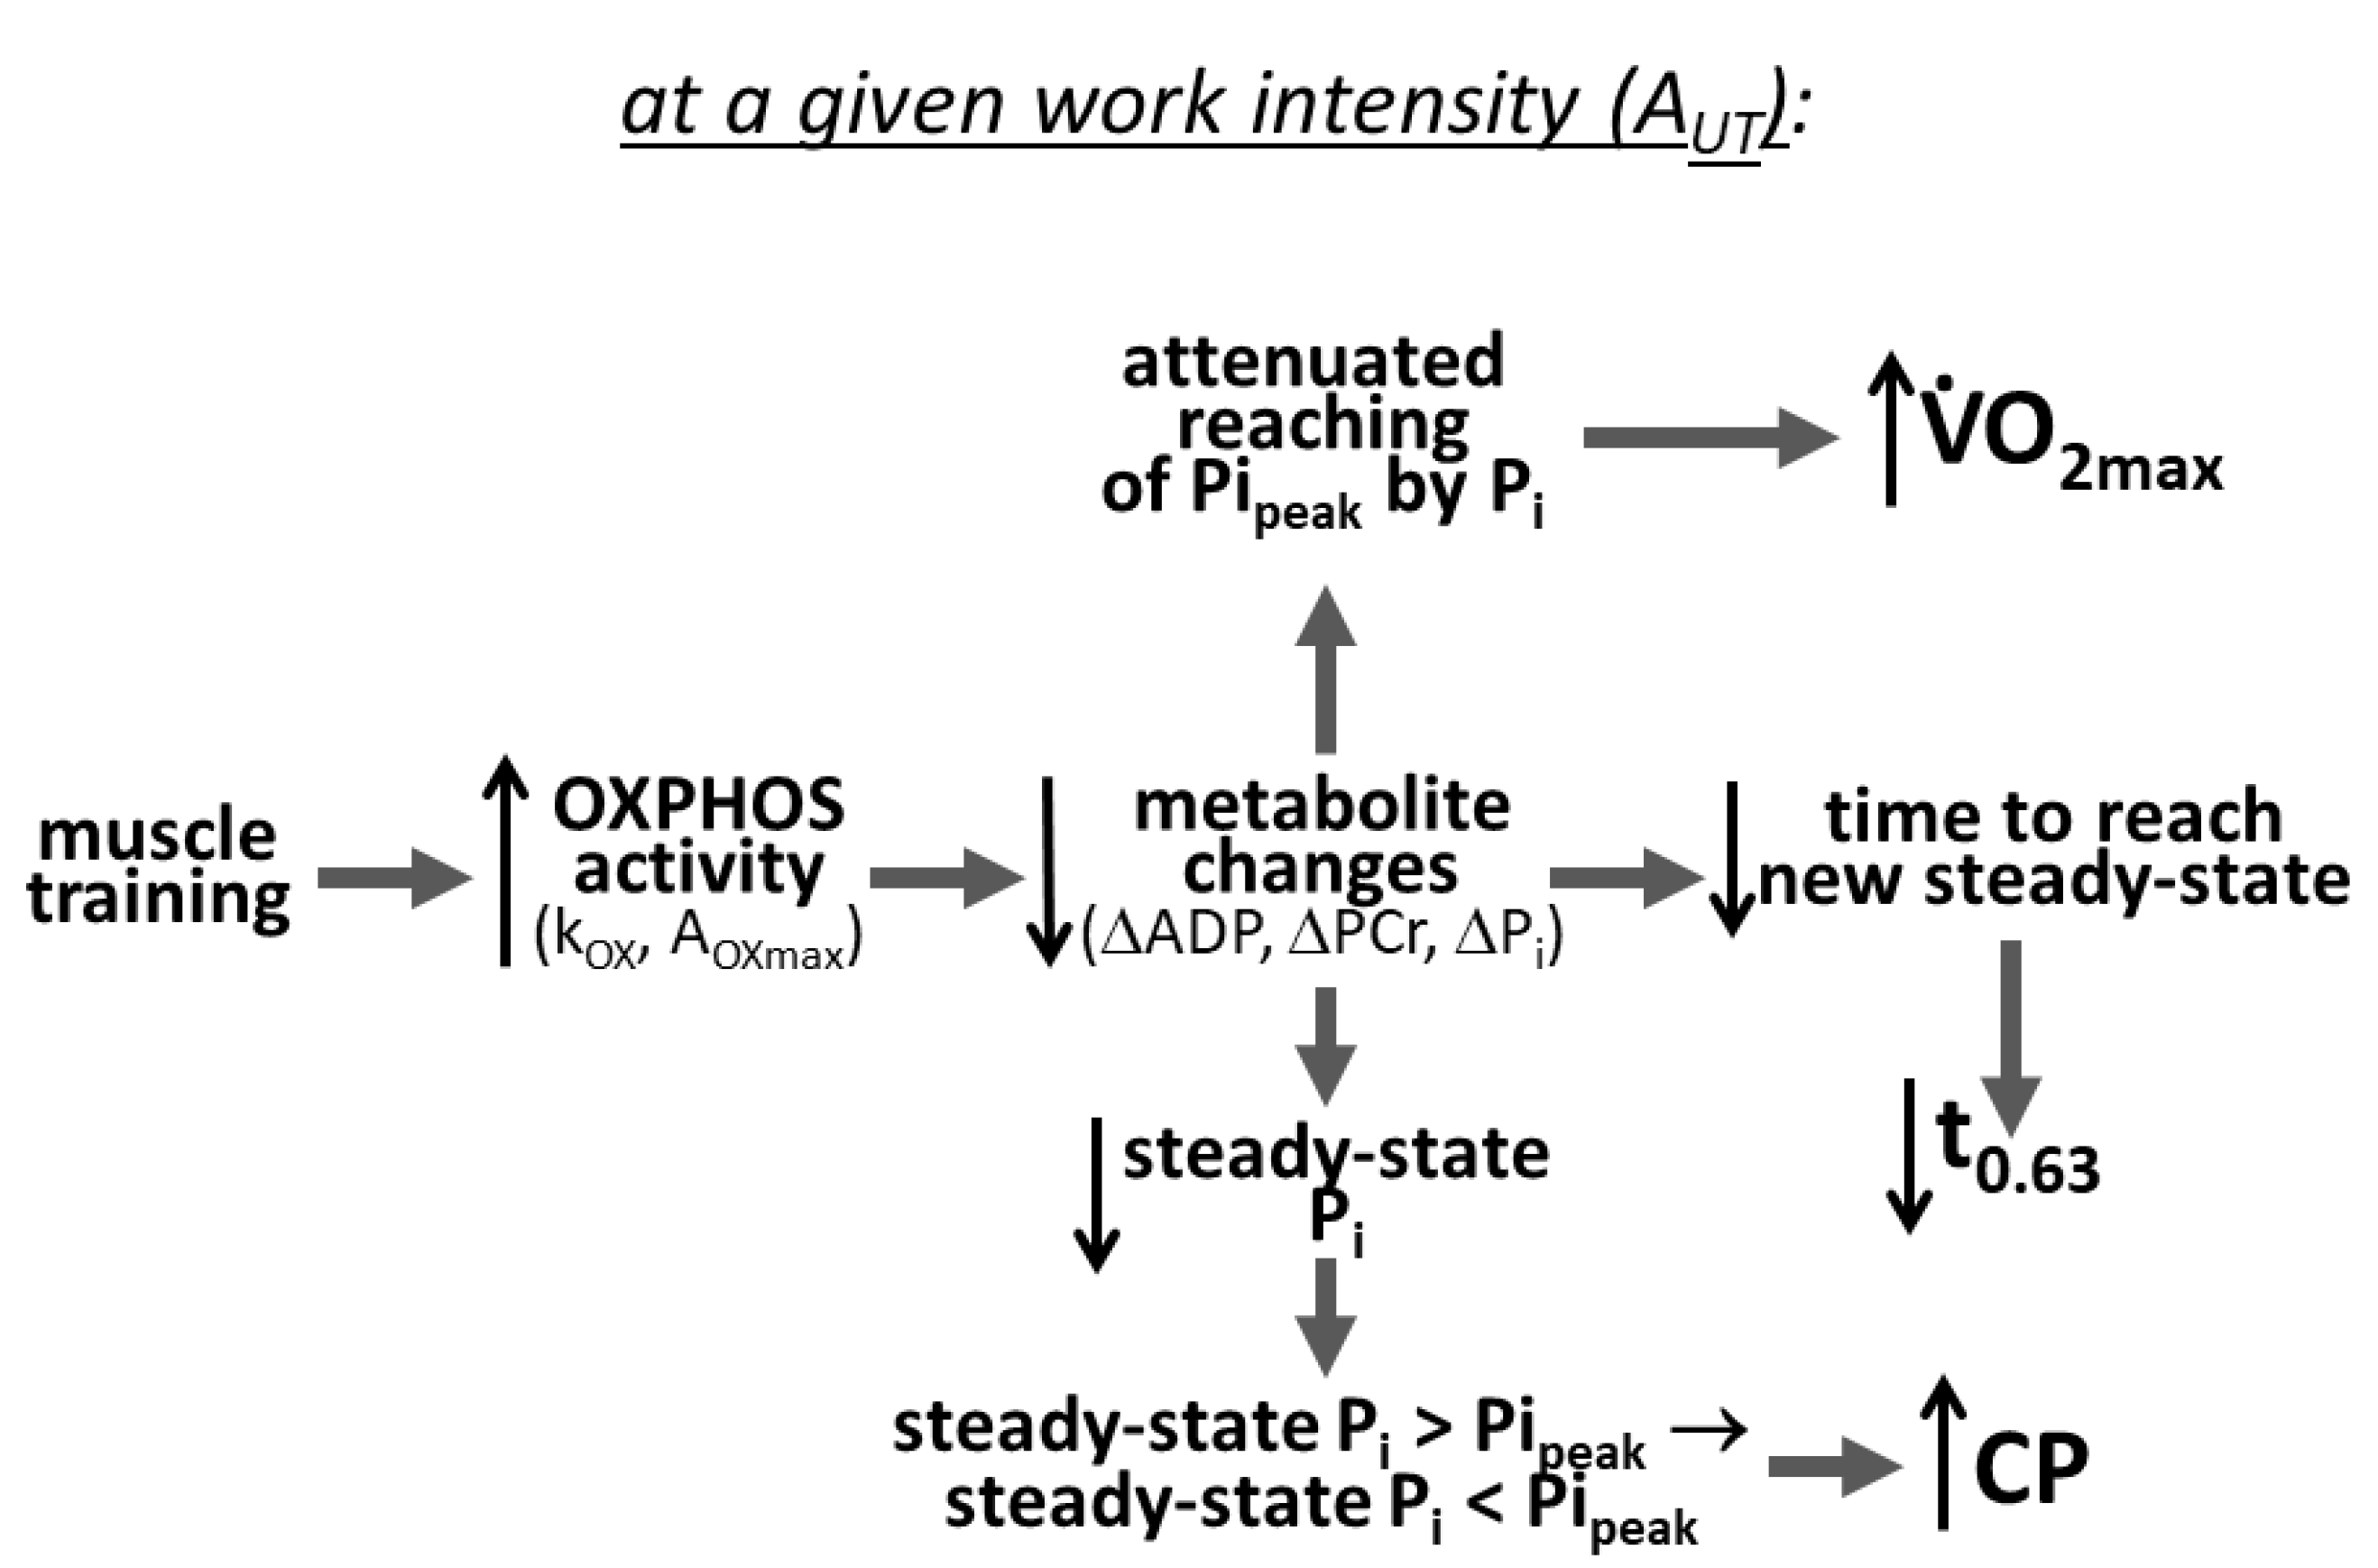
4.1. Mechanism of the Impact of Training-Induced Increase in OXPHOS Activity and Decrease in Pipeak on  V · O2max, CP and t0.63

The aim of the present article is to explain and explicate in detail the mechanisms through which the training-induced increase in OXPHOS activity and likely decrease in Pipeak determine the increases in  V · O2max and CP and decrease in t0.63. Previous in silico studies [29,33,45] demonstrated that the rise in OXPHOS activity led to rises in  V · O2max and CP and a fall in t0.63, while the decrease in Pipeak diminishes the increases in  V · O2max and CP. However, the detailed mechanism underlying this effect was not explicated. Additionally, previous studies did not address the effect of the OXPHOS activity and peak Pi on exercise duration until exhaustion.
The present article demonstrates that the effect of the training-induced increase in OXPHOS activity on  V · O2max, CP and t0.63 and of the decrease in Pipeak on  V · O2max and CP is mediated through the attenuation (decrease and delay) of the Pi increase after the onset of exercise. This attenuation is caused by the increase in OXPHOS activity and is possibly partly compensated for (diminished) by the Pipeak decrease.
The details of the mechanism of the impact of the elevated OXPHOS activity on  V · O2max, CP and t0.63 are presented in Figure 2, Figure 3 and Figure 4 and are summarized in Figure 7.
The training-induced increase in the total OXPHOS activity can occur through an increase in the “default” OXPHOS activity kOX (see Introduction), an increase in the “work-induced” OXPHOS activity (ESA intensity, AOX) [13] or both. The present study focuses on the former, but the general reasoning would be very similar for the latter.
The training-induced rise in OXPHOS activity leads to attenuation (decrease and delay) of changes in the bioenergetic system metabolites (e.g., increases in ADP, Pi, Cr and H+ and decrease in PCr) during the rest-to-work transition at a given power output. In particular, this change concerns the increase in Pi: it rises at a slower pace and to a smaller extent at a given  V · O2 (Figure 2). During the rest-to-work transition, OXPHOS with the default (resting) activity (kOX) is very quickly (in a few seconds) stimulated by ESA (work-induced OXPHOS activity, AOX) and then more slowly (tens of seconds to minutes) by increases in ADP and Pi. In the result of the training-induced rise in the total OXPHOS activity (kOX and/or AOX), Pi (and ADP) does not have to increase as much to stimulate OXPHOS (oxidative ATP supply to match the elevated ATP usage), as its activity is already elevated by training. As a result, in trained muscle, Pi increases at a slower pace and reaches Pipeak (during very heavy and severe exercise), and exercise is terminated because of fatigue after a longer time and at a higher  V · O2 than in untrained muscle. Because of the elevated OXPHOS activity, the Pi increase is delayed in relation to the  V · O2 increase, or alternatively,  V · O2 increases more at a given Pi increase until Pi reaches Pipeak. Consequently, the exercise duration until exhaustion timeend is lengthened, and  V · O2max is elevated. The system remains in the very heavy exercise-intensity domain.
The training-induced slowed and decreased Pi increase during exercise (due to augmented OXPHOS activity) can cause, at a given power output (PO), the steady-state Pi value to decrease: Pi ultimately stabilizes at a steady-state value less than Pipeak, and exercise continues potentially ad infinitum, instead of rising unceasingly until reaching Pipeak and causing exercise termination. This outcome is demonstrated in Figure 3 and Figure 7. In other words, muscle training causes the PO value, which was greater than CP (critical power) before training, to be smaller than CP after training. Consequently, exercise of a given intensity passes from the very heavy to heavy, or even moderate, domain.
The decreased magnitude of the Pi increase during exercise of a given intensity also leads to a shortening of the transition time of primary phase II of the  V · O2 on-kinetics: t0.63. Easterby [48] showed in an abstract and general way that the time of the transition between steady states in a metabolic system is proportional to the changes in metabolite concentrations during this transition. It was demonstrated in the concrete case of the skeletal muscle bioenergetic system that t0.63 of the  V · O2 on-kinetics depends near-linearly on the changes in, first of all, PCr, Cr and Pi (anyway, related to each other) during the rest-to-work transition at the same PO [49] (ADP and its changes are in the micromolar range and therefore contribute little to the general effect, while ATP is essentially constant in the absence of AMP deamination). At a given metabolic flux, the smaller that the changes in metabolites are, the faster that the new steady-state is reached, and consequently the shorter that the transition time is. The effect of the smaller Pi increase on t0.63 is demonstrated in Figure 4 (and summarized in Figure 7) regarding the example of moderate exercise, where the additional ATP usage and slow component of the  V · O2 on-kinetics are absent, facilitating a clear presentation.
The possible training-induced decrease in Pipeak counterbalances to a certain extent the effect of elevated OXPHOS activity. In the presence of a lowered Pipeak, Pi reaches Pipeak in a shorter time and at a lower  V · O2, than at unaltered Pipeak, leading to the shortening of exercise duration and a fall in  V · O2max. This outcome is demonstrated in Figure 5. This effect takes place within the very heavy exercise-intensity domain.
At some lower PO values, the decrease in Pipeak can lead to a transition from the heavy to very heavy exercise-intensity domain. The Pi concentration, which did not reach (unchanged) Pipeak in the absence of the Pipeak decrease, can be greater than (lowered) Pipeak in the presence of the Pipeak decrease. Therefore, while in the former case, exercise could be continued potentially ad infinitum, in the latter case, it is terminated after some time because of fatigue. This outcome is demonstrated in Figure 6 and is equivalent to a CP decrease. Therefore, a given PO can be less than CP in the absence of the Pipeak fall and greater than CP in the presence of this fall.
As mentioned above, as Pipeak does not affect the reaching of a steady state of Pi and  V · O2 in primary phase II of the  V · O2 and Pi on-kinetics, changes in Pipeak have no effect on t0.63.
Summing up, the training-induced increase in the “default” OXPHOS activity and possibly “work-induced” OXPHOS activity (ESA intensity) acts through a decrease and delay in metabolite (ADP, Pi, PCr, H+, AMP, IMP, NH3) changes, especially the Pi increase during the rest-to-work transition (improvement in metabolite homeostasis, at least at a given time and  V · O2). This outcome in turn leads to an increase in  V · O2max, increase in CP and shortening of t0.63 (Figure 7). The effect on  V · O2max and CP can be diminished by a training-induced decrease in Pipeak, which is associated with improved end-exercise metabolite homeostasis.

4.2. General Discussion

The present article addresses the training-induced changes in  V · O2max, CP (AUTcrit) and t0.63 at the muscle level. However, the kinetic properties of the system at the whole-body, including the pulmonary, level can to a certain degree differ from their counterparts at the muscle level. First, the pulmonary and muscle  V · O2 kinetics can somewhat dissociate, for instance, during very intense exercise or off-transient. This outcome can be caused by some delays in oxygen transport by the circulatory system from working muscles to the lungs, buffering of the O2 level by oxygen stores in tissues, blood and lungs or contributions of oxygen consumption by auxiliary tissues (heart, respiratory muscle, posture-maintaining muscles) to the pulmonary oxygen consumption [45]. Second, it is possible that the moderate/heavy exercise border at the whole-body level (lactate threshold, LT, ventilatory threshold, VT) appears earlier (in time and at a lower PO) than at the working muscle level (AUTadd, ATP usage activity at which the additional ATP usage, underlying the  V · O2 and metabolites’ slow component, is initiated) [45].
Previous in silico studies [29,33] demonstrated that the training-induced increase in OXPHOS activity and/or ESA intensity not only elevates the critical ATP usage activity (AUTcrit, analogous to CP) but shifts the whole power–duration dependence upward (toward higher values of AUTcrit/PO). At the same time, depending on detailed parameter values (particularly changes in kOX and Pipeak), the curvature constant W’ of the power–duration relationship (equivalent to the slope of the linear AUT-1/time relationship) remains essentially unaffected by training or somewhat decreases. Both cases were encountered in experimental studies [3,4,5]. Of course, this effect can be explained in terms of the impact on the Pi increase kinetics during the rest-to-work transition, which affects both CP and duration of exercise, as demonstrated above.
Only the effect of Pipeak on the training-induced changes in the kinetic properties of the skeletal muscle bioenergetic system elicited through OXPHOS activity enhancement and attenuation of the Pi increase during exercise was analyzed in the present study. However, it cannot be excluded that other parameters, for example, Picrit (critical Pi, above which the additional ATP usage, underlying the  V · O2 and metabolites’ slow component, is initiated) or kadd (the activity or “rate constant” of the additional ATP usage), are affected by muscle training. It was demonstrated that an increase in Picrit elevates  V · O2 and CP and lowers t0.63 [29,46]. It also reduces the slow component of  V · O2 (and metabolites) on-kinetics. A rise in kadd diminishes CP and does not affect  V · O2max or t0.63 [29,46]. Of course, it enlarges the slow component intensity. The mechanism of the potential action of Picrit and kadd will be discussed and explained in detail when evidence for/reasons to believe in training-induced changes in these parameters appear.
The  V · O2 on-kinetics (t0.63 and/or O2 deficit) was proposed recently [50] to determine CP. However,  V · O2 and its kinetics are emergent properties of the system and can only be correlated with, but they do not bring about (determine) anything within the system. On the contrary, t0.63 and CP result from system parameters, such as OXPHOS activity and Pipeak, acting through the Pi on-kinetics, as demonstrated in the present in silico study. The inverse correlation between t0.63 and CP encountered in experimental studies results from, e.g., OXPHOS activity changing t0.63 and CP (AUTcrit) in the opposite directions [46]. Additionally, it was postulated [50] that t0.63 determines metabolite changes during the rest-to-work transition. However, in reality, the relation is just the opposite: this is changes in the metabolites (especially PCr, Cr and Pi) that determine t0.63 at a given work intensity (see above [45,49]).
Of course, the possibility of a training-induced Pipeak decrease can be tested experimentally, for example, by measuring the end-exercise Pi concentration in very heavy exercise before and after training.

4.3. Study Limitations

Every computer model of a complex biochemical/cellular/physiological system constitutes at best only a simplification and approximation of the reality. Of course, this fact also concerns the dynamic model of the skeletal muscle bioenergetic system used in the present study.
The model describes only one compartment corresponding to working muscles and does not distinguish particular working (power-generating) muscles (including the gluteus, quadriceps, biceps femoris, gastrocnemius and soleus, the kinetic/metabolic properties of which can differ to a certain extent) and different muscle fiber types within muscles (type I, IIa and IIx fibers and their various sub-types), and it involves parameters and variables (rate constants, activities, fluxes, metabolite concentrations) that are averaged over the entire working muscles group and particular muscles. Nevertheless, the model is compared with experimental data concerning muscle (or pulmonary)  V · O2 and muscle PCr, Pi, ADP, ATP and H+ concentrations averaged over the entire muscle. Even then, the model can generate, at least semi-quantitatively, a surprisingly broad set of dynamic properties of the modeled system.
Only the total Pi concentration as the main fatigue factor is considered explicitly by the “Pi double-threshold” mechanism. It was postulated as a major fatigue-related factor in peripheral fatigue [51]. Nevertheless, other metabolites, such as H+, ADP, NH4+, IMP and AMP, can also contribute to peripheral muscle fatigue [51]. On the other hand, the levels of these metabolites (at least H+ and ADP) change together with Pi during exercise [28,29]. Therefore, Pi can be regarded as a “representative” of various metabolites causing muscle fatigue. Some authors [28,52] have proposed that rather than H2PO4, a deprotonated form of Pi, and not Pi itself, is the most important fatigue-related factor. H2PO4 seems to be an attractive candidate, as its relative increase during the rest-to-work transition is greater than that of Pi [45], and it represents the increase in both Pi and H+ (pH decrease increases the fraction of Pi in the form of H2PO4), regarded as the two most important fatigue factors [51]. A substitution within the computer model of Pi by H2PO4 as the fatigue factor provided similar general results. Moreover, altered Ca2+ sensitivity was postulated to contribute to peripheral fatigue generation [51,53]. However, Pi can cause Ca2+ precipitation in sarcoplasmic reticulum [53]. Additionally, one can speculate that Pi (and other related metabolites) can be potentially involved in central fatigue, as the central nervous system can detect the metabolic state of working muscle cells, for instance, through type III/IV afferents [30]. Moreover, one could speculate that, for example, mental fatigue, sleepiness or illness can co-determine the Pipeak and/or Picrit fixed by the brain. Therefore, Pi as the main, or at least representative, fatigue-related factor seems to be quite a satisfactory approximation, as it leads to astonishingly good agreement of computer simulations with various experimental data and can account for different, seemingly unrelated, features of the system.

5. Conclusions

The training-induced increase in  V · O2max, increase in critical power (CP) and acceleration of  V · O2 on-kinetics (decrease in t0.63) in the skeletal muscle bioenergetic system caused by a rise in OXPHOS activity are mediated by attenuation (delay and decrease) of the rise in Pi (inorganic phosphate) after the onset exercise. This outcome delays the reaching of Pipeak (peak Pi) by Pi and termination of exercise because of fatigue, and it lowers Pi at a given  V · O2, causing a higher  V · O2 to be reached at the end of exercise, when Pi reaches Pipeak. This outcome is equivalent to the increase in the duration of exercise of a given power output and elevation of  V · O2max. Additionally, the decrease/delay in trained muscle of the Pi increase during exercise of a given power output (PO) can lead to stabilization of Pi at a steady state less than Pipeak and continuation of exercise potentially ad infinitum, while in untrained muscle, Pi reaches Pipeak after a certain time, and exercise terminates because of fatigue. Therefore, PO that was greater than critical power (CP) before training is less than CP after training. In other words, the system transitions from the very heavy exercise domain to the heavy exercise domain. Finally, the decreased rise in Pi (and changes in other metabolites) in moderate exercise of a given power output (or in primary phase II of the Pi on-kinetics in exercises of higher intensity) leads to faster reaching by Pi and ADP (both stimulate OXPHOS during rest-to-work transition) of the working steady state, faster reaching by  V · O2 of the active steady state and thus shortening of the  V · O2 on-kinetics transition time: t0.63.
A possible training-induced decrease in Pipeak diminishes the effect of the elevated OXPHOS activity on  V · O2max and CP (but not t0.63). At a lowered Pipeak, Pi reaches Pipeak faster,  V · O2 has less time to increase, and thus, the exercise duration is shortened, and  V · O2max falls. The steady-state Pi value for a given PO at an unchanged Pipeak can become greater than Pipeak at a diminished Pipeak; as a consequence, Pi would reach Pipeak instead of stabilizing at a steady state less than Pipeak, exercise would be terminated because of fatigue instead of continuing potentially ad infinitum, CP would become less than PO, and the system would pass from the heavy exercise-intensity domain to very heavy exercise-intensity domain.

Funding

This research received no external funding.

Institutional Review Board Statement

Not applicable.

Informed Consent Statement

Not applicable.

Data Availability Statement

Not applicable.

Conflicts of Interest

The author declares no conflict of interest.

References

  1. Hoppeler, H.; Howald, H.; Conley, K.; Lindsted, S.L.; Claassen, H.; Vock, P.; Weibel, E.R. Endurance training in humans: Aerobic capacity and structure of skeletal muscle. J. Appl. Physiol. 1985, 59, 320–327. [Google Scholar] [CrossRef]
  2. Casaburi, R.; Storer, T.W.; Ben-Dov, I.; Wasserman, K. Effect of endurance training on possible determinants of VO2 during heavy exercise. J. Appl. Physiol. 1987, 62, 199–207. [Google Scholar] [CrossRef]
  3. Gaesser, G.A.; Wilson, L.A. Effects of continuous and interval training on the parameters of the power-endurance time relationship for high-intensity exercise. Int. J. Sports Med. 1988, 9, 417–421. [Google Scholar] [CrossRef]
  4. Poole, D.C.; Ward, S.A.; Whipp, B.J. The effects of training on the metabolic and respiratory profile of high-intensity cycle ergometer exercise. Eur. J. Appl. Physiol. 1990, 59, 421–429. [Google Scholar] [CrossRef]
  5. Jenkins, D.G.; Quigley, B.M. Endurance training enhances critical power. Med. Sci. Sports Exerc. 1992, 2, 1283–1289. [Google Scholar] [CrossRef]
  6. Roca, J.; Agusti, A.G.N.; Alonso, A.; Poole, D.C.; Viegasl, C.; Barbera, J.A.; Rodrigez-Roisin, R.; Ferrer, A.; Wagner, P.D. Effects of training on muscle O2 transport at VO2max. J. Appl. Physiol. 1992, 73, 1067–1076. [Google Scholar] [CrossRef]
  7. Phillips, S.M.; Green, H.J.; MacDonald, M.J.; Hughson, R.L. Progressive effect of endurance training on VO2 kinetics at the onset of submaximal exercise. J. Appl. Physiol. 1995, 79, 1914–1920. [Google Scholar] [CrossRef]
  8. Suter, E.; Hoppeler, H.; Claassen, H. Ultrastructural modification of human skeletal-muscle tissue with 6-month moderate-intensity exercise training. Int. J. Sports Med. 1995, 16, 160–166. [Google Scholar] [CrossRef]
  9. Carter, H.; Jones, A.M.; Barstow, T.J.; Burnley, M.; Williams, C.; Doustl, J.H. Effect of endurance training: On oxygen uptake kinetics during treadmill running. J. Appl. Physiol. 2000, 89, 1744–1752. [Google Scholar] [CrossRef]
  10. Fernström, M.; Tonkonogil, M.; Sahlin, K. Effects of acute and chronic endurance exercise on mitochondrial uncoupling in human skeletal muscle. J. Physiol. 2004, 554, 755–763. [Google Scholar] [CrossRef]
  11. Berger, N.J.; Tolfrey, K.; Williams, A.G.; Jones, A.M. Influence of continuous and interval training on oxygen uptake on-kinetics. Med. Sci. Sports Exerc. 2006, 38, 504–512. [Google Scholar] [CrossRef]
  12. Hottenrott, K.; Ludyga, S.; Schulze, S. Effects of high intensity training and continuous endurance training on aerobic capacity and body composition in recreationally active runners. J. Sports Sci. Med. 2012, 11, 483–488. [Google Scholar]
  13. Zoladz, J.A.; Grassi, B.; Majerczak, J.; Szkutnik, Z.; Korostyński, M.; Karasiński, J.; Kilarski, W.; Korzeniewski, B. Training-induced acceleration of O2 uptake on-kinetics precedes mitochondria biogenesis in humans. Exp. Physiol. 2013, 98, 883–898. [Google Scholar] [CrossRef]
  14. Zoladz, J.A.; Grassi, B.; Majerczak, J.; Szkutnik, Z.; Korostyński, M.; Grandys, M.; Jarmuszkiewicz, W.; Korzeniewski, B. Mechanisms responsible for the acceleration of pulmonary VO2 on-kinetics in humans after prolonged endurance training. Am. J. Physiol. 2014, 307, R1101–R1114. [Google Scholar]
  15. Burnley, M.; Jones, A.M. Oxygen uptake kinetics as a determinant of sports performance. Eur. J. Sport Sci. 2007, 7, 63–79. [Google Scholar] [CrossRef]
  16. Womack, C.J.; Davis, S.E.; Blumer, J.L.; Barrett, E.; Weltman, A.L.; Gaesser, G.A. Slow component of O2 uptake during heavy exercise: Adaptation to endurance training. J. Appl. Physiol. 1995, 79, 838–845. [Google Scholar] [CrossRef]
  17. Holloszy, J.O. Biochemical adaptations in muscle. Effects of exercise on mitochondrial oxygen uptake and respiratory enzyme activity in skeletal muscle. J. Biol. Chem. 1967, 242, 2278–2282. [Google Scholar] [CrossRef]
  18. Scalzo, R.L.; Peltonen, G.L.; Binns, S.E.; Shankaran, M.; Giordano, G.R.; Hartley, D.A.; Klochak, A.L.; Lonac, M.C.; Paris, H.L.; Szallar, S.E.; et al. Greater muscle protein synthesis and mitochondrial biogenesis in males compared with females during sprint interval training. FASEB J. 2014, 28, 2705–2714. [Google Scholar] [CrossRef]
  19. Baldwin, K.M.; Klinkerfuss, G.H.; Terjung, R.L.; Molé, P.A.; Holloszy, J.O. Respiratory capacity of white, red, and intermediate muscle: Adaptative response to exercise. Am. J. Physiol. 1972, 222, 373–378. [Google Scholar] [CrossRef]
  20. Jacobs, R.A.; Flückl, D.; Bonne, T.C.; Bürgi, S.; Christensen, P.M.; Toigo, M.; Lundby, C. Improvements in exercise performance with high-intensity interval training coincide with an increase in skeletal muscle mitochondrial content and function. J. Appl. Physiol. 2013, 115, 785–793. [Google Scholar] [CrossRef]
  21. Pesta, D.; Hoppel, F.; Macek, C.; Messner, H.; Faulhaber, M.; Kobel, C.; Parson, W.; Burtscher, M.; Schocke, M.; Gnaiger, E. Similar qualitative and quantitative changes of mitochondrial respiration following strength and endurance training in normoxia and hypoxia in sedentary humans. Am. J. Physiol. Regul. Integr. Comp. Physiol. 2011, 301, R1078–R1087. [Google Scholar] [CrossRef]
  22. Wibom, R.; Hultman, E.; Johansson, M.; Matherei, K.; Constantin-Teodosiu, D.; Schantz, P.G. Adaptation of mitochondrial ATP production in human skeletal muscle to endurance training and detraining. J. Appl. Physiol. 1992, 73, 2004–2010. [Google Scholar] [CrossRef]
  23. Tarnopolsky, M.A.; Rennie, C.D.; Robertshaw, H.A.; Fedak-Tarnopolsky, S.N.; Devries, M.C.; Hamadeh, M.J. Influence of endurance exercise training and sex on intramyocellular lipid and mitochondrial ultrastructure, substrate use, and mitochondrial enzyme activity. Am. J. Physiol. Regul. Integr. Comp. Physiol. 2007, 292, R1271–R1278. [Google Scholar] [CrossRef]
  24. Zoladz, J.A.; Majerczak, J.; Glganski, L.; Grandys, M.; Zapart-Bukowska, J.; Kuczek, P.; Kołodziejski, L.; Walkowicz, L.; Szymoniak-Chochół, D.; Kilarski, W.; et al. Endurance training increases the running performance of untrained men without changing the mitochondrial volume density in the gastrocnemius muscle. Int. J. Mol. Sci. 2022, 23, 10843. [Google Scholar] [CrossRef]
  25. Krieger, D.A.; Tate, C.A.; McMillin-Wood, J.; Booth, F.W. Populations of rat skeletal muscle mitochondria after exercise and immobilization. J. Appl. Physiol. 1980, 48, 23–28. [Google Scholar] [CrossRef]
  26. McCully, K.K.; Boden, B.P.; Tuchler, M.; Fountain, M.R.; Chance, B. Wrist flexor muscles of elite rowers measured with magnetic resonance spectroscopy. J. Appl. Physiol. 1989, 67, 926–932. [Google Scholar] [CrossRef]
  27. Sundberg, C.W.; Prost, R.W.; Fitts, R.H.; Hunter, S.K. Bioenergetic basis for the increased fatigability with ageing. J. Physiol. 2019, 597, 4943–4957. [Google Scholar] [CrossRef]
  28. Korzeniewski, B.; Rossiter, H.B. Exceeding a “critical” Pi: Implications for VO2 and metabolite slow components, muscle fatigue and the power-duration relationship. Eur. J. Appl. Physiol. 2020, 120, 1609–1619. [Google Scholar] [CrossRef]
  29. Korzeniewski, B.; Rossiter, H.B. Factors determining training-induced changes in VO2max, critical power and VO2 on-kinetics in skeletal muscle. J. Appl. Physiol. 2021, 130, 498–507. [Google Scholar] [CrossRef]
  30. Korzeniewski, B. Pi-induced muscle fatigue leads to near-hyperbolic power–duration dependence. Eur. J. Appl. Physiol. 2019, 119, 2201–2213. [Google Scholar] [CrossRef]
  31. Korzeniewski, B.; Zoladz, J.A. Possible factors determining the non-linearity in the VO2-power output relationship in humans theoretical studies. Japan. J. Physiol. 2003, 53, 271–280. [Google Scholar] [CrossRef] [PubMed]
  32. Korzeniewski, B. Mechanisms of the effect of oxidative phosphorylation deficiencies on the skeletal muscle bioenergetic system. J. Appl. Physiol. 2021, 131, 768–777. [Google Scholar] [CrossRef]
  33. Korzeniewski, B. Effect of training on skeletal muscle bioenergetic system in patients with mitochondrial myopathies: A computational study. Resp. Physiol. Neurobiol. 2022, 296, 103799. [Google Scholar] [CrossRef] [PubMed]
  34. Korzeniewski, B.; Zoladz, J.A. A model of oxidative phosphorylation in mammalian skeletal muscle. Biophys. Chem. 2001, 92, 17–34. [Google Scholar] [CrossRef] [PubMed]
  35. Korzeniewski, B.; Liguzinski, P. Theoretical studies on the regulation of anaerobic glycolysis and its influence on oxidative phosphorylation in skeletal muscle. Biophys. Chem. 2004, 110, 147–169. [Google Scholar] [CrossRef]
  36. Korzeniewski, B.; Rossiter, H.B. Each-step activation of oxidative phosphorylation is necessary to explain muscle metabolite kinetic responses to exercise and recovery in humans. J. Physiol. 2015, 593, 5255–5268. [Google Scholar] [CrossRef]
  37. Korzeniewski, B. Regulation of oxidative phosphorylation is different in electrically- and cortically-stimulated skeletal muscle. PLoS ONE 2018, 13, e0195620. [Google Scholar] [CrossRef]
  38. Korzeniewski, B. Muscle VO2-power output nonlinearity in constant-power, step-incremental, and ramp-incremental exercise: Magnitude and underlying mechanisms. Physiol. Rep. 2018, 6, e13915. [Google Scholar] [CrossRef]
  39. Korzeniewski, B. Regulation of ATP supply during muscle contraction: Theoretical studies. Biochem. J. 1998, 330, 1189–1195. [Google Scholar] [CrossRef]
  40. Korzeniewski, B. Regulation of oxidative phosphorylation in different muscles and various experimental conditions. Biochem. J. 2003, 375, 799–804. [Google Scholar] [CrossRef]
  41. Korzeniewski, B. Regulation of oxidative phosphorylation through parallel activation. Biophys. Chem. 2007, 129, 93–110. [Google Scholar] [CrossRef]
  42. Korzeniewski, B. Regulation of oxidative phosphorylation through each-step activation (ESA): Evidences from computer modeling. Prog. Biophys. Mol. Biol. 2017, 125, 1–23. [Google Scholar] [CrossRef] [PubMed]
  43. Fell, D.A.; Thomas, S. Physiological control of metabolic flux: The requirement for multisite modulation. Biochem. J. 1995, 311, 35–39. [Google Scholar] [CrossRef] [PubMed]
  44. Thomas, S.; Fell, D.A. The role of multiple enzyme activation in metabolic flux control. Adv. Enzyme. Regul. 1998, 38, 65–85. [Google Scholar] [CrossRef] [PubMed]
  45. Korzeniewski, B.; Rossiter, H.B. Skeletal muscle biochemical origin of exercise intensity domains and their relation to whole-body VO2 kinetics. Biosci. Rep. 2022, 42, BSR20220798. [Google Scholar] [CrossRef] [PubMed]
  46. Korzeniewski, B. Sensitivity of VO2max, critical power and VO2 on-kinetics to O2 concentration/delivery and other factors in skeletal muscle. Resp. Physiol. Neurobiol. 2023, 307, 103977. [Google Scholar] [CrossRef]
  47. Whipp, H.B. Domains of aerobic function and their limiting parameters. In The Physiology and Pathophysiology of Exercise Tolerance; Steinacker, J.M., Ward, S.A., Eds.; Plenum: New York, NY, USA, 1996; pp. 83–89. [Google Scholar]
  48. Easterby, J.S. A generalized theory of the transition time for sequential enzyme reactions. Biochem. J. 1981, 199, 155–161. [Google Scholar] [CrossRef]
  49. Korzeniewski, B.; Zoladz, J.A. Factors determining the oxygen consumption rate (VO2) on-kinetics in skeletal muscle. Biochem. J. 2004, 379, 703–710. [Google Scholar] [CrossRef]
  50. Goulding, R.P.; Rossiter, H.B.; Marwood, S.; Ferguson, C. Bioenergetic mechanisms linking VO2 kinetics and exercise tolerance. Exerc. Sport Sci. Rev. 2021, 49, 274–283. [Google Scholar] [CrossRef]
  51. Allen, D.G.; Lamb, G.D.; Westerblad, H. Skeletal muscle fatigue: Cellular mechanisms. Physiol. Rev. 2008, 88, 287–332. [Google Scholar] [CrossRef]
  52. Wilson, J.R.; McCully, K.K.; Mancini, D.M.; Boden, B.; Chance, B. Relationship of muscular fatigue to pH and diprotonated Pi in humans: A 31P-NMR study. J. Appl. Physiol. 1988, 64, 2333–2339. [Google Scholar] [CrossRef] [PubMed]
  53. Allen, D.G.; Westerblad, H. Role of phosphate and calcium stores in muscle fatigue. J. Physiol. 2001, 536, 657–665. [Google Scholar] [CrossRef] [PubMed]
Figure 1. General scheme of the myocyte bioenergetic system. The components of the system are presented that are considered explicitly in the dynamic computer model used for theoretical studies. Each-step activation (ESA) denotes direct activation of (almost) all elements of the system by some mechanism involving cytosolic Ca2+ (ATP usage, OXPHOS complexes, malate–aspartate shuttle, MAS and glycolysis) and mitochondrial Ca2+ (NADH supply system). Some still unknown factor/mechanism cooperating with Ca2+, for example, calmodulin-like protein, which “presents” Ca2+ ions to enzymes/carriers and/or protein (de)phosphorylation, is indicated by the question mark (“?”). CI, CIII and CIV indicate complexes I, III and IV of the respiratory chain, respectively; cyt.c, cytochrome c; UQ, ubiquinone. This diagram is taken from [45] (no permission required by the publisher).
Metabolites 13 01111 g001
Figure 2. Simulated effect of training-induced increase in OXPHOS activity on  V · O2max. Time courses of muscle  V · O2 and Pi in untrained and trained muscle are shown.  V · O2max and end-exercise time before and after training are indicated. The system remains in the very heavy exercise-intensity domain (AUT = 90 is greater than AUTcrit both before and after training). The additional ATP usage, underlying the slow component of the  V · O2 and Pi slow component, is launched when Pi exceeds Picrit, and exercise is terminated because of fatigue when Pi reaches Pipeak.
Metabolites 13 01111 g002
Figure 3. Simulated effect of training-induced increase in OXPHOS activity on CP (AUTcrit). Time courses of muscle  V · O2 and Pi in untrained and trained muscle are shown.  V · O2max and end-exercise time before training are indicated. After training, Pi reaches a steady state less than Pipeak V · O2 reaches a steady state less than  V · O2max, and exercise is not terminated because of fatigue: the system passes from the very heavy to heavy exercise intensity domain (AUT = 82 is greater than AUTcrit before training and less than AUTcrit after training). The additional ATP usage, underlying the slow component of the  V · O2 and Pi slow component, is initiated when Pi exceeds Picrit, and exercise is terminated because of fatigue when Pi reaches Pipeak.
Metabolites 13 01111 g003
Figure 4. Simulated effect of training-induced increase in OXPHOS activity on t0.63. Time courses of muscle  V · O2 and Pi in untrained and trained muscle are shown. t0.63 before and after training is shown. The system remains in the moderate exercise intensity domain (AUT = 50 is less than AUTadd, AUT at which Pi exceeds Picrit, and the additional ATP usage, underlying the slow component of the  V · O2 and Pi slow component, is launched, both before and after training).
Metabolites 13 01111 g004
Figure 5. Simulated effect of training-induced decrease in Pipeak (Pipeak decr.) on  V · O2max. OXPHOS activity is increased as the result of training, as in Figure 2. Time courses of muscle  V · O2 and Pi in trained muscle without and with Pipeak decreases are shown. The lines representing  V · O2 and Pi overlap at the moment when exercise is terminated at lowered Pipeak V · O2max and timeend are decreased as a result of the Pipeak decrease. The additional ATP usage, underlying the slow component of  V · O2 and the Pi slow component, is initiated when Pi exceeds Picrit, and exercise is terminated because of fatigue when Pi reaches Pipeak.
Metabolites 13 01111 g005
Figure 6. Simulated effect of training-induced decrease in Pipeak (Pipeak decr.) on CP (AUTcrit). OXPHOS activity is increased as the result of training, as in Figure 3. Time courses of muscle  V · O2 and Pi in trained muscle without and with Pipeak decreases are shown. The lines representing  V · O2 and Pi overlap at the moment when exercise is terminated at lowered Pipeak. The Pipeak decrease lowers AUTcrit, causing AUT = 82 to be greater than AUTcrit, Pi reaches (decreased) Pipeak V · O2 reaches (decreased)  V · O2max and the system passes from the heavy to very heavy exercise-intensity domain. Exercise is terminated because of fatigue when Pi reaches (lowered) Pipeak.
Metabolites 13 01111 g006
Figure 7. Mechanism of the training-induced increases in  V · O2max, CP and t0.63. Muscle training causes an increase in total (default and/or work-induced) OXPHOS activity, leading to smaller changes in metabolites (ADP, Pi, PCr, H+) at a given time after the onset of exercise (delay/attenuation of metabolite changes). As a result: 1. The increase in Pi with time (especially in relation to the increase in  V · O2) and reaching of Pipeak by Pi are attenuated;  V · O2 can increase more at a given Pi, and thus,  V · O2 at Pipeak, that is  V · O2max, is elevated; 2. At a given work intensity (ATP usage activity, AUT), the new steady state of primary phase II of metabolites (ADP, Pi, PCr, H+) on-kinetics is reached in a shorter time, OXPHOS is stimulated faster by increases in ADP and Pi, and therefore, the transition time t0.63 of the  V · O2 on-kinetics is shortened; 3. The steady state of Pi concentration (not reached for PO greater than CP, that is, for AUT greater than AUTcrit) can fall, for a given AUT, from greater than to less than Pipeak so that the system passes from the very heavy/severe to heavy, or even moderate exercise intensity domain, and thus, AUTcrit (CP) is elevated.
Metabolites 13 01111 g007
Disclaimer/Publisher’s Note: The statements, opinions and data contained in all publications are solely those of the individual author(s) and contributor(s) and not of MDPI and/or the editor(s). MDPI and/or the editor(s) disclaim responsibility for any injury to people or property resulting from any ideas, methods, instructions or products referred to in the content.

