Microstructure and Electrical Property of Ex-Situ and In-Situ Copper Titanium Carbide Nanocomposites


School of Materials Science and Engineering, Hanoi University of Science and Technology, Hanoi 100000, Vietnam
*
Author to whom correspondence should be addressed.
Metals 2020, 10(6), 735; https://doi.org/10.3390/met10060735
Submission received: 19 May 2020
/
Revised: 28 May 2020
/
Accepted: 29 May 2020
/
Published: 2 June 2020
Abstract
:In this study, ex-situ Cu-TiC nanocomposites of 1, 3 and 5 vol. % TiC and in-situ Cu-TiH2-C nanocomposites (corresponding to 5 vol. % TiC) were prepared using ball milling and spark plasma sintering methods. Powder mixtures were milled for 4 h at 400 rpm. As-milled Cu-TiC composite powders were consolidated under an applied pressure of 70 MPa. The phase composition, and microstructure of the composite samples were characterized by X-ray diffraction, and scanning electron microscope and transmission electron microscope techniques, respectively. With the increasing TiC content from 1 to 5 vol. %, the hardness of the ex-situ composites when sintered at 600 °C changed between 161.4 and 178.5 HV and the electrical conductivity decreased from 52.1 to 47.6% IACS. In-situ Cu-TiH2-C nanocomposite sintered at 950 °C had higher hardness and electrical conductivity than ex-situ Cu-TiC composite due to having a homogenous distribution of nano reinforcement particles and dense structure.
1. Introduction
Copper possesses several properties, such as high electrical conductivity, thermal conductivity, good formability, a high melting point and good corrosion resistance, which is widely used in electrical and electronic applications [1,2]. However, low hardness, strength, and poor wear resistance limit the usage area of pure copper. The mechanical properties and wear resistance can be enhanced by adding hard second-phase particles. There are two ways of strengthening copper matrix composite, which are ex-situ and in-situ processes [3,4,5]. In the ex-situ composite, reinforcement particles, such as oxides, carbides, and borides, are generally introduced into the copper matrix externally [6,7]. In the in-situ composite, reinforcement phases are formed within the matrix via reaction during processing. The feature of this method is that very fine reinforcement particles are formed. Moreover, interfaces between reinforcement particles and matrix are clean, which enhances the mechanical and physical properties of copper matrix composites [8,9].
In the present study, TiC with high modulus, hardness, melting temperature and chemical stability was selected as reinforcement materials for the copper matrix [10,11,12]. Besides good mechanical properties, TiC also has high electrical conductivity comparable to metals and alloys, such as titanium, manganin, etc. [13,14]. In order to prevent mass transfer occurs between anode and cathode in contact materials, TiC-reinforced particles are a good candidate for reducing mass transfer on the surface of electrical contacts. There are some methods to synthesize copper matrix composite, such as stir casting, liquid metal infiltration, squeeze casting, spray decomposition and powder metallurgy [15]. Among these methods, mechanical milling (MM) proved several advantages, namely uniform distribution of ceramic particles, low cost, bonding enhancing and reactions minimizing between the reinforcement and the matrix [16,17,18,19]. Spark plasma sintering (SPS) with a fast heating rate and short sintering time is a suitable technique for consolidation amorphous, nanocomposites powders [20,21,22].
The objective of this work is to investigate the relationship between microstructure and properties of ex-situ and in-situ nanocomposites prepared via mechanical milling and spark plasma sintering techniques.
2. Materials and Methods
The copper (with average particle size of 75 µm), Titanium carbide TiC powder (US2052, US Research Nanomaterials, Inc., Houston, TX, USA) with a particle size within the 40–60 nm range, TiH2 (average particle size of 40 µm) and graphite (average particle size of 5 µm) powder (≥ 99% purity, from HIGH PURITY CHEMICALS Co., Ltd., Chiyoda, Japan) were used as starting materials. The powder mixtures of two composites Cu-TiH2-C and Cu-TiC of 1, 3 and 5 vol. % TiC for ex-situ composites and 5 vol. % TiC for in-situ composites were mechanically milled in a high-energy planetary ball mill (P100-Korea). Milling was operated for 4 h at the rotational speed of 400 rpm and 0.5 wt. % stearic acid was used as the milling process control agent. The balls and vials were made of hardened steel, the diameter of the balls was 5 mm and the powder-to-ball ratio was 1:20. The vial was evacuated and subsequently filled with argon gas up to 0.3 MPa. The as-milled composite powders were placed into a graphite die with an inner diameter of 10 mm. Before sintering, the SPS chamber was pumped to a pressure below 5 Pa. The sintering experiments were conducted using a spark plasma sintering facility (DR. SINTER LAB Model: SPS-515S, Sumitomo Coal Mining, Tokyo, Japan). The sintering temperatures are 600 and 700 °C for ex-situ Cu-TiC composite while those for in-situ Cu-TiH2-C composite are 600, 700 and 950 °C. The holding time is 5 min for both composites. A pressure of 70 MPa was applied throughout the sintering cycle. The applied pressure and heating of SPS to densify as-milled powders are described in ref. [23]. The microstructure of the composites was studied by scanning electron microcopy and energy-dispersive spectroscopy (SEM/EDS) using a field-emission JEOL JSM-7600F microscope (JEOL Ltd., Tokyo, Japan) and transmission electron microscopy (TEM) using a JEOL JEM-2100 microscope (JEOL Ltd., Tokyo, Japan). The phase composition of the milled powders was studied by means of X-ray diffraction (XRD) using a RIGAKU RINT-2000 diffractometer with Cu Kα radiation (Rigaku Corporation, Tokyo, Japan). The relative densities of composites were performed by Olympus PMG3 optical microscope (Olympus Corporation, Tokyo, Japan) with computerized image analysis at a magnification of 100×. The hardness of the sintered Cu-TiC composites was measured using a Vickers hardness instrument (Mitutoyo MVK-H1 Hardness Testing Machine, Mitutoyo, Japan) under a load of 100 g. The electrical conductivity measured by this equipment is usually expressed as a percentage of the conductivity of the International Annealed Copper Standard (% IACS). A minimum of five readings were taken for each sample.
3. Results
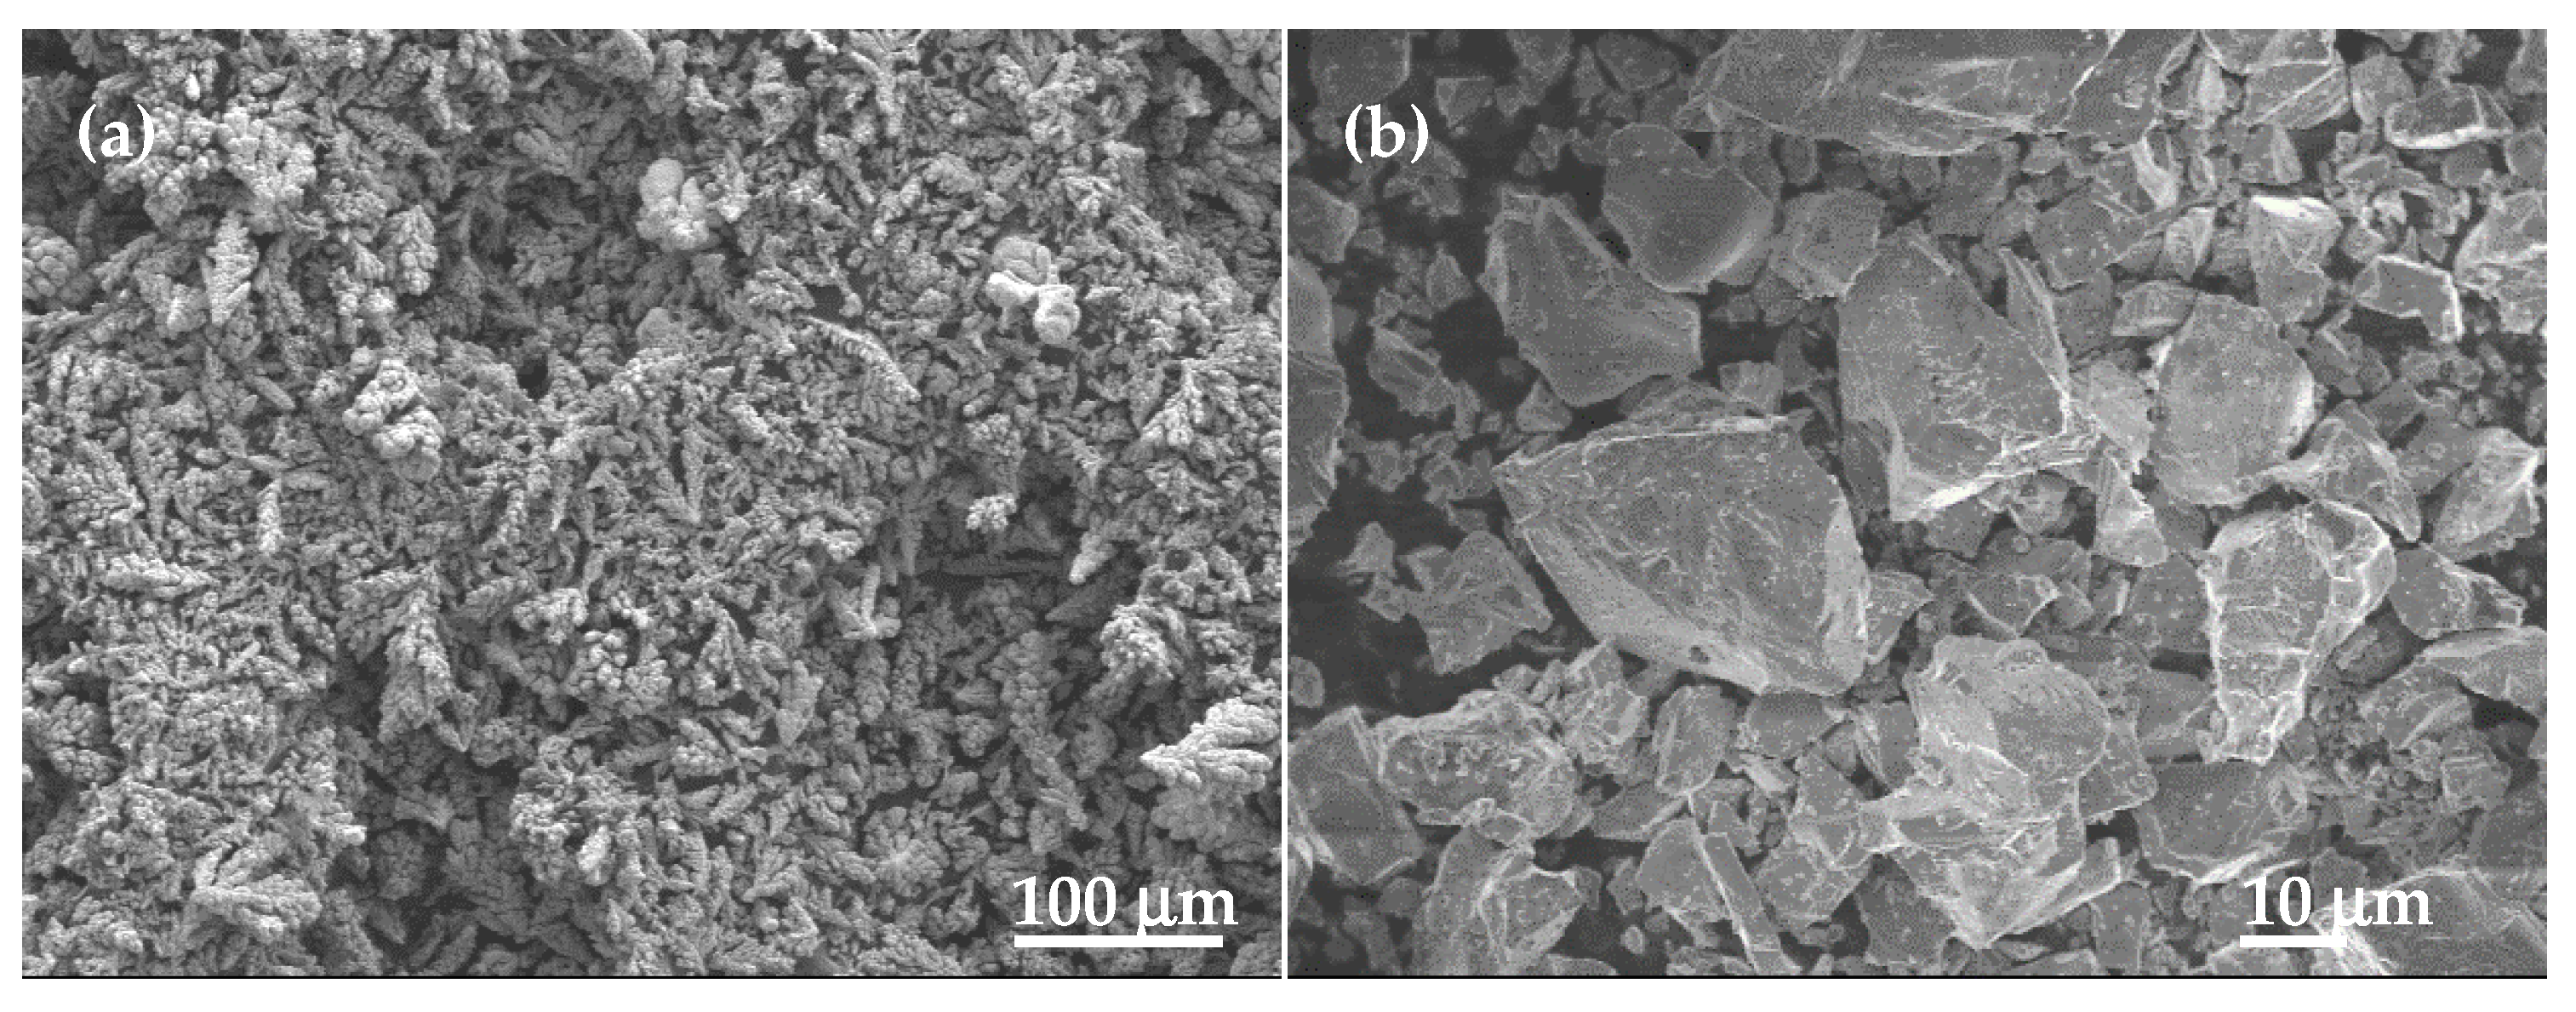
Figure 1 illustrates SEM images of pure copper and titanium hydride powders. While copper powder had a dendritic structure, titanium hydride powder had a sharp-edged structure. Figure 2 shows the SEM images of milled composite powder along with the EDS patterns. The powder agglomeration can be observed for ex-situ (Figure 2a–c) and in-situ (Figure 2d) composite for which even stearic acid is used in milling process. The data of EDS spectra are listed in the Table 1. It was realized that only a small amount of iron is detected in both composite powders. Milling rotation at 400 rpm can reduce the contamination from milling tools. In the case of using horizontal miller to produce copper matrix composite, Jian Zhuang et al. noted that the higher concentration of irons was detected according to EDS results [24].
The amount of oxygen in in-situ Cu-TiH2-C composite powder (1.44 wt. % O) is remarkably smaller compared to ex-situ Cu-TiC composite powder (4.27 wt. % O). Figure 3 presents the XRD patterns of composite powder milled for 4 h. Diffraction peaks of pure copper can be seen for both composite powders. However, it can be seen from Figure 3b that only the TiC phase can be found in ex-situ Cu-TiC composite powder. The diffraction peaks of the TiC phase were not detected in the XRD pattern for in-situ Cu-TiH2-C composite (Figure 3b). This means that, in the milling process, the activation energy was not satisfied for the reaction between C and TiH2 to form to TiC precipitate.
Figure 4a,c shows the back-scatter electron SEM micrographs of polished surface of composite samples. The dark gray areas represent porosities, very fine gray sharp-edged grains indicate TiC and light gray areas correspond to Cu matrix. The absence of cracks was observed in the secondary electron SEM images. The fractured surface of as-sintered composites, as seen in Figure 4b,d, shows dimples, which suggests a ductile fracture mode. With the same magnification of 10.000×, the microstructure of in-situ Cu-TiH2-C nanocomposite is finer compared to that of ex-situ Cu-TiC nanocomposite. This means that reinforcement particles in in-situ nanocomposite distribute more homogeneously in a copper matrix than that of ex-situ composite do.
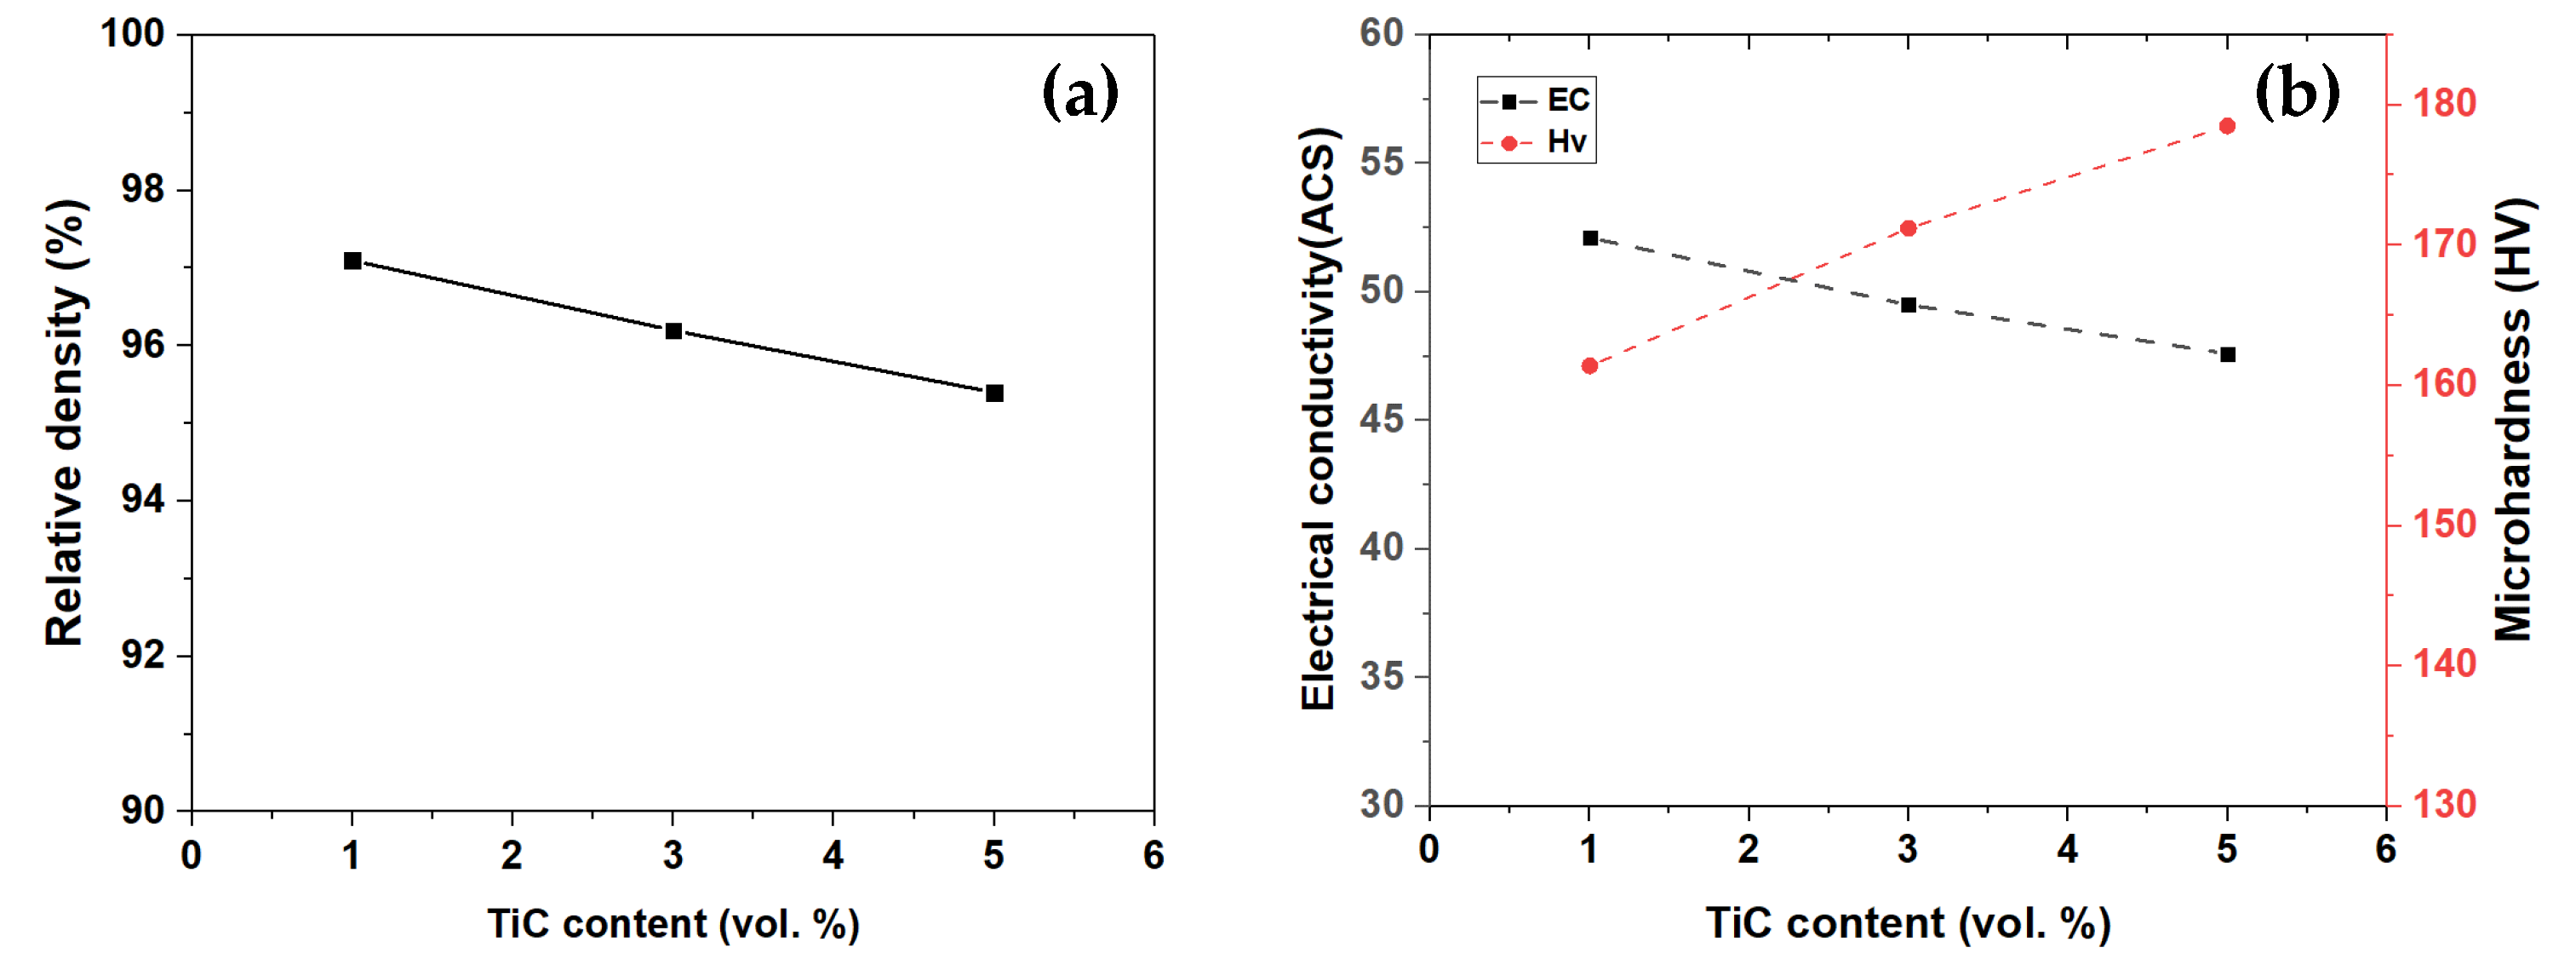
Figure 5a shows the influence of the TiC volume fraction on the relative density of ex-situ Cu-TiC nanocomposites sintered at 600 °C. There is a reduction in the relative density of composite from 97.1% to 95.4% with increasing from 1 to 5 volume percent of TiC. The decrease in relative density was caused by a significant difference between melting points of copper and TiC, which hindered therearrangement of powder particles during the sintering process. The more additional TiC content in the composite there is, the greater the adverse effect on the sintering is. Furthermore, the density of TiC is lower than that of copper, so the density of composites decreases with an increasing TiC volume. The relative density decreased slightly in ex-situ composite containing 1 and 3 vol. % TiC when sintering temperature rises from 600 to 700 °C (Table 2). These results contradict those of the ex-situ composite containing 5 vol. % TiC, where there is an increase in relative density with higher sintering temperature. The atomic diffusion rate will be accelerated at higher sintering temperature to eliminate porosity formed in a denser structure [25].
The microhardness and electrical conductivity of the ex-situ Cu-TiC composites sintered at 600 °C plotted in Figure 5b. The hardness values of composites increased from 161.4 to 178.5 HV with the addition of 1 to 5 vol. % TiC. The composite hardness increased with the addition of TiC content, which is due mainly to the respective hardness of the reinforcement particle. The highest hardness value of the ex-situ Cu-TiC composite is 186 HV after sintering at 700 °C, as seen in Table 3. At a sintering temperature of 700 °C, the microhardness values of ex-situ composites containing 1 and 3 vol. % TiC decreased due to higher occurrence of recrystallization [26]. The microhardness of in-situ Cu-TiH2-C composites increased significantly from 175.8 to 206.5 HV when the sintering temperature increased from 600 to 950 °C. At a higher sintering temperature, the reaction between TiH2 and C was supported thermodynamically. As J.Zhang reported, the formation of TiC from TiH2 and C can occur at 1130−1300 °C [27]. It can be seen that the microhardness of ex-situ Cu-TiC composites is inversely proportional to their electrical conductivity. A similar relationship is also observed in the case of the in-situ Cu-NbC composite [28]. The electrical conductivity of the ex-situ Cu-TiC composites sintered at 600 °C decreases from 52.1 to 47.6 as the TiC volume percentage increased from 1 to 5 (as in Table 4). It can be explained that the electrons in TiC are tight bonding to the nucleus, so electrons do not move; consequently, the electrical conductivity of carbides is weak [29]. Nevertheless, the electrons in copper can move so easily that the electrical conductivity of metal is good. The more TiC content introduced in composite, the greater the density of dislocation induced by the difference of thermal expansion coefficients between TiC and Cu. Extra scattering centers were produced by these dislocations in the copper matrix [30]. Each scattering even contributes to decrease the kinetic energy of electrons in metal. With an increasing amount of TiC reinforcement, the mean free conductive path increases, resulting in a decrease in electrical conductivity. The increase in reinforcement volume fraction TiC embedded in copper matrix may account for the decrease in Cu grain size and the resultant increase in grain boundary volume. The higher the grain boundary volume, the more barriers to the conductive path, which can reduce the electrical conductivity of composite [31]. By using TiC with a 10-μm grain size, S. Islak et al. [25] obtained the electrical conductivity value of 68.1% IACS for Cu-10 wt. % TiC composite sintered at 800 °C, while the microhardness is about 85.2 HV. Soner Buytoz [32] also prepared ex-situ Cu-TiC via the hot pressing technique. The electrical conductivity and microhardness of the resulting composite with 10% TiC addition sintered at 700 °C for 4 min is about 64.9% IACS and 84 HV, respectively. The larger the reinforcement particles distributed in the copper matrix, the lower the hardness value and the higher electrical conductivity of composite materials. The higher electrical conductivity value of the Cu-TiH2-C (5 vol. % TiC) composite sintered at 950 °C (54.8) compared to the Cu-TiC (5 vol. % TiC) composite sintered at 700 °C (51) is related to the higher relative density of the in-situ composite. According to Table 2, the relative density of the in-situ Cu-TiH2-C (5 vol. % TiC) composite sintered at 950 °C is 97.2%, while, for the ex-situ Cu-TiC (5 vol. % TiC) composite, it is 96.5%.
The bright-field and HR-TEM images (Figure 6a–d) of ex-situ Cu-TiC and in-situ Cu-TiH2-C show that the particle size of TiC is about 40 and 15nm, respectively. The selected area electron diffraction (SAED) patterns of both composites in Figure 6a,b corresponds to TiC particles. With the same composition of a TiC of 5 vol. %, J. Zhang et al. [33] reported that grain size in the Cu matrix is about 5 μm for in-situ Cu-TiC composite produced by hot pressing; the sample also has electrical conductivity of 30% IACS, tensile strength of 315 MPa, and hardness of 100 HV. Karadag M et al. [34] sintered milled Cu-TiC powders at 800 °C for 2h in air. The resulting hardness values decreased with higher TiC content of 10 wt. % because of inhomogeneous TiC dispersion in the Cu matrix, which influence mechanical and electrical properties negatively. The crystalline size of copper in ex-situ and in-situ is about 15 and 10 nm, respectively. The smaller the copper crystallite size in Cu-TiH2-C in-situ composites, the better distribution of TiC on the copper matrix. This, in combination with clean interfaces between the matrix and the reinforcement, enhances the hardness value of the composite. The highest hardness values for ex-situ Cu-TiC and in-situ Cu-TiH2-C sintered at 700 and 950 °C are 181.6 and 206.5 HV, respectively. Furthermore, the electrical resistivity of the in-situ composite is 47.2% IACS, which is higher than that of in-situ Cu-NbC with the same reinforcement volume as that reported [35].
4. Conclusions
The ex-situ Cu-TiC and in-situ Cu-TiH2-C nanocomposites were successfully produced using the MM and SPS with a sintering time of 5 minutes under a pressure of 70 MPa. The XRD pattern of milled Cu-TiH2-C composite powder indicates that TiC did not form during the milling process. The presence of TiC grains with a size of 15 nm for Cu-TiH2-C composite powder sintered at 950 °C was confirmed by TEM in electron diffraction mode. For ex situ, the relative densities of Cu-TiC composites with 1 to 5 vol. % TiC were reduced from 97.1% to 95.4% for the samples sintered at 600 °C. The hardness of composites increased from 161.4 to 178.4 HV. The electrical conductivity of Cu-TiC composites also decreased from 52.1% to 47.6% IACS with a higher volume of TiC. At a higher sintering temperature of 700 °C, for ex-situ Cu-TiC composite with 5 vol. % TiC, the relative density, hardness, and electrical conductivity value increased. The electrical conductivity of in-situ Cu–TiH2-C composites sintered at 600, 700 and 950 °C is 45.5%, 47.2% and 54.8% IACS, respectively. The highest hardness value of 206.5 and 181.6 HV was obtained for ex-situ Cu-TiC and in-situ Cu–TiH2-C nanocomposites with 5 vol. % TiC sintered at 700 and 950 °C, respectively. These results indicate an advantage of an in-situ method over an ex-situ method for preparing nanocomposites. An in-situ reaction between Cu and TiH2 occurs in the copper matrix to form nano TiC particles, improving the bonding matrix and reinforcement particles and better distributing the hardness values as well as electrical properties of the composite.
Author Contributions
Conceptualization, methodology, investigation, visualization, software, N.H.V.; methodology, validation, writing—review and editing, visualization, N.T.H.O.; project administration, funding acquisition, N.T.H.O. All authors have read and agreed to the published version of the manuscript.
Funding
This research is funded by Vietnam National Foundation for Science and Technology Development (NAFOSTED) under grant number 103.02-2017.366.
Conflicts of Interest
The authors declare no conflict of interest.
References
- Surekha, K.; Els-Botes, A. Development of high strength, high conductivity copper by friction stir processing. Mater. Des. 2011, 32, 911–916. [Google Scholar] [CrossRef]
- Dinaharan, I.; Saravanakumar, S.; Kalaiselvan, K.; Gopalakrishnan, S. Microstructure and sliding wear characterization of Cu/TiB2 copper matrix composites fabricated via friction stir processing. J. Asian Ceram. Societies 2017, 5, 295–303. [Google Scholar] [CrossRef] [Green Version]
- Casati, R.; Vedani, M. Metal Matrix Composites Reinforced by Nano-Particles—A Review. Metals 2014, 4, 65–83. [Google Scholar] [CrossRef]
- Nguyen Thi Hoang, O.; Nguyen Hoang, V.; Kim, J.-S.; Dudina, V.D. Structural Investigations of TiC–Cu Nanocomposites Prepared by Ball Milling and Spark Plasma Sintering. Metals 2017, 7, 123. [Google Scholar] [CrossRef] [Green Version]
- Thi Hoang Oanh, N.; Hoang Viet, N.; Kim, J.-S.; Moreira Jorge Junior, A. Characterization of In-Situ Cu–TiH2–C and Cu–Ti–C Nanocomposites Produced by Mechanical Milling and Spark Plasma Sintering. Metals 2017, 7, 117. [Google Scholar] [CrossRef] [Green Version]
- Celebi Efe, G.; Yener, T.; Altinsoy, I.; Ipek, M.; Zeytin, S.; Bindal, C. The effect of sintering temperature on some properties of Cu–SiC composite. J. Alloys Compd. 2011, 509, 6036–6042. [Google Scholar] [CrossRef]
- Ramesh, M.; D, J.D.; Ravichandran, M. Investigation on Mechanical Properties and Wear Behaviour of Titanium Diboride Reinforced Composites. FME Trans. 2019, 47, 873–879. [Google Scholar] [CrossRef] [Green Version]
- Zuhailawati, H.; Yong, T.L. Consolidation of dispersion strengthened copper–niobium carbide composite prepared by in situ and ex situ methods. Mater. Sci. Eng. A 2009, 505, 27–30. [Google Scholar] [CrossRef]
- Awotunde, M.A.; Adegbenjo, A.O.; Obadele, B.A.; Okoro, M.; Shongwe, B.M.; Olubambi, P.A. Influence of sintering methods on the mechanical properties of aluminium nanocomposites reinforced with carbonaceous compounds: A review. J. Mater. Res. Technol. 2019, 8, 2432–2449. [Google Scholar] [CrossRef]
- Frage, N.; Froumin, N.; Rubinovich, L.; Dariel, M.P. Infiltrated TiC/Cu composites. In Powder Metallurgical High Performance Materials. Proceedings. Volume 1: High Performance P/M Metals, Proceedings of the 15th International Plansee Seminar, Reutte, Austria, May 2001; Kneringer, G., Roedhammer, P., Wildner, H., Eds.; Plansee AG: Reutte, Austria, 2001. [Google Scholar]
- Nemati, N.; Khosroshahi, R.; Emamy, M.; Zolriasatein, A. Investigation of microstructure, hardness and wear properties of Al–4.5wt.% Cu–TiC nanocomposites produced by mechanical milling. Mater. Des. 2011, 32, 3718–3729. [Google Scholar] [CrossRef]
- Tjong, S.C.; Ma, Z.Y. Microstructural and mechanical characteristics of in situ metal matrix composites. Mater. Sci. Eng. R: Rep. 2000, 29, 49–113. [Google Scholar] [CrossRef]
- Takahashi, K.; Kagawa, T.; Tanaka, K.; Kihira, H.; Ushioda, K. Reduction of Contact Resistance on Titanium Sheet Surfaces by Formation of Titanium Carbide and Nitride, and its Stability in Sulfuric Acid Aqueous Solution. ISIJ Int. 2019, 59, 1621–1631. [Google Scholar] [CrossRef] [Green Version]
- Meaden, G.T. Electrical Resistance of Metals; Springer: Boston, MA, USA, 1965; p. 218. [Google Scholar] [CrossRef]
- Hashmi, T.Q. Liquid State Methods of Producing Metal Matrix Composites: A Review Article. J. Res. Mech. Eng. Technol. 2014, 5, 103–106. [Google Scholar]
- Singh, V.K.; Sakshi, C.; Gope, P.C.; Chaudhary, A.K. Enhancement of Wettability of Aluminum Based Silicon Carbide Reinforced Particulate Metal Matrix Composite. High Temp. Mater. Processes 2015, 34, 163–170. [Google Scholar] [CrossRef]
- Alaneme, K.K.; Okotete, E.A.; Fajemisin, A.V.; Bodunrin, M.O. Applicability of metallic reinforcements for mechanical performance enhancement in metal matrix composites: a review. Arab J. Basic Appl. Sci. 2019, 26, 311–330. [Google Scholar] [CrossRef]
- Khoa, H.X.; Tuan, N.Q.; Lee, Y.H.; Lee, B.H.; Viet, N.H.; Kim, J.S. Fabrication of Fe-TiB2 Composite Powder by High-Energy Milling and Subsequent Reaction Synthesis. J. Korean Powder Metall. Inst. 2013, 20, 221–227. [Google Scholar] [CrossRef] [Green Version]
- Thandalam, S.K.; Ramanathan, S.; Sundarrajan, S. Synthesis, microstructural and mechanical properties of ex situ zircon particles (ZrSiO4) reinforced Metal Matrix Composites (MMCs): a review. J. Mater. Res. Technol. 2015, 4, 333–347. [Google Scholar] [CrossRef] [Green Version]
- Tuan, N.Q.; Khoa, H.X.; Viet, N.H.; Lee, Y.H.; Lee, B.H.; Kim, J.S. Fabrication of Fe-TiC Composite by High-Energy Milling and Spark-Plasma Sintering. J. Korean Powder Metall. Inst. 2013, 20, 338–344. [Google Scholar] [CrossRef] [Green Version]
- Viet, H.N.; Oanh, T.N.; Kim, J.-S.; Jorge, M.A. Crystallization Kinetics and Consolidation of Al82La10Fe4Ni4 Glassy Alloy Powder by Spark Plasma Sintering. Metals 2018, 8, 812. [Google Scholar] [CrossRef] [Green Version]
- Choi, P.P.; Kim, J.S.; Nguyen, O.T.H.; Kwon, D.H.; Kwon, Y.S.; Kim, J.C. Al-La-Ni-Fe bulk metallic glasses produced by mechanical alloying and spark-plasma sintering. Mater. Sci. Eng. A 2007, 449–451, 1119–1122. [Google Scholar] [CrossRef]
- Saheb, N.; Hayat, U.; Hassan, F.S. Recent Advances and Future Prospects in Spark Plasma Sintered Alumina Hybrid Nanocomposites. Nanomaterials 2019, 9, 1607. [Google Scholar] [CrossRef] [PubMed] [Green Version]
- Zhuang, J.; Liu, Y.; Cao, Z.; Li, Y. The Influence of Technological Process on Dry Sliding Wear Behaviour of Titanium Carbide Reinforcement Copper Matrix Composites. Mater. Trans 2010, 51, 2311–2317. [Google Scholar] [CrossRef] [Green Version]
- Islak, S.; Kır, D.; Buytoz, S. Effect of Sintering Temperature on Electrical and Microstructure Properties of Hot Pressed Cu-TiC Composites. Sci. Sintering 2014, 46, 15–21. [Google Scholar] [CrossRef]
- Matějíček, J.; Vilémová, M.; Veverka, J.; Kubásek, J.; Lukáč, F.; Novák, P.; Preisler, D.; Stráský, J.; Weiss, Z. On the Structural and Chemical Homogeneity of Spark Plasma Sintered Tungsten. Metals 2019, 9, 879. [Google Scholar] [CrossRef] [Green Version]
- Yang, Y.F.; Mu, D.K. Rapid dehydrogenation of TiH2 and its effect on formation mechanism of TiC during self-propagation high-temperature synthesis from TiH2–C system. Powder Technol. 2013, 249, 208–211. [Google Scholar] [CrossRef]
- Long, B.D.; Othman, R.; Umemoto, M.; Zuhailawati, H. Spark plasma sintering of mechanically alloyed in situ copper–niobium carbide composite. J. Alloys Compd. 2010, 505, 510–515. [Google Scholar] [CrossRef]
- Pierson, H.O. 6 - Carbides of Group VI: Chromium, Molybdenum, and Tungsten Carbides. In Handbook of Refractory Carbides and Nitrides; Pierson, H.O., Ed.; William Andrew Publishing: Westwood, NJ, USA, 1996; pp. 100–117. [Google Scholar] [CrossRef]
- Sousa, T.G.; Moura, I.A.d.B.; Garcia Filho, F.D.C.; Monteiro, S.N.; Brandão, L.P. Combining severe plastic deformation and precipitation to enhance mechanical strength and electrical conductivity of Cu–0.65Cr–0.08Zr alloy. J. Mater. Res. Technol. 2020. [Google Scholar] [CrossRef]
- Venugopal, T.; Prasad Rao, K.; Murty, B.S. Mechanical and electrical properties of Cu–Ta nanocomposites prepared by high-energy ball milling. Acta Mater. 2007, 55, 4439–4445. [Google Scholar] [CrossRef]
- Buytoz, S.; Dagdelen, F.; Islak, S.; Kok, M.; Kir, D.; Ercan, E. Effect of the TiC content on microstructure and thermal properties of Cu–TiC composites prepared by powder metallurgy. J. Therm. Anal. Calorim. 2014, 117, 1277–1283. [Google Scholar] [CrossRef]
- Zhang, J.; Zhou, Y.C. Microstructure, mechanical, and electrical properties of Cu–Ti3AlC2 and in situ Cu–TiCx composites. J. Mater. Res. 2008, 23, 924–932. [Google Scholar] [CrossRef]
- M, K.; G, A. Investigation of Electrical and Mechanical Properties of Cu Matrix TiC Reinforced Composites. Sch. J. Eng. Tech. 2018, 6, 58–63. [Google Scholar] [CrossRef]
- Long, B.D.; Othman, R.; Zuhailawati, H.; Umemoto, M. Comparison of Two Powder Processing Techniques on the Properties of Cu-NbC Composites. Adv. Mater. Sci. Eng. 2014, 2014, 160580. [Google Scholar] [CrossRef] [Green Version]
Figure 1.
Scanning electron microcopy (SEM) images of starting powders of (a) copper and (b) TiH2.

Figure 2.
SEM images of as-milled composite powders (a) ex-situ Cu-TiC with 1 vol. % TiC; (b) ex-situ Cu-TiC with 3 vol. % TiC; (c) ex-situ Cu-TiC with 5 vol. % TiC and (d) in-situ Cu-TiH2-C with 5 vol. % TiC; The rectangles mark the areas from which energy-dispersive spectroscopy (EDS) spectra were taken.

Figure 3.
X-ray diffraction (XRD) pattern of as-milled powders (a) Cu-TiH2-C with 5 vol. % TiC and (b) Cu-TiC with 5 vol. % TiC.
Figure 3.
X-ray diffraction (XRD) pattern of as-milled powders (a) Cu-TiH2-C with 5 vol. % TiC and (b) Cu-TiC with 5 vol. % TiC.

Figure 4.
Ex-situ nanocomposite Cu-TiC (5 vol. % TiC) sintered at 700 °C (a) polished surface; and (b) fractured surface; in-situ nanocomposite Cu-TiH2-C (5 vol. % TiC) sintered at 950 °C; (c) polished surface and (d) fractured surface.
Figure 4.
Ex-situ nanocomposite Cu-TiC (5 vol. % TiC) sintered at 700 °C (a) polished surface; and (b) fractured surface; in-situ nanocomposite Cu-TiH2-C (5 vol. % TiC) sintered at 950 °C; (c) polished surface and (d) fractured surface.

Figure 5.
Properties of Cu-TiC composite samples sintered at 600 °C with different vol. % TiC: (a) relative density of the composites and (b) electrical conductivity versus microhardness.
Figure 5.
Properties of Cu-TiC composite samples sintered at 600 °C with different vol. % TiC: (a) relative density of the composites and (b) electrical conductivity versus microhardness.

Figure 6.
Transmission electron microscopy (TEM) images of (a) bright-field image ex-situ composite 5 vol. % TiC sintered at 700 °C (inset: selected area electron diffraction (SAED) corresponding to a TiC phase); (b) bright-field image of Cu-TiH2-C composite sintered at 950 °C (inset: SAED corresponding to a TiC phase; (c,e) HR-TEM images of ex-situ Cu-TiC composite and (d,f) HR-TEM images of in-situ Cu-TiH2-C composite.


Table 1.
EDS analysis of the as-milled composite powders.
| Composite | Concentration, wt. % | ||||
|---|---|---|---|---|---|
| Cu | Ti | C | Fe | O | |
| Cu-TiC (1 vol. % TiC) | 94.56 | 0.71 | 0.74 | 0.60 | 3.39 |
| Cu-TiC (3 vol. % TiC) | 91.50 | 2.31 | 1.13 | 0.70 | 4.36 |
| Cu-TiC (5 vol. % TiC) | 89.41 | 3.53 | 4.89 | 0.81 | 4.27 |
| Cu-TiH2-C (5 vol. % TiC) | 88.88 | 3.32 | 5.63 | 0.73 | 1.44 |
Table 2.
Relative density of nanocomposites sintered at different temperatures.
| Composition | Relative Density (%) | ||
|---|---|---|---|
| 600 °C | 700 °C | 950 °C | |
| Cu-TiC (1 vol. %TiC) | 97.1 | 96.4 | - |
| Cu-TiC (3 vol. %TiC) | 96.2 | 95.2 | - |
| Cu-TiC (5 vol. % TiC) | 95.4 | 96.5 | - |
| Cu-TiH2-C (5 vol. % TiC) | 94.2 | 95.0 | 97.2 |
Table 3.
Hardness values of composites sintered at different temperatures.
| Composition | Hardness, HV | ||
|---|---|---|---|
| 600 °C | 700 °C | 950 °C | |
| Cu-TiC (1 vol. %TiC) | 161.4 | 145 | - |
| Cu-TiC (3 vol. %TiC) | 171.2 | 168.5 | - |
| Cu-TiC (5 vol. % TiC) | 178.5 | 181.6 | - |
| Cu-TiH2-C (5 vol. % TiC) | 175.8 | 178.2 | 206.5 |
Table 4.
Electrical conductivity value of composites sintered at different temperatures.
| Composition | Electrical Conductivity (%IACS) | ||
|---|---|---|---|
| 600 °C | 700 °C | 950 °C | |
| Cu-TiC (1 vol. %TiC) | 52.1 | - | - |
| Cu-TiC (3 vol. %TiC) | 49.5 | - | - |
| Cu-TiC (5 vol. %TiC) | 47.6 | 51 | - |
| Cu-TiH2-C (5 vol. % TiC) | 45.5 | 47.2 | 54.8 |
© 2020 by the authors. Licensee MDPI, Basel, Switzerland. This article is an open access article distributed under the terms and conditions of the Creative Commons Attribution (CC BY) license (http://creativecommons.org/licenses/by/4.0/).
Share and Cite
MDPI and ACS Style
Viet, N.H.; Oanh, N.T.H. Microstructure and Electrical Property of Ex-Situ and In-Situ Copper Titanium Carbide Nanocomposites. Metals 2020, 10, 735. https://doi.org/10.3390/met10060735
AMA Style
Viet NH, Oanh NTH. Microstructure and Electrical Property of Ex-Situ and In-Situ Copper Titanium Carbide Nanocomposites. Metals. 2020; 10(6):735. https://doi.org/10.3390/met10060735
Chicago/Turabian StyleViet, Nguyen Hoang, and Nguyen Thi Hoang Oanh. 2020. "Microstructure and Electrical Property of Ex-Situ and In-Situ Copper Titanium Carbide Nanocomposites" Metals 10, no. 6: 735. https://doi.org/10.3390/met10060735
Note that from the first issue of 2016, this journal uses article numbers instead of page numbers. See further details here.