

Removal of the Basic and Diazo Dyes from Aqueous Solution by the Frustules of Halamphora cf. salinicola (Bacillariophyta)
 , , , , , , , ,
Abstract
:1. Introduction
2. Results
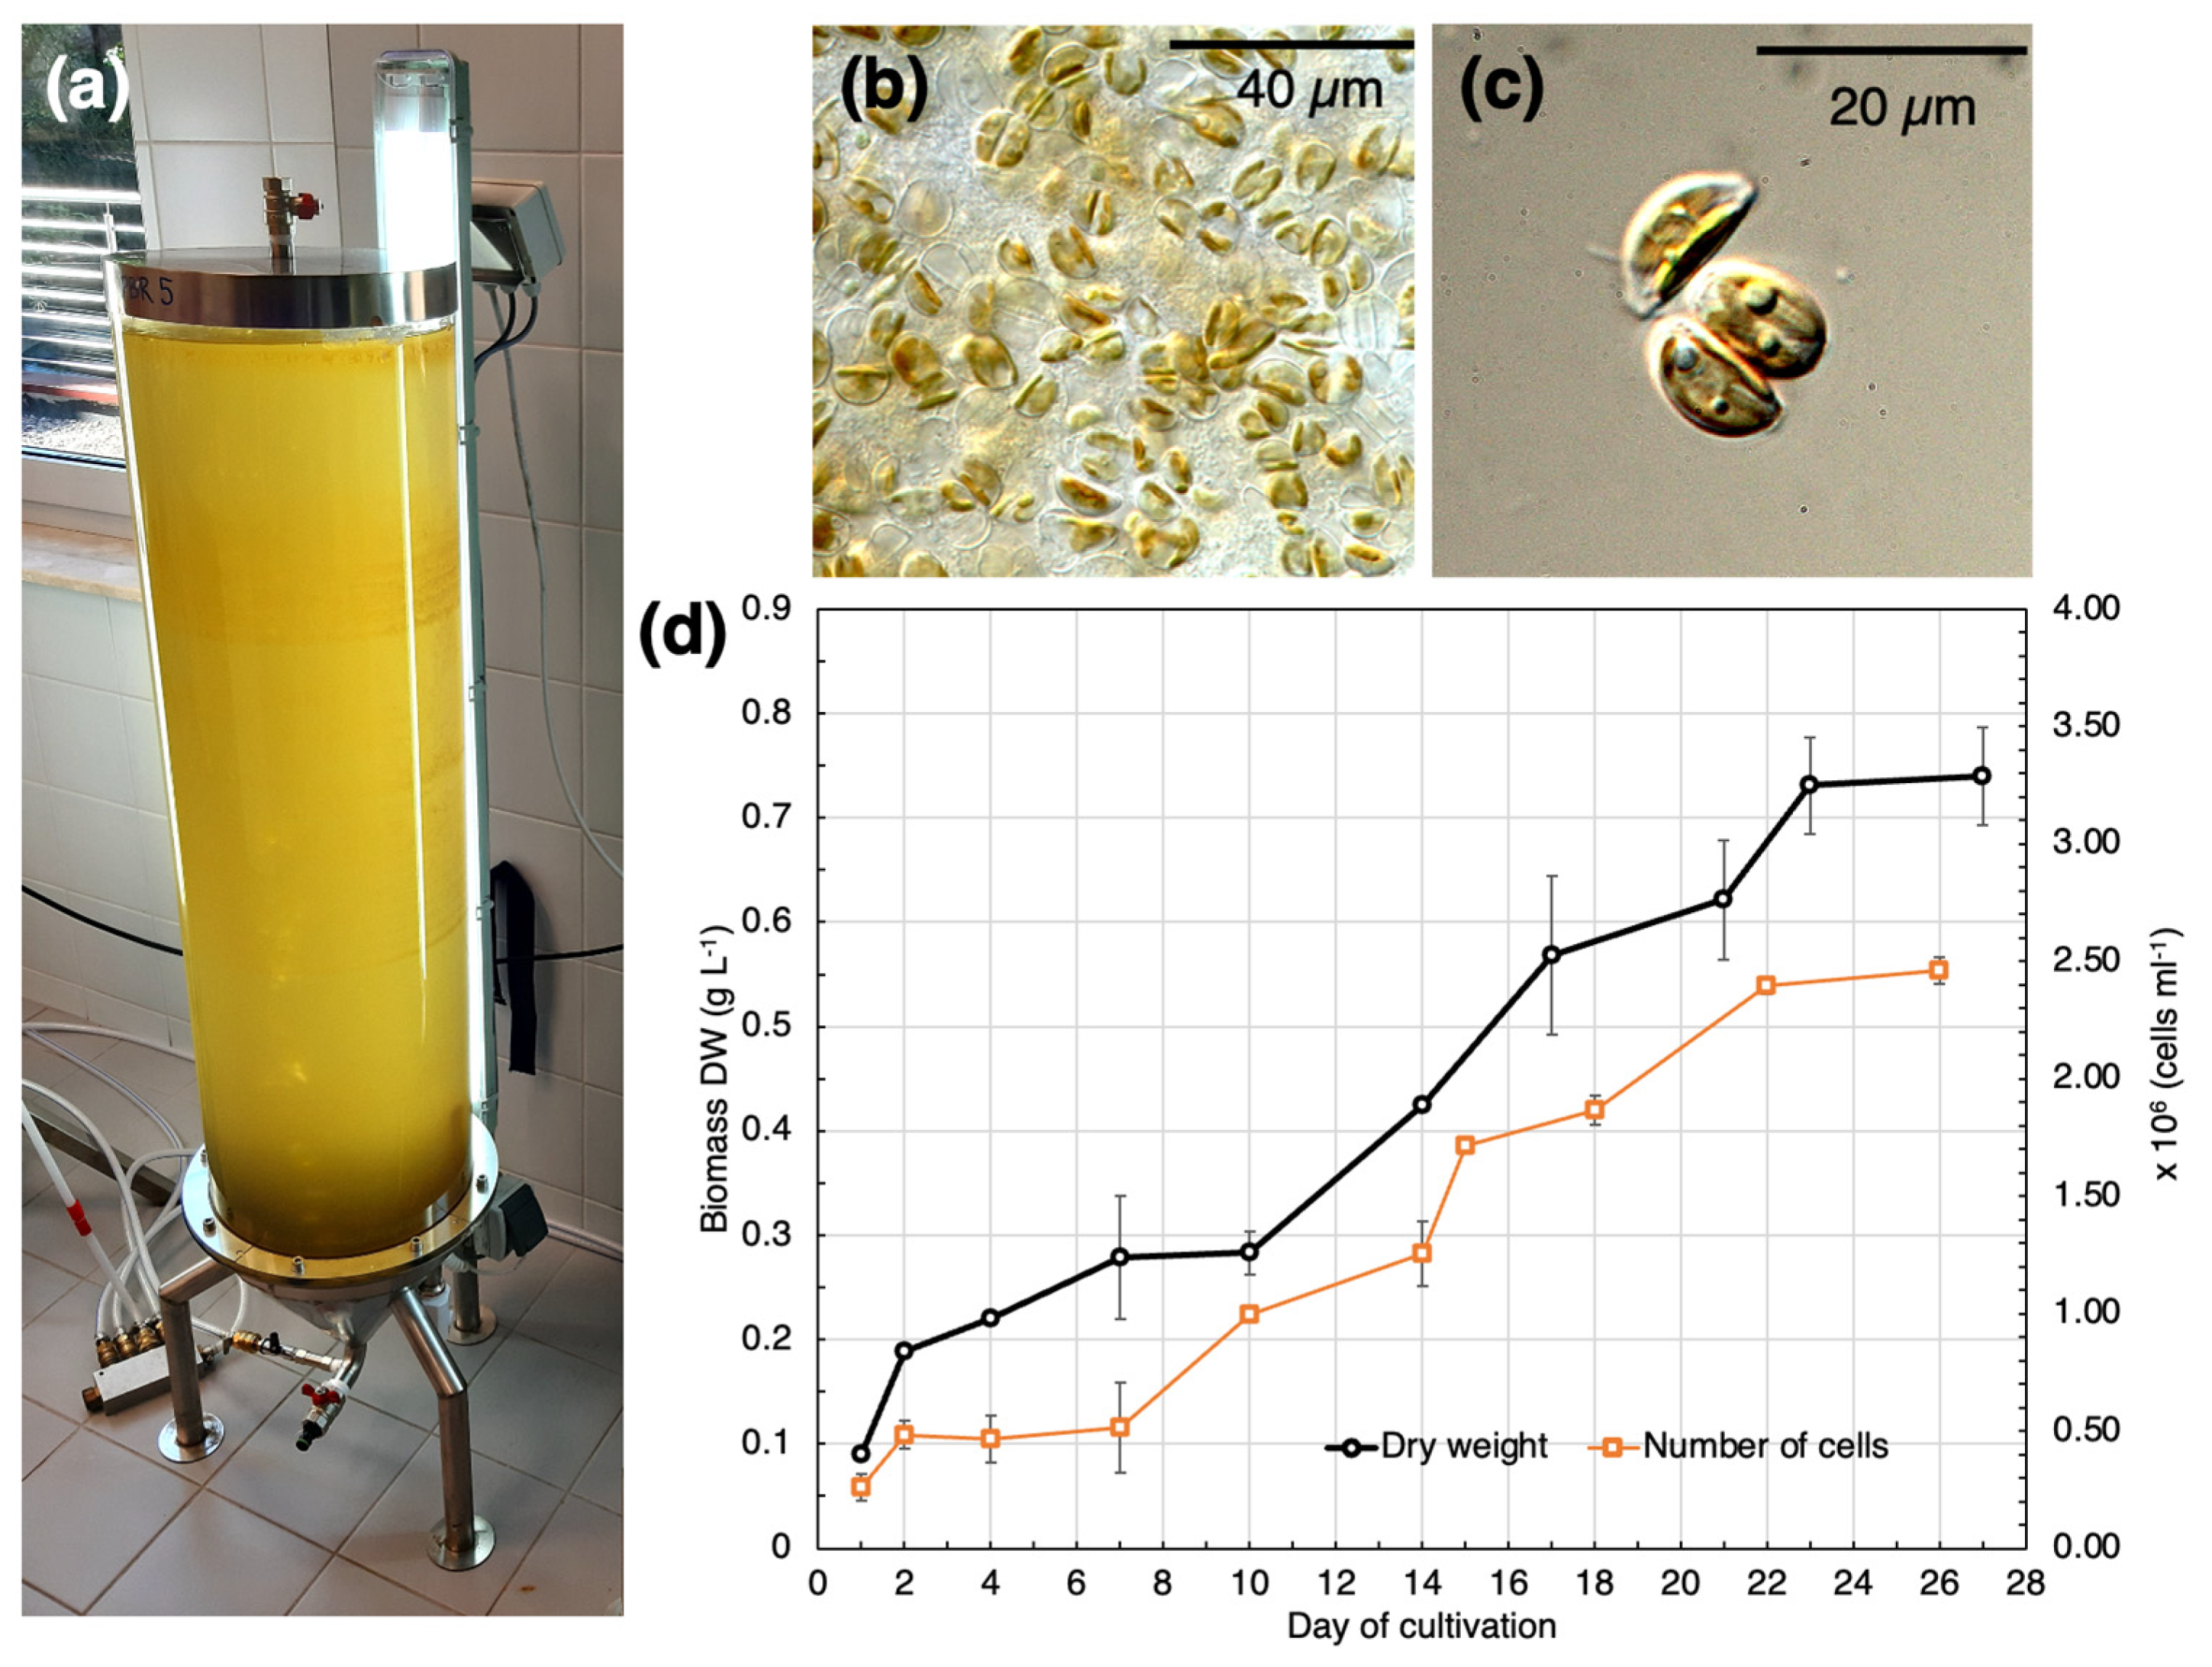
2.1. Batch Cultivation of SZCZM1454 H. cf. salinicola
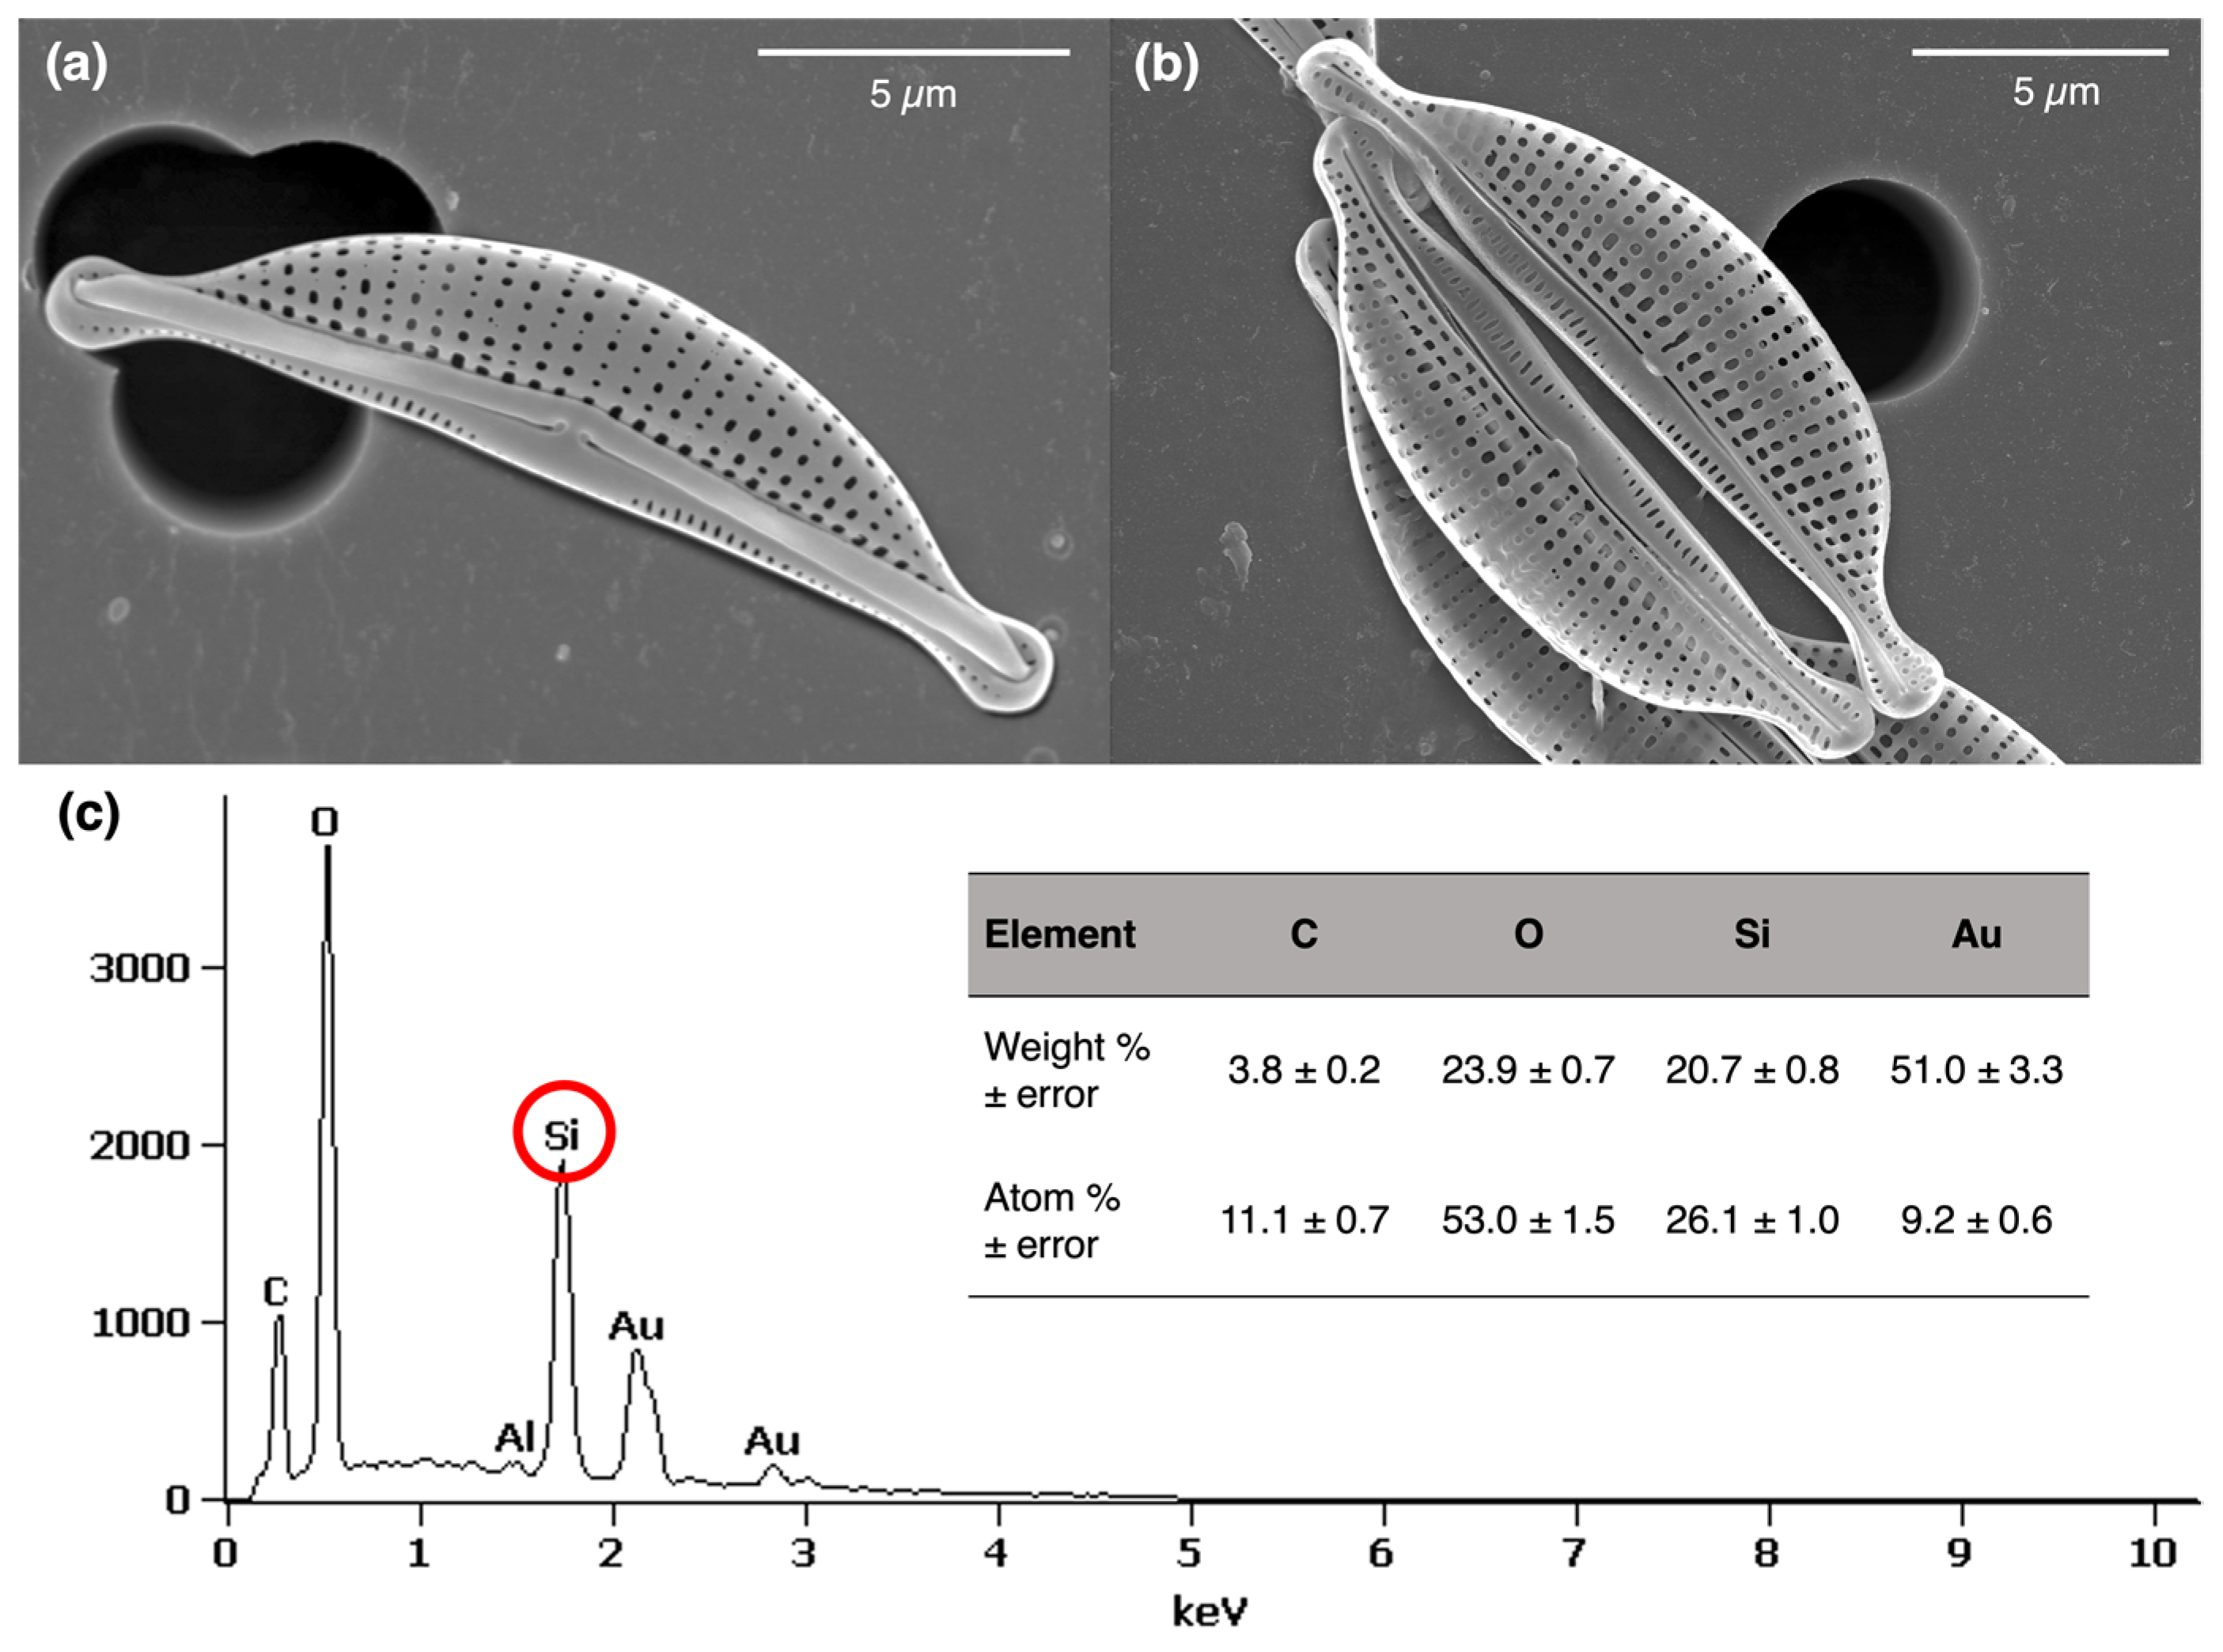
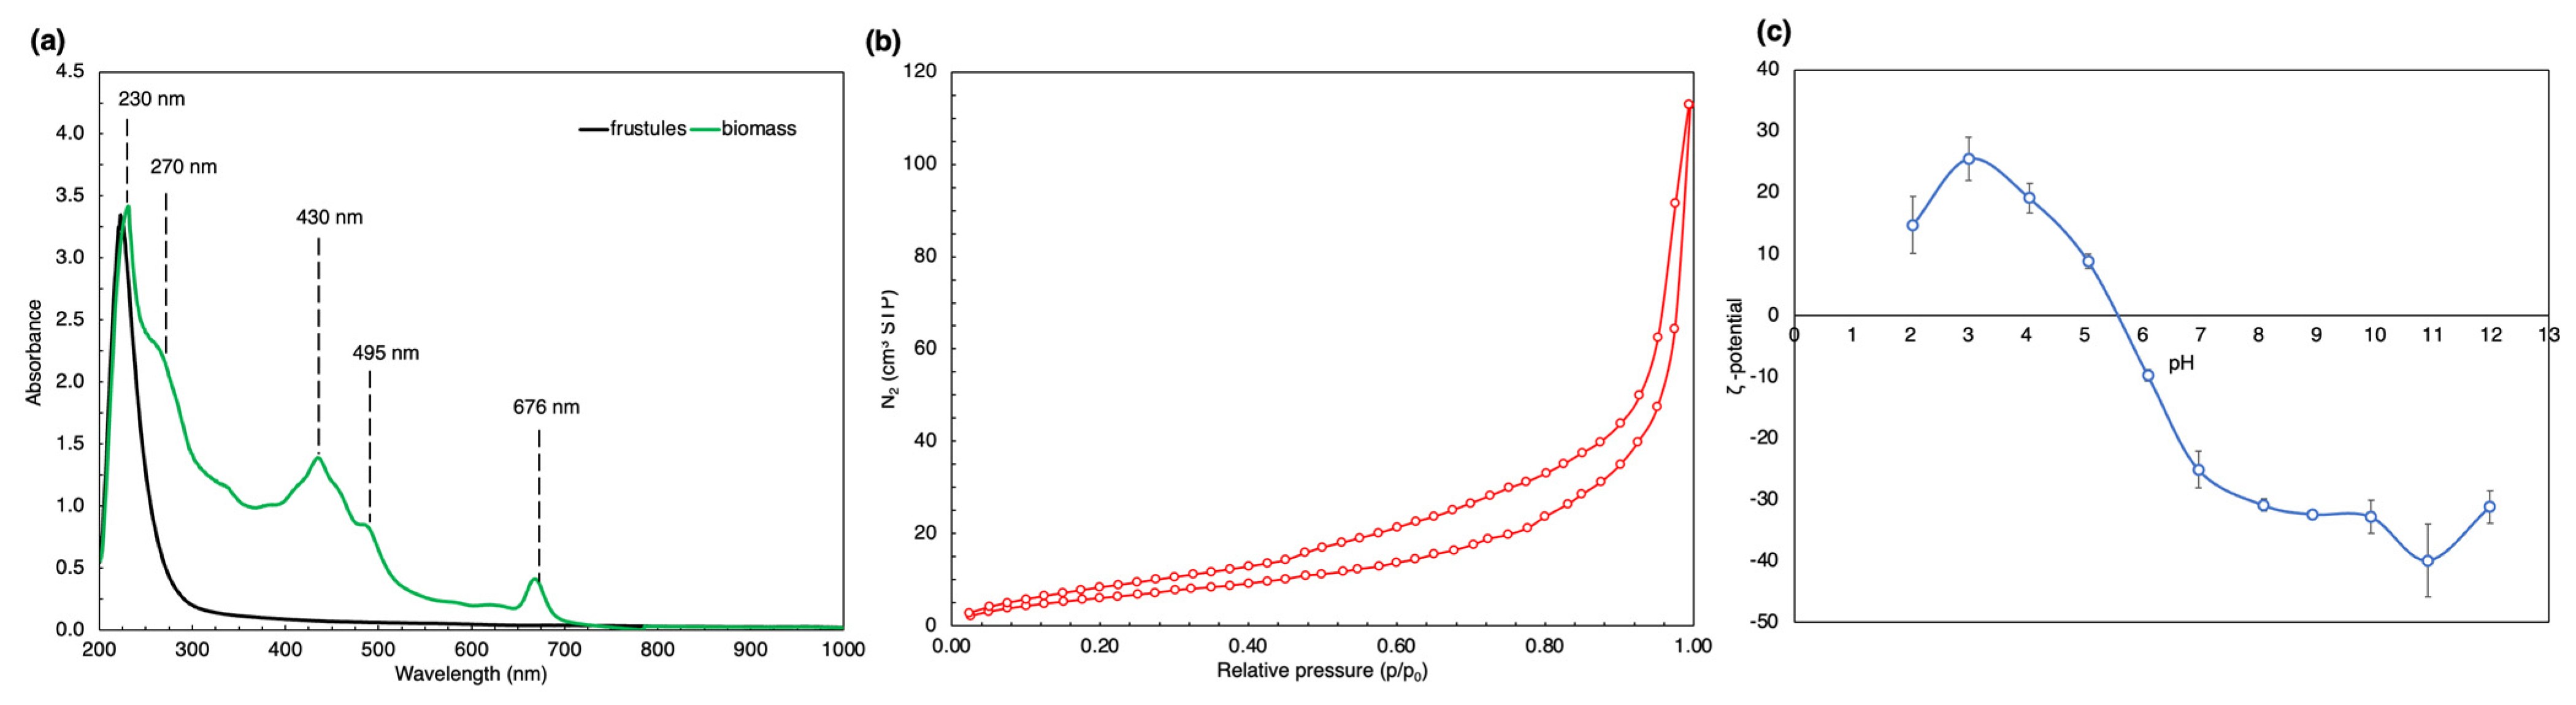
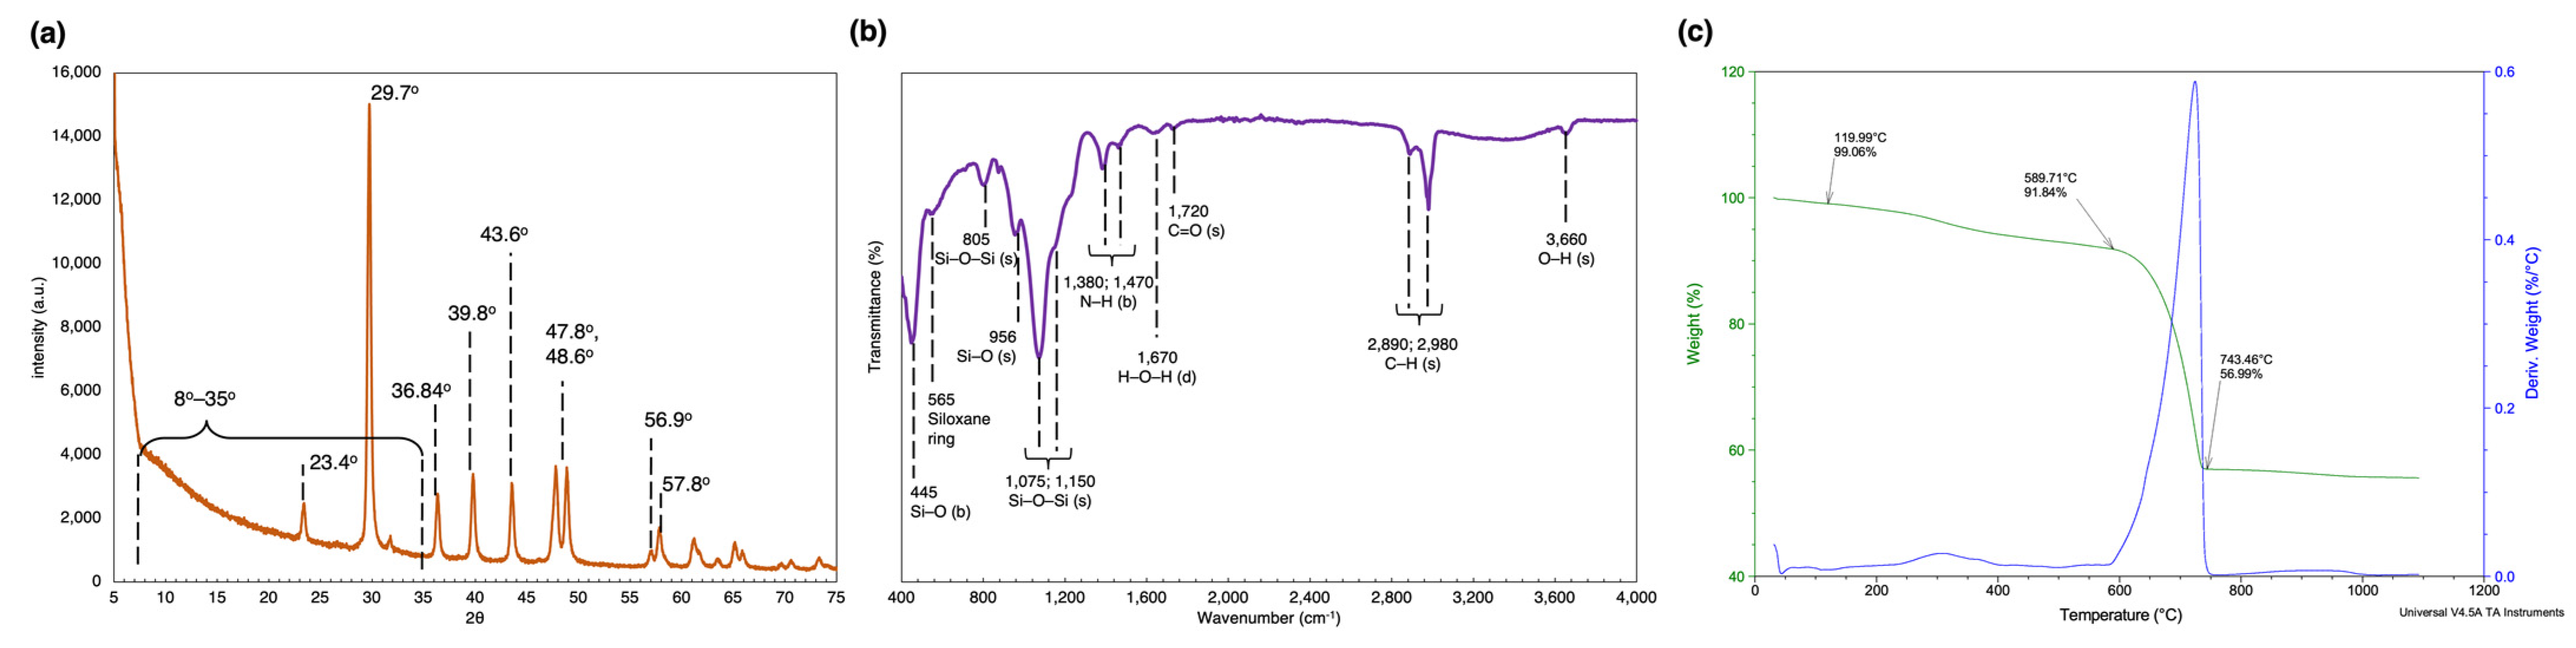
2.2. Characterization of the Frustule Surface
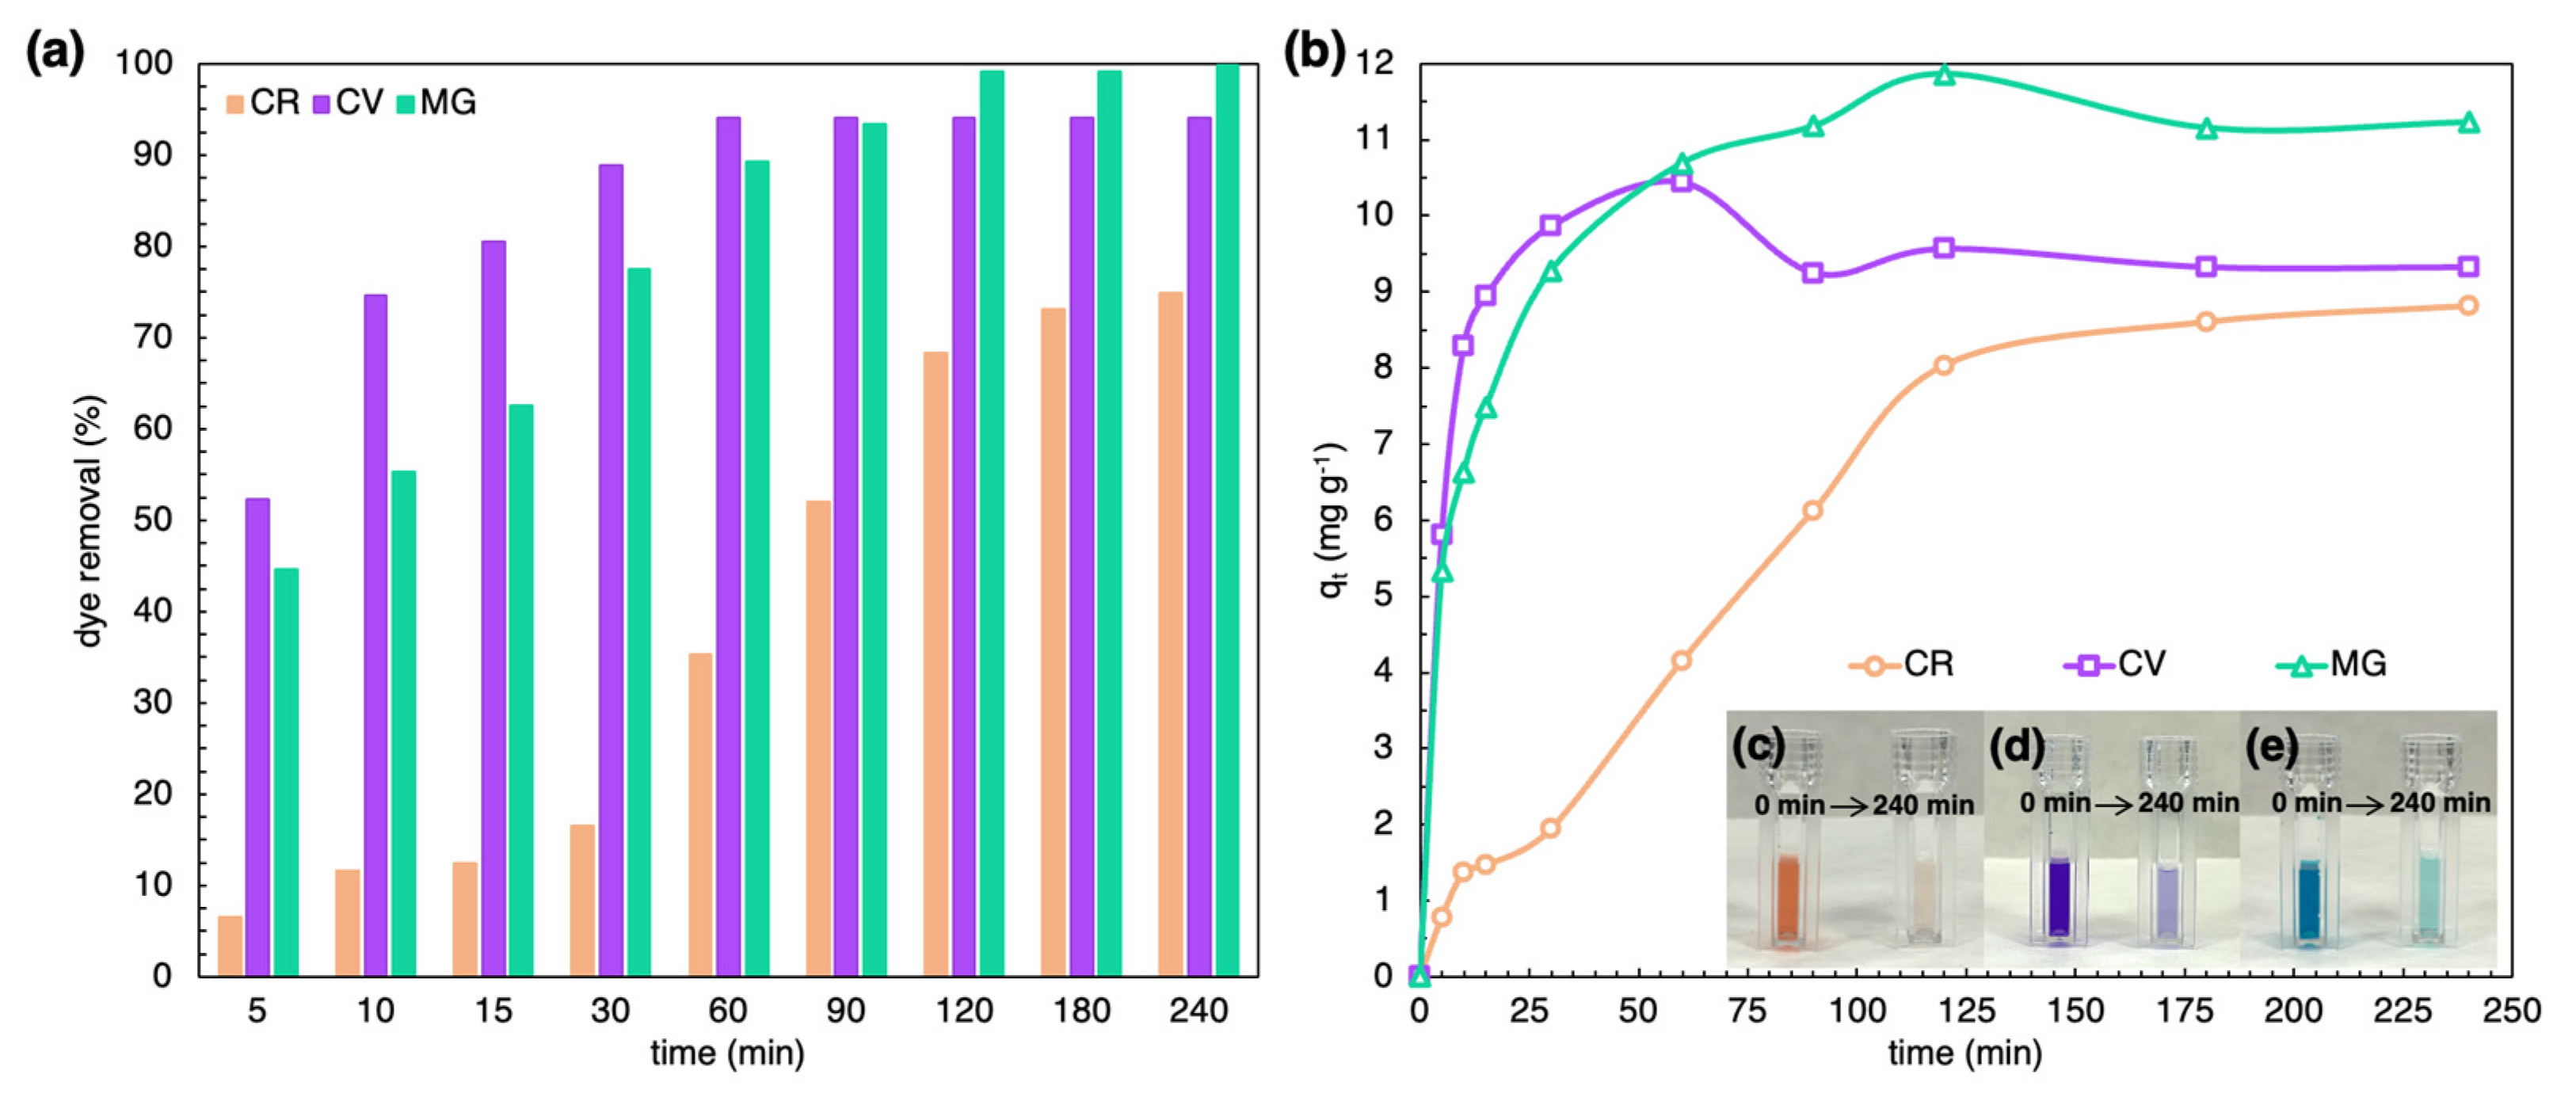
2.3. Batch Adsorption Study
3. Discussion
4. Materials and Methods
4.1. Chemicals
4.2. Batch Cultivation
4.3. Characterization of the Frustules Surface
4.4. Batch Adsorption Experiments
4.5. Data Analysis
5. Conclusions
Supplementary Materials
Author Contributions
Funding
Institutional Review Board Statement
Data Availability Statement
Acknowledgments
Conflicts of Interest
References
- Armbrust, E.V. The life of diatoms in the world’s oceans. Nature 2009, 459, 185–192. [Google Scholar] [CrossRef] [PubMed]
- Bowler, C.; Vardi, A.; Allen, A.E. Oceanographic and biogeochemical insights from diatom genomes. Ann. Rev. Mar. Sci. 2010, 2, 333–365. [Google Scholar] [CrossRef] [PubMed]
- Wang, J.K.; Seibert, M. Prospects for commercial production of diatoms. Biotechnol. Biofuels 2017, 10, 16. [Google Scholar] [CrossRef] [PubMed]
- Navarro, F.E.; Damiani, M.C.; Leonardi, P.I.; Popovich, C.A. Temperature and Salinity Effect on Tolerance and Lipid Accumulation in Halamphora coffeaeformis: An Approach for Outdoor Bioenergy Cultures. Bioenerg. Res. 2022, 15, 1545–1554. [Google Scholar] [CrossRef]
- Stepanek, J.G.; Fields, F.J.; Kociolek, J.P. A comparison of lipid content metrics using six species from the genus Halamphora (Bacillariophyta). Biofuels 2016, 7, 521–528. [Google Scholar] [CrossRef]
- Martin, L.A.; Popovich, C.A.; Martinez, A.M.; Damiani, M.C.; Leonardi, P.I. Oil assessment of Halamphora coffeaeformis diatom growing in a hybrid two-stage system for biodiesel production. Renew. Energy 2016, 92, 127–135. [Google Scholar] [CrossRef]
- Martín, L.A.; Popovich, C.A.; Martínez, A.M.; Bilbao, P.G.S.; Damiani, M.C.; Leonardi, P.I. Hybrid two-stage culture of Halamphora coffeaeformis for biodiesel production: Growth phases, nutritional stages and biorefinery approach. Renew. Energy 2018, 118, 984–992. [Google Scholar] [CrossRef]
- Scodelaro Bilbao, P.G.; Martín, L.A.; Popovich, C.A.; Almeyda, M.D.; Chamorro, V.; Leonardi, P.I. Assessment of Halamphora coffeaeformis growth and biochemical composition for aquaculture purposes. J. Mar. Sci. Eng. 2020, 8, 282. [Google Scholar] [CrossRef]
- Bouzidi, N.; Zili, F.; García-Maroto, F.; Alonso, D.L.; Ouada, H.B. Impact of temperature and growth phases on lipid composition and fatty acid profile of a thermophilic Bacillariophyta strain related to the genus Halamphora from north-eastern Tunisia. J. Mar. Biol. Assoc. UK 2020, 100, 529–536. [Google Scholar] [CrossRef]
- Marzec, M.; Dąbek, P.; Witkowski, A.; Monedeiro, F.; Pomastowski, P.; Buszewski, B.; Nowak, I. Lipid constituents of diatoms (Halamphora) as components for production of lipid nanoparticles. Pharmaceutics 2022, 14, 1171. [Google Scholar] [CrossRef]
- Yang, R.; Wei, D.; Xie, J. Diatoms as cell factories for high-value products: Chrysolaminarin, eicosapentaenoic acid, and fucoxanthin. Crit. Rev. Biotechnol. 2020, 40, 93–1009. [Google Scholar] [CrossRef] [PubMed]
- Popovich, C.A.; Faraoni, M.B.; Sequeira, A.; Daglio, Y.; Martín, L.A.; Martínez, A.M.; Damiani, M.C.; Matulewicz, M.C.; Leonardi, P.I. Potential of the marine diatom Halamphora coffeaeformis to simultaneously produce omega-3 fatty acids, chrysolaminarin and fucoxanthin in a raceway pond. Algal Res. 2020, 51, 102030. [Google Scholar] [CrossRef]
- Bose, R.; Roychoudhury, P.; Pal, R. In-situ green synthesis of fluorescent silica–silver conjugate nanodendrites using nanoporous frustules of diatoms: An unprecedented approach. Bioprocess Biosyst. Eng. 2021, 44, 1263–1273. [Google Scholar] [CrossRef] [PubMed]
- Roychoudhury, P.; Dąbek, P.; Gloc, M.; Golubeva, A.; Dobrucka, R.; Kurzydłowski, K.; Witkowski, A. Reducing efficiency of fucoxanthin in diatom mediated biofabrication of gold nanoparticles. Materials 2021, 14, 4094. [Google Scholar] [CrossRef] [PubMed]
- Roychoudhury, P.; Golubeva, A.; Dąbek, P.; Gloc, M.; Dobrucka, R.; Kurzydłowski, K.; Witkowski, A. Diatom Mediated Production of Fluorescent Flower Shaped Silver-Silica Nanohybrid. Materials 2021, 14, 7284. [Google Scholar] [CrossRef]
- Sasirekha, R.; Sheena, T.S.; Deepika, M.S.; Santhanam, P.; Townley, H.E.; Jeganathan, K.; Kumar, S.D.; Premkumar, K. Surface engineered Amphora subtropica frustules using chitosan as a drug delivery platform for anticancer therapy. Mater. Sci. Eng. C 2019, 94, 56–64. [Google Scholar] [CrossRef]
- Javalkote, V.S.; Pandey, A.P.; Puranik, P.R.; Deshmukh, P.K. Magnetically responsive siliceous frustules for efficient chemotherapy. Mater. Sci. Eng. C 2015, 50, 107–116. [Google Scholar] [CrossRef]
- Selvaraj, V.; Muthukumar, A.; Nagamony, P.; Chinnuswamy, V. Detection of typhoid fever by diatom-based optical biosensor. Environ. Sci. Pollut. Res. 2018, 25, 20385–20390. [Google Scholar] [CrossRef]
- Squire, K.; Kong, X.; LeDuff, P.; Rorrer, G.L.; Wang, A.X. Photonic crystal enhanced fluorescence immunoassay on diatom biosilica. J. Biophotonics 2018, 11, e201800009. [Google Scholar] [CrossRef]
- Kong, X.; Squire, K.; Li, E.; LeDuff, P.; Rorrer, G.L.; Tang, S.; Chen, B.; McKay, C.P.; Navarro-Gonzalez, R.; Wang, A.X. Chemical and biological sensing using diatom photonic crystal biosilica with in-situ growth plasmonic nanoparticles. IEEE Trans. Nanobiosci. 2016, 15, 828–834. [Google Scholar] [CrossRef]
- Kamińska, A.; Sprynskyy, M.; Winkler, K.; Szymborski, T. Ultrasensitive SERS immunoassay based on diatom biosilica for detection of interleukins in blood plasma. Anal. Bioanal. Chem. 2017, 409, 6337–6347. [Google Scholar] [CrossRef] [PubMed]
- Marella, T.K.; Saxena, A.; Tiwari, A. Diatom mediated heavy metal remediation: A review. Bioresour. Technol. 2020, 305, 123068. [Google Scholar] [CrossRef]
- Roychoudhury, P.; Bose, R.; Dąbek, P.; Witkowski, A. Photonic Nano-/Microstructured Diatom Based Biosilica in Metal Modification and Removal—A Review. Materials 2022, 15, 6597. [Google Scholar] [CrossRef]
- Mu, W.; Jia, K.; Liu, Y.; Pan, X.; Fan, Y. Response of the freshwater diatom Halamphora veneta (Kützing) Levkov to copper and mercury and its potential for bioassessment of heavy metal toxicity in aquatic habitats. Environ. Sci. Pollut. Res. 2017, 24, 26375–26386. [Google Scholar] [CrossRef]
- O’Neill, C.; Hawkes, F.R.; Hawkes, D.L.; Lourenço, N.D.; Pinheiro, H.M.; Delée, W. Colour in textile effluents–sources, measurement, discharge consents and simulation: A review. J. Chem. Technol. Biotechnol. 1999, 74, 1009–1018. [Google Scholar] [CrossRef]
- Sarkar, A.K.; Pal, A.; Ghorai, S.; Mandre, N.R.; Pal, S. Efficient removal of malachite green dye using biodegradable graft copolymer derived from amylopectin and poly(acrylic acid). Carbohydr. Polym. 2014, 111, 108–115. [Google Scholar] [CrossRef]
- Husain, Q. Potential applications of the oxidoreductive enzymes in the decolorization and detoxification of textile and other synthetic dyes from polluted water: A review. Crit. Rev. Biotechnol. 2006, 26, 201–221. [Google Scholar] [CrossRef]
- Zeng, L.X.; Chen, Y.F.; Zhang, Q.Y.; Kang, Y.; Luo, J.W. Adsorption of Congo red by cross-linked chitosan resins. Desalination Water Treat. 2014, 52, 7733–7742. [Google Scholar] [CrossRef]
- Lachheb, H.; Puzenat, E.; Houas, A.; Ksibi, M.; Elaloui, E.; Guillard, C.; Herrmann, J.M. Photocatalytic degradation of various types of dyes (Alizarin S, Crocein Orange G, Methyl Red, Congo Red, Methylene Blue) in water by UV-irradiated titania. Appl. Catal. B Environ. 2002, 39, 75–90. [Google Scholar] [CrossRef]
- Ameen, S.; Akhtar, M.S.; Nazim, M.; Shin, H.S. Rapid photocatalytic degradation of crystal violet dye over ZnO flower nanomaterials. Mater. Lett. 2013, 96, 228–232. [Google Scholar] [CrossRef]
- Yang, J.; Chen, C.; Ji, H.; Ma, W.; Zhao, J. Mechanism of TiO2-assisted photocatalytic degradation of dyes under visible irradiation: Photoelectrocatalytic study by TiO2-film electrodes. J. Phys. Chem. B 2005, 109, 21900–21907. [Google Scholar] [CrossRef] [PubMed]
- Gopinath, K.P.; Muthukumar, K.; Velan, M. Sonochemical degradation of Congo red: Optimization through response surface methodology. Chem. Eng. J. 2010, 157, 427–433. [Google Scholar] [CrossRef]
- Guzman-Duque, F.; Pétrier, C.; Pulgarin, C.; Peñuela, G.; Torres-Palma, R.A. Effects of sonochemical parameters and inorganic ions during the sonochemical degradation of crystal violet in water. Ultrason. Sonochem. 2011, 18, 440–446. [Google Scholar] [CrossRef] [PubMed]
- Berberidou, C.; Poulios, I.; Xekoukoulotakis, N.P.; Mantzavinos, D. Sonolytic, photocatalytic and sonophotocatalytic degradation of malachite green in aqueous solutions. Appl. Catal. B Environ. 2007, 74, 63–72. [Google Scholar] [CrossRef]
- Gharbani, P.; Tabatabaii, S.M.; Mehrizad, A. Removal of Congo red from textile wastewater by ozonation. Int. J. Environ. Sci. Technol. 2008, 5, 495–500. [Google Scholar] [CrossRef]
- Wu, J.; Gao, H.; Yao, S.; Chen, L.; Gao, Y.; Zhang, H. Degradation of crystal violet by catalytic ozonation using Fe/activated carbon catalyst. Sep. Purif. Technol. 2015, 147, 179–185. [Google Scholar] [CrossRef]
- Zhou, X.J.; Guo, W.Q.; Yang, S.S.; Zheng, H.S.; Ren, N.Q. Ultrasonic-assisted ozone oxidation process of triphenylmethane dye degradation: Evidence for the promotion effects of ultrasonic on malachite green decolorization and degradation mechanism. Bioresour. Technol. 2013, 128, 827–830. [Google Scholar] [CrossRef]
- Venkatesh, S.; Pandey, N.D.; Quaff, A.R. Decolorization of synthetic dye solution containing Congo red by advanced oxidation process (AOP). Int. J. Adv. Res. Civ. Struct. Environ. Infrastruct. Eng. Dev. 2014, 2, 49–55. [Google Scholar]
- Jana, S.; Purkait, M.K.; Mohanty, K. Removal of crystal violet by advanced oxidation and microfiltration. Appl. Clay Sci. 2010, 50, 337–341. [Google Scholar] [CrossRef]
- Modirshahla, N.; Behnajady, M.A. Photooxidative degradation of malachite green (MG) by UV/H2O2: Influence of operational parameters and kinetic modeling. Dyes Pigm. 2006, 70, 54–59. [Google Scholar] [CrossRef]
- Lahkimi, A.; Oturan, M.A.; Oturan, N.; Chaouch, M. Removal of textile dyes from water by the electro-Fenton process. Environ. Chem. Lett. 2006, 5, 35–39. [Google Scholar] [CrossRef]
- Fan, H.J.; Huang, S.T.; Chung, W.H.; Jan, J.L.; Lin, W.Y.; Chen, C.C. Degradation pathways of crystal violet by Fenton and Fenton-like systems: Condition optimization and intermediate separation and identification. J. Hazard. Mater. 2009, 171, 1032–1044. [Google Scholar] [CrossRef] [PubMed]
- Chen, F.; Ma, W.; He, J.; Zhao, J. Fenton degradation of malachite green catalyzed by aromatic additives. J. Phys. Chem. A 2002, 106, 9485–9490. [Google Scholar] [CrossRef]
- Neoh, C.H.; Lam, C.Y.; Lim, C.K.; Yahya, A.; Bay, H.H.; Ibrahim, Z.; Noor, Z.Z. Biodecolorization of recalcitrant dye as the sole source of nutrition using Curvularia clavata NZ2 and decolorization ability of its crude enzymes. Environ. Sci. Pollut. Res. Int. 2015, 22, 11669–11678. [Google Scholar] [CrossRef] [PubMed]
- Bumpus, J.A.; Brock, B.J. 1988. Biodegradation of crystal violet by the white rot fungus Phanerochaete chrysosporium. Appl. Environ. Microbiol. 1988, 54, 1143–1150. [Google Scholar] [CrossRef]
- An, S.Y.; Min, S.K.; Cha, I.H.; Choi, Y.L.; Cho, Y.S.; Kim, C.H.; Lee, Y.C. Decolorization of triphenylmethane and azo dyes by Citrobacter sp. Biotechnol. Lett. 2002, 24, 1037–1040. [Google Scholar] [CrossRef]
- Raval, N.P.; Shah, P.U.; Shah, N.K. Malachite green “a cationic dye” and its removal from aqueous solution by adsorption. Appl. Water Sci. 2017, 7, 3407–3445. [Google Scholar] [CrossRef]
- Kannan, N.; Meenakshisundaram, M. Adsorption of Congo Red on various activated carbons. A comparative study. Water Air Soil Pollut. 2002, 138, 289–305. [Google Scholar] [CrossRef]
- Abbas, M.; Harrache, Z.; Trari, M. Removal of gentian violet in aqueous solution by activated carbon equilibrium, kinetics, and thermodynamic study. Adsorp. Sci. Technol. 2019, 37, 566–589. [Google Scholar] [CrossRef]
- Qu, W.; Yuan, T.; Yin, G.; Xu, S.; Zhang, Q.; Su, H. Effect of properties of activated carbon on malachite green adsorption. Fuel 2019, 249, 45–53. [Google Scholar] [CrossRef]
- Liu, J.; Wang, N.; Zhang, H.; Baeyens, J. Adsorption of Congo red dye on FexCo3−xO4 nanoparticles. J. Environ. Manag. 2019, 238, 473–483. [Google Scholar] [CrossRef] [PubMed]
- Samrot, A.V.; Ali, H.H.; Selvarani, J.; Faradjeva, E.; Raji, P.; Prakash, P. Adsorption efficiency of chemically synthesized Superparamagnetic Iron Oxide Nanoparticles (SPIONs) on crystal violet dye. Curr. Res. Green Sustain. Chem. 2021, 4, 100066. [Google Scholar] [CrossRef]
- Dehbi, A.; Dehmani, Y.; Omari, H.; Lammini, A.; Elazhari, K.; Abdallaoui, A. Hematite iron oxide nanoparticles (α-Fe2O3): Synthesis and modelling adsorption of malachite green. J. Environ. Chem. Eng. 2020, 8, 103394. [Google Scholar] [CrossRef]
- Kamil, A.M.; Mohammed, H.T.; Alkaim, A.F.; Hussein, F.H. Adsorption of Congo red on multiwall carbon nanotubes: Effect of operational parameters. J. Chem. Pharm. Sci. 2016, 9, 1128–1133. [Google Scholar]
- Sabna, V.; Thampi, S.G.; Chandrakaran, S. Adsorption of crystal violet onto functionalised multi-walled carbon nanotubes: Equilibrium and kinetic studies. Ecotoxicol. Environ. Saf. 2016, 134, 390–397. [Google Scholar] [CrossRef]
- Kiani, G.; Dostali, M.; Rostami, A.; Khataee, A.R. Adsorption studies on the removal of Malachite Green from aqueous solutions onto halloysite nanotubes. Appl. Clay Sci. 2011, 54, 34–39. [Google Scholar] [CrossRef]
- Nautiyal, P.; Subramanian, K.A.; Dastidar, M.G. Adsorptive removal of dye using biochar derived from residual algae after in-situ transesterification: Alternate use of waste of biodiesel industry. J. Environ. Manag. 2016, 182, 187–197. [Google Scholar] [CrossRef]
- Mittal, A.; Mittal, J.; Malviya, A.; Kaur, D.; Gupta, V.K. Adsorption of hazardous dye crystal violet from wastewater by waste materials. J. Colloid Interface Sci. 2010, 343, 463–473. [Google Scholar] [CrossRef]
- Ahmad, R.; Kumar, R. Adsorption studies of hazardous malachite green onto treated ginger waste. J. Environ. Manag. 2010, 91, 1032–1038. [Google Scholar] [CrossRef]
- Vimonses, V.; Lei, S.; Jin, B.; Chow, C.W.; Saint, C. Adsorption of congo red by three Australian kaolins. Appl. Clay Sci. 2009, 43, 465–472. [Google Scholar] [CrossRef]
- Nandi, B.K.; Goswami, A.; Das, A.K.; Mondal, B.; Purkait, M.K. Kinetic and equilibrium studies on the adsorption of crystal violet dye using kaolin as an adsorbent. Sep. Sci. Technol. 2008, 43, 1382–1403. [Google Scholar] [CrossRef]
- Caponi, N.; Collazzo, G.C.; Jahn, S.L.; Dotto, G.L.; Mazutti, M.A.; Foletto, E.L. Use of Brazilian kaolin as a potential low-cost adsorbent for the removal of malachite green from colored effluents. Mater. Res. 2017, 20, 14–22. [Google Scholar] [CrossRef]
- Nodehi, R.; Shayesteh, H.; Kelishami, A.R. Enhanced adsorption of congo red using cationic surfactant functionalized zeolite particles. Microchem. J. 2020, 153, 104281. [Google Scholar] [CrossRef]
- Bautista, M.M.C.; Arrieta, B.M.C.; Colpas, J.E.J.; Aldana, L.C.M.; Ríos, J.S.V.; Ortega, G.C.C. Evaluation of diatomaceous earth in the removal of crystal violet dye in solution. J. Appl. Res. Technol. 2022, 20, 387–398. [Google Scholar] [CrossRef]
- Tian, L.; Zhang, J.; Shi, H.; Li, N.; Ping, Q. Adsorption of malachite green by diatomite: Equilibrium isotherms and kinetic studies. J. Dispers. Sci. Technol. 2016, 37, 1059–1066. [Google Scholar] [CrossRef]
- Khamis Soliman, N.; Moustafa, A.F.; Aboud, A.A.; Halim, K.S.A. Effective utilization of Moringa seeds waste as a new green environmental adsorbent for removal of industrial toxic dyes. J. Mater. Res. Technol. 2019, 8, 1798–1808. [Google Scholar] [CrossRef]
- Ashour, M.; Alprol, A.E.; Khedawy, M.; Abualnaja, K.M.; Mansour, A.T. Equilibrium and Kinetic Modeling of Crystal Violet Dye Adsorption by a Marine Diatom, Skeletonema costatum. Materials 2022, 15, 6375. [Google Scholar] [CrossRef]
- Giri, B.S.; Sonwani, R.K.; Varjani, S.; Chaurasia, D.; Varadavenkatesan, T.; Chaturvedi, P.; Yadav, S.; Katiyar, V.; Singh, R.S.; Pandey, A. Highly efficient bio-adsorption of Malachite green using Chinese Fan-Palm Biochar (Livistona chinensis). Chemosphere 2022, 287, 132282. [Google Scholar] [CrossRef]
- Van Eynde, E.; Lenaerts, B.; Tytgat, T.; Verbruggen, S.W.; Hauchecorne, B.; Blust, R.; Lenaerts, S. Effect of pretreatment and temperature on the properties of Pinnularia biosilica frustules. RSC Adv. 2014, 4, 56200–56206. [Google Scholar] [CrossRef]
- Gholami, P.; Khataee, A.; Bhatnagar, A. Environmentally superior cleaning of diatom frustules using sono-Fenton process: Facile fabrication of nanoporous silica with homogeneous morphology and controlled size. Ultrason. Sonochem. 2020, 64, 105044. [Google Scholar] [CrossRef]
- Chu, W.L.; Phang, S.M.; Goh, S.H. Environmental effects on growth and biochemical composition of Nitzschia inconspicua Grunow. J. Appl. Phycol. 1996, 8, 389–396. [Google Scholar] [CrossRef]
- Jiang, Y.; Laverty, K.S.; Brown, J.; Brown, L.; Chagoya, J.; Burow, M.; Quigg, A. Effect of silicate limitation on growth, cell composition, and lipid production of three native diatoms to Southwest Texas desert. J. Appl. Phycol. 2015, 27, 1433–1442. [Google Scholar] [CrossRef]
- Daglio, Y.; Maidana, N.I.; Matulewicz, M.C.; Rodríguez, M.C. Changes in motility and induction of enzymatic activity by nitrogen and phosphate deficiency in benthic Halamphora luciae (Bacillariophyceae) from Argentina. Phycologia 2016, 55, 493–505. [Google Scholar] [CrossRef]
- Jauffrais, T.; Agogué, H.; Gemin, M.P.; Beaugeard, L.; Martin-Jézéquel, V. Effect of bacteria on growth and biochemical composition of two benthic diatoms Halamphora coffeaeformis and Entomoneis paludosa. J. Exp. Mar. Biol. Ecol. 2017, 495, 65–74. [Google Scholar] [CrossRef]
- Dahmen-Ben Moussa, I.; Boukhriss, S.; Athmouni, K.; Ayadi, H. Secondary metabolites production combined with lead bioremediation by Halamphora sp. marine diatom microalgae and their physiological response. Int. J. Aquac. Fish. Sci. 2022, 8, 25–36. [Google Scholar] [CrossRef]
- Avşar, Ö.; Avşar, U.; Arslan, Ş.; Kurtuluş, B.; Niedermann, S.; Güleç, N. Subaqueous hot springs in Köyceğiz Lake, Dalyan Channel and Fethiye-Göcek Bay (SW Turkey): Locations, chemistry and origins. J. Volcanol. Geotherm. Res. 2017, 345, 81–97. [Google Scholar] [CrossRef]
- Thommes, M.; Kaneko, K.; Neimark, A.V.; Olivier, J.P.; Rodriguez-Reinoso, F.; Rouquerol, J.; Sing, K.S. Physisorption of gases, with special reference to the evaluation of surface area and pore size distribution (IUPAC Technical Report). Pure Appl. Chem. 2015, 87, 1051–1069. [Google Scholar] [CrossRef]
- Shiraishi, S. Electric double layer capacitors. In Carbon Alloys; Yasuda, E.I., Inagaki, M., Kaneko, K., Endo, M., Tanabe, Y., Eds.; Elsevier Science: Amsterdam, The Netherlands, 2003; pp. 447–457. [Google Scholar] [CrossRef]
- Sprynskyy, M.; Szczyglewska, P.; Wojtczak, I.; Nowak, I.; Witkowski, A.; Buszewski, B.; Feliczak-Guzik, A. Diatom biosilica doped with palladium (II) chloride nanoparticles as new efficient photocatalysts for methyl orange degradation. Int. J. Mol. Sci. 2021, 22, 6734. [Google Scholar] [CrossRef]
- Vrieling, E.G.; Sun, Q.; Tian, M.; Kooyman, P.J.; Gieskes, W.W.C.; van Santen, R.A.; Sommerdijk, N.A.J.K. Salinity-dependent diatom biosilicification implies an important role of external ionic strength. Proc. Natl. Acad. Sci. USA 2007, 104, 10441–10446. [Google Scholar] [CrossRef]
- Luo, Y.; Li, S.; Shen, K.; Song, Y.; Zhang, J.; Su, W.; Yang, X. Study on the Hemostasis Characteristics of Biomaterial Frustules Obtained from Diatom Navicula australoshetlandica sp. Materials 2021, 14, 3752. [Google Scholar] [CrossRef]
- Dalagan, E.G.; Enriquez, E.P. Interaction of diatom silica with graphene. Philipp. Sci. Lett. 2013, 6, 119–127. [Google Scholar]
- Verma, J.; Bhattacharya, A. Analysis on synthesis of silica nanoparticles and its effect on growth of T. Harzianum & Rhizoctonia species. Biomed. J. Sci. Technol. Res. 2018, 10, 7890–7897. [Google Scholar] [CrossRef]
- Prasetyanto, E.A.; Sujandi, S.; Lee, S.C.; Park, S.E. Highly dispersed CuO nanoparticles on SBA-16 type mesoporous silica with cyclam SBA-16 as a precursor. Bull. Korean Chem. Soc. 2007, 28, 2359–2362. [Google Scholar] [CrossRef]
- Roychoudhury, P.; Golubeva, A.; Dąbek, P.; Pryshchepa, O.; Sagandykova, G.; Pomastowski, P.; Gloc, M.; Dobrucka, R.; Kurzydłowski, K.; Buszewski, B.; et al. Study on Biogenic Spindle-Shaped Iron-Oxide Nanoparticles by Pseudostaurosira trainorii in Field of Laser Desorption/Ionization Applications. Int. J. Mol. Sci. 2022, 23, 11713. [Google Scholar] [CrossRef] [PubMed]
- Jeffrey, S.W.; Humphrey, G.F. New spectrophotometric equations for determining chlorophylls a, b, c1 and c2 in higher plants, algae and natural phytoplankton. Biochem. Physiol. Pflanz. 1975, 167, 191–194. [Google Scholar] [CrossRef]
- Trabelsi, L.; M’sakni, N.H.; Ben Ouada, H.; Bacha, H.; Roudesli, S. Partial characterization of extracellular polysaccharides produced by cyanobacterium Arthrospira platensis. Biotechnol. Bioprocess Eng. 2009, 14, 27–31. [Google Scholar] [CrossRef]
- Jones, J.T.; Segnit, E.R. The nature of opal I. Nomenclature and constituent phases. J. Geol. Soc. Aust. 1971, 18, 57–68. [Google Scholar] [CrossRef]
- Tesson, B.; Hildebrand, M. Extensive and intimate association of the cytoskeleton with forming silica in diatoms: Control over patterning on the meso-and micro-scale. PLoS ONE 2010, 5, e14300. [Google Scholar] [CrossRef]
- Zhang, X.; Wu, Y.; He, S.; Yang, D. Structural characterization of sol–gel composites using TEOS/MEMO as precursors. Surf. Coat. Techol. 2007, 201, 6051–6058. [Google Scholar] [CrossRef]
- Kiraz, N.; Kesmez, Ö.; Burunkaya, E.; Budama, L.; Acar, B.; Asiltürk, M.; Camurlu, H.E.; Arpaç, E. Antibacterial glass films prepared on metal surfaces by sol–gel method. J. Sol-Gel. Sci. Tehcnol. 2010, 56, 227–235. [Google Scholar] [CrossRef]
- Camargo, E.; Jaime, P.C.J.; Lin, C.F.; Lin, M.S.; Yu, T.Y.; Wu, M.C.; Lai, S.Y.; Wang, M.Y. Chemical and optical characterization of Psammodictyon panduriforme (Gregory) Mann comb. nov. (Bacillariophyta) frustules. Opt. Mater. Express 2016, 6, 1436–1443. [Google Scholar] [CrossRef]
- Karmakar, B.; De, G.; Ganguli, D. Dense silica microspheres from organic and inorganic acid hydrolysis of TEOS. J. NonCryst. Solids 2000, 272, 119–126. [Google Scholar] [CrossRef]
- Li, K.M.; Jiang, J.G.; Tian, S.C.; Chen, X.J.; Yan, F. Influence of silica types on synthesis and performance of amine—Silica hybrid materials used for CO2 capture. J. Phys. Chem. C 2014, 118, 2454–2462. [Google Scholar] [CrossRef]
- Otzen, D. The role of proteins in biosilicification. Scientifica 2012, 2012, 867562. [Google Scholar] [CrossRef]
- Nowak, A.P.; Sprynskyy, M.; Wojtczak, I.; Trzciński, K.; Wysocka, J.; Szkoda, M.; Buszewski, B.; Lisowska-Oleksiak, A. Diatoms Biomass as a Joint Source of Biosilica and Carbon for Lithium-Ion Battery Anodes. Materials 2020, 13, 1673. [Google Scholar] [CrossRef]
- Wan, X.; Liu, D.; Ye, Y.; Luo, J. Preparation of Highly Dispersed CaCO3 Nanoparticles in a Novel Membrane Dispersion Microreactor by a Chemical Coprecipitation Process. Ind. Eng. Chem. Res. 2022, 61, 7842–7851. [Google Scholar] [CrossRef]
- Chen, W.-H.; Chu, Y.-S.; Liu, J.-L.; Chang, J.-S. Thermal Degradation of Carbohydrates, Proteins and Lipids in Microalgae Analyzed by Evolutionary Computation. Energy Convers. Manag. 2018, 160, 209–219. [Google Scholar] [CrossRef]
- Choi, S.-B.; Kim, N.-W.; Lee, D.-K.; Yu, H. Growth Mechanism of Cubic MgO Granule via Common Ion Effect. J. Nanosci. Nanotechnol. 2013, 13, 7577–7580. [Google Scholar] [CrossRef]
- Dong, B.; Xu, Y.; Lin, S.; Dai, X. Characterizing and Exploring the Formation Mechanism of Salt Deposition by Reusing Advanced-Softened, Silica-Rich, Oilfield-Produced Water (ASOW) in Superheated Steam Pipeline. Sci. Rep. 2015, 5, 17274. [Google Scholar] [CrossRef]
- Pryshchepa, O.; Pomastowski, P.; Buszewski, B. Silver Nanoparticles: Synthesis, Investigation Techniques, and Properties. Adv. Colloid. Interface Sci. 2020, 284, 102246. [Google Scholar] [CrossRef]
- Gumustas, M.; Sengel-Turk, C.T.; Gumustas, A.; Ozkan, S.A.; Uslu, B. Effect of Polymer-Based Nanoparticles on the Assay of Antimicrobial Drug Delivery Systems. In Multifunctional Systems for Combined Delivery, Biosensing and Diagnostics; Elsevier: Amsterdam, The Netherlands, 2017; pp. 67–108. [Google Scholar]
- Xu, P.; Wang, H.; Tong, R.; Du, Q.; Zhong, W. Preparation and Morphology of SiO2/PMMA Nanohybrids by Microemulsion Polymerization. Colloid. Polym. Sci. 2006, 284, 755–762. [Google Scholar] [CrossRef]
- Abou-El-Souod, G.; Hamouda, R.A.; El-Sheekh, M. Influence of heavy metal as co-contamination on biodegradation of dyes by free and immobilized Scenedesmus obliquus. Desalin. Water Treat. 2020, 182, 351–358. [Google Scholar] [CrossRef]
- Fawzy, M.A.; Gomaa, M. Low-cost biosorption of methylene blue and Congo red from single and binary systems using Sargassum latifolium biorefinery waste/wastepaper xerogel: An optimization and modeling study. J. Appl. Phycol. 2020, 33, 675–691. [Google Scholar] [CrossRef]
- Wu, K.; Pan, X.; Zhang, J.; Zhang, X.; Salah Zene, A.; Tian, Y. Biosorption of Congo red from aqueous solutions based on self-immobilized mycelial pellets: Kinetics, isotherms, and thermodynamic studies. ACS Omega 2020, 5, 24601–24612. [Google Scholar] [CrossRef] [PubMed]
- Sriram, G.; Uthappa, U.T.; Losic, D.; Kigga, M.; Jung, H.Y.; Kurkuri, M.D. Mg–Al-layered double hydroxide (LDH) modified diatoms for highly efficient removal of Congo red from aqueous solution. Appl. Sci. 2020, 10, 2285. [Google Scholar] [CrossRef]
- Hernández-Zamora, M.; Cristiani-Urbina, E.; Martínez-Jerónimo, F.; Perales-Vela, H.V.; Ponce-Noyola, T.; Montes-Horcasitas, M.C.; Cañizares-Villanueva, O. Bioremoval of the azo dye Congo Red by the microalga Chlorella vulgaris. Environ. Sci. Pollut. Res. 2015, 22, 10811–10823. [Google Scholar] [CrossRef]
- Vijayakumar, G.; Dharmendirakumar, M.; Renganathan, S.; Sivanesan, S.; Baskar, G.; Elango, K.P. Removal of Congo red from aqueous solutions by perlite. CLEAN Soil Air Water 2009, 37, 355–364. [Google Scholar] [CrossRef]
- Guler, U.A.; Ersan, M.; Tuncel, E.; Dügenci, F. Mono and simultaneous removal of crystal violet and safranin dyes from aqueous solutions by HDTMA-modified Spirulina sp. Process Saf. Environ. Prot. 2016, 99, 194–206. [Google Scholar] [CrossRef]
- Wang, X.S.; Liu, X.; Wen, L.; Zhou, Y.; Jiang, Y.; Li, Z. Comparison of basic dye crystal violet removal from aqueous solution by low-cost biosorbents. Sep. Sci. Technol. 2008, 43, 3712–3731. [Google Scholar] [CrossRef]
- Essekri, A.; Aarab, N.; Hsini, A.; Ajmal, Z.; Laabd, M.; El Ouardi, M.; Ait Addi, A.; Lakhmiri, R.; Albourine, A. Enhanced adsorptive removal of crystal violet dye from aqueous media using citric acid modified red-seaweed: Experimental study combined with RSM process optimization. J. Dispers. Sci. Technol. 2022, 43, 1359–1372. [Google Scholar] [CrossRef]
- Sarabadan, M.; Bashiri, H.; Mousavi, S.M. Removal of crystal violet dye by an efficient and low cost adsorbent: Modeling, kinetic, equilibrium and thermodynamic studies. Korean J. Chem. Eng. 2019, 36, 1575–1586. [Google Scholar] [CrossRef]
- Ali, H.; Muhammad, S.K. Biosorption of crystal violet from water on leaf biomass of Calotropis procera. J. Environ. Sci. Technol. 2008, 1, 143–150. [Google Scholar] [CrossRef]
- Bertolini, T.C.; Izidoro, J.C.; Magdalena, C.P.; Fungaro, D.A. Adsorption of crystal violet dye from aqueous solution onto zeolites from coal fly and bottom ashes. Orbital Electron. J. Chem. 2013, 5, 179–191. [Google Scholar]
- Yang, H.; Zhou, D.; Chang, Z.; Zhang, L. Adsorption of crystal violet onto amino silica: Optimization, equilibrium, and kinetic studies. Desalination Water Treat. 2014, 52, 6113–6121. [Google Scholar] [CrossRef]
- Malik, R.; Ramteke, D.S.; Wate, S.R. Adsorption of malachite green on groundnut shell waste based powdered activated carbon. Waste Manag. 2007, 27, 1129–1138. [Google Scholar] [CrossRef]
- Sriram, G.; Uthappa, U.T.; Kigga, M.; Jung, H.Y.; Altalhi, T.; Brahmkhatri, V.; Kurkuri, M.D. Xerogel activated diatoms as an effective hybrid adsorbent for the efficient removal of malachite green. New J. Chem. 2019, 43, 3810–3820. [Google Scholar] [CrossRef]
- Khan, T.A.; Ali, I.; Singh, V.V.; Sharma, S. Utilization of fly ash as low-cost adsorbent for the removal of methylene blue, malachite green and rhodamine B dyes from textile wastewater. J. Environ. Prot. Sci. 2009, 3, 11–22. [Google Scholar]
- Arumugam, T.K.; Krishnamoorthy, P.; Rajagopalan, N.R.; Nanthini, S.; Vasudevan, D. Removal of malachite green from aqueous solutions using a modified chitosan composite. Int. J. Biol. Macromol. 2019, 128, 655–664. [Google Scholar] [CrossRef]
- Kumar, K.V.; Sivanesan, S. Pseudo second order kinetics and pseudo isotherms for malachite green onto activated carbon: Comparison of linear and non-linear regression methods. J. Hazard. Mater. 2006, 136, 721–726. [Google Scholar] [CrossRef]
- Kumar, K.V.; Sivanesan, S.; Ramamurthi, V. Adsorption of malachite green onto Pithophora sp., a fresh water algae: Equilibrium and kinetic modelling. Process Biochem. 2005, 40, 2865–2872. [Google Scholar] [CrossRef]
- Kannan, R.R.; Rajasimman, M.; Rajamohan, N.; Sivaprakash, B. Brown marine algae Turbinaria conoides as biosorbent for Malachite green removal: Equilibrium and kinetic modeling. Front. Environ. Sci. Eng. China 2010, 4, 116–122. [Google Scholar] [CrossRef]
- Wang, S.; Ariyanto, E. Competitive adsorption of malachite green and Pb ions on natural zeolite. J. Colloid Interface Sci. 2007, 314, 25–31. [Google Scholar] [CrossRef] [PubMed]
- Kannan, C.; Sundaram, T.; Palvannan, T. Environmentally stable adsorbent of tetrahedral silica and non-tetrahedral alumina for removal and recovery of malachite green dye from aqueous solution. J. Hazard. Mater. 2008, 157, 137–145. [Google Scholar] [CrossRef]
- Manzoor, K.; Batool, M.; Naz, F.; Nazar, M.F.; Hameed, B.H.; Zafar, M.N. A comprehensive review on application of plant-based bioadsorbents for Congo red removal. Biomass Convers. Biorefin. 2022. [Google Scholar] [CrossRef]
- Hameed, B.H.; El-Khaiary, M.I. Malachite green adsorption by rattan sawdust: Isotherm, kinetic and mechanism modeling. J. Hazard. Mater. 2008, 159, 574–579. [Google Scholar] [CrossRef] [PubMed]
- Giles, C.H.; Smith, D.; Huitson, A. A general treatment and classification of the solute adsorption isotherm. I. Theoretical. J. Colloid Interface Sci. 1974, 47, 755–765. [Google Scholar] [CrossRef]
- Kalam, S.; Abu-Khamsin, S.A.; Kamal, M.S.; Patil, S. Surfactant adsorption isotherms: A review. ACS Omega 2021, 6, 32342–32348. [Google Scholar] [CrossRef]
- Lu, Z.; Maroto-Valer, M.M.; Schobert, H.H. Catalytic effects of inorganic compounds on the development of surface areas of fly ash carbon during steam activation. Fuel Process. Tehcnol. 2010, 89, 3436–3441. [Google Scholar] [CrossRef]
- Guillard, R.R. Culture of phytoplankton for feeding marine invertebrates. In Culture of Marine Invertebrate Animals; Smith, W.L., Chanley, M.H., Eds.; Springer: Boston, MA, USA, 1975; pp. 29–60. [Google Scholar] [CrossRef]
- Kirchman, D.L. Calculating microbial growth rates from data on production and standing stocks. Mar. Ecol. Prog. Ser. 2002, 233, 303–306. [Google Scholar] [CrossRef]
- Lagergren, S. Zur theorie der sogenannten adsorption geloster stoffe. Kungliga Svenska Vetenskapsakademiens. Handlingar 1898, 24, 1–39. [Google Scholar]
- Blanchard, G.; Maunaye, M.; Martin, G. Removal of heavy metals from waters by means of natural zeolites. Water Res. 1984, 18, 1501–1507. [Google Scholar] [CrossRef]
- Boyd, G.E.; Adamson, A.W.; Myers Jr, L.S. The exchange adsorption of ions from aqueous solutions by organic zeolites. II. Kinetics. J. Am. Chem. Soc. 1947, 69, 2836–2848. [Google Scholar] [CrossRef]
- Weber Jr, W.J.; Morris, J.C. Kinetics of adsorption on carbon from solution. J. Sanit. Eng. Div. 1963, 89, 31–59. [Google Scholar] [CrossRef]
- Bangham, A.D.; Standish, M.M.; Watkins, J.C. Diffusion of univalent ions across the lamellae of swollen phospholipids. J. Mol. Biol. 1965, 13, 238–252. [Google Scholar] [CrossRef]
- Langmuir, I. The adsorption of gases on plane surfaces of glass, mica and platinum. J. Am. Chem. Soc. 1918, 40, 1361–1403. [Google Scholar] [CrossRef]
- Freundlich, H.M.F. Over the adsorption in solution. J. Phys. Chem. 1906, 57, 385–471. [Google Scholar]
- Temkin, M.J.; Pyzhev, V. Recent modifications to Langmuir isotherms. Acta Physochim URSS 1940, 12, 217–225. [Google Scholar]
- Sips, R. On the structure of a catalyst surface. J. Phys. Chem. 1948, 16, 490–495. [Google Scholar] [CrossRef]


| Nitrate, mM | Phosphate, mM | ||||||||
| 0.88 | 4.41 | 8.82 | 13.23 | 17.64 | 0.04 | 0.18 | 0.36 | 0.54 | 0.72 |
| 0.610 ± 0.0206 | 0.556 ± 0.0295 | 0.627 ± 0.0300 | 0.670 ± 0.0899 | 0.641 ± 0.0457 | 0.646 ± 0.0321 | 0.631 ± 0.0226 | 0.604 ± 0.0707 | 0.701 ± 0.0074 | 0.704 ± 0.0530 |
| Silicate, mM | Temperature, °C | ||||||||
| 0.11 | 0.53 | 1.06 | 1.59 | 2.12 | 15 | 20 | 30 | ||
| 0.501 ± 0.0045 | 0.644 ± 0.0274 | 0.646 ± 0.0442 | 0.825 ± 0.0093 | 0.964 ± 0.0471 | 0.431 ± 0.0015 | 0.480 ± 0.00402 | 0.700 ± 0.0346 | ||
| Light, µmol s−1 m−2 | Salinity, ppt | ||||||||
| 10 | 50 | 100 | 150 | 15 | 20 | 35 | 45 | ||
| 0.342 ± 0.0619 | 0.712 ± 0.0527 | 0.547 ± 0.0511 | 0.641 ± 0.0436 | 0.388 ± 0.0779 | 0.355 ± 0.1576 | 0.603 ± 0.0751 | 0.969 ± 0.0228 | ||
| Specific Surface Area (m2 g−1) | Pore Volume (cm3 g−1) | Pore Diameter Distribution (nm) |
|---|---|---|
| 26.922 | 0.175 | 3–35 |
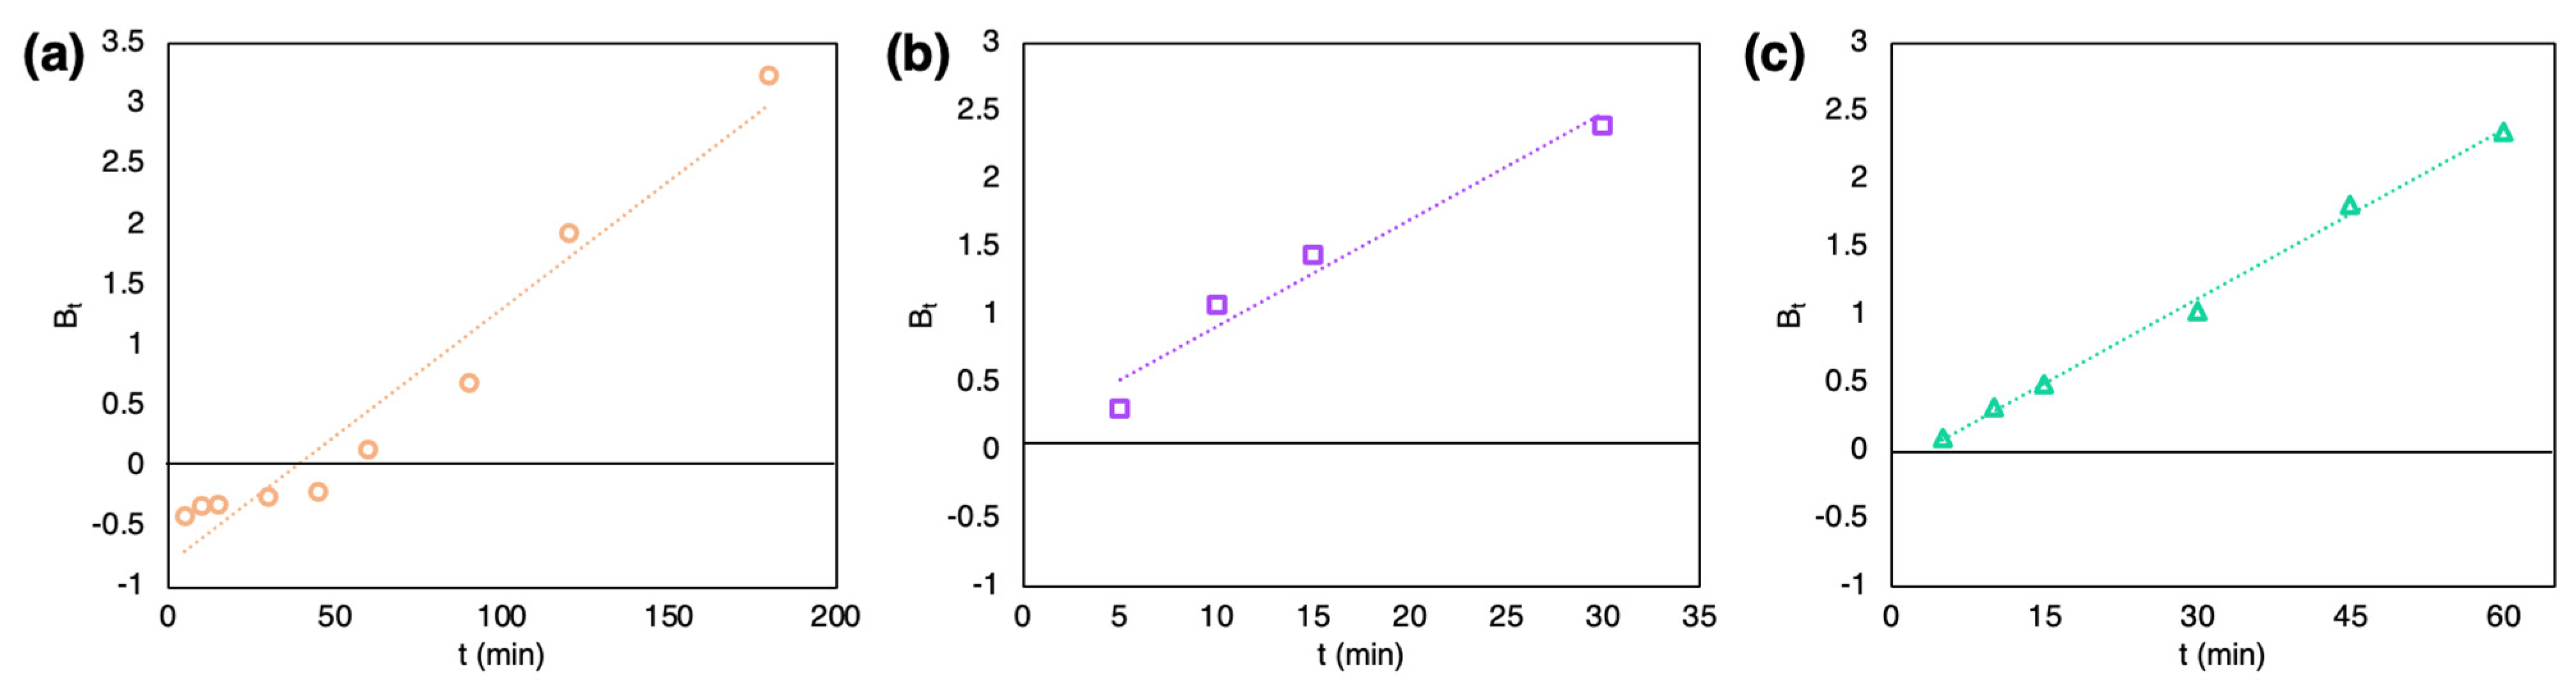
| Type of Dye | Pseudo First Order | Pseudo Second Order | Boyd’s | |||||||
| q1, mg g−1 | k1, min−1 | R2 | χ2 | q2, mg g−1 | k2, g (mg min)−1 | R2 | χ2 | R2 | χ2 | |
| CR | 11.95 | 0.008 | 0.947 | 32.41 | 14.64 | 0.0005 | 0.859 | 1.47 | 0.947 | 16.91 |
| CV | 1.64 | 0.003 | 0.142 | 75.5 | 9.36 | 0.4491 | 0.954 | 3.15 | 0.957 | 0.16 |
| MG | 3.87 | 0.010 | 0.720 | 57.59 | 11.64 | 0.0145 | 0.999 | 0.25 | 0.996 | 0.51 |
| Type of dye | Intra particle diffusion | Pore diffusion | qexp, mg g−1 | |||||||
| Kwm, mg (g min0.5)−1 | B, mg g−1 | R2 | χ2 | Δβ | kβ | R2 | χ2 | |||
| CR | 0.707 | 1.203 | 0.935 | 1.82 | 0.677 | 0.0003 | 0.951 | 1.37 | 8.81 | |
| CV | 0.146 | 7.813 | 0.267 | 1.43 | 0.088 | 0.0088 | 0.479 | 1.00 | 10.44 | |
| MG | 0.441 | 5.906 | 0.759 | 1.25 | 0.201 | 0.005 | 0.907 | 0.61 | 11.86 | |
| Type of Dye | Langmuir | Freundlich | Temkin | Sips | qexp, mg g−1 | |||||||||||||
|---|---|---|---|---|---|---|---|---|---|---|---|---|---|---|---|---|---|---|
| qmax, mg g−1 | KL, L mg−1 | R2 | χ2 | KF, (mg g−1) (mg L−1)-n | n | R2 | χ2 | b, J mol−1 | Km, L g−1 | R2 | χ2 | qm, mg g−1 | KS [(mg L−1)−1/n] | n | R2 | χ2 | ||
| CR | 87.72 | 26.22 | 0.018 | 5.05 | 3.66 | 0.94 | 0.786 | 10.02 | 549.6 | 0.33 | 0.916 | 2.69 | 13.4 | 0.08 | 0.47 | 0.950 | 1.26 | 13.04 |
| CV | 114.9 | 0.06 | 0.473 | 16.82 | 7.04 | 1.25 | 0.977 | 0.80 | 189.9 | 1.86 | 0.923 | 3.74 | 42.1 | 0.53 | 0.39 | 0.662 | 18.92 | 41.97 |
| MG | 41.5 | 753.1 | 0.938 | 1.31 | 10.39 | 1.63 | 0.999 | 0.06 | 384.4 | 11.0 | 0.874 | 19.02 | 35.0 | 0.77 | 0.91 | 0.900 | 3.75 | 33.19 |
| Strain | Origin of Strain | Cell Density per mL | Biomass DW (g L−1) | Specific Growth Rate | Days of Cultivation | Ref. |
|---|---|---|---|---|---|---|
| H. coffeaeformis | Bahía Blanca Estuary, Argentina | 1.40 × 10⁵ | 1.47 div d−1 | 7 days | [4] | |
| H. coffeaeformis | 0.3 | 22 days | [7] | |||
| H. coffeaeformis | 10.0 × 10⁵ | 0.43 | 2.03 div d−1 | 13 days | [12] | |
| H. coffeaeformis | 7.8 × 10⁵ | 0.18 | 0.92 div d−1 | 6 days | [8] | |
| H. coffeaeformis | 37.0 × 10⁵ in PBR | 0.64 | 0.4 div d−1 | 11 days | [6] | |
| H. luciae | 417 cells in mm−2 | 0.29 div d−1 | 18 days | [73] | ||
| UTCC58 H. coffeaeformis | 2.51 × 10⁵ | Max: 2.01 div d−1 Mean: 1.04 div d−1 | 8 days | [74] | ||
| H. coffeaeformis | Kelley’s Slough, ND, USA | 1.01 div d−1 | The growth rate was calculated after 48 h | [5] | ||
| H. subturgida | Sawhill Pond, CO, USA | 0.26 div d−1 | ||||
| H. pertusa | Blue Lake, UT, USA | 1.33 div d−1 | ||||
| H. turgida | Blue Lake, UT, USA | 1.16 div d−1 | ||||
| H. oligotraphenta | Sawhil Pond, CO, USA | 0.33 div d−1 | ||||
| H. cf. borealis | Guana River, FL, USA | 0.98 div d−1 | ||||
| SB1 MK575516.1 Halamphora sp. | Sfax Solar Saltern pond, Tunisia | 8 × 10⁵ | 10 days | [75] | ||
| SZCZM1454 H. cf. salinicola | Köyceğiz Lake, Turkey | 24.6 ± 0.04 × 10⁵ | 0.73 ± 0.047 | 0.081 d−1 0.113 div d−1 | 27 days | This study |
Disclaimer/Publisher’s Note: The statements, opinions and data contained in all publications are solely those of the individual author(s) and contributor(s) and not of MDPI and/or the editor(s). MDPI and/or the editor(s) disclaim responsibility for any injury to people or property resulting from any ideas, methods, instructions or products referred to in the content. |
© 2023 by the authors. Licensee MDPI, Basel, Switzerland. This article is an open access article distributed under the terms and conditions of the Creative Commons Attribution (CC BY) license (https://creativecommons.org/licenses/by/4.0/).
Share and Cite
Golubeva, A.; Roychoudhury, P.; Dąbek, P.; Pryshchepa, O.; Pomastowski, P.; Pałczyńska, J.; Piszczek, P.; Gloc, M.; Dobrucka, R.; Feliczak-Guzik, A.; et al. Removal of the Basic and Diazo Dyes from Aqueous Solution by the Frustules of Halamphora cf. salinicola (Bacillariophyta). Mar. Drugs 2023, 21, 312. https://doi.org/10.3390/md21050312
Golubeva A, Roychoudhury P, Dąbek P, Pryshchepa O, Pomastowski P, Pałczyńska J, Piszczek P, Gloc M, Dobrucka R, Feliczak-Guzik A, et al. Removal of the Basic and Diazo Dyes from Aqueous Solution by the Frustules of Halamphora cf. salinicola (Bacillariophyta). Marine Drugs. 2023; 21(5):312. https://doi.org/10.3390/md21050312
Chicago/Turabian StyleGolubeva, Aleksandra, Piya Roychoudhury, Przemysław Dąbek, Oleksandra Pryshchepa, Paweł Pomastowski, Jagoda Pałczyńska, Piotr Piszczek, Michał Gloc, Renata Dobrucka, Agnieszka Feliczak-Guzik, and et al. 2023. "Removal of the Basic and Diazo Dyes from Aqueous Solution by the Frustules of Halamphora cf. salinicola (Bacillariophyta)" Marine Drugs 21, no. 5: 312. https://doi.org/10.3390/md21050312