Pd-Ceria/CNMs Composites as Catalysts for CO and CH4 Oxidation

 , , , , ,
  , and
, and
Abstract
:
1. Introduction
2. Materials and Methods
2.1. Synthesis
2.2. Samples Characterization
2.2.1. X-ray Diffraction Analysis (XRD)
2.2.2. X-ray Photoelectron Spectroscopy (XPS)
2.2.3. Transmission Electron Microscopy (TEM)
2.3. Catalytic Properties
2.3.1. Catalytic Activity Measurements
2.3.2. Temperature Programmed Reduction
3. Results and Discussion
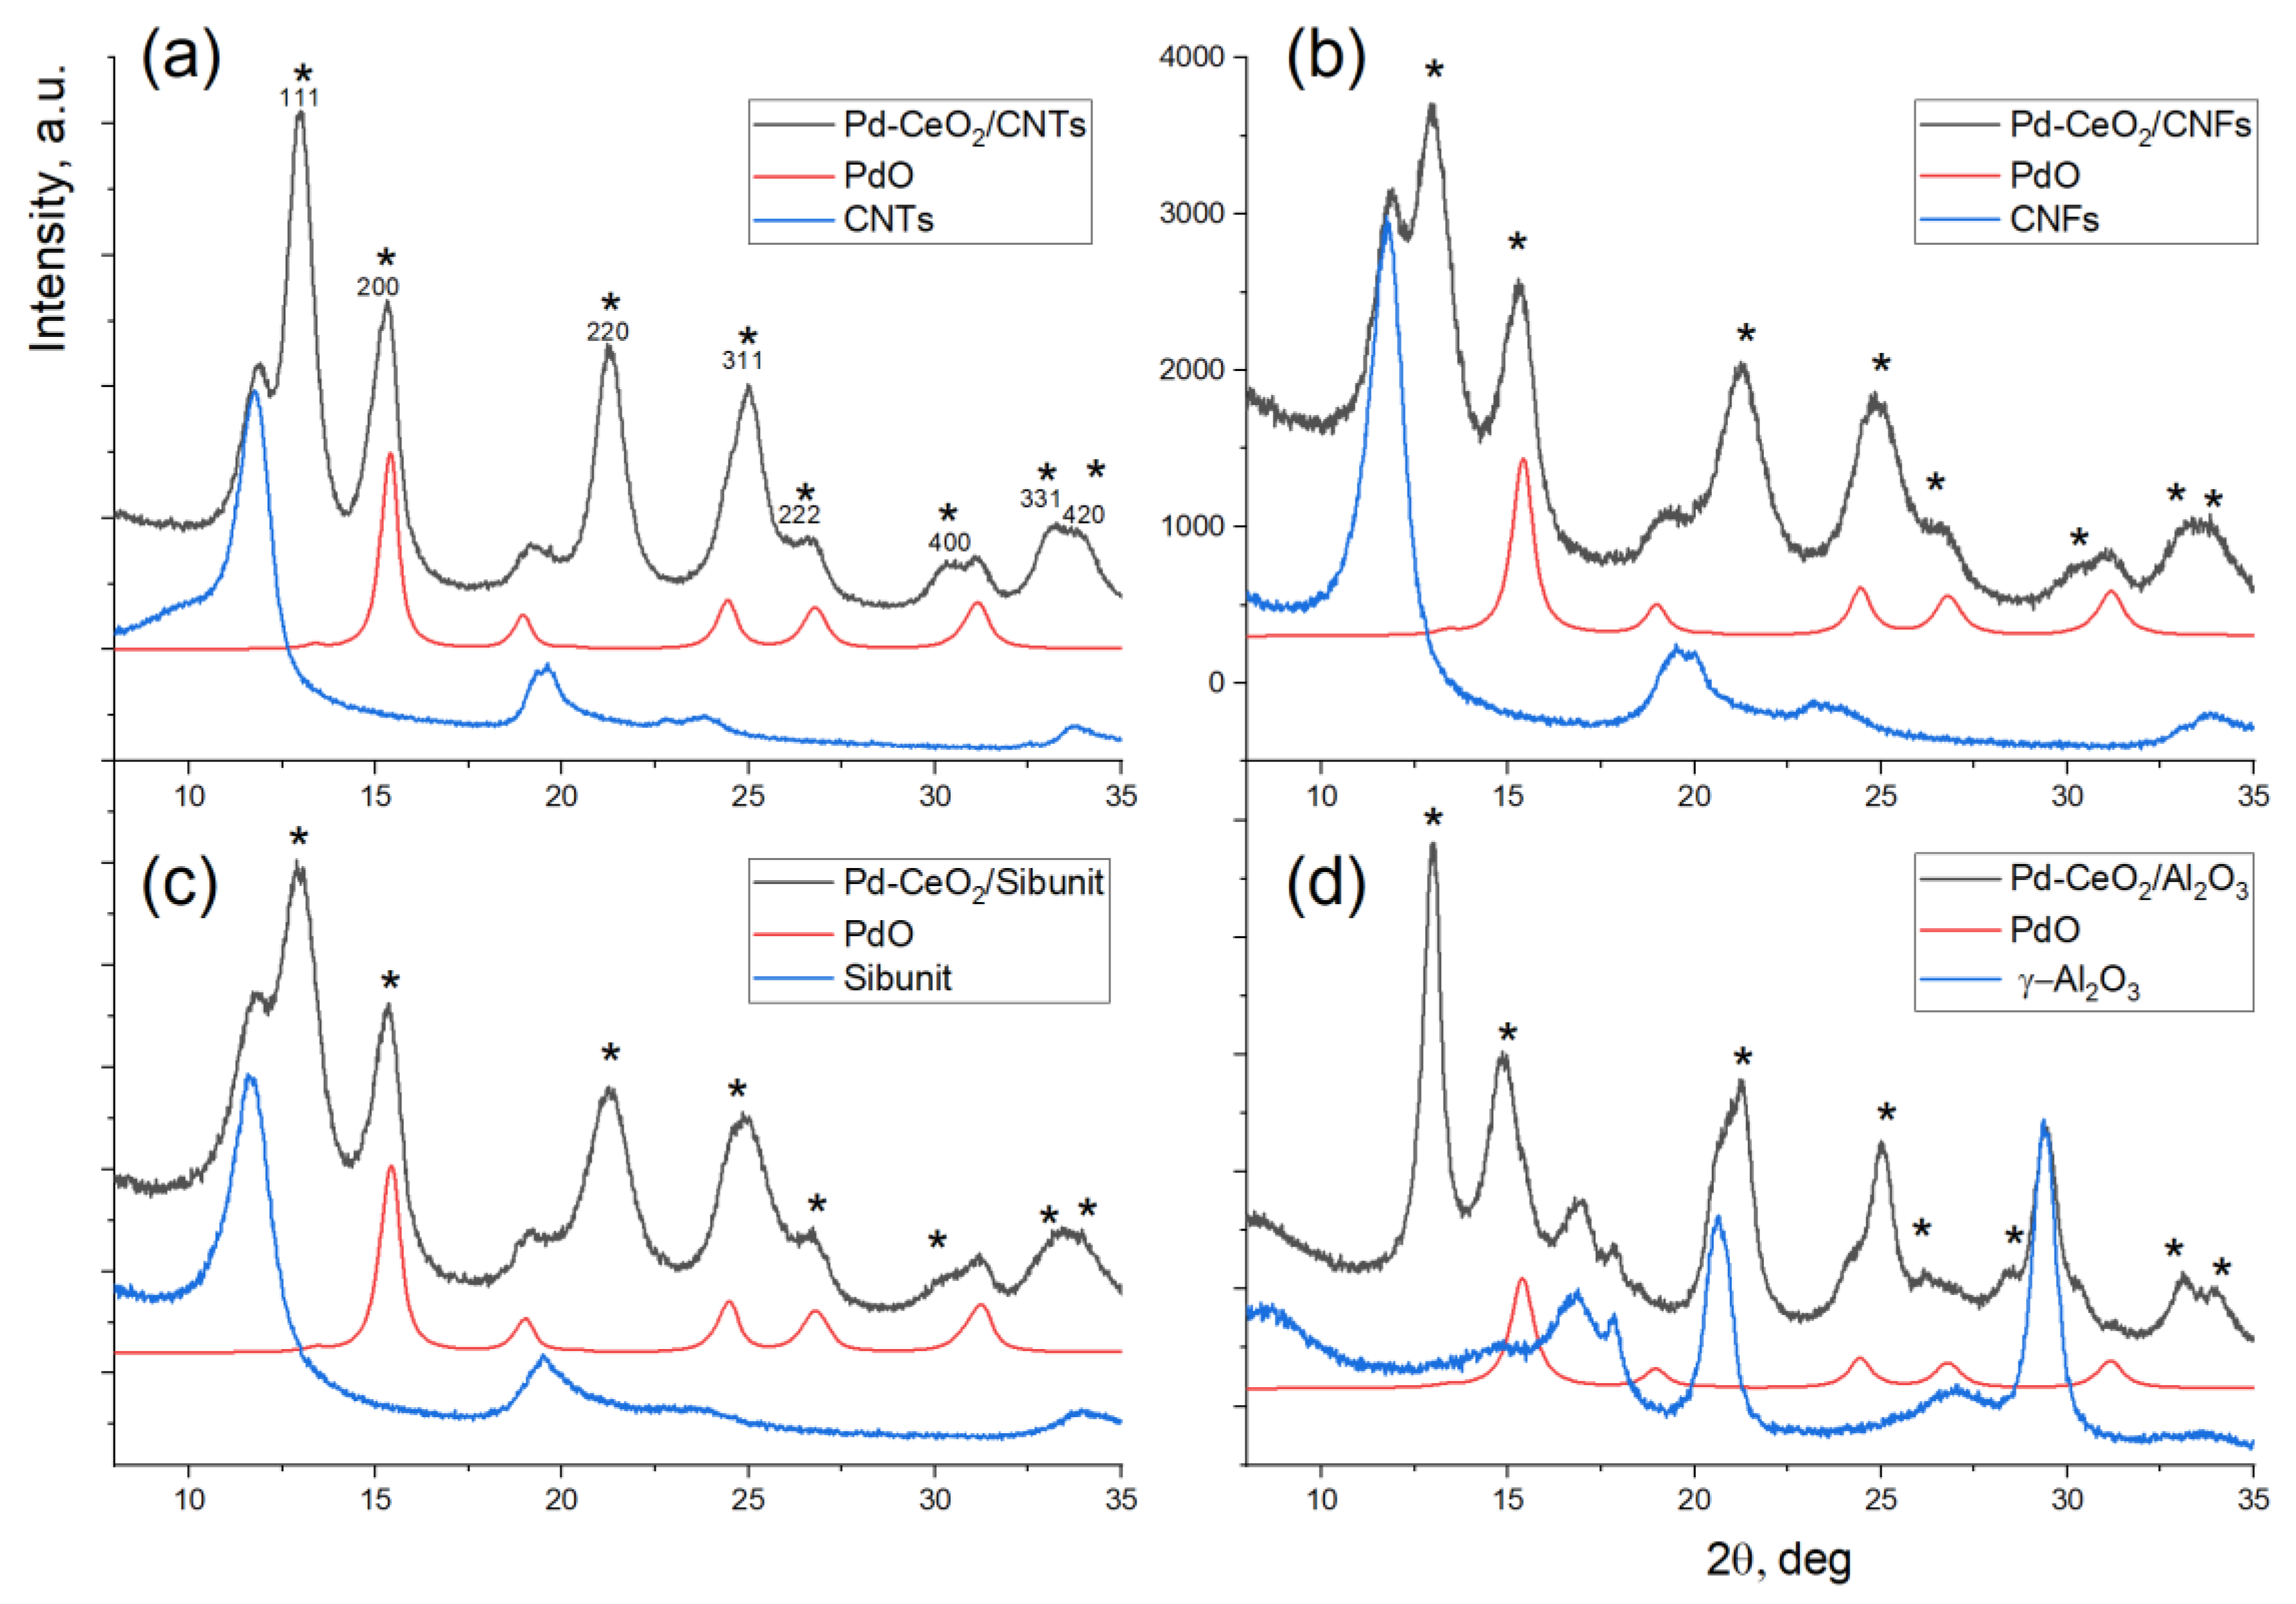
3.1. Textural Properties and XRD Data
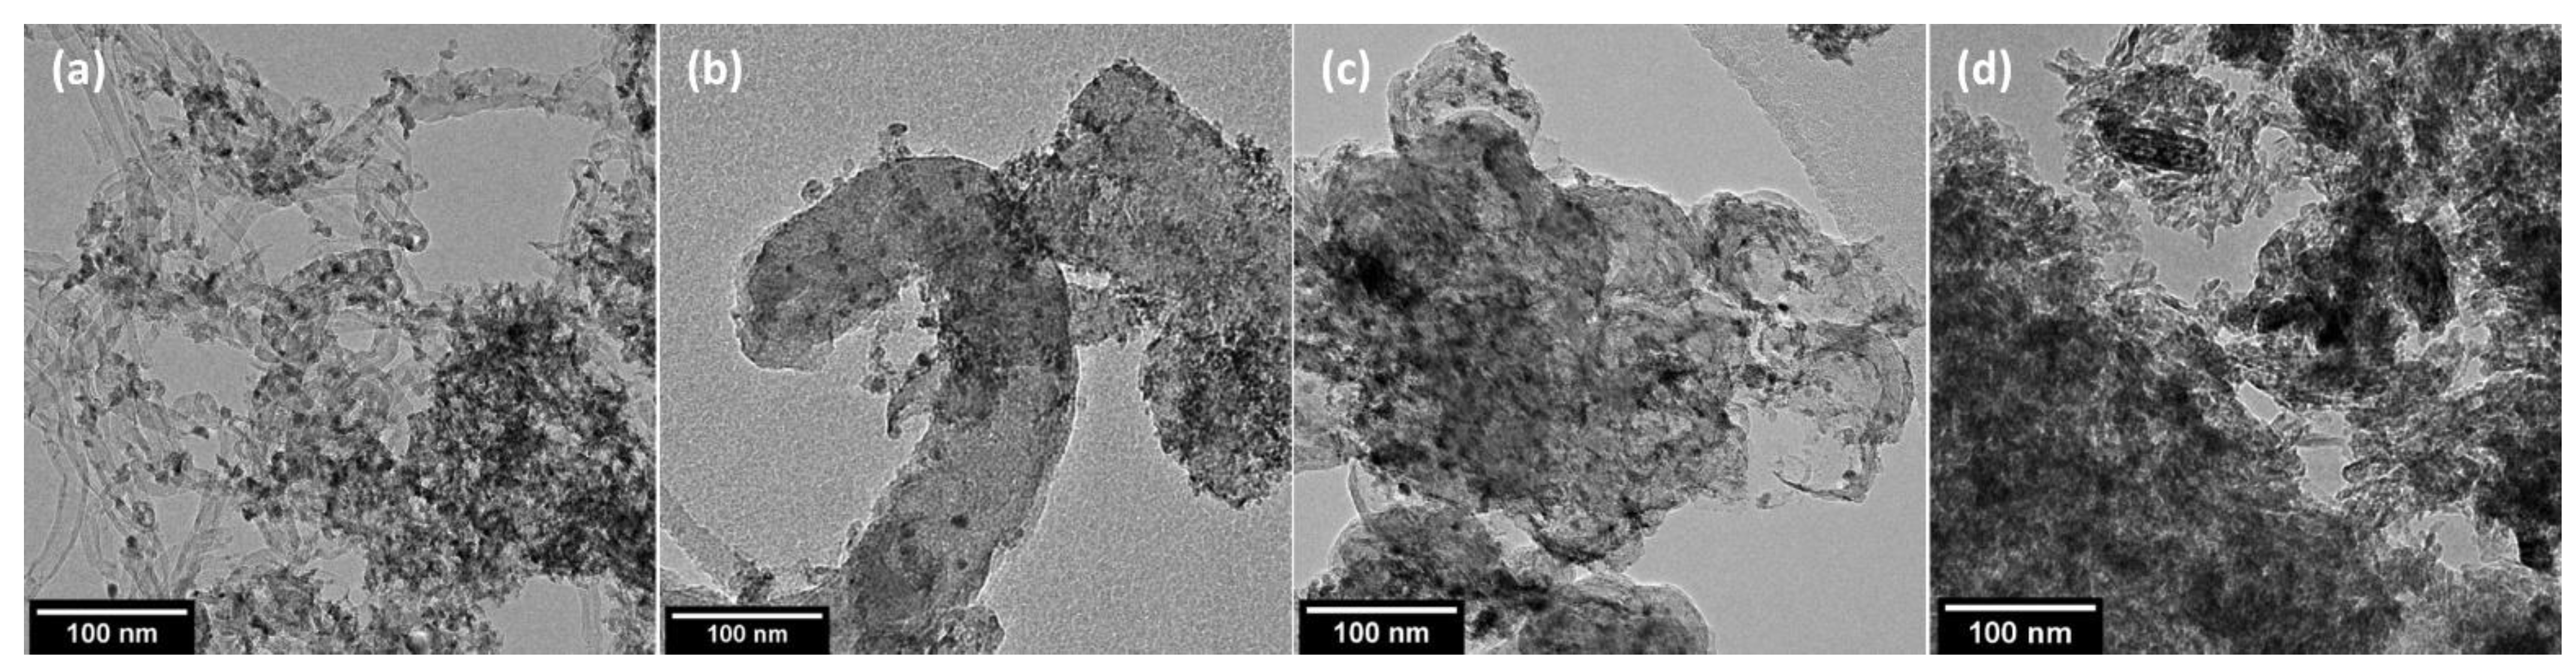
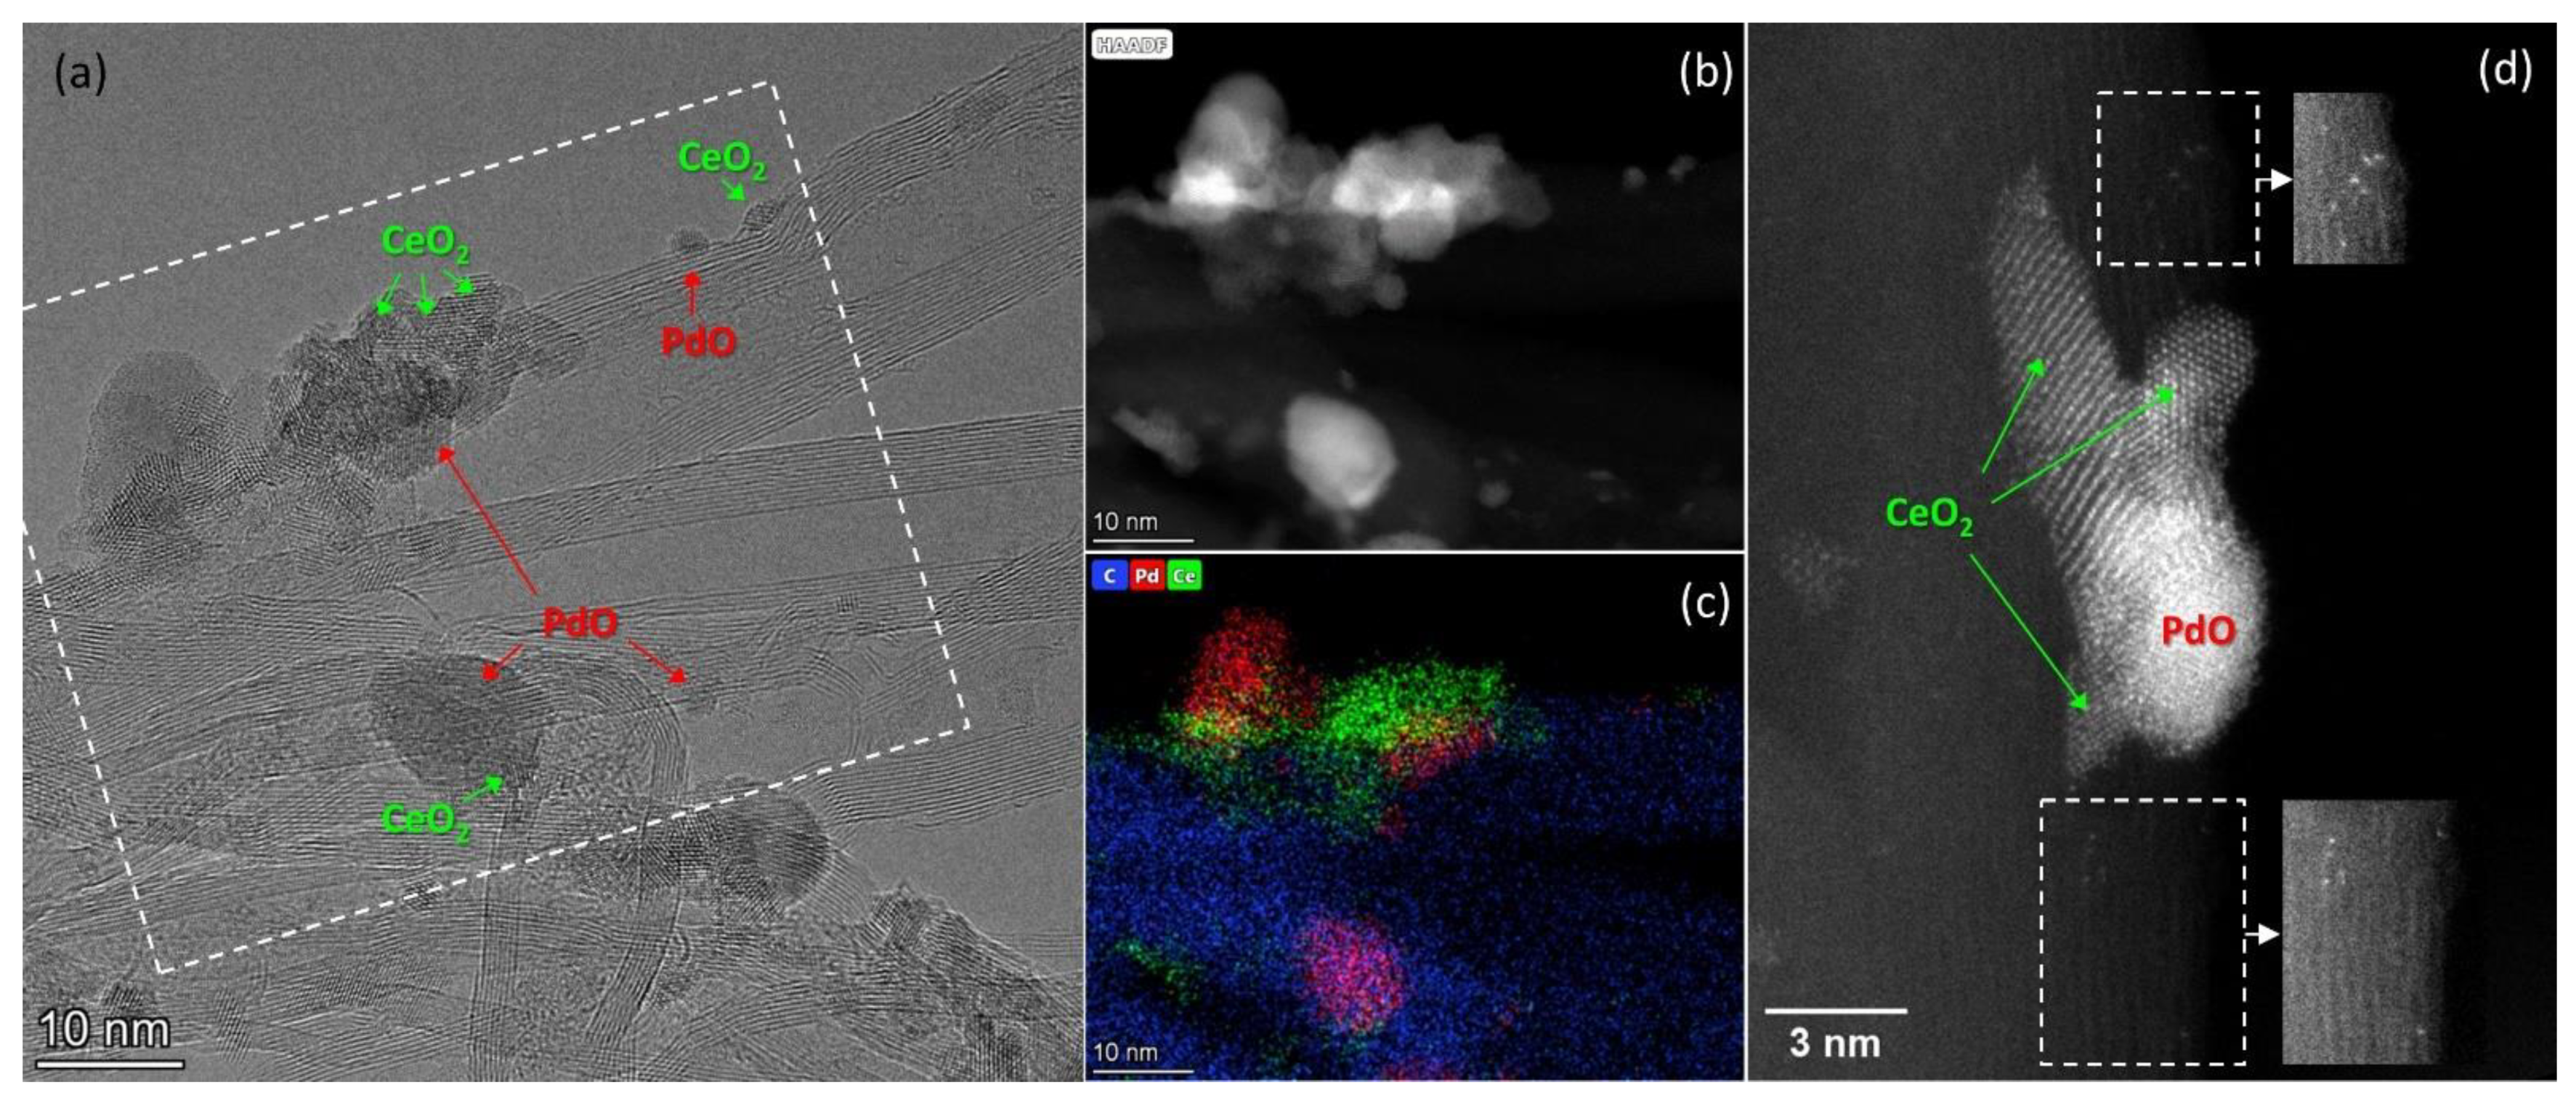
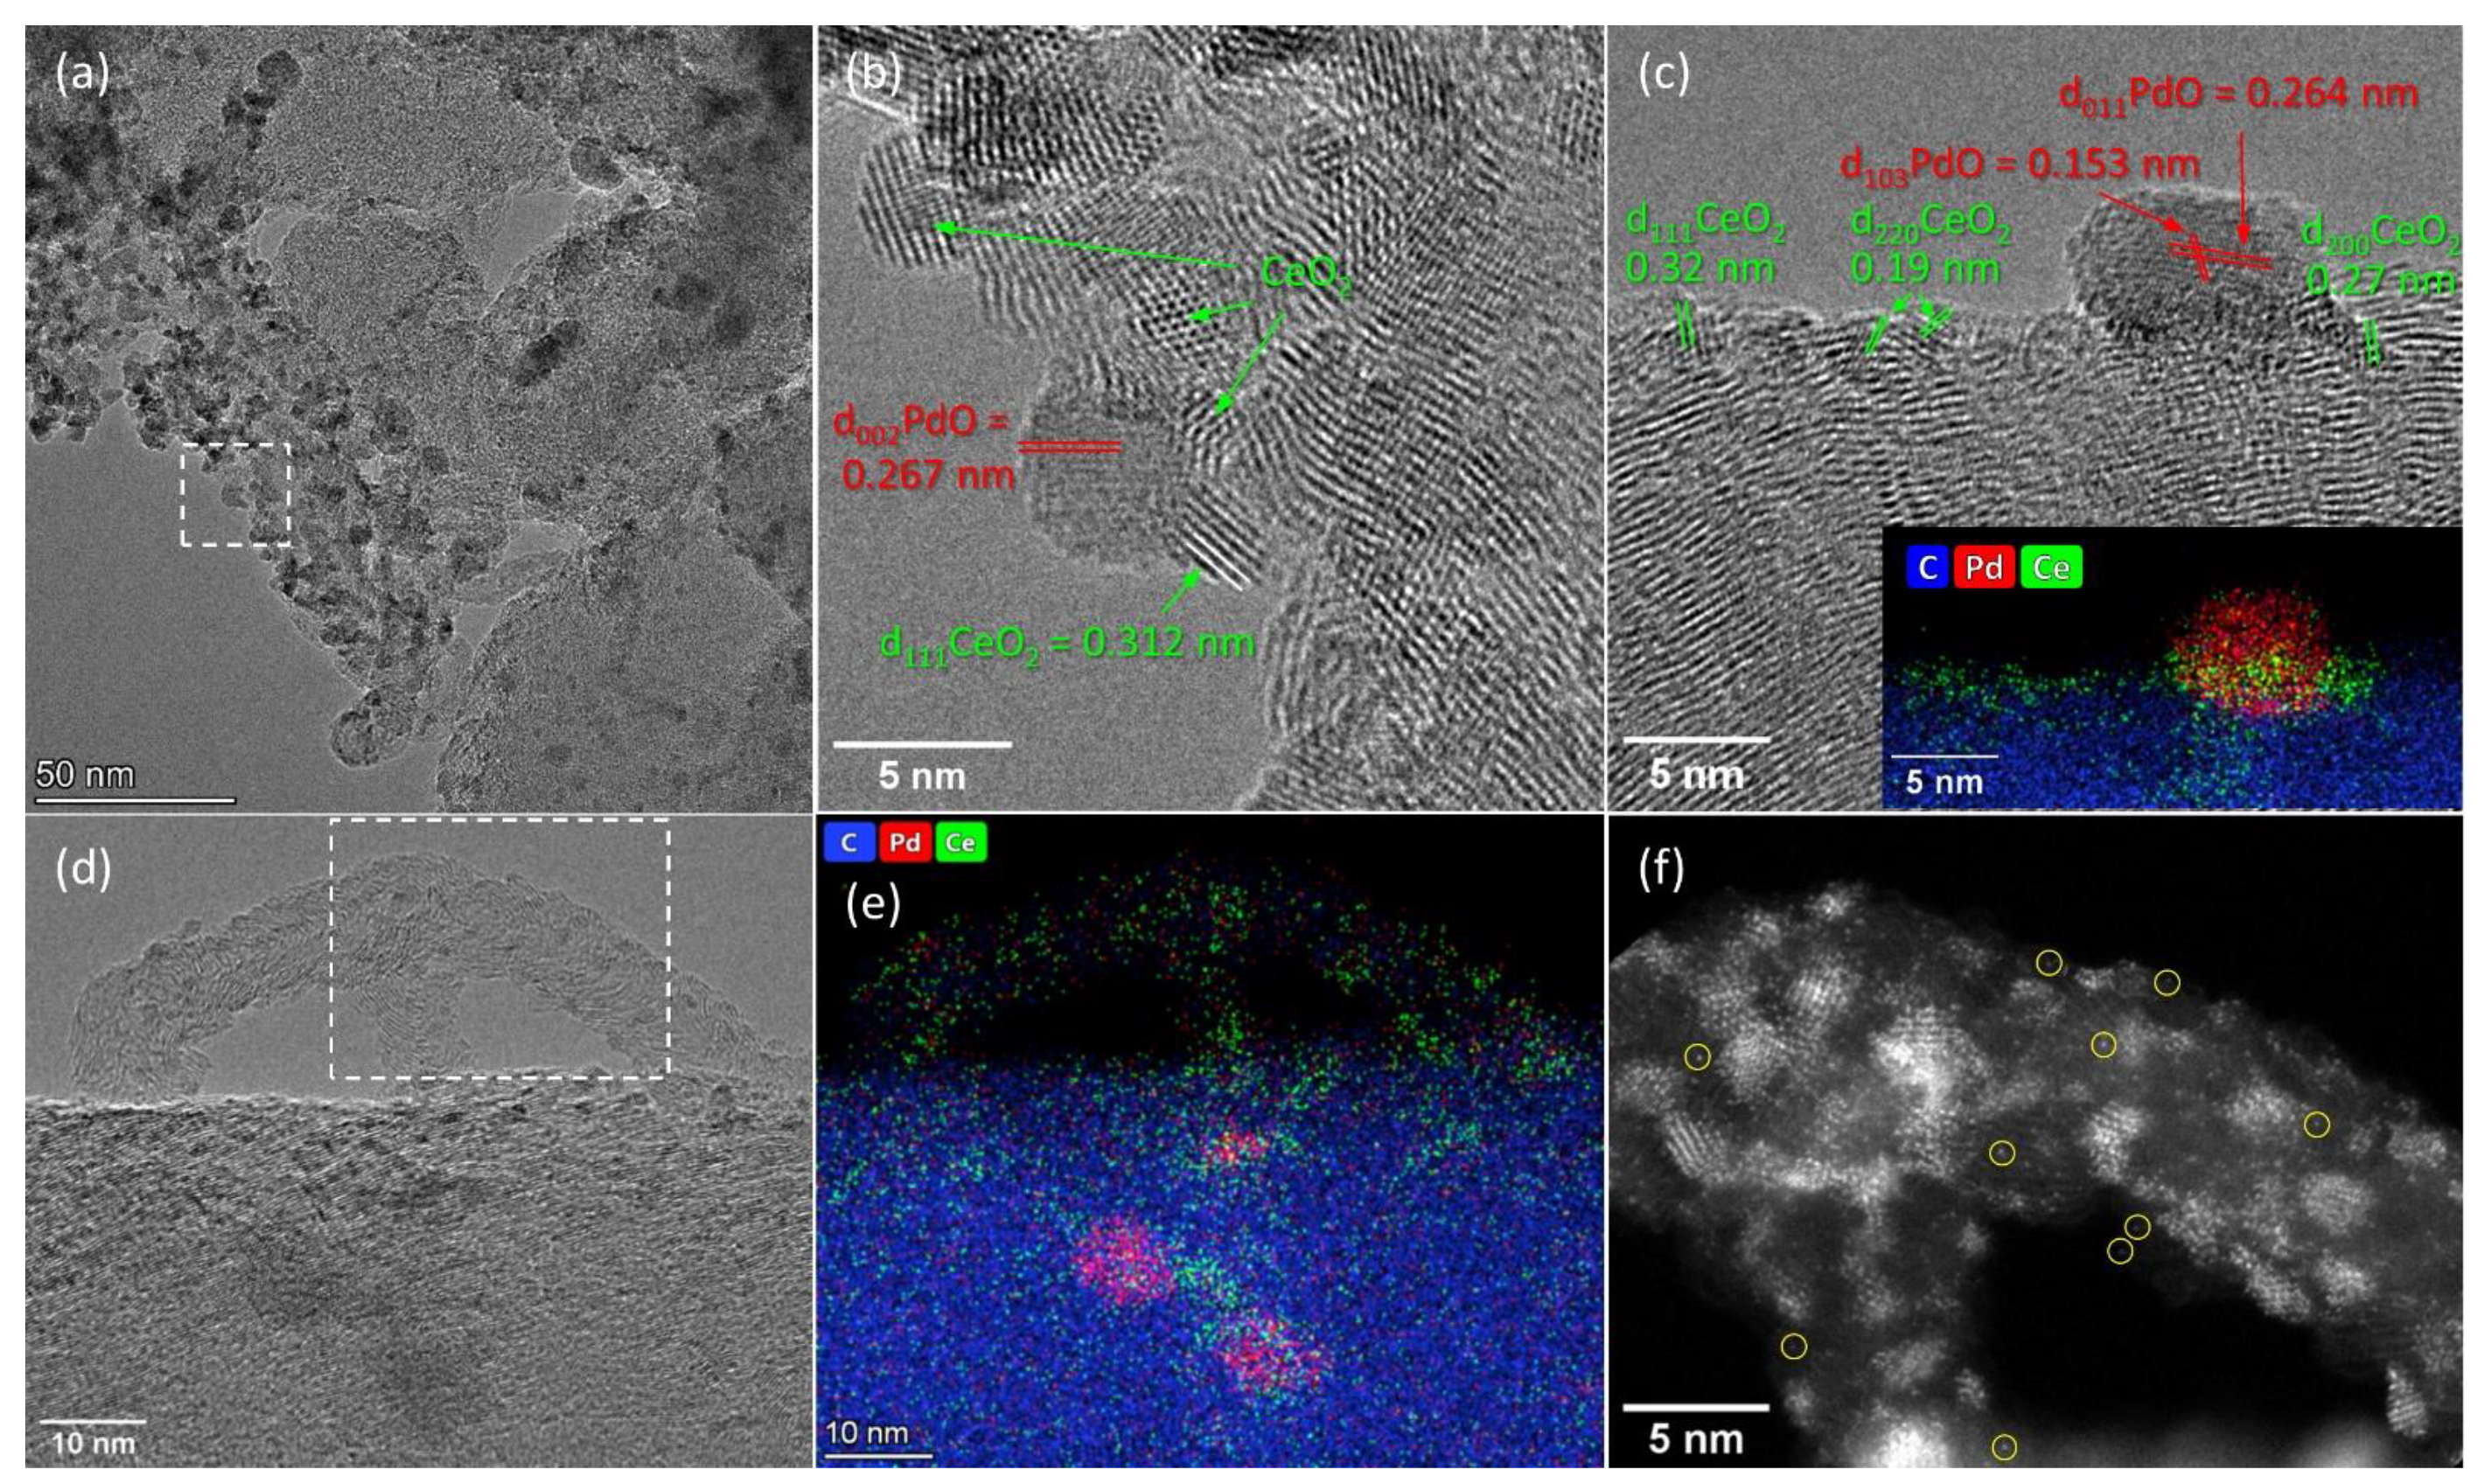
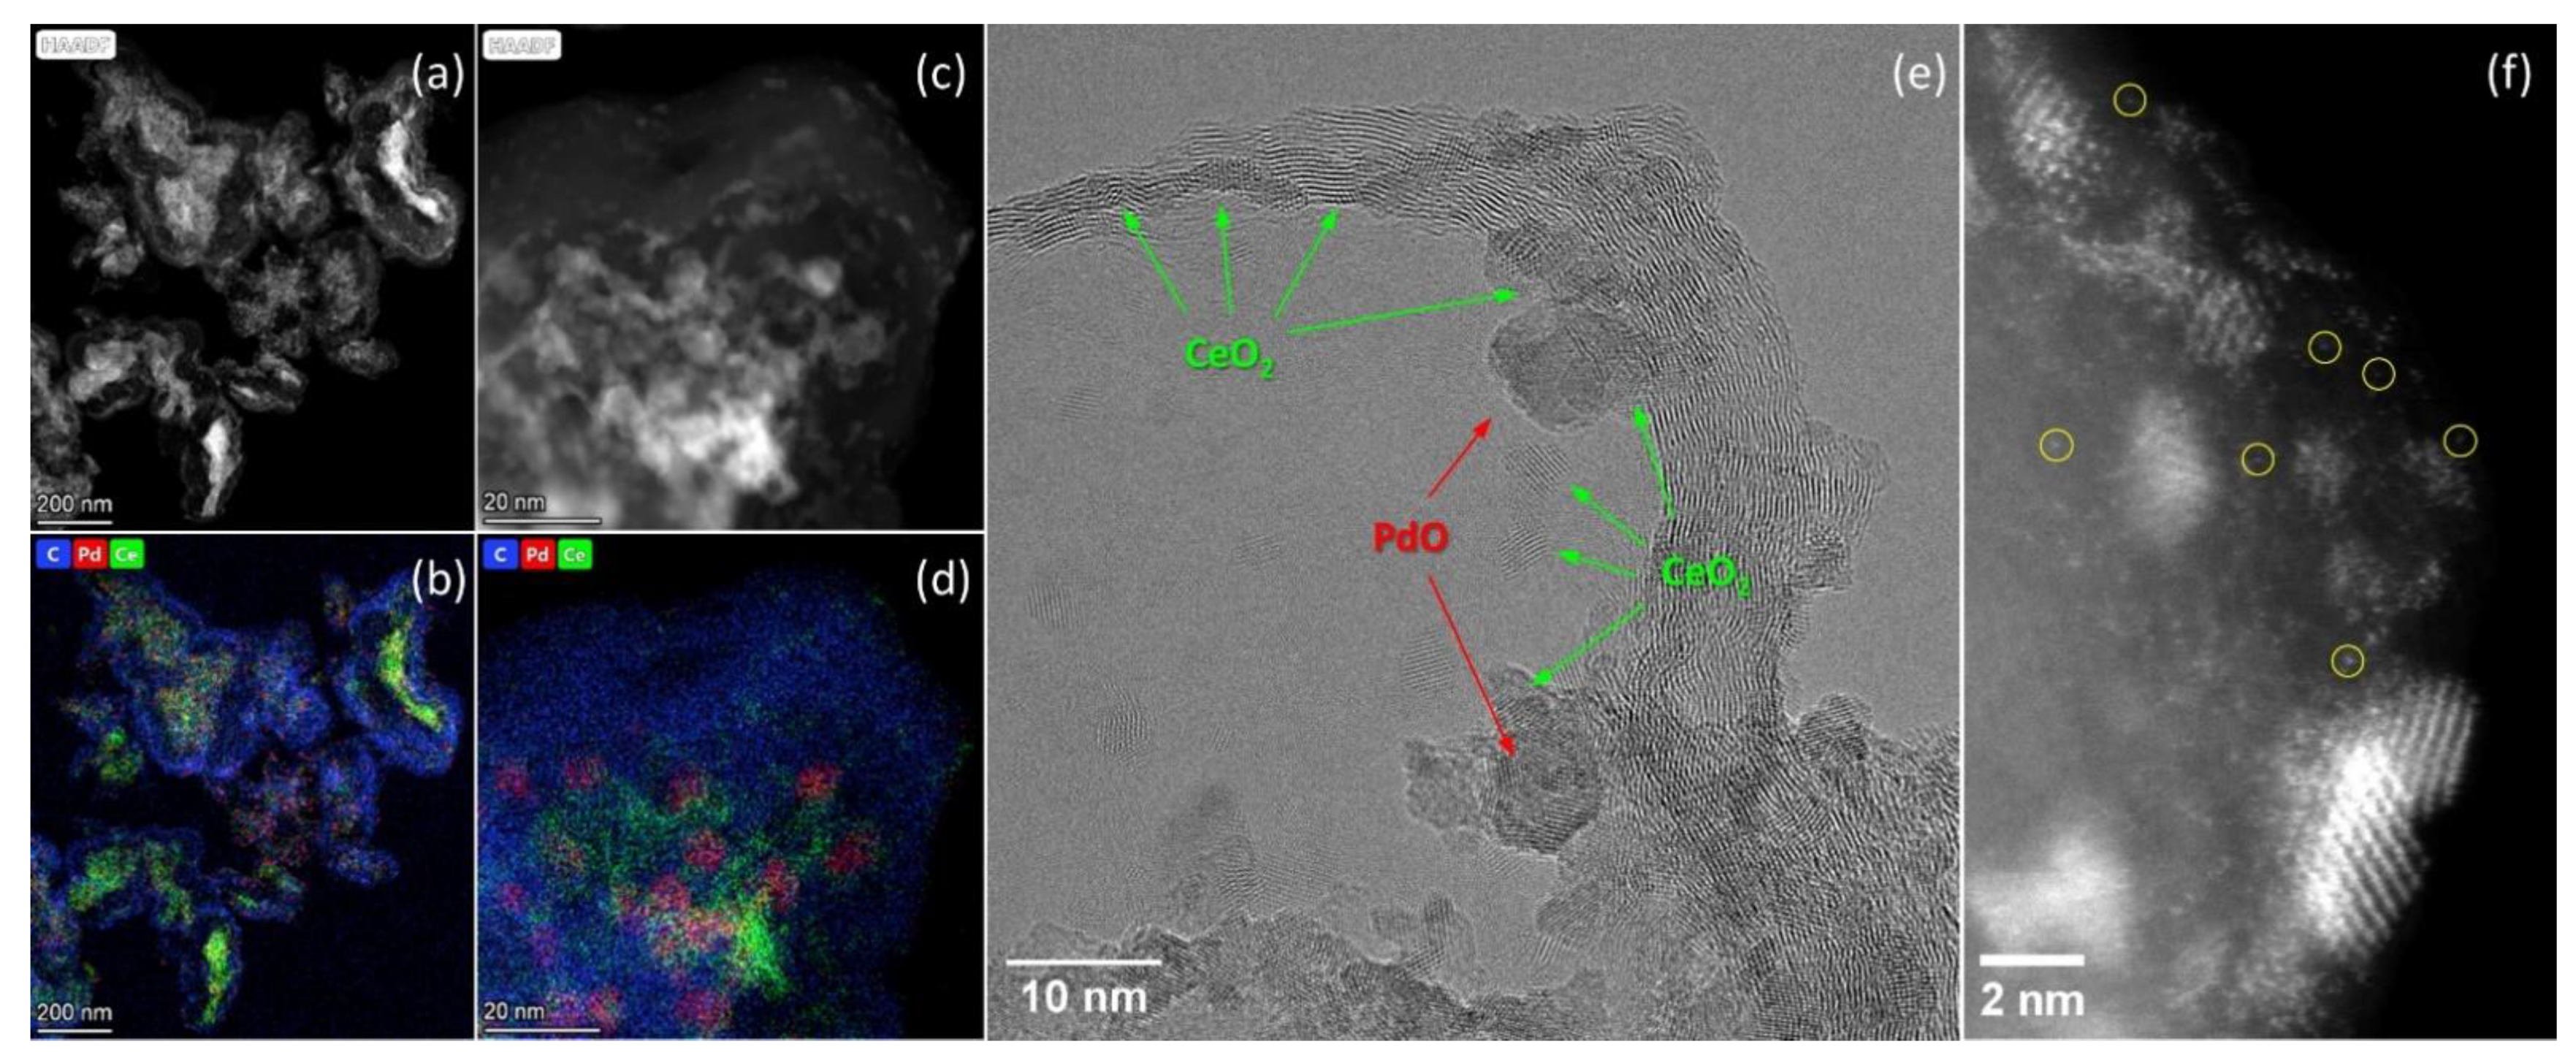
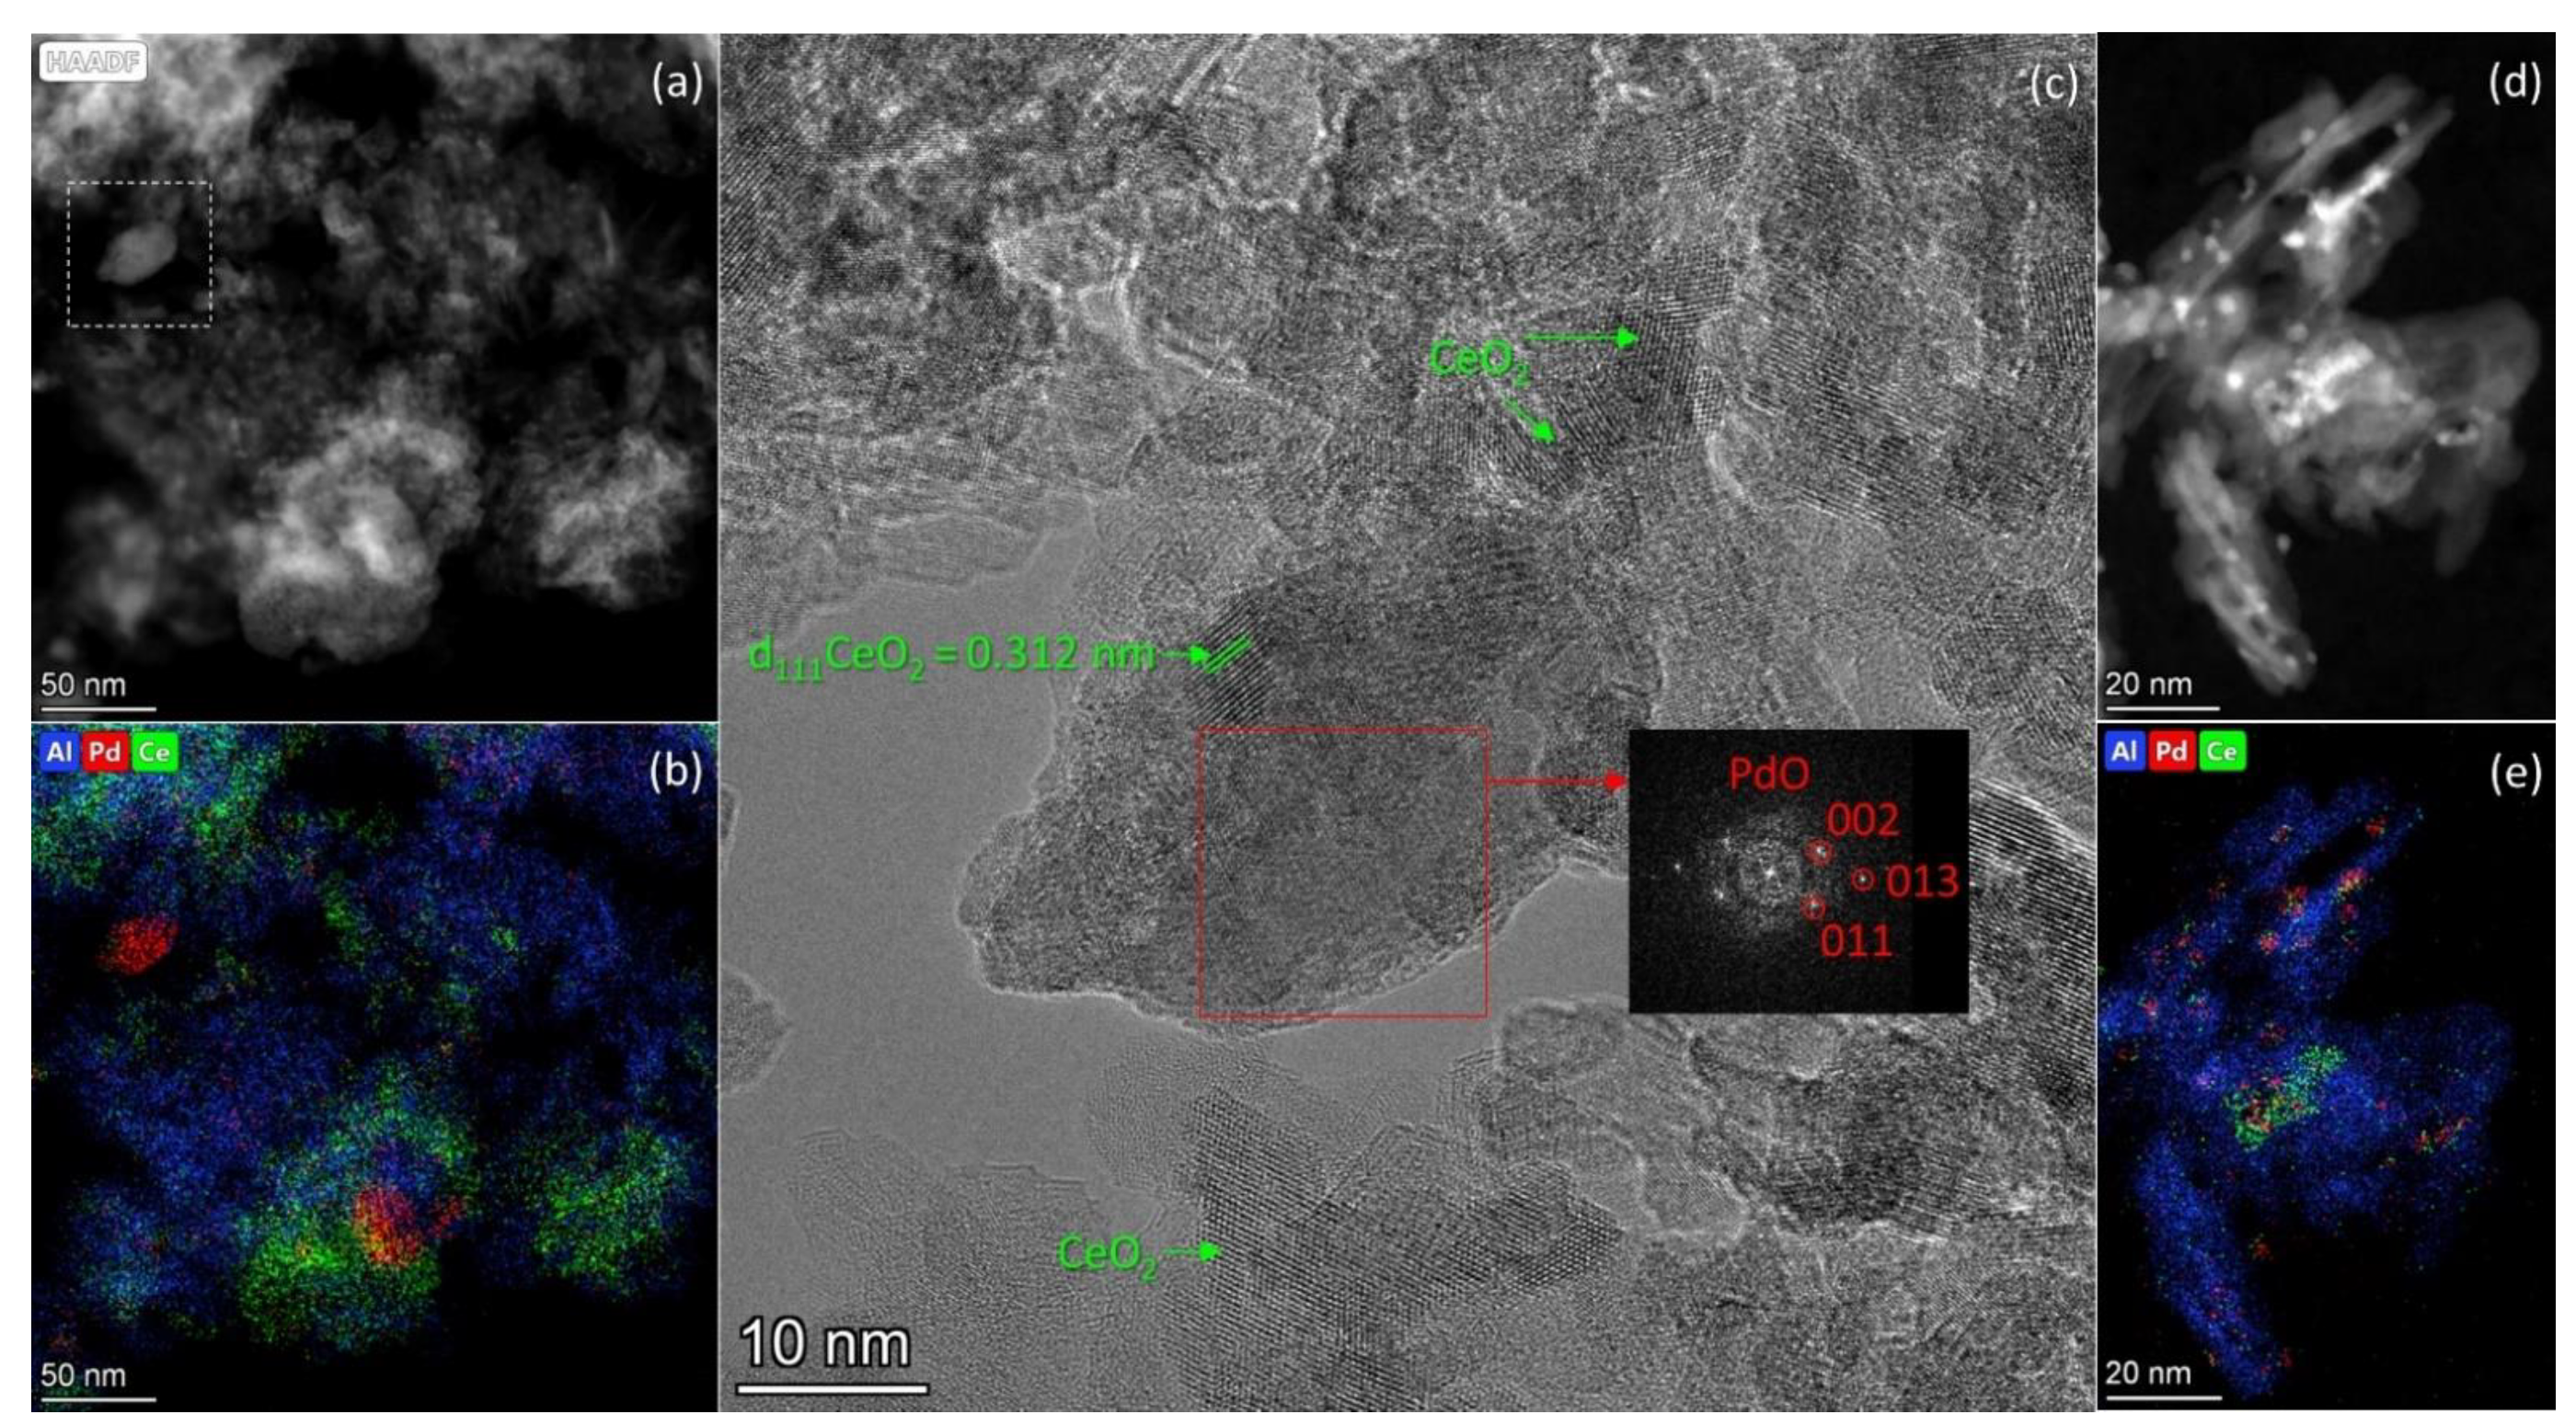
3.2. TEM Data
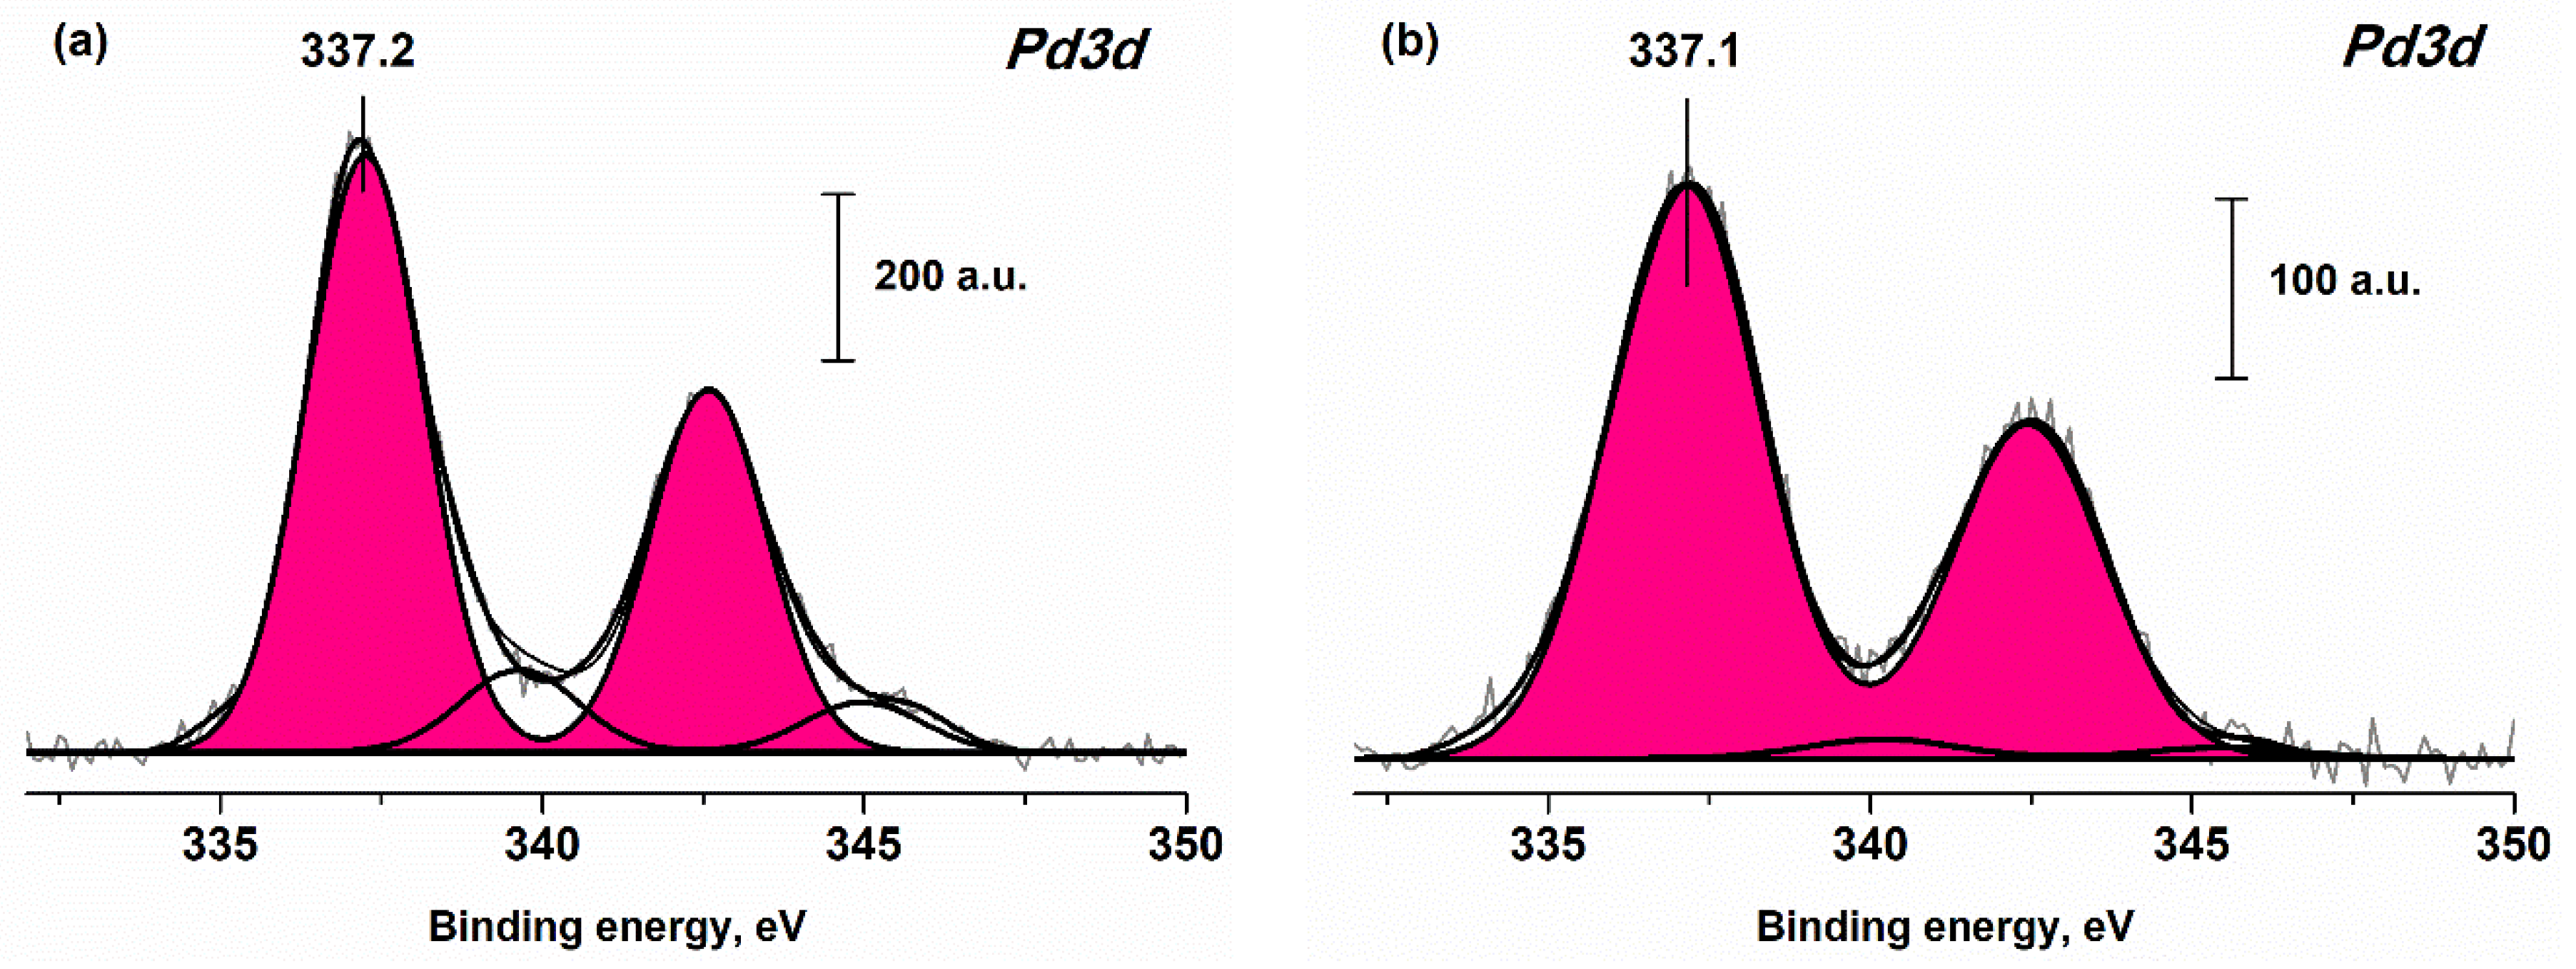
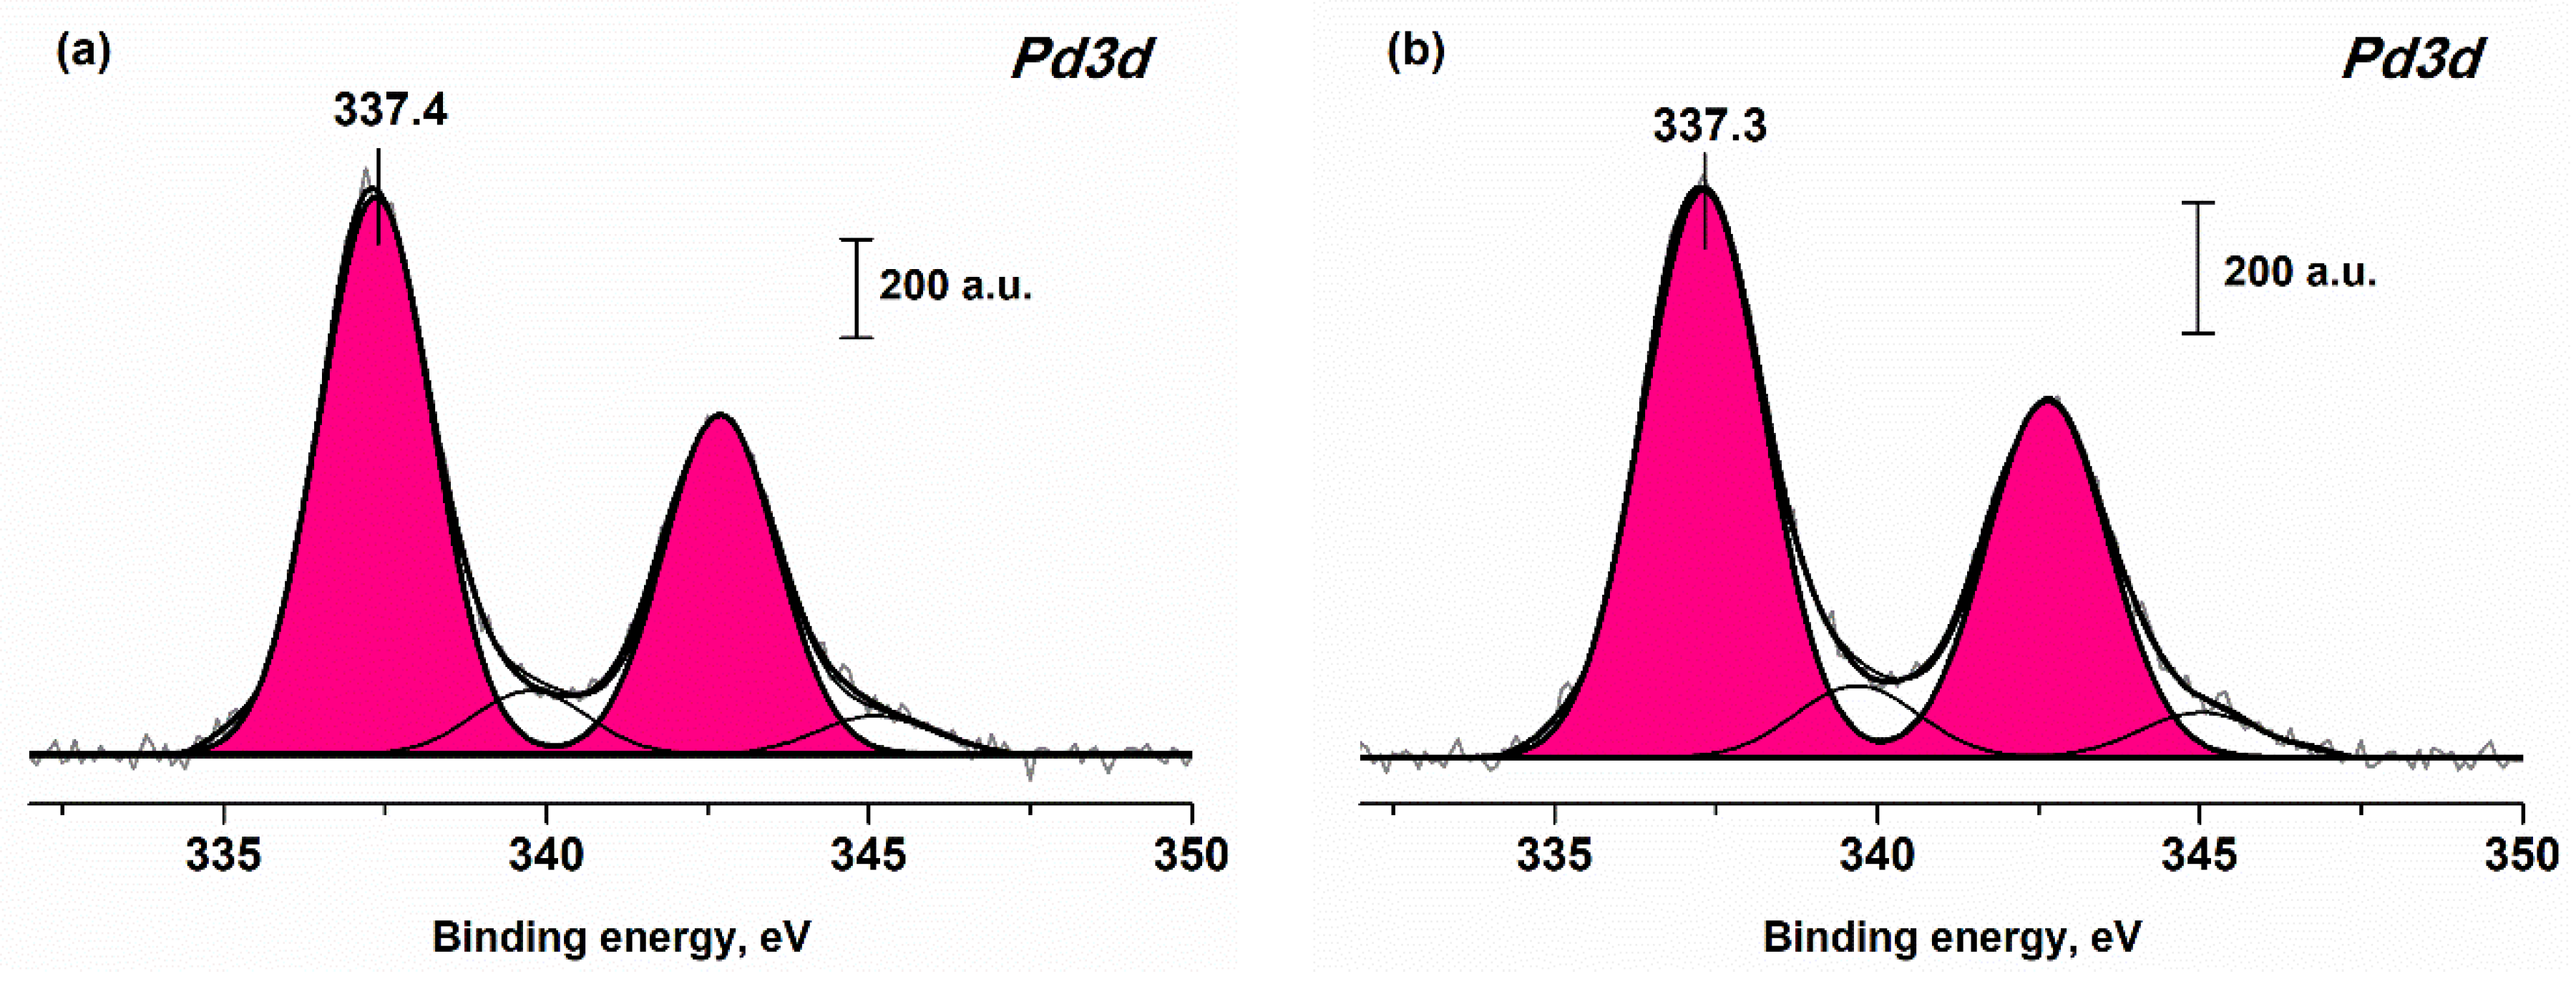
3.3. XPS Data
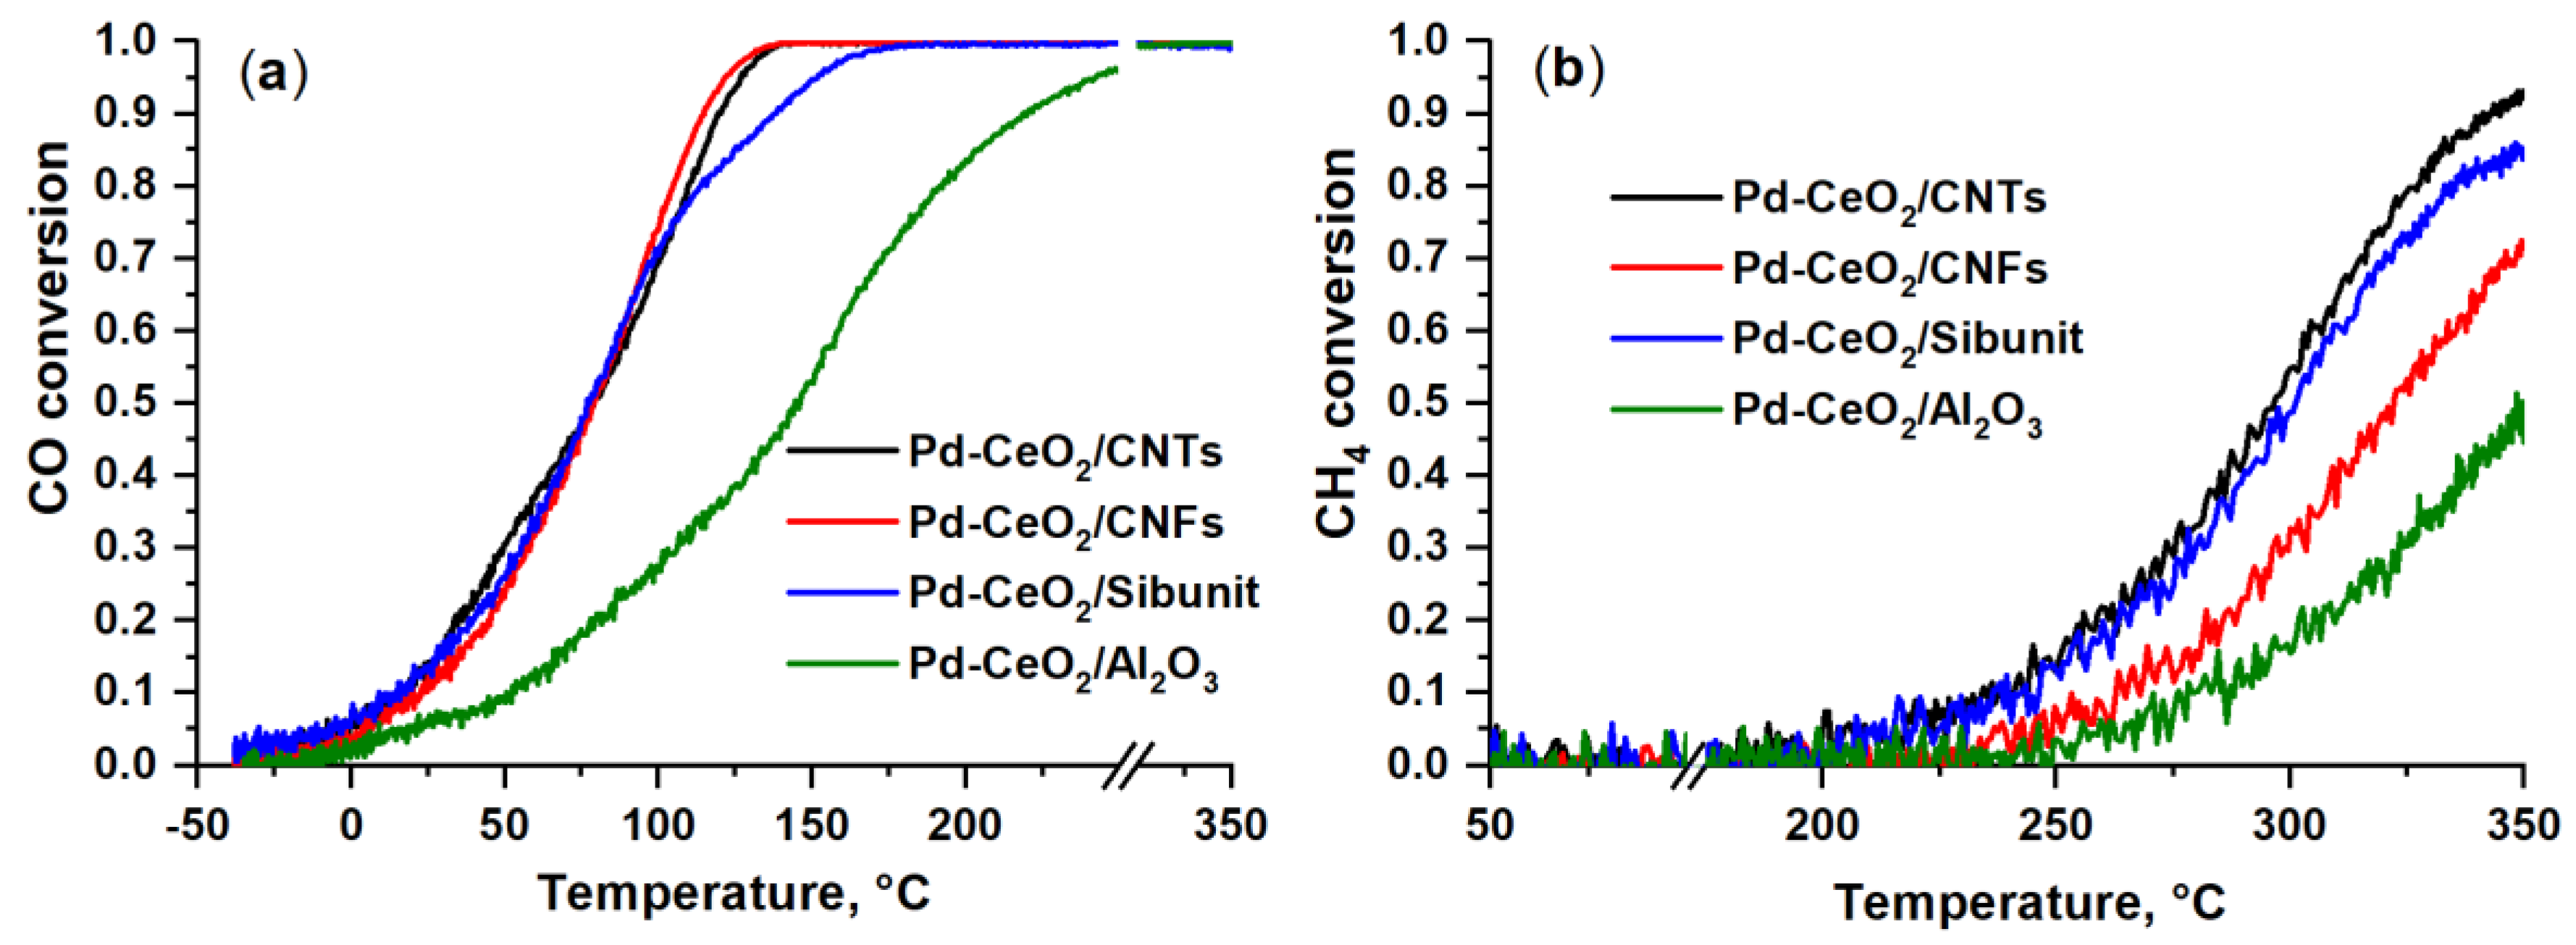
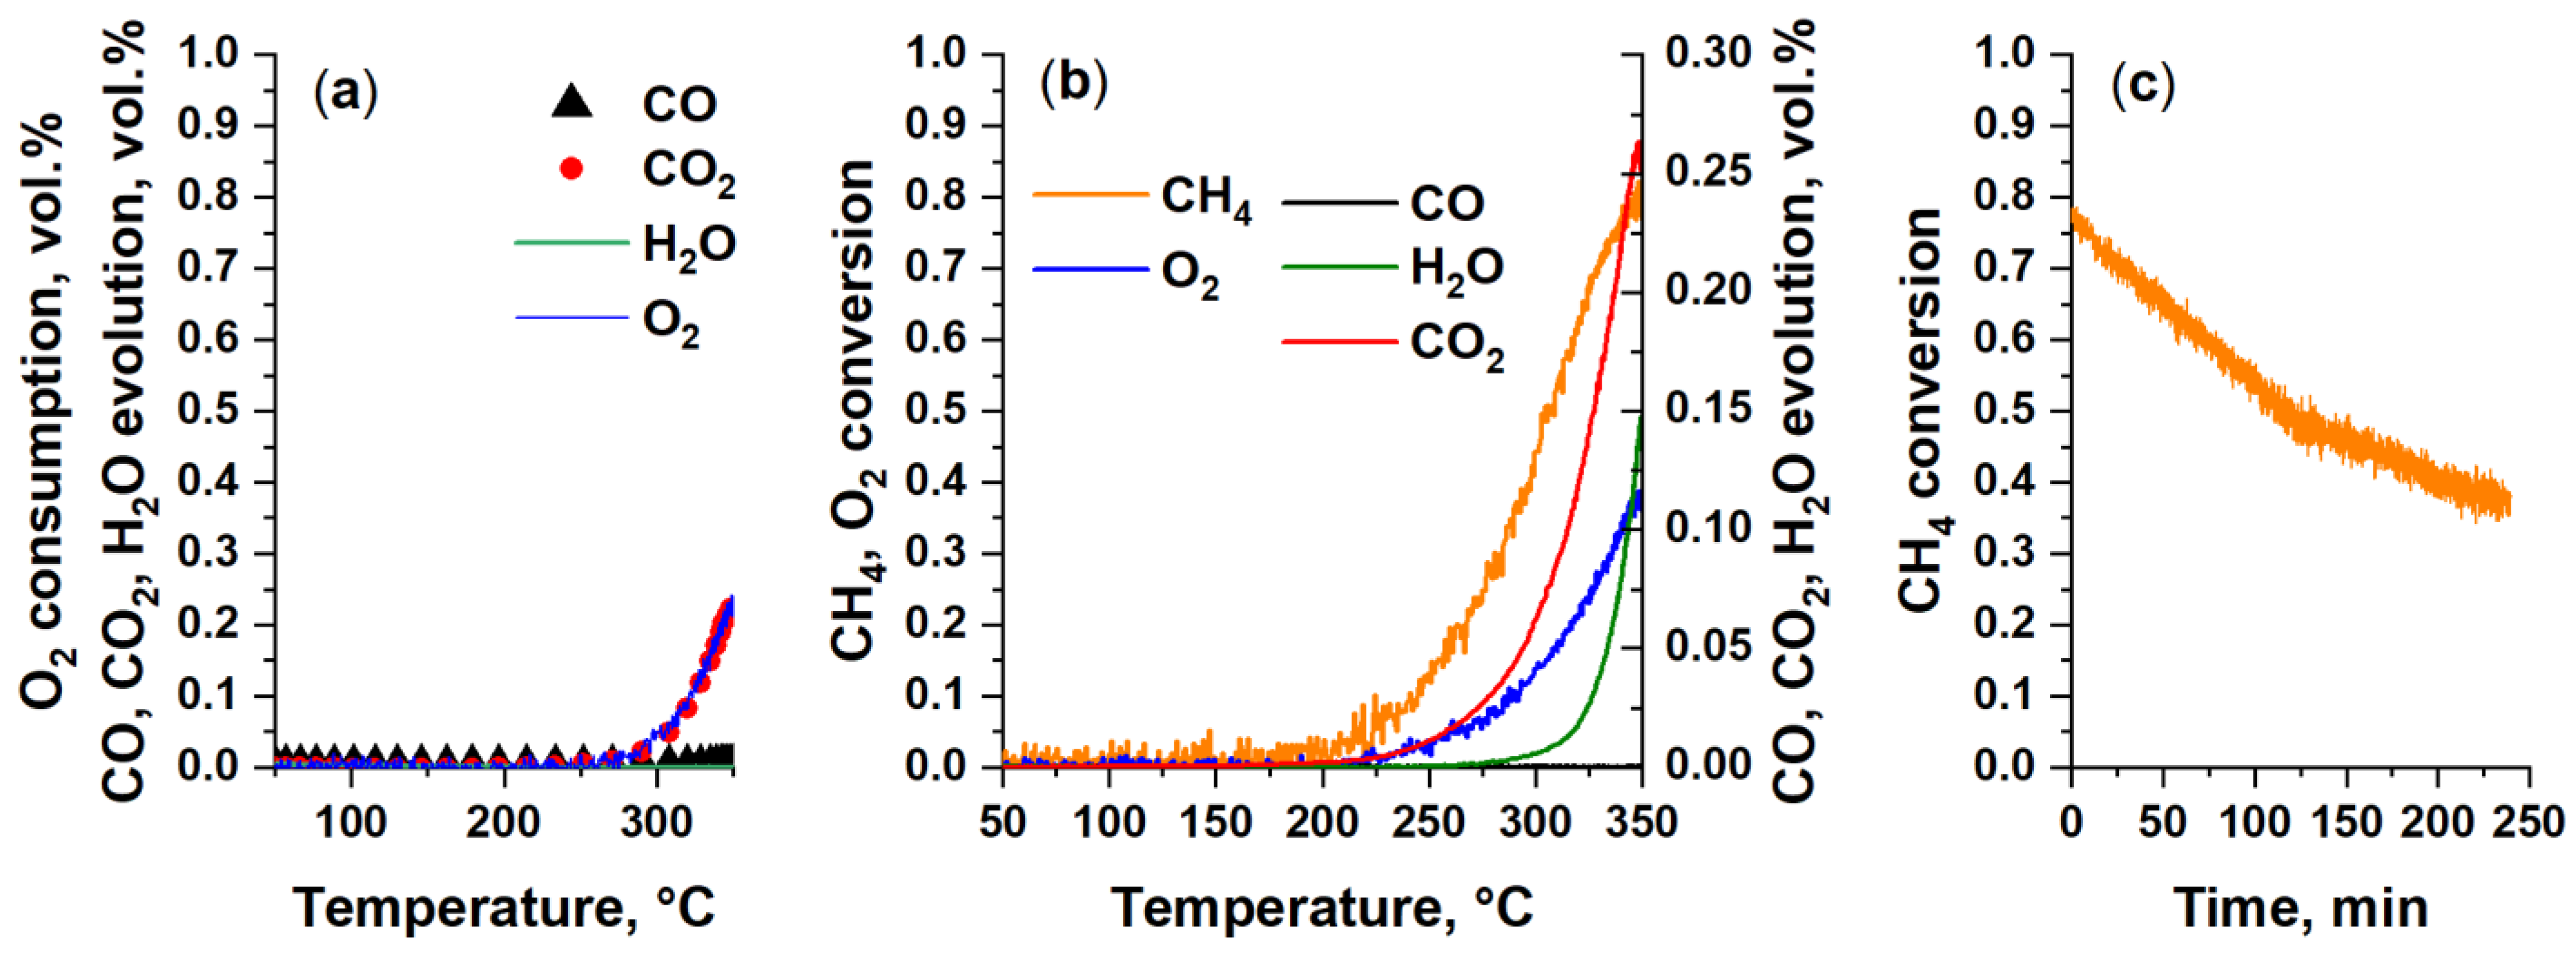
3.4. TPR-CO+O2, TPR-CH4+O2: Catalytic Data
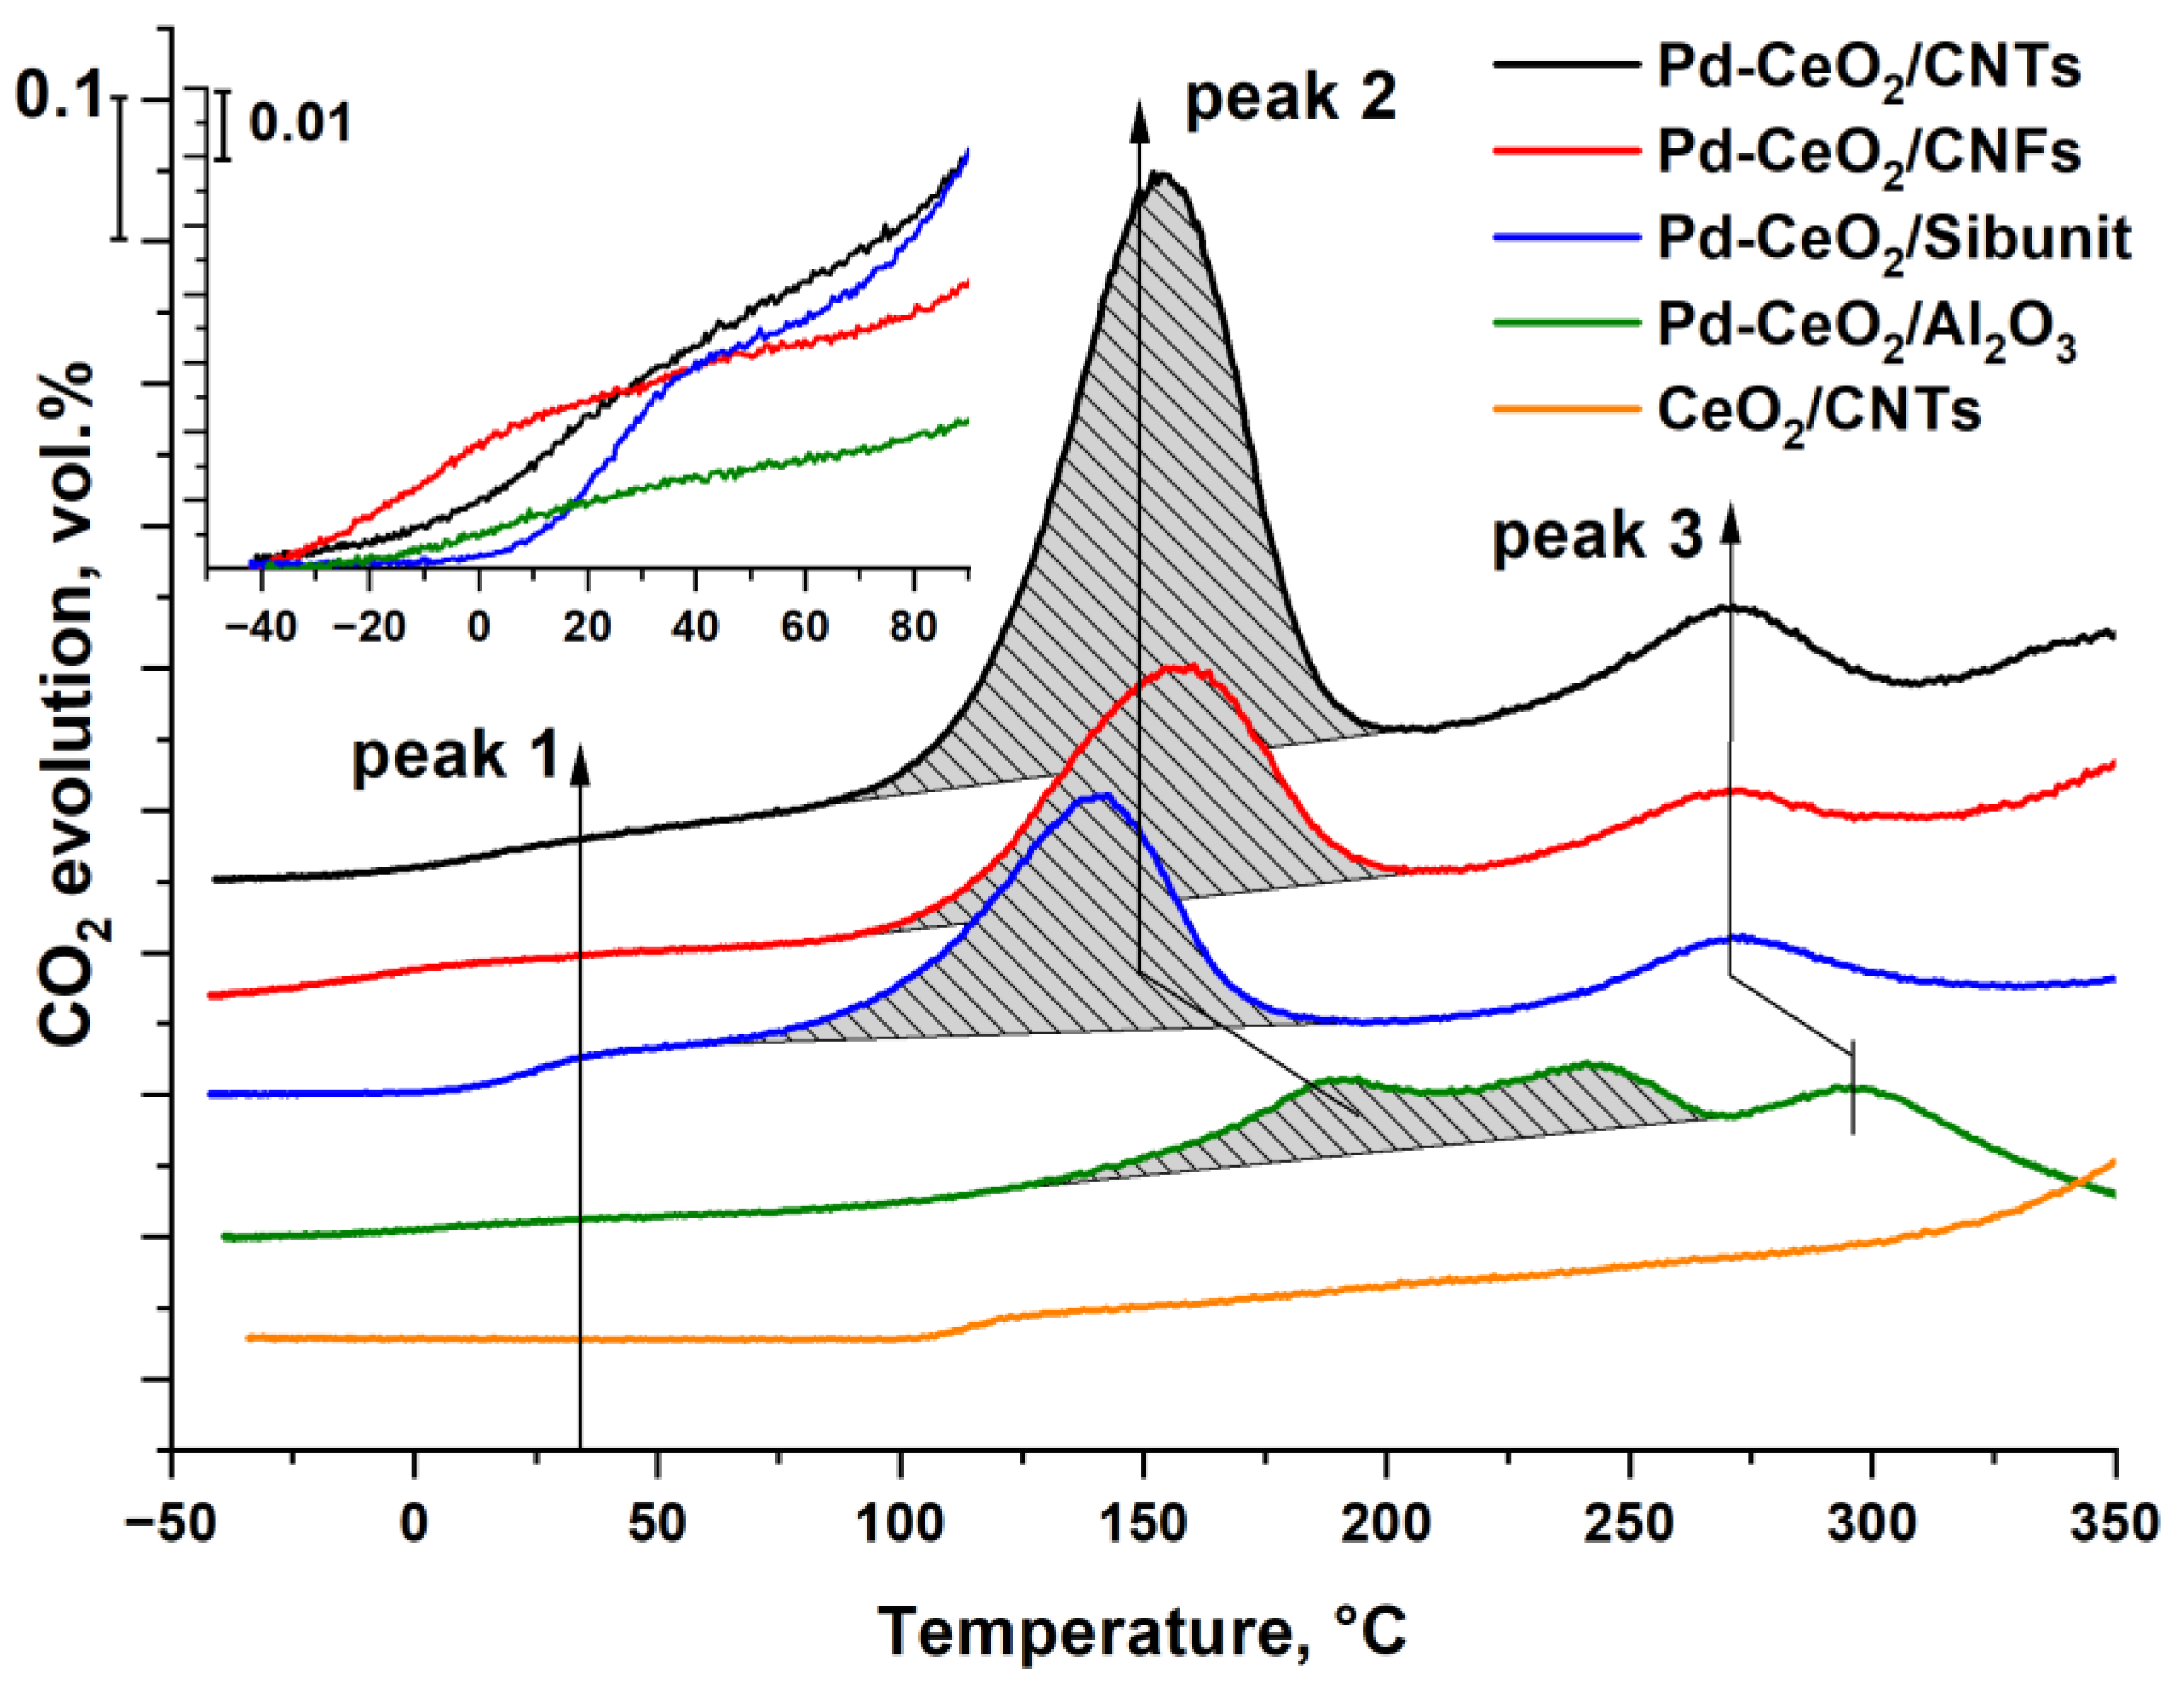
3.5. TPR-CO Data
4. Conclusions
Author Contributions
Funding
Institutional Review Board Statement
Informed Consent Statement
Data Availability Statement
Acknowledgments
Conflicts of Interest
Appendix A


References
- Yao, Y.-F.Y. The Oxidation of CO and Hydrocarbons over Noble Metal Catalysts. J. Catal. 1984, 87, 152–162. [Google Scholar] [CrossRef]
- Farrauto, R.J.; Deeba, M.; Alerasool, S. Gasoline Automobile Catalysis and Its Historical Journey to Cleaner Air. Nat. Catal. 2019, 2, 603–613. [Google Scholar] [CrossRef]
- Al Soubaihi, R.; Saoud, K.; Dutta, J. Critical Review of Low-Temperature CO Oxidation and Hysteresis Phenomenon on Heterogeneous Catalysts. Catalysts 2018, 8, 660. [Google Scholar] [CrossRef] [Green Version]
- Kim, H.J.; Shin, D.; Jeong, H.; Jang, M.G.; Lee, H.; Han, J.W. Design of an Ultrastable and Highly Active Ceria Catalyst for CO Oxidation by Rare-Earth- and Transition-Metal Co-Doping. ACS Catal. 2020, 10, 14877–14886. [Google Scholar] [CrossRef]
- Masui, T.; Ozaki, T.; Machida, K.; Adachi, G. Preparation of Ceria–Zirconia Sub-Catalysts for Automotive Exhaust Cleaning. J. Alloys Compd. 2000, 303–304, 49–55. [Google Scholar] [CrossRef]
- He, H.; Dai, H.; Au, C. Defective Structure, Oxygen Mobility, Oxygen Storage Capacity, and Redox Properties of RE-Based (RE = Ce, Pr) Solid Solutions. Catal. Today 2004, 90, 245–254. [Google Scholar] [CrossRef]
- Luo, M.-F.; Hou, Z.-Y.; Yuan, X.-X.; Zheng, X.-M. Characterization Study of CeO2 Supported Pd Catalyst for Low-Temperature Carbon Monoxide Oxidation. Catal. Lett. 1998, 50, 205–209. [Google Scholar] [CrossRef]
- Boronin, A.I.; Slavinskaya, E.M.; Figueroba, A.; Stadnichenko, A.I.; Kardash, T.Y.; Stonkus, O.A.; Fedorova, E.A.; Muravev, V.V.; Svetlichnyi, V.A.; Bruix, A.; et al. CO Oxidation Activity of Pt/CeO2 Catalysts below 0 °C: Platinum Loading Effects. Appl. Catal. B Environ. 2021, 286, 119931. [Google Scholar] [CrossRef]
- Stonkus, O.A.; Kardash, T.Y.; Slavinskaya, E.M.; Zaikovskii, V.I.; Boronin, A.I. Thermally Induced Structural Evolution of Palladium-Ceria Catalysts. Implication for CO Oxidation. ChemCatChem 2019, 11, 3505–3521. [Google Scholar] [CrossRef]
- Priolkar, K.R.; Bera, P.; Sarode, P.R.; Hegde, M.S.; Emura, S.; Kumashiro, R.; Lalla, N.P. Formation of Ce1−xPdxO2−δ Solid Solution in Combustion-Synthesized Pd/CeO2 Catalyst: XRD, XPS, and EXAFS Investigation. Chem. Mater. 2002, 14, 2120–2128. [Google Scholar] [CrossRef]
- Farrauto, R.J.; Hobson, M.C.; Kennelly, T.; Waterman, E.M. Catalytic Chemistry of Supported Palladium for Combustion of Methane. Appl. Catal. A Gen. 1992, 81, 227–237. [Google Scholar] [CrossRef]
- Colussi, S.; Fornasiero, P.; Trovarelli, A. Structure-Activity Relationship in Pd/CeO2 Methane Oxidation Catalysts. Chin. J. Catal. 2020, 41, 938–950. [Google Scholar] [CrossRef]
- Ciuparu, D.; Lyubovsky, M.R.; Altman, E.; Pfefferle, L.D.; Datye, A. Catalytic Combustion of Methane over Palladium-Based Catalysts. Catal. Rev. 2002, 44, 593–649. [Google Scholar] [CrossRef]
- Farrauto, R.J.; Lampert, J.K.; Hobson, M.C.; Waterman, E.M. Thermal Decomposition and Reformation of PdO Catalysts; Support Effects. Appl. Catal. B Environ. 1995, 6, 263–270. [Google Scholar] [CrossRef]
- Cargnello, M.; Delgado Jaén, J.J.; Hernández Garrido, J.C.; Bakhmutsky, K.; Montini, T.; Calvino Gámez, J.J.; Gorte, R.J.; Fornasiero, P. Exceptional Activity for Methane Combustion over Modular Pd@CeO2 Subunits on Functionalized Al2O3. Science 2012, 337, 713–717. [Google Scholar] [CrossRef]
- Danielis, M.; Colussi, S.; de Leitenburg, C.; Soler, L.; Llorca, J.; Trovarelli, A. Outstanding Methane Oxidation Performance of Palladium-Embedded Ceria Catalysts Prepared by a One-Step Dry Ball-Milling Method. Angew. Chem. Int. Ed. 2018, 57, 10212–10216. [Google Scholar] [CrossRef]
- Vlaic, G.; Di Monte, R.; Fornasiero, P.; Fonda, E.; Kašpar, J.; Graziani, M. Redox Property–Local Structure Relationships in the Rh-Loaded CeO2–ZrO2 Mixed Oxides. J. Catal. 1999, 182, 378–389. [Google Scholar] [CrossRef]
- Heck, R.M.; Farrauto, R.J.; Gulati, S.T.; Ronald, M.; Heck, R.J.; Farrauto, S.T.G. Catalytic Air Pollution Control; John Wiley & Sons, Inc.: Hoboken, NJ, USA, 2009; Volume 5, ISBN 9780470275030. [Google Scholar]
- Heck, R.M.; Farrauto, R.J. Automobile Exhaust Catalysts. Appl. Catal. A Gen. 2001, 221, 443–457. [Google Scholar] [CrossRef]
- Serp, P.; Machado, B. Carbon (Nano)Materials for Catalysis. In Nanostructured Carbon Materials for Catalysis; The Royal Society of Chemistry: London, UK, 2015; pp. 1–45. [Google Scholar]
- Melchionna, M.; Marchesan, S.; Prato, M.; Fornasiero, P. Carbon Nanotubes and Catalysis: The Many Facets of a Successful Marriage. Catal. Sci. Technol. 2015, 5, 3859–3875. [Google Scholar] [CrossRef] [Green Version]
- Mironenko, R.M.; Belskaya, O.B.; Likholobov, V.A. Synthesis of Pd/C Catalysts: Approaches to Regulating the Structure of Active Sites toward Achieving High Selectivity in Hydrogenation of Organic Compounds. Russ. J. Gen. Chem. 2020, 90, 532–549. [Google Scholar] [CrossRef]
- Kibis, L.; Zadesenets, A.; Garkul, I.; Korobova, A.; Kardash, T.; Slavinskaya, E.; Stonkus, O.; Korenev, S.; Podyacheva, O.; Boronin, A. Pd-Ce-Ox/MWCNTs and Pt-Ce-Ox/MWCNTs Composite Materials: Morphology, Microstructure, and Catalytic Properties. Materials 2022, 15, 7485. [Google Scholar] [CrossRef] [PubMed]
- Kibis, L.S.; Korobova, A.N.; Zadesenets, A.V.; Romanenko, A.V.; Kardash, T.Y.; Stonkus, O.A.; Korenev, S.V.; Podyacheva, O.Y.; Slavinskaya, E.M.; Boronin, A.I. Catalysts for Low-Temperature CO Oxidation Based on Platinum, CeO2, and Carbon Nanotubes. Dokl. Phys. Chem. 2022, 505, 115–121. [Google Scholar] [CrossRef]
- Kibis, L.S.; Korobova, A.N.; Fedorova, E.A.; Kardash, T.Y.; Zadesenets, A.V.; Korenev, S.V.; Stonkus, O.A.; Slavinskaya, E.M.; Podyacheva, O.Y.; Boronin, A.I. Application of N-Doped Carbon Nanotubes for the Preparation of Highly Dispersed PdO–CeO2 Composite Catalysts. J. Struct. Chem. 2022, 63, 407–422. [Google Scholar] [CrossRef]
- Kibis, L.S.; Zadesenets, A.V.; Garkul, I.A.; Korobova, A.N.; Kardash, T.Y.; Fedorova, E.A.; Slavinskaya, E.M.; Stonkus, O.A.; Korenev, S.V.; Podyacheva, O.Y.; et al. Pd-Ce-Ox Species on MWCNTs Surface: Probing the Structure-Activity Correlation in Low-Temperature CO Oxidation. Appl. Surf. Sci. 2023, 611, 155750. [Google Scholar] [CrossRef]
- Gawande, M.B.; Fornasiero, P.; Zbořil, R. Carbon-Based Single-Atom Catalysts for Advanced Applications. ACS Catal. 2020, 10, 2231–2259. [Google Scholar] [CrossRef]
- Machado, B.F.; Oubenali, M.; Rosa Axet, M.; Trang NGuyen, T.; Tunckol, M.; Girleanu, M.; Ersen, O.; Gerber, I.C.; Serp, P. Understanding the Surface Chemistry of Carbon Nanotubes: Toward a Rational Design of Ru Nanocatalysts. J. Catal. 2014, 309, 185–198. [Google Scholar] [CrossRef] [Green Version]
- Likholobov, V.A.; Fenelonov, V.B.; Okkel, L.G.; Goncharova, O.V.; Avdeeva, L.B.; Zaikovskii, V.I.; Kuvshinov, G.G.; Semikolenov, V.A.; Duplyakin, V.K.; Baklanova, O.N.; et al. New Carbon-Carbonaceous Composites for Catalysis and Adsorption. React. Kinet. Catal. Lett. 1995, 54, 381–411. [Google Scholar] [CrossRef]
- Podyacheva, O.Y.; Simonov, P.A.; Yashnik, S.A.; Kvon, R.I.; Stonkus, O.A.; Sobolev, V.I.; Khairulin, S.R.; Bukhtiyarov, V.I. Concurrent Anchoring of Au NPs and Amine Groups under the Decomposition of Supported L-Arginine-Au(III) Complexes:A Simple Way to Active Au/C Catalyst for Pure Hydrogen Production. ChemistrySelect 2022, 7, e202201110. [Google Scholar] [CrossRef]
- Surovikin, V.F.; Plaxin, G.V.; Semikolenov, V.A.; Likholobov, V.A.; Tiunova, I.J. Porous Carbonaceous Material. U.S. Patent 4,978,649, 18 December 1990. [Google Scholar]
- Khranenko, S.P.; Baidina, I.A.; Gromilov, S.A. Crystal Structure Refinement for Trans-[Pd(NO3)2(H2O)2]. J. Struct. Chem. 2007, 48, 1152–1155. [Google Scholar] [CrossRef]
- Moulder, J.; Stickle, W.; Sobol, W.; Bomben, K.D. Handbook of X-ray Photoelectron Spectroscopy; Perkin-Elmer Corp.: Eden Prairie, MN, USA, 1992. [Google Scholar]
- Romeo, M.; Bak, K.; El Fallah, J.; Le Normand, F.; Hilaire, L. XPS Study of the Reduction of Cerium Dioxide. Surf. Interface Anal. 1993, 20, 508–512. [Google Scholar] [CrossRef]
- Hiley, C.I.; Fisher, J.M.; Thompsett, D.; Kashtiban, R.J.; Sloan, J.; Walton, R.I. Incorporation of Square-Planar Pd2+ in Fluorite CeO2: Hydrothermal Preparation, Local Structure, Redox Properties and Stability. J. Mater. Chem. A 2015, 3, 13072–13079. [Google Scholar] [CrossRef] [Green Version]
- Gulyaev, R.V.; Kardash, T.Y.; Malykhin, S.E.; Stonkus, O.A.; Ivanova, A.S.; Boronin, A.I. The Local Structure of PdxCe1−xO2−x−δ Solid Solutions. Phys. Chem. Chem. Phys. 2014, 16, 13523–13539. [Google Scholar] [CrossRef] [PubMed]
- Chizari, K.; Janowska, I.; Houllé, M.; Florea, I.; Ersen, O.; Romero, T.; Bernhardt, P.; Ledoux, M.J.; Pham-Huu, C. Tuning of Nitrogen-Doped Carbon Nanotubes as Catalyst Support for Liquid-Phase Reaction. Appl. Catal. A Gen. 2010, 380, 72–80. [Google Scholar] [CrossRef]
- Ersen, O.; Werckmann, J.; Houllé, M.; Ledoux, M.-J.; Pham-Huu, C. 3D Electron Microscopy Study of Metal Particles inside Multiwalled Carbon Nanotubes. Nano Lett. 2007, 7, 1898–1907. [Google Scholar] [CrossRef] [PubMed]
- Pillo, T.; Zimmermann, R.; Steiner, P.; Hüfner, S. The Electronic Structure of PdO Found by Photoemission (UPS and XPS) and Inverse Photoemission (BIS). J. Phys. Condens. Matter 1997, 9, 3987–3999. [Google Scholar] [CrossRef]
- Kibis, L.S.; Titkov, A.I.; Stadnichenko, A.I.; Koscheev, S.V.; Boronin, A.I. X-ray Photoelectron Spectroscopy Study of Pd Oxidation by RF Discharge in Oxygen. Appl. Surf. Sci. 2009, 255, 9248–9254. [Google Scholar] [CrossRef]
- Brun, M.; Berthet, A.; Bertolini, J.C. XPS, AES and Auger Parameter of Pd and PdO. J. Electron Spectrosc. Relat. Phenom. 1999, 104, 55–60. [Google Scholar] [CrossRef]
- Xia, Y.; Ye, J.; Cheng, D.G.; Chen, F.; Zhan, X. Identification of a Flattened Pd-Ce Oxide Cluster as a Highly Efficient Catalyst for Low-Temperature CO Oxidation. Catal. Sci. Technol. 2018, 8, 5137–5147. [Google Scholar] [CrossRef]
- Muravev, V.; Simons, J.F.M.; Parastaev, A.; Verheijen, M.A.; Struijs, J.J.C.; Kosinov, N.; Hensen, E.J.M. Operando Spectroscopy Unveils the Catalytic Role of Different Palladium Oxidation States in CO Oxidation on Pd/CeO2 Catalysts. Angew. Chem. Int. Ed. 2022, 61, e202200434. [Google Scholar] [CrossRef]
- Lashina, E.A.; Slavinskaya, E.M.; Boronin, A.I. Low-Temperature Activity of Pd/CeO2 Catalysts: Mechanism of CO Interaction and Mathematical Modelling of TPR-CO Kinetic Data. Chem. Eng. Sci. 2021, 244, 116812. [Google Scholar] [CrossRef]
- Giordano, F.; Trovarelli, A.; De Leitenburg, C.; Giona, M. A Model for the Temperature-Programmed Reduction of Low and High Surface Area Ceria. J. Catal. 2000, 193, 273–282. [Google Scholar] [CrossRef]
- Slavinskaya, E.M.; Kardash, T.Y.; Stonkus, O.A.; Gulyaev, R.V.; Lapin, I.N.; Svetlichnyi, V.A.; Boronin, A.I. Metal–Support Interaction in Pd/CeO2 Model Catalysts for CO Oxidation: From Pulsed Laser-Ablated Nanoparticles to Highly Active State of the Catalyst. Catal. Sci. Technol. 2016, 6, 6650–6666. [Google Scholar] [CrossRef]
- Slavinskaya, E.M.; Gulyaev, R.V.; Zadesenets, A.V.; Stonkus, O.A.; Zaikovskii, V.I.; Shubin, Y.V.; Korenev, S.V.; Boronin, A.I. Low-Temperature CO Oxidation by Pd/CeO2 Catalysts Synthesized Using the Coprecipitation Method. Appl. Catal. B Environ. 2015, 166–167, 91–103. [Google Scholar] [CrossRef]
- Slavinskaya, E.M.; Zadesenets, A.V.; Stonkus, O.A.; Stadnichenko, A.I.; Shchukarev, A.V.; Shubin, Y.V.; Korenev, S.V.; Boronin, A.I. Thermal Activation of Pd/CeO2-SnO2 Catalysts for Low-Temperature CO Oxidation. Appl. Catal. B Environ. 2020, 277, 119275. [Google Scholar] [CrossRef]


| Support | SBET, m2/g | Vpore, cm3/g | Vmicro, cm3/g | Dpore, nm |
| CNTs | 179 | 1.29 | 0 | 29 |
| CNFs | 197 | 0.45 | 0 | 9 |
| Sibunit | 313 | 0.44 | 0.01 | 6 |
| Al2O3 | 166 | 0.45 | 0 | 11 |
| Sample | CeO2 Parameters | PdO Parameters | |||
|---|---|---|---|---|---|
| а, Å | D, nm | e0 | D, nm | e0 | |
| Pd-CeO2/CNTs | 5.411(1) | 4(1) | 0.18(3) | 12(2) | 0.34(3) |
| Pd-CeO2/CNFs | 5.414(3) | 2.7(3) | 0.16(4) | 6(1) | 0.1(2) |
| Pd-CeO2/Sibunit | 5.40(1) | 2.4(3) | 0.10(3) | 6(1) | 0.12(4) |
| Pd-CeO2/Al2O3 | 5.41(1) | 7(1) | 0.3(1) | ≈3 * | - |
| Sample | Pd, at% | Ce, at% | Eb(Pd3d5/2), eV | Се3+, % |
|---|---|---|---|---|
| Pd-CeO2/CNTs | 0.85 | 3.5 | 337.2 | 19 |
| Pd-CeO2/CNFs | 1.1 | 3.8 | 337.4 | 20 |
| Pd-CeO2/Sibunit | 1.0 | 3.6 | 337.3 | 23 |
| Pd-CeO2/Al2O3 | 0.5 | 2.8 | 337.1 | 15 |
| Sample | CO Oxidation | CH4 Oxidation | ||
|---|---|---|---|---|
| T10, °C | T50, °C | T90, °C | T10, °C | |
| Pd-CeO2/CNTs | 14 | 78 | 115 | 235 |
| Pd-CeO2/CNFs | 20 | 78 | 121 | 265 |
| Pd-CeO2/Sibunit | 14 | 78 | 138 | 235 |
| Pd-CeO2/Al2O3 | 51 | 145 | 220 | 280 |
| Catalyst | T2,°C | T3,°C | CO2-2, μmol/g | CO2-2/Pd | CO2-Σ, μmol/g |
|---|---|---|---|---|---|
| Pd-CeO2/CNTs | 152 | 268 | 722 | 1.28 | 2090 |
| Pd-CeO2/CNFs | 153 | 264 | 322 | 0.57 | 1450 |
| Pd-CeO2/Sibunit | 138 | 270 | 315 | 0.56 | 1090 |
| Pd-CeO2/Al2O3 | 190, 225 | 285 | 170 | 0.30 | 928 |
Disclaimer/Publisher’s Note: The statements, opinions and data contained in all publications are solely those of the individual author(s) and contributor(s) and not of MDPI and/or the editor(s). MDPI and/or the editor(s) disclaim responsibility for any injury to people or property resulting from any ideas, methods, instructions or products referred to in the content. |
© 2023 by the authors. Licensee MDPI, Basel, Switzerland. This article is an open access article distributed under the terms and conditions of the Creative Commons Attribution (CC BY) license (https://creativecommons.org/licenses/by/4.0/).
Share and Cite
Stonkus, O.; Kibis, L.; Slavinskaya, E.; Zadesenets, A.; Garkul, I.; Kardash, T.; Stadnichenko, A.; Korenev, S.; Podyacheva, O.; Boronin, A. Pd-Ceria/CNMs Composites as Catalysts for CO and CH4 Oxidation. Materials 2023, 16, 4257. https://doi.org/10.3390/ma16124257
Stonkus O, Kibis L, Slavinskaya E, Zadesenets A, Garkul I, Kardash T, Stadnichenko A, Korenev S, Podyacheva O, Boronin A. Pd-Ceria/CNMs Composites as Catalysts for CO and CH4 Oxidation. Materials. 2023; 16(12):4257. https://doi.org/10.3390/ma16124257
Chicago/Turabian StyleStonkus, Olga, Lidiya Kibis, Elena Slavinskaya, Andrey Zadesenets, Ilia Garkul, Tatyana Kardash, Andrey Stadnichenko, Sergey Korenev, Olga Podyacheva, and Andrei Boronin. 2023. "Pd-Ceria/CNMs Composites as Catalysts for CO and CH4 Oxidation" Materials 16, no. 12: 4257. https://doi.org/10.3390/ma16124257