Article

Microbial Parameters as Predictors of Heterotrophic Prokaryotic Production in the Ross Sea Epipelagic Waters (Antarctica) during the Austral Summer

1
Institute for Coastal Marine Environment (CNR-IAMC), National Research Council, Spianata S. Raineri 86, 98122 Messina, Italy
2
Institute of Polar Sciences (CNR-ISP), National Research Council, Spianata S. Raineri 86, 98122 Messina, Italy
3
Department of Earth, Environment and Life Sciences (DISTAV), University of Genoa, Corso Europa 26, 16132 Genoa, Italy
*
Author to whom correspondence should be addressed.
J. Mar. Sci. Eng. 2022, 10(12), 1812; https://doi.org/10.3390/jmse10121812
Submission received: 17 October 2022 / Revised: 8 November 2022 / Accepted: 10 November 2022 / Published: 24 November 2022
(This article belongs to the Special Issue Microbes in Extreme Marine Environments)

Abstract

:
A regression-based approach was used to test the suitability of a range of parameters, including total prokaryotic cell abundance and biomass, as lipopolysaccharide (LPS) content, and exoenzymatic activities (leucine aminopeptidase, LAP, beta-glucosidase, ß-G, and alkaline phosphatase, AP) as predictors of heterotrophic prokaryotic production (HPP) in the Ross Sea epipelagic waters. A close association between HPP and protein hydrolysis mediated by enzymatic activity (LAP), and to a lower significance level with the other variables, was recorded. Three multiple regression equations were developed from two microbial datasets collected during middle austral summer periods. All showed a good predictive ability for HPP, and this was further validated through a comparison between the predicted and the observed HPP values. The obtained regression equations proved to represent a promising example of empirical models for further predictive studies in the Ross Sea where—through the incorporation of additional microbiological and environmental parameters—the developed models could find a practical application to cover the entire austral summer period.

1. Introduction

In aquatic environments, the heterotrophic activity expressed by the microbial assemblage is a dominant energy pathway in the planktonic food web. Prokaryotes are the major players in the production of new living biomass, as well as in the transformation of particulate organic matter (POM) into dissolved organic matter (DOM) and in the mineralization of DOM to CO2 and inorganic nutrients [1]. By means of the bacterial carbon production (now renamed as heterotrophic prokaryotic production (HPP), DOC was assimilated by the prokaryotic assemblage with production of new biomass. The HPP process has a primary importance in understanding the fluxes of carbon and energy in aquatic ecosystems [2]. On the other hand, organic matter hydrolysis by exoenzymatic activities is recognized as an important bottleneck for substrate utilization by microbial assemblage and an important factor controlling the prokaryotic metabolism [3]. Consequently, estimates of potential activity rates may provide important insights on the organic matter flux along the microbial loop, as well as on the quality and quantity of organic polymers available to heterotrophs [4]. The hydrolysis and utilization of complex organic substrates are crucial steps in the use of macromolecules to sustain microbial growth rates [5]. Microorganisms are recognized as major enzyme synthesizers [6,7,8]; the enzymes leucine aminopeptidase (LAP), beta-glucosidase (ß-G), and alkaline phosphatase (AP) play a critical role in the decomposition of proteins, polysaccharides, and organic phosphates, respectively, and modulate the flux of carbon from the biotic to the abiotic domains and the recycling of nutrients [6,7]. Both the processes of organic matter decomposition through enzymatic hydrolysis and the production of new prokaryotic biomass are under environmental control and can influence the ecosystem functioning [6,7,8].
In cold marine environments, during the summer period, the occurrence of active productive (both autotrophic and heterotrophic) processes frequently results in a close association between the hydrolytic activities over the organic polymers, particularly protein decomposition, and picoplankton biomass [9,10]. In extreme environments, the content of lipopolysaccharides (LPS) [11] has been considered as a useful proxy for microbial biomass detection owing to its easy and quick measurement [12,13]. LPS are structural components of the outer membrane characteristic of all Gram-negative bacteria, therefore LPS assay targets all the Gram-negative microorganisms, both heterotrophic and photosynthetic prokaryotes (e.g., sulfur and non-sulfur purple bacteria, green sulfur bacteria, cyanobacteria), but not Archaea.
During the last four decades, in the framework of the Italian National Antarctic Research Program (PNRA), field studies and experimental work have been carried out in the Southern Ocean in order to explore its waters for physical, chemical, and microbiological features. These studies have demonstrated the presence of active bacterial communities with a high metabolic potential [14,15,16,17,18,19,20]. From a microbiological point of view, the coastal areas of the Ross Sea, particularly Victoria Land, represent a very interesting “laboratory” for the study of the water biogeochemistry in terms of carbon, nitrogen, and phosphorus mobilization and recycling mediated by the microbial communities. Besides a complex topography, during the austral summer period it is possible to find the coexistence of a mosaic of habitats differently affected by iceberg disturbance, sea ice cover, light regime, and primary production sources [21,22]. Furthermore, increased melting of sea ice is expected to fuel surface waters with carbohydrate-rich organic polymers, stimulating the activity of specific hydrolytic enzymes [10]. Antarctic coastal ecosystems have perhaps the most extreme seasonality observed anywhere in the world’s oceans [23].
In the Terra Nova Bay (TNB) area, the distribution and composition of suspended particulate matter occurring in the polynya affect the structure and variability of the plankton community and its variability. The succession of blooms (Phaeocystis in early December, small and micro-sized diatoms in early February) and changes in the biomass of small heterotrophs determine important changes in the composition and fate of particulate matter [16]. In a complex planktonic scenario, several processes may regulate the flux of DOC and in turn the distribution patterns of the prokaryotic production, making a correct estimate of the environmental state very difficult. The release of dissolved organic matter (DOM) by coastal diatoms [24] or by planktonic grazers during their sloppy feeding [25], as well as the DOM released during bacterial cell growth and decline [26,27], the phosphate and soluble organic phosphorus compounds excreted by zooplankton [28], or the DOM released during viral lysis [29,30], are some of them.
During austral summer periods, most of the research performed within the PNRA over the last decades in the Ross Sea has focused on the upper layers of the water column (200 m), resulting in the generation of time series of data concerning several microbial parameters (prokaryotic abundance, exoenzymatic activities, HPP) and measurements. During the summer season, productive processes are high at the most surface layers, where nutrients, inorganic, and organic particles are released during sea ice melting, with important consequences for all biological processes [31].
The present study aimed at evaluating the usefulness of prokaryotic parameters such as exoenzymatic activities, cells abundance, and biomass in order to develop a predictive model for epipelagic net HPP. For that purpose, the relationships among prokaryotic parameters, the validity of each one, regression models, and HPP prediction across the water columns of coastal stations in the Ross Sea were considered.

2. Materials and Methods

The field datasets used in this study were obtained from two Italian surveys (2000 and 2004) carried out in coastal areas of the Ross Sea during the austral summer period.

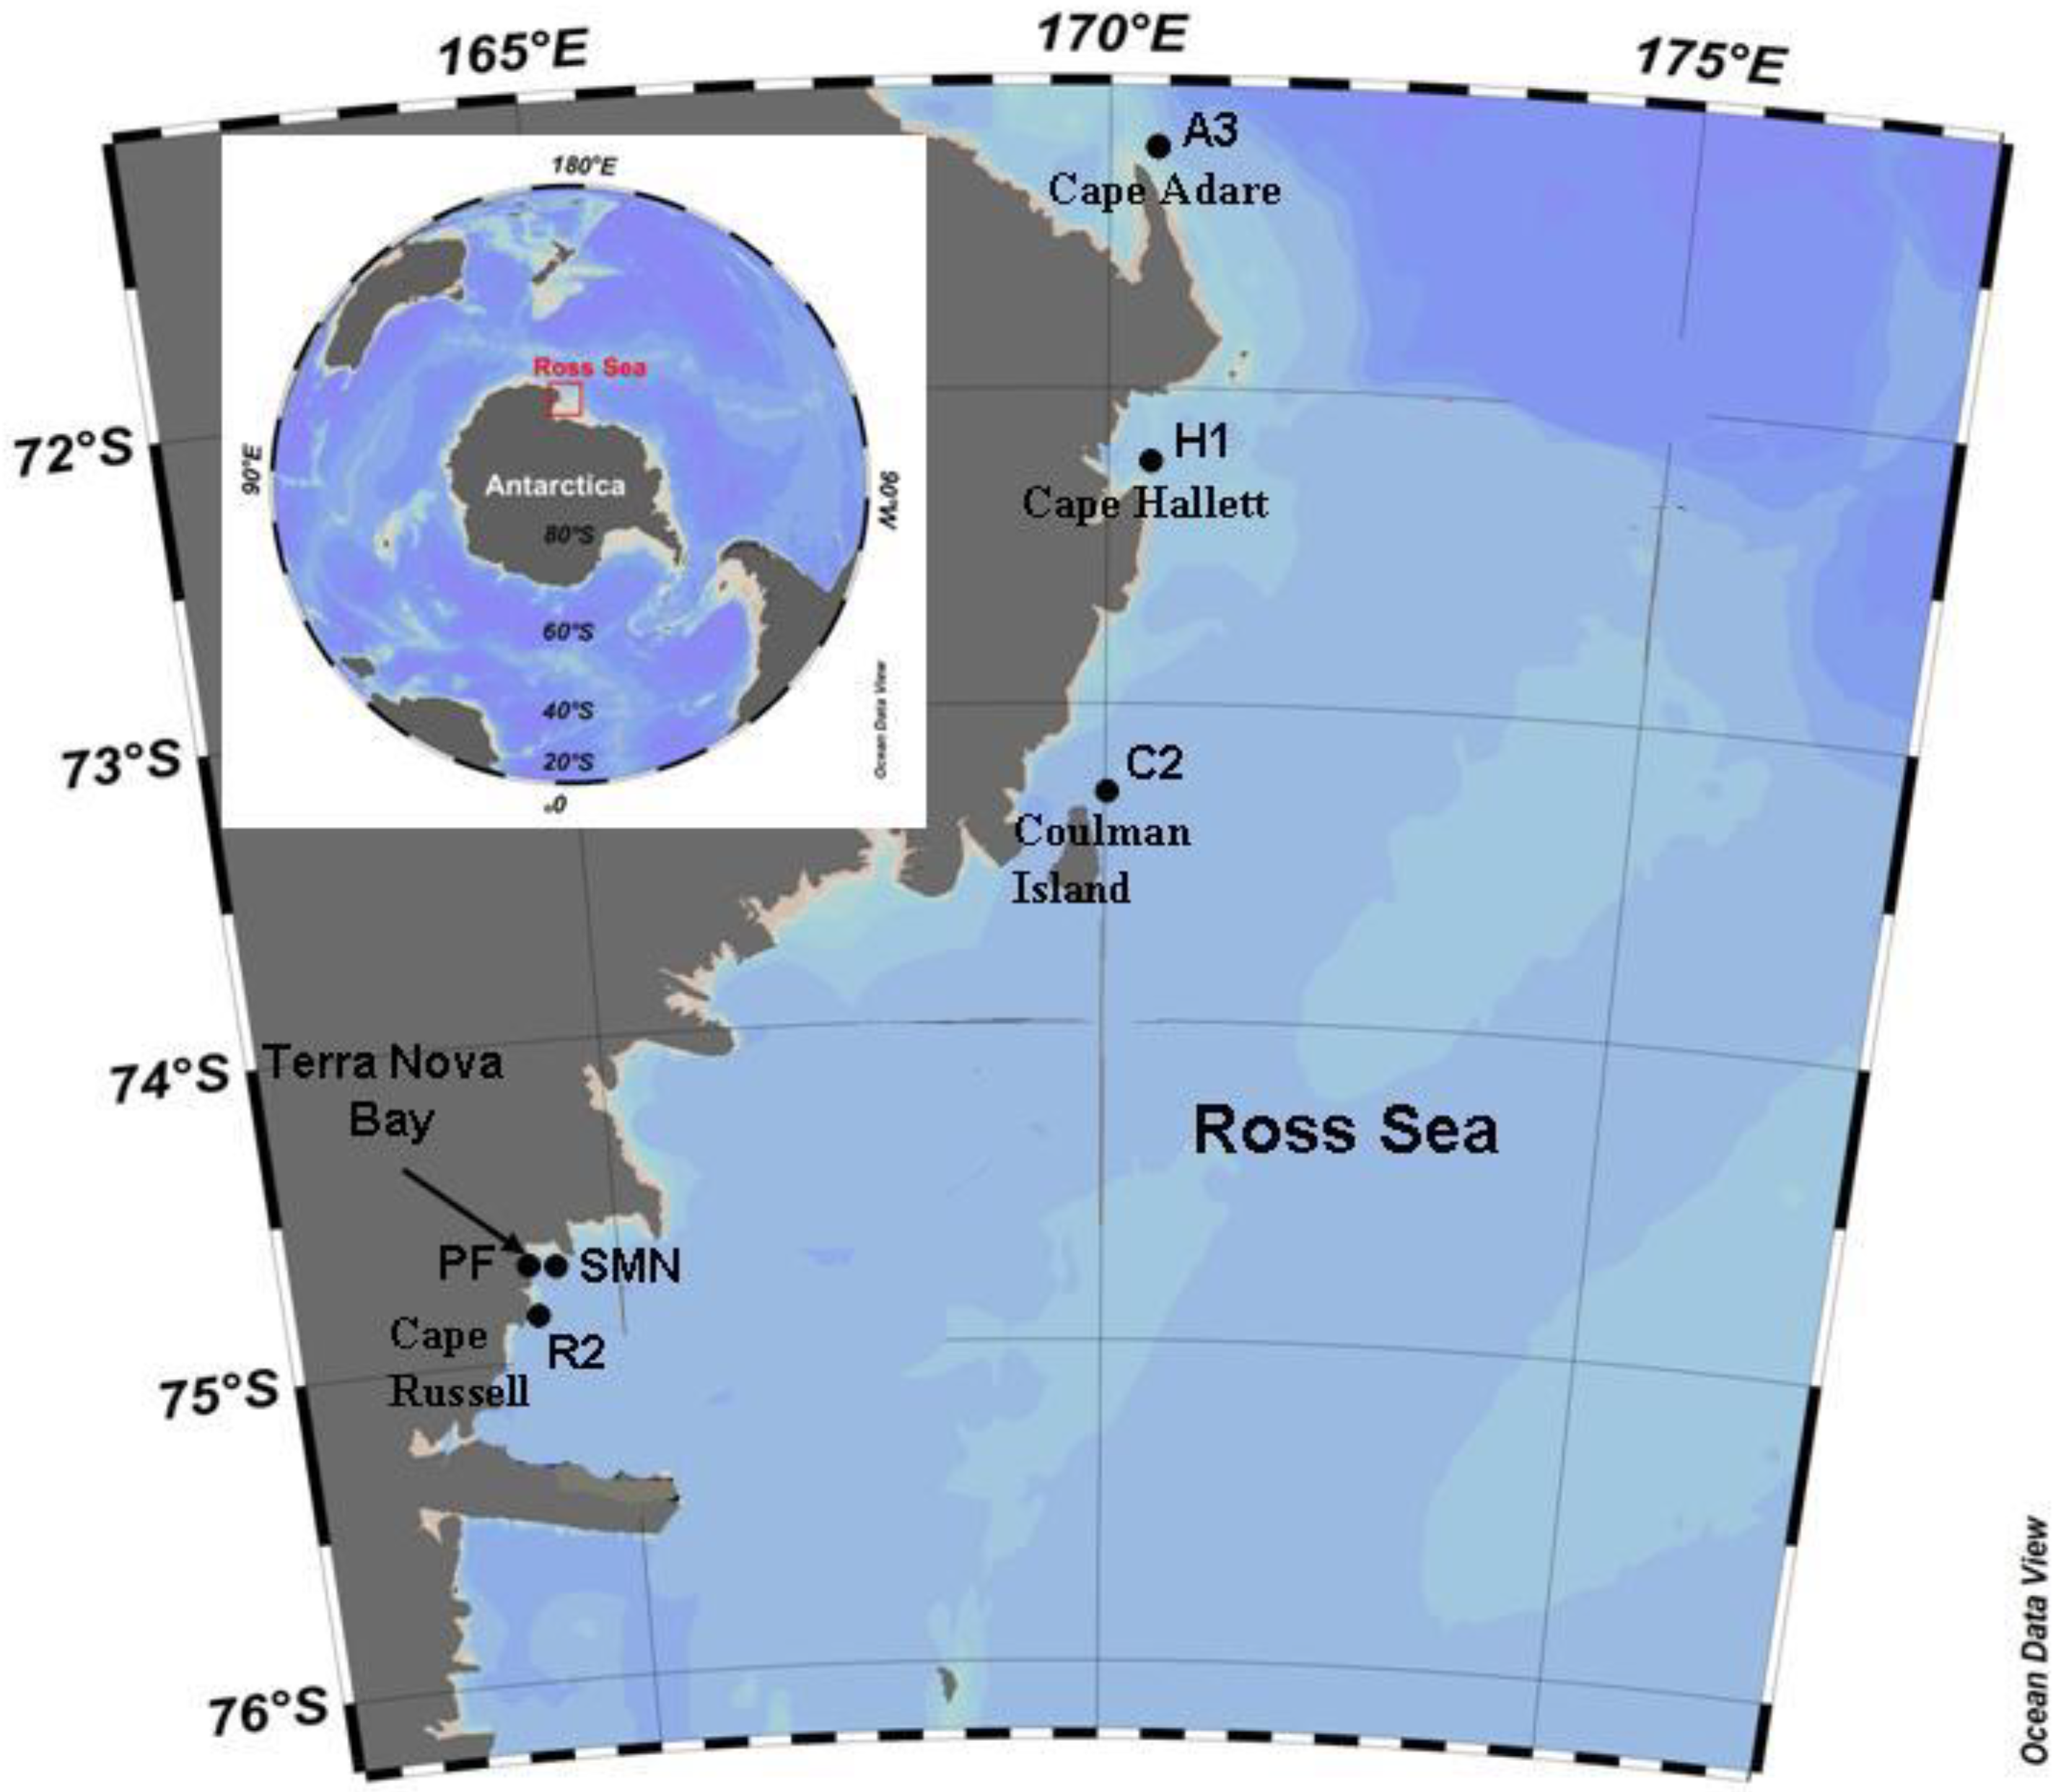
2.1. Study Area and Samplings

Samplings were planned as a part of two projects, carried out in the frame of the XV and XVIII Expeditions of the Italian National Program for Antarctic Research (PNRA). The first dataset analyzed was from the Terra Nova Bay 2000 survey (TNB), performed from 22 January to 10 February, in an area near the Mario Zucchelli Italian Station (MZS) (Lat. 74°41.616′ S, Long. 164°06.702′ E) strongly influenced by the Terra Nova Bay polynya; from this survey, two stations were selected, Portofino (PF, Lat. 74°42.01′ S, Long. 164°9.15′ E) and Santa Maria Novella (SMN, Lat. 74°43′ S, Long. 164°13′ E). The second dataset was from the Victoria Land Transect 2004 survey (VLT), performed on board the polar R/V “Italica” (3–22 February), in coastal areas from Lat. 71°15′ E to Long. 74°50′ E. Four stations were selected, stations A3: Lat. 71°17′ S, Long.170°14′ E; H1: Lat. 72°19′ S, Long. 170°13′ E; C2: Lat. 73°29′ S, Long. 164°45′ E; R2: Lat. 74°54′ S, Long. 163°54′ E. The location of the sampling stations is shown in Figure 1. Detailed information about the sampling station locations, water column characteristics, and microbiological analyses is reported by Monticelli et al. [18] and Povero et al. [32]. Here, the microbiological topics are briefly discussed.

2.2. Heterotrophic Prokaryotic Production (HPP) Measurements

HPP was estimated using the 3H-leucine incorporation method [33] by the centrifugation micro-method of Smith and Azam [34] using 2 mL Eppendorf tubes, triplicate samples, and two killed blanks. Net Prokaryotic carbon biomass production was calculated according to Kirchman [35], assuming no intracellular isotope dilution, applying a theoretical factor of 1.55 Kg C mol leucine−1 [36]. Values were expressed as ng C L−1h−1. Cell-specific activity (csa) was calculated dividing the HPP activity rates by the prokaryotic abundance (cells L−1) and expressed as ag C cell−1h−1.

2.3. Extracellular Enzymatic Activity (EEA) Measurements

The potential extracellular enzymatic activity (EEA) rates were measured immediately after sample collection, according to the Hoppe’s multi-concentration method [3], by using methylumbelliferyl (MUF) substrates (MUF-phosphate and MUF-ß-Glucopyranoside, Sigma Aldrich, St. Louis, MO, USA) for alkaline phosphatase (AP) and β-glucosidase (ß-G) activities, respectively. L-leucine-4 Methyl-7-coumarinylamide (Leu-MCA) (Sigma Aldrich) was the substrate used to measure leucine aminopeptidase activity (LAP). Details about the used protocols are reported in Monticelli et al. [18]. Briefly, increasing concentrations of fluorogenic substrates (standing stocks 5 mM) were added to 10 mL seawater samples to get final concentrations of 10, 25, 50, 100, and 200 nM. Fluorometric readings were performed with a Turner TD 700 fluorometer (Turner Designs, San Jose, CA, USA) using the filters 380–440 nm (excitation–emission wavelengths) for LAP and 350–445 nm for ß-G and AP. After immediate measurements of fluorescence after substrate addition (time 0), readings were repeated 3 h after incubation at in situ temperature. Known MUF and MCA concentrations (from 10 to 200 nM) were used to build a standard curve and convert the increase in fluorescence into the hydrolysis velocity, reported as Vmax. Results were expressed as nM of hydrolyzed substrate h−1, LAPcsa, ß-Gcsa, and APcsa as amol cell−1h−1.

2.4. Total Pico Plankton (TPP) Cell Counts

Eubacteria + Archaea direct counts were determined by epifluorescence microscopy after staining with 4′,6-Diamidino−2-Phenylindole and Dihydrochloride (DAPI, 2% final concentration, Merck Life, Milan, Italy) according to Porter and Feig [37].

2.5. Lipopolysaccharides (LPS) Quantitative Determinations

The determination of total (dissolved plus particulate) LPS as an indicator of Gram-negative biomass was estimated according to Watson and Hobbie [38]. Subsamples (1 mL) for LPS quantification were stored in pyrogen-free vials at −20 °C until analysis, performed in Italy. The Quantitative Chromogenic LAL test (QCL-1000, Bio Whittaker, Inc., Walkersville, MD, USA) was used for LPS determinations, following the producer instructions. Each sample was gently mixed with the Limulus amebocyte lysate (LAL) and incubated at 37 °C for 10 min. The subsequent addition of the chromogenic reagent was followed by a further incubation for 6 min; the reaction was stopped by adding 100 µL acetic acid (final concentration 25%). The color change from white to yellow indicated the concentration of LPS in the sample. The absorbance of the test tube was measured at 405 nm using a microtiter ELX−808 spectrophotometer (Bio Whittaker, Inc.) equipped with an Automatic Microplate Reader (for 96 microtiters) controlled by the specific software WIN-KQCL (Bio Whittaker, Inc.). The LPS concentration in each sample was expressed as ng LPS L−1 and LPScsa as ag cell−1.

2.6. Statistical Analysis

Descriptive statistics, normality tests, correlations, and regressions were performed using the Minitab Statistical Software (Release 17 for Windows, State College, Pennsylvania) [39]. In particular, in the regression study, the microbiological parameters TPP, LPS, LAP, AP, and ß-G were considered as free predictors versus HPP (response). The adopted principle was to achieve a predictive equation (multiple regression model) using the lowest number of predictors associated with the highest coefficient of determination-CD (R-sq). CD was adjusted according to the number of predictors in the model (R-sq adj) and R square was predicted (R-sq pred) to indicate how well the model predicts responses for new observations.
Other considered parameters were the optimal goodness of prediction according to the Mallows’ Cp coefficient, where a small Cp value indicates a small variance, namely that the model is relatively precise in estimating the true regression coefficients and predicting future responses; the standard error of coefficients (SE) and of the regression (S); the variance inflation factor (VIF) indicates the extent to which multi-collinearity is present in the regression analysis (VIF = 1: whether predictors are not correlated, 1 < VIF < 5: whether they are moderately correlated, VIF > 5 to 10: whether predictors are highly correlated, VIF > 10: indicate that multi-collinearity is inappropriately influencing the regression results), and the prediction sum of squares (PRESS) to assess the predictive ability of the model (in general, a smaller PRESS value supports the best model’s predictive ability). To choose the best subsets of predictors, a level of significance p = 0.05 was used. Post-regression tests using Mann–Whitney pairwise comparisons between the observed and the predicted HPP values were carried out.

3. Results

3.1. Microbiological and Environmental Characteristics

The mean values and the ranges of microbiological parameters recorded during each survey are summarized in Table 1. During the TNB survey in the post-bloom period sampled in an area adjacent to the MZ Station, all hydrolytic activities, prokaryotic standing stock, and biomass were relatively high, with mean values 1–2 orders of magnitude higher than those measured in the VLT survey. The mean and extreme values of HPP were significantly higher also. The maximum values of HPP (282.79 ng C L−1 h−1) and LAP (733.05 nM h−1), and their mean values, were exceptionally high in Antarctic waters. Many ice-covered stations were sampled during the VLT survey; under these conditions, the photosynthetic production of biopolymers, as well as the hydrolytic activities and cell standing stock, were low.
Prior the regression analysis the multiple correlations between the logarithmic-transformed values of the microbiological parameters, particularly between HPP and other parameters, Spearman’s rho correlation coefficients were calculated (Table 2). The highest correlation was observed between Log 10 HPP and Log 10 LAP activity (0.848 and 0.853 in TNB and VLT surveys, respectively, as reported in the matrices A and B), which was reflected in the total dataset (matrix C, rho = 0.826) and in the csa values (matrix D, rho = 0.828).
From the total dataset (Table 2, matrix C), the level of relative correlation of HPP with the other microbiological parameters was in the order LAP (0.826) > AP(0.499) > LPS (0.450) > TPP(0.329)~ß-G (0.331). When considering cell-specific activity (matrix D) it was in the order LAPcsa (0.828) > LPScsa (0.588) > APcsa (0.542) > ß-Gcsa (0.441), again showing the highest correlation of HPPcsa with LAPcsa and increased correlations with LPScsa and APcsa. LAPcsa was shown to be the best predictor parameter, followed by LPScsa and APcsa. Cell-specific rates of hydrolytic activities revealed higher LAP values in the TNB area (mean LAPcsa = 11.84 amolcell−1h−1) than in the VLT area (mean LAPcsa = 0.209 amol cell−1h−1); LPScsa was also six times higher in TNB area than in VLT (mean = 9.26 ag cell−1).

3.2. Regression Analysis

A first hypothesis to be verified was if the predictive model, generated from the dataset of the TNB survey 2000, was suitable for the dataset obtained from the VLT survey 2004. Unfortunately, this test was unsuccessful due to very high values of residuals (i.e., the differences between the observed and the predicted data). Actually, although both surveys were performed in late summer periods, and the range of water depths was the same (0–100 m), the sampled areas were different, as shown by the different ranges of the values measured for the predictor parameters (Table 1). Furthermore, a possible influence of autotrophic organisms, such as phytoplankton (as a potential producer of AP) and cyanobacteria (as potential producers of LAP), both actively involved in the enzyme synthesis within the photic zone, could partially explain this failure. Consequently, the model produced from one dataset did not fit well within the range of the predictors’ values of the other dataset and therefore it did not meet the general condition of being suitable for the total dataset; for these reasons, a total dataset of predictors from both surveys was necessarily built.
A second screening was carried out using all the predictors, which were significantly correlated with HPP (Table 2, C, D). According to the highest correlation values observed among all the microbiological parameters, the predictive equation was built considering only the heterotrophic activity in terms of csa.
From the total dataset (TDS), the best subsets of regression HPP (Y) versus LPS, ß-G, AP, LPS, and TPP (variables-vars) were calculated. For confirmation, an analysis was carried out with their original values (see Table 1) and after with csa values and Log 10 (L) transformed values. The accuracy and goodness of each single variable (var) and of a group of vars to yield a regression equation were evaluated analyzing the coefficients of determination (R-sq, R-sq adj, and R-sq-pred), the prediction sum of squares (PRESS), the goodness of prediction (Mallows Cp), and the error standard of the regression (S) (see Materials and Methods).
The best results were obtained expressing the vars as Logarithmic-transformed, cell-specific activities (L-csa). At the top of Table 3, the statistics of each single var and the best combination of vars (from 2 to 5) are reported. When single vars were considered, LAP showed to be the best var (R-sq pred = 59.9%), followed by ß-G (R-sq pred = 29.2%), AP, LPS and TPP (R-sq pred = 1.5%). According to Mallows’ Cp, the regression models using a single predictor resulted in very imprecise predictive responses; with two or more vars as predictors, the precision of the models was significantly increased, giving higher CD and lower PRESS, Mallows Cp and S.
For the Model Building Sequence and Optimize Response steps, three vars (LAP, ß-G, and LPS) were selected as potential predictors of HPP. ß-G was not considered due to its negligible contribution to the regression model. To reduce the multi-collinearity, logarithmic-transformed-LAP and logarithmic-transformed-LPS were used as predictors, and the statistic of the regression model from total dataset (TDS-RE) is shown at the top of Table 4. Their main features were R-sq = 97.23%, R-sq pred = 97.16%, low S, and moderate multi-collinearity (VIF = 5.2) values, which were compatible with a good predictive equation.
In the equation building process, seven predictor values (four responsible of large residuals and three of unusual values) were removed from the total dataset (plots not shown).
From the highest correlations observed between HPP and LAP (Table 2), a simple scatter plot between these two parameters was produced. The general trend was that the dataset points were arranged following a linear distribution. In detail, in correspondence with low LAP values (<50 nM h−1), the respective “cloud” of points were fitted on an axis different from the axis of the main regression line. This is also shown in Figure 2.
Particularly, LAP activity values > 50 nM h−1 were recorded in seawater collected from 0–50 m depth of the TNB area only, while lower values (LAP ≤ 50 nM h−1) were detected below 50 m in the TNB area and in all the VLT area. Consequently, two datasets were re-arranged, one corresponding to LAP values ≤50 nM h−1 and the other to LAP values >50 nM h−1, which were used to build two multiple regression equations. Therefore, simple regressions HPP versus LAP were computed from each dataset and their respective equations showed different slopes and intercepts [Log (HPPcsa) = 1.372 + 1.230 Log (LAPcsa) ≤ 50 nM h−1; Log (HPPcsa) = 27.78 + 0.195 Log (LAPcsa) > 50 nM h−1].
From the LAP ≤ 50 nM h−1 dataset (≤50 DS), the respective exploratory best subsets regression analysis is detailed in the middle part of Table 3. As observed from the total dataset analysis, the best single var was LAP (R-sq = 67.8%), followed by LPS (R-sq = 29.0%), ß-G, and AP (R-sq = 25.3%). Single var regression models were imprecise, as shown by high Mallows Cp and S; better results were obtained simultaneously using two or more vars as predictors. The three vars selected to optimize the regression analysis were the three enzymatic activities expressed as Log-transformed cell-specific activities (L-csa) (R-sq = 71.2%, PRESS 9.2, Mallows Cp = 7.9, and S = 0.3155). The regression equation (≤ 50 DS-RE), that is shown in the middle of Table 4 was characterized by discrete values of SE, high R-sq (80.73%), and R-sq pred (79.17%), and very low levels of multi-collinearity (VIF = 1.28). As found from TDS-RE optimization step, β-G gave a negligible contribution to the regression model. Consequently only two predictors (LAPcsa and LPScsa) were considered, and four vars were excluded, as they were responsible for large residuals.
From the LAP > 50 nM h−1 dataset (>50 DS), the respective exploratory best subsets regression analysis, detailed at the bottom of Table 3, was markedly different from the other two exploratory analyses. The best single var was LPS (R-sq = 81.5%), followed by LAP (R-sq = 73.9%), AP, and β-G (R-sq = 62.8%). In general terms, LPS increased its value as predictor, while two enzymatic activities (AP and ß-G) did not. Better results were obtained using two or more vars as predictors simultaneously, which resulted in increased R-sq, R-sq pred, and precision, as shown by low Mallows Cp and PRESS values. To model the regression analysis, logarithmic-transformed cell-specific LAPcsa and LPScsa were selected, and the statistic of this test is shown at the bottom of Table 4. Conversely, TPP was not considered as an X variable of the regression equation; indeed, using cell-specific variables there was an autocorrelation, as HPPcsa was calculated by dividing HPP by TPP.

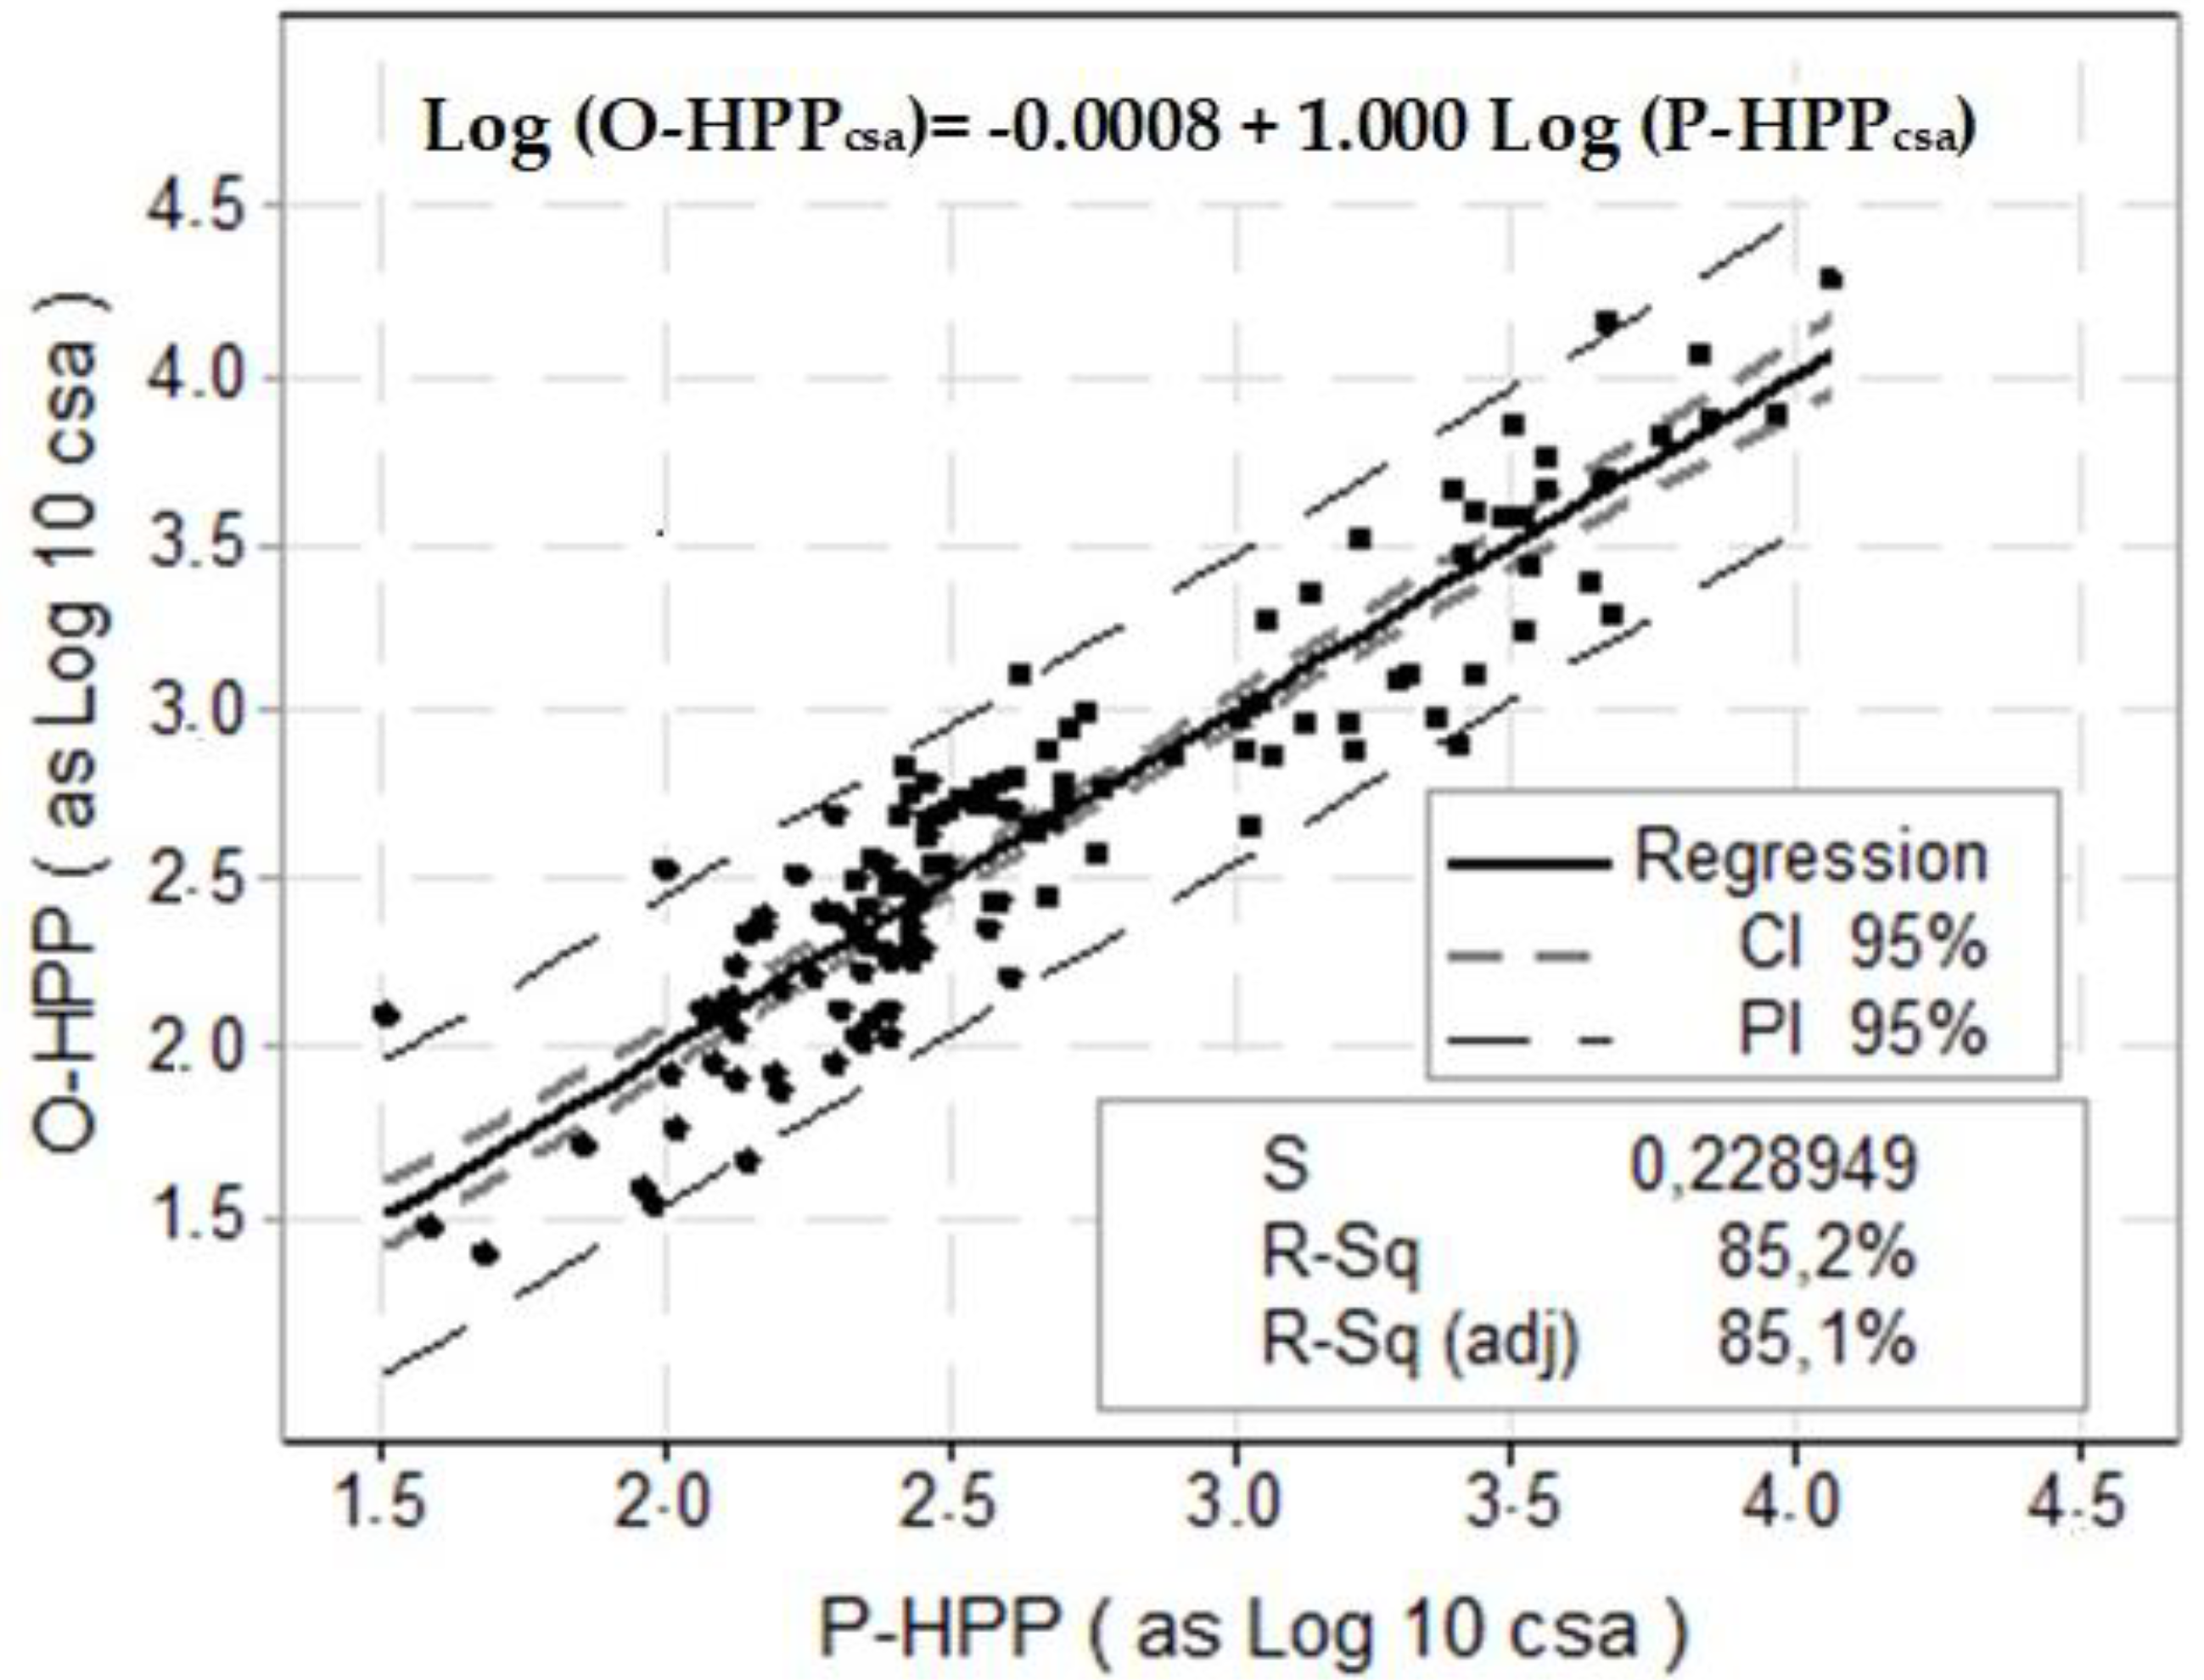
3.3. Observed and Predicted HPP Values

Using the regression equation TDS-RE, the predicted HPP (P-HPP) values, as Logarithmic-transformed, cell-specific-HPP values (HPPcsa), were calculated and plotted versus the observed HPP (O-HPP) (Figure 2). A simple regression analysis was performed employing P-HPP as a dependent variable, and yielded a regression equation with slope 1 and intercept close to zero. Values located outside the prediction intervals (PI, indicated with a dashed line) correspond to anomalous values responsible for large residuals.

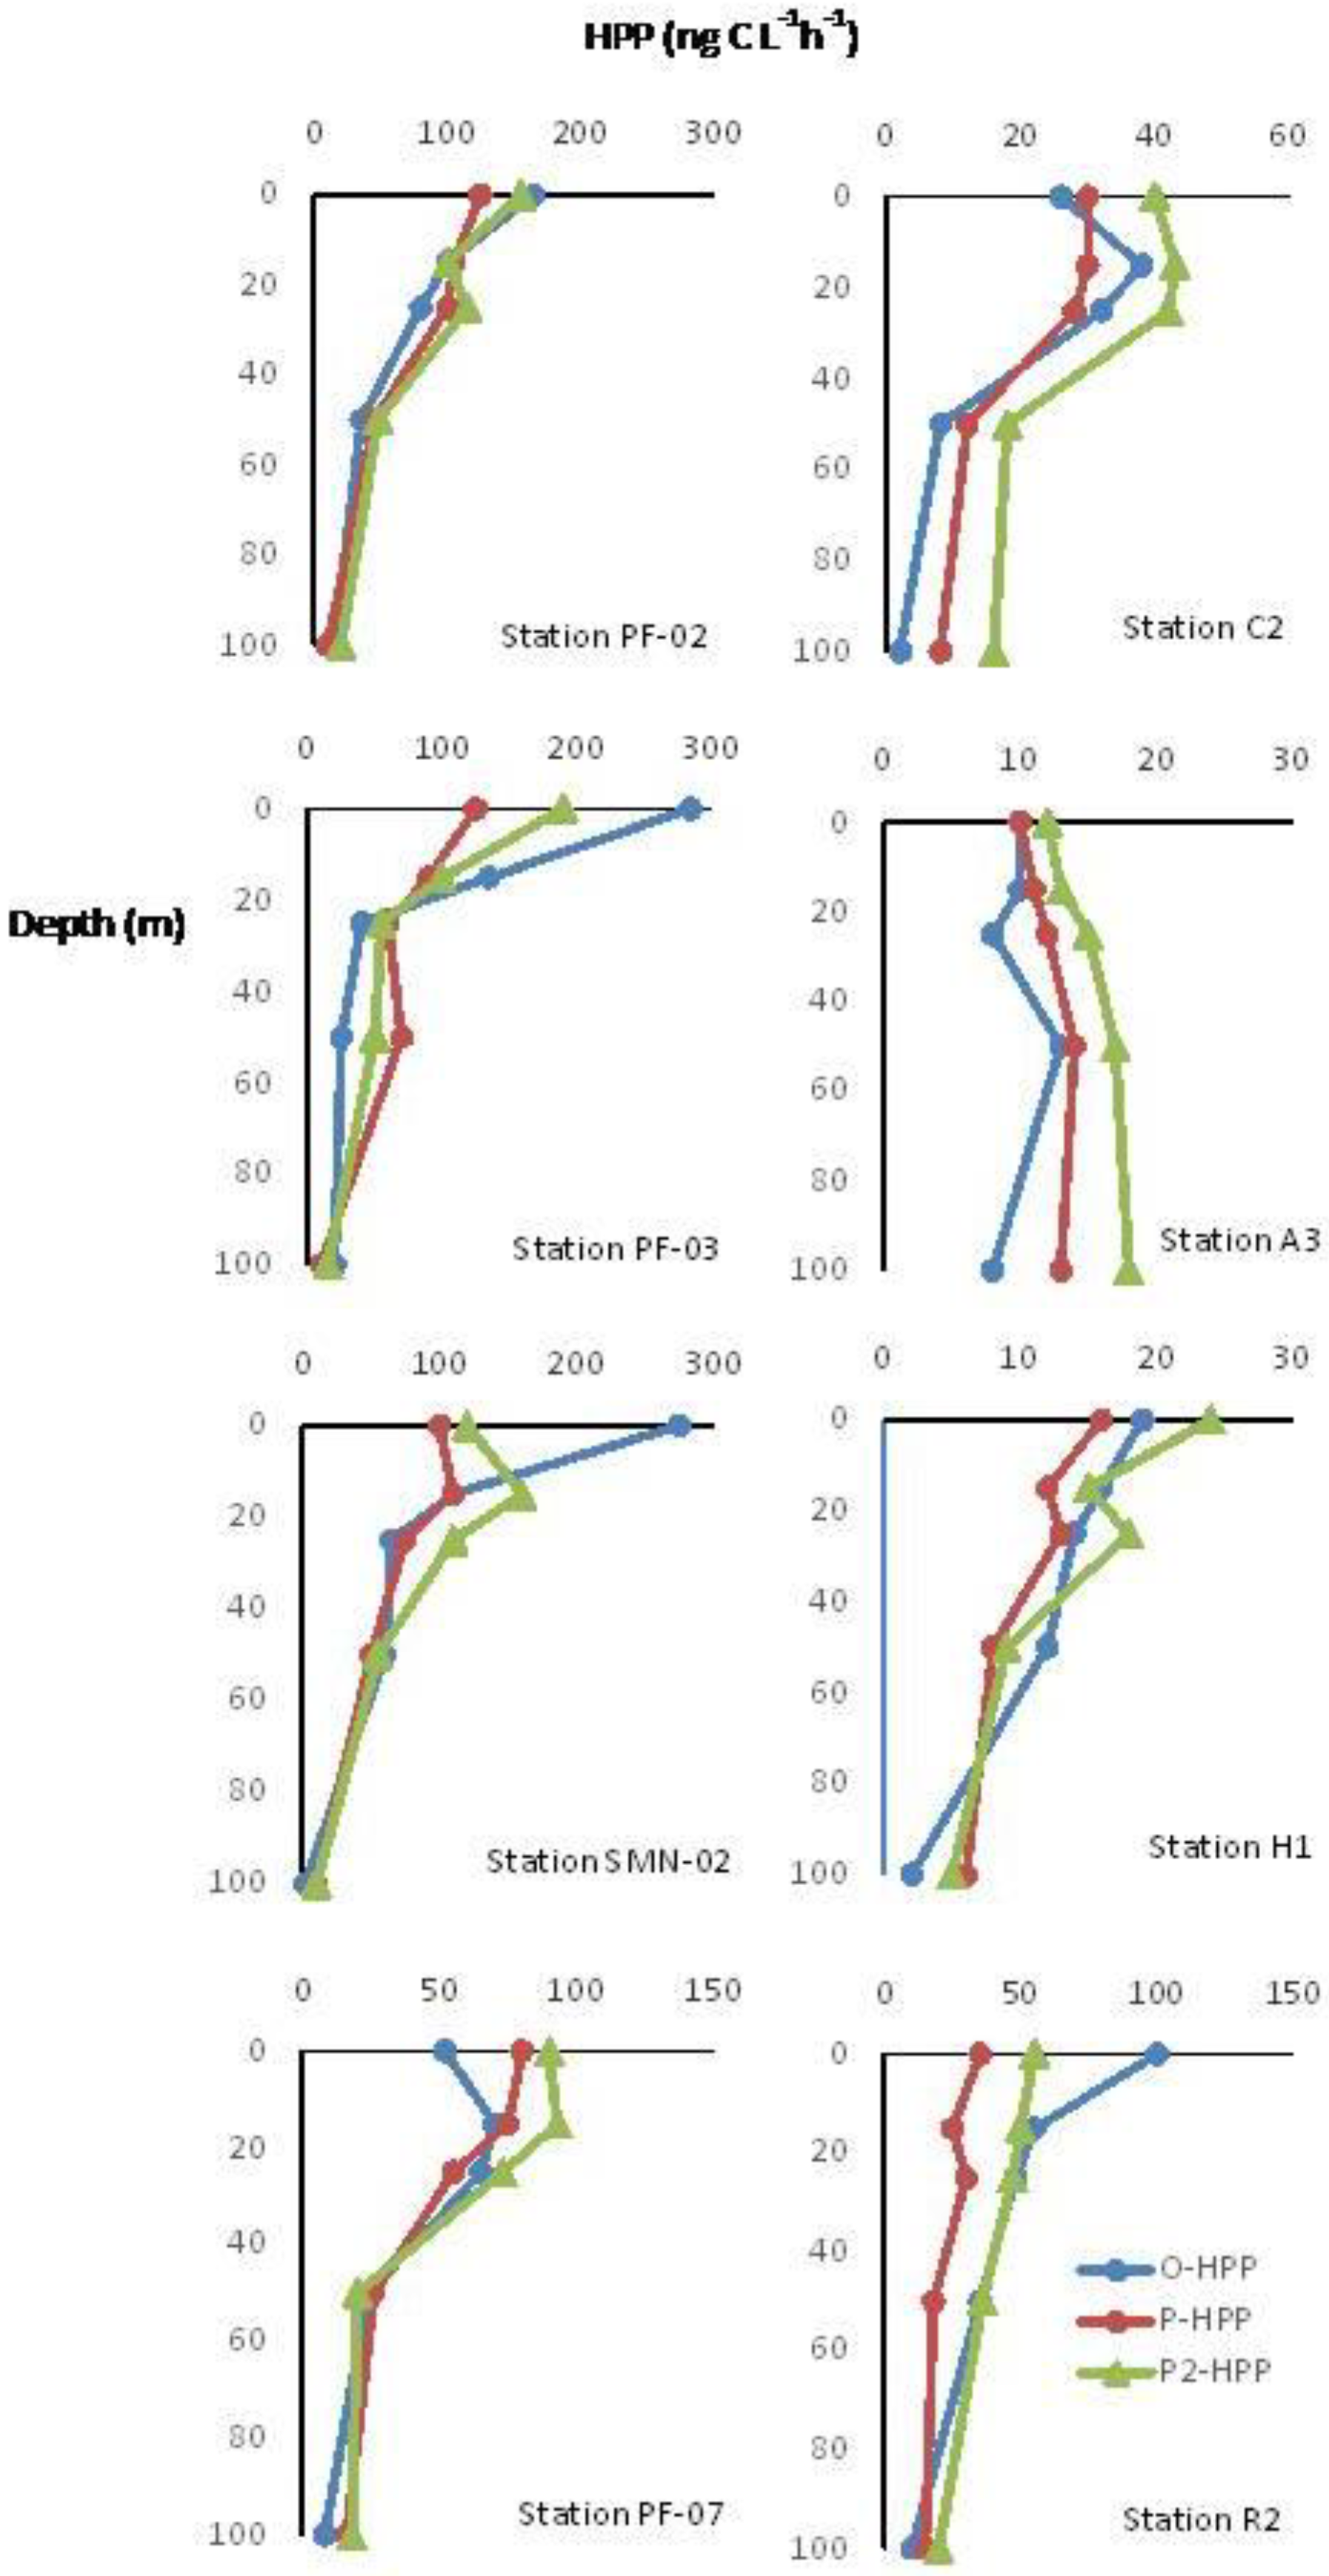
Distribution of O-HPP and P-HPP along TNB and VLT Epipelagic Water Columns

From the selected parameters, the predicted HPP values along eight water columns (four from TNB, namely from station PF sampled at different times and from station SMN, with four stations from VLT: C2, A3, H1, and R2) were calculated and plotted with the observed HPP (O-HPP) values (Figure 3). The predicted HPP values were calculated from the predictor values measured in each water sample, both using the regression equation from the total dataset (indicated as P-HPP) and simultaneously using two regression equations (indicated as P2-HPP). All the predicted values showed trends similar to the observed ones, with few exceptions. In TNB, O-HPP and P-HPP values were closely related, except for the O-HPP values detected at stations SMN 02, PF 03 at surface; the same discrepancy was found at R2 station in VTL area.

4. Discussion

Accounting for about 20% of the atmospheric CO2 uptake, the Southern Ocean plays a significant role as a major carbon sink [40]; in this context, HPP regulates the efficiency of the biologically-mediated carbon sequestration and its quantification is important to obtain a biogeochemical model of the carbon cycle, and also in the light of current climate change scenario [41,42]. This study aimed at finding a set of microbial variables as suitable predictors of HPP in Antarctic epipelagic waters during the austral summer period; to this end, two datasets were analyzed through calculation of regression equations. In a comprehensive view of ocean carbon fluxes, HPP is universally recognized as a key process to evaluate the role played by the prokaryotic assemblage. Nevertheless, criticism has frequently been moved against the method based on tritiated leucine incorporation, regarding the use of standard carbon-to-leucine conversion factors, which vary along environmental gradients and must be determined in situ [43]. These factors could result in underestimation of the actual production rates by at least a factor of 6.1 in open-ocean waters [44]. Starting from these considerations, the present study aimed at assessing which, among a set of microbial parameters, was the best hypothetic predictor of HPP. In the perspective of proposing an eco-friendly methodological approach alternative to the commonly used radiotracer measurements for HPP estimation, empirical models suitable to be applied to cold marine environments such as the Antarctic waters were developed.

4.1. Microbiological Scenario

During a high photosynthetically active radiation (PAR) availability period, in the epipelagic layer, the photoautotrophic processes and the consequent production of biopolymers are particularly active, as well as the synthesis of prokaryotic inducible catabolic enzymes [6]. In the polynya of the Ross Sea, the hydrolytic activities and their relationships with particulate organic substrates were analyzed [17], confirming the close link between organic substrates availability and degradations systems response; particularly high LAP activity was detected in the upper layer (0–50 m depth). During the early summer period in the Arctic Ocean, significantly positive correlations were detected among HPP, amino acids, temperature, and chlorophyll a, as well as between LAP activity and amino acids, in relation to the prokaryotic activity [10]. In such a case, a direct linear relationship was recorded between cell-specific HPP and cell-specific LAP (R2 = 0.74, p < 0.001, n = 16). In the same study a high temperature variability (Δt = 7–8 °C) was observed, positively associated with amino acid concentrations and prokaryotic activity. In the summer season in a South American sub-Antarctic area, high positive correlations among HPP and LAP activity, TPP, POC, and Chla were observed [9]. Conversely, in the present study, narrow temperature variations were observed during both surveys (Δt~1.6 °C, 0.5 °C in TNB surface waters) and temperature showed no or little influence on the microbiological activities (Temperature versus HPP Spearman rho = −0.02). As a consequence, this environmental parameter was not considered as a predictor parameter in our regression study.
The values of the microbial parameters collected from the TNB area were in the same range as those observed by Talbot et al. [9] and Piontek et al. [10], even expressed as cell-specific activity; conversely, at the VLT area, all parameters showed values significantly lower than those measured at the TNB one (Table 1) and similar to those reported under ice close to Cape Hallett (Victoria Land) [19]. The high rates of HPP, enzymatic activities, TPP, and LPS suggested the occurrence of intense biological activities in the TNB area compared to the VLT one.
In both the study areas HPP was significantly correlated with LAP, with a Spearman’s rho coefficient similar to that reported by Talbot et al. [9], indicating a coupling of organic matter decomposition and heterotrophic production during summer. At a lower level, significant correlations were also observed between HPP and TPP, as well as between HPP and LPS, and AP and ß-G. Particularly, the prokaryotic biomass (LPS) was positively correlated with the three enzyme activities and HPP (Table 2); a similar result was observed in an Arctic study [10]. The different rho correlation values observed between the TNB and the VLT surveys (Table 2), together with the quantitative differences (Table 1), were probably the result of the different trophic and geographical characteristics of the sampled areas and sites [18,22].
The phytoplanktonic biomass, measured as water fluorescence, was significantly correlated (Spearman’s rho) with HPP (0.58), LAP (0.74), ß-G (0.42), TPP (0.50), and LPS (0.64), as calculated on logarithmic-transformed data from the whole dataset. In a previous study, a strong positive empirical relationship between prokaryotic abundance and chlorophyll concentration was observed by Bird and Kalff [45] in fresh and marine waters. A tight coupling between HPP and chlorophyll-a was also recorded in the Amundsen Sea Polynya (Antarctica) [42], suggesting that phytoplankton biomass provides a relevant source of DOC that supports the metabolic activity of prokaryotic organisms.
Concerning the used datasets, during both surveys, samplings did not take into consideration the diel dynamics of microbial parameters which could influence qualitatively some values [19], the rapid changes of microbial biomass detected in the early ice-free areas [15], the horizontal transport of DOC and POC, and other forcings/variables capable of influencing the microbial processes and, consequently, the absolute values of the analyzed parameters and their relationships. On the other hand, all these features underlined the value of the total dataset considered in this study, as it was representative of most microbial processes taking place during two middle summer periods in coastal areas along Victoria Land.
The relative ratio between proteolysis and glycolysis processes gave insights on the qualitative composition and availability of organic matter to planktonic microorganisms; variations in LAP/ß-G ratios depend on the quality and nature (labile or refractory) of the organic matter pool available in the waters [46]. Proteins and organic phosphorus compounds are polymers degraded early during the enzymatic breakdown of the organic matter, while polysaccharides are more recalcitrant [47,48]. During the TNB survey, molar ratios LAP/ß-G in terms of Carbon mobilized from these hydrolytic activities varied from 1199 (on 22 January) to 65 (on 10 February) [18]. The mean LAP/ ß-G ratios (from Table 1) were 395 and 100 for TNB and VLT, respectively. In the Ross Sea Polynya, sampled during the same period of this study, ratios higher than 10 were detected during autotrophic productive processes [17].
In a previous study performed in the Ross Sea [49], a close relationship was found to link the expression of enzymatic activities to the available organic matter; during productive periods, when both auto- and heterotrophic-derived organic substrates are already available in the environment, the relative importance of leucine aminopeptidase in the organic matter recycling decreased, suggesting that under these conditions the synthesis of new enzymes was not stimulated. As bacterial growth in marine environments depends on peptidyl substrates, extracellular aminopeptidase production is regulated through a “on-demand” mechanism by the peptides present in seawater, as shown in batch cultures of selected bacterial genera [50]. Taking into consideration the release of carbon atoms and considering that one molecule of hydrolyzed leucine is equivalent to six carbon atoms, the LAP/HPP ratios calculated in the Ross Sea were 231 (TNB) and 39 (VLT) (Table 1). In both surveys, the amount of monomers potentially mobilized from protein decomposition supplied those removed by the heterotrophic prokaryotic production, providing a surplus available to other processes.

4.2. Regressions and Predictive Models

From the microbial parameters analyzed as potential predictors, the variations of Log-transformed LAPcsa alone and together with Log-transformed LPScsa were those that better interpreted the response variable (HPP). Additionally, in the building process of the regression equation from ≤50 nM h1 LAP dataset, APcsa contributed to decrease the multi-collinearity level of predictors in the regression equation. The significant relationships between HPP and LAP (Table 2) suggested that the conceptual trophic model [productive period (polymeric new production) → proteolytic exoenzymes → new prokaryotic biomass (HPP)] was fully active in the studied area, even at variable intensities, as shown by the variable microbial parameters values reported in Table 1. The ecological correlation of such functional processes was reflected in the numerical correlation between HPP and the other variables, allowing the building of empirical regression models for predictive purposes. In addition, the positive correlations between activity rates (HPP, LAP) and biomass (LPS) agreed with previous studies on polar and cold environments. Moreover, like our findings, Sinsabaugh et al. [51] underlined the close relationships between the heterotrophic prokaryotic production and extracellular enzyme activities, as calculated from a ln-ln regression (instead of Log-10 datasets like in the present study). Table 5 summarizes the regression statistics calculated between HPP and enzyme activities.
Although the magnitude order of HPP values reported by the above-cited study were not comparable with our data, due to the different environmental conditions (temperate and polar, respectively), the significant links between HPP and enzyme activity rates further confirmed that microbial growth depends on enzyme synthesis and on substrate availability; therefore, the enzymatic activity expression acts as an optimal resource allocation strategy between environmental resource availability and microbial growth requirements, undergoing up- and down-regulation in close relationships with environmental and trophic conditions.
In contrast with the significant relationships between HPP and LAP detected in our study, heterotrophic bacterial production was found to be significantly related to lipase activity, which in turn correlated with temperature, in sinking particles collected by sediment traps from the western North Pacific Ocean [52].

Post-Regression Tests

From the three datasets (TDS, ≤50 DS, and >50 DS) and using the three regression equations (TDS-RE, ≤50 DS-RE, and >50 DS-RE), the predicted values of HPP, together with the respective residuals and squared values, were calculated. All squared residuals varied into the same range with similar mean and standard deviation values (not shown). Another analysis was carried out using the Kruskal–Wallis test and Mann–Whitney (M–W) pairwise comparisons between the O-HPP and the P-HPP values; the results are shown in Table 6. M–W U values suggested that the predictive equation (Regression Equation, RE) built from the Total DataSet (TDS-RE) gave a better predictive interpretation when >50 DS predictors were used (M–W = 0.912) than TDS ones; conversely, the predictive equation was not appropriate when predictors from ≤50 Dataset (DS) (M–W = 0.104) were used. The best interpretative capacity was associated to ≤50 DS and its specific regression (M–W = 0.995), and a good result was obtained also using >50 DS and its specific regression (M–W = 0.741), whereas it was completely unsuitable for ≤50 DS and >50 DS-RE (M–W ≤ 0.001).
In Table 5, the datasets and regressions combinations used to predict HPP distribution in the water columns are reported in bold (Figure 3). Observing the distribution of both P- HPP and O-HPP values, the question if the single predictive equation built from the TDS instead of two predictive equations used simultaneously was more suitable to predict the response variable was not completely answered.

4.3. Observed versus Predicted HPP

The dataset of each single survey, summarized in Table 1, was closely related with the two datasets (≤50 and >50 DS) of LAP produced after the regression study. All samples collected from the VLT survey were included in ≤50 DS and 68% of samples from the TNB survey were included in >50 DS. Therefore, practically, the predicted HPP values for the VLT area and for 50–100 m depth of the TNB area were obtained using ≤50 DS regression equation (Figure 3).
The single regression equations, derived from log-transformed, cell-specific activities linking O-HPP versus two LAP datasets [Log (HPPcsa) = 1.372 + 1.230 Log (LAPcsa) ≤ 50 nM h1; Log (HPPcsa) = 27.78 + 0.195 Log (LAPcsa) > 50 nM h1], exhibited two different slopes (=coefficients of the regression equation). This resulted in different ecological implications: indeed, in the VLT area (≤50 DS) characterized by low microbial activities, ice covered an active melting process, and the slope of 1.230 indicated that HPP increased more rapidly than LAP, resulting in a potential consumption of the dissolved monomers released from the proteolytic activity. On the contrary, in the TNB area (>50 DS, particularly in the 0–50 m layer of the water column), characterized by high microbial activities in decreasing trend during a post-bloom period [18], the slope of 0.195 suggested that HPP increased more slowly than LAP, indicating that dissolved monomers exceeded those consumed by the heterotrophic production process.
The substantial differences observed between the two simple regression equations (HPP versus LAP) might contribute to interpreting the recent history, and the close evolution, of the biological processes taking place in each area. When very low microbial activities (close to the limit of detection) are observed, the precision of these estimates is low and their respective numerical data are less reliable, which can contribute to making the predictive capacity of the regression equation less confident. The low values of AP and ß-G detected mainly in the VLT survey and at 50–100 m depth in the TNB waters could be susceptible to this error. According to the analytical protocols used in the study of the variables, it was not possible to assess the possible methodological error included into the regression equation; for HPP, the determinations were made in triplicate and the results gave a mean coefficient of variation (CV) of 15.1%, which was the only CV that could be considered. Moreover, another potential error source could be introduced by the ectoenzymatic activities calculated using the Michaelis–Menten kinetics, since a Vmax value was obtained.
In some water columns (SMN-02 and R2 stations, Figure 3), the O-HPP values at surface were far from or did not follow the same trend as the P-HPP ones. This behavior led us to suppose that not all the variance in HPP could be explained by the selected predictors and that other processes affected HPP [53]. Variability in temperature, nutrients, and community composition has been reported to influence HPP patterns in oligotrophic Arctic streams and lakes affected by nutrient pulses following storm events [54]. Moreover, besides temperature, other physical factors related to climate change (i.e., ice melting inputs) and biogeochemical forcings (i.e., DOC availability) were reported to affect bacterial dynamics in a coastal ecosystem of the Western Antarctic Peninsula, where a decadal (2002–2014) time series of bacterial production was collected and analyzed [55]. All such factors can lead to erroneous data predictions and misinterpretations.
Although our observations were the results of two surveys referred to the Ross Sea summer conditions, and additional data should be collected to generalize our findings to the entire annual period, the good agreement between the predicted and observed HPP rates confirmed the validity of our predicted models for the Ross Sea environmental scenario.

5. Conclusions

The results obtained in this study proved that enzymatic activities, particularly exoproteases, together with prokaryotic biomass, are good predictors for HPP in the context of the microbial processes and trophic characteristics of the coastal Ross Sea epipelagic environments.
The application of EEA measurements to get empirical predictive models of HPP values has the important advantage of ensuring laboratory safety, as fluorogenic assays do not involve the production of hazardous (i.e., radioactive) wastes; moreover, the analytical protocols of enzyme assays are cheap and widely used in routine analysis.
The used statistical tools, together with an ecological interpretation of the microbial processes investigated during the surveys, led us to consider the more appropriate simltaneous use of two regression equations, each of them built with different ranges of the main predictor (LAP), for the empirical prediction of HPP.
The total dataset of microbiological parameters, however, referred to two middle summer periods only; this leaves the question of how the models would have predicted HPP after and before the studied period unanswered. Moreover, in this study the datasets considered referred to natural microbial communities; in future experiments it would be interesting to confirm the performance of the experimental and analytical workflow applied here through experiments in microcosms with known concentrations of both autotrophic and heterotrophic microorganisms.
As the models developed in this study are tailored for the austral summer period, future Antarctic surveys should be performed to extend the period of observations and include other seasonal periods, as well as to check these models and analyze other environmental and/or biological parameters capable of improving current model estimates, making them applicable to almost the entire year.

Author Contributions

Conceptualization, L.S.M., R.Z. and G.C.; methodology, all the authors; software, L.S.M.; validation, L.S.M. and R.Z.; formal analysis, L.S.M., R.Z. and G.C.; investigation, L.S.M., P.P., M.A. and F.A.; resources, R.L.F.; data curation, L.S.M., G.M., R.L.F. and A.C.; writing—original draft preparation, all the authors; writing—review and editing, all the authors; supervision, L.S.M., R.Z. and G.C.; project administration, R.L.F.; funding acquisition, R.L.F. All authors have read and agreed to the published version of the manuscript.

Funding

This research was funded by the Italian Ministry for Scientific Research within the Antarctic Research Programme (PNRA) within the project 8.5/1999–2001 XV Italian Expedition and within “The Victoria Land coastal ecosystems: Structure and distribution along a latitudinal gradient project” (XVIII Expedition), implemented by the Italian, United States and New Zealand polar programs.

Institutional Review Board Statement

Not applicable.

Informed Consent Statement

Not applicable.

Data Availability Statement

Data are available upon request.

Acknowledgments

This research was carried out in the frame of the Italian National Program for Antarctic Research (PNRA) XV Expedition, and of “The Victoria Land coastal ecosystems: structure and distribution along a latitudinal gradient” project, implemented by Italian, United States and New Zealand polar programs, carried out in the frame of the PNRA XVIII Expedition, respectively. The authors would like to express their gratitude to the Captains and the crews of polar R/V Italica and R/V Malippo for their help during sea operations during Victoria Land and Terra Nova Bay surveys respectively.

Conflicts of Interest

The authors declare no conflict of interest. The funders had no role in the design of the study; in the collection, analyses, or interpretation of data; in the writing of the manuscript, or in the decision to publish the results.

References

  1. Cho, B.C.; Azam, F. Major role of bacteria in biogeochemical fluxes in the ocean’s interior. Nature 1988, 332, 441–443. [Google Scholar] [CrossRef]
  2. Simon, M.; Azam, F. Protein content and protein synthesis rates of planktonic marine bacteria. Mar. Ecol. Progr. Ser. 1989, 51, 201–213. [Google Scholar] [CrossRef]
  3. Hoppe, H.G. Significance of exoenzymatic activities in the ecology of brackish water: Measurements by means of methyl-umbelliferyl-substrates. Mar. Ecol. Progr. Ser. 1983, 11, 299–308. [Google Scholar] [CrossRef]
  4. Fabiano, M.; Danovaro, R. Enzymatic Activity, Bacterial Distribution, and Organic Matter Composition in Sediments of the Ross Sea (Antarctica). Appl. Environ. Microbiol. 1998, 64, 3838–3845. [Google Scholar] [CrossRef] [Green Version]
  5. Azam, F. Microbial control of oceanic carbon flux: The plot thickens. Science 1998, 280, 694–696. [Google Scholar] [CrossRef] [Green Version]
  6. Chróst, R.J. Microbial ectoenzymes in aquatic environments. In Aquatic Microbial Ecology; Overbeck, J., Chróst, R.J., Eds.; Springer: New York, NY, USA, 1990; pp. 47–74. [Google Scholar] [CrossRef]
  7. Chróst, R.J. Microbial Enzymes in Aquatic Environments; Springer: New York, NY, USA, 1991; pp. 1–317. [Google Scholar] [CrossRef]
  8. Chróst, R.J. Ectoenzymes in aquatic environments: Microbial strategy for substrate supply. Verh. Internat. Verein Limnol. 1991, 24, 2597–2600. [Google Scholar] [CrossRef]
  9. Talbot, V.; Giuliano, L.; Bruni, V.; Bianchi, M. Bacterial abundance, production and ectoproteolytic activity in the Strait of Magellan. Mar. Ecol. Progr. Ser. 1997, 154, 293–302. [Google Scholar] [CrossRef] [Green Version]
  10. Piontek, J.; Sperling, M.; Nöthig, E.M.; Engel, A. Regulation of bacterioplankton activity in Fram Strait (Arctic Ocean) during early summer: The role of organic matter supply and temperature. J. Mar. Syst. 2014, 132, 83–94. [Google Scholar] [CrossRef]
  11. Watson, S.W.; Novitsky, T.J.; Quinby, H.L.; Valois, F.W. Determination of bacterial number and biomass in the marine environment. Appl. Environ. Microbiol. 1977, 33, 940–946. [Google Scholar] [CrossRef] [Green Version]
  12. Karl, D.M.; Bird, D.F.; Björkman, K.; Houlikan, T.; Shackelford, R.; Tupas, L. Microorganisms in the accreted ice of Lake Vostok, Antarctica. Science 1999, 286, 2144–2147. [Google Scholar] [CrossRef] [Green Version]
  13. Barnett, M.J.; Wadham, J.L.; Jackson, M.; Cullen, D.C. In-field implementation of a recombinant factor C assay for the detection of lipopolysaccharide as a biomarker of extant life within glacial environments. Biosensors 2012, 2, 83–100. [Google Scholar] [CrossRef] [PubMed] [Green Version]
  14. Bruni, V.; La Ferla, R.; Acosta Pomar, M.L.C.; Salomone, L. Structural differences of the microbial community in two sites of the Terra Nova Bay (Ross Sea, Antarctica): A statistical analysis. Microbiologica 1995, 18, 409–422. [Google Scholar] [PubMed]
  15. Crisafi, E.; Azzaro, F.; La Ferla, R.; Monticelli, L.S. Microbial biomass and respiratory activity related to the ice-melting upper layers in the Ross Sea (Antarctica). In Ross Sea Ecology; Faranda, F., Guglielmo, L., Ianora, A., Eds.; Springer: Berlin/Heidelberg, Germany, 2000; pp. 171–180. [Google Scholar]
  16. Umani, S.F.; Accornero, A.; Budillon, G.; Capello, M.; Tucci, S.; Cabrini, M.; Del Negro, P.; Monti, M.; De Vittor, C. Particulate matter and plankton dynamics in the Ross Sea Polynya of Terra Nova Bay during the austral summer 1997/98. J. Mar. Syst. 2002, 36, 29–49. [Google Scholar] [CrossRef]
  17. Misic, C.; Povero, P.; Fabiano, M. Ectoenzymatic ratios in relation to particulate organic matter distribution (Ross Sea, Antarctica). Microb. Ecol. 2002, 44, 224–234. [Google Scholar] [CrossRef] [PubMed]
  18. Monticelli, L.S.; La Ferla, R.; Maimone, G. Dynamics of bacterioplankton activities after a summer phytoplankton bloom period in Terra Nova Bay. Antarct. Sci. 2003, 15, 85–93. [Google Scholar] [CrossRef]
  19. Celussi, M.; Paoli, A.; Crevatin, E.; Bergamasco, A.; Margiotta, F.; Saggiomo, V.; Fonda Umani, S.; Del Negro, P. Short-term under-icevariability of prokaryotic plankton communities in coastalAntarcticwaters (Cape Hallett, Ross Sea). Estuar. Coast. Shelf Sci. 2009, 8, 491–500. [Google Scholar] [CrossRef]
  20. Zaccone, R.; Misic, C.; Azzaro, F.; Azzaro, M.; Maimone, G.; Mangoni, O.; Fusco, G.; Rappazzo, A.C.; La Ferla, R. Regulation of Microbial Activity Rates by Organic Matter in the Ross Sea during the Austral Summer 2017. Microorganisms 2020, 8, 1273. [Google Scholar] [CrossRef]
  21. Berkman, P.A.; CattaneoVietti, R.; Chiantore, M.; Howard Williams, C.; Cummings, V.; Kvitek, R. Marine research in the Latitudinal Gradient Project along Victoria Land, Antarctica. Sci. Mar. 2005, 69, 57–63. [Google Scholar] [CrossRef]
  22. Azzaro, M.; Specchiulli, A.; Maimone, G.; Azzaro, F.; Lo Giudice, A.; Papale, M.; La Ferla, R.; Paranhos, R.; Souza Cabral, A.; Rappazzo, A.C.; et al. Trophic and Microbial Patterns in the Ross Sea Area (Antarctica): Spatial Variability during the Summer Season. J. Mar. Sci. Eng. 2022, 10, 1666. [Google Scholar] [CrossRef]
  23. Karl, D.M. Microbial processes in the southern oceans. In Antarctic Microbiology; Friedmann, E.I., Ed.; Wiley: New York, NY, USA, 1993; pp. 1–63. [Google Scholar]
  24. Wetz, M.S.; Wheeler, P.A. Release of dissolved organic matter by coastal diatoms. Limnol. Oceanogr. 2007, 52, 798–807. [Google Scholar] [CrossRef]
  25. Strom, L.S.; Benner, R.; Ziegler, S.; Dago, M.J. Planktonic grazers are a potential important source of marine dissolved organic carbon. Limnol. Oceanogr. 1997, 42, 1364–1374. [Google Scholar] [CrossRef] [Green Version]
  26. Kawasaki, N.; Benner, R. Bacterial release of dissolved organic matter during cell growth and decline: Molecular origin and composition. Limnol. Oceanogr. 2006, 51, 2170–2180. [Google Scholar] [CrossRef] [Green Version]
  27. Thornton, D.C.O. Dissolved organic matter (DOM) released by phytoplankton in the contemporary and future ocean. Eur. J. Phycol. 2014, 49, 20–46. [Google Scholar] [CrossRef] [Green Version]
  28. Pomeroy, L.R.; Mathews, H.M.; Min, H.S. Excretion of phosphate and soluble organic phosphorus compounds by zooplankton. Limnol. Oceanogr. 1963, 8, 50–55. [Google Scholar] [CrossRef]
  29. Steward, G.F.; Smith, D.C.; Azam, F. Abundance and production of bacteria and viruses in the Bering and Chukchi seas. Mar. Ecol. Progr. Ser. 1996, 131, 287–300. [Google Scholar] [CrossRef]
  30. Shelfort, E.J.; Middelboe, M.; Moller, E.F.; Suttle, C.A. Virus-driven nitrogen cycling enhances phytoplankton growth. Aquat. Microb. Ecol. 2012, 60, 41–46. [Google Scholar] [CrossRef] [Green Version]
  31. Leventer, A. Particulate flux from sea ice in Antarctic waters. In Sea Ice. An Introduction to Its Physics, Chemistry, Biology and Geology; Thomas, D.N., Dieckmann, G.S., Eds.; Wiley-Blackwell: Hoboken, NJ, USA, 2003; Chapter 10; pp. 303–332. [Google Scholar]
  32. Povero, P.; Castellano, M.; Ruggieri, N.; Monticelli, L.S.; Saggiomo, V.; Chiantore, M.; Guidetti, M.; CattaneoVietti, R. Water column features and their relationship with sediments and benthic communities along Victoria Land Coast (Ross Sea, summer 2004). Antarct. Sci. 2006, 18, 603–613. [Google Scholar] [CrossRef]
  33. Kirchman, D.; K’nees, E.; Hodson, R. Leucine incorporation and its potential as a measure of protein synthesis by bacteria in natural aquatic systems. Appl. Environ. Microbiol. 1985, 49, 599–607. [Google Scholar] [CrossRef]
  34. Smith, D.C.; Azam, F. A simple, economical method for measuring bacteria protein synthesis rates in seawater using 3H-leucine. Mar. Microb. Food Webs 1992, 6, 107–114. [Google Scholar]
  35. Kirchman, D.L. Leucine incorporation as a measure of biomass production bt heterotrophic bacteria. In Handbook of Methods in Aquatic Microbial Ecology; Kemp, P.F., Sherr, B.F., Cole, J.J., Eds.; Lewis Publishers: Boca Raton, FL, USA, 1993; pp. 509–512. [Google Scholar]
  36. Ducklow, H.W. Seasonal production and bacterial utilization of DOC in the Ross Sea, Antarctica. In Biogeochemistry of the Ross Sea; Ditullio, G.R., Dunbar, R.B., Eds.; Antarctic Research Series 78; American Geophysical Union: Washington, DC, USA, 2003; pp. 143–158. [Google Scholar]
  37. Porter, K.G.; Feig, Y.S. The use of DAPI for identifying and count aquatic microflora. Limnol. Oceanogr. 1980, 25, 942–948. [Google Scholar] [CrossRef]
  38. Watson, S.W.; Hobbie, J.E. Measurement of bacterial biomass as lipopolysaccharides. In Native Aquatic Bacteria: Enumeration, Activity and Ecology; Costerton, J.W., Colwell, R.R., Eds.; ASTM: Philadelphia, PA, USA, 1979; pp. 82–88. [Google Scholar]
  39. Minitab, LLC. Minitab. 2021. Available online: https://www.minitab.com (accessed on 16 April 2021).
  40. Arrigo, K.R.; van Dijken, G.L.; Long, M. Coastal Southern Ocean: A Strong Anthropogenic CO2 Sink. Geophys. Res. Lett. 2008, 35, L21602. [Google Scholar] [CrossRef]
  41. Kim, B.; Kim, S.-H.; Min, J.-O.; Lee, Y.; Jung, J.; Kim, T.-W.; Lee, J.S.; Yang, E.J.; Park, J.; Lee, S.H.; et al. Bacterial Metabolic Response to Change in Phytoplankton Communities and Resultant Effects on Carbon Cycles in the Amundsen Sea Polynya, Antarctica. Front. Mar. Sci. 2022, 9, 872052. [Google Scholar] [CrossRef]
  42. Min, J.-O.; Kim, S.-H.; Jung, J.; Jung, U.-J.; Yang, E.J.; Lee, S.H.; Hyun, J.-H. Glacial ice melting stimulates heterotrophic prokaryotes production on the Getz Ice Shelf in the Amundsen Sea, Antarctica. Geophys. Res. Lett. 2022, 49, e2021GL097627. [Google Scholar] [CrossRef]
  43. Li, X.; Xu, J.; Shi, Z.; Li, Q.; Li, R. Variability in the empirical leucine-to-carbon conversion factors along an environmental gradient. Acta Oceanol. Sin. 2018, 37, 77–82. [Google Scholar] [CrossRef]
  44. Giering, S.L.C.; Evans, C. Overestimation of prokaryotic production by leucine incorporation—And how to avoid it. Limnol. Oceanogr. 2022, 67, 726–738. [Google Scholar] [CrossRef]
  45. Bird, D.F.; Kalff, J. Empirical relationships between bacterial abundance and chlorophyll concentration in fresh and marine waters. Can. J. Fish. Aquat. Sci. 1984, 41, 1015–1023. [Google Scholar] [CrossRef]
  46. Caruso, G.; Madonia, A.; Bonamano, S.; Miserocchi, S.; Giglio, F.; Maimone, G.; Azzaro, F.; Decembrini, F.; La Ferla, R.; Piermattei, V.; et al. Microbial Abundance and Enzyme Activity Patterns: Response to Changing Environmental Characteristics along a Transect in Kongsfjorden (Svalbard Islands). J. Mar. Sci. Eng. 2020, 8, 824. [Google Scholar] [CrossRef]
  47. Caruso, G.; Zaccone, R. Estimates of leucine aminopeptidase activity in different marine and brackish environments. J. Appl. Microbiol. 2000, 89, 951–959. [Google Scholar] [CrossRef]
  48. Zaccone, R.; Caruso, G. Microbial hydrolysis of polysaccharides and organic phosphates in the Northern Adriatic Sea. Chem. Ecol. 2002, 18, 85–94. [Google Scholar] [CrossRef]
  49. Misic, C.; Povero, P.; Fabiano, M. Relationship between ectoenzymatic activity and availability of organic substrates (Ross Sea, Antarctica): An experimental approach. Polar Biol. 1998, 20, 367–376. [Google Scholar] [CrossRef]
  50. Shindoh, S.; Obayashi, Y.; Suzuki, S. Induction of Extracellular Aminopeptidase Production by Peptides in Some Marine Bacterial Species. Microbes Environ. 2021, 36, ME20150. [Google Scholar] [CrossRef] [PubMed]
  51. Sinsabaugh, R.L.; Follstad Shah, J.J.; Findlay, S.G.; Keuehn, K.A.; Moorhead, D.L. Scaling microbial biomass, metabolism and resource supply. Biogeochemistry 2015, 122, 175–190. [Google Scholar] [CrossRef]
  52. Yamada, N.; Fukuda, H.; Ogawa, H.; Saito, H.; Suzumura, M. Heterotrophic bacterial production and extracellular enzymatic activity in sinking particulate matter in the western North Pacific Ocean. Front. Microbiol. 2012, 3, 379. [Google Scholar] [CrossRef] [PubMed] [Green Version]
  53. Hoch, M.P.; Kirchman, D.L. Seasonal and inter-annual variability in bacterial production and biomass in a temperate estuary. Mar. Ecol. Progr. Ser. 1993, 98, 283–295. [Google Scholar] [CrossRef]
  54. Adams, H.E.; Crump, B.C.; Kling, G.W. Isolating the effects of storm events on arctic aquatic bacteria: Temperature, nutrients, and community composition as controls on bacterial productivity. Front. Microbiol. 2015, 6, 250. [Google Scholar] [CrossRef] [PubMed]
  55. Kim, H.; Ducklow, H.W. A decadal (2002–2014) analysis for dynamics of heterotrophic bacteria in an Antarctic coastal ecosystem: Variability and physical and biogeochemical forcings. Front. Mar. Sci. 2016, 3, 214. [Google Scholar] [CrossRef]
Figure 1. Antarctic study area and location of the sampling stations.
Jmse 10 01812 g001
Figure 2. Relationships between the logarithmic-transformed and cell-specific values of the observed (O-HPP) and the predicted (P-HPP) heterotrophic prokaryotic production (L-HPPcsa) obtained from the total dataset regression equation (T DS-RE). The solid line represents the regression line showing the best fit to these data, and the dotted lines represent the 95% confidence intervals (CI) and prediction intervals (PI). The meaning of the statistical parameters is explained in the Section 2.
Jmse 10 01812 g002
Figure 3. Terra Nova Bay (TNB, column on the left) and Victoria Land (VLT, column on the right) surveys. Vertical distribution along the water column of the observed (O-HPP) values of Heterotrophic prokaryotic production (HPP) and the predicted HPP values (P-HPP) from the total dataset and from the simultaneous use of two different regression equations developed according to both datasets (≤50 and >50 nM h1) of Leucine AminoPeptidase (LAP) concentrations (P2-HPP).
Jmse 10 01812 g003
Table 1. Microbiological parameters observed in Terra Nova Bay (TNB) and Victoria Land Transect (VLT) surveys, together with temperature values. T (temperature), HPP (heterotrophic prokaryotic production), LAP (leucine aminopeptidase), AP (alkaline phosphatase), ß-G (ß-glucosidase), LPS (lipopolysaccharide), and TPP (total picoplankton).
THPPLAPAPß-GLPSTPP
°CngC
L−1h−1
nM h−1nM
h−1
nM
h−1
ng
L−1
×107
cells L−1
TNBmean−1.6559.23190.121.260.48128.3413.32
(0–100 m)s.d.0.4826.96451.150.450.1438.304.55
22 January–10 February 2000max−0.89282.79733.056.731.85357.8713.90
min−1.994.428.630.030.4161.155.40
n84848154488378
VLTmean−1.2611.676.440.0540.06470.816.06
(0–100 m)s.d.0.502.441.970.0030.0273.134.37
3–21 February 2004max−0.69125.4950.762.0270.569212.1132.44
min−1.900.490.120.0170.00339.412.65
n78787878787478
Table 2. Spearman’s rho correlation coefficients calculated between the log 10-transformed values of heterotrophic prokaryotic production (HPP, as ngC L−1 h−1) and exoenzymatic activities (leucine aminopeptidase-LAP, alkaline phosphatase-AP, ß-glucosidase-ß-G) (as nM h−1), total picoplankton-TPP (as cells L−1), and lipopolysaccharide-LPS (as ng L−1). For the matrix D, the correlations were calculated using the cell-specific activity (csa) values, reported as nmol cell−1 h−1 for enzyme activities and as ag cell −1 for LPS.
Matrix A.TNB 2000 Survey Dataset Matrix B VLT 2004 Survey Dataset
HPPLAPβ-GAPTPP HPPLAPβ-GAPTPP
LAP0.848 LAP0.853
(•) * (•)
β-G0.4490.553 β-G0.2440.251
(0.002)(•) (0.049)(0.027)
AP0.3180.3180.358 AP0.4720.3670.259
(0.022)(0.022)(0.016) (•)(0.001)(0.022)
TPP0.4830.4700.2430.248 TPP0.4150.3600.3040.485
(•)(•)n.s.n.s. (•)(0.001)(0.007)(•)
LPS0.5310.5330.4390.2880.138LPS0.3890.3350.3290.5280.691
(•)(•)(0.002)(0.038)n.s. (0.001)(0.004)(0.005)(•)(•)
Matrix COverall Data (TNB + VLT Datasets) Matrix DAs Cell-Specific Activity
HPPLAPβ-GAPTPP HPPcsaLAPcsaβ-GcsaAPcsa
LAP0.826 LAPcsa0.828
(•) (•)
β-G0.3310.467 β-Gcsa0.4410.511
(•)(•) (•)(•)
AP0.4990.5740.461 APcsa0.5420.5820.470
(•)(•)(•) (•)(•)(•)
TPP0.3290.1000.1500.165 LPScsa0.5880.4360.3300.434
(•)n.s.n.s.n.s. (•)(•)(•)(•)
LPS0.4500.3740.2850.1480.284
(•)(•)(0.002)n.s.(•)
* plevel:•, p < 0.001; n.s.: not significant; cell-specific activity was calculated by dividing enzyme activities and LPS by TPP values.
Table 3. Exploratory best subsets log-log regression analysis of specific heterotrophic prokaryotic production (HPP) versus specific leucine aminopeptidase (LAP), specific alkaline phosphatase (AP), specific ß-glucosidase (ß-G) and specific lipopolysaccharide (LPS). Reported are: HPPcsa, LAPcsa, APcsa and ß-Gcsa as Log10 cell-specific activity h−1, LPS as Log10 ag cell−1, TPP as Log10 cells L−1. Abbreviations: PRESS-prediction sum of squares; S-standard error of the regression; R squared (sq)-coefficients of determination. The meaning of the statistical parameters is explained in Materials and Methods.
R-sq R-sqMallows Variables
VarsR-sq(Adj)PRESS(Pred)CpSLAPcsaAPcsaß-GcsaLPScsaTPP
Total Dataset
161.461.114.159.937.60.3555X
132.131.424.829.2146.10.4719 X
131.130.525.028.7149.50.4751 X
124.924.227.421.9172.80.4963 X
14.43.534.51.5248.40.5598 X
2 *70.870.210.869.25.10.3110X X
3 *71.770.910.869.33.70.3076X XX
4 *72.172.110.869.34.00.3066XXXX
572.170.810.968.96.00.3080XXXXX
≤50 nmol L−1 LAP Dataset LAPcsaAPcsaß-GcsaLPScsaTPP
167.867.49.766.114.30.3298X
132.631.820.130.0120.30.4768 X
129.028.121.425.4131.30.4896 X
125.925.122.421.9140.40.4999 X
125.324.422.521.5142.50.5022 X
2 *70.169.49.267.09.30.3196XX
3 *71.270.19.267.87.90.3155XXX
4 *71.970.59.268.07.90.3137XXXX
573.271.59.168.46.00.3083XXXXX
>50 nmol L−1 LAP Data Set LAPcsaAPcsaß-GcsaLPScsaTPP
181.881.01.678.65.50.2394 X
181.580.61.678.16.00.2418 X
173.972.82.368.617.10.2868X
165.163.62.959.429.90.3316 X
162.861.23.156.633.20.3422 X
2 *85.784.41.382.71.80.2169 XX
3 *86.284.31.382.13.10.2179X XX
4 *86.884.21.381.94.30.2188X XXX
587.083.51.480.66.00.2230XXXXX
* The best of n (2, 3, 4) variables (vars).
Table 4. Heterotrophic prokaryotic production (HPP) prediction from logarithmic-transformed LAP and LPS variables: selected multiple regression analysis with optimized response from total, ≤50 nM h−1 and >50 nM h−1 LAP datasets. Abbreviations: SE (standard error of coefficient), VIF (variance inflation factor), TDS (total dataset), RE (regression equation). For the selection of predictor parameters see Table 1, and for the meaning of the regression parameters see Materials and Methods. For the matrix D, the correlations were calculated using the cell-specific activity (csa) values. Leucine AminoPeptidase-LAP and alkaline phosphatase-AP are reported as nM h−1, lipopolysaccharide-LPS as ng L−1; csa are reported as amol cell−1 h−1 for LAP and AP and as ag cell−1 for LPS.
PredictorCoefSE p-ValueVIF
Total Dataset (TDS)
LAP *0.53600.02700.0005.24
LPS *0.28330.02300.0005.24
S0.2483
R-sq97.23%
R-sq (adj)97.19%
R-sq (pred)97.16%
Mallows’ Cp2.00
alpha = 0.05
Regression Equation from TDS (TDS-RE)
Log HPP = 0.536 log (LAP *) + 0.283 log (LPS *)
≤50 nM h−1LAP dataset (≤50 DS)
Constant0.68200.11900.000
LAPcsa **0.62850.04030.0001.28
APcsa **0.09320.03740.0151.28
S0.2319
R-sq80.73%
R-sq (adj)80.29%
R-sq (pred)79.17%
Mallows’ Cp2.53
alpha = 0.05
Regression Equation from ≤50-DS (≤50 DS-RE)
Log HPPcsa = 0.682 + 0.6285 log (LAPcsa **) + 0.0932 log (APcsa **)
>50 nM h1LAP dataset (>50 DS)
Constant0.12300.33200.714
LAPcsa **0.39500.16900.0293.31
LPScsa**0.45400.11100.0003.31
S0.2212
R-sq85.15%
R-sq (adj)83.80%
R-sq (pred)81.45%
Mallows’ Cp1.59
alpha = 0.05
Regression Equation from >50 DS (>50 DS-RE)
Log HPPcsa = 0.1230 + 0.3950 log (LAPcsa **) + 0.4540 log (LPScsa **)
* As Log 10 of total activity, ** as Log 10 of cell-specific activity.
Table 5. Least squares ln-ln regression statistics calculated between HPP and enzyme activities (HPP values ranging from 0.65 to 0.79 µmol C L1 d1, modified from [51]).
Enzyme.N ObservationsSlopeInterceptR2
LAP5441.10+0.660.48
B-G5671.04−1.790.46
AP3911.05−1.400.45
Table 6. U values of Mann–Whitney pairwise comparisons calculated between the observed (O-HPP) and the predicted (P-HPP) values of heterotrophic prokaryotic production (HPP). The datasets and regression combinations used in the building of the P-HPP along the water columns are reported in bold (reported in Figure 3), namely the comparisons between O-HPP and P-HPP obtained from Total dataset, ≤50 nM h1 LAP and >50 nM h1 LAP datasets. The asterisks indicate the combinations giving the best matches between O-HPP and P-HPP. Abbreviations: TDS-RE, Total Dataset Regression Equation; DS-RE, Dataset Regression Equation obtained with the two concentrations of Leucine AminoPeptidase (LAP ≤ 50 nM h1 and >50 nM h1).
P-HPP from Regression Equations:
O-HPP from:TDS-RE≤50 DS-RE>50 DS-RE
Total dataset (TDS)0.2630.5440.810
≤50 nM h−1 LAP dataset (≤50 DS)0.1040.995 *<0.001
>50 nMh−1 LAP dataset (>50 DS)0.912 *0.5090.741 *
As the same numerical database was used for the regression equation building and prediction processes, close relationships between the O-HPP and the P-HPP were expected.
Publisher’s Note: MDPI stays neutral with regard to jurisdictional claims in published maps and institutional affiliations.

