Article

Trophic and Microbial Patterns in the Ross Sea Area (Antarctica): Spatial Variability during the Summer Season

1
Institute of Polar Sciences, National Research Council (CNR-ISP), Spianata S. Raineri 86, 98122 Messina, Italy
2
Institute for Biological Resources and Marine Biotechnologies, National Research Council (CNR-IRBIM), Via Pola 4, Lesina, 71010 Foggia, Italy
3
Laboratorio de Hidrobiologia, Institute of Biology, Federal University of Rio de Janeiro (UFRJ), Ilha do Fundao, Rio de Janeiro 21941-590, Brazil
4
Institute of Microbiology, Federal University of Rio de Janeiro (UFRJ), Av. Carlos Chagas Filho, Rio de Janeiro 21941-902, Brazil
5
Department of Life Sciences, University of Trieste, Via L. Giorgieri, 10, 34127 Trieste, Italy
6
Department of Mathematical Sciences and Informatics, Physics and Earth Sciences, University of Messina, Viale Stagno d’Alcontres, 98166 Messina, Italy
7
Department of Life and Environmental Sciences, Ancona Polytechnic University, Via Brecce Bianche, 60131 Ancona, Italy
8
Department of Chemistry and Industrial Chemistry, University of Genoa, Via Dodecaneso 31, 16146 Genoa, Italy
*
Author to whom correspondence should be addressed.
J. Mar. Sci. Eng. 2022, 10(11), 1666; https://doi.org/10.3390/jmse10111666
Submission received: 7 October 2022 / Revised: 28 October 2022 / Accepted: 1 November 2022 / Published: 5 November 2022
(This article belongs to the Section Marine Ecology)

Abstract

:
In open regions of the Ross Sea, the role of the microbial community in the turnover of organic matter has scarcely been investigated; indeed, very little is known on how microbial distribution and functional diversity respond to environmental conditions and hydrographic structures. During the austral summer of 2017, two pelagic areas of the Ross Sea [the Drygalski Ice Tongue and the nearby Terra Nova Bay polynya (A area), and the continental Shelf Break area near Cape Adare (C area)] were studied at selected depths [surface, Deep Chlorophyll Maximum (DCM), Circumpolar Deep Water (CDW), deep waters]. Trophic properties [nutrient concentrations, particulate (POC), dissolved organic carbon (DOC) and its optically significant fraction (CDOM) were measured, together with the main hydrological variables. Microbial community abundance [total prokaryotes, living, dead, and actively respiring fraction, high- and low nucleic acid cells (HNA and LNA), pico- and nano-eukaryotes, culturable heterotrophic bacteria], composition, and metabolism (as whole community and as isolated bacteria) were also assessed. Through a multidisciplinary dataset, this study highlighted the variable response of microbial abundance, diversity, and metabolism of the microbial community to the changing local environmental conditions of the Ross Sea. Different forces, such as organic matter inputs (mostly of detrital nature) released from the Drygalski glacier in the A area, and a coastal-to-offshore gradient in the C area, coexisted within this extreme ecosystem. This resulted in a significant spatial segregation of the edaphic parameters, and of the microbial community distribution and metabolic activity patterns.

1. Introduction

The Southern Ocean covers only 10% of the total ocean surface area and plays a key role in global biogeochemical cycles [1]. Within Antarctica, the Ross Sea represents a unique region with respect to both its physics and its ecological characteristics [2,3]; it exhibits the largest continental shelf in Antarctica, and is one of the most productive areas in the Southern Ocean [4,5]. In the Ross Sea, climate anomalies have caused recent changes in Antarctic Bottom Water formation [6] and a rebound of shelf water salinity has also been recorded [7]. The Ross Sea is considered a “natural laboratory”, and since 2018 it is a highly marine protected area (MPA) in international waters (>150,000 km2 [8]).
Although it is well known that the vertical fluxes of organic matter are highly dependent on mineralization processes performed by prokaryotes [9,10,11,12,13,14,15,16], to date, the patterns of response of the microbial components to trophic and other environmental changes in the Ross Sea are yet not fully known [17,18,19]. Particularly, current climate change is expected to induce shifts in the overall total prokaryotic abundance and in the microbial community structure in terms of functional groups (i.e., heterotrophic, culturable, living, metabolically active cells) as well as in the pico-and-nano-eukaryotes components, also influencing the dynamics of the microbial-organic matter interactions.
The organic matter present in aquatic ecosystems is a heterogeneous matrix, composed of more labile materials such as proteins, simple sugars, and fatty acids and of more refractory compounds less available to degradation, such as structural carbohydrates. The concentrations of dissolved organic carbon (DOC) and of its optically significant fraction, the chromophoric component (CDOM), are important for carbon budget estimates. As heterotrophic bacteria can only directly uptake for their metabolism molecules with a molecular weight lower than 600 Daltons (amino acids, simple sugars, fatty acids), complex organic molecules (polymers) require a preliminary hydrolysis into monomers or compounds with low molecular weight [20]. The decomposition of organic polymers is a microbially-mediated process that affects the functioning of aquatic ecosystems [21]; microorganisms, and in particular heterotrophic bacteria, represent the main biological component involved in this process, thanks to their small size and metabolic plasticity which favor the interaction between microheterotrophs and organic matter, so affecting the fate of organic matter [20,22,23].
In the Ross Sea, DOM concentrations and optical properties have been recently investigated in relation to phytoplankton communities [24], but the structure and dynamics of the microbial assemblage and its role in organic matter degradation still need to be further researched [19,25]. Here, the warm Circumpolar Deep Water (CDW) is the primary source of heat, salt, nutrients, and iron (Fe) onto the Antarctic continental shelves, with important implications on physical, biogeochemical, and biological processes [26]. According to climate change predictions, it is predicted that an additional input of Fe-rich freshwater might derive from ice melting in certain locations around Antarctica, promoting phytoplankton blooms and, consequently, enriching waters with organic substrates for microbial growth [27]. Given the importance of this topic in the framework of the dynamics and variability of the Southern Ocean, within the CELEBeR Project (CDW Effects on glaciaL mElting and on Bulk of Fe in the Western Ross sea) funded by the Italian Antarctic Research Program (PNRA16-000207 A3), the direct contribution of CDW to the supply of iron (Fe) in the western Ross Sea shelf area and its indirect role through the melting of continental ice were studied. As significant changes have been observed in the Ross Sea phytoplankton community in relation to the variable environmental scenarios [28], in this study we have predicted that the distribution, diversity, and function of the prokaryotic and eukaryotic components of the microbial assemblage could vary in response to the different forces occurring in this extreme environment. In this context, microbial community abundance, biomass, metabolism, and diversity were investigated in relation to the main chemical-physical measurements and organic matter composition across the vertical profiles of two different areas, namely the Terra Nova Bay polynya, near the Drygalski glacier and the area off Cape Adare.
The specific aims were as follows:
(i)
to perform a quali-quantitative assessment of the trophic conditions of the water column along coastal to offshore and vertical profiles covering from deep to surface layers in terms of particulate and dissolved organic matter and of the CDOM component in two different areas of the Ross Sea;
(ii)
to depict the distribution patterns of microbial prokaryotic and eukaryotic communities and their main components (living, metabolically active, culturable cells)
(iii)
to highlight the interactions of the microbial assemblage with available organic substrates
(iv)
to find the main variables affecting the microbial community dynamics and the response of these latter to the different environmental scenarios.

2. Materials and Methods

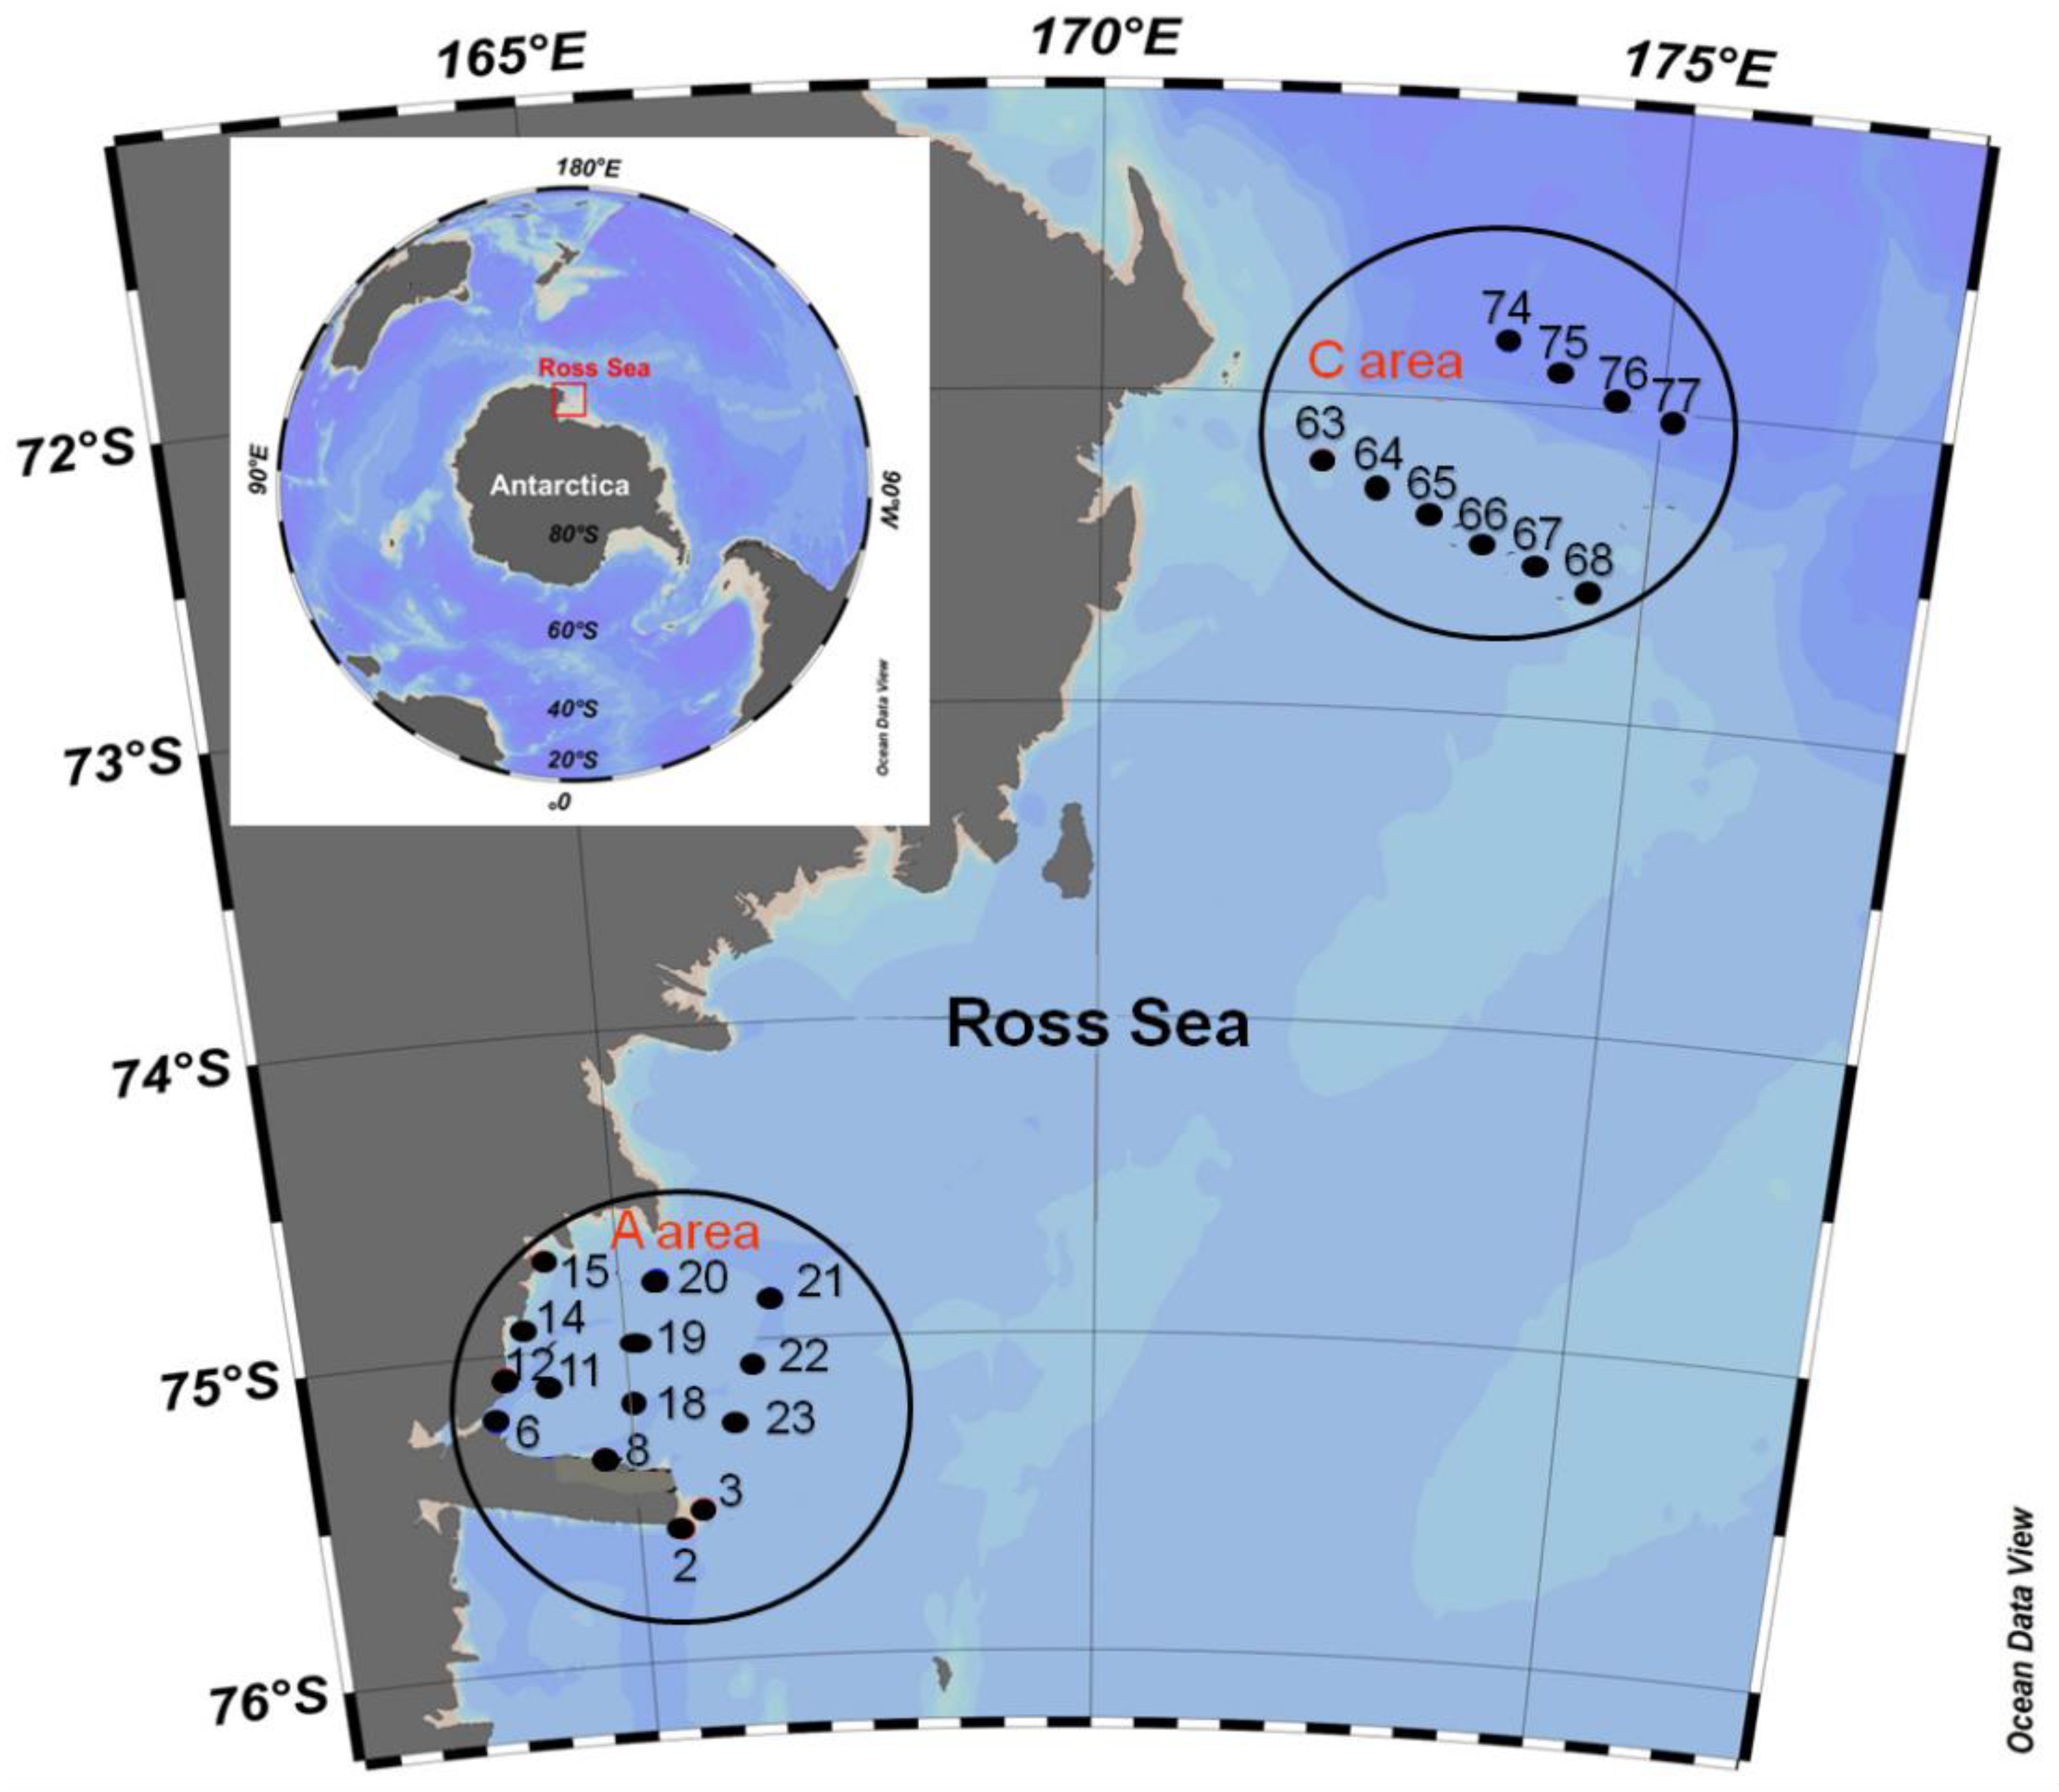
2.1. Description of the Area and Sampling Strategy

In the framework of the Project CELEBeR, an oceanographic cruise was performed in January–February 2017 aboard the R/V Italica. A total of 24 hydrological stations were monitored, variously located over two different areas (Figure 1):
-Area A, which included the Drygalski Ice Tongue and the nearby Terra Nova Bay polynya, with 14 stations (002, 003, 006, 008, 011, 012, 014, 015, 018, 019, 020, 021, 022, 023);
-Area C, which included the Antarctic continental shelf break area near Cape Adare (North Victoria Land), with 10 stations (063, 064, 065, 066, 067, 068, 074, 075, 076, 077). The geographical coordinates of the stations are reported in Table 1.
Discrete depths were chosen according to the water column structure to determine the trophic and microbial characteristics. The sampling strategy was as follows: the surface layer, the Deep Chlorophyll Maximum (DCM), the Circumpolar Deep Water (CDW) and the deep water masses.

2.2. Measured Variables

2.2.1. Hydrological, Trophic and Optical Variables

The hydrological parameters (temperature T, salinity S) were measured along the water column by a Sea Bird Electronics SBE 9/11 plus probe. The CTD was equipped with dual temperature-conductivity sensors flushed with a pump at a constant rate, a SBE 23 O2 sensor, and a Chelsea Aquatrack III fluorometer for dissolved oxygen (DO) concentration and fluorescence (F) data. Calibrations were performed before and after the cruises. Data were acquired at the maximum frequency (24 Hz).
A SBE 32 plastic coated carousel sampler was used to collect water samples from twenty-four 12-L Niskin bottles. Duplicate water samples were collected at discrete depths to measure both the environmental and biological variables. For ammonia (NH4), nitrite + nitrate (NO2+NO3) and orthophosphate (PO4) determinations, seawater samples were taken directly from the Niskin bottles, filtered through 0.7 μm glass fibre filters (GFF) and kept frozen −20 °C in 20 mL low-density polyethylene containers until laboratory analysis. Analytical determinations were performed using a five-channel continuous flow auto-analyzer (Technicon Autoanalyser II), according to the method described by Hansen et al. [28] and adapted to the available instrumentation. The accuracy and the precision of the method were checked by Certified Reference Material (CRM) MOOS-3. Nutrient concentrations were reported in μM.
Total Suspended Matter (TSM, mg L−1), Particulate Organic Carbon (POC, μgC L−1) and Particulate Nitrogen (PN, μgN L−1) were measured according to conventional methods in use at the CNR-ISP laboratory. TSM was gravimetrically determined. For the estimation of POC and PN, water samples were concentrated on pre-combusted Whatman GF⁄F glass-fibre filters and processed at 980 °C in a Perkin-Elmer CHN-Autoanalyzer 2400, using acetanilide as the standard [29,30].
Sub-samples for dissolved organic carbon (DOC, mg L−1) and chromophoric dissolved organic matter (CDOM) measurements were filtered through sterile 0.2 μm polyethersulfone (PES) filters using a polyethylene (PE) syringe. DOC concentrations were measured by high temperature catalytic oxidation as non-purgeable organic carbon, using a Shimadzu TOC-L CSH series + SSM 5000, while CDOM absorption measurements were conducted using a dual-beam UV-VIS spectrophotometer, the Shimadzu 2600 Series (Shimadzu, Milan, Italy), with a 10-cm quartz cuvette. Details about the analytical procedures are reported in Specchiulli et al. [31,32]. The indices derived by the absorbance measurements were the spectral slopes S275–295 (Sl, nm−1) and SUVA254 (L mg−1 m−1).

2.2.2. Microbial Abundance Data

Total Prokaryotic Abundance, Volume and Biomass

Total prokaryotic abundance (TPP), cell volume (VOL) and prokaryotic biomass (PB) were estimated after sample fixation with formaldehyde (2% final concentration) and stored in the dark at 4 °C until analysis at the CNR-ISP laboratory in Italy. Two replicates were filtered through polycarbonate black membranes (porosity 0.22 μm; GE Water & Process Technologies) and stained for 10–20 min with DAPI (4′6-diamidino-2-phenylindole, final concentration 10 μg mL−1 by Sigma-Aldrich, St. Louis, MO, USA) according to Porter and Feig [33]. The prokaryotic cells were quantified by an AXIOPLAN 2 Imaging microscope (Carl Zeiss, Oberkochen, Germany), provided with the specific sets for DAPI (G365; FT395; LP420) and equipped with an AXIOCAMHR digital camera (Zeiss) and AXIOVISION 3.1 software. The morphometric measurements of the cells were performed, and the volume (VOL, expressed in μm3) of each cell was calculated from two linear dimensions (width, W, and length, L) which were manually obtained. The detailed methodological procedures for the single-cell volume calculation and the volume-to-biomass conversion factors were reported by La Ferla et al. [34].

Microbial Assemblage Components

The fraction of viable prokaryotic cells was quantified using the Live/Dead BacLight kit (Molecular Probes, Eugene, OR, USA) which uses SYTO® 9 and propidium iodide as reagents. One mL of the mixture of the two reagents was added to 1 mL of the sample, with subsequent shaking and incubation at 4 °C in the dark for 1 h, followed by freezing at −20 °C. Samples were then filtered through 0.22 μm Nuclepore polycarbonate black membranes (GE Water and Process Technologies, Feasterville-Trevose, PA, USA) and these were observed under an epifluorescence microscope. Cell counts were performed using sets specific for fluoresceine (BP450-490; FT510; LP520) and rhodamine (BP546/12; FT580; LP590). The procedure was performed according to La Ferla et al. [35].
For the quantification of actively respiring cells (CTC+), 1 mL of the sample was added to 0.1 mL of cyanotetrazolium chloride (CTC, 50 mM from the Bac Light Redox Sensor CTC Vitality Kit purchased from Molecular Probes) and incubated for 5 h in the dark at 4 °C. The sample was subsequently fixed and stored in the freezer at −20 °C. As reported above, the samples were then filtered on 0.22 μm Nuclepore polycarbonate black membranes, and these were observed under the epifluorescence microscope using a rhodamine-specific filter set (BP546/12; FT580; LP590). The analysis was performed as described by La Ferla et al. [35].
The prokaryotic community composition was also assessed by CARD-FISH (CAtalyzed Reporter Deposition—Fluorescence In Situ Hybridization (CARD-FISH) technique [36]. Variable seawater volumes (ranging from 6 to 3 mL), determined according to DAPI hybridization results, were filtered through white Nuclepore polycarbonate membranes (diameter, 25 mm; pore size, 0.22 μm) and subsequently fixed for 30 min at room temperature by overlaying filters with 3 mL of a freshly prepared paraformaldehyde (Sigma-Aldrich, St. Louis, MO, USA, final concentration 4%)/phosphate-buffered saline (PBS, 130 mM NaCl, 10 mM NaHPO4, and 10 mM NaH2PO4, pH 7.4, all from Sigma-Aldrich) solution. After fixative removal, membranes were washed twice with 3 mL of PBS, followed by washing with distilled water. Filter sections were then hybridized with the horseradish peroxidase (HRP)-labeled oligonucleotide probes listed in Table 2, provided by GBF Biotechnology research company (Braunschweig, Germany).
According to Pernthaler et al. [37], the tyramide signal amplification protocol was applied. The probe NON338 [38] was used as a negative control, and no false positive signals were found. Filters were counterstained with DAPI at a final concentration of 1 μg mL−1 and subsequently mounted on glass slides with Citifluor immersion oil (Sigma) and Vectashield Mounting medium with DAPI (Abcam, Cambridge, United Kingdom) in a 4:1 (v/v) ratio and observed under an Axioplan epifluorescence microscope (Zeiss) equipped with specific filter sets for DAPI and HRP. For all used probes, the actual counts were done by enumerating a minimum of 500 DAPI-stained cells in 20 fields that covered an area of at least 100 μm × 100 μm each.

Prokaryotic, High and Low Nucleic Acid Content, Pico- and Nano-Eukaryotic Cell Abundance by Flow Cytometry

Samples for prokaryotic counts (PAC) by Flow cytometry were collected in sterile cryogenic tubes, fixed with pre-filtered (0.22 μm pore size) (paraformaldehyde 1% + glutaraldehyde 0.05%) and frozen in liquid nitrogen, where they were kept until analysis [47]. The analysis was carried out using a FACSCalibur flow cytometer (BD-Becton, Dickinson and Company, CA, USA) equipped with standard laser and optics: an air-cooled argon-ion laser emitting at 488 nm (power at 15 mW), fixed laser alignment, and fixed optical components. Each sample was aspirated through a 70-μm nozzle and sterile Mill-Q water (18.2 mΩ) was used as the sheath fluid. For the prokaryotic counts (PAC), aliquots were stained with SYBR Green I (Molecular Probes, at a final concentration 5 × 10⁻⁴ of the commercial stock solution) according to Brussard et al. [48] and analyzed. Distinct prokaryotic heterotrophic cells with high (HNA) and low (LNA) nucleic acid content were quantified based on their cytometric signatures in a plot side scatter (X-axis, related by size) vs. green fluorescence (Y-axis, green fluorescence from SYBR Green I related to nucleic acid content) [47]. Distinct autotrophic populations (pico- and nano-eukaryotic cells) were detected, identified, and quantified using a combination of side scatter light and natural fluorescence (red and orange) issued by photosynthetic pigments [49].

2.2.3. Microbial Metabolism
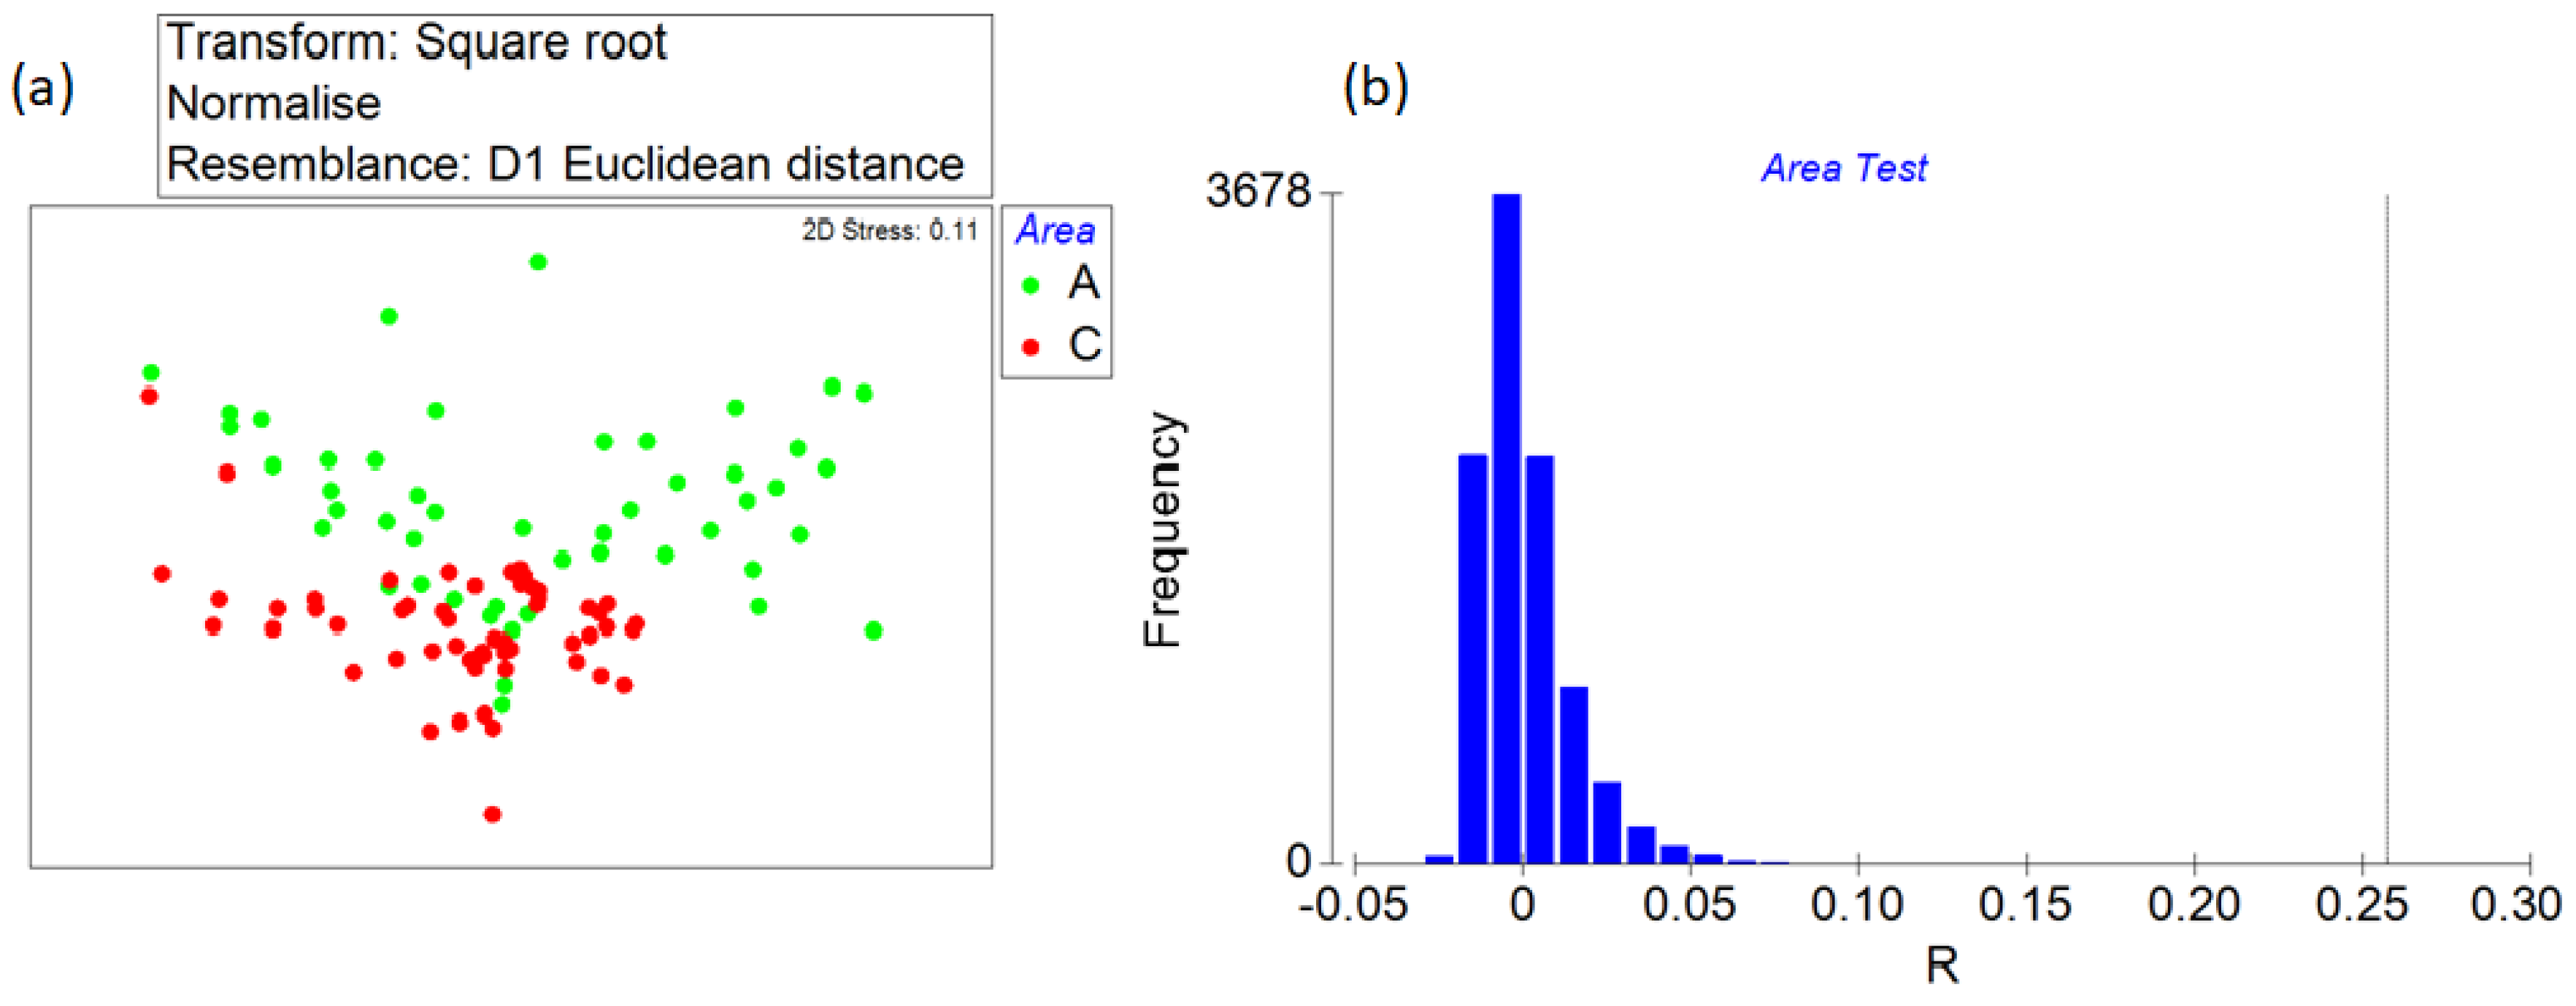
To assess microbial community metabolism, Biolog-Ecoplates™ that contained 31 carbon sources and a control in triplicate were used, together with the tetrazolium violet redox dye. Ninety-six wells were inoculated with 150 μL of the sample, and each plate was incubated at 4 °C in the dark [50,51]. The oxidation of tetrazolium in formazan was measured as Absorbance at 590 nm using a microplate-reader spectrophotometer (MICROTITER ELX-808, Bio Whittaker, Inc., Walkersville, MD, USA) equipped with a microplate reader and the specific software (WIN KQCL) for data processing. The optical density (OD) of the reaction product was recorded immediately after inoculation (at time T0), and thereafter, every 2 days after incubation at +5 °C. As described by Sala et al. [52], the average well substrate color development (AWCD) for each plate was calculated using the following formula:
AWCD = Σ ((R − C)/31)
where R was the average absorbance of the three wells with the substrate, and C was the average absorbance of the control wells (without the substrate). A value of 2% of the total absorbance measured per plate was used as the threshold for substrate utilization. The carbon substrates were classified into six guilds, namely, complex carbon sources, carbohydrates, phosphate carbon sources, carboxylic and acetic acids, amino acids, and amines.
The enzymatic profiles of bacterial isolates were obtained by screening the ability to metabolize proteins, polysaccharides, and organic phosphates, using fluorogenic substrates different for each organic substrate to be assayed, as described by Caruso et al. [53]. Briefly, to test the proteolytic (leucine aminopeptidase, LAP), glycolytic (alpha- and betaglucosidase, GLU), and phosphatasic (alkaline phosphatase, AP) abilities, all the strains in the axenic culture were inoculated by replica plating on the surface of four Marine agar dishes, one for each enzyme to be assayed. Only one strain per each Petri dish was tested, to avoid potential interferences in the interpretation of the results. After incubation for 10 days at +5 °C, the plates were covered with a paper filter dish embedded with a 0.1 mM solution of each fluorogenic substrate [leucine-7 amido-4-methyl-coumarin, 4-Methlumbelliferyl (MUF)-alpha-d- and beta-d-glucoside, MUF-phosphate] specific for LAP, alpha-GLU, beta-GLU and AP. The strains equipped with the enzyme assayed showed a clear fluorescent halo when observed under UV light using a Wood lamp.

2.3. Data Analysis

Data structure was explained through univariate and multivariate methods. In the first step, multivariate analytical techniques were applied to quantitatively analyze a large and heterogeneous dataset distributed in the study area. The collected data were pre-treated with a four-root transformation, followed by normalization before calculating the Euclidean matrix of distances [54]. Non-metric Multi-Dimensional Scale (nm-MDS two dimensions) was applied to the whole dataset to delineate different variable profiles between the two areas (A and C) considered as discriminating factors. Then, a one-way ANOSIM (Analysis of Similarity) test was performed (with 9999 permutations) to check for significant differences and to test the H0 hypothesis of no difference in variable distributions between the two areas, using permutation/randomization methods on the similarity matrix. When a significant difference was obtained by ANOSIM, a Similarity Percentage (SIMPER) analysis was applied to evaluate the percentage contribution of each variable to the Bray-Curtis similarity between the groups of samples [55].
In the second step, a Spearman rank correlation was performed on each obtained sub-groups of variables to extract important correlations, and to reduce the number of variables in the following multivariate tests. The distribution characteristics of values of the selected variables were represented by box plots to define pattern separately for each area.
In the final step, Principal Component Analysis (PCA) was applied for each sub-group to define the correlations and the environmental forces for biological variables.
Statistical analyses were run on data by using the STATISTICA 8.0 computer package (StatSoft Inc.) and the Primer-E Software package v6.0 (Plymouth Marine Laboratory, Plymouth, UK).

3. Results

3.1. Significant Differences between the Two Areas

A multivariate approach as the first analytical step on a complex data structure allowed for the integration of not only all data, but also the establishment of differences in close relationships between environmental variable concentration and biological response. A Non-metric Multi-dimensional Scale (nmMDS) test successfully recognized a spatial variability of environmental and biological data among the sampling stations (Figure 2a). In the two-dimensional ordination diagram, samples were grouped according to similar environmental conditions and biological responses. The clear segregation between the stations belonging to the A and C area was tested with an ANOSIM one-way test (number of permutations of 9999), confirming a significant difference (R = 0.257, p = 0.01%) (Figure 2b). According to this result, the obtained datasets were reported by separating the two areas.

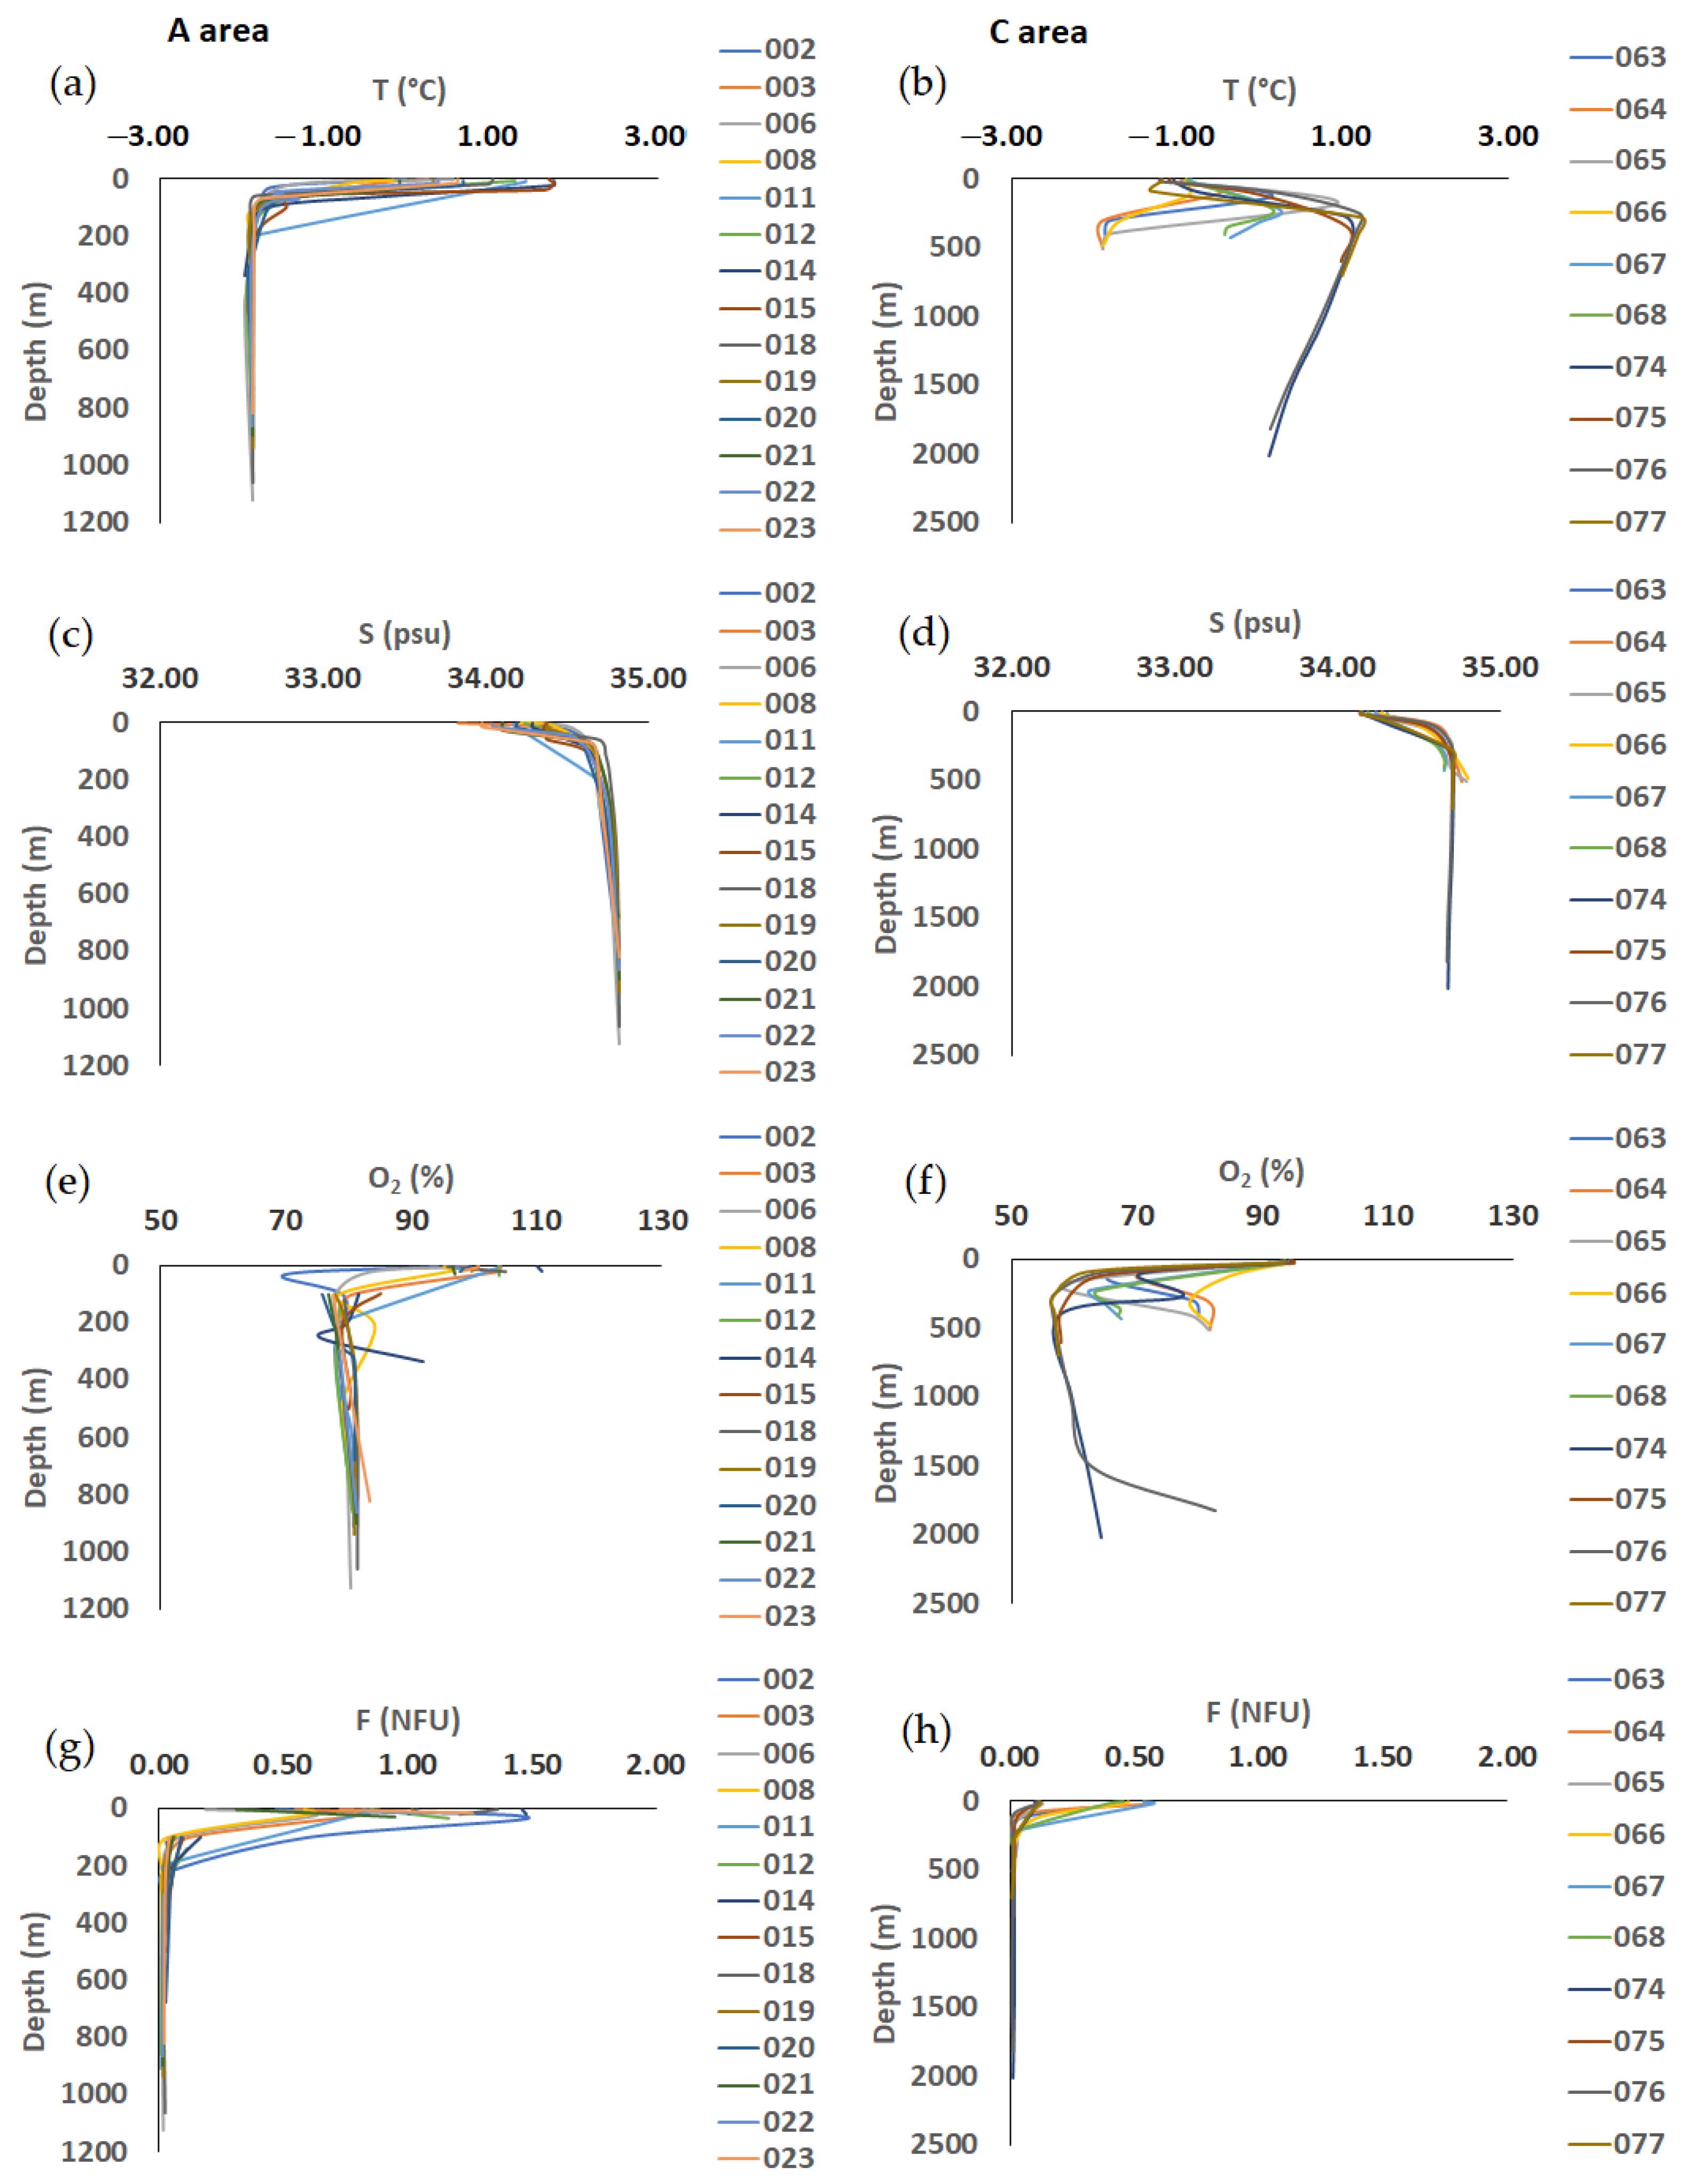
3.2. Hydrological Properties

The physico-chemical characteristics of the water column differed significantly between the euphotic (EZ, above 100 m) and the aphotic zone (AZ, below 100 m) in both of the areas (Figure 3). In the A area (Figure 3a), T values oscillated from +1.42 °C to −1.84 °C (stations 011 and 018 respectively) in the EZ, and from −1.49 °C (station 015) to −1.96 °C (station 015) in the AZ. Significant decreases (p < 0.01) were recorded in the EZ up to the upper ten meters of the AZ. In the C area (Figure 3b), T ranged from 0.83 to −1.21 °C in the EZ (at almost all stations), reaching positive values in the core of the CDW; at increasing depths, its values ranged between 0.36 and −1.90 °C at shallower stations, approaching 0 °C at deeper stations. Vertical T profiles were opposite between the two areas.
In the A area (Figure 3c), S varied between 34.16 and 34.55 (stations 011 and 019, respectively) in the EZ, increasing in the AZ to 34.71–34.79 (stations 014 and 018, respectively). Similar profiles were found in the C area, where S ranged from 34.14 to 34.38 (stations 075 and 064, respectively) in the EZ, increasing with depth to 34.63–34.74 (stations 063 and 068, respectively) at shallower stations and to 34.66–34.71 (stations 074 and 076, respectively) at deeper stations (Figure 3d).
DO saturation percentages ranged from 81 to 104% in the EZ, remaining with a depth in the range of 78–82% in the A area (Figure 3e); in the C area DO saturation varied in a narrow range (83–95%) in the EZ, decreasing to 58–82% in the AZ (Figure 3f). Similar fluorescence profiles were recorded in both the areas; in EZ the values ranged between 0.01 and 0.85 NFU in the A area, and between 0.01 and 0.42 NFU in the C area; from 100 m to the bottom, stable values of approximately 0 NFU were recorded (Figure 3g,h).

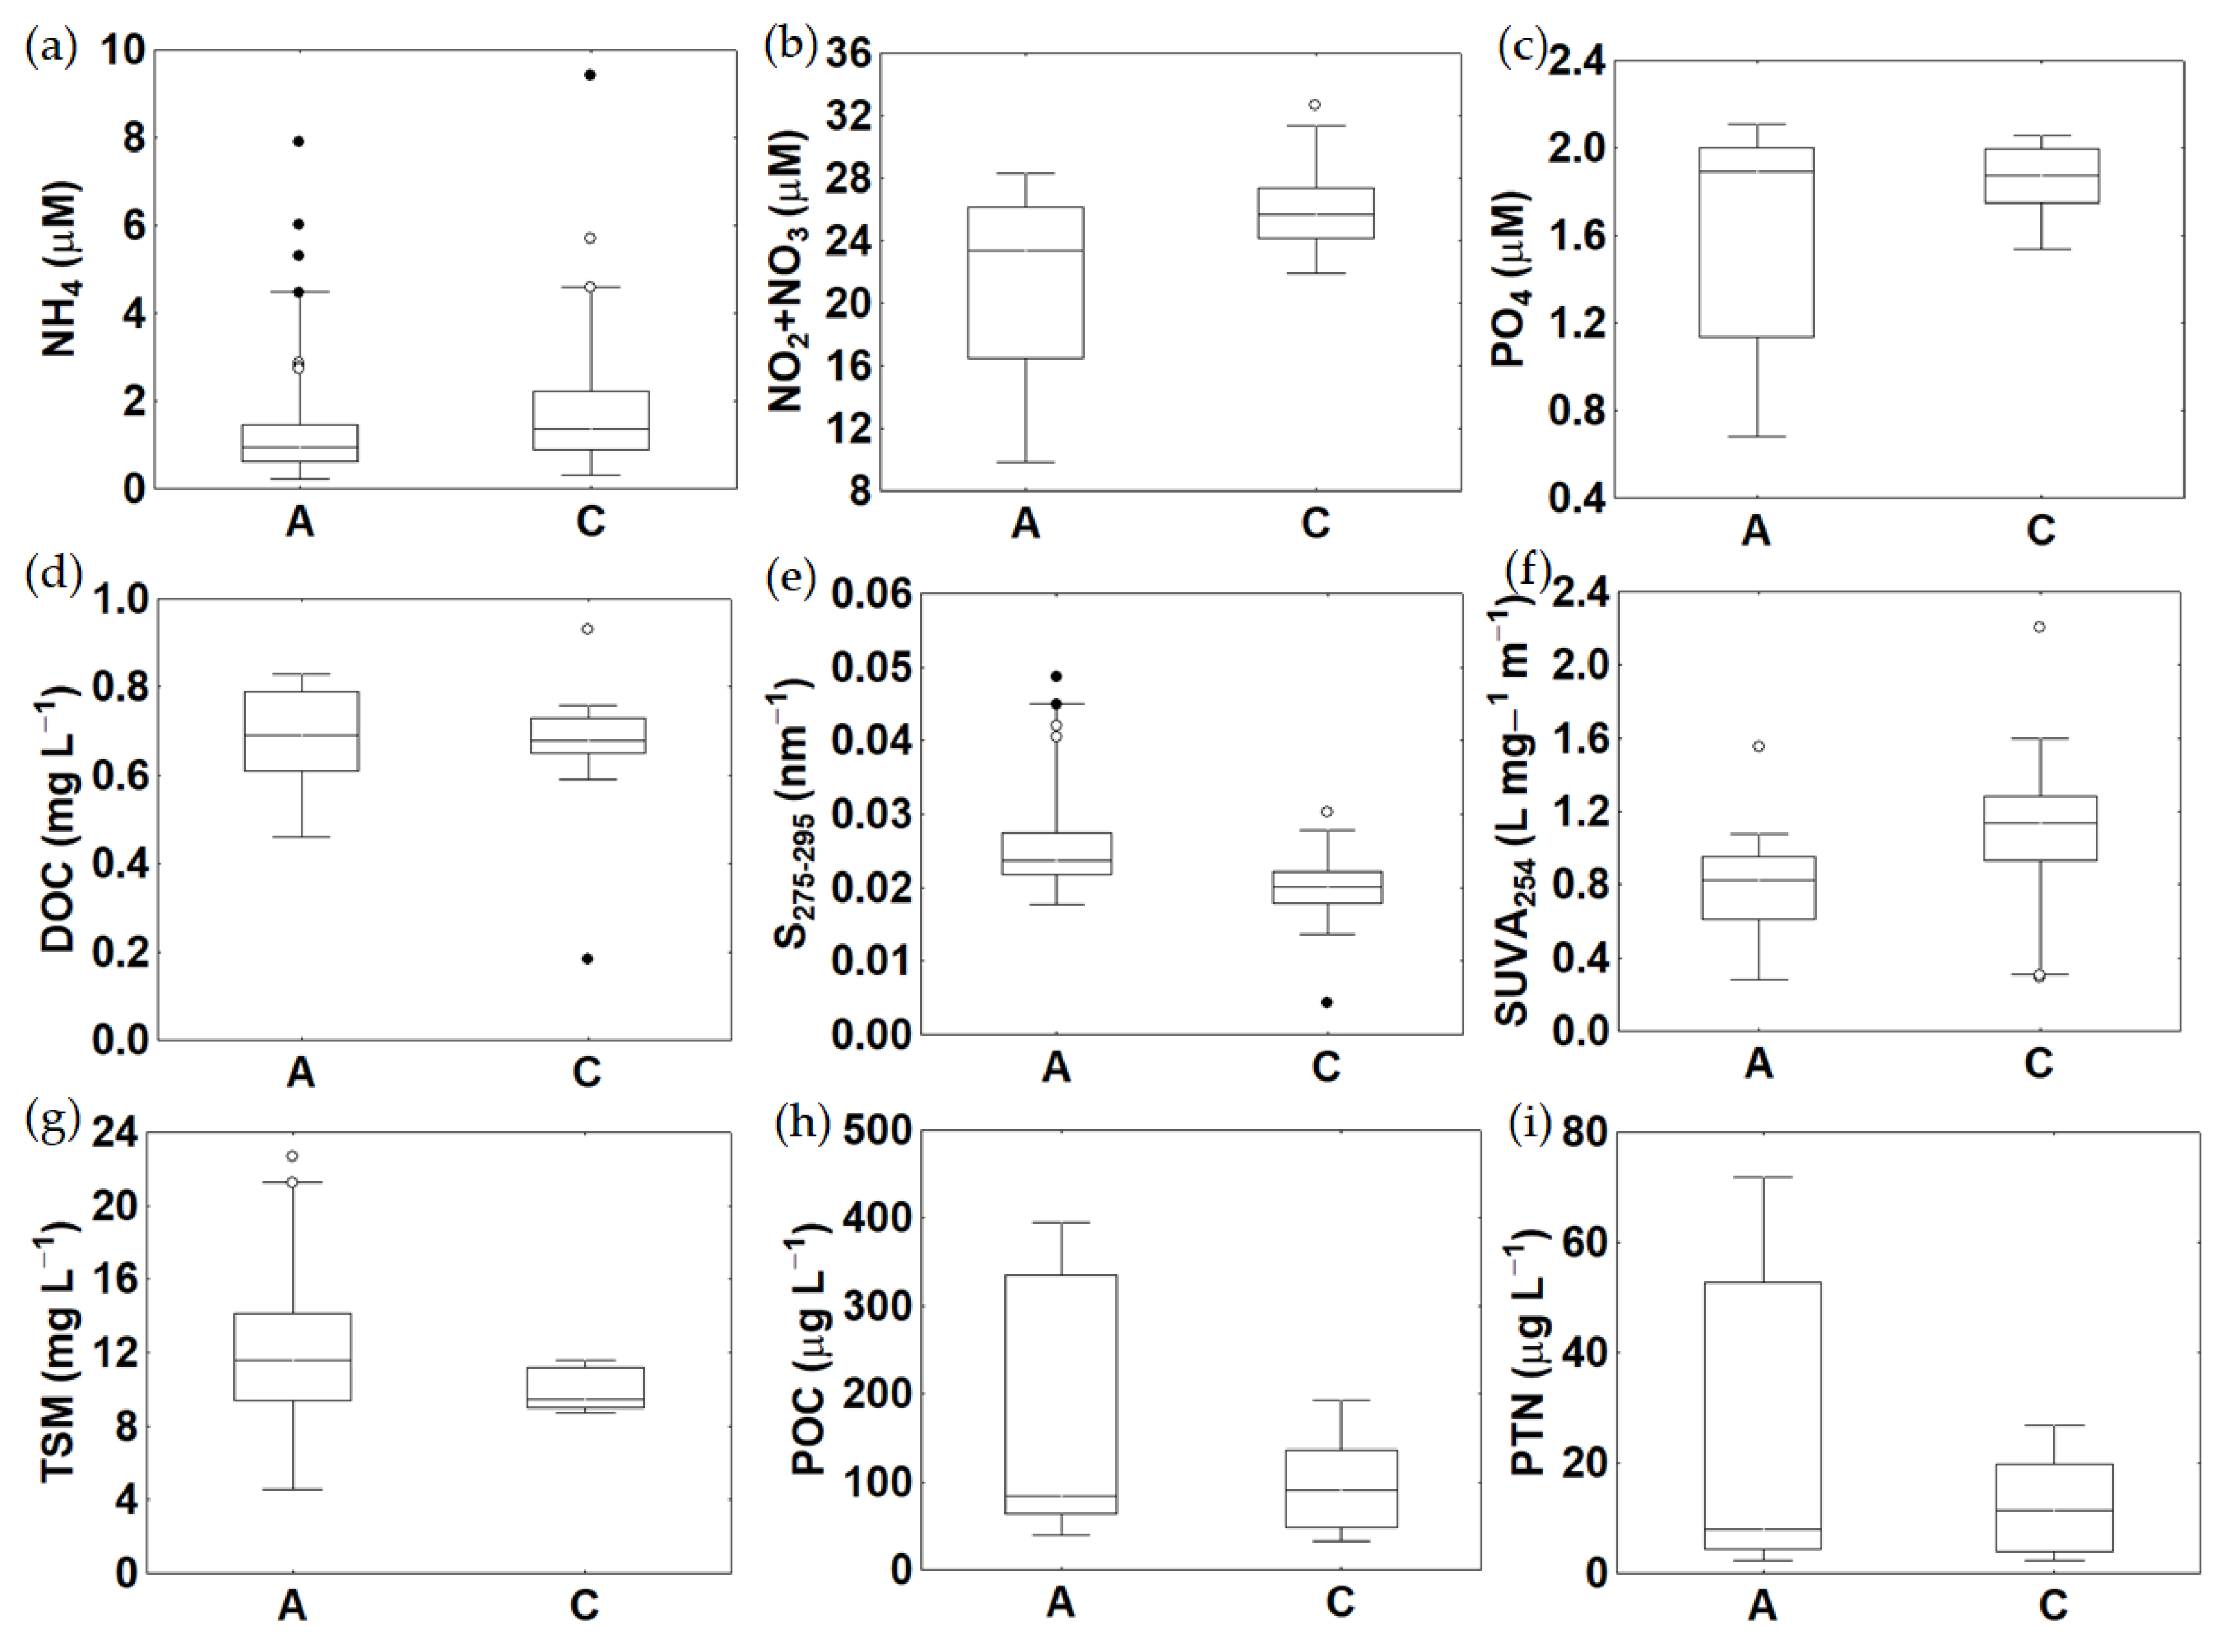
3.3. Trophic Variables

Concerning nutrients, both areas exhibited different trophic conditions. Ammonia concentrations were significantly different between the two areas (p < 0.01), with ranges of 0.11–7.91 μM in the A area, 0.17–9.41 μM in the C area, and extreme values in both of the areas (Figure 4a). A significant difference between the two areas (p < 0.001) was also observed for the oxidized nitrogen compounds NO2+NO3, with a wider variability in the A area compared to the C area, with concentrations varying from 9.05 μM to 32.97 μM in the A area, and from 21.53 μM to 32.69 μM in the C area (Figure 4b). A similar pattern was observed for PO4, whose mean concentrations were similar in the two areas, with ranges of 0.57–2.21 μM in the A area and 1.44–2.08 μM in the C area (Figure 4c).
DOC concentrations varied, not significantly, between 0.45 and 0.83 mg L−1 (n = 25) in the A area and between 0.18 and 0.93 mg L−1 (n = 30) in the C area, with similar mean values in both the areas, but with extreme and outlier values observed in the C area (Figure 4d).
For CDOM, the spectral slope values [from 275 to 295 nm (S275−295)] were significantly lower in the C area compared to the A area (p < 0.01), ranging from 0.02 nm−1 to 0.05 nm−1 in the A area and from 0.004 nm−1 to 0.03 nm−1 in the C area (Figure 4e). Also, S275−295 slopes showed a more fluctuating pattern within the A area than in the C area (Figure 4e). The SUVA index varied from 0.25 to 1.55 L mg−1 m−1 in the A area, and from 0.29 to 2.21 L mg−1 m−1 in the C area, displaying significantly higher mean values (p < 0.001) and a wider variability in the C area compared to the A area (Figure 4f).
TSM concentrations varied from as low as 4.45 mg L−1 to above 22.65 mg L−1 in the A area, while they were in a narrow range of 8.68–11.99 mg L−1 in the C area (Figure 4g), with significant differences between the two areas (p < 0.05). POC concentrations varied from 26.40 μgC L−1 to 451.00 μgC L−1 in the area A and in the range of 27.00–200.09 μgC L−1 in the C area, with a pattern largely different from that of TSM (Figure 4h). The PN pattern strongly reflected that of POC, with similar concentrations in both of the areas, but a wider variability in the A area, with ranges of 1.57–82.86 μgN L−1 in the A area and 1.70–28.07 μgN L−1 in the C area (Figure 4i).
Spatial patterns of the trophic variables (data not shown) showed lower values at the nearshore stations compared to the offshore stations within the A area, and an opposite distribution within the C area.

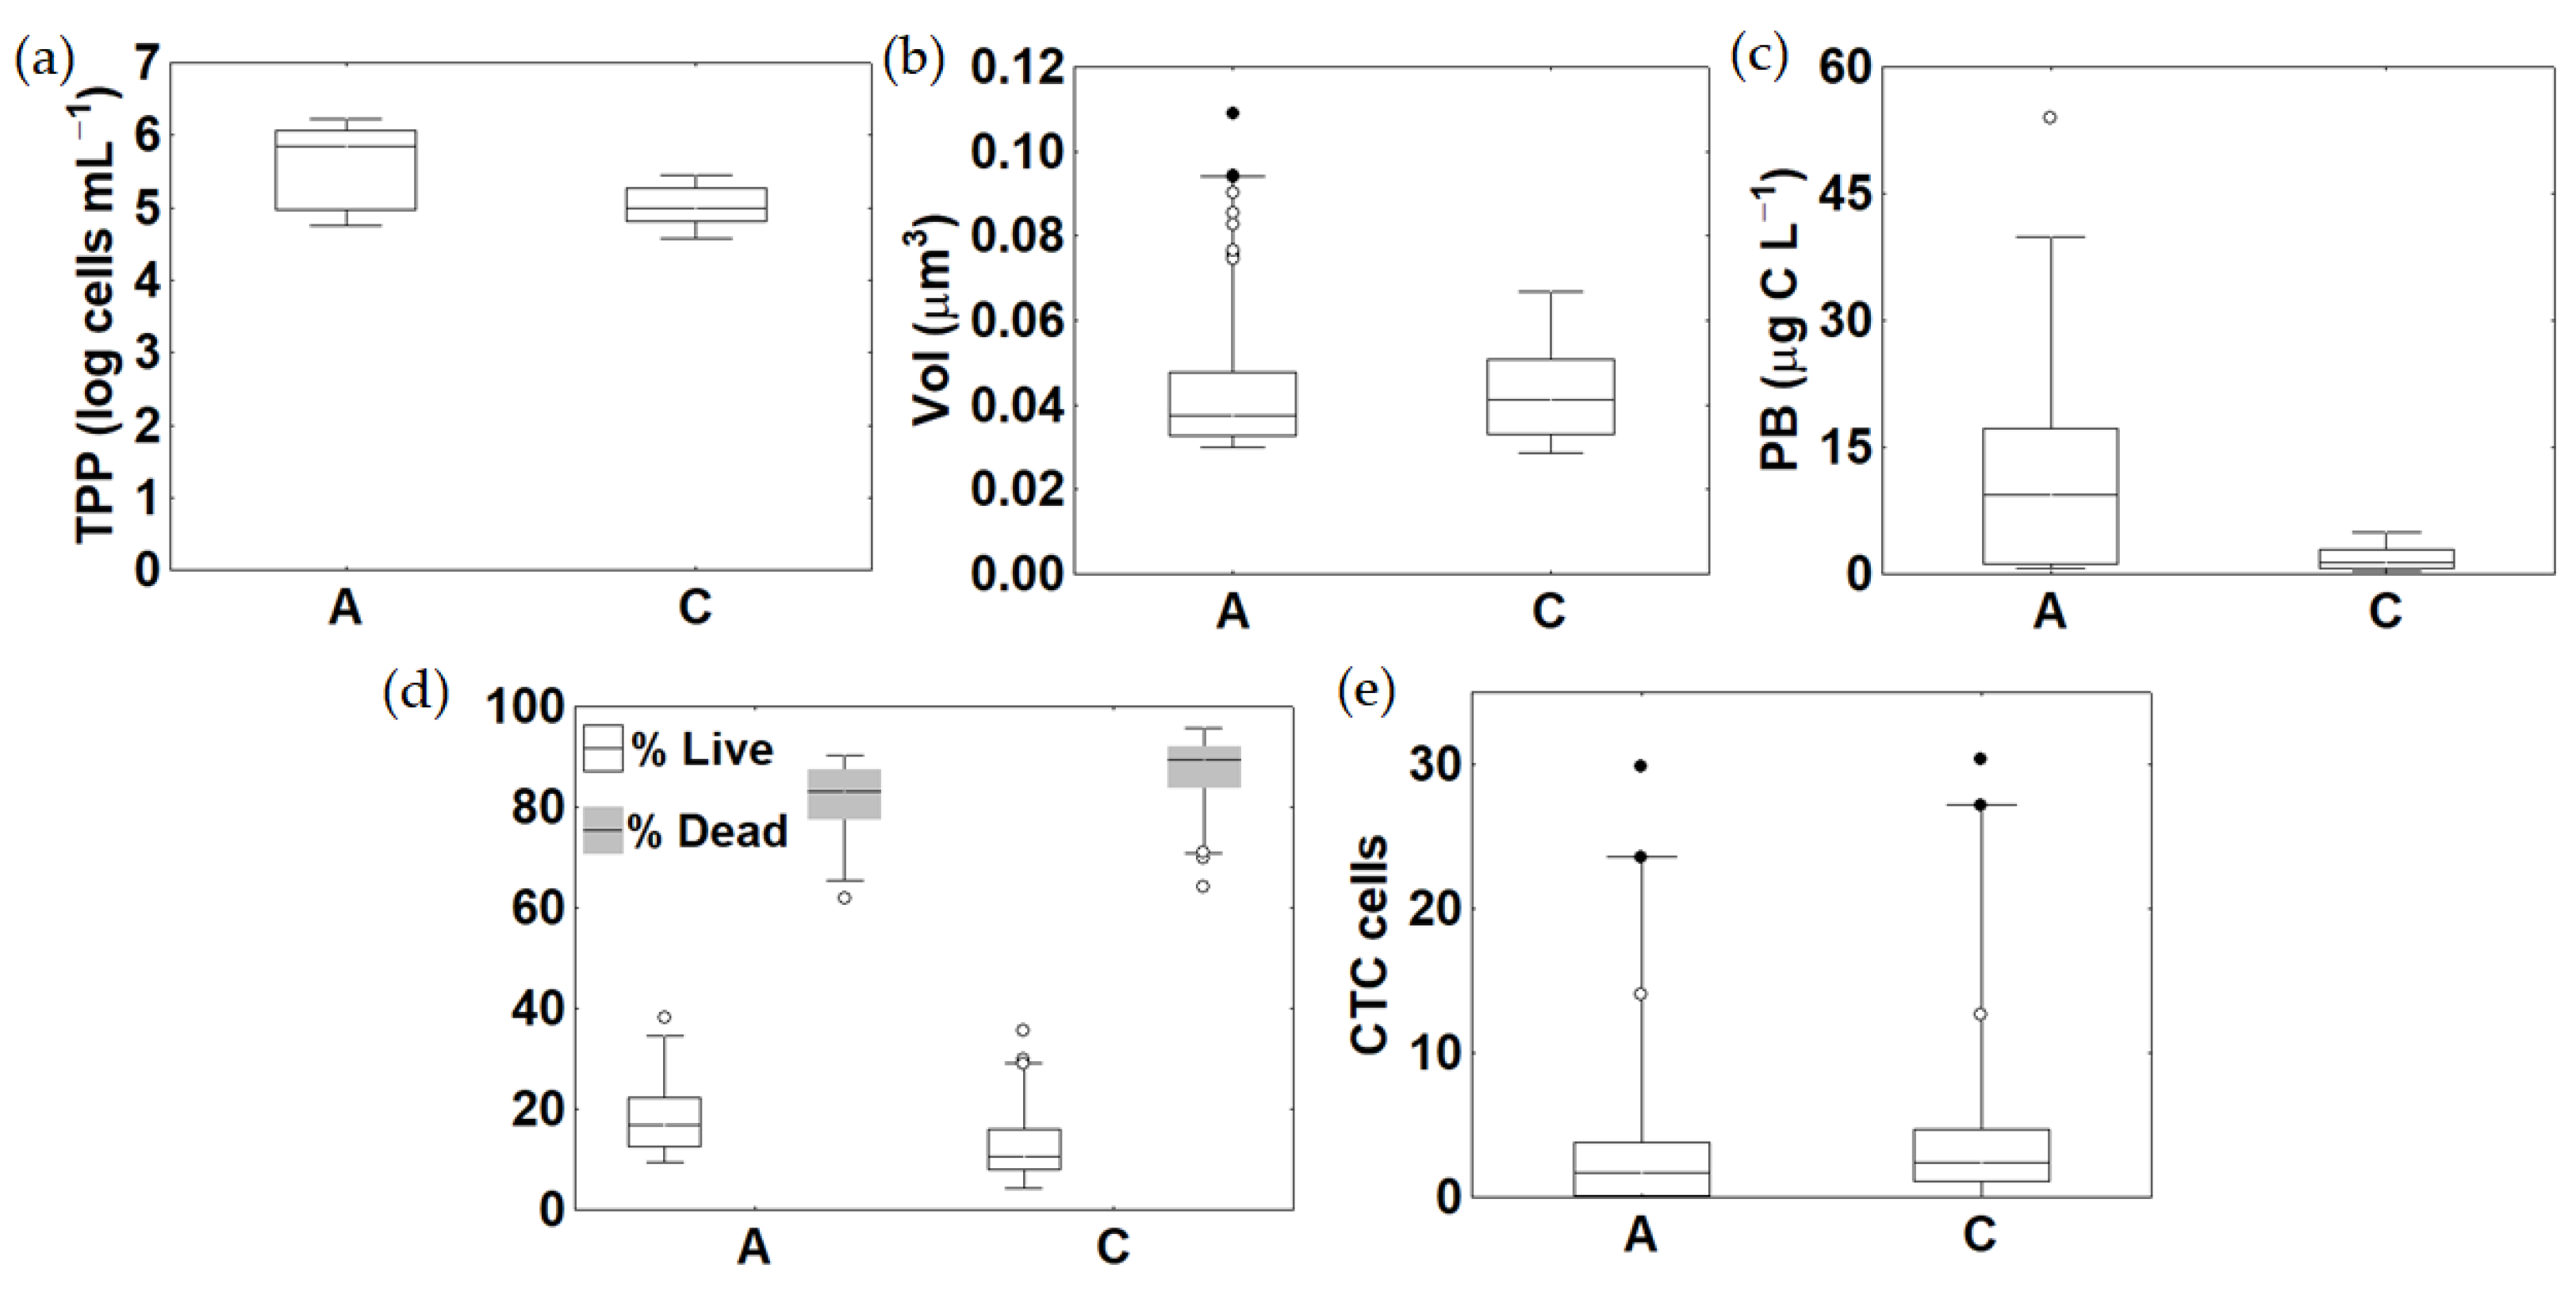
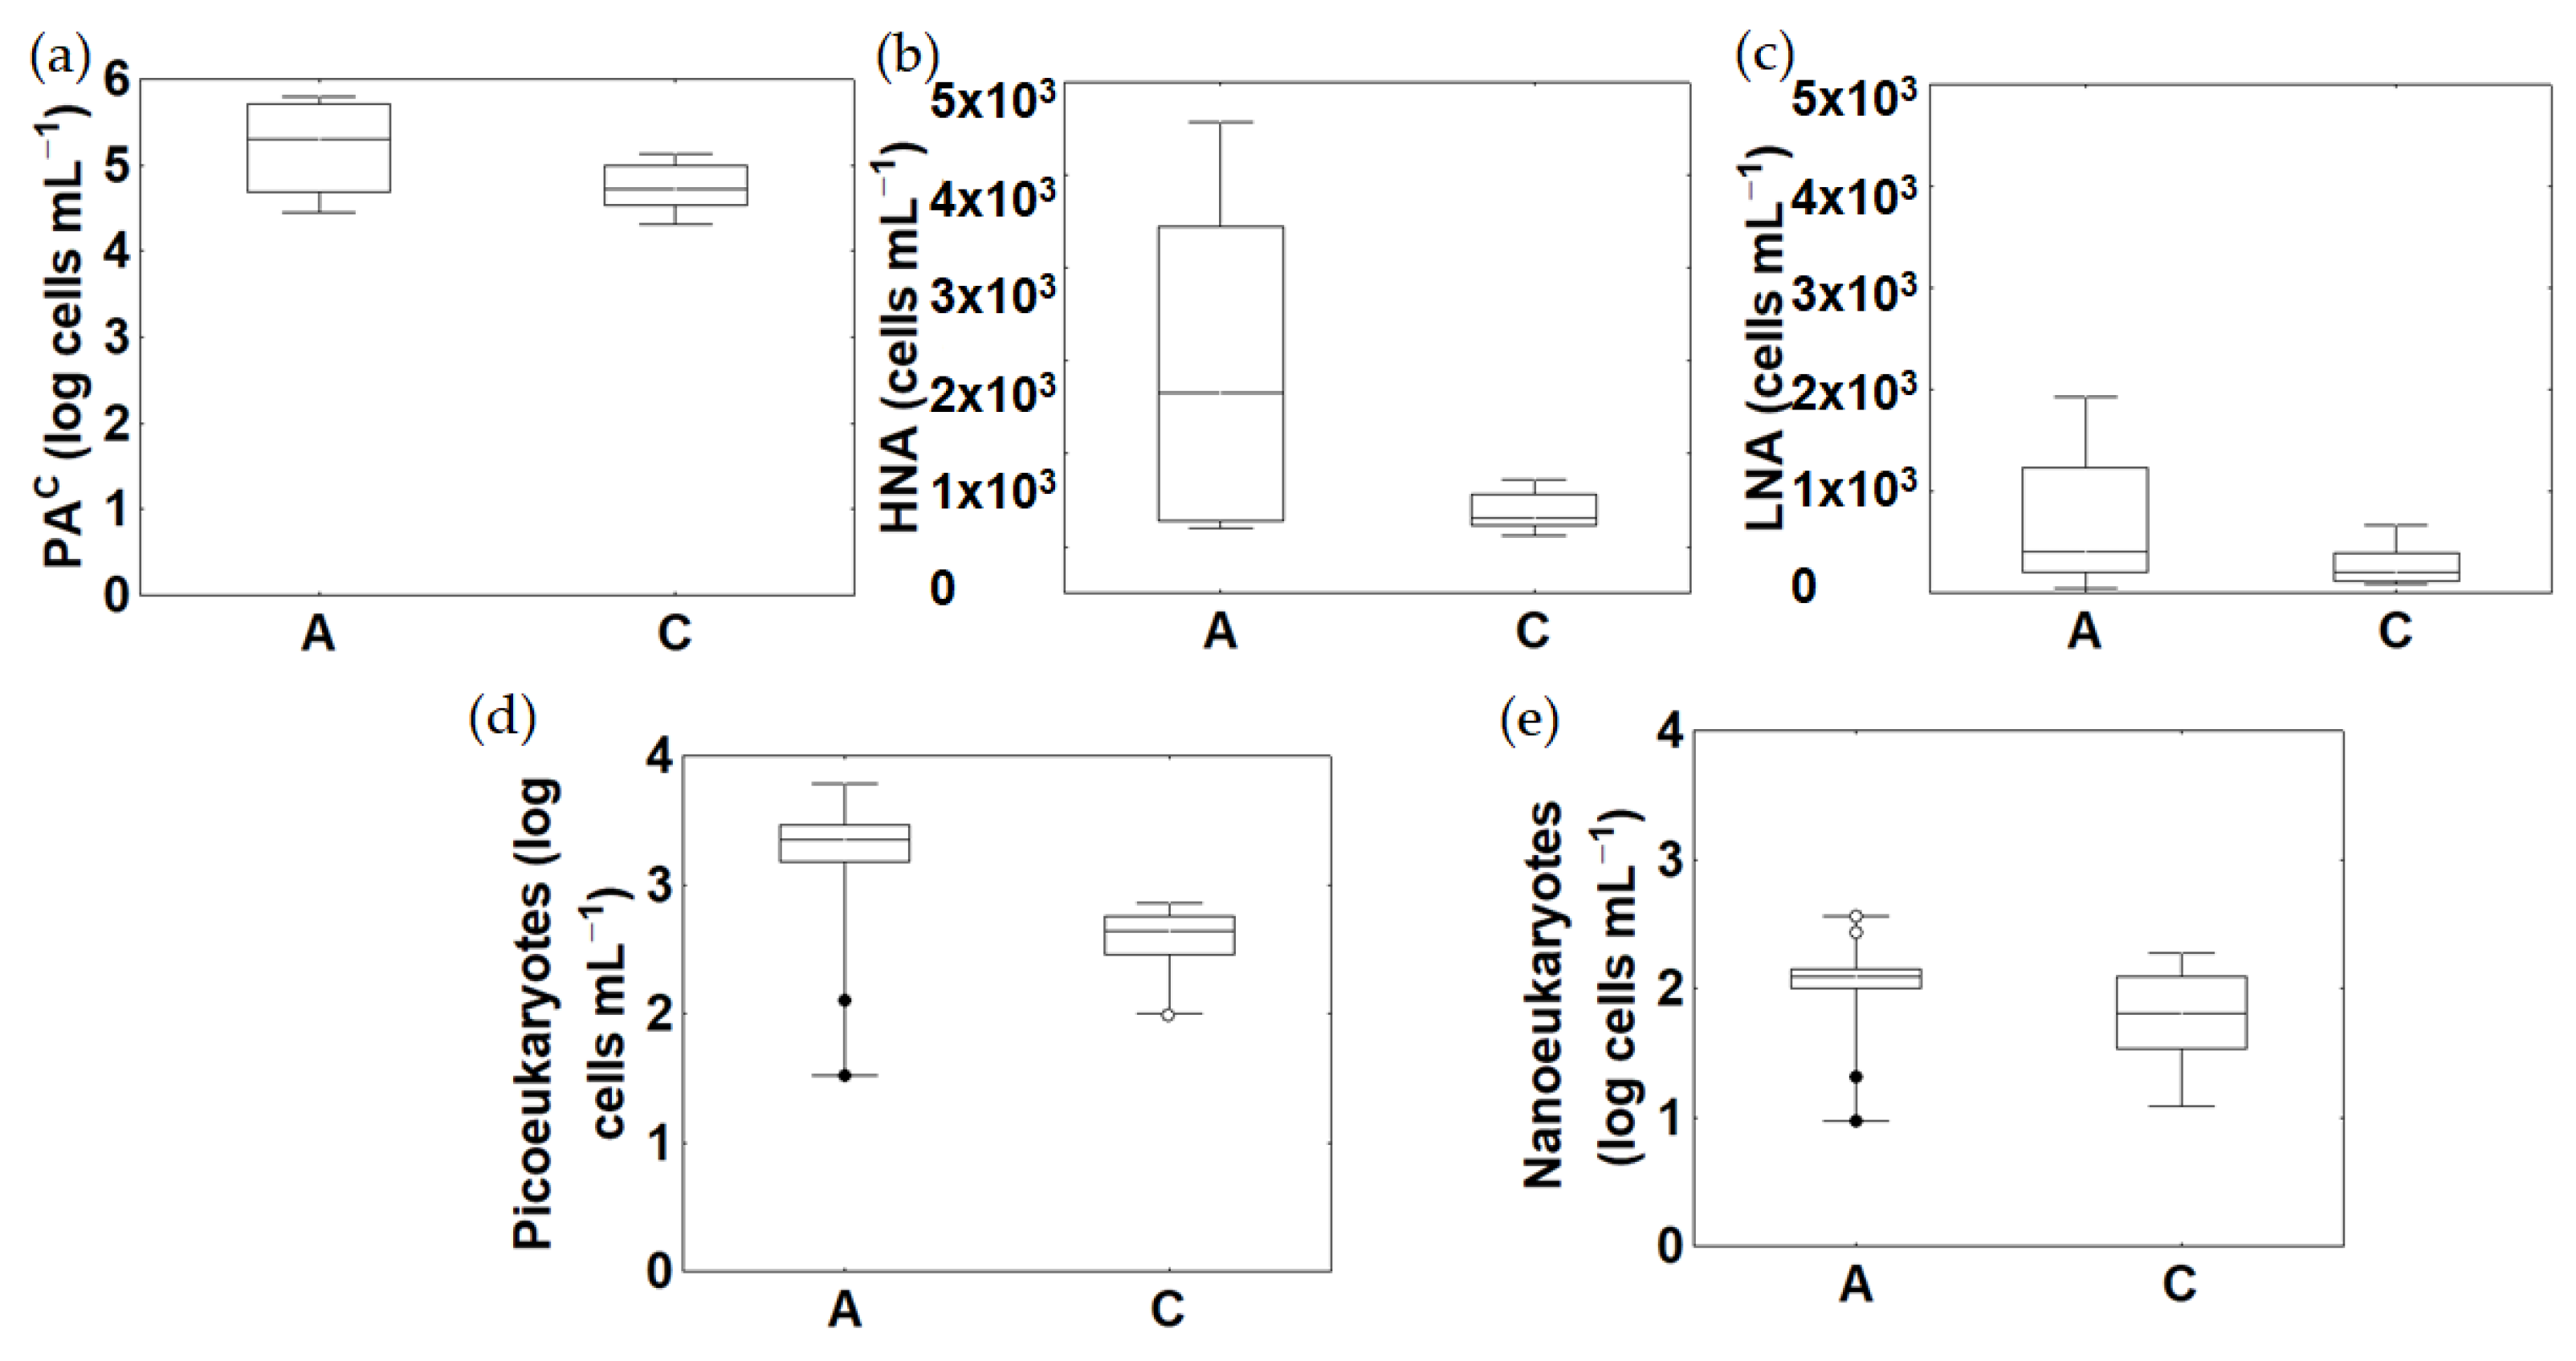
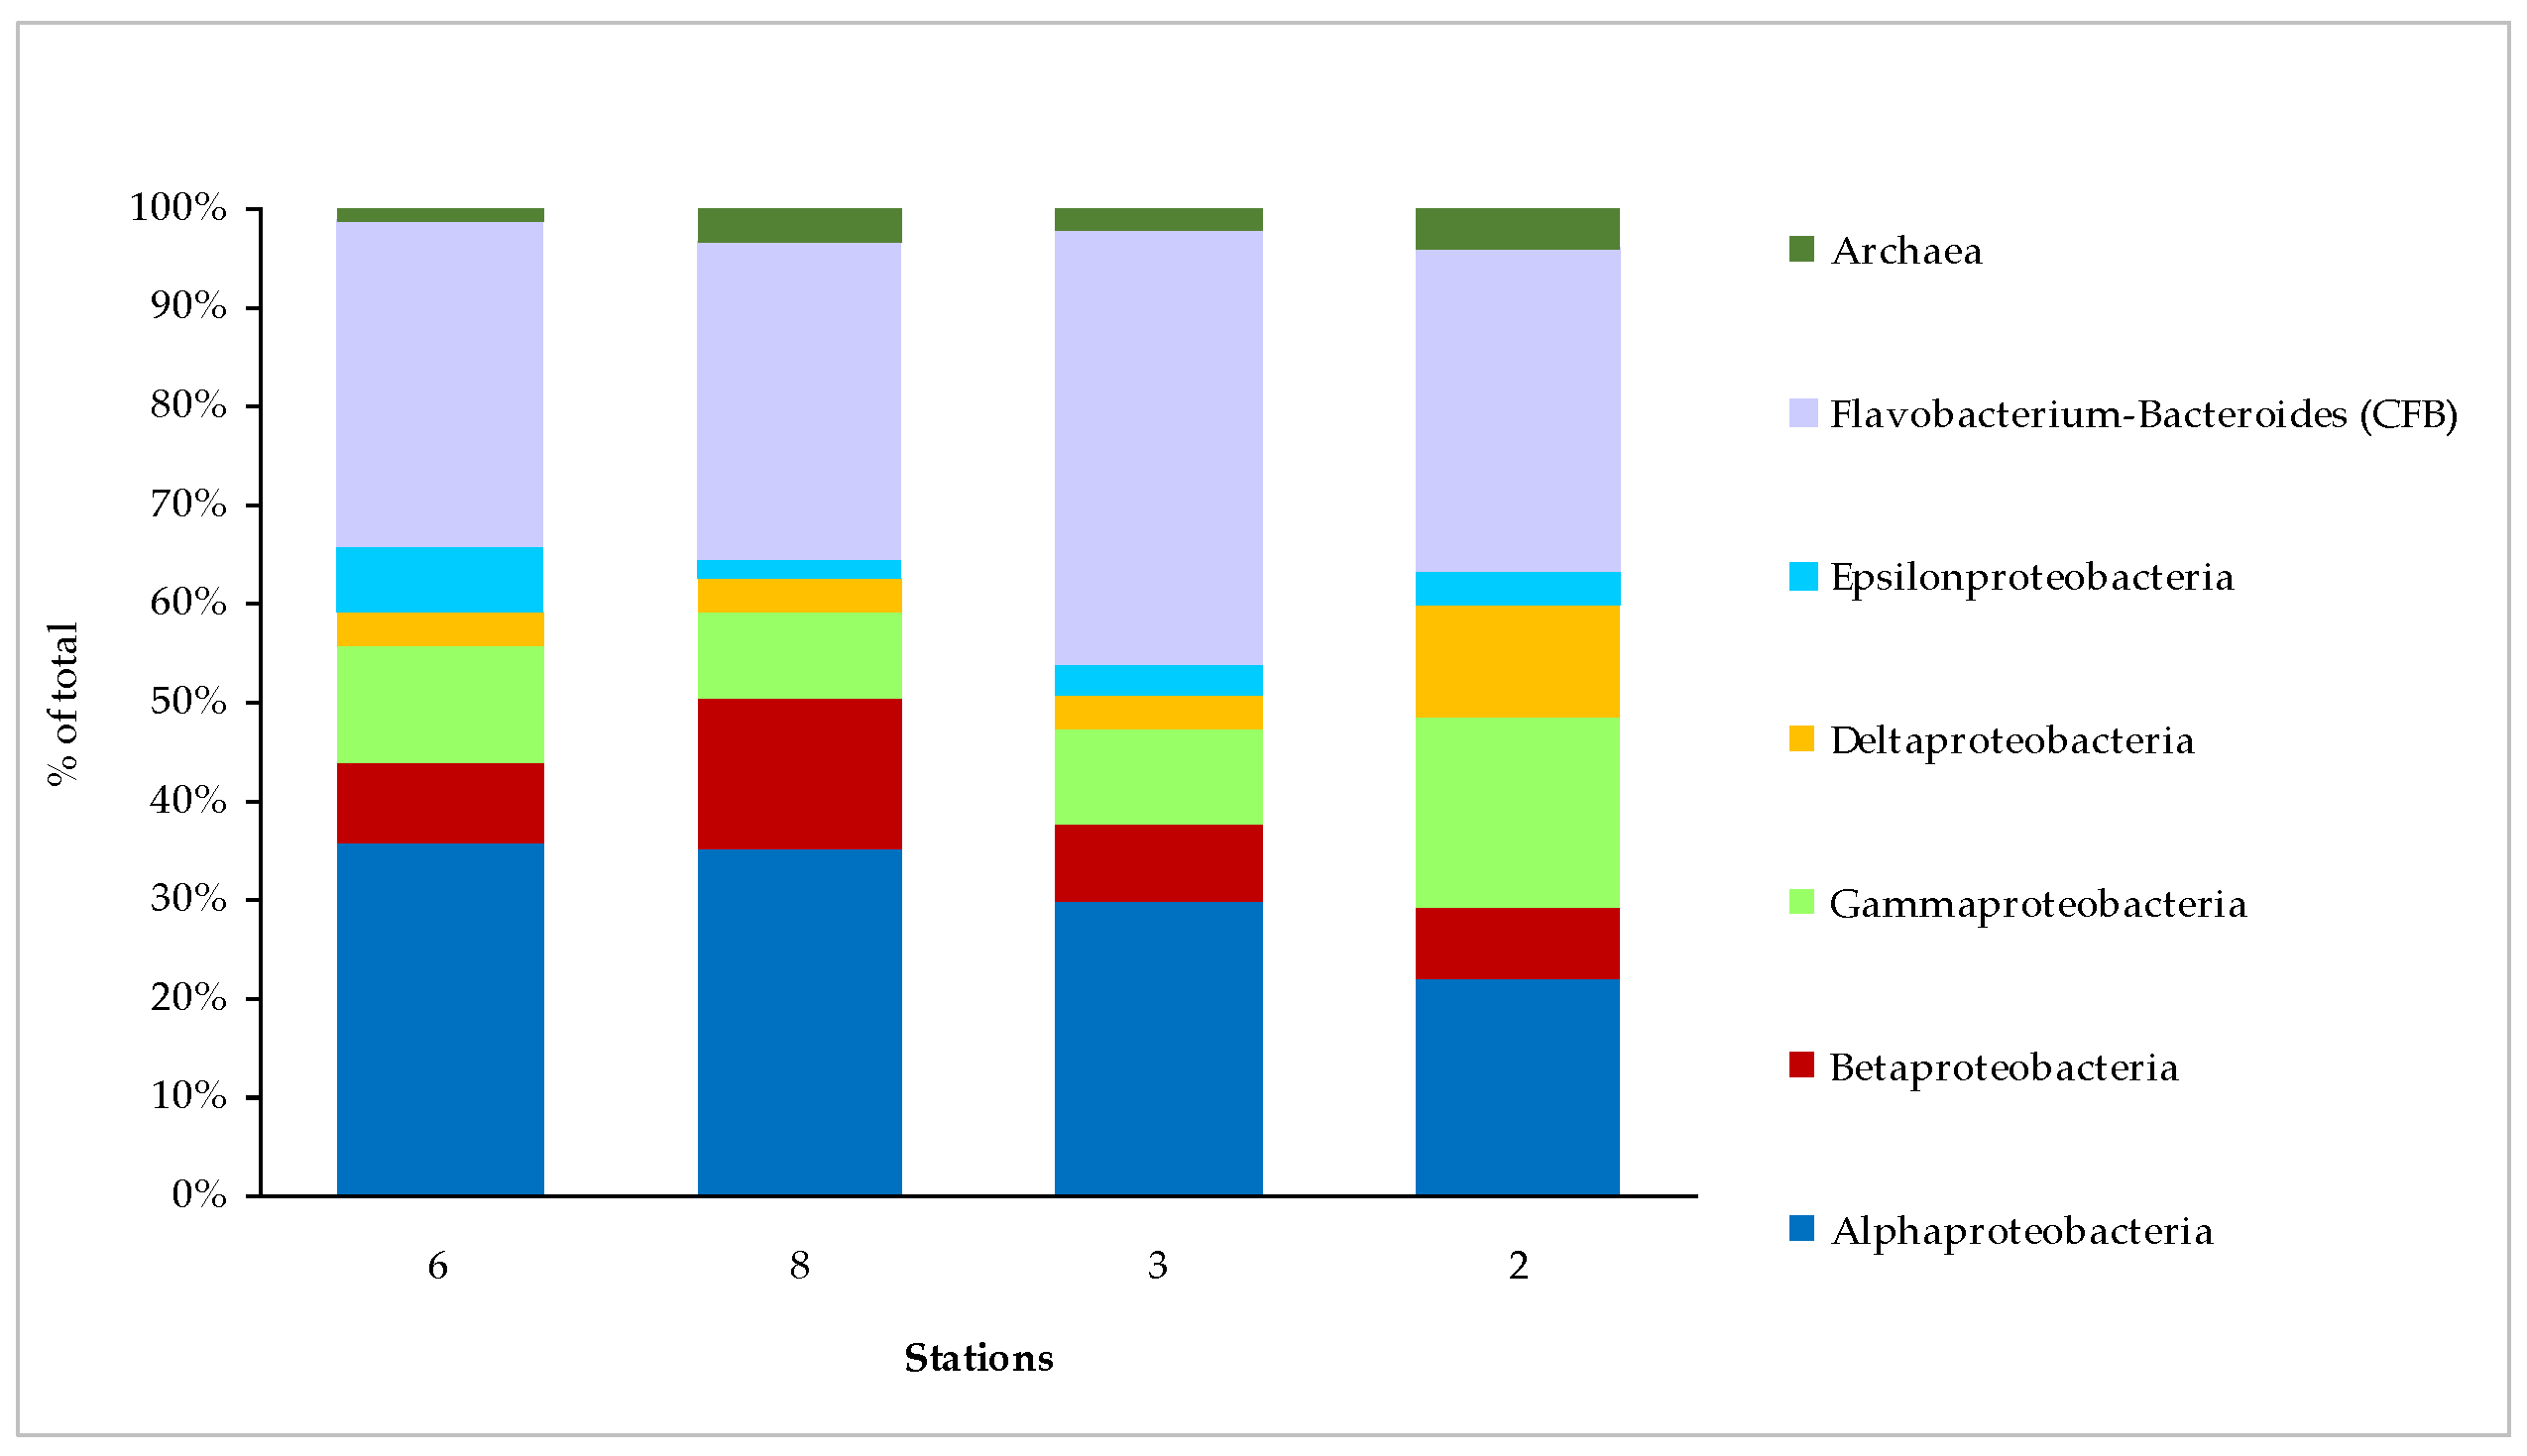
3.4. Microbial Abundance

Significant differences in the TPP, living and CTC+ cell abundance, and VOL and PB values were observed among the examined areas (Figure 5). TPP abundance, in the order of 105 cells mL−1, was significantly (p < 0.001) higher in the A area (mean ± s.d.: 7.41 ± 6.22 × 10⁵ cells mL−1) compared to the C area (1.29 ± 0.82 × 10⁵ cells mL−1) (Figure 5a). Contrarily to the TPP, VOL values were higher, although not significantly, in the C area (0.043 ± 0.012 μm3 vs. 0.050 ± 0.020 μm3 in the areas C and A, respectively) (Figure 5b). PB followed PPT distribution, with the highest values in the A area (12.05 ± 12.75 μg C L−1) (Figure 5c).
Living cells abundance (Figure 5d) depicted trends similar to the TPP, accounting for 18.38 ± 7.95% and 13.17 ± 7.56% of the total in the A and C areas, respectively. CTC+ cells (Figure 5e) accounted for similar percentages in the two areas (4.50 ± 7.65% and 4.99 ± 7.83% in the A and C areas, respectively).
At a spatial scale (data not shown) within the A area, the highest TPP abundance and PB values were recorded at station 019 (1.30 ± 099 × 106 cells mL−1 and 17.60 ± 15.67 μg C L−1, respectively), while VOL reached its maximum value at station 014 (0.08 ± 0.01 μm3). Live and CTC+ cells peaked at stations 008 and 003 (27.97 ± 11.57 and 16.39 ± 19.02% of total counts, respectively). Within the C area, the highest values of TPP abundance, PB, and VOL were recorded at station 066 (1.88 ± 0.89 × 10⁵ cells mL−1, 3.38 ± 1.78 μg C L−1, 0.055 ± 0.009 μm3, respectively), while the highest percentages of living and CTC+ cells were measured at stations 067 and 065 (19.86 ± 10.49% and 13.13 ± 12.11%, respectively).
Flow Cytometry counts of PAC, HNA, LNA, picoeukaryotes, and nanoeukaryotes showed that PAC abundance ranged from 2.66 ± 2.32 × 10⁵ cells mL−1 to 6.62 ± 3. 69 × 104 cells mL−1 in the A and C areas, respectively, with significant (p < 0.01) differences between the two areas (Figure 6a). HNA cell abundance was always higher than LNA, accounting for an average value of 60% and 68% of the total cells in the C and A areas, respectively; significant differences (p < 0.01) were observed between the two areas (Figure 6b,c).
Pico- and Nanoeukaryote counts reflected the same trend, with higher values and wider ranges of variation in the A area compared to the C area (Figure 6d,e). Picoeukaryote abundance varied from 1.38 ± 1.73 × 10³ cells mL−1 to 0.42 ± 0.19 × 10³ cells mL−1 in the A and C areas, respectively; values about two orders of magnitude lower were recorded for Nanoeukaryotes (ranging from 7.80 ± 9.20 × 101 cells mL−1 to 5.05 ± 5.79 × 101 cells mL−1 in the A and C areas, respectively).
Within the A area, the highest abundance of PAC was recorded at station 002 (data not shown), while HNA and LNA cells were more abundant at stations 022 and 015, respectively. Pico- and nano-eukaryotes reached their highest abundance at station 015 too. Spatial distribution patterns within the C area showed the highest total prokaryotes and LNA cell abundance at station 068, while HNA peaked at station 064; pico- and nano-eukaryotes were more abundant at stations 065 and 064, respectively.
Microbial composition analyzed by CARD-FISH evidenced the predominance of the Flavobacterium-Bacterioides (CFB) group at all the stations of the A area (Figure 7). Within Proteobacteria, spatial differences were observed in their relative contribution, with Gamma- and Delta-proteobacteria predominating at station 002, while Alphaproteobacteria prevailing at stations 006 and 008. Low percentages of Archaea were found, with higher numbers at station 008.
Mean culturable heterotrophic bacterial counts varied from 1.51 × 10³ ± 2.28 × 10³ Colony Forming Units (CFU) mL−1 to 2.21 × 10³ ± 1.39 × 10³ CFU mL−1 in the A and C areas, respectively (Figure 8). Within the A area, higher abundance was observed at station 006 (3.53 × 10³ ± 3.40 × 10³ CFU mL−1) and values one order of magnitude lower at stations 018 and 020 (lower than 1.70 × 10² CFU mL−1); within the C area, culturable bacteria were more abundant at stations 064 and 066, where they reached peak values of 4.32 × 10³ CFU mL−1 (20 m depth) and 4.05 × 10³ CFU mL−1 (120 m depth), respectively.

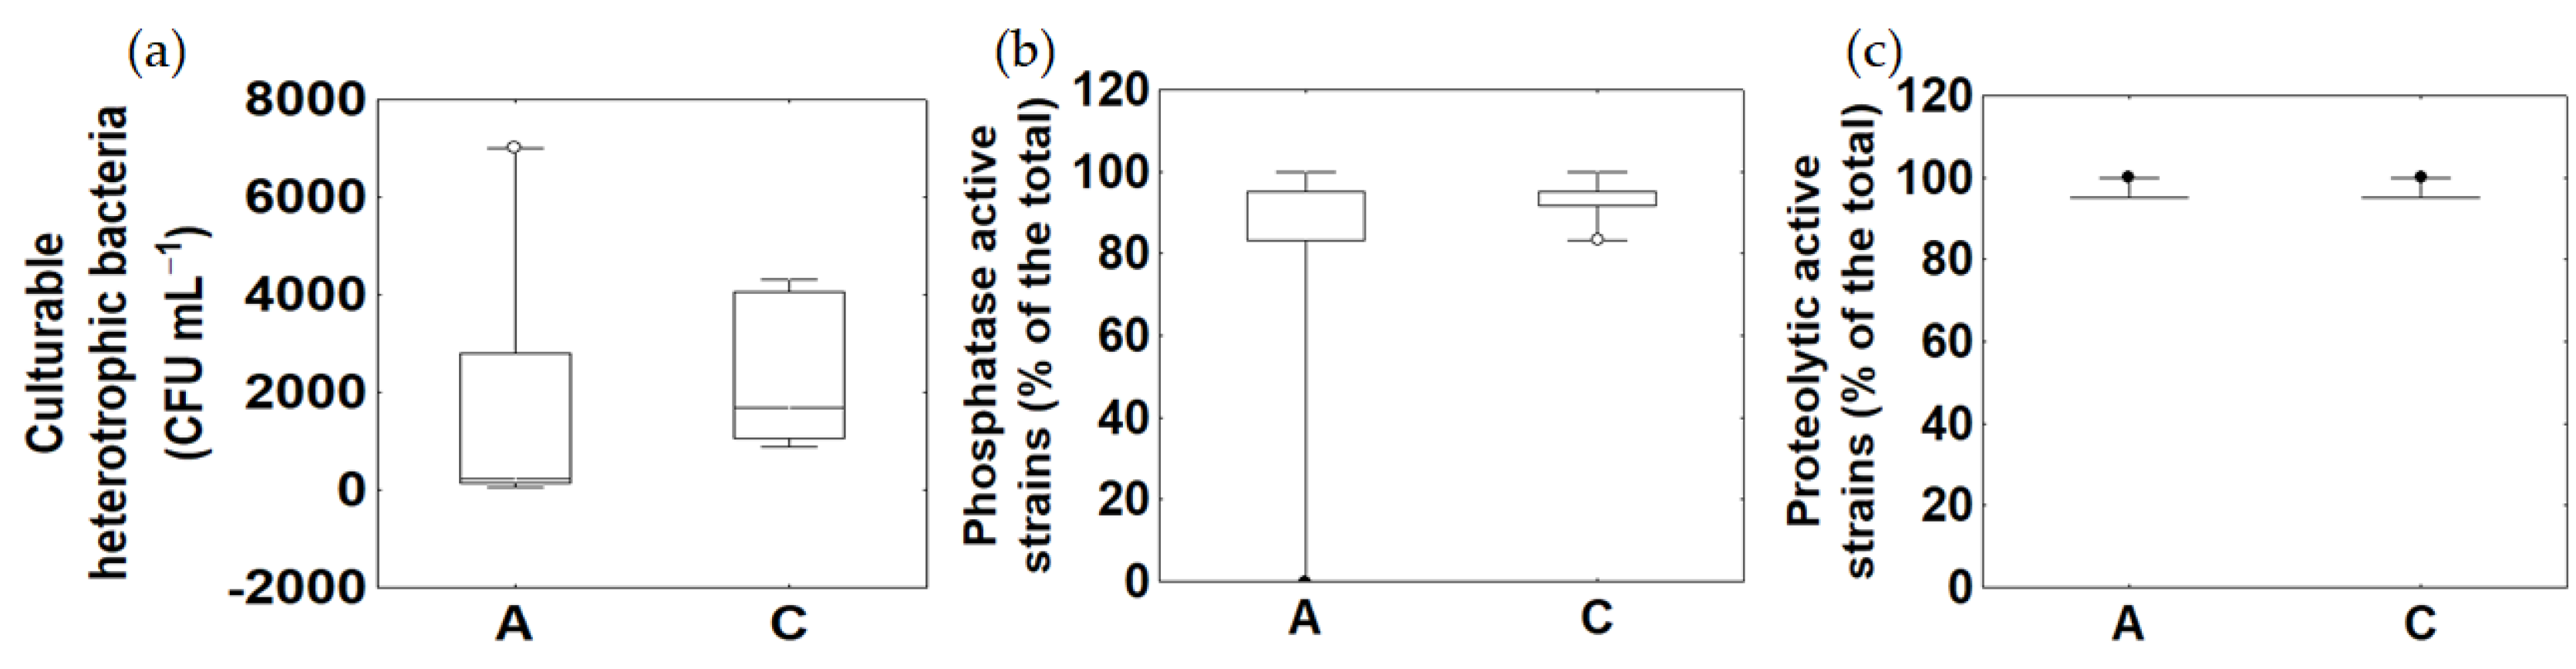
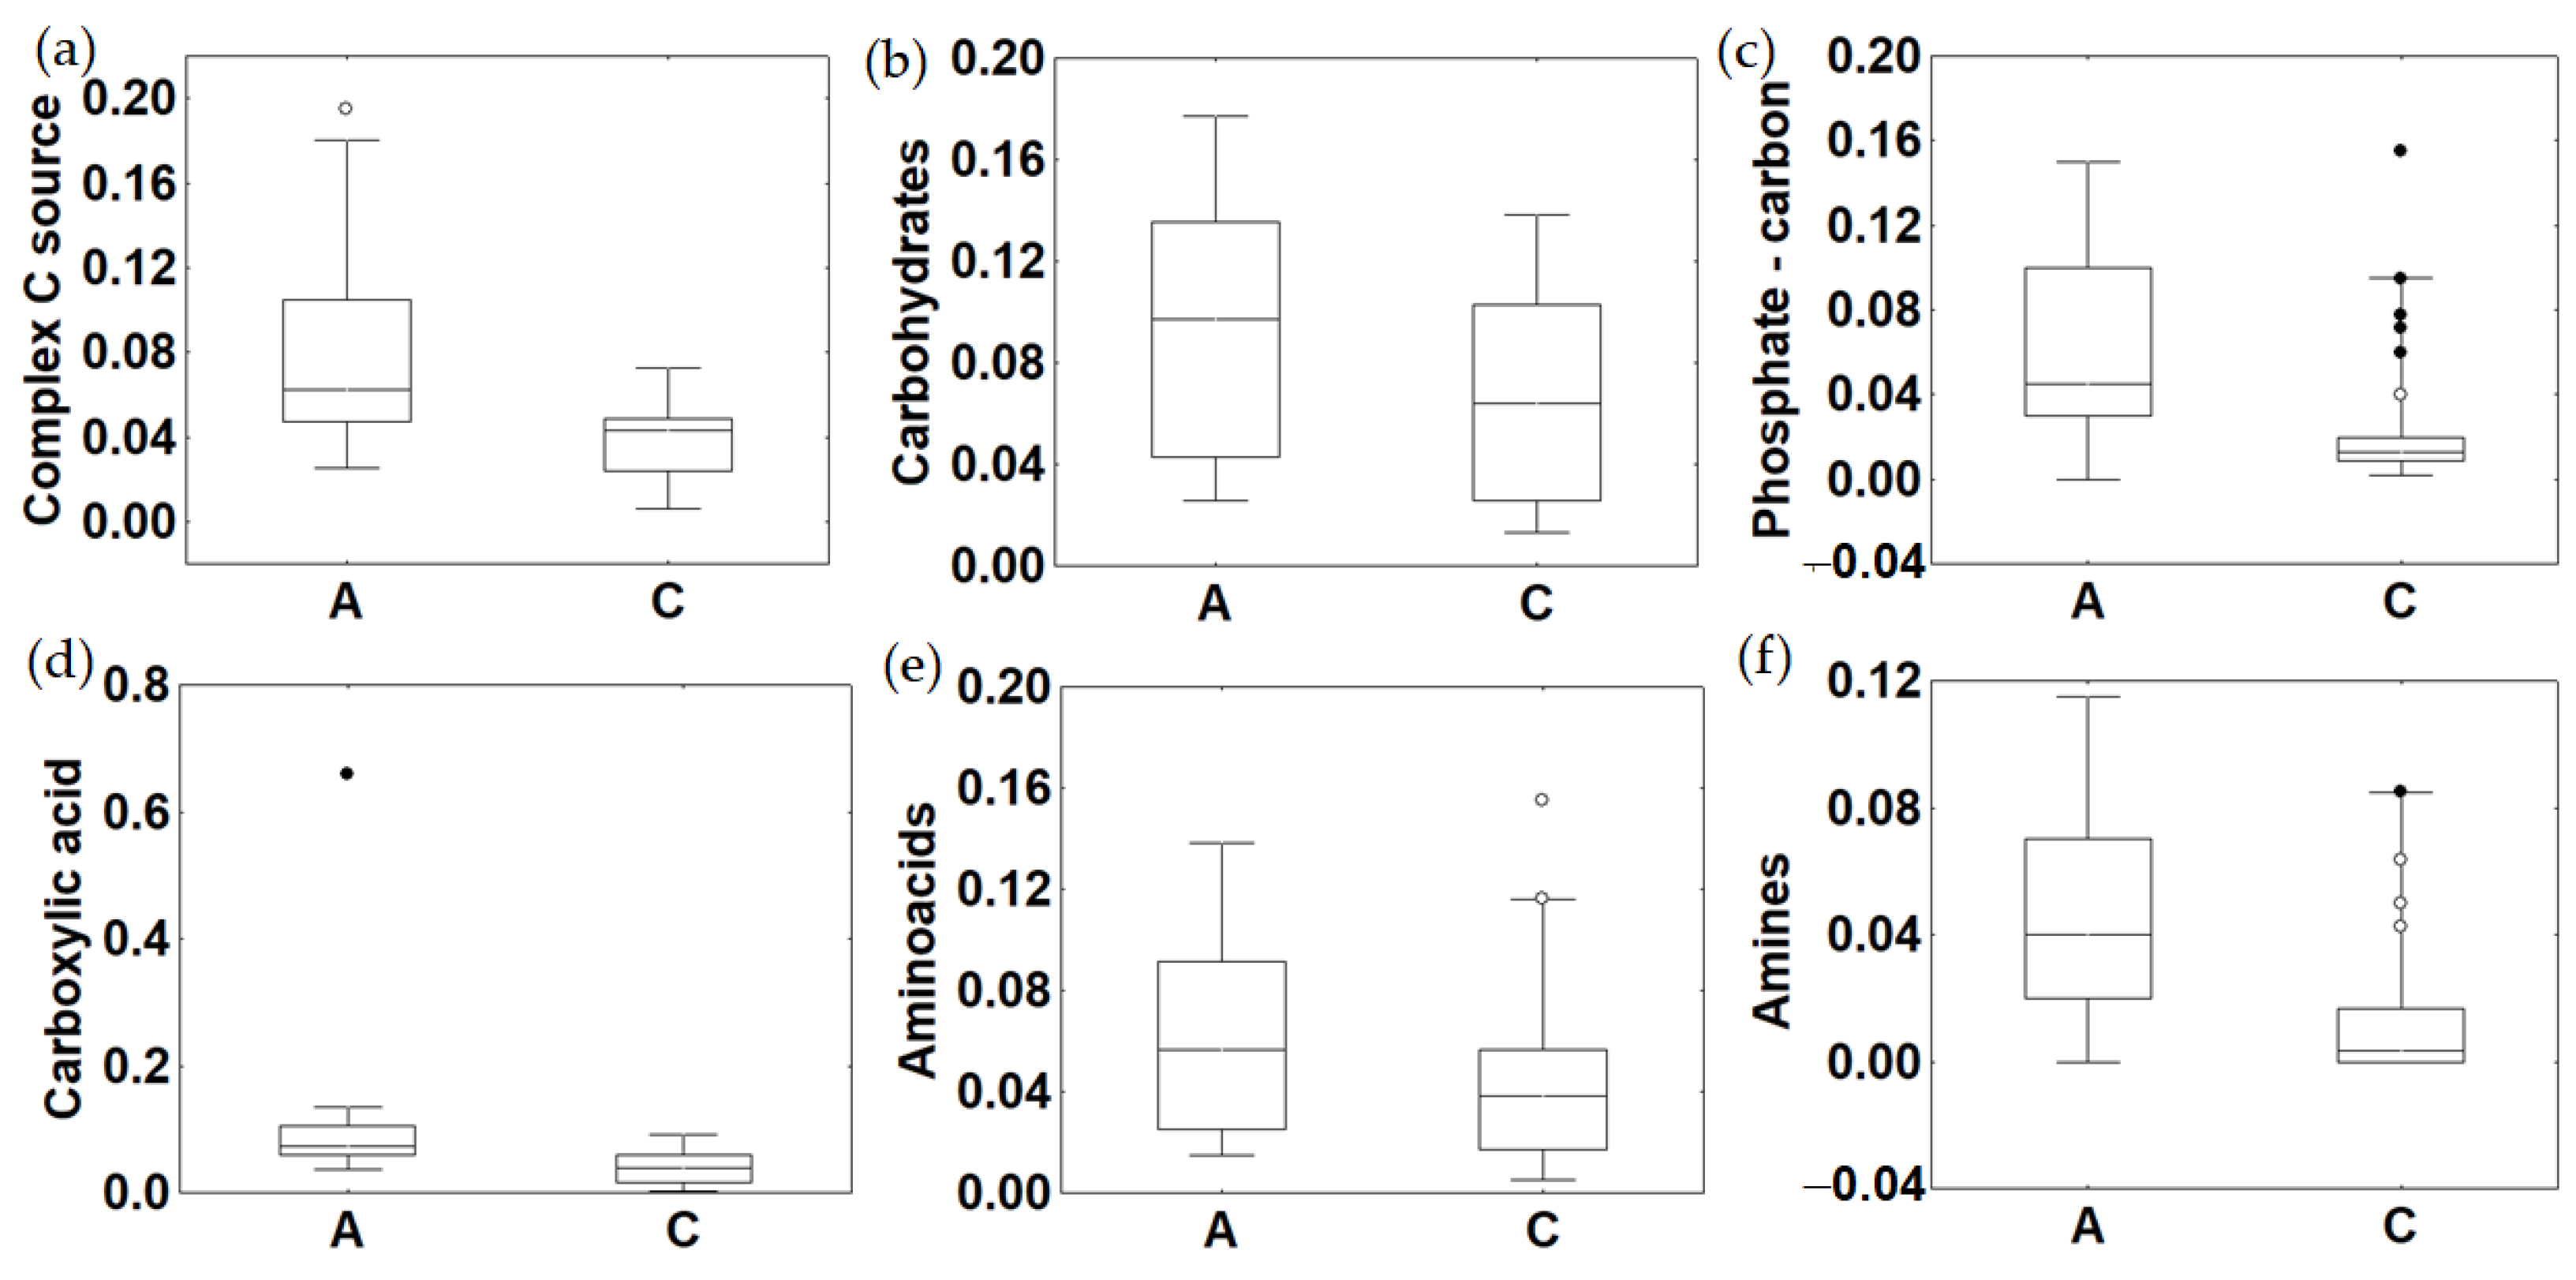
3.5. Microbial Metabolism

Bacterial isolates screened for LAP and AP positivity showed that proteolytic and phosphatasic enzyme activities were the most expressed by the bacterial strains, while none of them showed glycolytic activities (i.e., alpha- and beta-glucosidase) (Figure 8). A percentage of 95–100% of the bacterial isolates exhibited proteolytic activity in the A area, compared to 67–100% of those from the C area. Phosphatase activity was detected in percentages from 95–100% and 83–100% of the bacterial strains isolated from the A and C areas, respectively.
Community metabolism estimated by Biolog ecoplates (Figure 9) suggested that, except for carbohydrates and amino acids, there were significant (p < 0.01) differences between the A and C areas. In the A area, the microbial community was able to utilize carbohydrates, complex C sources and Phosphate-Carbon compounds, as well as amino acids as the main Carbon sources; the least utilized C substrates were amines. Conversely, in the C area, carbohydrates were the most utilized compounds (Figure S1B, Supplementary file); at DCM and CDW, the highest numbers of used substrates were recorded. Within the complex C sources, Tween 40 was the most frequently metabolized, while itaconic acid was the most frequently metabolized among the carboxylic acids. Among the amino acids, the microbial community metabolized preferentially L-asparagine and phenylethylamine among the amines. Among the carbohydrates, i-erythritol was the most used, while D-mannitol was metabolized at stations 014 and 063 only. Within the P-C sources, D-l-glycerol P and glucose P were most used. At coastal stations 008, 003, and 002, the highest values of AWCD were recorded; the same result was observed at station 020 at the deep layer, and at station 064 at DCM. Generally, AWCD values were higher at DCM than at the deep layer, resulting in a decreased ability to metabolize carbon substrates with increased depths (Table S1 Supplementary file). Most of the substrates showed a high percentage of utilization (>2%), accounting for between a total of 15 and 23 substrates at T0 and T15-T24, respectively. Some compounds were utilized at a high level (>6%) (data not shown).

4. Discussion

During the last three decades, significant advances have been recorded in microbiological research in Antarctic ecosystems, leading to relevant findings in Antarctic microorganisms and their ecology [56]. In the Ross Sea, several studies on microbial abundance, structure, and processes [10,11,12,14,15,16,19,25] provided new insights on the microbial dynamics in this extreme environment. Nevertheless, knowledge gaps persist regarding the relationships that link microbial community abundance, diversity, and metabolism to the environmental, physical, and trophic properties, mostly due to the fragmentary datasets. This study is a further contribution to explore how the microbial community components and the environmental structure change over a spatial scale in the Ross Sea, considering two topical areas.

4.1. Spatial Variability of Environmental and Microbial Parameters

Environmental, trophic, and biological parameters are differently characterized the two investigated areas of the Ross Sea. Compared with the C area, in the A area, higher surface T values were found, as reported in previous studies [18,19], as well as the presence of slightly colder, more productive, and less salty waters in nearshore compared with offshore sites (Figure S1, Supplementary file). The statistical significance of the differences in the hydrological and trophic variables (Table S2, Supplementary file) suggested that sub-systems with different hydrological and biogeochemical properties coexist within the Ross Sea.
As also observed during the ice-melting period by Rivaro et al. [57], the hydrographic structure and local geomorphology of the Ross Sea affected the nutrient concentrations and availability during the observation study. Nutrient-enriched waters were found in the C area, while the negative correlations (p < 0.05) between nutrients and fluorescence (Table S3 Supplementary file) observed in the A area indicated that phytoplankton growth (shown by the fluorescence increase near to the coast) was responsible for nutrient consumption.
TSM, POC, and DOC distribution reflected the different hydrological conditions, with significant spatial differences between the A and C areas as well as between the nearshore and offshore stations. TSM and POC values were in the same range as reported by Carlson et al. [58] for the Ross Sea in the summer period. The organic matter pool was mostly composed by detritus (C/N ratios from POC/PN were >8), probably related to ice melting, but a different quality of this pool was observed in the A area (C/N ratios 10.45 ± 4.70) compared to the C area (9.97 ± 3.60). Within the A area, peaks in C/N ratios were recorded at the coastal stations 12 (18.74), 11 (14.38) and 6 (10.28).
DOM levels and optical properties in marine systems generally reflect catchment properties, anthropogenic input, and local hydrology and productivity [59]. Lower DOC values observed at the coastal sites of the A area confirmed previous studies carried out in the same area [24], and suggested a DOC consumption by photo-oxidation processes and heterotrophic microbial activity rather than production by phytoplankton release, despite the high productivity of the area. A higher heterotrophic microbial activity was consistent with higher TPP and CTC+ abundance recorded in this area compared to the C area; in addition, the increase of metabolic activity in deep waters suggested a sink of organic matter. Differences in DOM composition observed between our study and that carried out by D’Sa et al. [24] reflected the occurrence of different organic matter sources. In our survey, lower molecular weight (higher S275−295) and lower aromatic content (lower SUVA254) in the organic matter pool of the A area were observed with respect to the C area, potentially indicating in the former a faster DOM degradation (caused by bacterial activity, or physical processes such as light exposure), as also pointed out in other oceanic areas [60]. Moreover, organic matter with higher molecular weight and aromaticity characterized the coastal stations compared to offshore ones, although the bulk of DOC depicted a clearly increasing coastal-offshore gradient. In contrast, in an area roughly corresponding to the A area, D’Sa et al. [24] observed the presence of compounds with a greater aromaticity and molecular weight, suggesting the release of DOM by krill (Euphausia superba), the dominant planktonic grazer in the Antarctic marine ecosystem.
The observed spatial variability in abiotic variables was reflected in the variability in microbial abundance—particularly TPP, living cells, pico- and nanoeukaryotes—and metabolism. Using both microscopic, flow cytometry, and culture methods, changes in the biodiversity (from the live to culturable fraction) of the prokaryotic and eukaryotic assemblages were observed from coastal to offshore (Figure S1, Supplementary file).Prokaryotic abundance ranged in the order of 105106 cells mL−1, with higher values in the A area compared to the C area. Within the A area, although no statistically different variations in microbial abundance were observed among the stations by ANOSIM (Table S2, supplementary file), some spatial patterns were detected. Indeed, high abundance values of TPP, PAc and HNA were recorded at the most offshore station of the Drygalski ice tongue (station 002, integrated values of TPP, PAc and HNA 5.78 × 10⁵ cells cm−2, 2.73 × 10⁵ cells cm−2 and 2.35 × 10⁵ cells cm−2, respectively), suggesting that microbial growth was supported by the organic substrates released by ice melting that accumulated locally, perhaps due to hydrodynamic circulation. Furthermore, from the CARD-FISH results, the ubiquitous presence of the Flavobacterium-Bacteroidetes (CFB) group, which is generally linked to the presence of complex organic matter, highlighted how the A area was strongly influenced by terrigenous organic inputs. This group is known to play a specialized role in the natural Carbon cycle [61,62].
In the same area, sampled during the P-ROSE project performed contextually to the CELEBER project, a significant spatial variability was detected in the microbial abundance patterns [19], with mean TPP values between 0.61 ± 0.28 × 10⁶ cell mL−1 and 1.68 ± 0.12 × 10⁶ cell mL−1 in the inner coastal sub-area, and lower values (between 0.18 ± 0.07 × 10⁶ cells mL−1 and 1.06 ± 0.42 × 10⁶ cell mL−1) in the offshore area. Our counts also fell in a range roughly comparable to those obtained in the Ross Sea in a previous study ([63] and references therein). PB recorded in our study ranged between 8.7 ± 6.1 μg C L−1 and 22.4 ± 3.7 μg C L−1 and were higher in the photic layer than in the aphotic ones; they were generally higher than those reported in other Antarctic waters [63]. Like our findings, a patchy distribution in the phytoplankton community has recently been found at the same stations [17,18].
In our survey, the fraction of culturable heterotrophic bacteria did not strictly reflect DOC distribution, probably being affected by a combination of different drivers such as temperature and local nutrient availability.
Regarding the functional role of microbial community in organic matter turnover, community metabolic profiles depicted a greater nutritional versatility at the coastal stations compared to the most offshore ones (Table S1, Supplementary file). Peaks in AWCD values were recorded not only at the coastal stations 3 and 2, and 6-DCM, but also at station 20, located in the middle of the first transect of the A area. Higher AWCD values were associated with a shorter color development time (3 days of incubation). The number of metabolized substrates was, on average, higher in the A area than in the C area (14–31 substrates vs. 14–26). Comparing the A and C areas, different utilization patterns of the six organic carbon substrates were also observed, excepting carbohydrates, which were the most used guild-complex Carbon sources, carboxylic acids and amino acids were mostly used in the A area; conversely, amino acids were the substrates most used in the C area (Figure S2, Supplementary file). Compared to other marine ecosystems, the raw metabolic responses at the community level were generally low; this might be related to the environmental constraints, causing a limited community functionality [64].
Most of the bacterial isolates were able to decompose proteins and organic phosphates, while no glycolytic activities were expressed by our bacterial isolates. High percentages of bacteria with proteolytic activity, especially at stations 002 and 18, suggested the presence of fresh, proteic, material; phosphatase positive strains were observed at station 15 and at station 002 even at higher depths, suggesting their role in the mineralization of Phosphorous for bacterial and phytoplankton needs. Proteolytic activity (LAP) provides information on the decomposition of proteins, present in living or non-living material (fecal pellets); mostly of the bacterial isolates possessed this enzyme activity. Strains were also positive for AP activity; in aquatic environments, this is a widespread enzyme that mineralizes organic phosphates into inorganic P, and is commonly used as an indicator of P deficiency by bacterial and phytoplankton assemblages. In the photic zone, both bacteria and phytoplankton components are involved in the synthesis of this enzyme [65].
Functional diversity of the microbial community between the studied areas was also depicted by the diversity indices of Richness (R) and Shannon–Weaver index (H); their values revealed different catabolic capabilities in terms of potential metabolic pathways between the different sampling areas, as well as within each area between coastal and offshore stations (Table S4, Supplementary file).

4.2. Vertical Profiles of Abiotic and Biotic Variables

Vertical profiles of abiotic and biotic variables exhibited marked changes among the depths (Figure S1, Supplementary file), with a significant variability confirmed by ANOSIM and SIMPER analyses (Table S2, Supplementary file).
A typical vertical summer structure, with the Antarctic Surface Water (AASW) located in the upper 100 m and the Dense Self Water (DSW) at the deep layers, was also reported in the A area, while the C area was characterized by cold and fresh AASW occupying the upper layers, stratified on the warm and salty Circumpolar Deep Waters (CDW) below [18].
Concentrations and distribution patterns of nutrients found in this study were comparable to those obtained in a previous study in the same area [57], with higher values in the aphotic layers, related to organic matter turnover and the remineralization processes. A slightly decreasing pattern along the water column was pointed out for DOC concentrations, but the lack of correlations with fluorescence and POC (Table S3, Supplementary file) led us to exclude the availability of a source of recently produced phytoplankton DOC, as previously observed [24]; rather, microbial activity fueled with an additional new sources the organic matter pools in the EZ of both the areas. Moreover, OM quality vertical patterns differed between the two areas: ice melting and photodegradation processes could be expected to lead to higher organic matter with reduced molecular weight in EZ of the A area, while terrestrial influence and outward dilution gradient seem to be the dominant driving force for OM quality in the EZ of the C area. A net particulate matter production occurred during phytoplankton blooms in the euphotic zone, as evidenced by the strong positive correlation of both TSM and POC with fluorescence (Table S3, Supplementary file), and as generally pointed out by Bianchi and Bauer [66]. At CDW and deep layers C/N ratios > 8 were recorded, suggesting that detritus was the major fraction within the organic matter pool at depths.
As T and organic matter supply are considered the major drivers regulating microbial growth in aquatic ecosystems [67], vertical variations of the microbial abundance, community structure and metabolism (Figure S1, Supplementary file) were also detected. TPP abundance decreased with depth, and living cells were more abundant in correspondence to the surface and DCM of the A area, supported by coastal production processes. In this area, a peak of living and CTC+ cells was achieved at the CDW, suggesting that this warm water mass provided a source of nutrients, stimulating active microbial growth and metabolism. CDW was identified generally at a −200 m depth and its contribution to the shelf physical and biological processes was confirmed in this study. Peaks in TPP abundance at the intermediate depths were also detected in the Ross Sea at middle and southern transects [19].
Pico- and nanoeukaryote cell abundance decreased significantly at deep layers (data not shown). All these data suggested that microbial distribution patterns were driven by both local processes (i.e., primary production, such in the DCM layer) and hydrological characteristics (i.e., CDW, frontal systems).
Vertical variability was also recorded in the structure of the microbial community. The reciprocally inverse abundance of Alpha- and Gamma-Proteobacteria observed in the water column suggested that sediments could be transported upward by sea currents, as Alpha-Proteobacteria are common inhabitants of polar marine environments, while Gamma-Proteobacteria are mainly associated with marine sediments [68,69]. In addition, the presence of Deltaproteobacteria, commonly present in uncontaminated aquatic ecosystems [70], in association with high numbers of Archaea, further suggested the upwelling of sediments towards the above water column.

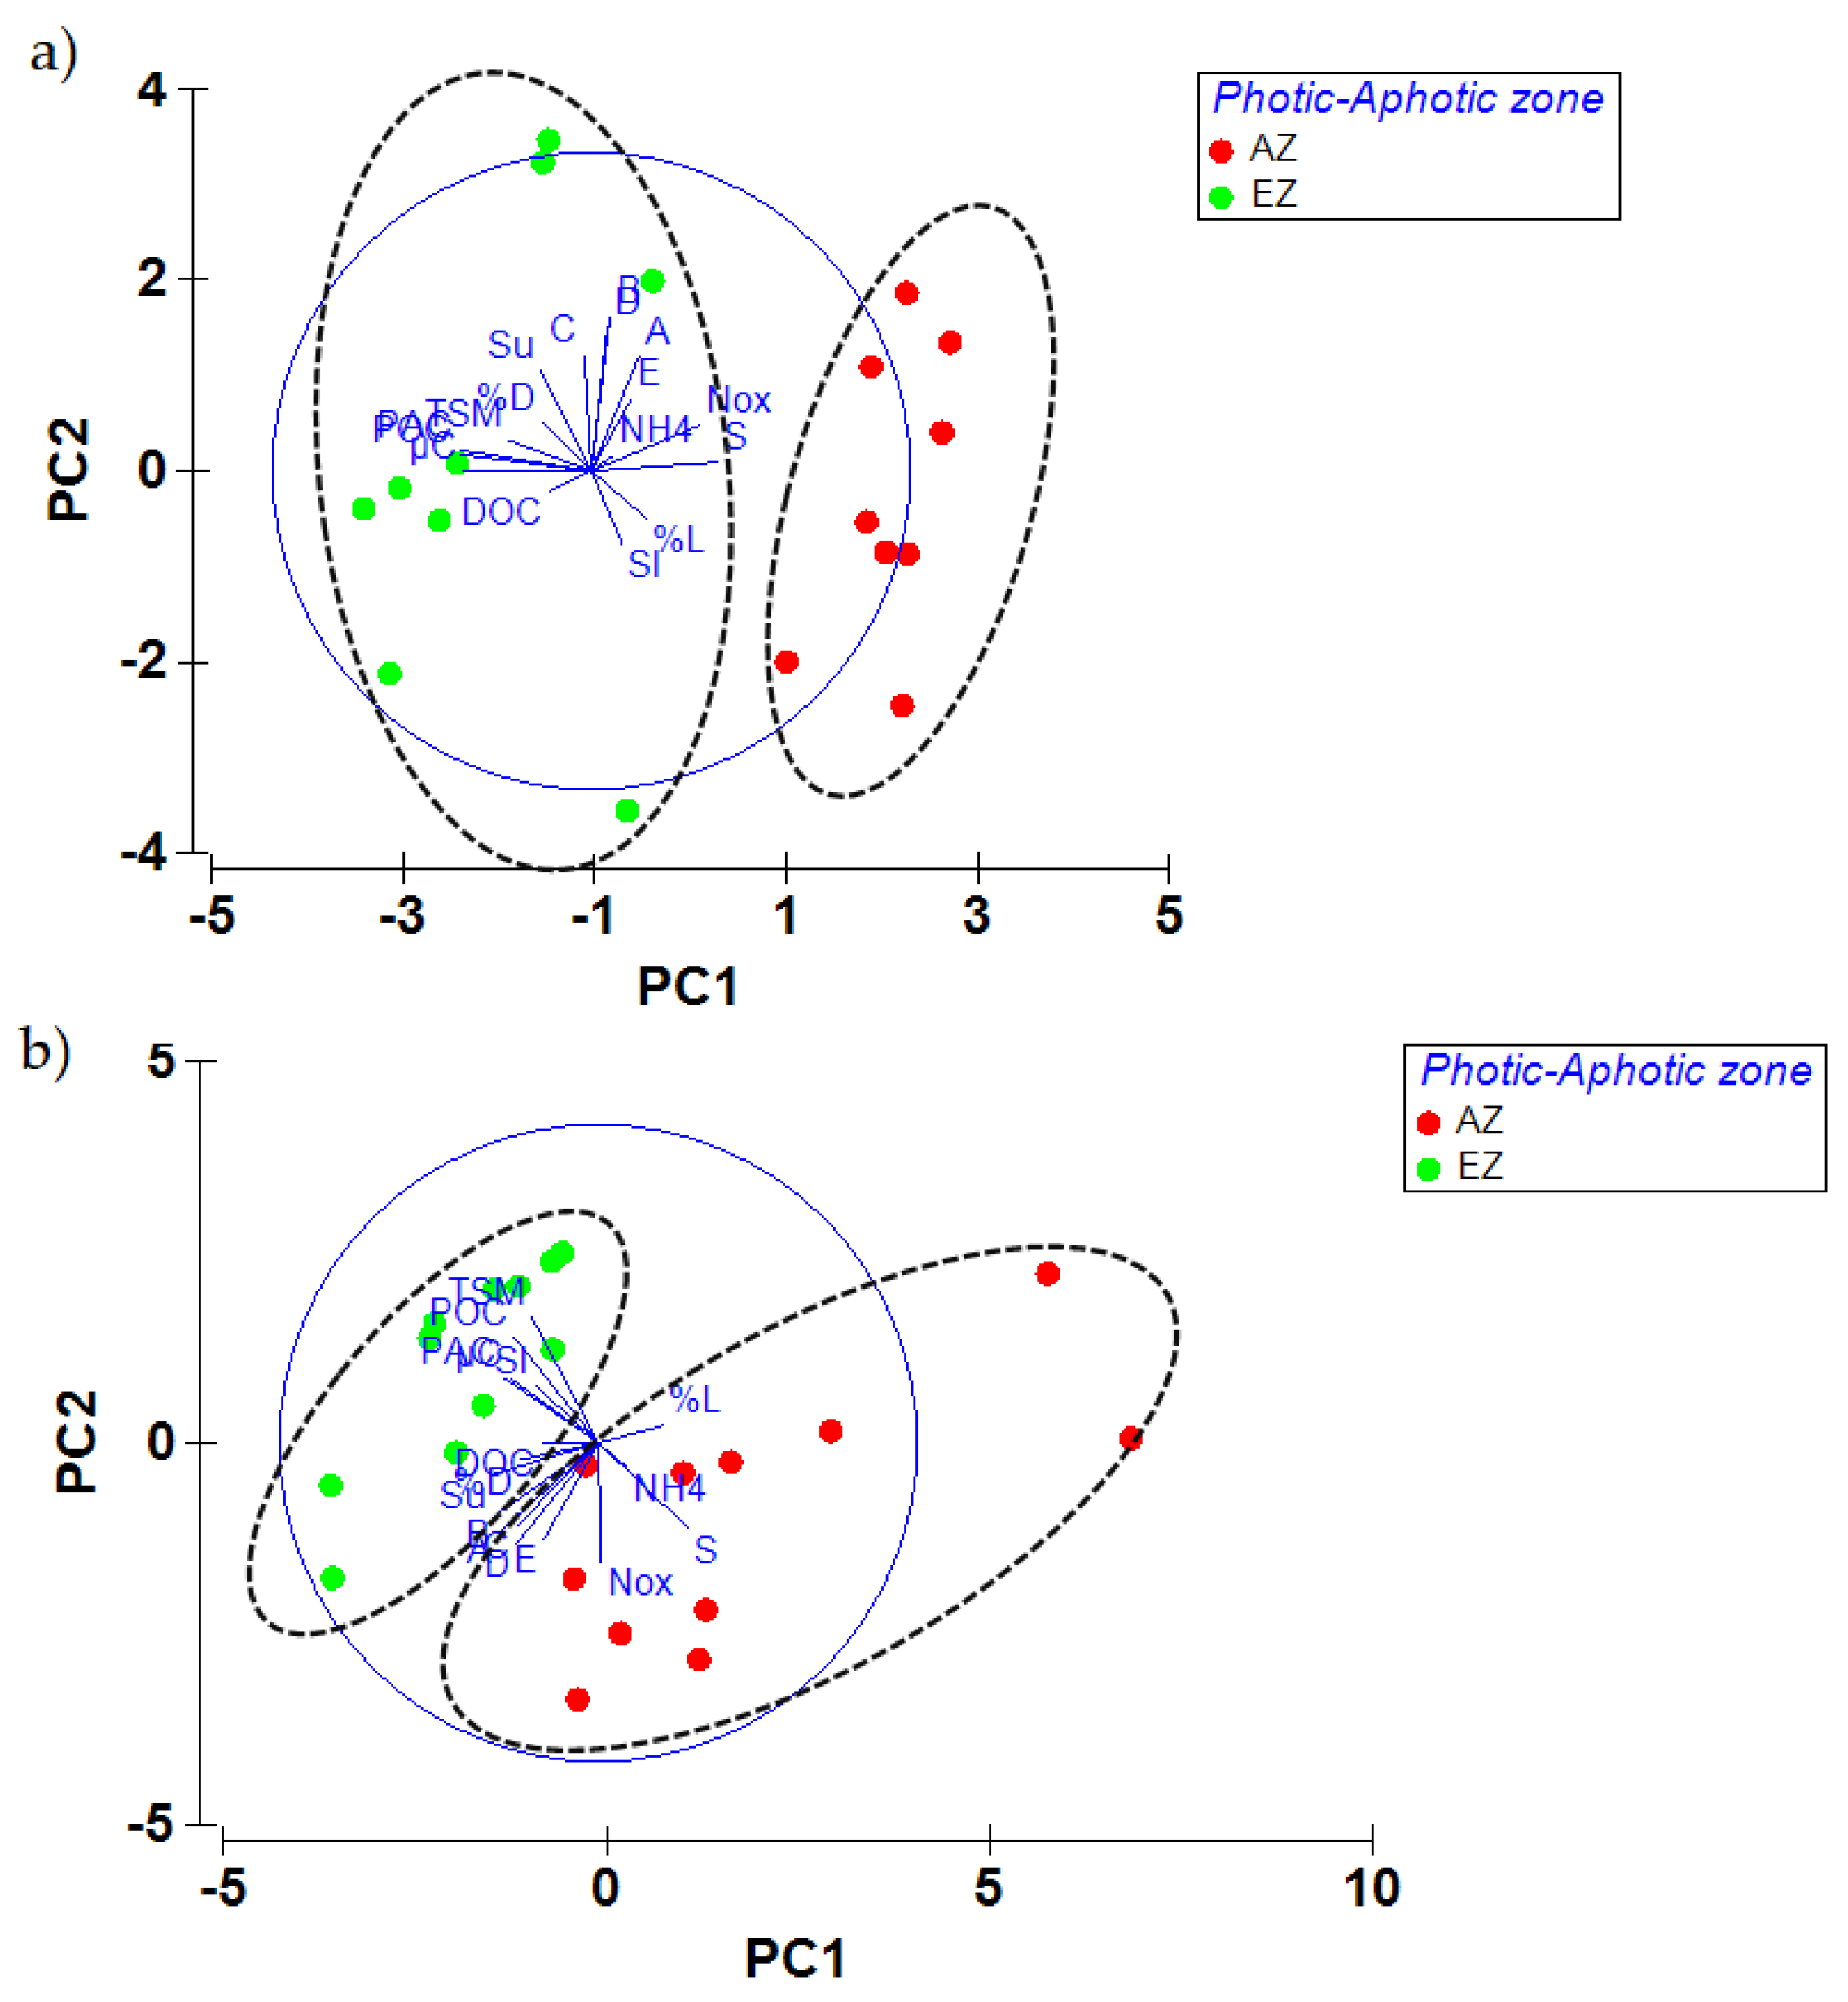
4.3. Major Drivers Affecting Environmental and Microbial Abundance, Structure and Metabolic Patterns

The multivariate ANOSIM analysis (Table S2, Supplementary file), applied to three groups of variables separately (physical-chemical, microbial abundance and metabolism), pointed out the differences existing between the two study areas. In both the areas, significant differences in the physical-chemical variables, as well as in microbial abundance and metabolism, depended on the water depth, with global R values higher in the A area (global R = 0.711, 0.484, 0.508, p < 0.1%, respectively) than in the C area (global R = 0.519, 0.370 and 0.489, p < 0.01, respectively). Conversely, significant variability among the stations was recorded for the physical-chemical and microbial abundance variables in the C area only (global R = 0.217 and 0.262, p < 0.1%, respectively).
The SIMPER analysis showed that within the A area, POC was the variable that mostly (95.89–96.71%) contributed to the variability observed at surface and DCM layers. At the same depths, significant differences in the microbial abundance were fully referable to the culturable fraction. In the deep layer, LAP accounted for 16.04–17.76% of the total variability observed in microbial metabolism. In the C area, the variable NO2+NO3 explained as much as 18.22% of the total variability in the physical-chemical variables within the surface layer, followed by DO and S. Within the DCM, Fluorescence and PN were responsible for dissimilarity with CDW and Deep layer, contributing to 9.66–15.48% (Fluorescence) and 9.95–12.91% (PN) of the total variability observed in the physical-chemical variables. Within the microbial abundance, the variable TPP explained from 10.41 to 12.05% of the total variability at DCM and surface, respectively, compared to the deep layer. At the surface, LNA and picoeukaryotes accounted for high percentages (35.13 and 23.74%, respectively) of the total variability, while HNA for 10.16% of the variability observed at the DCM layer. Within the microbial metabolism, amino acids, carbohydrates, and amines explained as much as 14.57–16.51% of the total variability observed at the surface layer, while at DCM the phosphate-Carbon compounds and carboxylic acids played a major role. At deeper layers (CDW and Deep layer), complex Carbon sources, together with bacteria showing LAP and AP activities accounted for over 20% of the total variability.
In the C area, the more labile organic substrates (as shown by lower C/N ratios) and the warmest T (−0.44 ± 0.73 °C) favored the growth of a higher abundance of culturable heterotrophic bacteria (2210 ± 1397 CFU mL−1) with active metabolism (95.71 ± 1.88% and 93.14 ± 5.12% of the total isolates showing proteolytic and phosphatase activities, respectively). In the A area, culturable bacteria were less abundant (1507 ± 2277 CFU mL−1), being also metabolically active at a lower extent (95.5% and 80.28% were positive for LAP and AP, respectively), also in relation with colder waters (−1.12 ± 1.18 °C). This finding confirmed that both temperature and organic matter quality supported the fraction of actively metabolizing microorganisms.
To detect possible distinctive relationships among the main variables that could drive microbial abundance, structure, and metabolism, PCA was also calculated, considering the variable depth as a discriminating factor. Different associations among the variables were observed in the two areas, suggesting that the microbial assemblage was differently shaped by key forcings.
In the A area, the environmental and biological variables were distinctly separated between euphotic and aphotic zones (Figure 10a). Both the zones showed similar variability in environmental and biological properties of the water column. Salinity, some trophic parameters (NO2+NO3, DOC, TSM and POC) and some biological variables linked to S (PAC, PB, LNA and HNA, and Beta-Proteobacteria) were strongly associated with PC1 (that explained 31% of the total variance in the dataset), while NH4, optical properties (Slope275−295 and SUVA254) and some variables linked to microbial metabolism (complex carbon source, carbohydrates and carboxylic acids) were strongly associated with PC2 (that explained 22% of the total variance). Different patterns, mainly of the environmental variables, between the EZ and the AZ were reflected along PC1, where S decreased paired with increased POC of phytoplankton origin and DOC produced by bacterial metabolism and decreased SUVA254 (suggesting a shift from terrestrial to marine DOM), as well as POC, HNA and LNA. Different patterns of the biological variables linked to metabolic processes were reflected along PC2, where complex carbon source, carbohydrates, and carboxylic acids increased, paired with increased SUVA254 and decreased S275−295, suggesting that organic matter dynamics affected metabolic processes.
In the C area, photic and aphotic zones were distinctly separated, but with a broader spread of the data in the AZ (Figure 10b). Salinity, optical properties, and some microbial components (picoeukaryotes) were strongly and negatively associated with PC1 (that explained 40% of the total variance), while trophic variables as NO2+NO3, TSM and POC, microbial metabolism (complex carbon source, carbohydrates, carboxylic acids and amines were associated with PC2 (that explained 20% of the total variance). The broader spread of the data from the EZ to the AZ along PC1 reflected, contrary to the A area, the influence of salinity on the OM quality; indeed, S decreased and S275-295 and SUVA254 increased, suggesting a shift from marine to terrestrial DOM, while the spread of data observed along PC2 axis indicated that variables linked to metabolic processes (complex carbon source, amines, carboxylic acids, and carbohydrates), were mainly affected by trophic variables such as TSM and POC.

5. Conclusions

This study is the first contribution to the knowledge of the response of microbial community, in terms of abundance and functional diversity, across a wide area in the Ross Sea. This study area is characterized by a mosaic of different forces affecting environmental and biological patterns.
The comparison between the two sub-sectors of the Ross Sea revealed different coastal to offshore gradients and photic-aphotic variables distributions, highlighting clear and strong differences between OM quality and microbial processes.
In the A area, a gradual shift from terrestrial to marine DOM was observed in the photic zone, with OM dynamics mainly affected by metabolic processes. Also, a more limited marine influence, paired with more pronounced ice melting near the coast, created a clear horizontal gradient in nutrient concentrations, with high phytoplankton production.
In the C area, vertical differences in environmental and biological variables were more pronounced than horizontal gradients. A broad spread of environmental and biological data was found along the vertical profiles, revealing the influence of S on the OM quality. A shift from marine to terrestrial DOM in the photic zone suggested that metabolic processes were mainly affected by trophic variables such as TSM and POC.
Different microbial abundance distribution and functional patterns were detected in the main sub-sectors investigated in this survey. Metabolic and enzymatic profiles of both the whole community and bacterial isolates confirmed that the microbial community was equipped with enzymes able to decompose proteins and organic phosphates. Overall, through an integrated (microbiological and environmental) approach, the abundance, diversity, and metabolism and diversity of the microbial community in the Ross Sea were found to respond to the local conditions that varied significantly in this extreme ecosystem exposed to environmental changes.

Supplementary Materials

The following supporting information can be downloaded at: https://www.mdpi.com/article/10.3390/jmse10111666/s1, Figure S1. SA1, Vertical profiles of physical-chemical variables (Temperature, T; Salinity, S; Dissolved Oxygen, DO; Fluorescence; nutrients: ammonia, NH4; nitrite+nitrate, NO2+NO3; phosphate, PO4; Total Suspended Matter, TSM; Particulate Organic Carbon, POC, Particulate Nitrogen, PN; Dissolved Organic Carbon, DOC) in the A area. SA2, Vertical profiles of microbial abundance (Prokaryotic abundance, TPP; Volume and Biomass; Prokaryotic abundance by cytometry, PAC) in the A area. SB1, Vertical profiles of physical-chemical variables (Temperature, T; Salinity, S; Dissolved Oxygen, DO; Fluorescence; nutrients: ammonia, NH4; nitrite+nitrate, NO2+NO3; phosphate, PO4; Total Suspended matter, TSM; Particulate Organic Carbon, POC, Particulate Nitrogen, PN; Dissolved Organic Carbon, DOC) in the C area. SB2, Vertical profiles of microbial abundance (Prokaryotic abundance, TPP; Live cells; Actively respiring cells, CTC+; Volume and Biomass; Prokaryotic abundance by cytometry, PAC; Picoeukaryotes; Nanoeukaryotes) in the C area; Figure S2. Heatmaps showing the capability of the microbial community to use the main classes of organic Carbon substrates in the A area (a) and in the C area (b); Table S1. Microbial community metabolism in A and C areas, as obtained from Biolog Ecoplates. Average Well Color Development (AWCD) peak values, number of metabolized substrates and days of incubation; Table S2. Results of ANOSIM and SIMPER analyses, performed per each study area and per physical-chemical, microbial abundance and metabolism separately; Table S3. A, Spearman Rank Order Correlations on the A area dataset, B, Spearman Rank Order Correlations on the C area dataset; Table S4. Microbial community metabolism: Average Well Color Development value (AWCD), Richness and Shannon-Weaver diversity index per each area.

Author Contributions

Conceptualization, M.A., A.S., G.M. and G.C.; methodology, all the authors; software, A.S. and M.R.; validation, M.A., A.S., G.M., R.L.F., A.L.G., R.P., A.S.C., A.C.R., M.P. and G.C.; formal analysis, M.A., A.S., G.M. and G.C.; investigation, M.A., F.A., P.C., P.F. and P.R.; resources, M.A. and P.R.; data curation, G.M., A.C.R., M.P. and G.C.; writing—original draft preparation, M.A., A.S., G.M. and G.C.; writing—review and editing, all the authors; visualization, G.M., A.C.R. and M.P.; supervision, M.A.; project administration, P.R.; funding acquisition, M.A. and P.R. All authors have read and agreed to the published version of the manuscript.

Funding

This research was funded by the Italian National Antarctic Research Programme PNRA, grant number PNRA16_00207—A3 “CDW Effects on glaciaL mElting and on Bulk of Fe in the Western Ross Sea (CELEBeR)”.

Institutional Review Board Statement

Not applicable.

Informed Consent Statement

Not applicable.

Data Availability Statement

Data are available upon request.

Acknowledgments

Thanks are due to the Captain and the crew of the R/V Italica for their support during the cruise.

Conflicts of Interest

The authors declare no conflict of interest. The funders had no role in the design of the study; in the collection, analyses, or interpretation of data; in the writing of the manuscript; or in the decision to publish the results.

References

  1. Henley, S.F.; Cavan, E.L.; Fawcett, S.E.; Kerr, R.; Monteiro, T.; Sherrell, R.M.; Bowie, A.R.; Boyd, P.W.; Barnes, D.K.A.; Schloss, I.R.; et al. Changing Biogeochemistry of the Southern Ocean and Its Ecosystem Implications. Front. Mar. Sci. 2000, 7, 581. [Google Scholar] [CrossRef]
  2. Catalano, G.; Budillon, G.; La Ferla, R.; Povero, P.; Ravaioli, M.; Saggiomo, V.; Accornero, A.; Azzaro, M.; Carrada, G.C.; Giglio, F.; et al. A global budget of carbon and nitrogen in the Ross Sea (Southern Ocean). In Carbon and Nutrient Fluxes in Continental Margins: A Global Synthesis; Liu, K.K., Atkinson, L., Quinones, R., Talaue-McManus, L., Eds.; Global Change, The IGBP Series; Springer: Berlin, Germany, 2006; pp. 303–318. [Google Scholar]
  3. Smith, W.O., Jr.; Ainley, D.G.; Arrigo, K.R.; Dinniman, M.S. The oceanography and ecology of the Ross Sea. Ann. Rev. Mar. Sci. 2014, 6, 469–487. [Google Scholar] [CrossRef] [PubMed] [Green Version]
  4. Arrigo, K.R.; van Dijken, G.L. Annual changes in sea-ice, chlorophyll a, and primary production in the Ross Sea, Antarctica. Deep Sea Res. Part II 2004, 51, 117–138. [Google Scholar] [CrossRef]
  5. Smith, W.O., Jr. Primary productivity measurements in the Ross Sea, Antarctica: A regional synthesis. Earth Syst. Sci. Data 2022, 14, 2737–2747. [Google Scholar] [CrossRef]
  6. Silvano, A.; Foppert, A.; Rintoul, S.R.; Holland, P.R.; Tamura, T.; Kimura, N.; Castagno, P.; Falco, P.; Budillon, G.; Haumann, F.A. Recent recovery of Antarctic Bottom Water formation in the Ross Sea driven by climate anomalies. Nat. Geosci. 2020, 13, 780–786. [Google Scholar] [CrossRef]
  7. Castagno, P.; Capozzi, V.; DiTullio, G.R.; Falco, P.; Fusco, G.; Rintoul, S.R.; Spezie, G.; Budillon, G. Rebound of shelf water salinity in the Ross Sea. Nat. Commun. 2019, 10, 5441. [Google Scholar] [CrossRef] [Green Version]
  8. Brooks, C.M.; Bloom, E.; Kavanagh, A.; Nocito, E.S.; Watters, G.M.; Weller, J. The Ross Sea, Antarctica: A highly protected MPA in international waters. Mar. Policy 2021, 134, 104795. [Google Scholar] [CrossRef]
  9. Legendre, L.; Rivkin, R.B.; Weinbauer, M.G.; Guidi, L.; Uitz, J. The microbial carbon pump concept: Potential biogeochemical significance in the globally changing ocean. Progr. Oceanogr. 2015, 134, 432–450. [Google Scholar] [CrossRef] [Green Version]
  10. Misic, C.; Harriague, A.C.; Mangoni, O.; Cotroneo, Y.; Aulicino, G.; Castagno, P. Different responses of the trophic features of particulate organic matter to summer constraints in the Ross Sea. J. Mar. Syst. 2017, 166, 132–143. [Google Scholar] [CrossRef]
  11. Misic, C.; Povero, P.; Fabiano, M. Ectoenzymatic ratios in relation to particulate organic matter distribution (Ross Sea, Antarctica). Microb. Ecol. 2002, 44, 224–234. [Google Scholar] [CrossRef]
  12. Misic, C.; Povero, P.; Fabiano, M. Relationship between ecto-enzymatic activity and organic substrates availability (Ross Sea, Antarctica): An experimental approach. Polar Biol. 1998, 20, 367–376. [Google Scholar] [CrossRef]
  13. Ducklow, H.; Carlson, C.; Church, M.; Kirchman, D.; Smith, D.; Steward, G. The seasonal development of the bacterioplankton bloom in the Ross Sea, Antarctica, 1994–1997. Deep Sea Res. Part II 2001, 48, 4199–4221. [Google Scholar] [CrossRef]
  14. Monticelli, L.S.; La Ferla, R.; Maimone, G. Dynamics of bacterioplankton activities after a summer phytoplankton bloom period in Terra Nova Bay. Antarct. Sci. 2003, 15, 85–93. [Google Scholar] [CrossRef]
  15. Celussi, M.; Bergamasco, A.; Cataletto, B.; Umani, S.F.; Del Negro, P. Water masses’ bacterial community structure and microbial activities in the Ross Sea, Antarctica. Antarct. Sci. 2010, 22, 361–370. [Google Scholar] [CrossRef]
  16. Celussi, M.; Cataletto, B.; Fonda Umani, S.; Del Negro, P. Depth profiles of bacterioplankton assemblages and their activities in the Ross Sea. Deep Sea Res. Part I 2009, 56, 2193–2205. [Google Scholar] [CrossRef]
  17. Mangoni, O.; Saggiomo, V.; Bolinesi, F.; Margiotta, F.; Budillon, G.; Cotroneo, Y.; Misic, C.; Rivaro, P.; Saggiomo, M. Phytoplankton blooms during austral summer in the Ross Sea, Antarctica: Driving factors and trophic implications. PLoS ONE 2017, 12, e0176033. [Google Scholar] [CrossRef] [Green Version]
  18. Bolinesi, F.; Saggiomo, M.; Ardini, F.; Castagno, P.; Cordone, A.; Fusco, G.; Rivaro, P.; Saggiomo, V.; Mangoni, O. Spatial-Related Community Structure and Dynamics in Phytoplankton of the Ross Sea, Antarctica. Front. Mar. Sci. 2020, 7, 574963. [Google Scholar] [CrossRef]
  19. Zaccone, R.; Misic, C.; Azzaro, F.; Azzaro, M.; Maimone, G.; Mangoni, O.; Fusco, G.; Rappazzo, A.C.; La Ferla, R. Regulation of Microbial Activity Rates by Organic Matter in the Ross Sea during the Austral Summer 2017. Microorganisms 2020, 8, 1273. [Google Scholar] [CrossRef]
  20. Hoppe, H.G.; Arnosti, C.; Herndl, G. Ecological significance of bacterial enzymes in the marine environment. In Enzymes in the Environment: Activity, Ecology and Applications; Burns, R.G., Dick, R.P., Eds.; Marcel Dekker: New York, NY, USA, 2002; pp. 85–125. [Google Scholar] [CrossRef]
  21. Azam, F.; Malfatti, F. Microbial structuring of marine ecosystems. Nat. Rev. Microbiol. 2007, 5, 782–791. [Google Scholar] [CrossRef]
  22. Azam, F.; Smith, D.C.; Steward, G.F.; Hagström, Å. Bacteria-organic matter coupling and its significance for oceanic carbon cycling. Microb. Ecol. 1993, 28, 167–179. [Google Scholar] [CrossRef]
  23. Cho, B.; Azam, F. Major role of bacteria in biogeochemical fluxes in the ocean's interior. Nature 1988, 332, 441–443. [Google Scholar] [CrossRef]
  24. D’Sa, E.J.; Kim, H.-C.; Ha, S.-Y.; Joshi, I. Ross Sea Dissolved Organic Matter Optical Properties During an Austral Summer: Biophysical Influences. Front. Mar. Sci. 2021, 8, 749096. [Google Scholar] [CrossRef]
  25. Azzaro, M.; Packard, T.T.; Monticelli, L.S.; Maimone, G.; Rappazzo, A.C.; Azzaro, F.; Grilli, F.; Crisafi, E.; La Ferla, R. Microbial metabolic rates in the Ross Sea: The ABIOCLEAR Project. Nat. Conserv. 2019, 34, 441–475. [Google Scholar] [CrossRef] [Green Version]
  26. Kohut, J.T.; Kustka, A.B.; Hiscock, M.R.; Lam, P.J.; Measures, C.; Milligan, A.; White, A.; Carvalho, F.; Hatta, M.; Jones, B.M.; et al. Mesoscale variability of the summer bloom over the northern Ross Sea shelf: A tale of two banks. J. Mar. Syst. 2017, 166, 50–60. [Google Scholar] [CrossRef]
  27. Monien, D.; Monien, P.; Brünjes, R.; Widmer, T.; Kappenberg, A.; Silva Busso, A.A.; Schnetger, B.; Brumsack, H. Meltwater as a source of potentially bioavailable iron to Antarctica waters. Antarctic Sci. 2017, 29, 277–291. [Google Scholar] [CrossRef] [Green Version]
  28. Hansen, J.; Russell, G.; Rind, D.; Stone, P.; Lacis, A.; Lebedeff, S.; Ruedy, R.; Travis, L. Efficient three-dimensional global models for climate studies: Models I and II. Mon. Weather Rev. 1983, 111, 609–662. [Google Scholar] [CrossRef]
  29. Caruso, G.; Azzaro, M.; Caroppo, C.; Decembrini, F.; Monticelli, L.S.; Leonardi, M.; Maimone, M.; Zaccone, R.; La Ferla, R. Microbial community and its potential as descriptor of environmental status. ICES J. Mar. Sci. 2016, 73, 2174–2177. [Google Scholar] [CrossRef] [Green Version]
  30. Iseki, K.; MacDonald, R.W.; Carmack, E. Distribution of particulate matter in the Southeastern Beaufort Sea in late summer. Proc. NIPR Symp. Polar Biol. 1987, 1, 35–46. [Google Scholar]
  31. Specchiulli, A.; Cilenti, L.; D'Adamo, R.; Fabbrocini, A.; Guo, W.; Huang, L.; Lugliè, A.; Padedda, B.M.; Scirocco, T.; Magni, P. Dissolved organic matter dymics in Mediterranean lagoons: The relationship between DOC and CDOM. Mar. Chem. 2018, 202, 37–48. [Google Scholar] [CrossRef]
  32. Specchiulli, A.; Bignami, F.; Marini, M.; Fabbrocini, A.; Scirocco, T.; Campanelli, A.; Penna, P.; Santucci, A.; D'Adamo, R. The role of forcing agents on biogeochemical variability along the southwestern Adriatic coast: The Gulf of Manfredonia case study. Estuar. Coast. Shelf Sci. 2016, 183, 136–149. [Google Scholar] [CrossRef]
  33. Porter, K.G.; Feig, Y.S. The use of DAPI for identifying and counting aquatic microflora. Limnol. Oceanogr. 1980, 25, 943–948. [Google Scholar] [CrossRef]
  34. La Ferla, R.; Maimone, G.; Azzaro, M.; Conversano, F.; Brunet, C.; Cabral, A.S.; Paranhos, R. Vertical distribution of the prokaryotic cell size in the Mediterranean Sea. Helgol. Mar. Res. 2012, 66, 635–650. [Google Scholar] [CrossRef] [Green Version]
  35. La Ferla, R.; Azzaro, M.; Michaud, L.; Caruso, G.; Lo Giudice, A.; Paranhos, R.; Cabral, A.S.; Conte, A.; Cosenza, A.; Maimone, G.; et al. Prokaryotic abundance and activity in permafrost of the Northern Victoria Land and upper Victoria Valley (Antarctica). Microb. Ecol. 2017, 74, 402–415. [Google Scholar] [CrossRef]
  36. Teira, E.; Reinthaler, T.; Pernthaler, A. Combining catalysed reporter deposition-fluorescence in situ hybridization and microautoradiography to detect substrate utilization by bacteria and Archaea in the deep ocean. Appl. Environ. Microbiol. 2004, 70, 4411–4414. [Google Scholar] [CrossRef] [Green Version]
  37. Pernthaler, A.; Pernthaler, J.; Amann, R. Sensitive multi-color fluorescence in situ hybridization for the identification of environmental microorganisms. In Molecular Microbial Ecology Manual, 2nd ed.; Kowalchuk, G., Bruijn, F.J., Head, I.M., Akkermans, A.D., Elsas, J.D., Eds.; Kluwer Academic Press: Dordrecht, The Netherlands, 2004; Volume 11, pp. 711–726. [Google Scholar]
  38. Wallner, G.; Amann, R.; Beisker, W. Optimizing fluorescent in situ hybridization of suspended cells with rRNA-targeted oligonucleotide probes for the flow cytometric identification of microorganisms. Cytometry 1993, 14, 136–143. [Google Scholar] [CrossRef]
  39. Amann, R.I.; Binder, B.J.; Olson, R.J.; Chisholm, S.W.; Devereux, R.; Stahl, D.A. Combination of 16S rRNA-targeted oligonucleotide probes with flow cytometry for analyzing mixed microbial populations. Appl. Environ. Microbiol. 1990, 56, 1919–1925. [Google Scholar] [CrossRef] [Green Version]
  40. Daims, H.; Brühl, A.; Amann, R.; Schleifer, K.H.; Wagner, M. The domain-specific probe EUB338 is insufficient for the detection of all Bacteria: Development and evaluation of a more comprehensive probe set. Syst. Appl. Microbiol. 1999, 22, 434–444. [Google Scholar] [CrossRef]
  41. Neef, A. Application of In Situ single-cell Identification of Bacteria for Population Analysis in Complex Microbial Communities. Ph.D. Thesis, Technical University Munich, Munich, Germany, 1997. [Google Scholar]
  42. Manz, W.; Amann, R.; Ludwig, W.; Wagner, M.; Schleifer, K.-H. Phylogenetic oligodeoxynucleotide probes for the major subclasses of proteobacteria: Problems and solutions. Syst. Appl. Microbiol. 1992, 15, 593–600. [Google Scholar] [CrossRef]
  43. Loy, A.; Lehner, A.; Lee, N.; Adamczyk, J.; Meier, H.; Ernst, J.; Schleifer, K.H.; Wagner, M. Oligonucleotide microarray for 16S rRNA gene-based detection of all recognized lineages of sulfate reducing prokaryotes in the environment. Appl. Environ. Microbiol. 2002, 68, 5064–5081. [Google Scholar] [CrossRef] [Green Version]
  44. Loy, A.; Maixner, F.; Wagner, M.; Horn, M. ProbeBase: An online resource for rRNA-targeted oligonucleotide probes. Nucleic Acids Res. 2007, 35, 800–804. [Google Scholar] [CrossRef]
  45. Manz, W.; Amann, R.; Ludwig, W.; Vancanneyt, M.; Schleifer, K.H. Application of a suite of 16S rRNA specific oligonucleotide probes designed to investigate bacteria of the phylum Cytophaga-Flavobacter-Bacteroides in the natural environment. Microbiology 1996, 142, 1097–1106. [Google Scholar] [CrossRef] [Green Version]
  46. Stahl, D.A.; Amann, R. Development and application of nucleic acid probes. In Nucleic Acid Techniques in Bacterial Systematics; Stackebrand, E., Goodfellow, M., Eds.; Wiley: Chichester, UK, 1991; pp. 205–248. [Google Scholar]
  47. Gasol, J.M.; del Giorgio, P.A. Using flow cytometry for counting natural planktonic bacteria and understanding the structure of planktonic bacterial communities. Sci. Mar. 2000, 64, 197–224. [Google Scholar] [CrossRef] [Green Version]
  48. Brussaard, C.P.D. Viral control of phytoplankton population—A review. J. Eukaryot. Microbiol. 2004, 51, 125–138. [Google Scholar] [CrossRef]
  49. Marie, D.; Simon, N.; Vaulot, D. Phytoplankton cell counting by flow cytometry. In Algal Culturing Techniques; Andersen, R.A., Ed.; Physiological Society of America: Oxford, UK, 2005; pp. 253–267. [Google Scholar]
  50. Garland, J.L.; Mills, A.L. Classification and characterization of heterotrophic microbial communities on the basis of patterns of community-level sole-carbon-source utilization. Appl. Environ. Microbiol. 1991, 57, 2351–2359. [Google Scholar] [CrossRef] [Green Version]
  51. Garland, J.L. Analytical approaches to the characterization of samples of microbial communities using patterns of potential C source utilization. Soil Biol. Biochem. 1996, 28, 213–221. [Google Scholar] [CrossRef]
  52. Sala, M.M.; Arin, L.; Balagué, V.; Felipe, J.; Guadayol, O.; Vaqué, D. Functional diversity of bacterioplankton assemblages in Western Antarctic seawaters during late spring. Mar. Ecol. Progr. Ser. 2005, 292, 13–21. [Google Scholar] [CrossRef]
  53. Caruso, G.; Dell'Acqua, O.; Caruso, R.; Azzaro, M. Phenotypic characterization of bacterial isolates from marine waters and plastisphere communities of the Ross Sea (Antarctica). J. Clin. Microbiol. Biochem. Technol. 2022, 8, 001–009. [Google Scholar] [CrossRef]
  54. Clarke, K.R.; Green, R.H. Statistical design and analysis for a “biological effects” study. Mar. Ecol. Prog. Ser. 1988, 46, 213–226. [Google Scholar] [CrossRef]
  55. Clarke, K.R.; Warwick, R.M. Change in Marine Communities: An. Approach to Statistical Analysis and Interpretation; Primer-E Ltd.: Plymouth, UK, 2001. [Google Scholar]
  56. Cavicchioli, R. Microbial ecology of Antarctic aquatic systems. Nat. Rev. Microbiol. 2015, 13, 691–706. [Google Scholar] [CrossRef]
  57. Rivaro, P.; Abelmoschi, M.L.; Grotti, M.; Ianni, C.; Magi, E.; Margiotta, F.; Massolo, S.; Saggiomo, V. Combined effects of hydrographic structure and iron and copper availability on the phytoplankton growth in Terra Nova Bay Polynya (Ross Sea, Antarctica). Deep Sea Res. I 2012, 62, 97–110. [Google Scholar] [CrossRef]
  58. Carlson, C.A.; Hansell, D.A.; Peltzer, E.T.; Smith, W.O., Jr. Stocks and dynamics of dissolved and particulate organic matter in the southern Ross Sea, Antarctica. Deep Sea Res. Part II Top. Stud. Oceanogr. 2000, 47, 3201–3225. [Google Scholar] [CrossRef]
  59. Schultze, S.; Weishaar Andersen, T.; Hessen, D.O.; Ruus, A.; Borgå, K.; Poste, A.E. Land-cover, climate and fjord morphology drive differences in organic matter and nutrient dynamics in two contrasting northern river-fjord systems. Estuar. Coast. Shelf Sci. 2022, 270, 107831. [Google Scholar] [CrossRef]
  60. Weishaar, J.L.; Aiken, G.R.; Bergamaschi, B.A.; Fram, M.S.; Fujii, R.; Mopper, K. Evaluation of specific ultraviolet absorbance as an indicator of the chemical composition and reactivity of dissolved organic carbon. Environ. Sci. Technol. 2003, 37, 4702–4708. [Google Scholar] [CrossRef] [PubMed]
  61. Peeters, K.; Hodgson, D.A.; Convey, P.; Willems, A. Culturable diversity of heterotrophic bacteria in Forlidas Pond (Pensacola Mountains) and Lundström Lake (Shackleton Range), Antarctica. Microb. Ecol. 2011, 62, 399–413. [Google Scholar] [CrossRef]
  62. Michaud, L.; Caruso, C.; Mangano, S.; Interdonato, F.; Bruni, V.; Lo Giudice, A. Predominance of Flavobacterium, Pseudomonas, and Polaromonas within the prokaryotic community of freshwater shallow lakes in the northern Victoria Land, East Antarctica. FEMS Microbiol. Ecol. 2012, 82, 391–404. [Google Scholar] [CrossRef] [PubMed] [Green Version]
  63. La Ferla, R.; Maimone, G.; Lo Giudice, A.; Azzaro, F.; Cosenza, A.; Azzaro, M. Cell size and other phenotypic traits of prokaryotic cells in pelagic areas of the Ross Sea (Antarctica). Hydrobiologia 2015, 761, 181–194. [Google Scholar] [CrossRef]
  64. Gilichinsky, D.; Vishnivetskaya, T.; Petrova, M. Bacteria in permafrost. In Psychrophiles: From Biodiversity to Biotechnology; Margesin, R., Schinner, F., Marx, J.C., Gerday, C., Eds.; Springer-Verlag: Berlin/Heidelberg, Germany, 2008; pp. 83–102. [Google Scholar]
  65. Zaccone, R.; Caruso, G. Microbial hydrolysis of polysaccharides and organic phosphates in the Northern Adriatic Sea. Chem. Ecol. 2002, 18, 85–94. [Google Scholar] [CrossRef]
  66. Bauer, J.E.; Bianchi, T.S. Dissolved Organic Carbon Cycling and Transformation. In Treatise on Estuarine and Coastal Science; Wolanski, E., Mc Lusky, D.S., Eds.; Academic Press: Waltham, MA, USA, 2011; Volume 5, pp. 7–67. [Google Scholar]
  67. Piontek, J.; Sperling, M.; Nothing, E.M.; Engel, A. Regulation of bacterioplankton activity in Fram Strait (Arctic Ocean) during early summer: The role of organic matter supply and temperature. J. Mar. Syst. 2014, 132, 83–94. [Google Scholar] [CrossRef]
  68. Bowman, J.P.; McCammon, S.A.; Dann, A.L. Biogeographic and quantitative analyses of abundant uncultivated gamma-proteobacterial clades from marine sediment. Microb. Ecol. 2005, 49, 451–460. [Google Scholar] [CrossRef]
  69. Ravenschlag, K.; Sahm, K.; Amann, R. Quantitative molecular analysis of the microbial community in marine arctic sediments (Svalbard). Appl. Environ. Microbiol. 2001, 67, 387–395. [Google Scholar] [CrossRef]
  70. Pearce, D.A.; Hodgson, D.A.; Thorne, M.A.S.; Burns, G.; Cockell, C.S. Preliminary analysis of life within a former subglacial lake sediment in Antarctica. Diversity 2013, 5, 680–702. [Google Scholar] [CrossRef]
Figure 1. Location of the sampling stations: (A area) Drygalski glacier and Terra Nova Bay polynya; (C area) Cape Adare shelf break area.
Jmse 10 01666 g001
Figure 2. (a) MDS ordination diagram of the environmental and biological variables in A area (Drygalski glacier and Terra Nova Bay polynya) and C area (Cape Adare shelf break area); (b) ANOSIM test with sample statistic Global R: 0.257 (significance level of sample statistic: 0.01%).
Jmse 10 01666 g002
Figure 3. CTD profiles for the two areas: Area A (Drygalski glacier and Terra Nova Bay polynya) and Area C (Cape Adare shelf break area). (a,b) temperature; (c,d) salinity; (e,f) dissolved oxygen; (g,h) fluorescence.
Jmse 10 01666 g003
Figure 4. Mean concentrations of trophic and optical variables in the two different study areas: (a) ammonia NH4+; (b) nitrite+ nitrate NO2+NO3; (c) phosphate PO4; (d) dissolved organic carbon DOC; (e) slope in the range 275–295 nm S275−295; (f) SUVA254 index; (g) total suspended matter TSM; (h) particulate organic carbon POC; (i) particulate nitrogen PTN. Box-Whiskers plot: boxes are characterized by a median line and boundaries indicating 25th and 75th percentiles; whiskers are characterized by a vertical line indicating 5th and 95th percentiles. White dots = outliers, black dots = extreme values.
Jmse 10 01666 g004
Figure 5. Box plots of microbial parameters studied by Image analysis: (a) Total prokaryotic abundance (TPP), (b) cell volumes (VOL) (c) prokaryotic biomass (PB), (d) percentages of the living and dead cells and (e) respiring cells (CTC+). The boxes are characterized by a median line and boundaries indicating 25th and 75th percentiles; whiskers are characterized by a vertical line indicating 5th and 95th percentiles. White dots = outliers, black dots = extreme values.
Jmse 10 01666 g005
Figure 6. Box plots of microbial parameters studied by Flow Cytometric analysis: (a) Total prokaryotes, (b,c) High- and Low-Nucleic Acid cells (HNA and LNA), (d,e) Pico- and Nano-eukaryotes. The boxes are characterized by a median line and boundaries indicating 25th and 75th percentiles; whiskers area characterized by a vertical line indicating 5th and 95th percentiles. White dots = outliers, black dots = extreme values.
Jmse 10 01666 g006
Figure 7. Percentage contribution of different taxa detected by CARD-FISH analysis.
Jmse 10 01666 g007
Figure 8. Box plots of the abundance of culturable heterotrophic bacteria (a), and of the percentages of bacterial isolates positive for proteolytic and phosphatasic activities (b,c). The boxes are char-acterized by a median line and boundaries indicating 25th and 75th percentiles; whiskers area characterized by a vertical line indicating 5th and 95th percentiles. White dots = outliers, black dots = extreme values.
Jmse 10 01666 g008
Figure 9. Box plots of the main categories of Carbon sources utilized by the microbial community, namely (a) complex C sources, (b) carbohydrates, (c) P-C compounds, (d) carboxylic acids, (e) amino acids and (f) amines. The boxes are characterized by a median line and boundaries indicating 25th and 75th percentiles; whiskers area characterized by a vertical line indicating 5th and 95th per-centiles. White dots = outliers, black dots = extreme values.
Jmse 10 01666 g009
Figure 10. Principal Component Analysis (PCA) of key environmental and biological variables selected on the basis of the Spearman rank correlation matrix, in the two areas (a) A area, (b) C area, for the euphotic (EZ, green points) and aphotic (AZ, red points) zones. For details on correlation factors, see the supplementary material. For a clearer reading of the diagrams, the following symbols have been associated with some variable: Nox = NO2+NO3; % L = % Live; % D = % Dead; A = AWCD; B = Richness; C = Complex carbon source; D = Carboydrates; E = Amines; Sl = S 275-295; Su = SUVA254.
Jmse 10 01666 g010
Table 1. Geographical coordinates of the stations sampled in Ross Sea.
A area
StationsLat (S)Long (E)Max. depth (m)
275°35.1282′165°28.4682′842
375°31.6676′165°43.1940′789
675°12.3186′163°33.0294′1108
875°20.9871′164°41.00′683
1175°07.0896′164°09.8970′971
1275°04.3128′163°42.2874′867
1474°55′39.598″163°59′46.799″344
1574°42.414′164°13.5088′498
1875°10.426′165°2.3732′1054
1975°00.2847′165°07.5264′925
2074°47.456′165°23.582′662
2174°52.4730′ 166°34.7040′886
2275°04.5138′166°24.2760′855
2375°14.1960′166°10.9332′852
C area
StationsLat (S)Long (E)Max. depth (m)
6372°12.7692′172°00.1914′415
6472°16.9812′172°30.0396′516
6572°22.2870′172°59.6796′513
6672°27.0273′173°29.9220′480
6772°31.2120′174°00.1422′ 430
6872°35.5641′174°30.0630′406
7471°48.3646′173°35.2806′1969
7571°53.5158′174°04.4184′1870
7671°58.0998′174°34.5156′1786
7772°02.4300′175°04.7070′1623
Table 2. HRP-labeled oligonucleotide probes used in this study. Probes EUB338I, EUB338II and EUB338III were equimolarly mixed together to obtain the EUB mix; probes DELTA495a, DELTA495b and DELTA495c were equimolarly mixed together to obtain the DELTA mix.
ProbesTarget GroupProbe Sequence (5′-3′)References
EUB338IMost, but not all bacteriaGCTGCCTCCCGTAGGAGT [39]
EUB338IIPlanctomycetesGCAGCCACCCGTAGGTGT[40]
EUB338IIIVerrucomicrobialesGCTGCCACCCGTAGGTGT[40]
ALF968AlphaproteobacteriaGGTAAGGTTCTGCGCGTT[41]
BET42aBetaproteobacteriaGCCTTCCCACTTCGTTT [42]
GAM42aGammaproteobacteriaGCCTTCCCACATCGTTT[42]
DELTA495aMost DeltaproteobacteriaAGTTAGCCGGTGCTTCCT[43]
DELTA495bDeltaproteobacteriaAGTTAGCCGGCGCTTCCT[43]
DELTA495cDeltaproteobacteriaAATTAGCCGGTGCTTCCT[43]
EPSY914EpsilonproteobacteriaGGTCCCCGTCTATTCCTT[44]
CF319aBacteroidetesTGGTCCGTGTCTCAGTAC[45]
ARCH915ArchaeaGTGCTCCCCCGCCAATTCCT[46]
Publisher’s Note: MDPI stays neutral with regard to jurisdictional claims in published maps and institutional affiliations.

