
Effect of Mechanical Stimuli and Zoledronic Acid on the Femoral Bone Morphology in Rats with Obesity and Limited Mobility

 , , , , and
Abstract
:1. Introduction
2. Materials and Methods
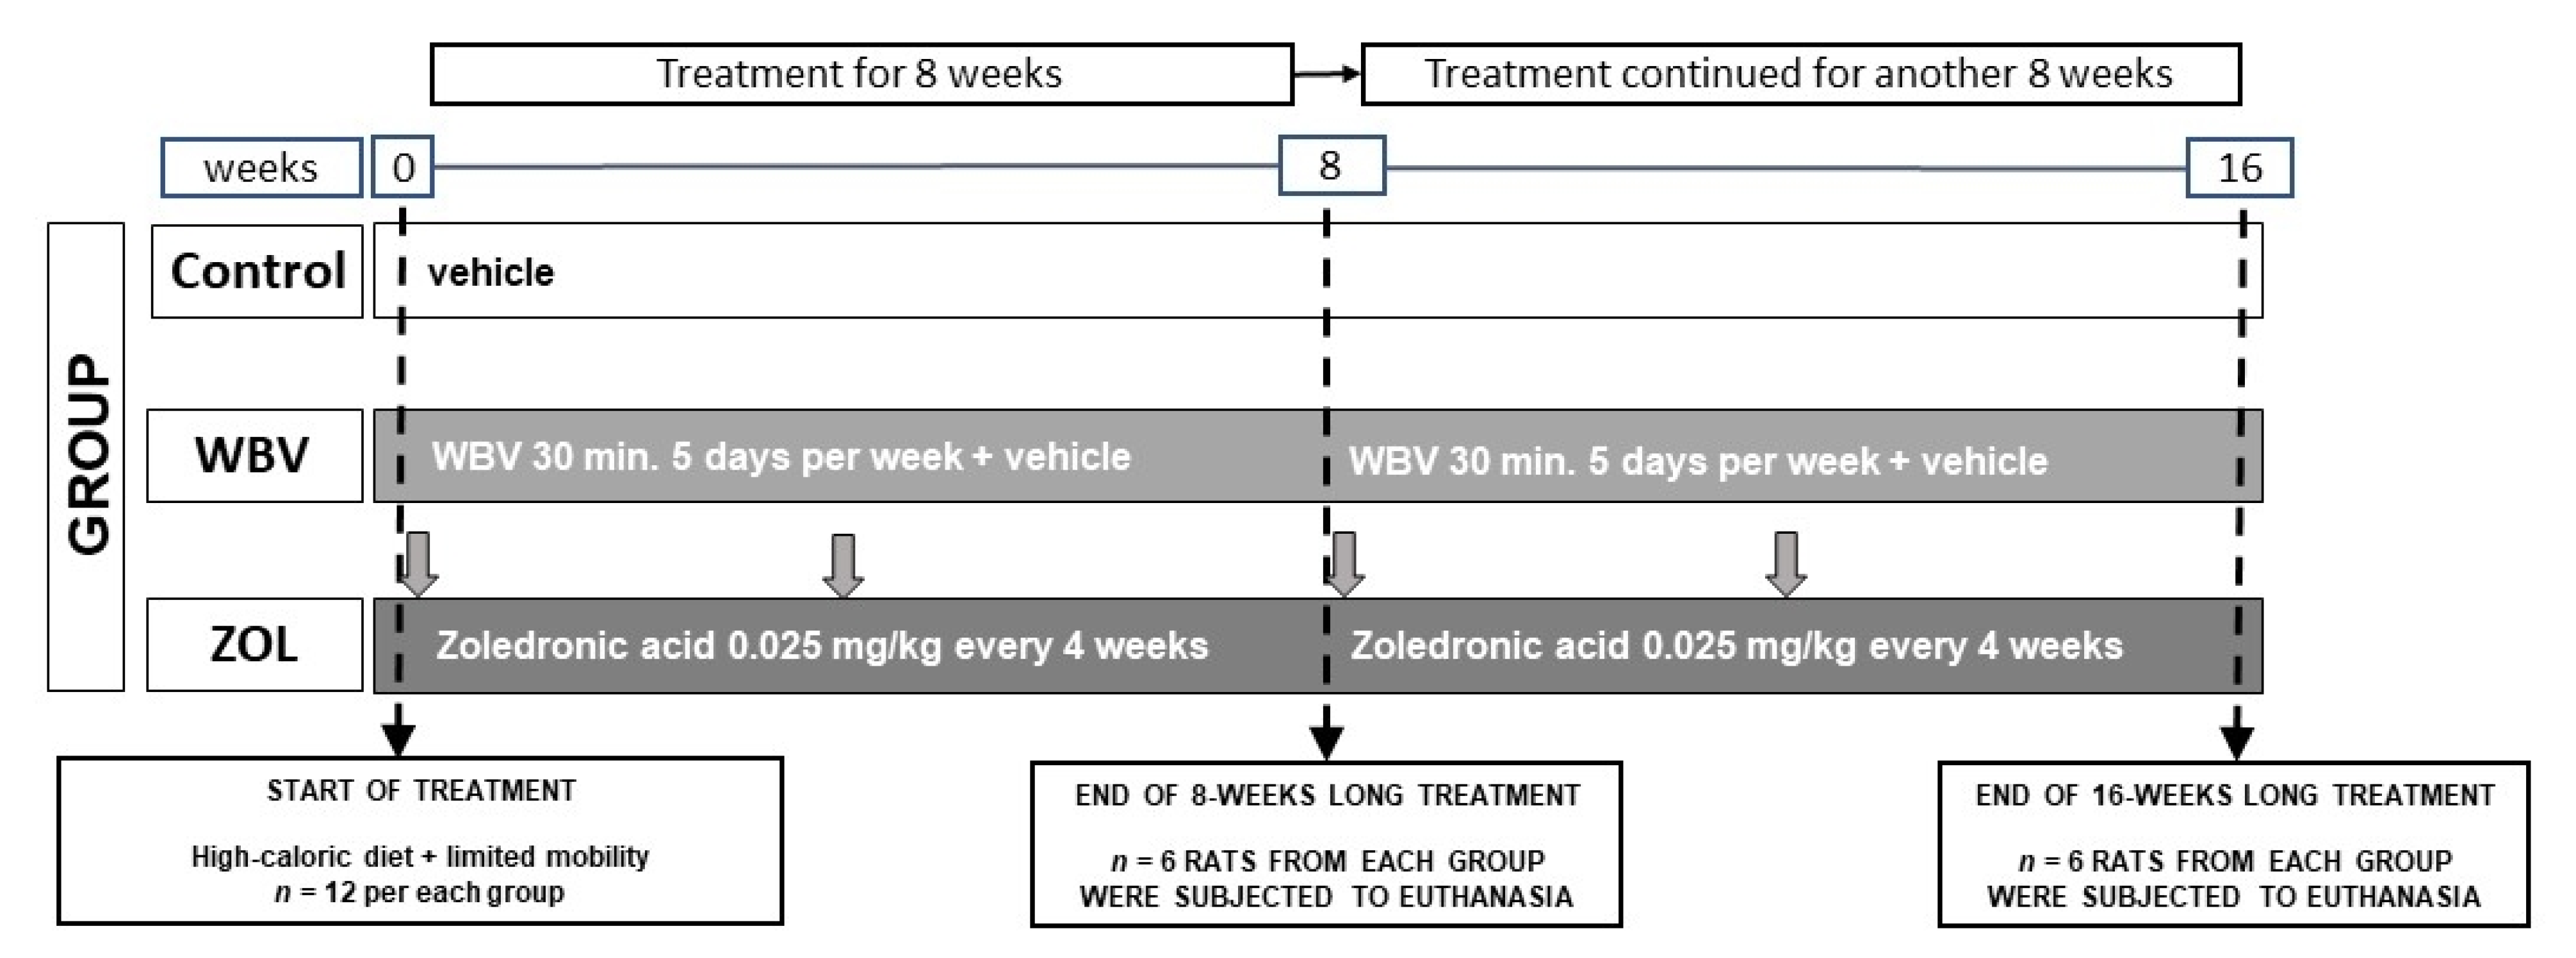
2.1. Animals and Experimental Design
2.2. Bone Preparation and Histomorphometry Analysis
2.3. Immunohistochemical Analysis
2.4. Statystical Anlysis
3. Results
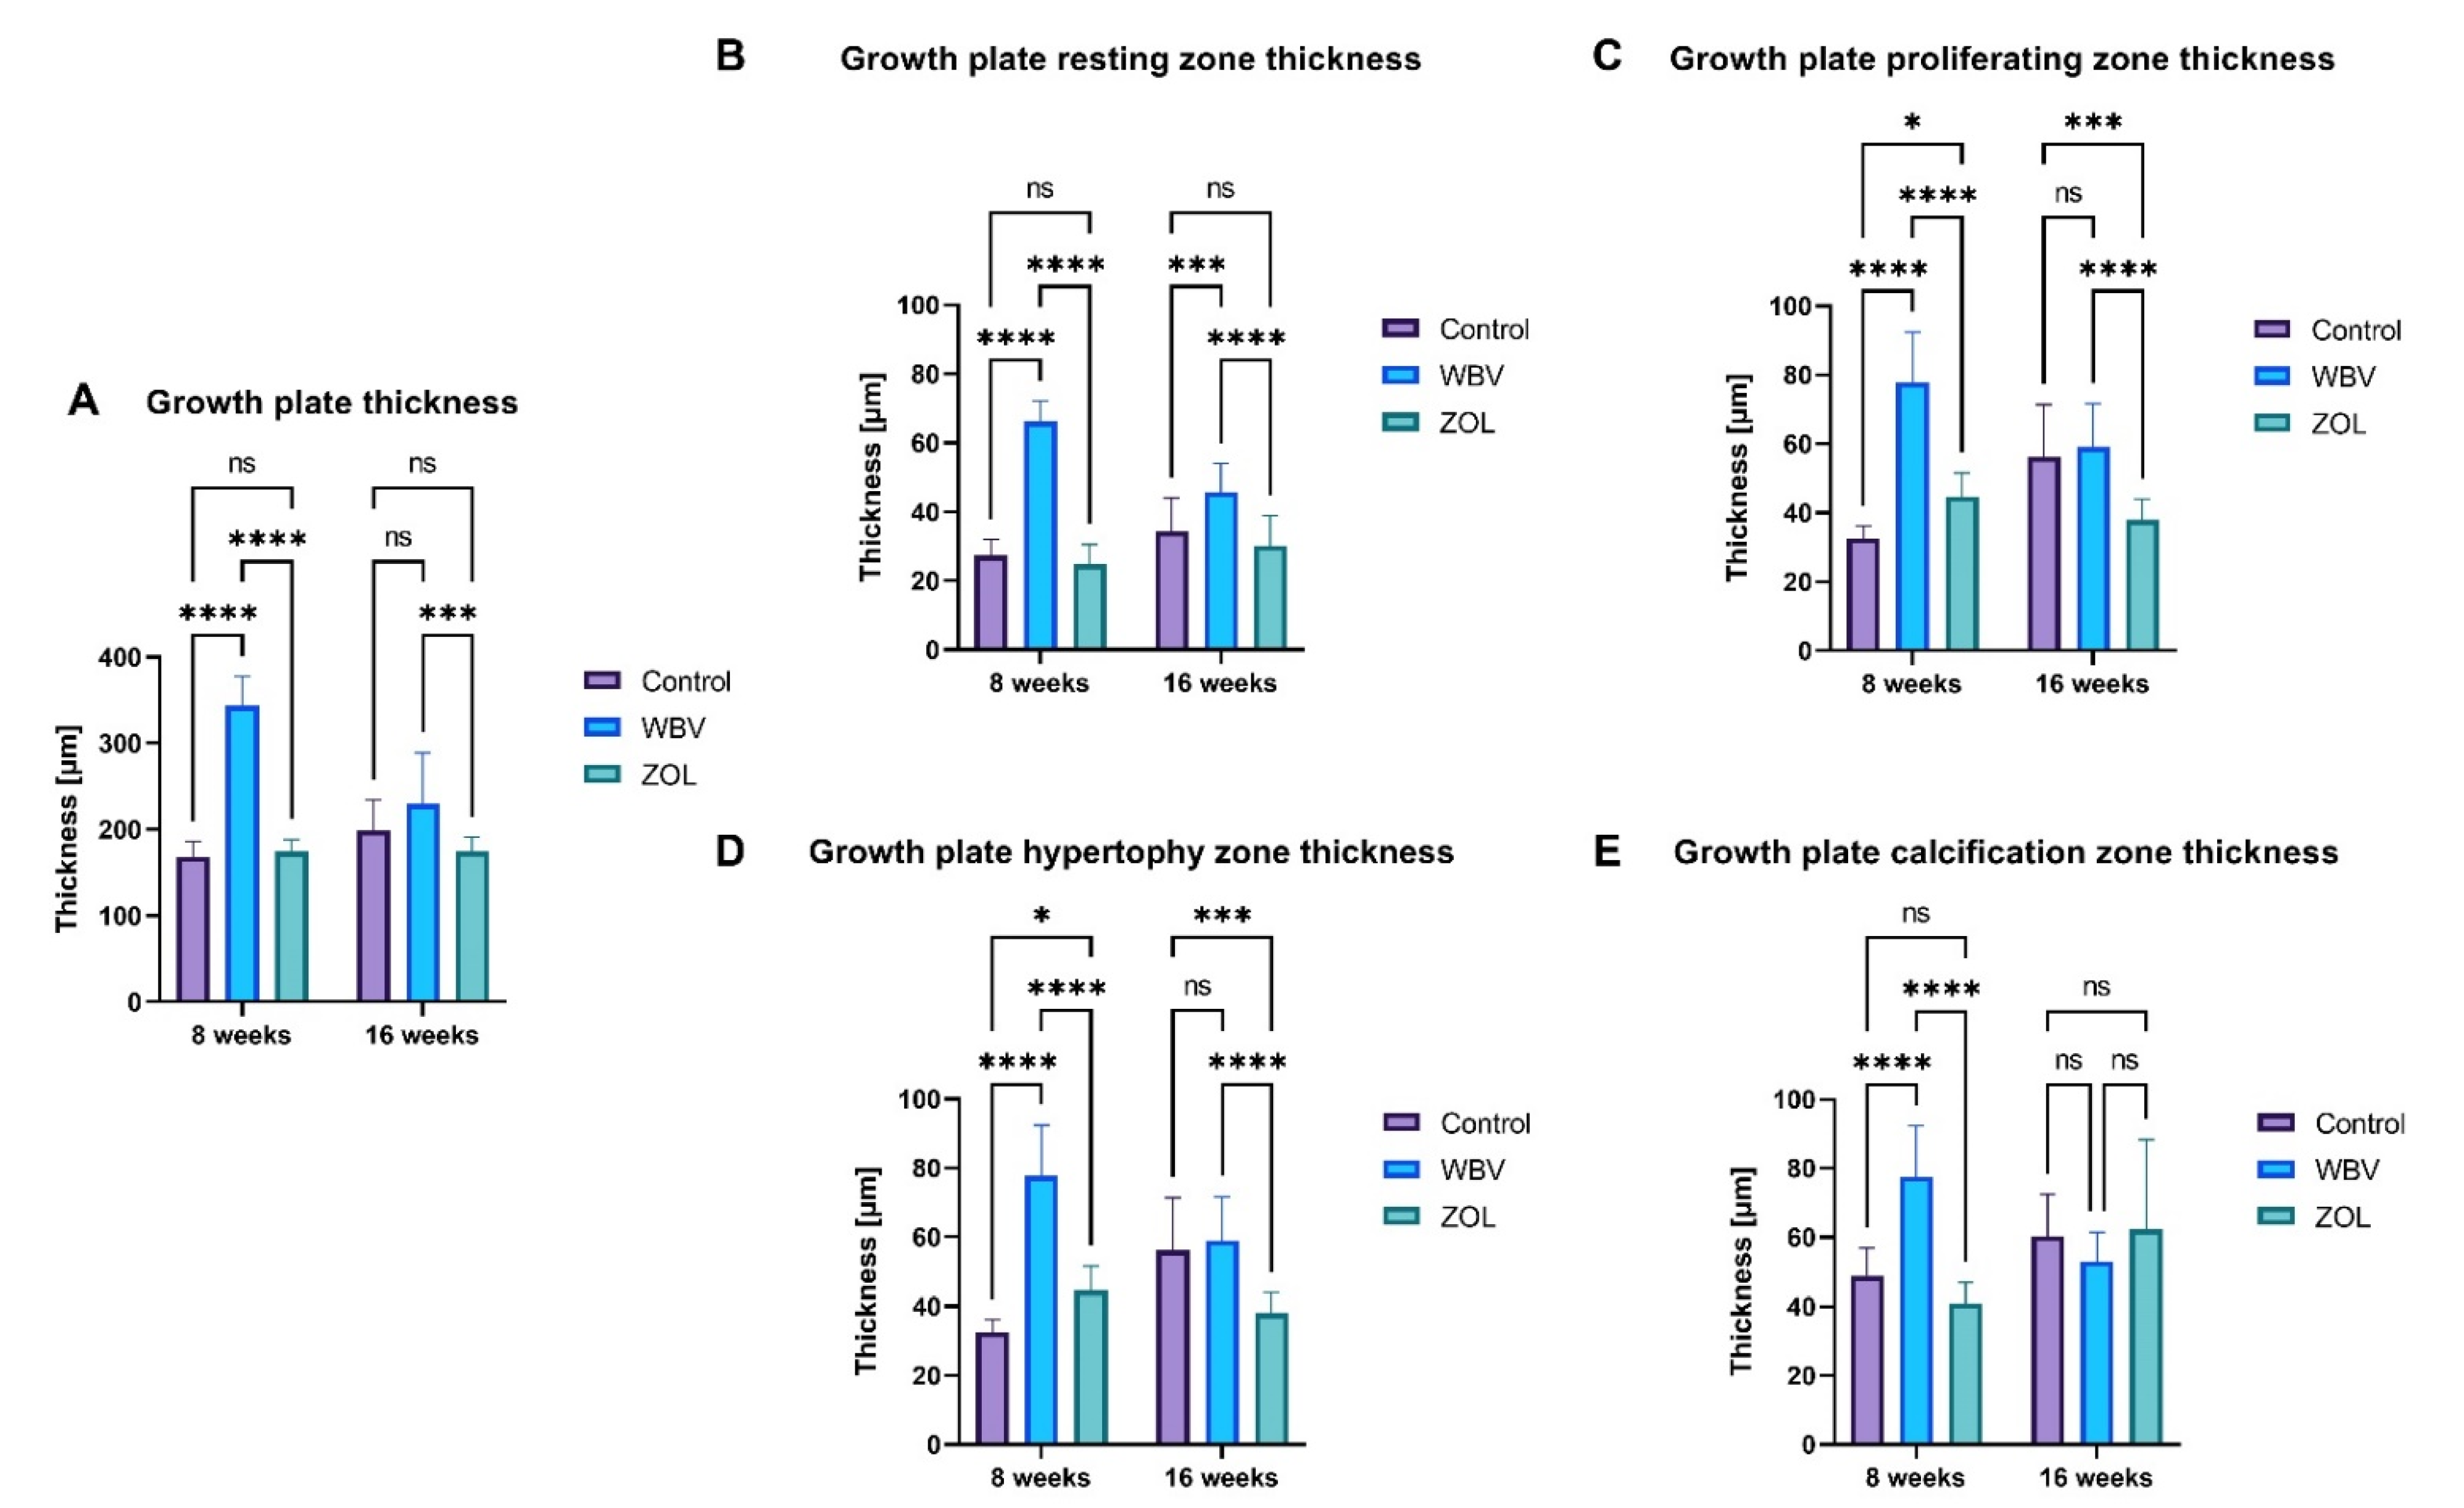
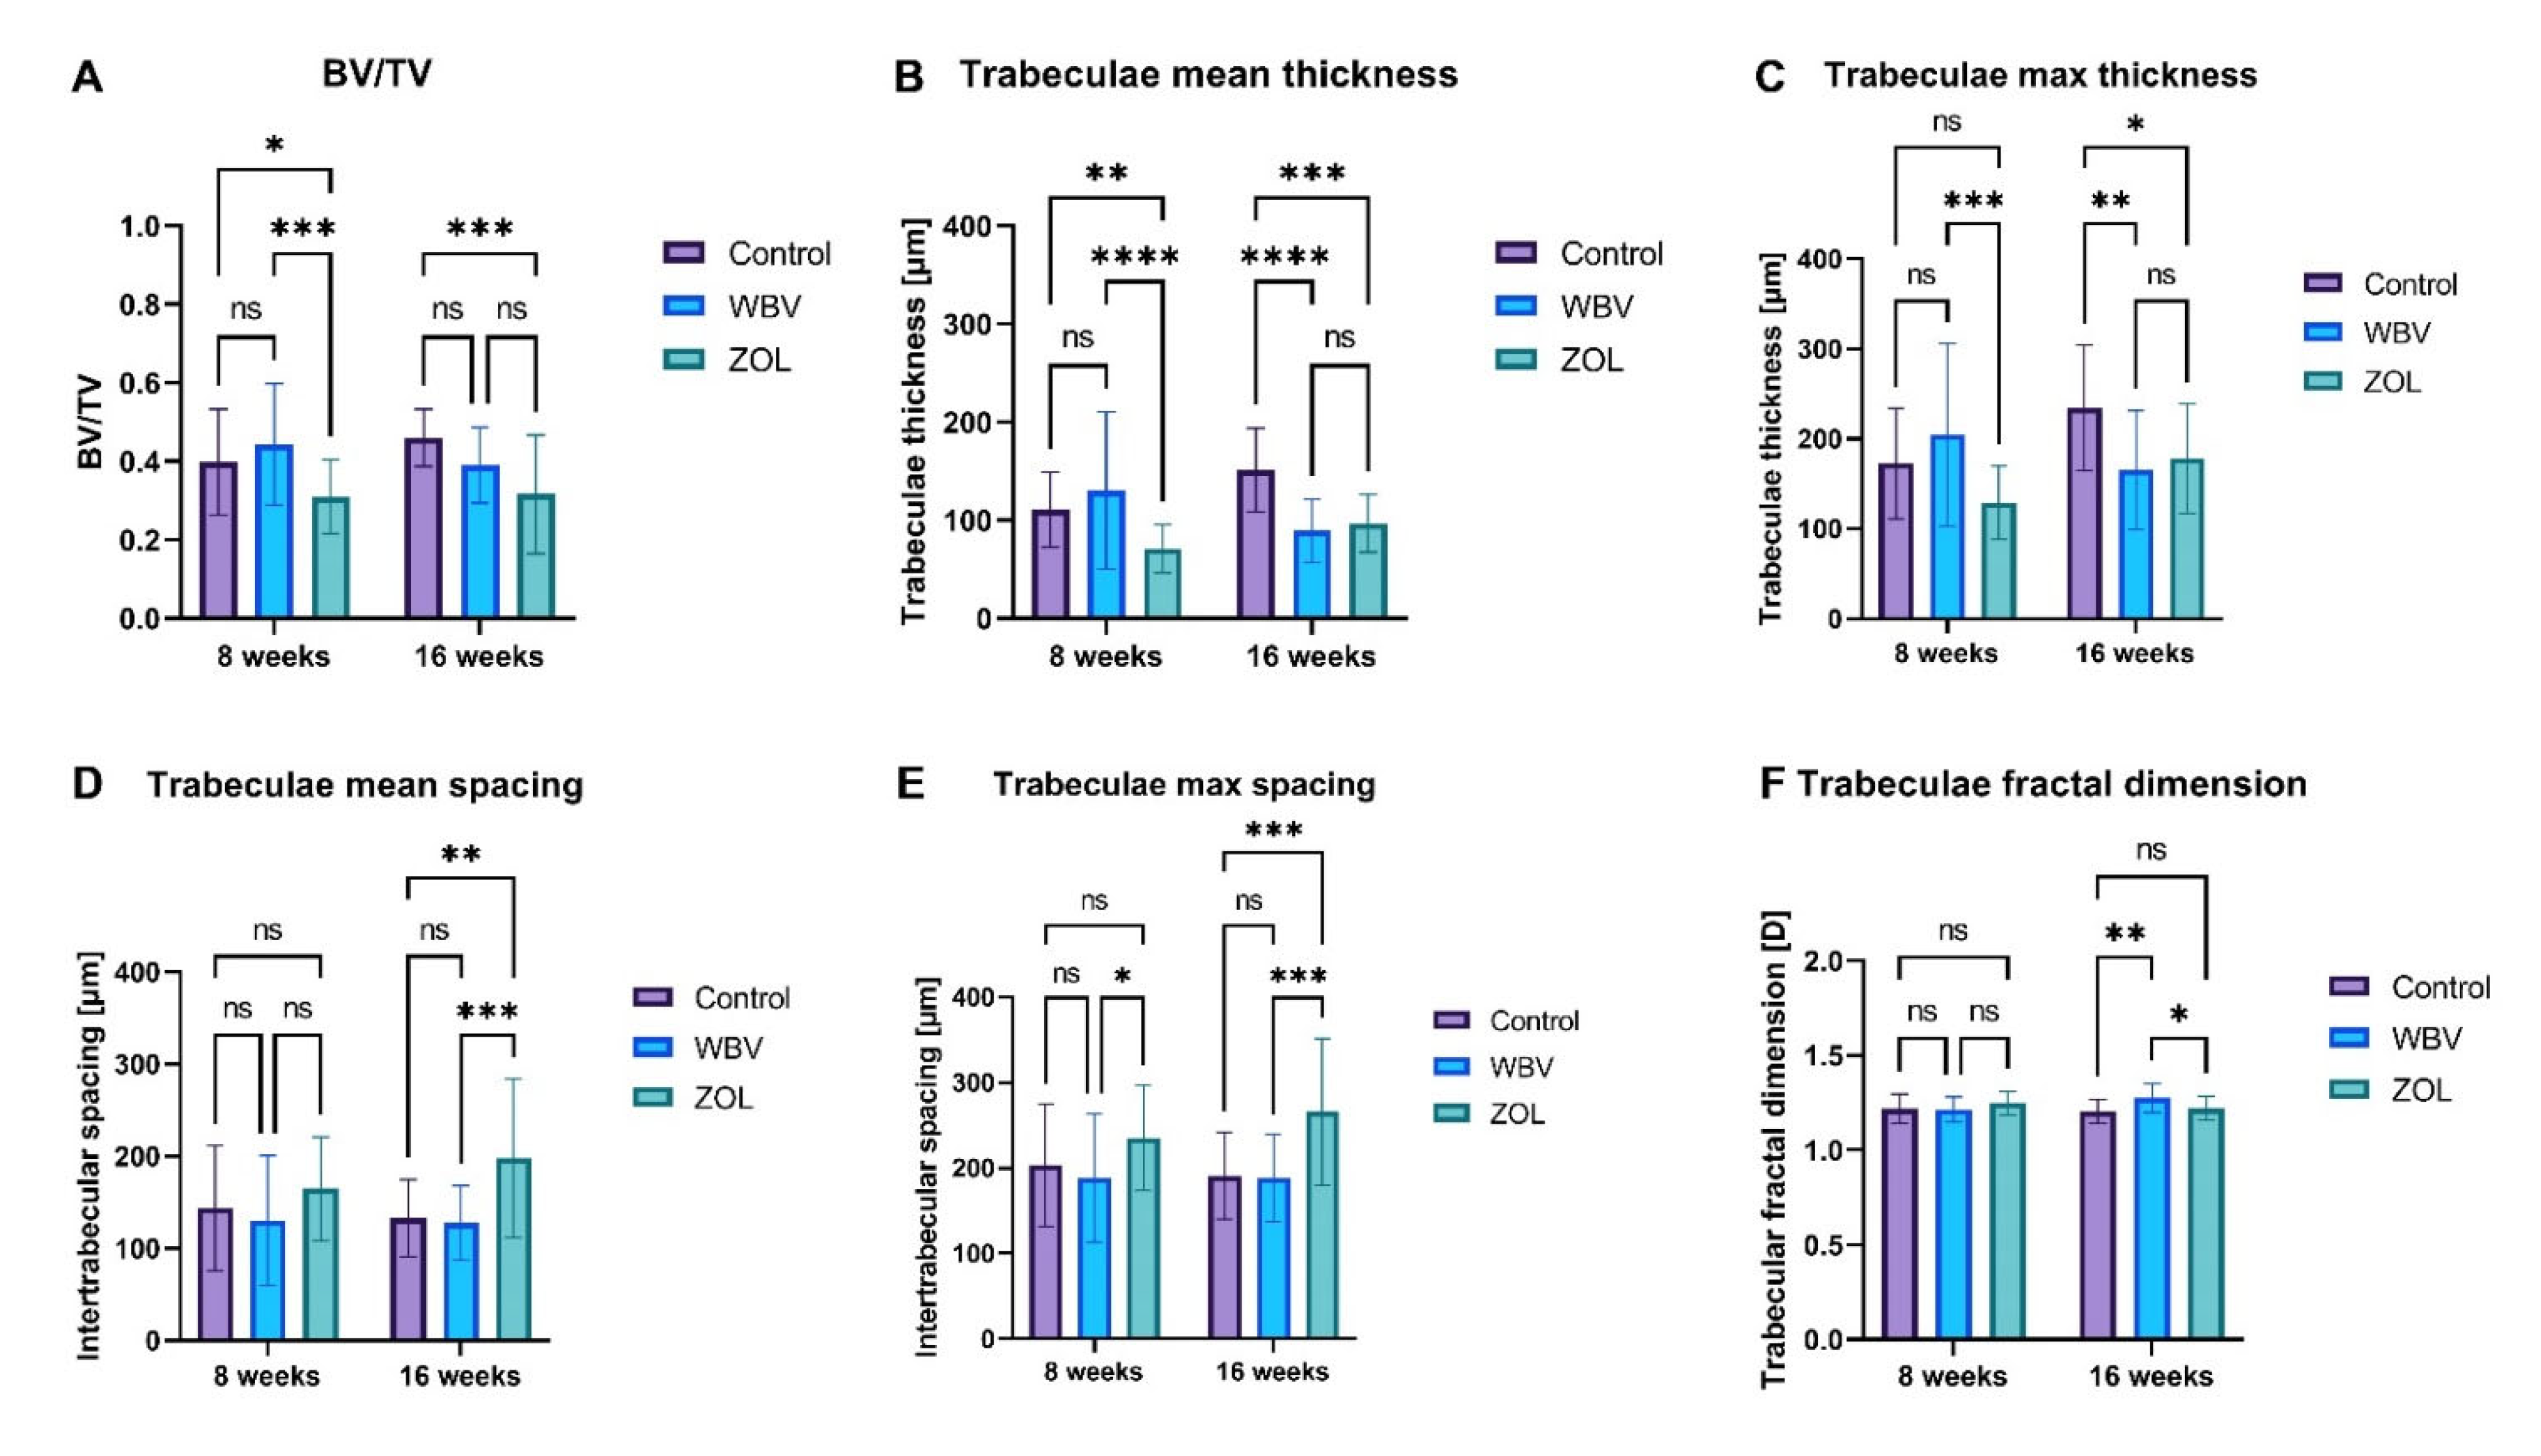
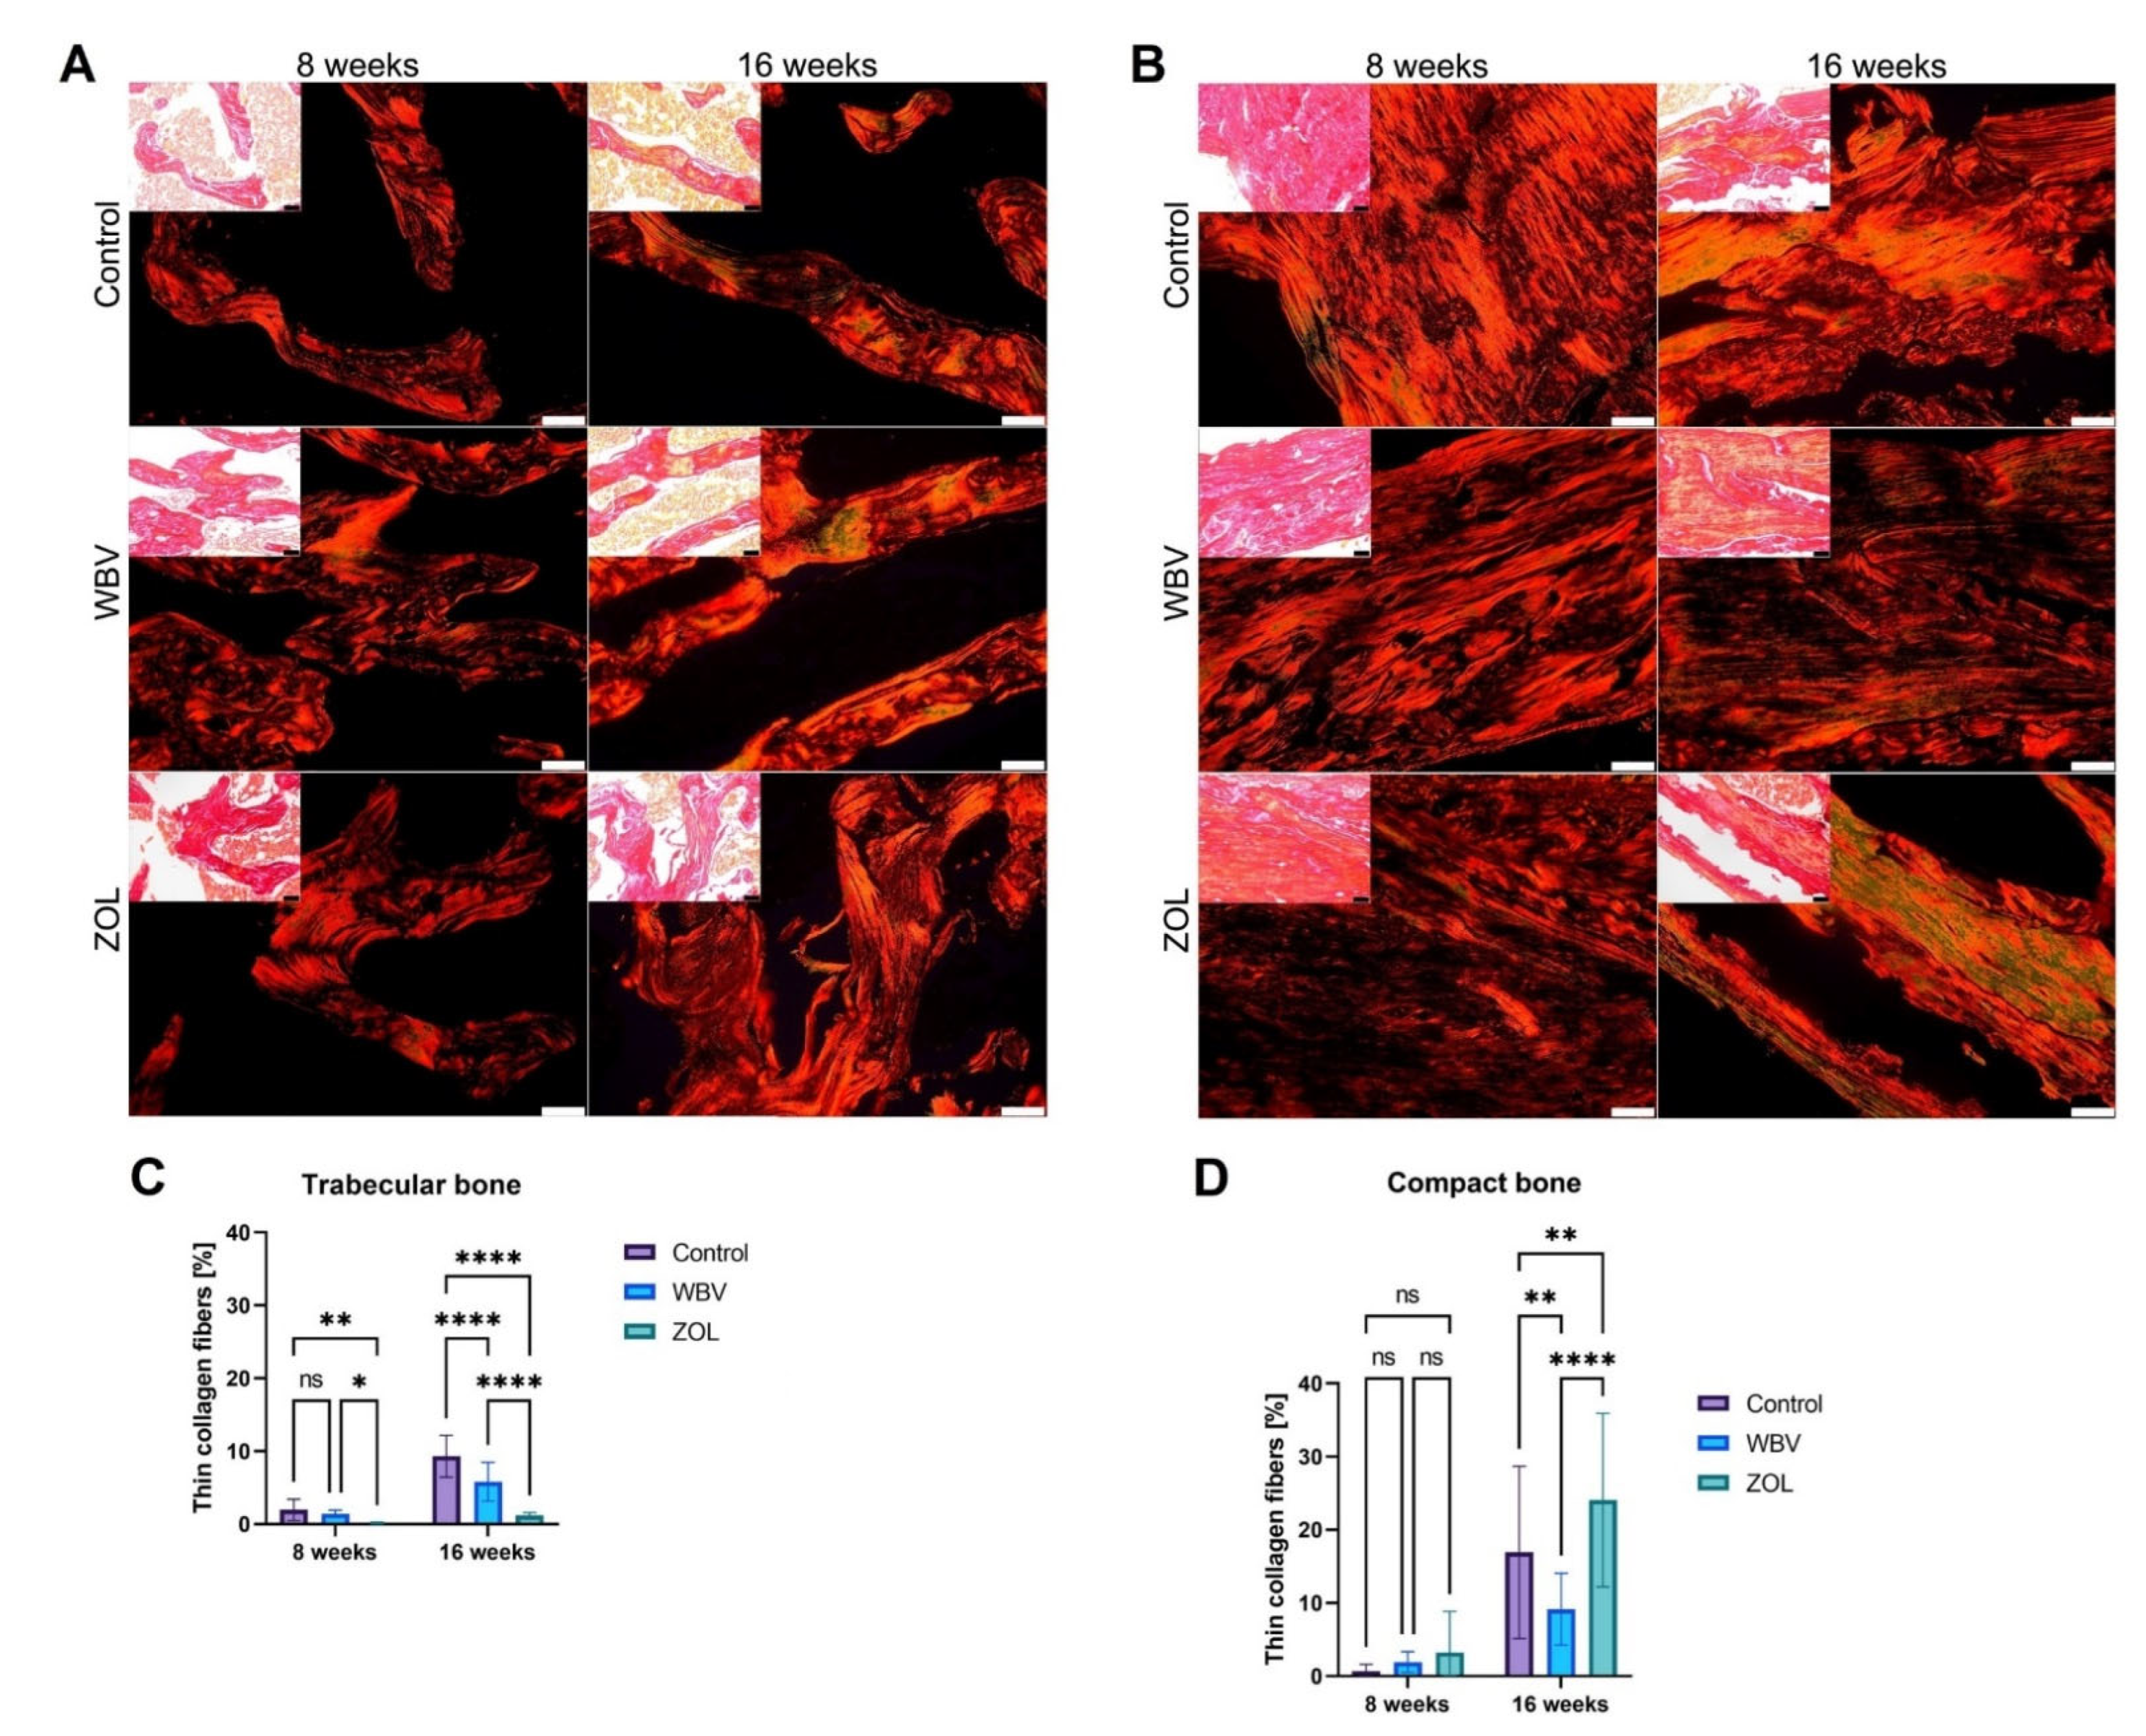
Histomorphometry
4. Discussion
5. Conclusions
Author Contributions
Funding
Institutional Review Board Statement
Informed Consent Statement
Data Availability Statement
Conflicts of Interest
References
- Duque, G. (Ed.) Osteosarcopenia: Bone, Muscle and Fat Interactions; Springer: Berlin/Heidelberg, Germany, 2019; 383p. [Google Scholar]
- Veronese, N.; Beaudart, C.; Sabico, S. (Eds.) Sarcopenia: Research and Clinical Implications; Springer: Cham, Switzerland, 2021; 220p. [Google Scholar]
- Barazzoni, R.; Bischoff, S.C.; Boirie, Y.; Busetto, L.; Cederholm, T.; Dicker, D.; Toplak, H.; Van Gossum, A.; Yumuk, V.; Vettor, R. Sarcopenic obesity: Time to meet the challenge. Clin. Nutr. 2018, 37, 1787–1793. [Google Scholar] [CrossRef] [PubMed]
- Choi, K.M. Sarcopenia and sarcopenic obesity. Korean J. Intern. Med. 2016, 31, 1054–1060. [Google Scholar] [CrossRef] [PubMed] [Green Version]
- Polyzos, S.A.; Margioris, A.N. Sarcopenic obesity. Hormones 2018, 17, 321–331. [Google Scholar] [CrossRef]
- Compston, J. Obesity and bone. Curr. Osteoporos. Rep. 2013, 11, 30–35. [Google Scholar] [CrossRef]
- Walsh, J.S.; Vilaca, T. Obesity, Type 2 diabetes and bone in adults. Calcif. Tissue Int. 2017, 100, 528–535. [Google Scholar] [CrossRef] [Green Version]
- Torvinen, S.; Kannus, P.; Sievanen, H.; Jarvinen, T.A.; Pasanen, M.; Kontulainen, S.; Nenonen, A.; Jarvinen, T.L.; Paakkala, T.; Jarvinen, M.; et al. Effect of 8-month vertical whole body vibration on bone, muscle performance, and body balance: A randomized controlled study. J. Bone Miner. Res. 2003, 18, 876–884. [Google Scholar] [CrossRef]
- De Zepetnek, J.O.T.; Giangregorio, L.M.; Craven, B.C. Whole-body vibration as potential intervention for people with low bone mineral density and osteoporosis: A review. J. Rehabil. Res. Dev. 2009, 46, 529–542. [Google Scholar] [CrossRef] [Green Version]
- Pang, M.Y.; Lau, R.W.; Yip, S.P. The effects of whole-body vibration therapy on bone turnover, muscle strength, motor function, and spasticity in chronic stroke: A randomized controlled trial. Eur. J. Phys. Rehabil. Med. 2013, 49, 439–450. [Google Scholar]
- Marín-Cascales, E.; Alcaraz, P.E.; Ramos-Campo, D.J.; Martinez-Rodriguez, A.; Chung, L.H.; Rubio-Arias, J.Á. Whole-body vibration training and bone health in postmenopausal women: A systematic review and meta-analysis. Medicine 2018, 97, e11918. [Google Scholar] [CrossRef]
- Bemben, D.; Stark, C.; Taiar, R.; Bernardo-Filho, M. Relevance of whole-body vibration exercises on muscle strength/power and bone of elderly individuals. Dose Response 2018, 16, 1–7. [Google Scholar] [CrossRef] [Green Version]
- Swolin-Eide, D.; Magnusson, P. Does whole-body vibration treatment make children’s bones stronger? Curr. Osteoporos. Rep. 2020, 18, 471–479. [Google Scholar] [CrossRef] [PubMed]
- Villareal, D.T.; Apovian, C.M.; Kushner, R.F.; Klein, S. Obesity in older adults: Technical review and position statement of the American Society for Nutrition and NAASO, The Obesity Society. Am. J. Clin. Nutr. 2005, 82, 923–934. [Google Scholar] [CrossRef] [PubMed] [Green Version]
- Yarrow, J.F.; Toklu, H.Z.; Balaez, A.; Phillips, E.G.; Otzel, D.M.; Chen, C.; Wronski, T.J.; Aguirre, J.I.; Sakarya, Y.; Tumer, N.; et al. Fructose consumption does not worsen bone deficits resulting from high-fat feeding in young male rats. Bone 2016, 85, 99–106. [Google Scholar] [CrossRef] [PubMed] [Green Version]
- Cao, J.J. Effects of obesity on bone metabolism. J. Orthop. Surg. Res. 2011, 6, 30. [Google Scholar] [CrossRef] [PubMed] [Green Version]
- Cao, J.J.; Sun, L.; Gao, H. Diet-induced obesity alters bone remodeling leading to decreased femoral trabecular bone mass in mice. Ann. NY Acad. Sci. 2010, 1192, 292–297. [Google Scholar] [CrossRef] [PubMed]
- Tadano, S.; Giri, B. X-ray diffraction as a promising tool to characterize bone nanocomposites. Sci. Technol. Adv. Mater. 2012, 12, 064708. [Google Scholar] [CrossRef]
- Sá-Caputo, D.A.C.; Ronikeili-Costa, P.; Carvalho-Lima, R.P.; Bernardo, L.C.; Bravo-Monteiro, M.O.; Costa, R.; de Moraes-Silva, J.; Paiva, D.N.; Machado, C.B.; Mantilla-Giehl, P.; et al. Whole body vibration exercises and the improvement of the flexibility in patient with metabolic syndrome. Rehabil. Res. Pract. 2014, 2014, 628518. [Google Scholar] [CrossRef] [Green Version]
- Cahalan, S.M.; Lukacs, V.; Ranade, S.S.; Chien, S.; Bandell, M.; Patapoutian, A. Piezo1 links mechanical forces to red blood cell volume. eLife 2015, 4, e07370. [Google Scholar] [CrossRef]
- Choi, D.; Park, E.; Jung, E.; Cha, B.; Lee, S.; Yu, J.; Kim, P.M.; Lee, S.; Hong, Y.J.; Koh, C.J.; et al. Piezo1 incorporates mechanical force signals into the genetic program that governs lymphatic valve development and maintenance. JCI Insight 2019, 4, 125068. [Google Scholar] [CrossRef]
- Fotiou, E.; Martin-Almedina, S.; Simpson, M.; Lin, S.; Gordon, K.; Brice, G.; Atton, G.; Jeffery, I.T.A.; Rees, D.C.; Mignot, C.; et al. Novel mutations in PIEZO1 cause an autosomal recessive generalized lymphatic dysplasia with non-immune hydrops fetalis. Nat. Commun. 2015, 6, 8085. [Google Scholar] [CrossRef] [Green Version]
- Lambrinoudaki, I.; Vlachou, S.; Galapi, F.; Papadimitriou, D.; Papadias, K. Once-yearly zoledronic acid in the prevention of osteoporotic bone fractures in postmenopausal women. Clin. Interv. Aging 2008, 3, 445–451. [Google Scholar] [CrossRef] [PubMed]
- Wellington, K.; Goa, K.L. Zoledronic acid. Drugs 2012, 63, 417–437. [Google Scholar] [CrossRef] [PubMed]
- Black, D.M.; Reid, I.R.; Napoli, N.; Ewing, S.K.; Shiraki, M.; Nakamura, T.; Takeuchi, Y.; Schafer, A.L.; Kim, T.Y.; Cauley, J.A. The interaction of acute-phase reaction and efficacy for osteoporosis after zoledronic acid: Horizon pivotal fracture trial. J. Bone Miner. Res. 2022, 37, 21–28. [Google Scholar] [CrossRef] [PubMed]
- Wessel, J.H.; Dodson, T.B.; Zavras, A.I. Zoledronate, smoking, and obesity are strong risk factors for osteonecrosis of the jaw: A case-control study. J. Oral Maxillofac. Surg. 2008, 66, 625–631. [Google Scholar] [CrossRef] [PubMed] [Green Version]
- Recker, R.R.; Delmas, P.D.; Halse, J.; Reid, I.R.; Boonen, S.; Garcia-Hernandez, P.A.; Supronik, J.; Lewiecki, E.M.; Ochoa, L.; Miller, P.; et al. Effects of intravenous zoledronic acid once yearly on bone remodeling and bone structure. J. Bone Miner. Res. 2008, 23, 6–16. [Google Scholar] [CrossRef]
- Marmonti, E.; Busquets, S.; Toledo, M.; Ricci, M.; Beltrà, M.; Gudiño, V.; Oliva, F.; López-Pedrosa, J.M.; Manzano, M.; Rueda, R.; et al. A rat immobilization model based on cage volume reduction: A physiological model for bed rest? Front. Physiol. 2017, 8, 184. [Google Scholar] [CrossRef] [Green Version]
- Marmonti, E.; Busquets, S.; Toledo, M.; Ricci, M.; Bria, J.; Oliva, F.; López-Pedrosa, J.M.; Manzano, M.; Rueda, R.; López-Soriano, F.J.; et al. Immobilization in diabetic rats results in altered glucose tolerance. A model of reduced locomotion/activity in diabetes? J. Cachexia Sarcopenia Muscle Rapid Comm. 2018, 1, 1–15. [Google Scholar] [CrossRef]
- Bertinato, J.; Lavergne, C.; Rahimi, S.; Rachid, H.; Vu, N.A.; Plouffe, L.J.; Swist, E. Moderately low magnesium intake impairs growth of lean body mass in obese-prone and obese-resistant rats fed a high-energy diet. Nutrients 2016, 8, 253. [Google Scholar] [CrossRef] [Green Version]
- Shih, D.M.; Meng, Y.; Sallam, T.; Vergnes, L.; Shu, M.L.; Reue, K.; Tontonoz, P.; Fogelman, A.M.; Lusis, A.J.; Reddy, S.T. PON2 deficiency leads to increased susceptibility to diet-induced obesity. Antioxidants 2019, 8, 19. [Google Scholar] [CrossRef] [Green Version]
- Duca, F.A.; Swartz, T.D.; Covasa, M. Effect of diet on preference and intake of sucrose in obese prone and resistant rats. PLoS ONE 2014, 9, e111232. [Google Scholar] [CrossRef]
- Bollheimer, L.C.; Buettner, R.; Pongratz, G.; Brunner-Ploss, R.; Hechti, C.; Banas, M.; Singler, K.; Hamer, O.W.; Stroczynski, C.; Sieber, C.C.; et al. Sarcopenia in the aging high-fat fed rat: A pilot study for modeling sarcopenic obesity in rodents. Biogerontology 2012, 13, 609–620. [Google Scholar] [CrossRef] [PubMed]
- Fellner, C.; Schick, F.; Kob, R.; Hechti, C.; Vorbuchner, M.; Buttner, R.; Hamer, O.W.; Sieber, C.C.; Stroczynski, C.; Bollheimer, L.C. Diet-induced and age-related changes in the quadriceps muscle: MRI and MRS in a rat model of sarcopenia. Gerontology 2014, 60, 530–538. [Google Scholar] [CrossRef] [PubMed] [Green Version]
- Turpin, S.M.; Ryall, J.G.; Southgate, R.; Darby, I.; Hevener, A.L.; Fabbraio, M.A.; Kemp, B.E.; Lynch, G.S.; Watt, M.J. Examination of ‘lipotoxicity’ in skeletal muscle of high-fat fed and ob/ob mice. J. Physiol. 2009, 587, 1593–1605. [Google Scholar] [CrossRef]
- Xiao, Y. Structural, Mechanical and Viscoelastic Changes in Ovariectomized Rat upon Drug Treatment and Vibration Therapy. Ph.D. Thesis, National University of Singapore, Singapore, 2012. [Google Scholar]
- Kostyshyn, N.M.; Świetlicka, I.; Tomaszewska, E.; Dobrowolski, P.; Muszyński, S. Impact of whole body vibration and zoledronic acid on femoral structure after ovariectomy: Morphological evaluation. J. Clin. Med. 2022, 11, 2441. [Google Scholar] [CrossRef] [PubMed]
- Beck, B.; Rubin, C.; Harding, A.; Paul, S.; Forwood, M. The effect of low-intensity whole-body vibration with or without high-intensity resistance and impact training on risk factors for proximal femur fragility fracture in postmenopausal women with low bone mass: Study protocol for the VIBMOR randomized controlled trial. Trails 2022, 23, 15. [Google Scholar]
- Flieger, J.; Karachalios, T.; Khaldi, L.; Raptoou, P.; Lyritis, G. Mechanical stimulation in the form of vibration prevents postmenopausal bone loss in ovariectomized rats. Calcif. Tissue Int. 1998, 63, 510–514. [Google Scholar] [CrossRef]
- Novelli, E.L.B.; Diniz, Y.S.; Galhardi, C.M.; Ebaid, G.M.X.; Rodrigues, H.G.; Mani, F.; Fernandes, A.A.H.; Cicogna, A.C.; Novelli Filho, J.L.V.B. Anthropometrical parameters and markers of obesity in rats. Lab. Anim. 2007, 41, 111–119. [Google Scholar] [CrossRef] [Green Version]
- Tomaszewska, E.; Dobrowolski, P.; Puzio, I.; Donaldson, J.; Muszyński, S. Acrylamide-induced prenatal programming of bone structure in mammal model. Ann. Anim. Sci. 2020, 20, 1257–1287. [Google Scholar] [CrossRef]
- Dobrowolski, P.; Tomaszewska, E.; Muszyński, S.; Blicharski, T.; Pierzynowski, S.G. Dietary 2-oxoglutarate prevents bone loss caused by neonatal treatment with maximal dexamethasone dose. Exp. Biol. Med. 2017, 242, 671–682. [Google Scholar] [CrossRef] [Green Version]
- Rich, L.; Whittaker, P. Collagen and Picrosirius Red Staining: A polarized light assessment of fibrillar hue and spatial distribution. Braz. J. Morphol. Sci. 2005, 22, 97–104. [Google Scholar]
- Schneider, C.A.; Rasband, W.S.; Eliceiri, K.W. NIH Image to ImageJ: 25 years of image analysis. Nat. Methods 2012, 9, 671–675. [Google Scholar] [CrossRef] [PubMed]
- Iwaniak, P.; Tomaszewska, E.; Muszyński, S.; Marszałek-Grabska, M.; Pierzynowski, S.G.; Dobrowolski, P. Dietary alpha-ketoglutarate partially abolishes adverse changes in the small intestine after gastric bypass surgery in a rat model. Nutrients 2022, 14, 2062. [Google Scholar] [CrossRef] [PubMed]
- Hułas-Stasiak, M.; Jakubowicz-Gil, J.; Dobrowolski, P.; Grzesiak, M.; Muszyński, S.; Świątkiewicz, M.; Tomaszewska, E. Regulation of folliculogenesis by growth factors in piglet ovary exposed prenatally to β-hydroxy-β-methylbutyrate (HMB). Ann. Anim. Sci. 2020, 20, 899–917. [Google Scholar] [CrossRef]
- Tomaszewska, E.; Prost, Ł.; Dobrowolski, P.; Chand, D.K.P.; Donaldson, J.; Czech, A.; Klebaniuk, R.; Fabjanowska, J.; Muszyński, S. Prenatal programming of the small intestine in piglets: The effect of supplementation with 3-hydroxy-3-methylbutyric acid (HMB) in pregnant sows on the structure of jejunum of their offspring. Ann. Anim. Sci. 2022, 22, 613–623. [Google Scholar] [CrossRef]
- Festing, M.F.W. On determining sample size in experiments involving laboratory animals. Lab. Anim. 2018, 52, 341–350. [Google Scholar] [CrossRef] [PubMed]
- Rocabado, J.M.R.; Kaku, M.; Nozaki, K.; Ida, T.; Kitami, M.; Aoyagi, Y.; Uoshima, K. A multi-factorial analysis of bone morphology and fracture strength of rat femur in response to ovariectomy. J. Orthop. Surg. Res. 2018, 13, 318. [Google Scholar] [CrossRef] [Green Version]
- Rudyk, H.; Tomaszewska, E.; Kotsyumbas, I.; Muszyński, S.; Tomczyk-Warunek, A.; Szymańczyk, S.; Dobrowolski, P.; Wiącek, D.; Kamiński, D.; Brezvyn, O. Bone homeostasis in experimental fumonisins intoxication of rats. Ann. Anim. Sci. 2019, 19, 403–419. [Google Scholar] [CrossRef] [Green Version]
- Zernicke, R.F.; Salem, G.J.; Barnard, R.J.; Schramm, E. Long-term, high-fat-sucrose diet alters rat femoral neck and vertebral morphology, bone mineral content, and mechanical properties. Bone 1995, 16, 25–31. [Google Scholar] [CrossRef]
- Bass, E.F.; Baile, C.A.; Lewis, R.D.; Giraudo, S.Q. Bone quality and strength are greater in growing male rats fed fructose compared with glucose. Nutr. Res. 2013, 33, 1063–1071. [Google Scholar] [CrossRef]
- Patsch, J.M.; Kiefer, F.W.; Varga, P.; Pail, P.; Rauner, M.; Stupphann, D.; Resch, H.; Moser, D.; Zysset, P.K.; Stulnig, T.M.; et al. Increased bone resorption and impaired bone microarchitecture in short-term and extended high-fat diet-induced obesity. Metabolism 2011, 60, 243–249. [Google Scholar] [CrossRef]
- Gautam, J.; Choudhary, D.; Khedgikar, V.; Kushwaha, P.; Singh, R.S.; Singh, D.; Tiwari, S.; Trivedi, R. Micro-architectural changes in cancellous bone differ in female and male C57BL/6 mice with high-fat diet-induced low bone mineral density. Br. J. Nutr. 2014, 111, 1811–1821. [Google Scholar] [CrossRef] [PubMed] [Green Version]
- Premaor, M.O.; Pilbrow, L.; Tonkin, C.; Parker, R.A.; Compston, J. Obesity and fractures in postmenopausal women. J. Bone Miner Res. 2010, 25, 292–297. [Google Scholar] [CrossRef] [PubMed]
- Fujita, Y.; Watanabe, K.; Maki, K. Serum leptin levels negatively correlate with trabecular bone mineral density in high-fat diet-induced obesity mice. J. Musculoskelet. Neuronal Interact. 2012, 12, 84–94. [Google Scholar] [PubMed]
- Strong, A.L.; Hunter, R.S.; Jones, R.B.; Bowles, A.C.; Dutreil, M.F.; Gaupp, D.; Hayes, D.J.; Gimble, J.M.; Levi, B.; McNulty, M.A.; et al. Obesity inhibits the osteogenic differentiation of human adipose-derived stem cells. J. Transl. Med. 2016, 14, 27. [Google Scholar] [CrossRef] [Green Version]
- Kostyshyn, N.; Kulyk, Y.; Kostyshyn, L.; Gzhegotskyi, M. Metabolic and structural response of bone to whole-body vibration in obesity and sedentary rat models for osteopenia. Rom. J. Diabetes Nutr. Metab. Dis. 2020, 27, 200–208. [Google Scholar]
- Chen, Q.; Bao, N.; Yao, Q.; Li, Z.Y. Fractal dimension: A complementary diagnostic indicator of osteoporosis to bone mineral density. Med. Hypotheses 2018, 116, 136–138. [Google Scholar] [CrossRef]
- McGee-Lawrence, M.E.; Wenger, K.H.; Misra, S.; Davis, C.L.; Pollock, N.K.; Elsalanty, M.; Ding, K.; Isales, C.M.; Hamrick, M.W.; Wosiski-Kuhn, M.; et al. Whole-body vibration mimics the metabolic effects of exercise in male leptin receptor–deficient mice. Endocrinology 2017, 158, 1160–1171. [Google Scholar] [CrossRef] [Green Version]
- Huang, C.C.; Tseng, T.L.; Huang, W.C.; Chung, Y.H.; Cguang, H.L.; Wu, J.H. Whole-body vibration training effect on physical performance and obesity in mice. Int. J. Med. Sci. 2014, 11, 1218–1227. [Google Scholar] [CrossRef] [Green Version]
- Cardoso, A.L.; Frederico, É.H.; Guimarães, C.A.; Guedes-Aguiar, E.O.; Moreira-Marconi, E.; Paineiras-Domingos, L.L.; Sá-Caputo, D.C.; Bernardo-Filho, M.; Asad, N.R. Long-term effects of mechanical vibration stimulus on the bone formation of Wistar rats: An assessment method based on X-rays images. Acad. Radiol. 2021, 28, e240–e245. [Google Scholar] [CrossRef]
- de Oliveira, L.C.; de Oliveira, R.G.; de Almeida Pires-Oliveira, D.A. Effects of whole-body vibration versus pilates exercise on bone mineral density in postmenopausal women: A randomized and controlled clinical trial. J. Geriatr. Phys. Ther. 2019, 42, E23–E31. [Google Scholar] [CrossRef]
- Liu, Y.; Côté, M.M.; Cheney, M.C.; Lindeman, K.G.; Rushin, C.C.; Hutter, M.M.; Yu, E.W. Zoledronic acid for prevention of bone loss in patients receiving bariatric surgery. Bone Rep. 2014, 14, 100760. [Google Scholar] [CrossRef] [PubMed]
- Lespessailles, E.; Jaffré, C.; Beaupied, H.; Nanyan, P.; Dolleans, E.; Benhamou, C.L.; Courteix, D. Does exercise modify the effects of zoledronic acid on bone mass, microarchitecture, biomechanics, and turnover in ovariectomized rats? Calcif. Tissue Int. 2009, 85, 146–157. [Google Scholar] [CrossRef] [PubMed]
- Hoffmann, D.B.; Sehmisch, S.; Hofmann, A.M.; Eimer, C.; Komrakova, M.; Saul, D.; Wassmann, M.; Stürmer, K.M.; Tezval, M. Comparison of parathyroid hormone and strontium ranelate in combination with whole-body vibration in a rat model of osteoporosis. J. Bone Miner. Metab. 2017, 35, 31–39. [Google Scholar] [CrossRef] [PubMed]


Disclaimer/Publisher’s Note: The statements, opinions and data contained in all publications are solely those of the individual author(s) and contributor(s) and not of MDPI and/or the editor(s). MDPI and/or the editor(s) disclaim responsibility for any injury to people or property resulting from any ideas, methods, instructions or products referred to in the content. |
© 2022 by the authors. Licensee MDPI, Basel, Switzerland. This article is an open access article distributed under the terms and conditions of the Creative Commons Attribution (CC BY) license (https://creativecommons.org/licenses/by/4.0/).
Share and Cite
Kostyshyn, N.M.; Muszyński, S.; Tomaszewska, E.; Tomczyk-Warunek, A.; Puzio, I.; Dobrowolski, P. Effect of Mechanical Stimuli and Zoledronic Acid on the Femoral Bone Morphology in Rats with Obesity and Limited Mobility. J. Clin. Med. 2023, 12, 43. https://doi.org/10.3390/jcm12010043
Kostyshyn NM, Muszyński S, Tomaszewska E, Tomczyk-Warunek A, Puzio I, Dobrowolski P. Effect of Mechanical Stimuli and Zoledronic Acid on the Femoral Bone Morphology in Rats with Obesity and Limited Mobility. Journal of Clinical Medicine. 2023; 12(1):43. https://doi.org/10.3390/jcm12010043
Chicago/Turabian StyleKostyshyn, Nazar M., Siemowit Muszyński, Ewa Tomaszewska, Agnieszka Tomczyk-Warunek, Iwona Puzio, and Piotr Dobrowolski. 2023. "Effect of Mechanical Stimuli and Zoledronic Acid on the Femoral Bone Morphology in Rats with Obesity and Limited Mobility" Journal of Clinical Medicine 12, no. 1: 43. https://doi.org/10.3390/jcm12010043